Article

Organic Materials Used for Giant Buddhas and Wall Paintings in Bamiyan, Afghanistan

1
History and Anthropology, Faculty of Humanities and Social Sciences, University of Tsukuba, Tsukuba 305-8571, Japan
2
Graduate School of Pharmaceutical Sciences, Osaka University, Suita 565-0871, Japan
3
The National Museum of Western Art, Taito, Tokyo 110-0007, Japan
4
ESRF, The European Synchrotron Radiation Facility, 38000 Grenoble, France
5
Laboratoire d’Archéologie Moléculaire et Structurale (LAMS), Sorbonne Université, CNRS, UMR8220, 75005 Paris, France
6
The Getty Conservation Institute, Los Angeles, CA 90049-1684, USA
7
Nippi Research Institute of Biomatrix, Toride 302-0017, Japan
8
Department of Chemistry, Nara Women’s University, Nara 630-8506, Japan
*
Author to whom correspondence should be addressed.
Appl. Sci. 2022, 12(19), 9476; https://doi.org/10.3390/app12199476
Submission received: 26 August 2022 / Revised: 8 September 2022 / Accepted: 16 September 2022 / Published: 21 September 2022
(This article belongs to the Special Issue Organic Materials in the Wall Paintings)

Abstract

:

Featured Application

This work presents a comprehensive approach to identifying both inorganic and organic components of very early wall oil-paintings with complex multiple-layered structures.

Abstract

Since 2004, scientific research on the damaged Giant Buddha statues and Buddhist paintings in Bamiyan, Afghanistan, has been conducted at various laboratories and large-scale facilities using mass-spectrometry techniques (GC-MS, LC-MS, LC-MS/MS, nano-LC/ESI-MS/MS), ELISA, and synchrotron-based micro-analyses) in parallel to conservation intervention. Studies on samples from these cultural heritage objects have shown that each is composed of a polychromatic multilayered structure with sizing layers, ground layers, painted layers, and glaze. The carefully produced complex multilayered structures were examined using optical microscopy (visible and UV light) as well as synchrotron-based infrared microscopy, both of which revealed various organic and inorganic components in each layer. High sensitivity bulk MS and ELISA methods were used to further identify details regarding organic materials, such as fatty acids and collagens, and these results suggest different vegetable oils and animal species of glues. For example, cow milk casein and cow skin glue were identified in the Eastern Giant Buddha, suggesting that casein was used as a sizing agent and the cow skin glue as a binder for painting. The wall paintings from Cave N(a) (mid-7th century AD) were found to have horse glue used as sizing and drying oil (poppyseed/walnuts/perilla oils) as a binding media. The paintings’ complex structures and their organic and inorganic materials were fully understood using both imaging and bulk methods, and thus, these methods help to reconstruct historical wall painting techniques in full.

1. Introduction

  • The National Research Institute for Cultural Properties, Tokyo (NRICPT), has led conservation work pertaining to cultural heritage in Bamiyan since 2004, as part of the UNESCO/Japan Funds-in-Trust project, “Safeguarding of the Bamiyan Site, Afghanistan” [1,2]. In March 2001, both the Eastern Giant Buddha (EGB) and the Western Giant Buddha (WGB) were demolished. Bamiyan was the site of Buddhist pilgrimages during the Kushano-Hephthalite kingdom and is located along the Silk Road, 2500 m in the highlands of Central Afghanistan. It has about 700 caves, of which around 50 have wall paintings. All have been subject to environmental degradation and human activity, such as looting, flaking, delamination, blackening, and alteration of pigments.
  • Prior to any conservation interventions in Bamiyan, it was necessary to obtain a thorough understanding of materials and techniques used in the caves. To this end, the NRICPT sampled and tested approximately 300 min fragments from wall paintings and both the EGB and WGB, with multi-analytical procedures. The wall paintings and polychromatic surfaces of the Giant Buddhas and are made from earthen renders with a secco paintings (Figure 1). Since the site has been seriously damaged and most art of historical value has been lost, we employed a comprehensive analytical approach with state-of-the-art diagnostics to extract material and chemical information and reveal its historical and technical importance.
Figure 1. (a) EGB of Bamiyan, after demolishment in 2001. (b) Rare surviving wall painting of a partially vandalized seated Buddha, Foladi Cave 6. Black areas are the result of alteration in the green pigment, atacamite (photographed by Y. Taniguchi in 2007).
Applsci 12 09476 g001
Radiocarbon dating of the polychrome surfaces of the EGB and the WGB were conducted in Germany and Japan and reported elsewhere [3,4]. Data obtained in Japan (from samples provided by ICOMOS Germany) is shown in Figure 2. Following re-calibration using the IntCal20 [5], dates produced for the EGB were 440–460 AD, 478–496 AD, and 534–546 AD [1σ]. Dates for the WGB were 606–642 AD [1σ]. We also obtained radiocarbon dates for the wall paintings, which spanned from the 5th to the late 8th centuries [6]. The caves once served as Buddhist monasteries, and the two Giant Buddha statues were constructed by different Buddhist sects with different political backgrounds. Therefore, study of the painting materials and techniques is crucial for attributing the works and identifying their technological contexts.
A group of wall paintings dated after the mid-7th century in Caves B(d), F(c), L, N(a), and S(a); Foladi Caves 2, 3, 4, and 6; Kakrak Caves 43 and 44, and Qol-e Jalal appear to contain various organic substances other than pigments and alteration products [7]; therefore, we applied state-of-the-art analytical methods—namely, synchrotron-radiation micro Fourier Transform Infrared spectroscopy (SR-µFTIR) and gas chromatography mass spectrometry (GC-MS)—to better identify specific painting materials and technologies. GC-MS identified drying oils used as a binding media in the multilayered paintings [8]. Proteins and polysaccharides, among other substances, were detected and further studied using LC-MS (liquid chromatography–mass spectrometry), LC-MS/MS (liquid chromatography–tandem mass spectrometry), nano-LC/ESI-MS/MS, and ELISA (enzyme-linked immunosorbent assay) methods. Since each analytical technique has its own pros and cons, we combined different methods to reveal as much information as possible.
The wall paintings and polychromy of the Giant Buddhas have multilayered structures, as described in Section 3.1. In order to obtain chemical characterization of each layer, synchrotron micro-analyses were performed over sample stratigraphies. In our study, about 55 thin sections and cross-sections were analyzed at the European Synchrotron Radiation Facility (ESRF, Grenoble, France) by micro-X-ray fluorescence (µXRF), micro-X-ray diffraction (µXRD), and µFTIR [9]. The first technique provides elemental composition, the second identifies crystalline phases, notably pigments and degradation products, while the third technique is key in the detection of molecular groups. It can probe some inorganic compounds but, in the present study, it had a fundamental role in the identification of organic and hybrid materials (that is, products of the interaction of organic and inorganic compounds). These three techniques were carried out using micrometric X-ray and infrared beams in 2D mapping mode, enabling not only identification but also location of many components over the complex paint stratigraphy. The brightness of the SR beam facilitates acquisitions at higher speeds, higher lateral resolution, and much better sensitivity than a conventional X-ray or infrared source. Herein, we report results mainly from SR-µFTIR; additional information obtained with SR-µXRF and SR-µXRD can be found elsewhere [9,10,11,12].
μFTIR, with or without SR, permits the identification of a large variety of organic matter compounds, such as oils, resins, proteins, and plant gums. However, this method does not allow for the precise identification of organic species. Therefore, after characterizing the functional groups, samples were analyzed using GC-MS, and then protein-containing samples were analyzed using ELISA and LC-MS.
GC-MS was used to classify the type of organic material with three separate analytical protocols for drying oils, resins, and waxes; proteins; and plant gums (Section 2.3). Analysis was carried out in collaboration with the Getty Conservation Institute in 2007. For amino acid analysis, we assumed materials contained collagen when hydroxyproline was detected. Further identification was conducted with ELISA and LC-MS techniques.
ELISA is an analytical method in the biological field. This method can be used to detect the type and concentration of antibodies and antigens in a sample (Section 2.4.). ELISA uses a highly specific antigen–antibody reaction, based on an enzymatic color reaction and is therefore an effective method for the detection and quantification of specific proteins in small quantities, even in the parts per trillion (ppt) order, where a variety of proteins are present in the same sample. ELISA tests were carried out in the lab of the National Museum of Western Art (NMWA) in Japan.
For the proteinaceous materials, their trypsin digests were analyzed with LC-MS/MS. Species identification of glue components was performed based on the detection patterns of 12 type I collagen-derived tryptic marker peptides. We took measurements with a quadrupole-time-of-flight (Q-TOF) and a hybrid triple-quadrupole ion-trap mass spectrometry at high sensitivity at Nippi Research Institute of Biomatrix, especially where specimens contained very little protein, as described in Section 2.5. For samples with larger amounts of proteins, we employed nano-liquid chromatography electrospray ionization tandem mass spectrometry (nano-LC/ESI-MS/MS) with a linear ion trap mass spectrometer at Nara Women’s University in search of peptides to identify animal species of proteins and the origins (either bone or skin) of glues (Section 2.6).

2. Materials and Methods

2.1. Microscopic Observation of Bulk Samples and Polished Sections (Diffused Light Source and UV Fluorescence Light)

Each micro sample was observed and photographed under a stereomicroscope (Olympus BX51) using normal light and UV fluorescence. Observations were conducted at magnifications ranging from 40 to 100×. Each micro sample was then mounted in polyester resin (Struers cold mounting resin No. 105). Because the samples may contain water-soluble binding media and moisture-sensitive pigments, the surfaces of the 4000–12,000 mesh samples were dry polished using Micro Mesh (Micro Surface®). The basic method for preparing polished sections was adapted from Plesters [13].

2.2. Synchrotron Radiation (SR)-Based Micro-Analyses

To obtain clues about the chemical composition of different paint layers, and particularly about the organic binders hypothesized from UV-optical microscopy (OM), we decided to apply a combination of SR-based micro-analytical techniques.
SR-μFTIR analyses were carried out at the former infrared end-station at the ID21 beamline at the ESRF [14]. We used the Nexus infrared spectrometer coupled with the Continuµm microscope from Thermo Nicolet. Spectra were measured in transmission mode. The beam size was reduced to 12 × 12 µm2 or 8 × 8 µm2, exploiting the high brightness of the SR beam. Two-dimensional maps were acquired through one FTIR spectrum (a sum of 25 scans in the range of 4000–800 cm−1 and with a resolution of 8 cm−1) per pixel and by raster scanning of the sample with a step size of 8–12 µm. Data acquisition and analysis were carried out using the Omnic software from Nicolet and the regions of interest (ROI) imaging tool from PyMca software [15]. Molecular maps were obtained by calculating the integrated intensity over specific ROI and through non-negative matrix approximation analysis (NNMA). From these maps, average spectra or NNMA vectors were extracted and analyzed in order to identify the main components.
The preparation of samples is particularly complex for such analyses because any standard embedding medium would contribute to the FTIR signal [16]. Some samples were prepared as thin sections from resin-embedded blocks (primarily prepared for OM and micro X-ray analyses), but the FTIR signal was usually not exploitable. Thus, we decided to prepare specific samples for SR-µFTIR analyses. In brief, under a binocular stereomicroscope, small (~10–20 µm) sections were sliced from paint fragments with a scalpel, deposited on a diamond cell (with the stratigraphic surface parallel to the diamond surface), and gently pressed to reduce the paint thickness and the infrared absorption. This inevitably led to some disruption of the stratigraphic structure but, in many cases, the multilayer structure is still visible, and the sample effectively represents each individual layer. The sample thickness could not be well controlled, and some parts were still too thick and absorbent, leading to saturated spectra. Such issues impacted data analysis in a few places, especially in the red layers.

2.3. Organic Media Analysis by GC-MS

2.3.1. Fatty Acids, Proteins, and Plant Gum Analysis Using GC-MS

GC-MS analysis was carried out in collaboration with the Getty Conservation Institute to identify the organic compounds by using several protocols, each of which has been optimized specifically to be applied to oils, resins, waxes, protein, and plant gums in 2007 [17,18]. Protein analysis was based on the measurement of amino acid composition by quantifying the tert-butyldimethylsilyl (TBDMS) esters of amino acids with GC-MS. Because the requisite silylation with N-(tert-butyldimethylsilyl)-N-methyltrifluoroacetamide (MTBSTFA) is adversely affected by silica, a white pigment commonly found in sand and wall paintings, protein analysis could also be achieved either by derivatization with ethyl chloroformate that minimizes the interference of pigments or by improving the protocols of other methods, such as LC-separation, at high temperatures and utilization of different reagents [19]. Nevertheless, some Bamiyan paint samples yielded amino acid compositions that matched protein binders reasonably by the present GC-MS of TBDMS esters, in spite of the possible adverse effect of pigments thought to be contained in the majority of samples.
Drying oils were identified based on fatty acid ratios. The concentration of palmitic (P), stearic (S), and azelaic (A) acids were used to calculate the P/S ratio and identify the drying oil since palmitic and stearic acids are less prone to chemical reactions upon aging than unsaturated fatty acids [20]; typical values of P/S ratios and iodine values for several drying oils are listed in Table 1.
Further, an A/P ratio of 0.6 or higher was required for a drying oil. Egg lipids generally have A/P ratios below 0.5 and contain significant amounts of protein [21].
Dicarboxylic, suberic, azelaic, and sebacic acids are formed during the auto-oxidation of the polyunsaturated chain present in fresh drying oils, which can be considered markers for drying oils. The amount of azelaic acid is significantly lower in egg yolk than in drying oils due to the lower amounts of unsaturated fatty acids [17]. The azelaic (A) to palmitic (P) acid ratio (A/P) can be used to discriminate drying oils (A/P > 0.6) from egg yolk (A/P < 0.3) [20,21].
The characterization of proteins and plant gums by GC-MS was accomplished by comparing the amino acid composition of proteins and the carbohydrate composition of plant gums to those of standard reference materials using correlation coefficients [22]. A correlation coefficient of 1.0 represents perfect match, but for environmental conditions found in the Bamiyan caves, that of 0.93 is an acceptable match. The identification of these materials can be problematic, and there can be negative effects to profiles due to aging and pigments, while mixtures of media can significantly lower match quality [19,22].
Table 1. Oils found in the Asian region. The iodine values were adapted from a collaborative study and indicates the measure of the relative degree of unsaturation in oil components [23]. Drying oil > 130. Palmitic/Stearic (P/S) data from various sources are cited.
MaterialIodine ValueP/SRefs.
Tung oil1601–1.2 [24]
Linseed oil1701.2–2.5[17,25]
Sesame oil1001.5–2[18]
Rapeseed oil942–3[26]
Walnut oil1322–3 [27,28]
Poppy oil1403–5 [29]
Perilla oil1902–4[30,31]

2.3.2. Procedures for Quantitative GC-MS Analysis of Amino Acids as Tert-Butyldimethylsilyl (TBDMS) Derivatives

Saponification and methylation were performed in a 0.2 M solution of m-(trifluoromethyl)phenyltrimethyl ammonium hydroxide (m-TFPTAH) in a 2:1 (v/v) mixture of methanol and toluene (20 µL) [32,33]. Vials were heated at 60 °C for 1 h. The analysis was carried out on a Hewlett Packard 5972 GC-MS with a DB-5MS column (30 m × 0.25 mm × 1 µm), inlet operating at 300 °C, and transfer line operating at 280 °C. Oven temperature was set at 50 °C for 2 min, and elevated at the rate of 10 °C/min to 320 °C.

2.3.3. Procedures for Quantitative GC-MS Analysis of Amino Acids as N-(Tert-Butyldimethylsilyl)-N-Methyltrifluoroacetamide (MTBSTFA) Derivatives

This method is described in detail elsewhere [33]. Briefly, we added 100 µL of 6.0 M hydrochloric acid to a vial and then heated the vial at 105 °C for 24 h. We evaporated the solution, added 20 µL MTBSTFA, and then heated the vial at 105 °C for 5 h. GC used DB-5MS column (30 m × 0.25 mm × 1 µm). The temperatures of inlet and transfer line were 280 °C, and 300 °C, respectively. Oven temperature was set at 80 °C for 1 min, and elevated at the rate of 75 °C/min to 180 °C and 10 °C/min to 320 °C.

2.3.4. Procedures for Quantitative GC-MS Analysis of Sugars in Plant Gums as O-Methyloxime Acetate Derivatives

The method is described in detail elsewhere [34]. Briefly, we added 100 µL of 1.2 M trifluoroacetic acid to a vial and heated at 125 °C for 1 h. Then, we evaporated the solution, added 200 µL of methoxyamine hydrochloride in pyridine (1%), and heated for 10 min at 70 °C. Subsequently, we added 40 µL of acetic anhydride to the vial and heated it at 70 °C for 10 min. GC employed DB-WAX Capillary Column (15 m × 0.25 mm × 0.25 µm). The inlet and transfer line temperature was 240 °C. Oven temperature was set at 105 °C for 1 min and elevated at the rate of 30 °C/min to 180 °C and 5 °C/min to 240 °C.

2.4. Analysis of Binding Media Using ELISA

2.4.1. Principles of ELISA

ELISA can be used to detect the type and concentration of antibodies and antigens in a sample. In recent years, ELISA tests have been used to simultaneously measure a variety of biological macromolecules of mammalian origin (including proteins, such as collagen from animal glues, casein from dairy products, egg white albumin from egg whites, and phosvitin from egg yolks) and polysaccharides of plant origin (such as plant gums), since a variety of organic substances may be present in a painted sample [35,36]. It is often complicated to analyze painted samples because organic substances, such as proteins, polysaccharides, and pigments may deteriorate over the years.

2.4.2. Sample Preparation and Analytical Methods

Samples were analyzed with the ELISA technique at the National Museum of Western Art (NMWA) in Japan. Preparation of the sample and analysis were conducted in accordance with GCI procedures [37] with modifications [38]. Antibodies were modified as shown in Table 2, and multiple dilutions were made for each sample and 40, 20, 20, and 10 μL of eluent were added to each well. Skim milk is usually used to block the solid phase but, because casein may be identified in the analyzed samples, Sea BlockTM buffer was used for two anti-collagen antibodies, an anti-casein antibody, and an anti-tragacanth antibody, while BlockerTM BSA was used for an anti-ovalbumin antibody and an anti-plant gum antibody. Measurements were taken at OD405 and OD630 simultaneously in order to avoid excessively high absorbance values. Average values of blank +3SD were used as the threshold, and more than 3 positives out of 4 wells of different dilutions were treated as a confirmed positive.

2.5. Identification of Protein and Animal Sources of Glue by LC-MS

2.5.1. Trypsin Digestion

The samples (15 mg of BMM061 (Cave A lower salle), 2.3 mg of BMM078 (Cave M) and 6.9 mg of BMM194 (Cave N(a)) were heated at 60 °C for 30 min in 100 µL of Tris-HCl buffer containing 1 mM CaCl2 (pH 7.6) and digested with 2.5 µg of trypsin (Sigma-Aldrich, St. Louis, MO, USA) at 37 °C for 3 h. After acidification with formic acid (final 1%), sample solutions were filtrated through a 0.45 µm filter and then subjected to LC-MS/MS for protein identification or LC-MS in multiple reaction monitoring (MRM) mode for species identification of glue.

2.5.2. Protein Identification

The trypsin digests were analyzed with LC-MS/MS using a maXis II quadrupole time-of-flight (Q-TOF) mass spectrometer (Bruker Daltonics, Bremen, Germany) coupled to a Shimadzu Prominence UFLC-XR system (Shimadzu, Kyoto, Japan) with chromatographic separation using an Ascentis Express C18 HPLC column (2.1 mm × 150 mm i.d., 2.7 μm; Supelco, Bellefonte, PA, USA) as described previously [39]. The MS and MS/MS spectra were obtained over the m/z ranges of 50–2150 with a frequency of 8 Hz in positive ion mode. Proteins were identified by searching the acquired MS/MS spectra against the UniprotKB/Swiss-Prot database (release 2018_05) using ProteinPilot software 4.5 (AB Sciex).

2.5.3. Species Identification of Glue

Species identification of glue was performed based on the detection patterns of 12 type I collagen-derived tryptic marker peptides, as established previously [40]. To detect the marker peptides, the tryptic digests were subjected to LC-MS in MRM mode using a 3200 QTRAP hybrid triple quadruple/linear ion trap mass spectrometer (AB Sciex) coupled with an Agilent 1200 series HPLC system (Agilent Technologies, Palo Alto, CA, USA). Peptide separation was performed using an Ascentis Express C18 HPLC column (2.1 mm × 150 mm i.d., 5 μm; Supelco), as described previously [40].

2.6. Mass Spectrometry of Proteinaceous Materials Extracted from Polychrome Fragments of the Eastern and Western Giant Buddhas by Nano-LC/ESI-MS/MS

2.6.1. Sample Preparation

The samples were collected from debris of the Eastern (14.6 mg of BMM190, and 0.4 mg of BMM191) and Western (0.3 mg of BMM199 and 4.1 mg of BMM201) Giant Buddhas. Each sample was mixed with 500 μL of 0.1 M NH4HCO3 and pulverized in mortar. The mixture was then transferred to an Eppendorf tube (1.5 mL), where another 500 μL of the NH4HCO3 solution was used to wash the mortar. After letting the solution stand at 60 °C for 1 h, the mixture was centrifuged at 8000× g for 5 min to remove insoluble materials. The supernatant was dialyzed against aqueous 0.1 M NH4HCO3 with an Amicon Ultra Centrifugal Filter Device (3-kDa cutoff, Merck Millipore, Darmstadt, Germany). Each solution in the filter unit was centrifuged at 14,000× g for 5 min for concentration, diluted with 0.1 M NH4HCO3 (400 μL), and then centrifuged again at 14,000× g for 5 min. After repeating the dilution and centrifugation 4 times, followed by concentration of the solution to 50 μL, we added 10 μL of porcine trypsin (Sigma-Aldrich, 0.15 mg/mL of 0.1 M NH4HCO3) to the protein solution in 0.1 M NH4HCO3 (30–50 μL) and incubated it at 37 °C for 17 h. The sample solution for mass spectrometry was finally prepared by evaporating the solvent with SpeedVac (Thermo Fisher Scientific, Waltham, MA, USA) and dissolving the residue in 30 μL of aqueous 0.1% trifluoroacetic acid.

2.6.2. Analytical Procedures

Solutions of tryptic peptides in 0.1% aqueous trifluoroacetic acid were analyzed with a Finnigan LTQ linear ion-trap mass spectrometer (Thermo Fischer Scientific) equipped with a Zaplous HPLC-MS/MS System (AMR Inc., Tokyo, Japan) and a nano-electrospray ionization source (AMR Inc.). Nano-LC was operated using a capillary reverse-phase column (L-Column ODS, 0.1 mm × 150 mm, Chemical Evaluation Research Institute, Tokyo, Japan) and developed at the flow rate of 500 nL/min with a concentration gradient of acetonitrile from 5% (0 min) to 40% (protocol A: 40 min; protocol B: 60 min), and the column was washed with 95% acetonitrile for another 15 min, followed by equilibration to 5% acetonitrile for 5 min (protocol A: 60 min; protocol B: 80 min, in total) in 0.1% aqueous HCOOH in an Advance UHPLC dual solvent delivery device (Michrom BioResources/Bruker). We mainly employed protocol A, while checking the existence of minor components with protocol B when the spectrum was dominated by the peaks of contaminants. The temperature of the UHPLC column was 60 °C and that of the transfer capillary at the LTQ inlet was 200 °C. The ESI voltage was set at 1.6 kV. MASCOT search was performed by using a database of Swiss-Prot 57.15 (515.203 sequences; 181,334,896 residues) for taxonomy of Metazoa (animals).

3. Results

3.1. Microscopic Observations of Bulk Samples and Polished Sections

Most of the paintings including those on the EGB and WGB had multilayered structures with rendering layers (earthen render with plant/animal fibers), a ground layer, painting layer(s), and sometimes a colored transparent glaze on the surface. Metal leaves are also observed in some surface decorations. For example, a 1 μm thin piece of gold leaf is applied over a red layer using purplish-brown mordant (Figure 3). Roughly crushed blue pigments (lapis lazuli) were placed on a black layer (carbon black) that had a darkening effect on the color (Figure 4). Many paintings used such optical effects to produce certain color variations [8].

3.2. SR-μFTIR Analyses

A total of 21 samples were analyzed with SR-µFTIR. Two of them did not give reliable results due to the embedding resin. A summary of the results obtained on the 19 other samples is given in Table 3. The discussion focuses on the identification of organic materials. As shown in Table 3 and Figure 5, this large corpus shows both wide variety in organic binders, as well as some recurring trends in paint composition and structure.
Notably, seven samples (BMM035, BMM039, BMM040, BMM082, BMM181, FDM55, KAK03, and QJM06) exhibit a very complex multilayered structure with the following:
-
A proteinaceous sizing layer;
-
in a few cases, a natural resin in a layer beneath the proteinaceous sizing layer. This layer was probably not sampled in all fragments, explaining why resin was not consistently detected;
-
a white ground layer made of oil (stretching bands of aliphatic CH and ester CO groups) that was partially saponified (judging from the lead carboxylates signal) and mixed with lead white (judging from the lead carbonate and lead hydroxide detected). Cerussite and hydrocerussite were further confirmed by SR-µXRD;
-
colored paints, made of oil mixed with different pigments (green, blue, red, etc.);
-
in some black layers, the spectra revealed a higher concentration of acid groups. Based on the shape of the CO and CH stretching bands, these have been tentatively assigned to an acidified oil rather than a resin;
-
similarly, in the case of two paints with metallic foils (BMM178 (Cave N(a)) and QJM06 (Qol-e Jalal), FTIR spectra could be assigned to acidified oil (without the presence of carboxylates).
Oxalates (usually calcium oxalates, but copper oxalates were also found in some copper-based paint) were almost consistently detected, both in the sizing layer (when present) or in the paint surface. They are usually attributed to degradation products. Interestingly, oxalates are detected even in the case of oil-free paints.

3.3. Identification of Fatty Acids, Protein and Plant Gums by GC-MS

A total of 86 paint samples were tested for binding media by GC-MS from four sites: Bamiyan, Foladi, Kakrak, and Qol-e Jalal. The samples were composed of several paint layers that were brittle and difficult to isolate so these layers were analyzed in bulk (surface coating, ground, paint layers, and earthen rendering). Samples were analyzed for specific binders based on previous results and prioritized based on sample size limitations. Ultimately, 58 paint samples were analyzed for plant gums, 57 for oils, waxes, and resins, and 32 for proteins. The results are summarized partially in Table 4 and Table 5.
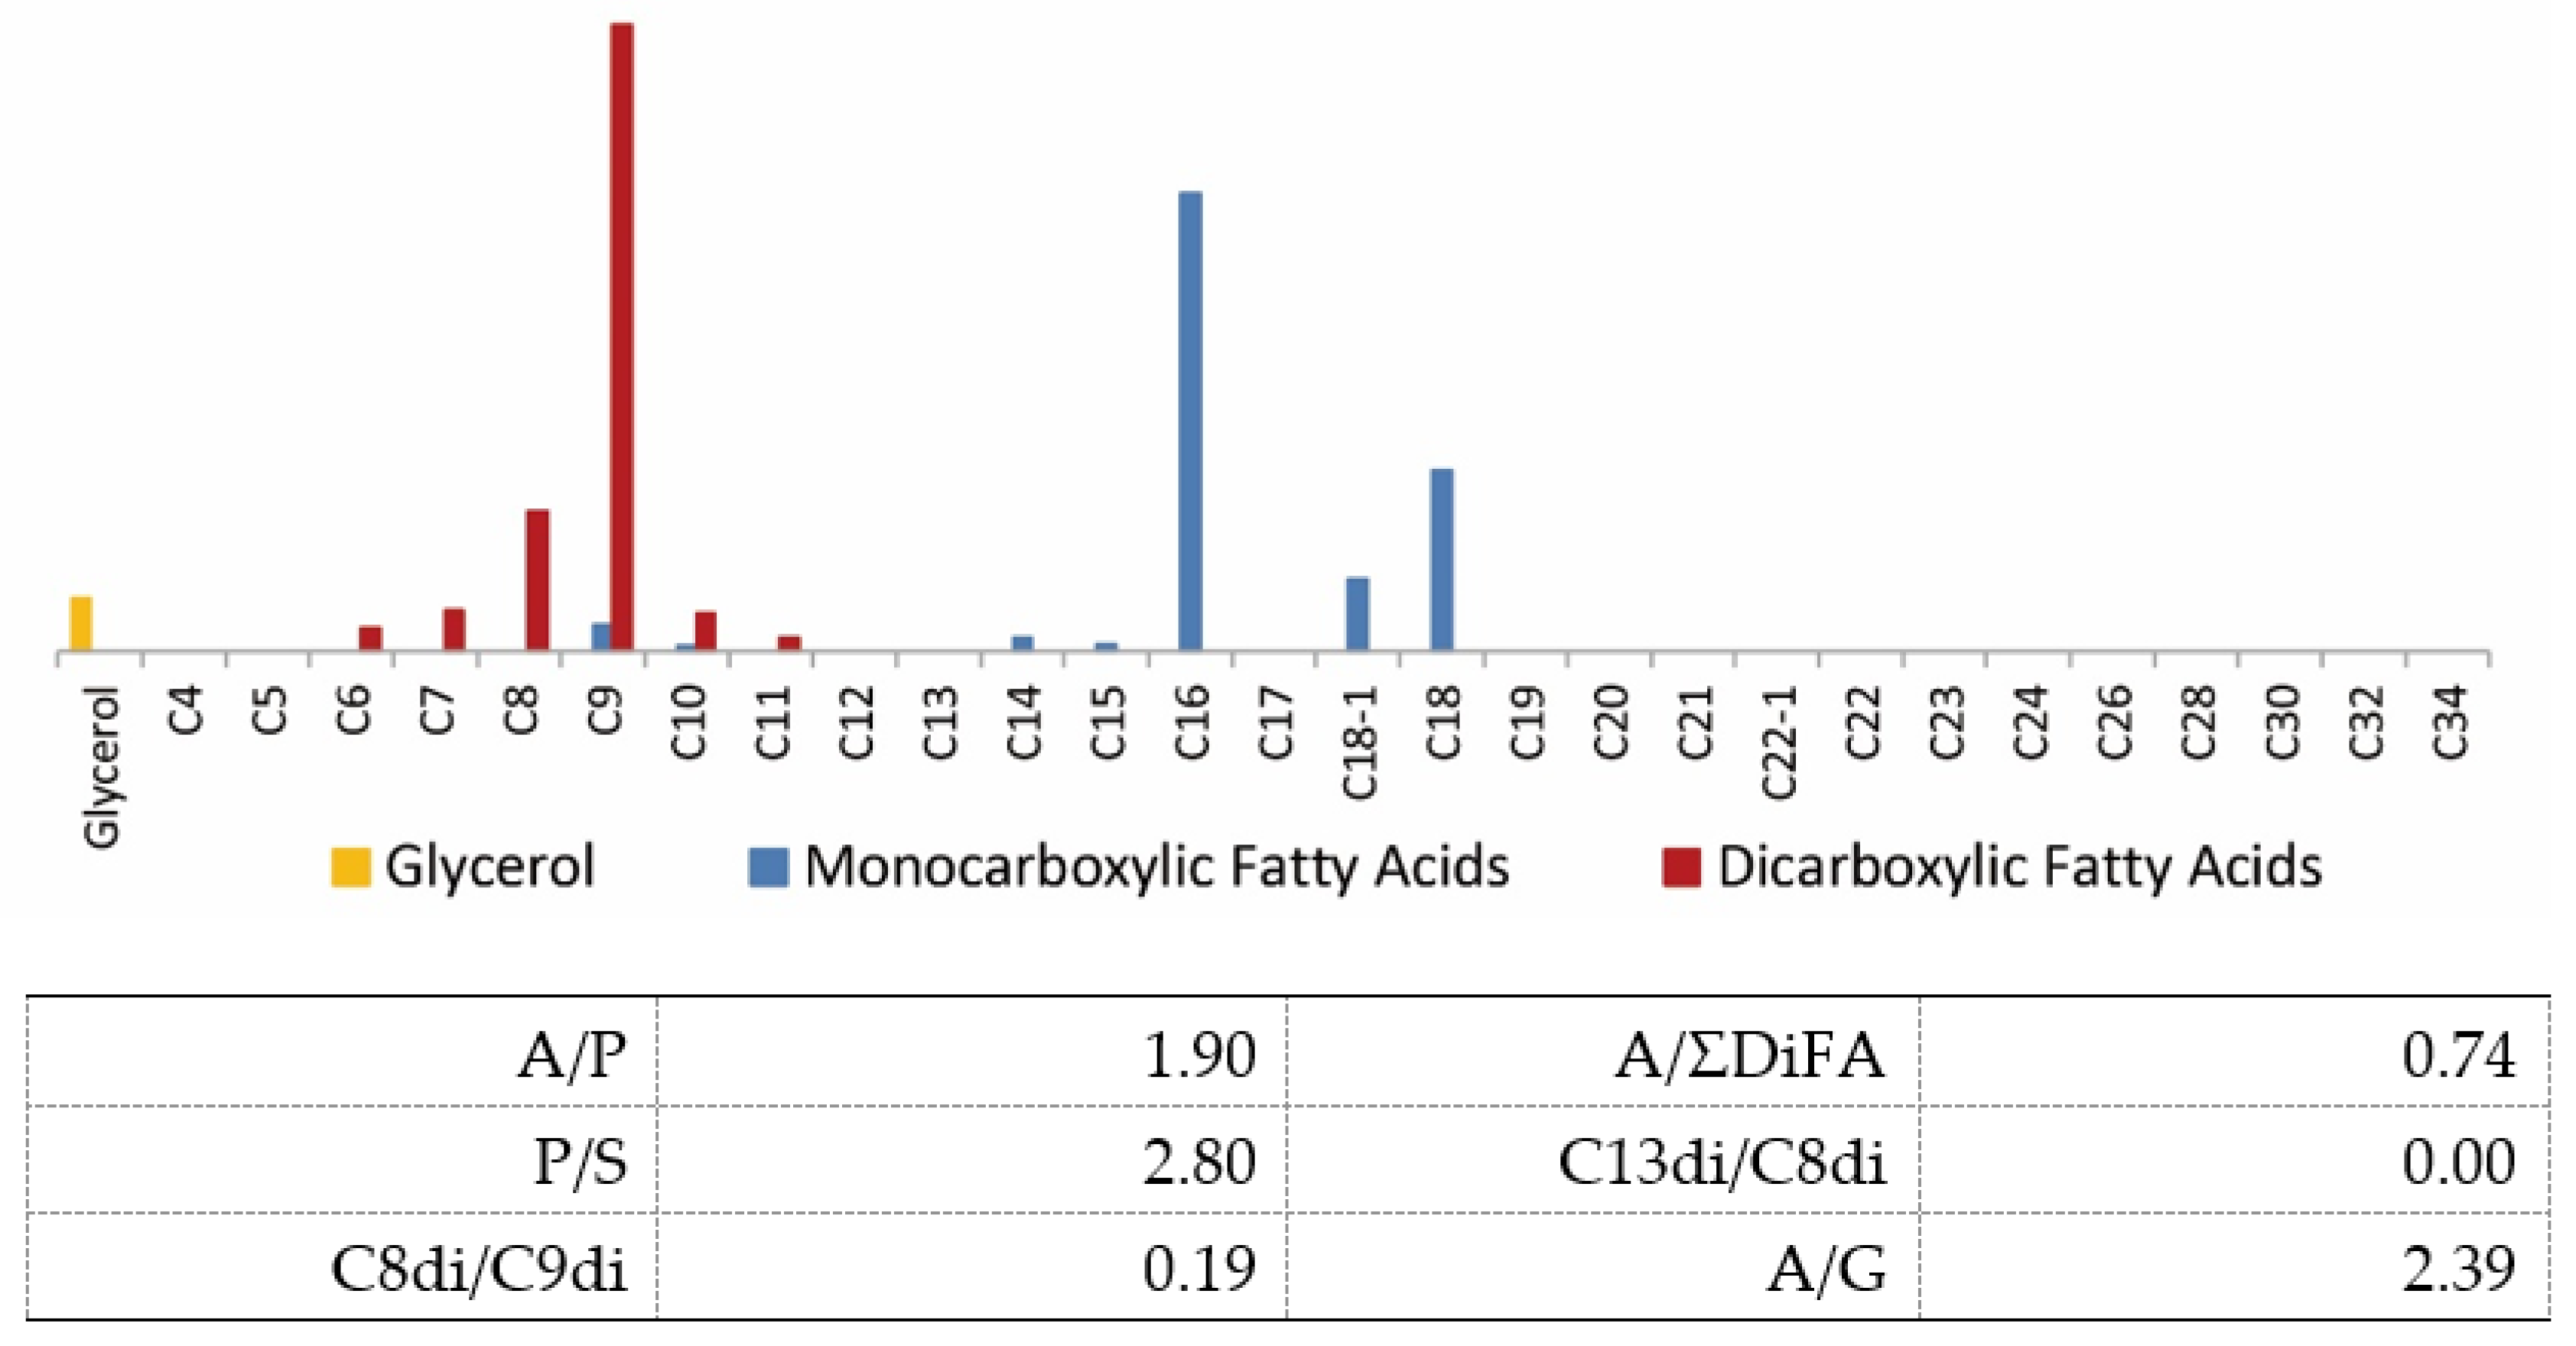
In general, GC-MS data complimented SR-μFTIR, ELISA, LC-MS, LC-MS/MS, and nano-LC/ESI-MS/MS results. The data in Table 1 show that most of the paint samples with fatty acids matched a drying oil, most likely walnut seed, perilla, or poppyseed oil, due to the P/S ratio (between 2 and 3.5) and most samples had high A/P ratios (above 1) (wall paintings from caves N(a), B(d), F(c), S(a), and L; Foladi caves 3, 4, and 6, Kakrak cave 43 and 44, and Qol-e Jalal cave). The identification of these drying oils is speculative, however, as no other drying oils (tung or linseed) are likely based on the P/S and A/P ratios obtained (see Table 4). Rapeseed oil does have a P/S value between 2 and 3. However, the iodine value is below 130, so it can be eliminated as a possibility [23]. Walnut is common from southeast Europe to Japan, and poppyseed is native to the eastern Mediterranean. However, perilla has been widely used across Asia. All three could be good candidates for drying oils. Other oils (such as linseed oil) may have been possible in caves M, K3, and J(c) due to P/S values below 2. However, P/S values can be affected if oils are used as a mixture [20]. P/S values can also decrease over time, due to evaporation of palmitic acid in the presence of inert pigments [42], so values should always be utilized with some caution.
As an example, for drying oils, GC-MS data from BMM035 (Cave N(a)) are shown in Figure 7.
GC-MS protein analysis of 32 paint samples showed that about 30% of the samples did not contain amino acids (ND), while 30% of the samples contained detectable levels of amino acids from an unknown protein source. The remaining samples matched proteins in the GCI database; for example, BMM054 (Cave M) and KAK10 (Kakrak Cave 44) contained drying oils as well as amino acids that best matched egg based on the correlation coefficients (0.96 and 0.99). The presence of egg and oil illustrate a complex painting technique and could be from different paint layers. BMM045 (Cave G) and BMM169 (Cave J(f)) contained amino acids that best matched casein, or milk protein. While BMM063 (Cave B(d)), FDM 060 (Foladi Cave 6), and KAK 03 (Kakrak 43) best matched animal glue, which was differentiated from casein and egg by the detection of the amino acid hydroxyproline. GC-MS analysis quantified the so-called “stable amino acids” for determination of a correlation coefficient, and these amino acids remain relatively stable over time in the presence of certain pigments, relative to other amino acids that rapidly degrade with oxygen, heat, and humidity.
GC-MS plant gum analysis of 58 paint samples revealed that 80% did not contain carbohydrates (ND). However, six samples contained carbohydrates that most closely matched tragacanth gum, and four samples best matched fruit tree gum. The identification of tragacanth gum is based on the detection of fucose, a unique sugar specifically found in tragacanth gum but not present in acacia, Arabic, or fruit tree gums. The identification of plant gums by GC-MS is inherently difficult, most notably in outdoor wall paintings. This is due to low concentrations of sugars after years of degradation from the environment or microbiological enzymes and, conversely, increased amounts of carbohydrates (xylose, glucose) due to contamination from earthen plaster or straw. In this study, when fucose was not present, it more closely matched fruit tree gum.
Lastly, BMM120 (Cave J(d)) contained a synthetic alkyd paint composed of fatty acids phthalic acids, and adipic acids and could be from a past restoration campaign. BMM134 (Cave K3) is composed of a dark brown deposit and unusual long chain fatty acids, and an unidentifiable protein was also detected. A scan of the data revealed that samples from BMM067 (Cave E 111), BMM099 (Cave D), BMM199 (WGB), and BMM201 (WGB) contained trace amounts of pine resin due to the detection of abietic acid (pine resin marker). The significance of this result is not known, but SR-μFTIR also detected natural resin in samples from BMM035 (Cave N(a)), BMM082, and FDM055.

3.4. Analysis of Binding Media Materials Using ELISA

Casein and plant gums were mainly detected in samples, as well as animal glue, egg white, and tragacanth gum; several binding media were often detected in one sample, suggesting that different kinds of binders were used for sizing, ground, and paint layers (Table 6). Casein was also detected in all samples, and its high absorbance suggested that casein was used as a sizing agent. The results for BMM191 (EGB) were in agreement with the nano-LC/ESI-MS/MS results (Section 3.6), and those for BMM169 (Cave J(f)) with the GC-MS results (Section 3.3). However, results for BMM082 (Cave F(c)) only partially agree with the GC-MS results; plant gums and casein were detected in ELISA, but tragacanth and protein were detected in GC-MS where only organic deposits on the paint surface were selectively analyzed. Although the results of ELISA were likely affected by paint pigments and the aging of proteins, especially where egg or glue binder were used [38,43,44], ELISA has the advantage that several proteins and plant gums in a single sample can be identified simultaneously in one analysis. Moreover, the ELISA method was useful for cross-checking results with those of other analytical methods. The fact that casein was detected in all samples in ELISA, while it was detected in only two samples in GC-MS, may indicate that ELISA is more accurate than GC-MS in detecting organic matter when several different proteins and gums are mixed together in a single sample.

3.5. Identification of Protein and Animal Sources of Glue by LC-MS

3.5.1. Protein Identification for BMM061, BMM078, and BMM194

Casein was identified in BMM061 (Cave A) and BMM078 (Cave M) through protein database searches (Table 7). A type I collagen α1-chain was detected in BMM194 (Cave N(a)), but the animal species could not be determined by the analysis. Detailed lists of detected peptides are shown in Table S1.

3.5.2. Species Identification for Glue

We previously established species identification methods for leather and glue by LC-MS detection of type I collagen-derived marker peptides after trypsin digestion [39,40,45]. The LC-MS method using 12 pre-selected marker peptides enabled us to clearly discriminate between eight animal sources (cattle, horse, pig, sheep, goat, deer, rabbit, sturgeon) of glue containing multiple animal origins [40]. The advantage of this method is that it can be applied to animal species whose amino acid sequences are not registered in protein databases and to glutinous species of multiple origins. Results for BMM194 (Cave N(a)) showed the clear detection of P1, P6, and P8 marker peptides, which were identified as horse, based on their detection pattern (Table 8). Therefore, we could conclude that horse glue was probably used as a sizing layer in the wall paintings of Cave N(a), which was already indicated by SR-μFTIR imaging.

3.6. Mass Spectrometry of Proteinaceous Materials Extracted from the Polychrome Fragments of the Eastern and Western Giant Buddhas

3.6.1. Collagen in Specimens from BMM191, BMM199, and BMM201

Mass spectrometry detected peptides that originated from type I collagen of cattle (Bos taurus) in BMM191 (EGB), BMM199 (WGB), and BMM201 (WGB). In contrast, we did not detect any protein in BMM190 (EGB), except for a possible contaminant of keratin and a few fragment peptides of trypsin, in spite of it being the largest sample (14.6 mg) among four specimens from the Giant Buddhas.
Type I collagen consists of two α1-chains (COL1A1) and one α2-chain (COL1A2) to form the characteristic triple helix. Table 9 lists all the tryptic peptides identified by ESI-MS/MS analysis of proteins extracted from BMM191 and BMM199, together with the species marker of Bos taurus (cattle) and peptides found in BMM201. These results rule out the possibility of any species other than cattle as a source of animal glue. Although there are a few exceptions including the peptide GIOGPAGAAGATGAR identified from BMM194 (P8 in Table 8), which corresponds to one of the markers of Sus scrofa (pig) and Equus caballus (horse), these peptides could be contaminants that originated from other specimens or artifacts due to about 1400 years of aging in the open-air site.
Although peptides identified from type III collagen were detected only in the sample BMM201, these peptides showed more clearly that the source of animal glue used as a binder was cattle hide. As shown in Figure 8, the amino acid sequences of peptides are not consistent with those of animals, including horses, pigs, sheep, goats, and deer, in line with the results obtained from type I collagen (Table 9). Moreover, the possibility of animal bone as a source of animal glue is unlikely because type III collagen is much less abundant in bones and tendons than type I collagen [46]. The full lists of MASCOT search results of peptides are summarized in Figures S2–S4 in Supporting Information.

3.6.2. Casein

Another protein of note is α-S1-casein of cow milk found in protein extracted from BMM191 (EGB) and BMM201 (WGB). We identified peptides FFVAPAFPEVFGK and YGLYLEQ*LLR (Q* = E) in both specimens BMM191 and BMM201 by nano-LC/ESI-MS/MS. Interestingly, these peptides have also been found in milk protein more than 4000 years old in a food vessel from northern England [47] and in food remnants from China 2000–2500 years old [48]. In BMM201, we found an additional peptide, VPQ*LEIVPN*SAER (Q* = E; N* = D), which would not have been detected in the aforementioned cases due to degradation of milk casein from ancient England or China [47,48]. These peptides may have originated from cow milk since their amino acid sequences were consistent with α-S1-casein of cattle (Figure 9). For example, the sequence of YGLYLEQ*LLR identified by the ESI-MS/MS analysis (Figure 10) matched with that of goat as well as cattle, but the other sequence of FFVAPFPEVFGK and VPQ*LEIVPN*SAER (Figure S4) did not match with that of goat.

4. Discussion

Our various complementary micro-analyses revealed the presence of a large variety of organic components in different layers of samples taken from the surfaces of the Eastern and Western Giant Buddhas and the Bamiyan wall paintings.
In the deepest layers (transparent sizing layer), SR-µFTIR highlighted the presence of proteins. GC-MS analyses on six samples from the EGB and seven samples from the WGB confirmed that the paintings contained proteinaceous binding media. Notably, samples from the EGB (BMM191) and WGB (BMM199, 201) contained cow glue, including cow skin glue (cattle hide) (BMM201) identified through the presence of type III collagen by nano-LC/ESI-MS/MS. Unexpectedly, horse glue was detected in the wall paintings of Cave N(a) (BMM194) by LC-MS in MRM mode, as described in Section 3.5, and could have been used as a sizing agent. However, this is a rare example from Bamiyan. The recently developed analytical protocol with LC-MS [39,40] is a rather convenient and quick method for identifying specific species of animals, primarily in the leather industry, and is a powerful tool for paint analysis. However, casein (cow milk) was identified in the EGB samples and BMM201 (WGB) and could have been used as a sizing agent under the painting layers. Casein was also identified in samples from the wall paintings of Cave A (BMM061) and Cave M (BMM078) by LC-MS/MS. The presence of casein could support a historical recipe recorded in the citrasūtra (a technical and religious treatise on Buddhist paintings in India), which mentions the use of cow milk on earthen walls [49].
On the contrary, the ELISA method revealed casein in all samples, plant gum in three samples, and tragacanth in one sample. These could stand as evidence that, in each painting, plant gums and tragacanth served as binding media and the protein (casein) as a sizing agent. Plant gums and tragacanth seem to be readily detected owing to the method’s high sensitivity with regard to minor organic materials that may not be identified using LC-MS or GC-MS, although this method has a rather narrow range of candidates for testing due to its methodological limitations.
Below the proteinaceous sizing layer, SR-μFTIR sometimes detected the presence of a natural resin. However, GC/MS did not confirm resin in these samples but detected trace amounts of pine resin in other caves. Above the sizing layers, SR-µFTIR analyses revealed that the white ground layers (similar to imprimatura) contain partially saponified fatty esters (or the presence of lead soaps) mixed with lead white pigment (cerussite and hydrocerussite). A similar saponified fatty medium was also detected in some painted layers. Thanks to GC-MS, drying oils (vegetable oils) were more precisely identified in the wall paintings of 12 caves. Some other fatty acids were also detected, which could be related to egg or other sources.
Considering the recurrent presence of lead soaps, their homogeneous distribution in the ground and some painted layers, and the good conservation state of these layers, the assignment of lead soaps to an intentional synthesis should not be neglected [50]. In Shōsōin Repository, Nara, Japan (8th century AD), a technique named mitsuda-e, based on the name mitsudasō, which refers to litharge (PbO), describes the mixing of PbO with vegetable oil. This recipe is assumed to originate from Persia [51]. It may be a link between historical painting techniques and the Bamiyan paintings.
Oil-based mordants were also found under metal foils used as surface decorations (BMM178, QJM06).
Finally, numerous surface areas contained oxalates (mainly calcium and sometimes copper), which could be degradation products of organic components that form lightly colored films on the paint surface.
Regarding the analytical procedure, the use of infrared (and X-ray, not shown here) synchrotron beams was essential to get a sufficient resolution to analyze layers separately. However, it has to be noted that the µFTIR experiments were carried out in 2007. In this period, there were already efforts to make µFTIR accessible with laboratory techniques and, since then, there has been tremendous progress in the implementation of efficient laboratory µFTIR microscopes, reaching similar or even better resolution than the one achieved in this work. Some microscopes are based on the use of focal plan array detectors, combined with attenuated total reflection mode [52]. More recently, a new technology based on the use of laser and optical photothermal infrared contrast enabled sub-micrometric resolution [53]
It is difficult to analyze organic binding media with chromatographic techniques due to molecular degradation by environmental conditions and contamination by microorganisms, insects, and plants. Identification of specific binders by GC-MS should always be tentative because of the myriad of factors that can impact results. SR-µFTIR is less specific than MS techniques. However, the location of different molecular families is highly useful, especially for differentiating original components from degraded ones. The multi-analytical approach used in this study allowed for more confidence in identification of organic paint components. For example, casein (cow milk) was identified in BMM045 (Cave G) and BMM169 (Cave J(f)) by GC-MS. It was also identified in all samples in Table 6, BMM082 (Cave F(c)), BMM115 (Cave J(c)), BMM137 (Cave K3), BMM169 (Cave J(f))), BMM191 (EGB), BMM203 (Cave L), and BMM210 (Cave C(a)) by ELISA and in BMM191 and BMM201 (WGB) by nano-LC/ESI-MS/MS. These techniques complemented each other and added significance to the identification of casein by GC-MS.
Additionally, gum tragacanth was identified in several samples by GC-MS due to the presence of fucose, and this interpretation is strengthened by its identification in BMM191 by ELISA. Animal glue was confirmed by ELISA and nano-LC-MS/MS. However, the identification of egg in several samples was not confirmed by other techniques and should be the focus of future investigations, although egg was detected in BMM210 (Cave C(a)) by ELISA.
Bamiyan is not a forgotten site. It is a living heritage in many ways–one that provides us with a continuous stream of new discoveries. However, conservation at Bamiyan faces much uncertainty since both the geomorphological instability of the Bamiyan cliff and caves and the political instability complicate continuation of the conservation project.

5. Conclusions

Bamiyan’s wall paintings, which are fairly representative of wall paintings in Central Asia, are produced from complex techniques and structures using various organic components. A proteinaceous layer, which is made of cow milk casein or cow/horse glue, was often identified as a sizing layer on the earthen render. This can be explained by the historical Indian treatise of painting materials, citrasūtra. This use of drying oils as a binding media in mid-7th century wall paintings in Buddhist caves is still the oldest example of oil-based painting techniques to have survived. This technology employing various organic components is archaeologically and historically important. The presence of lead-based pigments and lead soaps as saponified product with drying oils should be noted in the painting history of Central Asia.
For scientific study of painting, structural analysis using polished sections and imaging technology (with and without synchrotron based micro-techniques) is indispensable for identifying the exact location of organic and inorganic substances within the multiple layers. With this information, further high-sensitivity bulk analysis (LC-MS, LC-MS/MS, nano-LC/ESI-MS/MS, GC-MS, ELISA) could be more meaningful.
A wide range of analytical techniques could cross-check the results and also identify specimens and the origins of organic substances in-depth. In this study, all the results were without contradictions. These results provide a more comprehensive picture of past painting technologies and materials, while also shining a light on the disadvantages of particular methodologies.

Supplementary Materials

The following supporting information can be downloaded at: https://www.mdpi.com/article/10.3390/app12199476/s1, MS/MS spectra of peptides in BMM194 is shown in Figure S1. Detailed results of the MASCOT search are shown in Figure S2 for peptides in BMM191, Figure S3 for peptides in BMM199, and Figures S4-1 and S4-2 for peptides in BMM201. Figure S5 shows ESI-MS/MS spectrum of the precursor ion peak at m/z 791.6 (z = 2). This peptide was isolated by nano-LC of tryptic digest of a protein obtained from the specimen BMM201. Details of detected peptides in BMM061, BMM078, and BMM194 in Table S1. The details of the MASCOT search of proteins are as follows: Table S2 (BMM191); Table S3 (BMM199); Table S4 (BMM201) and Table S5 (BMM191, BMM199, and BMM201).

Author Contributions

Conceptualization, Y.T., M.C., M.T. and T.N.; methodology, Y.T., M.C., M.T., K.K., T.N., Y.K., Y.T. (Yuki Taga) and J.M.; Protein mass spectrometry, T.N. and K.K.; ELISA, M.T. and J.M.; GC-MS, J.M., M.T., T.N., LC-MS, Y.K., Y.T. (Yuki Taga) and K.K.; synchrotron-based analyses, M.C. All authors have read and agreed to the published version of the manuscript.

Funding

Part of this study has been funded by the Grant-in-Aid for Scientific Research [16K01187 24101014 and 19K01133 for M.T. and Y.T., 18H05449, 17K01192, 21700845 and 18700680 for Y.T., 24700934 for M.T., and 16H05656, 17H05130, and 19H04525 for T.N.] from the Ministry of Education, Culture, Sports, Science and Technology of Japan.

Institutional Review Board Statement

Not applicable.

Informed Consent Statement

Not applicable.

Data Availability Statement

The results of protein mass spectrometry described in Section 3.5.1, Section 3.5.2, Section 3.6.1 and Section 3.6.2 are given in in the Results section and Supporting Information. The data presented in this study are available on request from the corresponding author.

Acknowledgments

We acknowledge the collaboration of the Afghan government and the National Research Institute for Cultural Properties, Tokyo (NRICPT), for providing samples of wall paintings from Bamiyan. The Bamiyan wall painting project has been supported by the NRICPT as a part of safeguarding projects by the Japanese Funds-in-Trust UNESCO project led by Kazuya Yamauchi of Teikyo University and the Agency for Cultural Affairs, Ministry of Foreign Affairs, Japan. The authors wish to thank the Getty Conservation Institute for GC-MS analysis. We thank Shunsuke Fukakusa for his support of protein mass spectrometry. We also extend gratitude to ESRF for providing beamtime (EC-101, in-house beamtime at ID21, and “The Historical materials BAG”, implemented with support from the European Union’s Horizon 2020 research and innovation programme under grant agreement No 870313, Streamline).

Conflicts of Interest

The authors declare no conflict of interest.

References

  1. Yamauchi, K. (Ed.) Preserving Bamiyan: Proceedings of the International Symposium “Protecting the World Heritage Site of Bamiyan”, Tokyo, 21 December 2004 (Recent Cultural Heritage Issues in Afghanistan Vol. 1); Japan Center for International Cooperation in Conservation, National Research Institute for Cultural Properties, Japan, Akashi Shoten: Tokyo, Japan, 2005.
  2. Taniguchi, Y. Conserving the Buddhist wall paintings of Bamiyan in Afghanistan: Practical issues and dilemmas. In Art of Merit: Studies in Buddhist Art and Its Conservation; Park, D., Wangmo, K., Cather, S., Eds.; Archetype Publications: London, UK, 2013; pp. 125–140. [Google Scholar]
  3. Yamauchi, K. (Ed.) Radiocarbon Dating of the Bamiyan Mural Paintings, Recent Cultural Heritage Issues in Afghanistan 2; Akashi Shoten: Tokyo, Japan, 2006. [Google Scholar]
  4. Blänsdorf, C.; Nadeau, M.-J.; Grootes, P.; Hüls, M.; Pfeffer, S.; Themann, L. Dating of the Buddha Statues-AMS 14C Dating of Organic Materials. In The Giant Buddhas of Bamiyan, Safeguarding the Remains; Petzet, M., Ed.; ICOMOS: Berlin, Germany, 2009; pp. 231–236. [Google Scholar]
  5. Bronk Ramsey, C. OxCal 4.4. 2021. Available online: https://c14.arch.ox.ac.uk/oxcal (accessed on 17 February 2022).
  6. Taniguchi, Y. Cultural Identity and the Revival of Values after the Demolishment of Bamiyan’s Buddhist Wall Paintings. In The Future of the Bamiyan Buddha Statues: Heritage Reconstruction in Theory and Practice; Nagaoka, M., Ed.; Springer: Cham, Switzerland, 2020; pp. 51–70. [Google Scholar]
  7. Taniguchi, Y. Issues of Conservation for the Bamiyan Buddhist Mural Paintings. In Mural Paintings along the Silk Road: Cultural Exchanges between East and West, Proceedings of the 29th Annual International Symposium on the Conservation and Restoration of Cultural Property, National Research Institute for Cultural Properties, Tokyo, January 2006; Yamauchi, K., Taniguchi, Y., Uno, T., Eds.; Archetype Publications: London, UK, 2007; pp. 144–151. [Google Scholar]
  8. Taniguchi, Y. Constituent material analysis of the Bamiyan Buddhist wall paintings in Central Asia (2): Organic analysis using GC/MS and ELISA. Bull. Natl. Mus. Jpn. Hist. 2012, 177, 81–106. [Google Scholar]
  9. Cotte, M.; Susini, J.; Solé, V.A.; Taniguchi, Y.; Chillida, J.; Checroun, E.; Walter, P. Applications of synchrotron-based micro-imaging techniques to the chemical analysis of ancient paintings. J. Anal. At. Spectrom. 2008, 23, 820–828. [Google Scholar] [CrossRef]
  10. Taniguchi, Y.; Otake, H.; Cotte, M.; Checroun, E. The painting techniques, materials and conservation of Bamiyan Buddhist mural paintings in Afghanistan. In Proceedings of the 15th Triennial Meeting of the ICOM Committee for Conservation, New Delhi, India, 22–26 September 2008; pp. 397–404. [Google Scholar]
  11. Taniguchi, Y. Materials and Technologies of the Bamiyan Wall Paintings. In Conservation and Painting Techniques of Wall Paintings on the Ancient Silk Road; Aoki, S., Taniguchi, Y., Rickerby, S., Mori, M., Kijima, T., Su, B., Kirino, F., Eds.; Springer: Singapore, 2021; pp. 177–195. [Google Scholar]
  12. Cotte, M.; Gonzalez, V.; Vanmeert, F.; Monico, L.; Dejoie, C.; Burghammer, M.; Huder, L.; de Nolf, W.; Fisher, S.; Fazlic, I.; et al. The “Historical Materials BAG”: A New Facilitated Access to Synchrotron X-ray Diffraction Analyses for Cultural Heritage Materials at the European Synchrotron Radiation Facility. Molecules 2022, 27, 1997. [Google Scholar] [CrossRef]
  13. Plesters, J. Cross-sections and Chemical Analysis of Paint Samples. Stud. Conserv. 1956, 2, 110–131. [Google Scholar]
  14. Cotte, M.; Pouyet, E.; Salomé, M.; Rivard, C.; De Nolf, W.; Castillo-Michel, H.; Fabris, T.; Monico, L.; Janssens, K.; Wang, T.; et al. The ID21 X-ray and infrared microscopy beamline at the ESRF: Status and recent applications to artistic materials. J. Anal. At. Spectrom. 2017, 32, 477–493. [Google Scholar] [CrossRef]
  15. Cotte, M.; Fabris, T.; Agostini, G.; Meira, D.M.; De Viguerie, L.; Solé, V.A. Watching Kinetic Studies as Chemical Maps Using Open-Source Software. Anal. Chem. 2016, 88, 6154–6160. [Google Scholar] [CrossRef]
  16. Pouyet, E.; Lluveras-Tenorio, A.; Nevin, A.; Saviello, D.; Sette, F.; Cotte, M. Preparation of thin-sections of painting fragments: Classical and innovative strategies. Anal. Chim. Acta 2014, 822, 51–59. [Google Scholar] [CrossRef]
  17. Manzano, E.; Rodriguez-Simón, L.R.; Navas, N.; Checa-Moreno, R.; Romero-Gámez, M.; Capitan-Vallvey, L.F. Study of the GC-MS determination of the palmitic-stearic acid ratio for the characterisation of drying oil in painting: La Encarnación by Alonso Cano as a case study. Talanta 2011, 84, 1148–1154. [Google Scholar]
  18. Schilling, M.R.; Heginbotham, A.; Van Keulen, H.; Szelewski, M. Beyond the basics: A systematic approach for comprehensive analysis of organic materials in Asian lacquers. Stud. Conserv. 2016, 61 (Suppl. 3), 3–27. [Google Scholar] [CrossRef]
  19. Mazurek, J.; Svoboda, M.; Schilling, M. GC/MS Characterization of Beeswax, Protein, Gum, Resin, and Oil in Romano-Egyptian Paintings. Heritage 2019, 2, 1960–1985. [Google Scholar] [CrossRef]
  20. Saverwyns, S.; Berghe, V. Separation Techniques in Archaeometry. In Analytical Archaeometry: Selected Topics; Kindle edition; Howell, E., Vandenabeele, P., Eds.; Royal Society of Chemistry: Cambridge, UK, 2016; p. 225. [Google Scholar]
  21. Colombini, M.P.; Modugno, F. Characterisation of proteinaceous binders and drying oils in wall painting samples by gas chromatography–mass spectrometry. J. Chromatogr. A 1999, 846, 113–124. [Google Scholar] [CrossRef]
  22. Schilling, M.; Khanjian, H. Gas chromatographic analysis of amino acids as ethyl chloroformate derivatives III. Identification of proteinaceous binding media by interpretation of amino acid composition data. In Proceedings of the 11th Triennial Meeting of the ICOM Committee for Conservation, Edinburgh, Scotland, 1–6 September 1996; Bridgland, J., Ed.; pp. 220–227. [Google Scholar]
  23. Pocklington, W.D. Determination of the iodine value of oils and fats: Results of a collaborative study. Pure Appl. Chem. 1990, 62, 2339–2343. [Google Scholar] [CrossRef]
  24. Song, Y.; Gao, F.; Nevin, A.; Guo, J.; Zhou, X.; Wei, S.; Li, Q. A technical study of the materials and manufacturing process used in the Gallery wall paintings from the Jokhang temple, Tibet. Heritage Sci. 2018, 6, 18. [Google Scholar] [CrossRef] [Green Version]
  25. Wei, S.; Schreiner, M.; Rosenberg, E.; Guo, H.; Ma, Q. The identification of the binding media in the Tang dynasty Chinese wall paintings by using py-GC/MS and GC/MS techniques. Int. J. Conserv. Sci. 2011, 2, 77–88. [Google Scholar]
  26. Van Keulen, H. Slow-drying oil additives in modern oil paints and their application in conservation treatments: An analytical study in technical historical perspective. In Proceedings of the 17th Triennial Meeting of the ICOM Committee for Conservation, Melbourne, VIC, Australia, Online Publication. 17–19 September 2014. [Google Scholar]
  27. Yang, H.; Xiao, X.; Li, J.; Wang, F.; Mi, J.; Shi, Y.; He, F.; Chen, L.; Zhang, F.; Wan, X. Chemical Compositions of Walnut (Juglans Spp.) Oil: Combined Effects of Genetic and Climatic Factors. Forests 2022, 13, 962. [Google Scholar] [CrossRef]
  28. Nogales-Bueno, J.; Baca-Bocanegra, B.; Hernández-Hierro, J.M.; Garcia, R.; Barroso, J.M.; Heredia, F.J.; Rato, A.E. Assessment of total fat and fatty acids in walnuts using near-infrared hyperspectral imaging. Front. Recent Dev. Plant Sci. 2021, 12, 729880. [Google Scholar] [CrossRef]
  29. Satranský, M.; Fraňková, A.; Kuchtová, P.; Pazderů, K.; Capouchová, I. Oil content and fatty acid profile of selected poppy (Papaver somniferum L.) landraces and modern cultivars. Plant Soil Environ. 2021, 67, 579–587. [Google Scholar] [CrossRef]
  30. Bondioli, P.; Folegatti, L.; Rovellini, P. Oils rich in alpha linolenic acid: Chemical composition of perilla (Perilla frutescens) seed oil. OCL 2020, 27, 67. [Google Scholar] [CrossRef]
  31. Siriamornpun, S.; Li, D.; Yang, L.; Suttajit, S.; Suttajit, M. Variation of lipid and fatty acid compositions in Thai Perilla seeds grown at different locations. Songklanakarin J. Sci. Technol. 2006, 28 (Suppl. 1), 17–21. [Google Scholar]
  32. Sutherland, K. Derivatisation using m-(trifluoromethyl) phenyltrimethylammonium hydroxide of organic materials in artworks for analysis by gas chromatography-mass spectrometry: Unusual reaction products with alcohols. J. Chromatogr. A 2007, 1149, 30–37. [Google Scholar] [CrossRef]
  33. Schilling, M.R. Paint Media Analysis. In Scientific Examination of Art: Modern Techniques in Conservation and Analysis; National Academy of Sciences, Ed.; The National Academies Press: Washington, DC, USA, 2005; pp. 186–205. [Google Scholar] [CrossRef]
  34. Lluveras-Tenorio, A.; Mazurek, J.; Restivo, A.; Colombini, M.P.; Bonaduce, I. Analysis of plant gums and saccharide materials in paint samples: Comparison of GC-MS analytical procedures and databases. Chem. Cent. J. 2012, 6, 115. [Google Scholar] [CrossRef]
  35. Heginbotham, A.; Millay, V.; Quick, M. The use of Immunofluorescence Microscopy (IFM) and Enzyme-linked Immunosorbent Assay (ELISA) as Complementary Techniques for Protein Identification in Artists’ Materials. J. Am. Inst. Conserv. 2006, 45, 89–105. [Google Scholar] [CrossRef]
  36. Mazurek, J.; Schilling, M.; Chiari, G.; Heginbotham, A. Antibody assay to characterize binding media in paint. In Proceedings of the 15th Triennial Meeting of the ICOM Committee for Conservation, New Delhi, India, 22–26 September 2008; pp. 849–856. [Google Scholar]
  37. Piqué, F.; Verri, G. (Eds.) Enzyme-Linked Immunosorbent Assay (ELISA) for Protein Identification. In Organic Materials in Wall Paintings: Project Report; The Getty Conservation Institute: Los Angeles, CA, USA, 2015; pp. 58–60. [Google Scholar]
  38. Takashima, M. Using Enzyme-Linked Immunosorbent Assay (ELISA) to Identify Proteinaceous Materials and Plant Gums in Artworks. J. Conserv. Cult. Prop. 2018, 61, 12–37. [Google Scholar]
  39. Kumazawa, Y.; Hattori, S.; Taga, Y. Semi-Nondestructive Certification of Crocodilian Leather by LC-MS Detection of Collagen Marker Peptides. Anal. Chem. 2019, 91, 1796–1800. [Google Scholar] [CrossRef]
  40. Kumazawa, Y.; Taga, Y.; Takashima, M.; Hattori, S. A novel LC-MS method using collagen marker peptides for species identification of glue applicable to samples with multiple animal origins. Herit. Sci. 2018, 6, 43. [Google Scholar] [CrossRef] [Green Version]
  41. Cotte, M.; Dumas, P.; Taniguchi, Y.; Checroun, E.; Walter, P.; Susini, J. Recent applications and current trends in Cultural Heritage Science using Synchrotron-based Fourier transform infrared micro-spectroscopy. C. R. Phys. 2009, 10, 590–600. [Google Scholar] [CrossRef]
  42. Shilling, M.R.; Carson, D.M.; Khanjian, H.P. Evaporation of fatty acids and the formation of ghost images by framed oil paintings. In Proceedings of the 12th Triennial Meeting of the ICOM Committee for Conservation, Lyon, France, 29 August–3 September 1999; James & James (Science Publishers) Ltd.: London, UK; pp. 242–247. [Google Scholar]
  43. Cartechini, L.; Vagnini, M.; Palmieri, M.; Pitzurra, L.; Mello, T.; Mazurek, J.; Chiari, G. Immunodetection of Proteins in Ancient Paint Media. Acc. Chem. Res. 2010, 43, 867–876. [Google Scholar] [CrossRef]
  44. Lee, H.Y.; Atlasevich, N.; Granzotto, C.; Schultz, J.; Loikeb, J.; Arslanoglu, J. Development and application of an ELISA method for the analysis of protein-based binding media of artworks. Anal. Methods 2015, 7, 187–196. [Google Scholar]
  45. Kumazawa, Y.; Taga, Y.; Iwai, K.; Koyama, Y. A Rapid and Simple LC-MS Method Using Collagen Marker Peptides for Identification of the Animal Source of Leather. J. Agric. Food Chem. 2016, 64, 6051–6057. [Google Scholar] [CrossRef]
  46. Nielsen, M.J.; Karsdal, M.A. Chapter 3—Type III Collagen. In Biochemistry of Collagens, Laminins and Elastin; Karsdal, M.A., Ed.; Academic Press: Cambridge, MA, USA, 2016; pp. 21–30. [Google Scholar]
  47. Buckley, M.; Melton, N.D.; Montgomery, J. Proteomics analysis of ancient food vessel stitching reveals >4000-year-old milk protein. Rapid Commun. Mass Spectrom. 2013, 27, 531–538. [Google Scholar] [CrossRef]
  48. Hong, C.; Jiang, H.; Lü, E.; Wu, Y.; Guo, L.; Xie, Y.; Wang, C.; Yang, Y. Identification of milk component in ancient food residue by proteomics. PLoS ONE 2012, 7, e37053. [Google Scholar] [CrossRef]
  49. Nardi, I. The Theory of Citrasūtras in Indian Paintings: A Critical Re-Evaluation of Their Uses and Interpretations; Routledge: London, UK; New York, NY, USA, 2006; p. 121. [Google Scholar]
  50. Cotte, M.; Checroun, E.; De Nolf, W.; Taniguchi, Y.; De Viguerie, L.; Burghammer, M.; Walter, P.; Rivard, C.; Salomé, M.; Janssens, K.; et al. Lead soaps in paintings: Friends or foes? Stud. Conserv. 2017, 62, 2–23. [Google Scholar] [CrossRef]
  51. Uemura, R.; Kameda, T.; Kimura, K.; Kitamura, D.; Yamasaki, K. Studies on the Mitsuda-e, a Kind of Oil Painting. Sci. Pap. Jpn. Antiq. Art Crafts 1954, 9, 15–21. [Google Scholar]
  52. Kazarian, S.G.; Chan, K.L.A. Micro- and Macro-Attenuated Total Reflection Fourier Transform Infrared Spectroscopic Imaging. Appl. Spectrosc. 2010, 64, 135A–152A. Available online: https://opg.optica.org/as/abstract.cfm?URI=as-64-5-135A (accessed on 20 August 2022). [CrossRef] [PubMed]
  53. Beltran, V.; Marchetti, A.; Nuyts, G.; Leeuwestein, M.; Sandt, C.; Borondics, F.; De Wael, K. Inside Cover: Nanoscale Analysis of Historical Paintings by Means of O-PTIR Spectroscopy: The Identification of the Organic Particles in L′Arlésienne (Portrait of Madame Ginoux) by Van Gogh. Angew. Chem. Int. Ed. 2021, 60, 22753–22760. [Google Scholar] [CrossRef] [PubMed]
Figure 2. Radiocarbon dating results from samples taken from the EGB and WGB. Colored areas are the most probable periods of construction.
Applsci 12 09476 g002
Figure 3. (a) Photomicrograph of a polished section of a sample from Qol-e Jalal Cave (QJM006) under normal light and (b) in UV light.
Applsci 12 09476 g003
Figure 4. (a) Photomicrograph of a polished section of a sample from Cave K3, Bamiyan (BMM135) under normal light and (b) in UV light.
Applsci 12 09476 g004
Figure 5. Optical microscopic pictures of some samples (fragments pressed between diamond cells). The red rectangles represent the regions analyzed with SR-µFTIR (cf. Figure 6).
Applsci 12 09476 g005
Figure 6. Left: µFTIR maps based on regions of interest (ROI). Red: 1720–1747 cm−1; green: 3131–3502 cm−1; blue: 1681–1722 cm−1 for the samples shown in Figure 5. Right: average FTIR spectra. extracted from the blue, green and red regions in the map of sample FDM55. Below: Close up of the CH (left) and CO (right) stretching regions. The coloured rectangles represent the ROI defined for the calculation of the maps. The red map highlights mainly oil ester groups. The green map highlights mainly proteins (amide A) but in the absence of proteins (BMM178 (Cave N(a)), a low signal from saponified oil and resin is visible. The blue map highlights mainly CO acid. With this specific ROI, natural resins are better seen, but oil (and in particular acidified oil) contributes as well (small shoulder in red spectrum).
Applsci 12 09476 g006
Figure 7. Fatty acid profile detected in sample from Cave N(a) (BMM035). AMDIS Excel data from Meth Prep. Azelaic = C9di, Sebacic = C8di, DiFa = dicarboxylic fatty acids indicate oxidation, C18-1 = oleic acid.
Applsci 12 09476 g007
Figure 8. Part of the amino acid sequence of type III collagen. The sequences are aligned according to the residue number of bovine α1(I) chain (P02453 CO1A1_Bovin). Amino acid sequences of peptides identified by our analysis of BMM201with ESI-MS/MS are printed in bold face and highlighted in green. Amino acid residues that differ from those in cattle sequence are highlighted in yellow. Color representing the sequence of each animal species: black (cattle); purple (deer); red (goats); pale green (sheep); blue (pig); green (horse).
Applsci 12 09476 g008
Figure 9. Full amino acid sequences of α-S1-casein comparing cattle, human, goat, and horse milk. Amino acid sequences of peptides identified by ESI-MS/MS are printed in bold face and highlighted in green. Color representing the sequence of each animal species: black (cattle); blue (human); red (goats); green (horse).
Applsci 12 09476 g009
Figure 10. ESI-MS/MS spectrum of the precursor ion peak at m/z 634.6 (z = 2). In the sequence of YGLYLEQ*LLR, Q* represents Glu (E) modified from Gln (Q) by the deamidation associated with aging.
Applsci 12 09476 g010
Table 2. Antibodies for ELISA at the National Museum of Western Art, Japan (as of 2018).
Primary AntibodiesDilutionSecondary AntibodiesDilution
Collagen #ab34710200Rabbit IgG #AP132A500
Collagen #ab19811400Goat IgG #ab6742500
Casein #bs-0813R400Rabbit IgG #AP132A500
Ovalbumin #ab12251600Rabbit IgG #AP132A500
Plant gum #JIM1350Rat IgM #A110-100AP500
Gum Tragacanth #MAC26550Rat IgG #A8438500
Table 3. Summary of the identification of the main organic components in Bamiyan’s paintings, using SR µFTIR mapping. The location of the components is given when the sample structure was sufficiently well preserved. * Indicates samples that have been analyzed only as thin resin-embedded sections. x indicates that the component has been detected but not assigned to a specific layer.
SampleProvenanceProteinaceous MaterialPartially Saponified OilOil (Acidified)Natural ResinOxalatesUnidentifiedRef.
BMM009Cave I x
BMM035Cave N(a)sizing layerwhite groundglaze/varnishdetected within/below the proteinaceous layersurface [10,41]
green layerblack layer
BMM039Cave N(a)sizing layerwhite ground surface
blue layer sizing layer
BMM040Cave N(a)sizing layerwhite ground surfaceblack layer (oil or resin)
sizing layerred layer (saturated signal)
BMM045Cave G x
BMM051Cave M x
BMM082Cave F(c)sizing layerwhite groundred layerdetected within/below the proteinaceous layer
BMM091Cave C(a) x
BMM101Cave E(e) x
BMM111Cave J(c) x
BMM178Cave N(a) white groundmordant over a lead/tin alloy (leaf) [11]
blue layer
BMM181Cave N(a)sizing layerwhite ground surfacered layer (saturated signal)
sizing layer
FDM035 *Foladi Cave 6 white ground surface
sizing layer
FDM037Foladi Cave 6 white ground red layer (saturated signal)
FDM053 *Foladi Cave 4 white ground surface
ground
FDM055Foladi Cave 4sizing layer (mixed with polysaccharides)white ground sizing layer, below proteinaceous layersurface [9,11,41]
red layer
white layer
green layer
KAK03Kakrak Cave 43sizing layerwhite layer surface
black layer sizing layer
QJM06Qol-e Jalalsizing layerwhite layertranslucent mordant
Table 4. Summary of GC-MS results for samples with oil. Samples are considered drying oil if the A/P ratio is greater than 1. Oils with A/P ratios lower than 0.6 (*) should be semi- or non-drying oils, fats, or lipids. NA = not analyzed, ND = not detected, below detection limit. Corr.coeff. = correlation coefficient.
SampleCaveDescriptionP/SA/PProtein (Corr.Coeff.)Plant Gum
BMM035N(a)resin, green, black, white ground, size3.11.8ProteinND
BMM040N(a)red/oily red, white ground3.32.4NANA
BMM054Mred, white ground1.91.3Egg (0.96)Plant Gum
BMM063B(d)red and ground3.12.4Glue (0.98)Tragacanth
BMM083-2F(c)black layer, yellow glaze, white ground2.72.4ProteinNA
BMM112 *J(c)green on white ground1.30.4NANA
BMM113 *J(c)green on white ground1.60.3NATragacanth
BMM135 *K3brown deposit on chaff0.40.1ProteinNA
BMM163S(a)grey/green, white ground, size2.51.5NDFruit Gum
BMM183N(a)deep red glaze on orange2.72.2NDTragacanth
BMM203Lgreen, white ground, yellow size2.92.2ProteinND
BMM204-2 *Lblack deposit1.80.2NANA
FDM014Foladi 4pink, yellow, white ground, size2.35.1ProteinNA
FDM023Foladi 4Bwhite, orange, white ground, size2.71.6NANA
FDM026Foladi 6black(green), white ground, white size2.63.7NAND
FDM043-1Foladi 3yellow translucent size1.91.8ProteinNA
FDM043-2Foladi 3white, white ground, size2.73.4ProteinNA
FDM055-1Foladi 4green, white ground, size, render2.81.8NANA
FDM059Foladi 2red and white ground3.12.6NDND
FDM 060Foladi 6brown, green, red, white ground, size1.93.8Glue (0.98)ND
KAK03Kakrak 43red, black organic, white ground3.21.7Glue (0.98)NA
KAK10Kakrak 44white and ground2.71.6Egg (0.99)ND
QJM06Qol-e Jalalgold leaf and mordant2.84NANA
QJM07Qol-e Jalalbrownish color, whole paint layer2.62.9ProteinNA
Table 5. Summary of GC-MS results for samples without oil. NA = not analyzed, ND = not detected, below detection limit. Corr.coeff. = correlation coefficient.
SampleCaveDescriptionOilProtein (Corr.Coeff.)Plant Gum
BMM045Gyellow, white groundNDCasein (0.95)ND
BMM067E IIIyellow, white groundNDProteinNA
BMM082F(c)organic depositNANATragacanth
BMM099Dred, white groundNDProteinNA
BMM120J(d)blue, pink groundNDProteinND
BMM128J(b)blue/black, white groundNDProteinND
BMM169J(f)red, renderNDCasein (0.92)ND
BMM184 N(a)silver colored surface with blueNANAFruit Gum
BMM191EGBblue in white, white groundNDProteinND
BMM211-2H(b)red and white groundNDProteinNA
BMM212H(a)yellow, white groundNDProteinND
FDM003Foladi 5red, white ground, sizeNDEgg (0.97)NA
FDM043Foladi 3red, white ground, two renderingsNANAPlant Gum
FDM051Foladi 4red and sermon pinkNANATragacanth
FDM054Foladi 4whitish green and redNANATragacanth
KAK05Kakrak 43Yellow ochre colorNANAFruit Gum
Table 6. ELISA optical densities for samples.
SampleCaveEgg WhiteAnimal Glue (Anti-Collagen#ab19811)Animal Glue (Anti-Collagen#ab34710)CaseinPlant gum TragacanthIdentified
40 μL20 μL20 μL10 μLAverage Values of Blank +3SD40 μL20 μL20 μL10 μLAverage Values of Blank +3SD40 μL20 μL20 μL10 μLAverage Values of Blank +3SD40 μL20 μL20 μL10 μLAverage Values of Blank +3SD40 μL20 μL20 μL10 μLAverage Values of Blank +3SD40 μL20 μL20 μL10 μLAverage Values of Blank +3SD
BMM210C(a)0.4570.4600.3850.344 0.379 0.1740.1450.1550.1430.117 0.169 0.156 0.095 0.141 0.194 0.1860.1300.1380.1390.104 0.1930.1970.137 0.128 0.183 0.076 0.077 0.079 0.074 0.103 Casein, egg white, animal glue
BMM191EGB0.3450.238 0.213 0.244 0.334 0.105 0.109 0.113 0.107 0.118 0.144 0.1680.1650.1540.145 0.5060.2820.3400.2400.102 0.024 0.173 0.189 0.126 0.564 0.0760.0830.0780.0940.070 Casein, animal glue, tragacanth
BMM082F(c) 0.310 0.386 0.449 0.6700.615 0.061 0.075 0.077 0.075 0.091 0.7230.402 0.409 0.483 0.525 0.2450.2300.2300.2250.074 0.3040.3230.2980.3110.171 0.053 0.053 0.053 0.0860.079 Plant gum, casein
BMM115J(c)0.384 0.410 0.458 0.440 0.463 0.087 0.091 0.080 0.066 0.128 0.105 0.111 0.114 0.103 0.126 0.5630.3100.3620.2200.112 0.4601.6101.5121.6970.198 0.075 0.071 0.074 0.0730.084 Plant gum, casein
BMM137K30.216 0.127 0.138 0.136 0.179 0.070 0.061 0.073 0.065 0.075 0.245 0.271 0.245 0.326 0.388 0.2530.2370.2710.2420.092 0.123 0.065 0.087 0.098 0.156 0.054 0.054 0.051 0.048 0.122 Casein
BMM169J(f)0.4020.344 0.246 0.356 0.379 0.099 0.116 0.1340.1190.117 0.125 0.140 0.090 0.141 0.194 1.1190.9141.0850.6680.104 0.2230.2030.151 0.166 0.183 0.072 0.071 0.072 0.075 0.103 Casein
BMM203L0.2060.132 0.124 0.149 0.179 0.050 0.048 0.051 0.048 0.055 0.133 0.174 0.167 0.161 0.240 1.6730.9891.2081.1510.078 0.2020.095 0.1600.1840.156 0.049 0.045 0.047 0.043 0.122 Plant gum, casein
Table 7. Results from the database search for proteins.
BMM061ProteinAccession NumberSpecies
NScore
18.10Alpha-S1-casein sp|P02662|CASA1_BOVINBos taurus
25.71Beta-casein sp|P02666|CASB_BOVINBos taurus
32.00Alpha-S2-casein sp|P02663|CASA2_BOVINBos taurus
BMM078ProteinAccession NumberSpecies
NScore
16.01Alpha-S1-casein sp|P02662|CASA1_BOVINBos taurus
20.48ATP synthase subunit sp|Q16AM8|ATP6_ROSDORoseobacter denitrificans
BMM194ProteinAccession NumberSpecies
NScore
13.15Collagen alpha-1(I) chain sp|P11087|CO1A1_MOUSEMus musculus
sp|P0C2W8|CO1A1_MAMAEMammut americanum
sp|P02452|CO1A1_HUMANHomo sapiens
sp|C0HJN3|CO1A1_ORYAFOrycteropus afer
sp|Q9XSJ7|CO1A1_CANLFCanis lupus familiaris
sp|P02453|CO1A1_BOVINBos taurus
sp|C0HJP5|CO1A1_MACSXMacrauchenia sp.
sp|C0HJP1|CO1A1_CYCDICyclopes didactylus
sp|C0HJN5|CO1A1_HIPAMHippopotamus amphibius
sp|P02454|CO1A1_RATRattus norvegicus
sp|C0HJP7|CO1A1_TOXSPToxodon sp.
sp|C0HJP3|CO1A1_MYLDAMylodon darwinii
sp|C0HJN9|CO1A1_EQUSPEquus sp.
sp|C0HJN7|CO1A1_TAPTETapirus terrestris
Trypsin was excluded from the list.
Table 8. List of marker peptides for animal species identification and the results of BMM194.
ChainPositionMarker PeptideSequence aCattle bHorse bPig bSheep bGoat bDeer bRabbit bSturgeon bBMM 194 b
α1(I) 316–327P1GFOGADGVAGPK++++++
316–327P2GFOGSDGVAGPK++
688–704P3GAAGPOGATGFOGAAGR+
733–756P4GETGPAGROGEVGPOGPOGPAGEK++++
741–756P5AGEVGPOGPOGPAGEK+
889–906P6GEAGPAGPAGPIGPVGAR++
889–906P7GETGPAGPAGPAGPAGAR+
α2(I) 238–252P8GIOGPAGAAGATGAR+++
253–264P9GLVGEOGPAGTK+
361–374P10GFOGSOGNVGPAGK+
978–990P11IGQOGAVGPAGIR+
978–990P12TGQOGAVGPAGIR++++
a O indicates 4-hydroxyproline. b The presence and absence of marker peptides are denoted by + and −, respectively.
Table 9. Tryptic peptides identified originating from the type I collagen α1-chain (COL1A1), α2-chain (COL1A2), and type III collagen α1-chain (COL3A1) in BMM191, BMM199, and BMM201.
Peptide (COL1A1)m/zMass (Da)Sample (BMM)Species
GEAGPSGPAGPTGAR641.61281.2191, 201Bos
GPSGPQGPSGPOGPK666.71331.4199, 201Bos
GPSGPqGPSGPOGPK667.21332.4191, 201Bos
GEOGPAGLPGOOGER718.41434.8191, 201Bos
GSAGPOGATGFOGAAGR730.61546.2191, 201Bos
GETGPAGPAGPVGPVGAR *1774.11545.8191, 201Sus
GETGPAGPAGPIGPVGAR781.31560.5191, 199, 201Bos
DGEAGAQGPPGOAGPAGER 854.51706.9199, 201Bos
GEpGSOGEnGAPGQmGOR 880.81759.6199, 201Bos
SGDRGETGPAGPAGPIGPVGAR 659.71975.0199, 201Bos
GAPGADGPAGAOGTPGPQGIAGqR 1037.92073.7201Bos
GnDGATGAAGOPGPTGPAGPOGFGAVGAK850.82549.3199, 201Bos
GFSGLQGPPGPOGSOGEqGPSGASGPAGPR897.62689.8201Bos
GFSGLqGPOGOOGSPGEqGPSGASGPAGPR 903.52707.7191Bos
GLTGPIGPPGPAGAPGDKGEAGPSGPAGPTGAR952.02852.9191, 201Bos
Peptide (COL1A2)m/zMass (Da)Sample (BMM)Species
IGQPGAVGPAGIR597.11192.1199Bos
IGQOGAVGPAGIR605.21208.3191Bos
GEAGPAGPAGPAGPR631.61261.2191, 201Bos
GIOGPAGAAGATGAR *1620.61239.2201Sus, Equus
GIOGPVGAAGATGAR 634.51267.1191 Bos
GPOGESGAAGPTGPIGSR 791.21580.5191, 199, 201Bos
GELGPVGnOGPAGPAGPR 809.11616.2191, 201Bos
GSTGEIGPAGPOGPOGLR825.31648.6199, 201Bos
GLOGVAGSVGEPGOLGIAGPOGAR1066.32130.5191, 199, 201Bos
GYOGNAGPVGAAGAPGOQGPVGPVGK1131.42260.7191, 199Bos
GYOGnAGPVGAAGAPGOqGPVGPVGK1132.92263.8201Bos
GEqGOAGPPGFQGLPGOAGTAGEAGKOGER 932.02792.3199, 201Bos
Peptide (COL3A1) *2m/zMass (Da)Sample (BMM)Species
GPOGPOGTnGVOGqR719.71437.3201Bos
GETGPAGPSGAOGPAGSR770.61539.3201Bos
GEVGPAGSOGSSGAOGqR800.31598.5201Bos
GPOGPQLOGLAGTAGEOGR917.71833.4201Bos
Abbreviations: We used a standard one—letter code for proteinaceous amino acids. The other codes for a few modification products are as follows: O, hydroxy—Pro; m, Met (M)—sulfoxide; q, deamidated Gln (Q); n, deamidated Asn (N). Amino acid residues distinguishing between Bos (Bos taurus) and other animal species (Sus: Sus scrofa; Equus: Equus caballus) are printed in red. Sequences unique to deer, goats, sheep, pigs, and horses are printed in bold face. *1 Further analysis of these peptides is needed to confirm the identity of the species. Residues distinguishing between cattle and other species are printed in red. *2 See also Figure 6 for a comparison of sequences with respect to cattle, deer, goat, sheep, and horse.
Publisher’s Note: MDPI stays neutral with regard to jurisdictional claims in published maps and institutional affiliations.

