Abstract
In this paper, we propose a method that uses the femoral and tibial elevation angles to quantitatively evaluate the symmetry of lower limb movement during the transition from a sitting position to a standing position. In kinematic analysis of the transition from sitting to standing, the angles of the three joints of the lower limb are often measured. However, due to the large number of variables, it is difficult to evaluate the symmetry of the lower limb movement by comparing data from the six joints of the left and right lower limbs. In this study, therefore, we measured the femoral and tibial elevation angles of healthy participants and rehabilitation patients and visually and numerically evaluated the symmetry and asymmetry of the movement of the left and right lower limbs. We were able to identify the kinematically major lower limbs in the transition from sitting to standing and quantify the symmetry of the movement patterns of the left and right lower limbs. Furthermore, we examined the possibility that the method could be effectively used in the rehabilitation field to evaluate the motor co-ordination that constitutes the lower limb movement pattern in the transition from the sitting to standing position, such as the gait plane rule.
1. Introduction
In our daily lives, we repeatedly travel to and from our destinations to accomplish our goals, often choosing walking as our means of transportation. However, disabled or elderly people who cannot walk safely may choose a wheelchair as their means of transportation [1]. When we walk or sit in a wheelchair, we need to perform a standing movement (sitting to standing (STS)). However, disabled and elderly people may not be able to perform the STS movement and may not be able to continue to live independently. Therefore, sometimes, the goal of rehabilitation in hospitals and nursing homes is to ensure that the patient achieves the STS ability [2]. Post-hip-fracture and post-stroke patients targeted for rehabilitation have been reported to have asymmetric STS movements due to muscle weakness and impaired sensory integration in the lower limbs [3,4]. Pao-Tsai et al. reported that post-stroke patients who had experienced falls had greater asymmetry in the weight distribution to the lower limbs during the STS movement [5]; the asymmetry of the STS movements is shaped by the associated muscle forces and joint moments. Previous studies examining weight bearing in the lower limbs of post-stroke patients have reported that patients often shift their center of gravity to the nonparalyzed lower limb [6]. However, mechanical asymmetry of the lower limb during the STS movement may reduce safety when the person is performing an even more advanced and dynamic gait [7]. Ryoichiro et al. reported an STS rehabilitation system that improves the functional asymmetry of the lower limb caused by disease [8]. These previous studies indicate that it is important for rehabilitation to improve the muscle strength, movement, and asymmetric STS movement of the asymmetric lower limb.
In previous studies on STS symmetry, lower limb joint torque and floor reaction force were selected as mechanical parameters and joint angle as a kinematic parameter, parameters that can be observed in measurement experiments [9,10,11]. These parameters are observed as a result of the human central nervous system controlling the muscles (the locomotion organs). In Japan today, cerebrovascular disorders are the leading cause of the need for long-term care [12] and normalization of muscle activity patterns and center-of-gravity trajectories during movement through rehabilitation-incorporating robots is becoming the treatment of choice [13]. In other words, rehabilitation of the central nervous system, which controls muscle activity temporally and spatially, rather than rehabilitation to increase motor muscle mass and the force exerted by the muscles, is attracting attention. Ningjia et al. analyzed muscle synergy during the STS movement in stroke patients [14]. However, this report mentions asymmetry based on the analysis of muscle synergy but does not propose a quantitative method for evaluating symmetry and asymmetry. Wendy et al. proposed a symmetry index in their report on STS symmetry evaluation [9]. This method measures the angles of the right and left (R–L) lower limb joints during the STS movement and calculates the ratio of the angles as a symmetry index. Michalina et al. selected ankle, knee, and hip joint angles, joint torque, and floor reaction force as symmetry indices [11]. These previous studies converted the observed information into a single value as an index of symmetry and cannot represent the motion patterns during the STS movement.
The planar law of gait (PLG) is a well-known evaluation method that allows us to observe the coordination patterns of the neurophysiological body movement based on changes in joint angles observed over time during movement [15,16]. The PLG involves the three-dimensional plotting of the elevation angles (EAs) of three segments (thigh, shin, and foot) during walking. Gianluca et al. used the PLG of the L–R lower limbs to present the symmetry of the walking motion as visual information [17]. They evaluated the symmetry; if the PLG could be applied to the STS movement and the STS movement symmetry could be quantitatively evaluated, it would be possible to geometrically evaluate the symmetry of the control by the central nervous system during the STS movement. However, there are different factors involved in the STS movement and gait. In the gait, the EAs of three segments (thigh, shank, and foot) are observed, but in the STS movement the EA of the foot is always constant because the foot is restrained above the floor and only changes in the EAs of two segments (thigh and shank) are observed. Therefore, the observed changes in the EAs of the two body segments in the STS movement cannot be plotted on 3D coordinates as in the gait. Furthermore, since the STS movement is not a periodic motion similar to a gait, the PLG cannot be directly adapted to the STS movement.
2. Methods
2.1. Participants
This study included 4 healthy participants (22.3 ± 0.5 years) and 4 rehabilitation patients (82.8 ± 3.1 years). The selection criterion for healthy participants was the absence of trauma or a disability that would affect the STS motion at the time of participation. In the case of patients, those who were judged by a rehabilitation specialist to be able to complete the STS movement unaided were included. The study was conducted after the participants were informed about the study and after they signed a consent form. Table 1 provides physical information about the healthy participants and the rehabilitation patients.

Table 1.
Summary of the participants’ physical information.
2.2. Experiment
In this study, motion capture experiments were conducted with healthy participants at Kwansei Gakuin University from 20 February 2019 to 24 February 2019 and with rehabilitation patients at Toyonaka Heisei Hospital on 7 March 2020. The 40 motion capture markers were placed on landmarks throughout the body [18]. In this study, four markers (the lateral ankle, the lateral 1/3 of the lower tibia, the lateral epicondyle of the knee, and the lateral 1/3 of the lower thigh) were placed on one lower extremity, and participants sat in a chair with a height of 43.5 cm and without a backrest. Participants were instructed to not allow their upper limbs to come into contact with their body or the external environment during the STS movement. The motion capture experiment was conducted as follows (Figure 1).
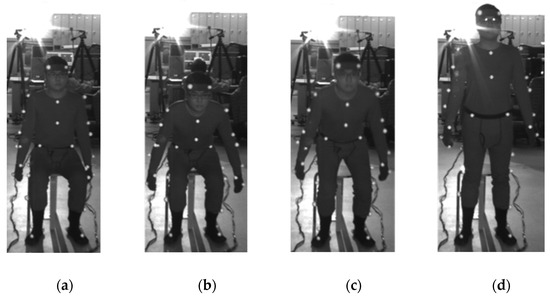
Figure 1.
STS measurement experiment. The upper extremity did not touch the body or the outside environment. The plantar was fixed in an arbitrary position that was not interchanged from the beginning to the end of the STS motion. (a) The start of the STS motion from the stationary starting posture at the signal, (b, c) the STS motion in progress, and (d) the end of the STS motion when the ending posture is stationary.
- Each participant sat in a chair and maintained their posture to initiate the STS movement.
- When we judged that the participant’s sitting posture was stationary, we signaled the start of STS.
- On hearing the cue, the participant initiated the STS movement.
- When the participant stood up and we judged that the standing posture was stationary, we signaled the end of the STS movement.
- The video images from the cue for the start of the movement to the cue for the end of the movement were included in the analysis.
A calibration space with an area of 150 cm × 150 cm and a height of 195 cm centered on the participant’s feet was set up (Figure 2). The captured images were recorded using Capture-Ex (Library Co., Ltd., Tokyo, Japan) at a sampling frequency of 50 Hz. Move-tr/3D (Library Co., Ltd., Tokyo, Japan) was used to convert the marker information in the video into coordinate data, and KineAnalyzer (KISSEI COMTEC Co., Ltd., Nagano, Japan) was used to measure the EAs of the thigh and shank. A 2 Hz low-pass filter was applied to all marker data. The EA formed by the shank and the vertical axis was defined as , and the EA formed by the thigh and the vertical axis was defined as (Figure 3).
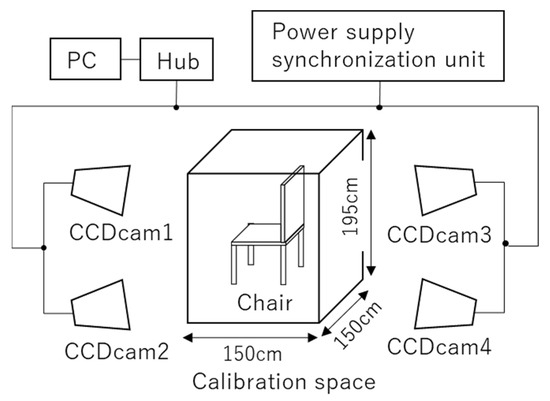
Figure 2.
Experimental setup. A calibration space (150 cm × 150 cm × 195 cm) photographed with four CCD cameras.
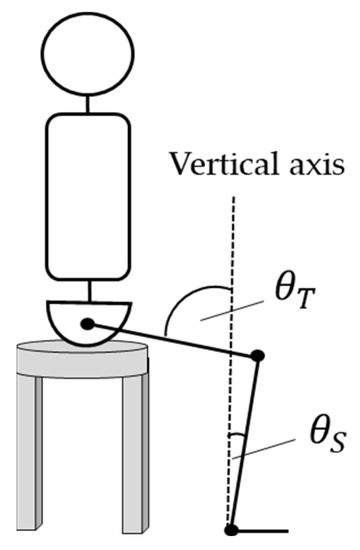
Figure 3.
Definition of EAs for the thigh and the lower leg. The EA was measured using KineAnalyzer. The angle between the vertical axis and the thigh axis was defined as , and the angle between the vertical axis and the lower leg was defined as .
2.3. Analysis
Data for each of the healthy and rehabilitation patient groups were analyzed, and statistical tests were performed on the results. Details of the analysis are provided below.
2.3.1. Definition of the EA error
During the STS motion, the shank EA was defined as and the thigh EA was defined as . In the first experiment of this study, the L–R errors of and were calculated. The indices of the L–R error were the shank EA error , the thigh EA error , and the overall error . Formulas (1)–(3) provide the calculation of each index.
where is the total number of samples for each participant and is the -th sample. The total number of samples was calculated by dividing the STS measurement time for each participant by the sampling frequency of 50 Hz.
2.3.2. Analysis of Measured EA changes
Two-dimensional Cartesian coordinates were created with the shank EA as the y-axis and the thigh EA as the x-axis, and n points (, ) were recorded on these coordinates. Point was recorded on coordinate for the R–L lower limbs. The position vector norm pointing from the origin to point was then calculated. Another two-dimensional Cartesian coordinate was created, with the position vector norm of the right lower limb as the x-axis and the position vector norm of the left lower limb as the y-axis. Thus, a line (the R–L vector line) consisting of n points (, ) on the two-dimensional coordinate was illustrated. Finally, a symmetrical reference line y = x was created on the two-dimensional coordinate and the average error ME and the average error sum of squares at each point of the target reference line and the R–L vector line were calculated using Equations (4) and (5):
3. Results
3.1. Symmetrical Comparison Using Measured EAs
Figure 4 and Figure 5 display the changes in shank EA and thigh EA during the STS motion. Figure 4 shows the results for each participant in the healthy group, and Figure 5 shows the results for each participant in the rehabilitation patient group.
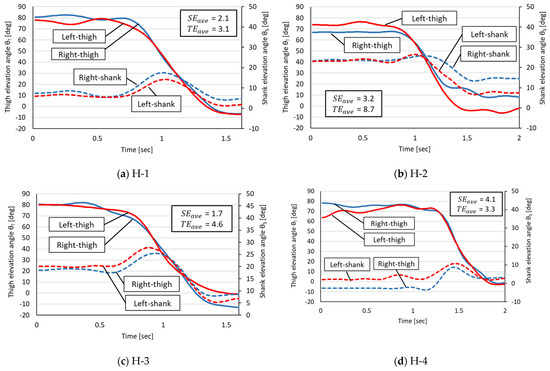
Figure 4.
Measured angular changes in thigh and shank EAs in the healthy group. The horizontal axis is the STS time (in seconds) of each participant. H-1 through H-4 in the figure refer to each healthy participant in Table 1.
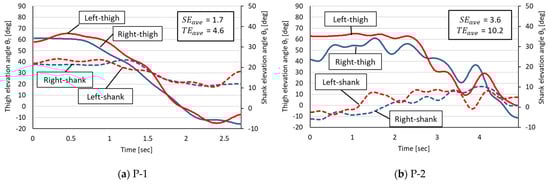
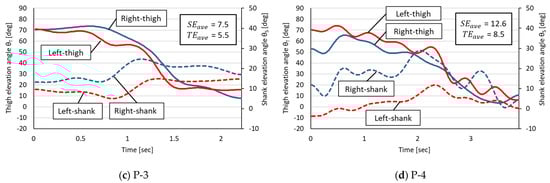
Figure 5.
Measured angular changes in thigh and shank EAs in the rehabilitation patient group. The horizontal axis is the STS time (in seconds) of each participant. P-1 through P-4 in the figure refer to each rehabilitated patient in Table 1.
On the basis of the measured EA changes in the healthy group, the following four phases were commonly observed in the healthy participants:
- -
- Phase 1: The STS start angle;
- -
- Phase 2: A decrease in the thigh EA and an increase in the shank EA;
- -
- Phase 3: A decrease in the thigh EA and a decrease in the shank EA;
- -
- Phase 4: The STS end angle.
A common characteristic of the healthy group was a small L–R error in the decrease in the thigh EA corresponding to Phases 2 and 3 but a trend toward larger L–R errors in thigh and shank EAs for Phases 1 and 4.
The EA changes in the rehabilitation patient group were characterized by two features. The first was that irregular EA changes occurred with shifting STS phases, making it impossible to identify the Phases 1–4 observed in the healthy group. The second was that the R–L thigh EAs were not as close as in the healthy group during Phases 2 and 3, even though the EA changes were similar in appearance to those in the healthy group (e.g., Patients 1 and 3).
Table 2 summarizes the R–L EA errors in the healthy group and the rehabilitation patient group. In this experiment, the mean and the standard deviation of each EA error , , and the error sum of the rehabilitation patient group were larger than those of the healthy group. A two-tailed Student’s t-test (R—4.0.2) at the 5% level of significance for the above three errors showed no significant difference between the two groups.
Table 2.
EA error in both groups.
3.2. Comparison of R–L Symmetry by the R–L Vector Line
Figure 6 and Figure 7 present the R–L vector lines for the healthy participants and the rehabilitation patients, respectively. Here, the numbers 1–4 assigned to each participant refer to the same participant’s results for the measured EAs (Figure 4 and Figure 5). Table 3 shows the and the obtained from the R–L vector line and the symmetric reference line; the is the error in the position vector norm of the R–L lower limbs, which approaches 0 if the motion patterns of the R–L lower limbs are symmetric ( = ).
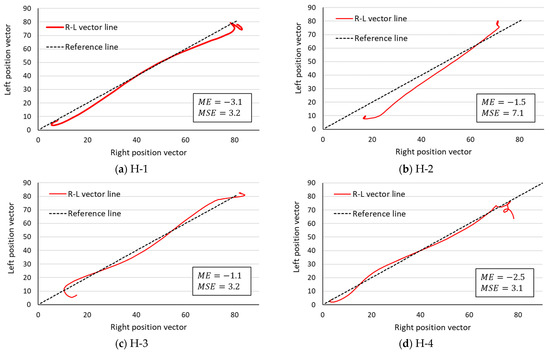
Figure 6.
R–L vector line in the healthy group. The lower limb movement pattern is symmetrical enough to be drawn near the central symmetry reference line. H-1 through H-4 in the figure refer to each healthy participant in Table 1.
Figure 7.
R–L vector line in the rehabilitation patient group. The lower limb movement pattern is symmetrical enough to be drawn near the central symmetry reference line. P-1 through P-4 in the figure refer to each rehabilitated patient in Table 1.
Table 3.
EA errors in both groups.
If , then the point (, ) is distributed more on the y-axis side of the symmetry reference line, and if , then the point f_i is distributed more on the x-axis side of the symmetry reference line. In the healthy participants, four values were negative, while in the rehabilitation patient group, two were positive and the remaining two were negative. Next, the is a parameter that quantifies the asymmetry of movement patterns. The of the healthy participants was 4.2 ± 2.0, while the of the rehabilitation patient group was 6.8 ± 2.5. The of the rehabilitation patient group was approximately 1.6 times that of the healthy group, but a two-tailed Mann–Whitney U test (R—4.0.2) at the 5% significance level showed no significant difference between the two groups.
4. Discussion
In post-total-hip-arthroplasty patients, the weight bearing on the lower limb during the STS motion is asymmetric because it is biased toward the healthy lower limb. In post-stroke patients, the center of foot pressure during the STS movement is asymmetric because it is biased toward the nonparalyzed side. Thus, previous studies have shown that muscle torque and joint angle changes exerted in the gait and during the STS movement are asymmetric due to disability or muscle weakness in one lower limb [7,19,20]. It was assumed that the rehabilitation patient group in this study would also have asymmetric lower limb joint angle changes during the STS motion due to disability and muscle weakness.
In patients with post-stroke syndrome, the muscle synergy of the R–L lower limbs is reportedly related to the asymmetry of the lower limb joint angle changes during the STS motion [21]. It is already known that the muscle synergy in such patients is altered compared with normal muscle synergy [22,23], and it was inferred that the patients in this study also had altered motor synergy of the unilateral lower limb due to disability and muscle weakness, resulting in asymmetric R–L lower limb movement during the STS motion. Therefore, we hypothesized that it is important to bring the synergy of the impaired lower limb of the patient closer to the normal state for the patient to recover the STS ability [21] and that improving the R–L lower limb coordination during the STS movement means that the muscle or motor synergy of the impaired lower limb used to perform the STS movement is closer to the synergy expressed by the healthy lower limb. We hypothesized that this would be the case. For this reason, we thought that a method for evaluating the coordination of R–L lower limbs during the STS movement was necessary and sought a method for evaluating this coordination from the perspective of both EAs and the R–L vector line in this study.
The R–L differences in shank and thigh EAs were also observed in the healthy participants. The reason for the observed differences in EAs in the healthy participants, despite the absence of a functional impairment, is presumably the habitual use of the dominant leg. Although there is no difference in muscle strength between the dominant and non-dominant leg [24,25], the dominant leg has priority in postural control [26]. In addition, placing one leg posteriorly at the start of the STS movement can reduce the external tension moment of the hip joint [27], which may have caused the difference in EAs in the healthy group. In the rehabilitation patients, both EA values and temporal–spatial differences were observed. These temporal–spatial differences were visually complex and difficult to analyze. Therefore, we performed an analysis using R–L vector lines.
The PLG is a geometric method used to identify the cooperative structure of lower limb movement patterns in the gait [15,16]. However, the PLG represents the coordinated motion of one lower limb and it cannot represent the coordinated movement of the R–L lower limbs. Therefore, in this paper, we proposed a method that presents information on the changes in the EA of the R–L thighs and tibia as a single line (the R–L vector line). This method suggests that the closer the drawn R–L vector line is to the symmetry reference line, the more parallel it is to the target reference line, and the higher is the degree of synchronization of the EA and the change per time point between the R–L segments. In other words, the symmetry of the movement pattern can be evaluated as high. The STS movement has a muscle coordination structure that is reportedly similar to that of walking [28,29], and the movements of the R–L lower limbs during the STS motion are considered to be the result of coordination. Therefore, we hypothesized that the symmetry of the coordinated movements of the R–L lower limbs during the STS motion could be evaluated by the R–L vector line. The of the R–L vector line analysis results provides information that can be used to identify which motion (left or right) is dominant based on the sign of the value (positive or negative) and its magnitude. In a previous study analyzing the STS motion of patients with femoral neck fractures, it was reported that the angular displacement of the knee joint and the hip joint is greater in the nonaffected lower limb, where the peak joint moment values are greater [30]. Therefore, by observing the , the lower limb that is the primary source of force used to perform the STS motion can be estimated, helping to interpret the visually complex information on elevation displacement. Previous studies have reported asymmetry in the STS motion in patients after a lower limb fracture or a stroke [4,5,7,19,20]. According to the R–L vector line and the sign of the value, two trends were observed in the rehabilitated patient group. The first is patients with increased use of one lower limb during STS movements (Figure 7, P-1 and P-3), where the R–L vector line was also drawn on the side indicated by the sign of the value. The second was a patient with alternating and irregular increases in R–L lower limb use (Figure 7, P-2 and P-4). In this case, it was difficult to determine whether the predominantly used lower limb was the right or left one only by observing the R–L vector line, but the direction of the predominantly used lower limb could be determined from the sign of the value. On the other hand, compared with the rehabilitation patients, the R–L vector line of the healthy participants passed near the symmetric reference line. In other words, the R–L lower limbs of the healthy participants showed the possibility of coordinated temporal and spatial movement. Chun et al. reported that a robotic rehabilitation intervention for stroke patients improves the muscle synergy asymmetry between the affected and nonaffected lower limbs [31]. In the study by Chun et al., the symmetry between R–L lower extremities was assessed by the correlation coefficient of muscle synergy, but it only provides information on the similarity of muscle synergy changes between R–L lower extremities, not explicit symmetry. Another weakness of R–L symmetry evaluation using only muscle synergy is that the number of synergies must be the same in the R–L lower limb as a condition for comparison, and the results of muscle synergy analysis vary depending on the number and types of muscles being investigated [32].
The R–L vector line proposed in this study will clearly demonstrate the symmetry of STS R–L lower limb movements when the R–L vector line, which plots STS movements, approaches the symmetry reference line through rehabilitation of the patient. In addition, since the EAs of the thigh and lower leg are used, the problem of differences in the measurement target affecting the analysis results can be avoided. This makes the determination of the effectiveness of the rehabilitation of R–L symmetry reliable and easy to perform.
The , which excludes the positive and negative signs of the and calculates the magnitude of the error between the symmetric reference line and the R–L vector line as a numerical value, is the mean error value obtained by dividing this value by the measurement time of each participant. Previous studies have reported that hemiplegia and pain reorganize the cooperative structure of muscles differently from the healthy side [14,33,34]. The R–L asymmetry of the lower limb movement pattern during the STS motion in the rehabilitation patient group could be quantified by values. In the present study, the number of participants in both groups was small (four in each) and there was no significant difference in the statistical test for the . Therefore, we can only mention the possibility that the is an indicator that can determine asymmetry. If the sample size is too small, the power of the test is estimated to be small [35]. In a previous study on the comparison of peak muscle synergy values, 21 participants, 12 with mild stroke sequelae and 7 with severe stroke sequelae, were compared [21]. A study examining the accuracy of the perception of the asymmetry of lower limb weight bearing during standing movements compared 19 stroke survivors and 15 healthy participants [36]. In contrast to these previous studies, our study had a short duration, which did not allow us to have a large number of participants, particularly rehabilitation patients. By increasing the duration of the study and obtaining the cooperation of several medical institutions, we could increase the number of rehabilitation patients. If we could increase the number of participants, it would be possible to study more clearly the magnitude of the error between healthy participants and rehabilitation patients and to calculate a cutoff value. If we could calculate a cutoff value for the , we would have an R–L vector line that would make it easier to visually determine the effectiveness of rehabilitation and treatment, aiding the staff working in clinical settings.
A limitation of this study is the large age difference between healthy participants and rehabilitation patients. The typical rehabilitation patient admitted to a medical facility is an elderly person. To determine the effectiveness of rehabilitation, it is desirable to compare the STS performance of patients and healthy participants of a similar age. However, since it cannot be said that elderly patients who are considered healthy do not experience musculoskeletal or cardiovascular diseases, close attention must be paid to the definition of STS performance as a normal model. In addition, because this study evaluated R–L lower extremity coordination during the STS motion based on EAs, the theory was limited to a kinematic perspective. If we could compare the muscle synergies of the same participants during the STS motion, errors between the neurological assessment and the kinematic assessment obtained from the results of this study could be identified.
5. Conclusions
In this study, we proposed a method for evaluating the improvement in the R–L synergy of the impaired lower limb during the STS movement, i.e., the measurement of the EA and the measurement of the R–L vector line, which is a secondary type of information obtained from the EA. The information obtained from the EAs of multiple body segments of the R–L lower limbs is complex, with many variables, making it difficult to evaluate coordination. In contrast, the R–L vector line can be represented by a single line in two-dimensional coordinates, and the and the facilitate comparison with a symmetrical reference line by a numerical representation. This means that the R–L vector line utilizes the kinematic synergy of the R–L lower limbs and can visually represent the difference in the kinematic coordination of the R–L lower limbs. The conventional assessment of R–L differences using muscle synergy consisting of multiple muscles can be depicted with fewer variables.
Because of the small number of participants in this study and the fact that the did not yield useful conclusions from the statistical tests, we were unable to quantitatively determine the presence or absence of R–L differences using the cutoff values. In the future, we hope to calculate the cutoff value of the by increasing the number of participants and establish this method as a symmetry evaluation method. Furthermore, we would like to apply this method to the PLG, which can be expressed in two degrees of freedom, to verify whether this method can be applied not only to STS but also to the symmetry evaluation of the gait cycle of the R–L lower limbs in the gait.
Author Contributions
K.N., conceptualization and writing of the original draft; N.S., discussion of the original draft, review, and editing. All authors have read and agreed to the published version of the manuscript.
Funding
This research was partially funded by Kwansei Gakuin University.
Institutional Review Board Statement
Not applicable.
Informed Consent Statement
Not applicable.
Data Availability Statement
Not applicable.
Conflicts of Interest
The authors declare no conflict of interest.
References
- Susan, S. The long-term impact of wheelchair delivery on the lives of people with disabilities in three countries of the world. Afr. J. Disabil. 2017, 6, a344. [Google Scholar] [CrossRef]
- Sui, F.H.; Avril, T.; Tricia, M.; Julie, M.; Andrew, K. Automated Movement Feedback for Recovering Independence in the Sit-to-Stand Movement in an Older Population: A Pilot Randomised. OBM Geriatr. 2019, 3, 1904089. [Google Scholar] [CrossRef]
- Janet, A.K.; Tiffany, N.H.; Josh, T.; Jeff, R.H. Weight-Bearing Asymmetry in Individuals PostHip Fracture During the Sit to Stand Task. Clin. Biomech. 2015, 30, 14–21. [Google Scholar]
- Bivalkar, A.; Varadharajulu, G. Establishment and Analysis of Ideal Lifting Technique Based on Kinesiological Principles for Outpatient Stroke Patients: An Experimental Study. Int. J. Curr. Res. Rev. 2020, 12, 14–18. [Google Scholar]
- Cheng, P.-T.; Liaw, M.-Y.; Wong, M.-K.; Tang, F.-T.; Lee, M.-Y.; Lin, P.-S. The sit-to-stand movement in stroke patients and its correlation with falling. Arch. Phys. Med. Rehabil. 1998, 79, 1043–1046. [Google Scholar] [CrossRef]
- Pai, Y.-C.; Rogers, M.W.; Hedman, L.D.; Hanke, T.A. Alterations in Weight-Transfer Capabilities in Adults With Hemiparesis. Phys. Ther. 1994, 74, 647–657. [Google Scholar] [CrossRef]
- Ryan, L.M.; Lynn, S.-M. Altered loading during walking and sit-to-stand is affected by quadriceps weakness after total knee arthroplasty. J. Orthop. Res. 2005, 23, 1083–1090. [Google Scholar] [CrossRef]
- Ryoichiro, S.; Hiroaki, K.; Yoshiyuki, S. Development of sit-to-stand and stand-to-sit training system for hemiplegie patients. In Proceedings of the 38th Annual International Conference of the IEEE Engineering in Medicine and Biology Society (EMBC), Orlando, FL, USA, 16–20 August 2016. [Google Scholar]
- Wendy, G.; Jack, C.; Richard, S. Rising to stand from a chair: Symmetry, and frontal and transverse plane kinematics and kinetics. Gait Posture 2008, 27, 8–15. [Google Scholar]
- Helga, H.; Maria, T.; Elisabeth, O. Coordinated Ground Forces Exerted by Buttocks and Feet are Adequately Programmed for Weight Transfer During Sit-to-Stand. J. Neurophysiol. 1999, 82, 3021–3029. [Google Scholar]
- Michalina, B.; Ida, W.; Andrzej, W. A new method of determination of phases and symmetry in stand-to-sit-to-stand movement. Int. J. Occup. Med. Environ. Health 2014, 27, 660–671. [Google Scholar]
- Cabinet Office. White Paper on Aging Society. 2018. Available online: https://www8.cao.go.jp/kourei/whitepaper/w-2021/zenbun/03pdf_index.html (accessed on 5 September 2021).
- Yosra, C.; Maryam, H.; Michael, B.; Nicolas, T. Muscle coordination during robotic assisted walking using Lokomat. Comput. Methods Biomech. Biomed. Eng. 2020, 22, S216–S218. [Google Scholar]
- Ningjia, Y.; Qi, A.; Hiroki, K.; Hiroshi, Y.; Yusuke, T.; Kouji, T.; Kinomoto, M.; Yamasaki, H.; Itkonen, M.; Shibata-Alnajjar, M.; et al. Temporal Features of Muscle Synergies in Sit-to-Stand Motion Reflect the Motor Impairment of Post-Stroke Patients. IEEE Trans. Neural Syst. Rehabil. Eng. 2019, 27, 2118–2127. [Google Scholar]
- Lacquaniti, F.; Grasso, R.; Zago, M. Motor Patterns in Walking. Physiology 1999, 14, 168–174. [Google Scholar] [CrossRef] [PubMed]
- Francesco, L.; Yury, I.; Mattia, Z. Kinematic control of walking. Arch. Ital. Biol. 2002, 140, 263–272. [Google Scholar]
- Gianluca, U.S.; Philippe, S.A.; Joyce, F. The Effects of a Virtual Environment and Robot-Generated Haptic Forces on the Coordination of the Lower Limb During Gait in Chronic Stroke Using Planar and 3D Phase Diagrams. In Proceedings of the International Conference on Virtual Rehabilitation (ICVR), Tel Aviv, Israel, 21–24 July 2019. [Google Scholar]
- Plug-in-Gait Maker Placement. Available online: http://www.idmil.org/mocap/Plug-in-Gait+Marker+Placement.pdf (accessed on 14 August 2022).
- Talos, V.L.; Grishin, A.A.; Solopova, I.A.; Oslanyan, T.L.; Blenky, V.E.; Ivanenko, Y.P. Asymmetric leg loading during sit-to-stand, walking and quiet standing in patients after unilateral total hip replacement surgery. Clin. Biomech. 2008, 23, 424–433. [Google Scholar] [CrossRef]
- Cyril, D.; Sylvia, N.; Julie, L. Lateral Trunk Displacement and Stability During Sit-to-Stand Transfer in Relation to Foot Placement in Patients With Hemiparesis. Neurorehabilit. Neural Repair 2008, 22, 715–722. [Google Scholar]
- Kogami, H.; An, Q.; Yang, N.; Wang, R.; Yoshida, K.; Hamada, H.; Yamakawa, H.; Tamura, Y.; Shimoda, S.; Yamasaki, H.; et al. Analysis of muscle synergy and kinematics in sit-to-stand motion of hemiplegic patients in subacute period. Adv. Robot. 2021, 35, 867–877. [Google Scholar] [CrossRef]
- Jinsook, R.; William, Z.R.; Eric, J.P.; Seng, B.Y.; Randall, F.B. Alterations in upper limb muscle synergy structure in chronic stroke survivors. J. Neurophysiol. 2013, 109, 768–781. [Google Scholar]
- van Criekinge, T.; Vermeulen, J.; Wagemans, K.; Schröder, J.; Embrechts, E.; Truijen, S.; Hallemans, A.; Saeys, W. Lower limb muscle synergies during walking after stroke: A systematic review. Disabil. Rehabil. 2020, 42, 2836–2845. [Google Scholar] [CrossRef]
- Damholt, V.; Termansen, N.B. Asymmetry of Plantar Flexion Strength in the Foot. Acta Orthop. Scand. 1977, 49, 215–219. [Google Scholar] [CrossRef]
- Yoshihiro, K.; Shin, M.; Shinichi, T. Comparision of Foot Gripping Strength and Quadriceps Femoris Muscle Strength of the Dominat Foot and Non-Dominant Foot. Phys. Ther. 2007, 22, 365–368. [Google Scholar]
- Tomote, Y.; Fuyuko, I.; Yoshihiro, I.; Tositaka, T.; Masahiko, Y.; Mitsuya, S. The dominant foot affects the postural control mechanism: Examination by body tracking test. Acta Oto-Laryngol. 2014, 134, 1146–1150. [Google Scholar]
- Jason, C.G.; Catherine, A.S. The effects of symmetric and asymmetric foot placements on sit-to-stand joint moments. Gait Posture 2012, 35, 78–82. [Google Scholar]
- Ningjia, Y.; Qi, A.; Hiroshi, Y.; Yusuke, T.; Atsushi, Y.; Hajime, A. Muscle synergy structure using different strategies in human standing-up motion. Adv. Robot. 2017, 31, 40–54. [Google Scholar]
- Qi, A.; Hiroshi, Y.; Atsushi, Y.; Hajime, A. Different Temporal Structure of Muscle Synergy Between Sit-to-Walk and Sit-to-Stand Motions in Human Standing Leg. In Converging Clinical and Engineering Research on Neurorehabilitation II; Springer: Cham, Switzerland, 2016; pp. 933–937. [Google Scholar]
- Takahiro, U.; Kouji, T.; Takuya, Z.; Eiji, S.; Kazuhiko, H. Kinetic and Electromyographic Analysesof Sit-to-StandMotion in Patients with Proximal Femoral Fracture: Comparison of Patients with Pain and without Pain. Phys. Ther. 2015, 42, 228–236. [Google Scholar]
- Chun, K.T.; Hideki, K.; Hiroki, W.; Aiki, M.; Masashi, Y.; Yoshiyuki, S.; Kenji, S. Lateral Symmetry of Synergies in Lower Limb Muscles of Acute Post-stroke Patients After Robotic Intervention. Front. Neurosci. 2018, 12, 276. [Google Scholar] [CrossRef]
- Katherine, M.S.; Matthew, C.T.; Eric, J.P. The number and choice of muscles impact the results of muscle synergy analyses. Front. Comput. Neurosci. 2013, 7, 105. [Google Scholar] [CrossRef]
- Silvia, M.; Deborah, F.; Dario, F. Reorganization of muscle synergies during multidirectional reaching in the horizontal plane with experimental muscle pain. Neurophysiology 2014, 111, 1615–1630. [Google Scholar]
- Michael, R.P.; Peter, M.T.; Victoria, G. Women with fibromyalgia walk with an altered muscle synergy. Gait Posture 2005, 22, 210–218. [Google Scholar]
- Takamitsu, H. Sample size determination given data of preliminary experiment for Student’s t-test, ANOVA and Tukey’s multiple comparison. Jpn. J. Psychol. 2004, 75, 213–219. (In Japanese) [Google Scholar]
- Anabèle, B.; Séléna, L.; Denis, G.; Sylvie, N. Perception of Weight-Bearing Distribution During Sit-to-Stand Tasks in Hemiparetic and Healthy Individuals. Stroke 2010, 41, 1704–1708. [Google Scholar]
Publisher’s Note: MDPI stays neutral with regard to jurisdictional claims in published maps and institutional affiliations. |
© 2022 by the authors. Licensee MDPI, Basel, Switzerland. This article is an open access article distributed under the terms and conditions of the Creative Commons Attribution (CC BY) license (https://creativecommons.org/licenses/by/4.0/).