Article

The Design and Implementation of an IoT Sensor-Based Indoor Air Quality Monitoring System Using Off-the-Shelf Devices

School of Engineering, STEM College, RMIT University, Bundoora, VIC 3083, Australia
*
Author to whom correspondence should be addressed.
Appl. Sci. 2022, 12(19), 9450; https://doi.org/10.3390/app12199450
Submission received: 1 August 2022 / Revised: 2 September 2022 / Accepted: 16 September 2022 / Published: 21 September 2022
(This article belongs to the Special Issue Indoor Air Quality Monitoring and Assessment)

Abstract

:

Featured Application

A generic Internet of Things (IoT) framework presented in this paper offers users a guide to the efficient use of commercially available software and hardware to monitor indoor air quality (IAQ). Findings from this study offer important insights for sensor selection, data integration, and other considerations when using the framework as a guide.

Abstract

IAQ monitoring studies have gained renewed interest post COVID-19. Furthermore, accessibility to the corresponding enabling technologies has improved considerably in terms of cost and requisite knowledge. This paper aims to outline the key decisions involved for researchers and building managers alike to seek to implement their own environmental monitoring study using commercially available hardware and software. To do so, this paper first outlines the essential elements or building blocks of an IoT architecture, detailing the design criteria for selecting various hardware and software. Secondly, it outlines the process of integrating these different components and the flow of data from IoT device to databases and end-user applications. To demonstrate this process, an IAQ monitoring study was conducted at an open-plan office. Our results demonstrated the framework can be adapted to different worksites with minor modifications and provide the flexibility to interchange components. The data collected can be easily integrated into open-source analytic software for visualization and to make informed decisions to manage IAQ. It is through this process that we provide recommendations on how other users may adopt similar frameworks.

1. Introduction

Indoor air quality (IAQ) has received much attention in recent years in scientific, environmental, and political spheres. This interest seems especially pertinent with the recent SARS-COV-2 pandemic. Studies have demonstrated links between the building, the indoor environment, and detrimental effects on human health [1]. Further studies have reinforced these links and found correlations between productivity and thermal comfort [2]. Considering this, the importance of monitoring areas with high levels of human occupancy and activity cannot be understated. The Environmental Protection Agency [3] defines IAQ as the air quality within and around buildings and structures, especially as it relates to the health and comfort of its occupants.
Existing studies have measured a range of IAQ parameters, which included but were not limited to, the particulate matter (PM), volatile organic compounds (VOCs), and carbon dioxide (CO2). PM refers to solid and liquid particles found in the air such as soil and dust particles [4]. They can be sub-classified by the particle size as follows: (a) PM10—‘coarse’, (b) PM2.5—‘fine’, and (c) PM0.1—‘ultra-fine’ [5]. The concern with PM particles is that they can be inhaled resulting in adverse health effects in the lungs and heart [6]. The source of PM can be found both indoors and outdoors, and at the same time, outdoor PM can infiltrate the indoor environment [7], and vice versa.
VOCs are carbon-based gaseous emissions of varying chemical pollutants generated from certain activities such as the application of paints, aerosol sprays, and pesticides [8]. The source of these pollutants can range from indoor activities such as cooking, infiltration from outdoors, to emissions from building materials [9]. As the term VOCs generally describes a mixture of carbon compounds, they are common and practical to measure Total Volatile Organic Compounds (TVOCs) rather than measuring specific compounds. Currently, there are no regulatory guidelines for an acceptable level of TVOCs in non-industrial settings [8,10]. However, TVOCs can result in many adverse health effects ranging from eye, nose, and throat irritation to organ damage in the liver, kidney, and central nervous system [8,11]. Furthermore, TVOCs are considered to be a major contributor to sick building syndrome [12].
CO2 is a colorless and odorless gas, primarily emitted through human activities such as transportation [13], and indoors that are mainly via occupant respirations [12]. A high level of CO2 has also been associated with sick building syndrome and building-related illnesses [14].
Nitrogen dioxide (NO2) is a highly reactive gas that is primarily generated through the burning of combustion sources, such as the burning of fuel [15]. It is known to cause respiratory symptoms and airway inflammation such that groups such as asthmatics, children, and the elderly are at higher risk [12].
Sulfur dioxide (SO2), similar to NO2, is primarily generated through combustion processes of fossil fuels [16]. Exposure to SO2 can lead to respiratory symptoms, particularly in vulnerable groups such as asthmatics and children [12].
In addition to the many IAQ parameters mentioned above, there are other common IAQ parameters that have been researched, but are beyond the scope of this paper, such as nitrogen oxide (NO), carbon monoxide (CO), and so forth. A short list of some recent IAQ studies with their relevant objective and main results have been summarized in Table 1.
In recent years, advances in Internet of Thing (IoT) technology have created the support for various IAQ monitoring studies with differing goals and objectives. Additionally, the barrier to purchase and adopt these technologies has gradually lowered to the point where virtually any entity may purchase a set of sensors off the shelf, install them in the desired location, and connect them with the chosen data management platform. Previous IAQ studies with a focus on Internet of Things (IoT) technology development are summarized in Table 2.
A number of studies have been enabled through such IoT technology in school settings. Bennet et al. [7], through the implementation of indoor and outdoor sensors, conducted a study on monitoring PM levels at a New Zealand primary school. The result was used to identify the potential sources of PM and their impact on and contribution to fluctuation levels identified in the data collected. The data showed significantly higher PM levels (both PM2.5 and PM10) when school children were present. As expected, average CO2 concentrations were also higher when school children were present. Regarding NO2, measured levels were higher on weekdays than weekends. Furthermore, these levels began to rise at 6 am and peaked at 1 pm before gradually decreasing.
Majd et al. [17] monitored both indoor and outdoor PM, NO2, CO, CO2, temperature, and relative humidity levels of 16 schools using a sensing system. Furthermore, they conducted a pre-study evaluation of the sites to record extrinsic (i.e., types of nearby roads) and intrinsic factors (i.e., building types and their heating, ventilation, and air conditioning (HVAC) systems), which were later used as explanatory variables for the monitored data. Nkosi et al. [18] conducted a study of PM10 and SO2 at schools in South Africa located 1–2 km and 5 km+ from a mine. Additional sensors were carried by participants to measure the local area of respirable dust. Their study primarily focused on the health of the participants. They found that the mean concentrations of PM10, SO2, and respirable dust were significantly higher in schools that were closer to mines. Accessible off-the-self IoT devices and systems are the key enablers for a wide range of users to conduct continuous data monitoring and analyses at a low cost.
IAQ monitoring studies are not limited to school settings. Similar studies were conducted for office buildings. Irga and Torpy [19] conducted a monitoring study in 11 buildings in Sydney, Australia. These buildings varied in their ventilation types, being either natural, mechanical, or mixed. The purpose of their study was to compare the different ventilation types through comparisons of the corresponding IAQ parameters. These parameters included PM10, PM2.5, TVOCs, CO2, and CO which were measured through a combination of high-end professional-grade sensors. These sensors and the IAQ monitoring framework enabled the researchers to conclude that the ventilation types had significant impacts on the air pollutant data. However, the authors did not provide a replicable methodology to implement and verify their IAQ monitoring study. There is a clear lack of detail regarding the sensor selection, implementation of the IoT framework, and a central hub to aggregate the data.
An office air quality study by Montgomery et al. [20] used the measurements of IAQ sensors to compare natural and mechanical ventilation systems in terms of governing standards. The parameters monitored were CO2, TVOCs, and PM. On the one hand, they found that mechanical ventilation was effective in controlling CO2 and TVOC levels, regardless of occupancy levels. On the other hand, natural ventilation was associated with increased CO2 and TVOC levels as occupancy levels increased. With regards to PM, the indoor-to-outdoor ratio of PM was found to be higher for natural ventilation than the mechanical one.
The above studies provide information on which sensors were used as well as the calibration methods in some cases. However, given that the focus of their respective studies, whether it be on identifying sources of IAQ parameters or using these parameters to evaluate HVAC systems, little detail information was provided to readers to replicate or verify the results. Such detailed information includes the methods of data communication between sensors and the database; the visualization of collected data; or the criteria by which sensors are selected.
Apart from designing and evaluating IoT communication modules for IAQ monitoring applications, Al-Okby et al. [21] provided an in-depth investigation on the performance of gas sensors in detecting different TVOCs in the air. While their work provided insights on the characteristics of two gas sensors in the market, details on the calculation of the proprietary VOC index were not provided, which makes it hard to apply the findings in real-life applications. Ceccarini et al. [22] also proposed an IoT-based platform for monitoring human and plants’ health in a home gardening system. The adoption of an open-source database system, i.e., MySQL, allowed them to have full control and ownership of their data. However, MySQL is not an optimal solution for storing and processing real time-series data for IAQ monitoring applications. Similar to the study in [21], Ceccarini et al. [22] gave attention to the HVAC conditions of the worksite rather than the implementation of the IAQ monitoring system. A list of sensors was provided with their respective sampling intervals and sensor accuracy. However, readers seeking to replicate such a study without the requisite knowledge may face tough challenges. It would be even more challenging for readers to adapt the methodology to their individual requirements.
While the above studies have demonstrated use cases for indoor environment studies using consumer-grade sensors with minimal modifications, there are several IAQ studies that implemented IoT technology with a high degree of customization, which often integrated various parts such as a single-board computer and sensors to form a sensing system. These customization approaches intended to achieve similar results to those that are based on consumer-grade sensors and included research into battery and energy management. For instance, Zhao et al. [30] proposed a multi-sensor multi-communication design for applications with accessible power outlets. Due to the accessibility to power outlets, they could incorporate four sensors and four communication modules in their designed system and achieved a relatively high sampling rate of 6 sample/min. However, their solution was considered over-designed for indoor IAQ monitoring purposes, as well as logistically challenging to deploy sensors at specific areas of interest for IAQ studies that has limited accessible power outlets. To address the constraint of power outlet issues, Permana and Kuncoro [26] recently attempted to create a compact battery-powered wireless sensor for monitoring only temperature and humidity. In their work, an Arduino-based architecture was powered by a 300 mAh Li-ion battery. This allowed a continuous monitoring period of 12 h at 1 sample/min. While the design by Permana and Kuncoro was compact and cost effective, their 12-h monitoring periods were far too short for IAQ monitoring applications, which normally last for days to weeks in order to capture meaningful periodic patterns. The parameters (i.e., temperature and humidity only) collected were also inadequate for evaluating the air flow and ventilation rate of an indoor environment. Kadir et al. [24] adopted a similar approach as the authors of [26], but utilised multiple sensors to capture multiple IAQ parameters. Sensors’ battery lifetime was once again the focus. With a sampling rate of 0.1 sample/min, their devices could only last for 3+ days. By reducing the sampling rate to 1 sample/hour, their devices could last for roughly 1.5 weeks. However, such a low sampling rate was not sufficient for capturing transient data fluctuations that are critical for air flow/ventilation studies.
Palco et al. [25] proposed an intelligent IAQ monitoring and control system by integrating ventilation control in their design. However, their framework was based on a commercial software, LabView, which could prevent it from being widely adopted. Furthermore, technical details on sensors and communication standards were not provided to guide other users. In an earlier study, Hapsari et al. [23] adopted the Message Queuing Telemetry Transport (MQTT) protocol, which made their system scalable. In their proposed system, discrete components and sensors were integrated to collect data at a sampling rate of 0.2 sample/min. Their customised sensing devices required rigorous calibration processes, which could once again be challenging for end-users with little to no knowledge of sensor calibrations. In contrast, systems based on off-the-shelf sensors would be more user-friendly as the sensors have been pre-calibrated by manufacturers. Nevertheless, no solution for data visualisation was provided in [23].
Among the aforementioned IAQ studies, the majority of the works focused on either (a) the IAQ pollutants, their sources, and correlations to health issues or (b) the technologies required to develop the IAQ monitoring system. In the latter cases, while they contributed to the study of IAQ monitoring, the knowledge and findings could be too technical to be adopted by the public. It should be noted that such custom-built devices were tailor-made for specific applications, which makes them difficult to adapt or deploy in scenarios that deviate from their intended settings. A slight variation in design criteria, such as a longer operating duration, a different data sampling rate, or a different set of IAQ parameters, would require a completely new design. Furthermore, the database systems adopted by such studies, while capable, are evidently not optimal for time-series data.
One common observation from recent studies that utilized IoT technology is the difficulty in replicating them. From the perspective of one who seeks to implement an IAQ monitoring study in their own workplace, sufficient guidelines or instructions have not been established in detail. Furthermore, an IAQ monitoring framework to meet the requirements of a specific workspace have not been generalized yet. The complexity of the system integration task increases tremendously when incorporating wireless sensors with different communication protocols, power requirements, measuring parameters, and other factors. All these barriers have prevented small and medium sized enterprises from adopting sensor-based IAQ systems to monitor and improve the air quality and safety of their workspaces.
Motivated by the surging need for COVID-safe protocols and mitigation strategies to eliminate hidden chains of infection in the workspace, this paper aims to formulate a framework and implementation strategy of a generic IoT system architecture for the real-time monitoring and processing of ambient parameters. As such, this paper seeks to demonstrate a generic methodology for implementing an IAQ monitoring framework using commercially available off-the-shelf (COTS) sensors and address a broad spectrum of attributes relevant to the sensing framework that an end-user may face. This will be addressed through the following research questions:
  • RQ1: What are the essential elements, design criteria and IoT architecture framework to implement an IAQ monitoring system?
  • RQ2: What are the strategies that integrate the essential elements and IoT architecture for continuous data capture and storage?
In order to address the research questions, an indoor environment monitoring scenario was conducted in an open plan workspace. Environmental and climate data were collected, stored, and visualized on a dashboard for management to view. Furthermore, the data collected within the workspace will be used to determine COVID-19 transmissibility. The collected data will form inputs and boundary conditions to determine aerosol transmission and COVID-19 risk investigations, which are not within the scope of this paper.

2. Materials and Methods

It is not the intention of this paper to address all parameters that have negative impacts to IAQ and health; instead, the focus of this study is primarily on providing a reference framework that users can adopt and undertake further customization based on their special needs. The proposed framework comprises sensors that measure parameters of IAQ in an open plan office. The framework also aims to provide general design and implementation strategies that can be used by all the stakeholders. These might include system integrators, electricians, data analysts, and infectious diseases experts.

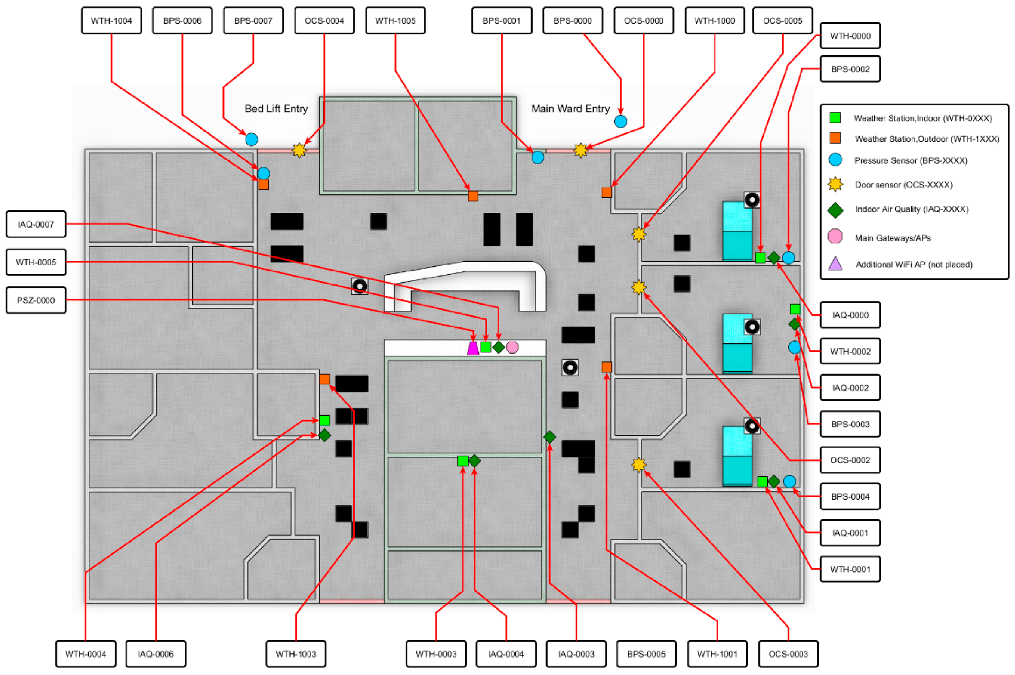
2.1. Experimental Scenario

For this study, based on the discussion in Section 1, we selected some commonly measured air quality parameters, namely PM2.5, PM10, CO2, and TVOCs as the focus. Parameters related to occupant comfort were selected, namely, temperature, relative humidity, and noise. Door sensors and pressure sensors will be placed at doorways and entrances into larger rooms to provide data for further studies related to human occupancy levels and airflow. Additionally, noise and CO2 will be monitored at workstations for studies relating to occupancy levels at those locations.
The framework can be extended to cover other IAQ and health-related parameters by incorporating the corresponding sensors and data.

2.2. Monitoring System Design

We present a unified architecture for implementing IAQ monitoring systems. The architecture utilized existing COTS wireless IoT sensors to produce an integrated sensing system with a variety of sensed parameters. The proposed architecture is intended to demonstrate the use of low-code tools and the integration of straightforward systems to implement an end-to-end system, which starts from concept to deployment in much shorter timeframes than if a custom system was developed. We present the design of this unified architecture from the theoretical and technological perspectives in the form of a methodology, which includes the choice of hardware and software, and system integration. Then, we put the methodology into practice for monitoring IAQ sensor deployments in the selected open plan office.

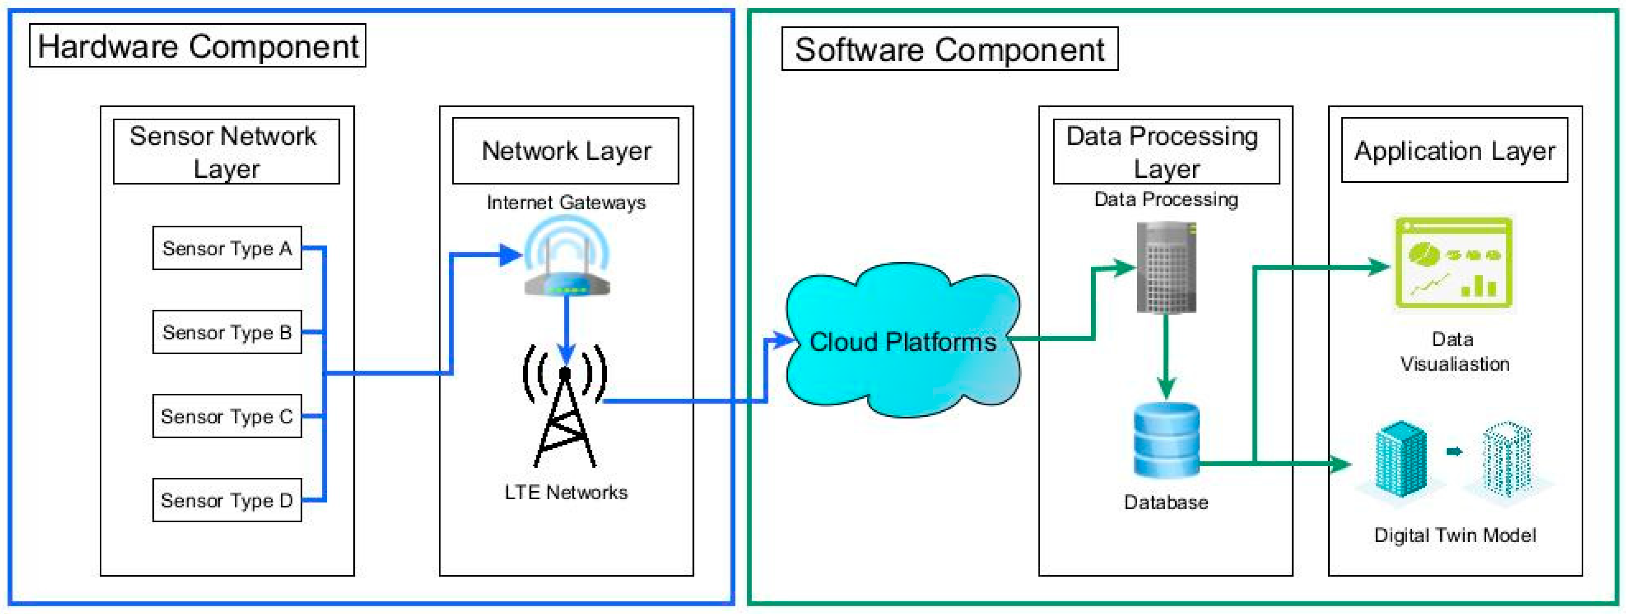
2.2.1. System Hardware and Software Architecture

The proposed IAQ monitoring system architecture is comprised of two major components as shown in Figure 1. The hardware component consists of the IoT sensors, network devices, and connectivity equipment. The software component encompasses a range of device specific IoT cloud platforms, unified data management services, and the end-user applications that provide data visualization or dashboarding.
A key aspect of this proposed architecture is the use of multiple sensor devices that communicate directly to independent IoT cloud platforms. The IoT cloud platforms often require little to no configuration. They handle the sensor devices to cloud communication and serve as an intermediary data store or relay service point. It is also a feature of such platforms that an Application Programming Interface (API)—a software intermediary that allows two applications to talk to each other—is provided for users to programmatically interact with their devices or data without using the platform’s graphical interface directly. With APIs, users can query data from IoT devices in a near-real time manner and aggregate the data from multiple platforms into a single, unified location. This can be achieved through low-code and open-source solutions such as Node-RED for performing data query or ingest and InfluxDB for time-series data storage. Alternative services can also be implemented using Amazon Web Services or Azure IoT services that adopt an optional subscription-based models.

2.2.2. Sensor and Device Selection

The choice of sensor devices and products to integrate into the sensing system were based on application and user requirements. These requirements help to guide the selection of appropriate devices to collect data at the desired rate and operate effectively in the deployed environments. The sensors selection criteria for this specific study were:
  • Commercial or consumer grade: The sensors should be purchasable by end-users without considerable modifications for purpose. Development boards, such as Arduino, ESP32, and Raspberry Pi-based alternatives were, therefore, ruled out;
  • Avoid vendor lock-in issues: Vendor lock-in refers to situations where the cost of switching is at such a steep cost that the customer is ‘locked-in’ with the vendor. This is a situation that should be avoided where possible;
  • Availability: Due to the global chip shortage and supply-chain issues, in this project, whenever a sensor model is unavailable or with an extended shipping timeframe, the next feasible option will be selected.
The selection criteria for indoor environment monitoring studies were:
  • Data acquisition in near real-time: Ability to monitor the environment in near real-time (a delay of 1–10 min) grants organisations greater insight into their workplace. Furthermore, it enhances the organisations’ ability to adjust on the fly. This can also prolong the battery lifetime of the devices as fewer data transmissions are needed;
  • Parameters: The key parameters to be measured to achieve the study’s purpose, which include temperature, humidity, pressure, noise, TVOCs, PM2.5, PM10, CO2, and the open and close status of doors;
  • Connectivity: Wireless communication between device and gateway should conform to Australian Industry Scientific and Medical (ISM) Band requirements to avoid interference with other electrical and electronic devices operating nearby. These radio bands are typically grouped around 433 MHz and 920 MHz, with the 920 MHz range varying between 915 and 928 MHz. Another typical band is 2.4 GHz which is commonly used for consumer Wi-Fi and Bluetooth. Such a design also makes the framework more accessible for the public as no special operating licence is needed;
  • Operation requirements: Each sensing device manufacturer should operate under open standards and/or with API capability for exporting and streaming the data to an external database;
  • Physical properties: The form factor of the sensor should be with equivalent footprint as ordinary smoke detectors or HVAC panels to avoid interference and disturbance with day-to-day activities at the monitoring site. Battery-powered devices are highly preferred as they provide the system with extra flexibility in the deployment process. All devices should have wireless networking capability to avoid extra networking wiring cost.

2.2.3. Data Integration System and Management System

The final key aspect of the implemented IAQ monitoring system was the integration and data management system. This portion of our system unified the system architecture and brought together the sensor data from heterogenous cloud platforms and stored them in a time-series format. In this section, we detail the technical design and implementation of the data management service aspect of the IAQ monitoring systems. We begin by, firstly, contextualizing it as a software block in terms of its system architecture. We then describe the abstract behavior of this system as it operated on the different sources of sensor data. Lastly, we provide technical details about the implementations of each step in the flow of data through the data management services.
From the system architecture in Figure 1, we extracted the data processing layer block and further defined the internal components which can be seen in Figure 2. These data management services were made from two key platforms: Node-RED for data integration from other cloud-based IoT platforms, and InfluxDB for implicit schema time-series data storage.
There are four major processing blocks that handle the data ingest operations, manipulation/sanitation, decoding, and storage in the time-series database using Node-RED.
We outline the different types of data ingest processes that allow integration with different IoT cloud platforms. These integrations utilize either the (i) Hypertext Transfer Protocol (HTTP)—an application-layer protocol for transmitting hypermedia documents, (ii) Websocket—a computer communications protocol that allows full-duplex communication, or (iii) MQTT—a lightweight open messaging protocol to communicate and operate using periodic and event-based triggers. The procedure for data ingest for a typical IoT device is shown in Figure 3. It is a pipeline model that demonstrates the flow of data into and out of the ingest system from a range of IoT cloud platforms and into a data storage system. The proposed model is a trigger-based mechanism that supports both push and pull-type data retrieval mechanisms and allows for near-real time updates of sensor data. The trigger-based model enables the data integration system to accept connections from or to interact with any style of API or IoT messaging technology such as MQTT, HTTP, and WebSockets. For example, if Cloud Platform in Figure 1 publishes data from Sensor Type A to an MQTT topic on a vendor-managed MQTT broker, the data ingest system can then subscribe to this topic to receive messages into the pipeline shown in Figure 3. At the end of the ingest operation, data have been stored and can be utilized by the end-user applications such as visualization in a dashboard. A detailed description of raw data ingest, data sanitizing, decoding, and storage can be found in Appendix A.

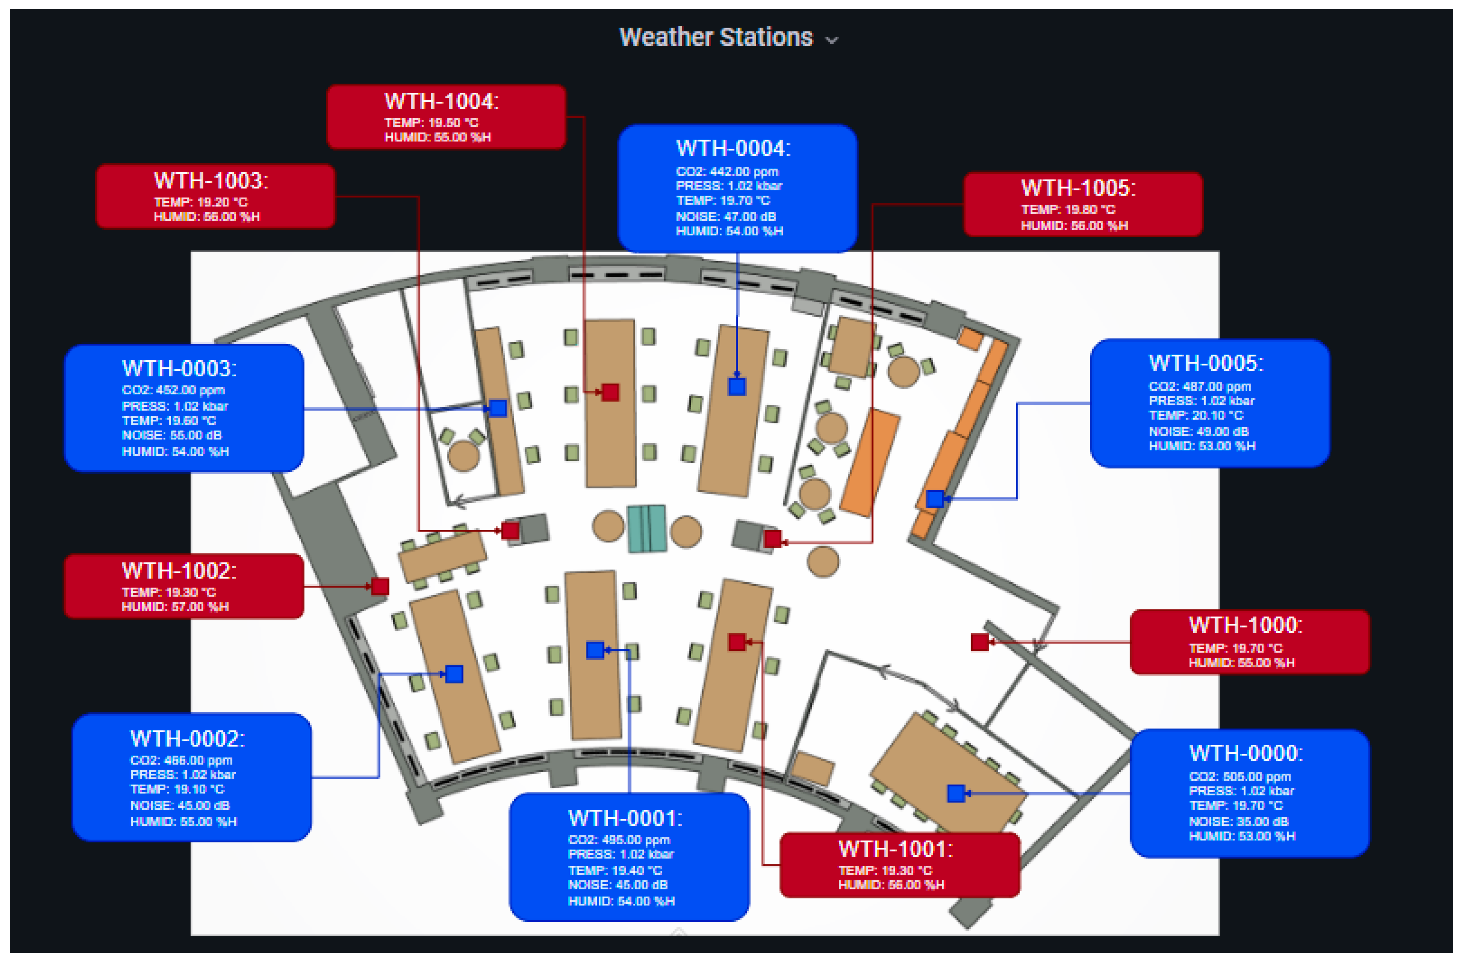
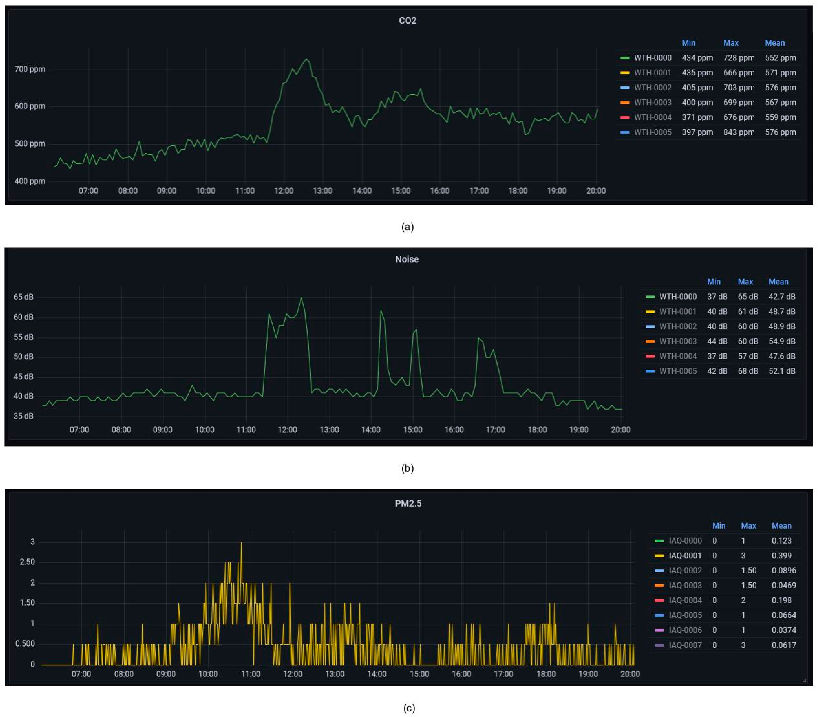
2.2.4. Data Visualization

At the phase where the data are stored in a unified database, they can then be used by the end-users. This may involve setting boundary conditions for COVID-19 transmission simulations, monitoring key parameters for hazardous conditions, or analyzing trends in the data.
For the purposes of this study, the data were presented on a dashboard with key values highlighted using Grafana—an open-source web application for data analytics and interactive visualization. The Grafana dashboard was connected to InfluxDB alongside user-made plug-ins to develop the panels containing the floorplans with sensors. The dashboard presents the data in three formats, firstly the floorplan format in which an image of the open plan office is overlayed with sensor locations. Each sensor displays the latest reading. Secondly, a graph of the time-series data shows the historical data for the selected time period for one parameter. Thirdly, a table format shows the time-series data of the Monnit ALTA open/close door sensors and SenseCap Barometric Pressure sensors. Since the door sensors are event-driven (i.e., when there is a change in state) the panel will show the date and time that the current state has changed from open to close and vice-versa.
A secondary and important purpose of the dashboard is to display the status and health of the sensors. This dashboard will display the current status of each gateway, essentially whether the gateway is operating. Each sensor will show the time since the last reading. Finally, for sensors that require battery the current battery life will be displayed.

3. Results

This section presents our implementation and use case for the proposed IAQ monitoring system, which followed the system framework outlined in Section 2. In this section we mainly present the results of the open plan office.

3.1. Essential Elements: Sensor Devices

A range of COTS devices were selected and purchased. Table 3 details the specific products and sensors, their sampling interval, communication technology, and power supply requirements.
The Netatmo Weather stations (indoor) were allocated to workstations or occupant work areas within the proposed study spaces, while the CloudGarden devices were for ambient air quality measurements throughout the remaining transient areas. The SenseCap pressure modules were used to measure pressure on either side of entry and exit doors. The Monnit ALTA door sensors were placed at key doorways (Figure 4). The final device type utilised in the monitoring system was the Netatmo outdoor weather station, which was an add-on device to the indoor modules that provided an additional temperature and humidity measurement capability originally intended for an outdoor placement.

3.2. IoT Framework: Hardware and Software Architecture

Following the selection of sensor devices, a suitable system hardware and software architecture were designed for the end-to-end data collection system. This end-to-end architecture, shown in Figure 5, describes all elements of the monitoring system including network access technologies and required access points or gateway devices, internet backhaul elements, device-specific cloud storage or management platforms, the unified data management system, and potential end-user applications.
Various gateways and access points were required to facilitate the connectivity of the chosen devices to the wider internet and relevant cloud platforms for the hardware architecture system. All WiFi-based devices were connected via industrial grade Telktonika RUT-240 4G access points. These provided WiFi networks that each sensor could independently connect to and backhaul communication to the Internet via a 4G cellular connection. As LoRaWAN devices communicate with a cloud-based network server, we used a Dragino LPS-8 LoRaWAN gateway and connected it via wired ethernet to a Teltonika 4G access point to create a link from the LoRaWAN gateway to the internet. The flow of data largely moved from the raw sensed parameters over a range of different network technologies before entering what can be considered cloud or internet-based software systems.
The software architecture of the implemented system consisted of three main components. These were the manufacturer/device-specific cloud platforms, the unified data management system, and any end-user applications that handle the manipulation or visualization of collected data.
In the IoT Cloud Platforms block of Figure 5, the manufacturer and/or device specific cloud platforms can be seen. The Things Network can be used to access the Dragino gateway and the SenseCap Barometric Pressure sensors. Netatmo Connect allows access to the Netatmo weather stations. Cloud Garden Sensorhub is used to access the Cloud Garden indoor air quality sensors. Finally, iMonnit is the platform to access the open/close door sensors.

3.3. Data Ingest Operations

Utilizing the pipeline model for data ingest in Figure 3, a sample of the Node-RED flow was developed as shown in Figure 6. The raw data ingest stage for the Netatmo weather stations was set up before the payload was sent to the payload sanitizing flow.
Following on from the raw data ingest stage, the payload sanitizing flow was connected as shown in Figure 7.
The final stage of the data ingest model is the decoding of the data before being stored in InfluxDB. This flow can be seen in Figure 8.
The above flows demonstrate the data ingest process for the Netatmo weather stations; however, similar flows were used for the other sensors.

3.4. Data Visualisation

The data collected during the monitoring period were integrated into a Grafana dashboard to display the key sensor readings. The dashboard was formatted in a manner that made it simple to identify the sensors, their readings, and locations relative to the worksite. A sample of the dashboard for the office site is presented in Figure 9.
The time-series data were presented in the form of a chart as shown in Figure 10. The location of the sensors was the large meeting room. It can be observed that during a meeting, noise levels rose as did CO2 levels. A time-series plot of PM2.5 was observed to fluctuate slightly over the same time-period.
Figure 11 displays a sample of one of the open/close door sensors in conjunction with adjacent barometric pressure sensors. The drop-down menu allows the user to switch between different door sensors to see historical data. The data collected from these sensors can be used for further studies on the correlations between doors opening/closing and airflow.
Grafana was not only used to display the data collected from the sensing devices, but it was also used to monitor the status of the gateways and devices. This included device battery life, whether the gateways were running, and time since last reading. Figure 12 displays samples of the panels in this dashboard such as when the IAQ sensors recorded their last readings and their current status.

4. Discussion

The hardware and software architecture framework and selected sensors and devices were used to implement an IAQ monitoring study in an open-plan office. IAQ studies can serve many purposes, ranging from simply measuring parameter values to correlating these values with health effects, and to testing and improving the technology associated with IAQ. This paper is intended to serve as a guideline from start to end for users to implement their own integrated sensing systems through the use of commercially available hardware and open-source software. As such, the following discussion of the research questions will provide insight to those planning to conduct an IAQ monitoring study.

4.1. The Essential Elements and IoT Architecture Framework to Implement an IAQ Monitoring Study

We first presented the proposed framework that provided guidance to the architectural levels for the integration of open-source IoT platforms, followed by the essential elements for deployment and implemented according to the requirements of specific application contexts.

4.1.1. Framework

The hardware and software architecture framework (see Section 2 and Figure 1) with the unified data management system that we presented could be adopted by any users. Using this framework, the essential elements of an IoT architecture could be identified, which included the sensing devices, the gateways for the devices to the wider network, their respective cloud platforms, the data management system, and end-user applications. Another key element was the communication protocol between each of these elements.

4.1.2. Sensors Selection

This study primarily focused on providing information to readers who are unfamiliar with IoT devices. As such, the list of criteria in Section 2 is intended to limit sensor selection to those devices that would be appropriate. In selecting devices that are either commercial or consumer grade, we demonstrated the capabilities of purchasable devices that require little to no modification and be ready for deployment at each worksite for IAQ monitoring purposes. It is then expected that other COTS devices may be added or interchanged to meet user requirements. This study attempted to circumnavigate issues of vendor lock-in through the purchase of sensors from differing manufacturers. As can be seen in Table 3, each sensor was sourced from a different manufacturer. The final criterion for this study was the availability of the device such that the device was available for the planned monitoring dates.
The second list of sensor selection was intended to assist potential adopters to ascertain whether a particular device is appropriate. To begin with, users must have knowledge of which IAQ parameters are to be monitored and understand the intention behind these choices. This is because sensing devices can monitor multiple parameters and therefore different combinations of devices will provide different utility.
There are further considerations beyond the IAQ parameters, which include the quality of data, and sensing accuracy and resolution that are determined by manufacturer, as well as the physical mechanisms of the sensing device. For example, consider the Monnit ALTA open/close sensors that are event-driven and operate via magnetic detection switch. These sensors have an operation range of ¾ inch between the magnets. They also generate a binary response to the activity of doors opening and closing, of which should be accurately captured and there is little room for error. In comparison, the Cloud Garden Climate Sensors take measurements every minute. They have a temperature accuracy of ±0.3 °C and tolerances that vary slightly over different temperature ranges. Each parameter has a different resolution, e.g., the particulate matter has a resolution of 1 µg/m3. For some system integrators such accuracy and resolution may or may not be deemed acceptable; however, for the purposes of our study, the accuracy and resolution were deemed sufficient.
During the deployment or implementation phase, the sampling rate of the sensor devices is one of the few parameters that can be adjusted on-the-fly. Sampling rate impacts the resolution of the data, which is governed by the frequency at which data are collected. While the accuracy and resolution of each reading are important, the frequency of these readings is important as well. For example, in any sensor that is capable of high accuracy measurements but at a low sampling rate, the data would not be representative for time-based monitoring studies. COTS devices often have a factory-configuration to sample data every 5 to 10 min. The factory configuration is often adjustable but not always to a significant degree. For our study, the sampling rates of the selected sensors varied from 1 min in the Cloud Garden sensors to 10 min in the SenseCap Barometric Pressure Sensors. The sampling rates of each sensor can be seen in Table 3. It is therefore recommended that the system integrator should investigate whether the considered sensing device is capable of meeting the data collection needs. It must be noted that there are trade-offs in relation to sampling rate. While it may seem beneficial to increase the sampling rate as much as possible for more data, it raises issues of data storage, costs, and battery life.
The users should then observe and evaluate the environmental characteristics. At a minimum, there should be knowledge of constraints at the site that would limit functionality of sensing devices. These constraints may be the size of the site, the day-to-day activities, and access to power outlets. For this study, battery-powered devices were preferred over outlet-powered supplies where possible. There were several scenarios where battery powered was a requirement, namely for the sensors placed at doorways and corridors as these tended to lack power outlets.
As outlined in the experimental scenario of Section 1, there were several parameters to be monitored for different purposes. Firstly, doorways were to be monitored to track human movement for a secondary study, specifically the opening and closing of doors. Furthermore, for doorways that lead to larger areas or corridors, the pressure differential needed to be captured to set up boundary conditions for Computational Fluid Dynamic simulations in the next study. Since the pressure difference indicated the direction of air flow, resolution was particularly important. For these areas the Monnit ALTA open/close sensors and SenseCap Barometric Pressure sensors were selected. Both are battery powered, operating within ISM band ranges. Additionally, the SenseCap Barometric Pressure Sensors were purported to have a resolution of 1 Pa, which was one of the lowest available.
Secondly, CO2 and noise levels at workstations were captured. The weather stations were effective in this regard as they also captured temperature, pressure, and relative humidity which are parameters related to occupant comfort. The third and final aspect of this study was to monitor the IAQ parameters commonly measured. These were PM2.5, PM10, CO2, and TVOCs. The Cloud Garden IAQ Sensors were suitable for this purpose.

4.1.3. Communication Protocol

The users must consider the suitability of different communication protocols for the specific task at the designated site. The factors that determine whether a device is suitable are: (i) the coverage where different wireless protocols can communicate at differing distances, (ii) the power consumption of the sensing device, and (iii) the required dedicated gateway hardware. Figure 5 illustrates the communication protocols utilized in our study, which highlight the sensor and IoT cloud platform multiple communication protocols. Users must be aware that the device manufacturers have a set protocol for the hardware that is not easily interchangeable. Furthermore, to communicate sensors’ data to the IoT cloud platform, each sensor required, at a minimum, a 4G gateway to connect the device to a wider network, and in some cases, they required further specific hardware. An example of such a consideration is a LoRaWAN-based device that requires a compatible gateway in order to access the LoRaWAN network server. The server is needed to handle the connection between the sensor device and the Internet via compatible protocols.
It is important to note that in any environmental monitoring scenario, it is likely that multiple sensing devices will be utilized based on the number of measured IAQ parameters. It then falls on the users to integrate multiple devices, with possibly varying communication protocols, and independent cloud platforms. It is highly recommended that the selected sensors support either open standards or provide APIs for streaming the data out. This would enable the creation of a system architecture that builds into a centralized location for data storage as shown in Figure 5.

4.1.4. Other Hardware

In addition to the decision-making process for sensor purchase, other hardware requirements in the form of networking and connectivity equipment become apparent. It is important to note the various gateways and access points are also required to facilitate the connectivity of the chosen devices to the wider internet and relevant cloud platforms. These are shown in the hardware architecture portion of Figure 5. For all WiFi-based devices, they are connected via industrial grade Telktonika RUT-240 4G access points. These provide WiFi networks that each sensor can independently connect to and backhauls communication to the Internet via a 4G cellular connection. Since LoRaWAN and Monnit ALTA sensors utilize different communication protocols, they further require protocol-specific gateways to backhaul data to and from the internet and cloud services.
The Monnit ALTA door sensors use a vendor-developed gateway that integrates the proprietary 433 MHz protocol with a 4G cellular module to facilitate communication to the Monnit cloud platform. As LoRaWAN devices communicate with a cloud-based network server, we used a Dragino LPS-8 LoRaWAN gateway connected via wired ethernet to a Teltonika 4G access point to create a link from the LoRaWAN gateway to the internet.

4.1.5. Other Software

In order to connect the various individual components and store the collected data, Node-RED and InfluxDB software were adopted. These software components make up the Data Management Services block in Figure 5 and will be discussed in greater detail in the following section regarding data integration.
Regarding the solution for the visualization of the collected data, Grafana was utilized for a number of reasons. Firstly, since Grafana is an open-source analytics solution, it opens the door for other developers to create the necessary plug-ins that were used for this dashboard. Secondly, the format in which it presents data enables its users to easily recognize what is being presented, which in some cases may improve decision-making capabilities.

4.2. The Integration Process to Capture, Store, and Visualize Data

As previously discussed, each of the COTS sensor devices communicates directly with a manufacturer or technology specific IoT cloud platform that handles basic connectivity management and data storage. While many such platforms store and visualize the data from associated devices, they generally provide APIs that allow external applications to interact with and extract the raw data. Through the use of these APIs, together with the standardized and well-documented interfaces, we then built a unified data management service (database). This service managed the periodic ingest and storage of sensor data so that the unified database could reflect the near-real time state of measurements taken by the deployed sensors.
In the proposed monitoring system, the data management service is a cloud-based software component that acts as a unified control and data storage hub for all the sensors and devices utilized in the monitoring system. Due to the heterogenous nature of a system where existing products are integrated into a single platform, this service is required to make use of a range of APIs and communication protocols to gather data and control information about each sensor and network device from various external cloud platforms.
The choice of software platforms in the Data Management Services block is based on the simple yet important requirements for a system that has a low barrier-to-entry and does not require deep technical experience in programming and design. These platforms are Node-RED and InfluxDB.
Node-RED is a well-known low-code flow-based programming tool that allows a system integrator to create data flows that ingest, manipulate, and export data from a range of sources and a range of formats. The low-code aspect of Node-RED means that the implementation of most data integration actions can be realized with only a high-level understanding of the operations required to interact with other Web APIs and transform data to push it into a database. The low-code methodology consequently also reduces the time required to implement data flow operations through the visual drag and drop-based flow construction method. Moreover, a developer is not limited to only graphically configured operations available as “blocks” but can write custom function blocks using standard JavaScript and the Node.JS libraries.
The storage and ease of access of sensor data in the implemented system by other users are a key design aspect of the entire sensing and data collection system. For this, we chose to use the InfluxDB time-series database platform. While the traditional databases allow flexible index types, the sensor data being collected in an IoT-based IAQ monitoring system is inherently associated with particular timestamps among other parameters. Previous studies [31,32] have raised concern that as IAQ monitoring applications largely deal with continuous real time-series data, the use of a database, which was optimized for time-series data, is crucial for efficient and easily accessible data to conduct post-processing and analysis. In this study, the InfluxDB has been optimized for the querying of data via its “tagging” mechanism that indexes tags for each record alongside timestamps. Such a mechanism means that heavily repeated parameters found in a database such as Device ID, sensor type, and other constants can be used to quickly filter and sort data during query operations.

4.3. Implications, Challenges, and Future Works

The proposed framework was also applied at three other workspaces with distinct attributes, including a laboratory, a factory, and a hospital (Appendix B). Each site produced continuous data monitoring stored in a central time-series database and can be visualized on an accessible dashboard in a format that is easily understandable users.
In the process of repeating the monitoring study and applying the provided framework, we have demonstrated the best practice in integrating different proprietary IoT platforms using open-source software to unify the data structure. An added benefit with the selected software is the no vendor-lock in issue. This allows users to swap in or out of any IoT devices as long as an API is provided for accessed and exporting the data. To maintain a generic framework that is scalable, versatile, and avoids vendor lock-in, this paper demonstrated the purchase of sensors from different manufacturers and have data exporting and streaming capability.
To elaborate on the importance of understanding the site and selecting a suitable communication protocol, during the factory monitoring study, the SenseCap Barometric Pressure sensors experienced interference from the sensing device to the gateway. Upon further investigation it was determined that the machinery was generating interference at the same frequency (915 MHz). The ultimate result was the inability to utilize the pressure sensors at this site.
The IoT framework and data ingest model are intended to form the foundation of any indoor environmental monitoring study. Once the data are collected, they can be utilized for many different purposes. The data can be used for further analysis to determine harmful IAQ parameter sources. However, this kind of analysis could be the focus of a subsequent study.

5. Conclusions

This paper presented an IoT architecture that can be adopted by ordinary users, without relevant engineering backgrounds, looking to perform an environmental monitoring study. This architecture offers flexibility for users to include or remove sensors as per their individual requirements. This has been demonstrated via a case study of an open-plan office and a mix of sensors for monitoring several IAQ and thermal comfort parameters. A model for the data ingest was presented in Section 2. In this case study, the model of data processing using Node-RED was presented and utilized to collect and store the data from these sensors in an InfluxDB database. This model consisted of three consecutive activities, namely raw data ingest from the sensors, data or payload sanitizing, and data decoding before being stored in the database. The merits of this software were discussed and its sample flows were provided. The dashboard presented the near-real time data in both a time-series format (graph and table) for historical data, and a floorplan format to visualize the sensor location with the latest reading. Findings from this study offer important insights for sensor selection, data integration, and other considerations when using the framework as a guide.

Author Contributions

Conceptualization, A.Y., J.D., C.-T.C. and T.Y.P.; methodology, A.Y., J.D.; software, A.Y. and J.D.; validation, A.Y. and J.D.; formal analysis, A.Y. and J.D.; investigation, A.Y. and J.D.; resources, C.-T.C. and T.Y.P.; writing—original draft preparation, A.Y., J.D., C.-T.C. and T.Y.P.; writing—review and editing, A.Y., J.D., C.-T.C. and T.Y.P.; visualization, A.Y. and J.D.; supervision, C.-T.C. and T.Y.P.; project administration, C.-T.C. and T.Y.P.; funding acquisition, C.-T.C. and T.Y.P. All authors have read and agreed to the published version of the manuscript.

Funding

This research was funded by the Victorian Higher Education State Investment Fund—Project Digital and Business Transformation—Digitization for Safe Workplaces, Grant Number: VHESIF 3.2, Project ID PRJ00000201.

Institutional Review Board Statement

Not applicable.

Informed Consent Statement

Not applicable.

Data Availability Statement

Not applicable.

Acknowledgments

We thank our industry partners (Memko Pty Ltd., Sutton Tools Pty Ltd., Northern Health, RMIT University) for their in-kind supports and participations for the experimental studies.

Conflicts of Interest

The authors declare no conflict of interest.

Appendix A

This section covers the detailed data flows implemented using Node-RED for each type of sensor data integration. These are the four major processing blocks that handle the data ingest, manipulation/sanitation, decoding, and storage in the time-series database.

Appendix A.1. Raw Data Ingest

Figure A1 shows the data ingest flow for an interval-based HTTP polling data ingest process. In this flow, a trigger is fired at periodic intervals (10 min) to begin a data ingest from a specific HTTP API from another cloud platform. The flow begins by authenticating with the API. This may be via API keys, usernames and passwords, or a combination of the two. Once authenticated, a request for data is sent to the API to retrieve the desired data recorded in the prior interval time (10 min). When the data are returned by the API, the endpoint (sensor or API type) is tagged as metadata to the current data flow and pushed on to the payload sanitizing flow.
Figure A1. HTTP interval polling-based data ingest step for device data integration.
Applsci 12 09450 g0a1
In the implementation of the data integration system presented in this paper, this polling type ingest flow requested the data for all sensors of the same type (e.g., the Weather Station devices from Table 2) and handled data from each device sequentially in the subsequent operations.
For event-triggered or Websocket-like HTTP APIs, Figure A2 shows the corresponding data ingest flow for a HTTP POST endpoint service to handle push data from a configured API service. This flow type suits IoT cloud platforms that allow a system integrator to provide an URL (Uniform Resource Locator)—a unique identifier that is used to locate a resource on the Internet, or an endpoint to push event-based data to an external service. This flow consists of an initial HTTP POST endpoint handler that forwards requests to be validated (i.e., from allowed sources) before tagging the endpoint source, and finally forwarding the received payload to the sanitizer process.
Figure A2. HTTP POST endpoint service-based data ingest step for device data integration.
Applsci 12 09450 g0a2
The final type of data ingest flow is an MQTT subscriber client, which allows the MQTT publish/subscribe protocol to be used to gather data from supporting cloud platforms. This type of data ingest flow is suitable for implementing on a Cloud platform, where MQTT brokers, that facilitate the information exchange among MQTT publishers and subscribers, are running on the Cloud to offload the computational and communication burden of the publishers and subscribers Figure A3 shows the data flow that requires only for an MQTT client to subscribe to the desired topic(s), tag the endpoint for which the data was retrieved from (MQTT device type or cloud platform), and pass the payloads on to the payload sanitizer.
Figure A3. MQTT topic subscriber-based data ingest step for device data integration.
Applsci 12 09450 g0a3

Appendix A.2. Payload Sanitizing

The next major step when integrating data into the unified management and storage system was the sanitizing step that received data packets and payloads. Broadly, this was performed for each device type based on the initially received format from the external cloud service. As shown in Figure A4, this starts by attempting to convert the data payload to a JavaScript Object Notation (JSON)—an open standard file or data format—syntax that can be easily handled by Node-RED. If not already completed, the endpoint (type of ingest) and origin (cloud platform) are added to the data flow as additional strings in the JSON syntax. Following this, redundant data and objects within the current data payload are removed (e.g., parameters which are not required for storage in the database). Finally, each payload is scanned for a device-specific ID to translate it to a system-wide ID.
Figure A4. Data flow for the payload sanitizing step of device data integration.
Applsci 12 09450 g0a4
In our implementation, the system-wide ID was referred to as the Sensor-Asset Name (SAN) and translated to a device or technology specific identifier to one that identifies the type and unique number of that sensor. For example, a WiFi-based weather station could be identified by its 8-byte Media Access Control (MAC) address—which identifies a device with other devices on the same local network—and is assigned a SAN in the form of “WTH-xxxx”, where “WTH” identified the device as a weather station and the four-digit number “xxxx” denoted the unique identifier of that particular weather station (e.g., 0001). The device to SAN ID mapping was stored as a configuration object in JSON format and read in from a file when the Node-RED flows were initialized. It should also be noted that any payload that either failed a communication to JSON, or could not have its ID decoded to a known device was discarded and was noted in the system log for future diagnoses

Appendix A.3. Data Decoding

Once received, payloads have been appropriately conditioned and any unnecessary or invalid payloads have been discarded, the payloads for each device type can be decoded based on the SAN, which has been mapped in the previous step. This flow is shown in Figure A5. During the data decoding step, a “device type router” block checks the SAN type identifier (e.g., “WTH”) and forwards the payload on towards the correct decoder.
Figure A5. Data flow for payload decoding and conditioning prior to storage for device data integration.
Applsci 12 09450 g0a5
Finally, during the payload decode step, all device-specific decodings of sensor parameters are extracted and compiled into a format that is compatible with and can be stored in an InfluxDB database. All datapoints are decoded with a timestamp, and the sensor parameter name, device ID (SAN), the data or measured value, and the corresponding units of the data point are stored. For some devices, timestamps are recorded by the sensor manufacturer platform and accompany the data queried via the integration APIs. In the case of push or real time ingest types (i.e., MQTT or websocket clients), where a timestamp is not provided by the API and the data push occurs in real time, we record it as the time at which the data were received by that particular ingest trigger.

Appendix A.4. Data Storage

The final step required for integrating data into the unified system is to extract the decoded payloads and store them in a chosen database. In this final portion of the data flow (Figure A6), the timestamps, sensor parameters, SANs, measured values, and units are arranged into the appropriate InfluxDB timestamp, tags, and field-value pairs, and are stored in the database.
Figure A6. Data storage preparation and storage operation flow for device data integration.
Applsci 12 09450 g0a6
The concept of tags and field-value pairs are unique and constructed to the InfluxDB data model, which has the following features. Firstly, each record in an InfluxDB database (referred to as a “bucket”) is characterized by a measurement name, which in our implementation will always be “sensor_data”, to denote the sensor data recorded at a specific site. We further organize recorded data into separate buckets for each site or deployment so as to isolate each collection of site data.
Secondly, within each bucket and measurement, each data record is stored with a timestamp as its index, a tag metadata, and one or more field-value pairs to store the actual record data. The difference between tags and field-value pairs is that tags are indexed and hence can be quickly queried by the database engine, whereas field-value pairs are not. This difference is useful for storing metadata about records that does not change or will have a finite and relatively limited range of possible values. For each record, our implementation stores device ID (SAN) and sensor parameter type (e.g., temperature, humidity, CO2, etc.) as tags and a “value” field with the recorded sensor measurement.

Appendix B

The proposed framework that is comprised of sensors that measure the parameters of IAQ, was tested at different worksites: a university laboratory, a hospital ward, and a processing room in a factory. In this section, we present the important aspects of each deployment including floorplans and installation photos.
Figure A7. Sensor placement for the university laboratory.
Applsci 12 09450 g0a7
Figure A8. Sensor placement for the hospital ward.
Applsci 12 09450 g0a8
Figure A9. Sensor placement for the factory room.
Applsci 12 09450 g0a9

References

  1. Fisk, W.J.; Rosenfeld, A.H. Estimates of Improved Productivity and Health from Better Indoor Environments. Indoor Air 1997, 7, 158–172. [Google Scholar] [CrossRef]
  2. Mujan, I.; Anđelković, A.S.; Munćan, V.; Kljajić, M.; Ružić, D. Influence of indoor environmental quality on human health and productivity—A review. J. Clean. Prod. 2019, 217, 646–657. [Google Scholar] [CrossRef]
  3. US EPA. Introduction to Indoor Air Quality. Available online: https://www.epa.gov/indoor-air-quality-iaq/introduction-indoor-air-quality (accessed on 16 May 2022).
  4. Particulate Matter (PM) Basics|US EPA. Available online: https://www.epa.gov/pm-pollution/particulate-matter-pm-basics (accessed on 17 May 2022).
  5. Brook, R.D.; Franklin, B.; Cascio, W.; Hong, Y.; Howard, G.; Lipsett, M.; Luepker, R.; Mittleman, M.; Samet, J.; Smith, S.C.; et al. Air Pollution and Cardiovascular Disease. Circulation 2004, 109, 2655–2671. [Google Scholar] [CrossRef] [PubMed]
  6. Chin, M.T. Basic mechanisms for adverse cardiovascular events associated with air pollution. Heart 2015, 101, 253–256. [Google Scholar] [CrossRef] [PubMed]
  7. Bennett, J.; Davy, P.; Trompetter, B.; Wang, Y.; Pierse, N.; Boulic, M.; Phipps, R.; Howden-Chapman, P. Sources of indoor air pollution at a New Zealand urban primary school; a case study. Atmos. Pollut. Res. 2019, 10, 435–444. [Google Scholar] [CrossRef]
  8. US EPA. Volatile Organic Compounds’ Impact on Indoor Air Quality. Available online: https://www.epa.gov/indoor-air-quality-iaq/volatile-organic-compounds-impact-indoor-air-quality (accessed on 16 May 2022).
  9. Tran, V.V.; Park, D.; Lee, Y.-C. Indoor Air Pollution, Related Human Diseases, and Recent Trends in the Control and Improvement of Indoor Air Quality. Int. J. Environ. Res. Public. Health 2020, 17, 2927. [Google Scholar] [CrossRef] [PubMed]
  10. Goodman, N.B.; Steinemann, A.; Wheeler, A.J.; Paevere, P.J.; Cheng, M.; Brown, S.K. Volatile organic compounds within indoor environments in Australia. Build. Environ. 2017, 122, 116–125. [Google Scholar] [CrossRef]
  11. Orecchio, S.; Fiore, M.; Barreca, S.; Vara, G. Volatile Profiles of Emissions from Different Activities Analyzed Using Canister Samplers and Gas Chromatography-Mass Spectrometry (GC/MS) Analysis: A Case Study. Int. J. Environ. Res. Public. Health 2017, 14, 195. [Google Scholar] [CrossRef]
  12. Zhang, H.; Srinivasan, R. A Systematic Review of Air Quality Sensors, Guidelines, and Measurement Studies for Indoor Air Quality Management. Sustainability 2020, 12, 9045. [Google Scholar] [CrossRef]
  13. US EPA. Overview of Greenhouse Gases. Available online: https://www.epa.gov/ghgemissions/overview-greenhouse-gases (accessed on 17 May 2022).
  14. Seppänen, O.A.; Fisk, W.J.; Mendell, M.J. Association of Ventilation Rates and CO2 Concentrations with Health andOther Responses in Commercial and Institutional Buildings. Indoor Air 1999, 9, 226–252. [Google Scholar] [CrossRef] [PubMed] [Green Version]
  15. US EPA. Nitrogen Dioxide’s Impact on Indoor Air Quality. Available online: https://www.epa.gov/indoor-air-quality-iaq/nitrogen-dioxides-impact-indoor-air-quality (accessed on 1 August 2022).
  16. US EPA. Sulfur Dioxide Basics. Available online: https://www.epa.gov/so2-pollution/sulfur-dioxide-basics (accessed on 1 August 2022).
  17. Majd, E.; McCormack, M.; Davis, M.; Curriero, F.; Berman, J.; Connolly, F.; Leaf, P.; Rule, A.; Green, T.; Clemons-Erby, D.; et al. Indoor air quality in inner-city schools and its associations with building characteristics and environmental factors. Environ. Res. 2019, 170, 83–91. [Google Scholar] [CrossRef] [PubMed]
  18. Nkosi, V.; Wichmann, J.; Voyi, K. Indoor and outdoor PM10 levels at schools located near mine dumps in Gauteng and North West Provinces, South Africa. BMC Public Health 2017, 17, 42. [Google Scholar] [CrossRef] [PubMed]
  19. Irga, P.J.; Torpy, F.R. Indoor air pollutants in occupational buildings in a sub-tropical climate: Comparison among ventilation types. Build. Environ. 2016, 98, 190–199. [Google Scholar] [CrossRef]
  20. Montgomery, J.F.; Storey, S.; Bartlett, K. Comparison of the indoor air quality in an office operating with natural or mechanical ventilation using short-term intensive pollutant monitoring. Indoor Built Environ. 2015, 24, 777–787. [Google Scholar] [CrossRef]
  21. Al-Okby, M.F.R.; Neubert, S.; Roddelkopf, T.; Fleischer, H.; Thurow, K. Evaluating of IAQ-index and TVOC As Measurements Parameters for IoT-based Hazardous Gases Detection and Alarming Systems. In Proceedings of the 2022 IEEE 20th Jubilee World Symposium on Applied Machine Intelligence and Informatics (SAMI), Poprad, Slovakia, 19–22 January 2022; pp. 000291–000298. [Google Scholar]
  22. Ceccarini, C.; Chan, K.K.; Lei Lok, I.; Tse, R.; Tang, S.-K.; Prandi, C. Fostering user’s awareness about indoor air quality through an IoT-enabled home garden system. In Proceedings of the 2021 International Conference on Computer Communications and Networks (ICCCN), Athens, Greece, 19–22 July 2021; pp. 1–4. [Google Scholar]
  23. Hapsari, A.A.; Hajamydeen, A.I.; Vresdian, D.J.; Manfaluthy, M.; Prameswono, L.; Yusuf, E. Real Time Indoor Air Quality Monitoring System Based on IoT using MQTT and Wireless Sensor Network. In Proceedings of the 2019 IEEE 6th International Conference on Engineering Technologies and Applied Sciences (ICETAS), Kuala Lumpur, Malaysia, 20–21 December 2019; pp. 1–7. [Google Scholar]
  24. Kadir, A.D.I.A.; Alias, M.R.N.M.; Dzaki, D.R.M.; Din, N.M.; Deros, S.N.M.; Haron, M.H. Cloud-Based IoT Air Quality Monitoring System. In Proceedings of the 2021 26th IEEE Asia-Pacific Conference on Communications (APCC), Kuala Lumpur, Malaysia, 10–13 October 2021; pp. 121–127. [Google Scholar]
  25. Palco, V.; Fulco, G.; De Capua, C.; Ruffa, F.; Lugarà, M. IoT and IAQ monitoring systems for healthiness of dwelling. In Proceedings of the 2022 IEEE International Workshop on Metrology for Living Environment (MetroLivEn), Cosenza, Italy, 25–27 May 2022; pp. 105–109. [Google Scholar]
  26. Permana, A.F.; Kuncoro, C.B.D. Autonomous Temperature and Humidity Wireless Sensor Node for Indoor Air Quality Monitoring Application. In Proceedings of the 2021 5th International Conference on Informatics and Computational Sciences (ICICoS), Semarang, Indonesia, 24–25 November 2021; pp. 272–276. [Google Scholar]
  27. Raj, A.A.; Vijila, J. Design of Indoor Air Quality Monitoring System to Ensure a Healthy Universe. In Proceedings of the 2020 International Conference on Smart Electronics and Communication (ICOSEC), Trichy, India, 10–12 September 2020; pp. 1123–1127. [Google Scholar]
  28. Rastogi, K.; Barthwal, A.; Lohani, D. AQCI: An IoT Based Air Quality and Thermal Comfort Model using Fuzzy Inference. In Proceedings of the 2019 IEEE International Conference on Advanced Networks and Telecommunications Systems (ANTS), Goa, India, 16–19 December 2019; pp. 1–6. [Google Scholar]
  29. Sajjan, V.; Sharma, P. Analysis of IoT Architecture for Low Cost Air Pollution Monitoring Systems. In Proceedings of the 2020 Second International Conference on Inventive Research in Computing Applications (ICIRCA), Coimbatore, India, 15–17 July 2020; pp. 63–69. [Google Scholar]
  30. Zhao, L.; Wu, W.; Li, S. Design and Implementation of an IoT-Based Indoor Air Quality Detector with Multiple Communication Interfaces. IEEE Internet Things J. 2019, 6, 9621–9632. [Google Scholar] [CrossRef]
  31. Grzesik, P.; Mrozek, D. Comparative Analysis of Time Series Databases in the Context of Edge Computing for Low Power Sensor Networks. In Proceedings of the International Conference on Computational Science, Amsterdam, The Netherlands, 3–5 June 2020; Volume 12141, pp. 371–383. [Google Scholar] [CrossRef]
  32. Luzar, A.; Stanovnik, S.; Cankar, M. Time Series or Relational Database for Edge and IoT 2018; Zenodo: Geneva, Switzerland, 2018. [Google Scholar] [CrossRef]
Figure 1. An architecture-level diagram of the monitoring system from sensor and network devices to cloud platforms for data storage and visualization.
Applsci 12 09450 g001
Figure 2. A system architecture to demonstrate data management services.
Applsci 12 09450 g002
Figure 3. High-level flow diagram representing the behavior of the data integration and management system.
Applsci 12 09450 g003
Figure 4. An example of an open plan office with sensor locations.
Applsci 12 09450 g004
Figure 5. Monitoring system hardware and software architecture shows logical interconnections and communication protocols.
Applsci 12 09450 g005
Figure 6. Node-RED flow—Raw data ingest of the Netatmo weather station.
Applsci 12 09450 g006
Figure 7. Node-RED flow—Payload sanitizing of Netatmo weather station.
Applsci 12 09450 g007
Figure 8. Node-RED flow—Data decoding of Netatmo weather station.
Applsci 12 09450 g008
Figure 9. Grafana dashboard of office worksite and weather station sensors.
Applsci 12 09450 g009
Figure 10. Time series from sensors in the large meeting room: (a) Weather station shows an increase in CO2 as occupant levels increase. (b) Weather station shows noise levels increase as occupant levels increase. (c) Indoor air quality sensor shows PM2.5 levels.
Applsci 12 09450 g010
Figure 11. Barometric pressure sensors and door sensors. (a) Panel shows the locations and latest readings of installed barometric pressure sensors and door sensors. (b) Panel shows readings from OCS-0000. Drop down menu allows the selection of other door sensors. (c) Panels show the time-series data from the barometric pressure sensors. (d) Panel shows readings from BPS-0000. Drop down menu allows selection from other barometric pressure sensors.
Applsci 12 09450 g011
Figure 12. Device Status Dashboard sample: (a) Indoor Air Quality Sensor last reading and (b) current status of gateway devices.
Applsci 12 09450 g012
Table 1. Recent air quality studies in the literature.
StudyParametersObjectiveMain Results
Bennet et al. [7],
2019
PM2.5, PM10, CO2, NO2
Temperature, Relative Humidity
Analyze the concentration and sources of air pollution PM2.5 associated with infiltration from outdoor/traffic pollution.
PM10 indoors was higher than outdoors.
Majd et al. [17],
2019
PM2.5, NO2, CO, CO2
Temperature, Relative Humidity
Measure indoor concentration and determine factors that affect these levelsOutdoor conditions (incl. seasons), facility conditions were found to contribute to indoor pollution concentrations.
Nkosi et al. [18],
2017
PM10, SO2Measure PM10 and SO2 levels for schools at different distances from minesFound a significant correlation between PM10 and indoor dust.
Irga and Torpa [19],
2016
CO2, CO, TVOCs, NO, NO2, SO2, total suspended particulate matter, PM10, PM2.5Measure air quality parameters in relation to different ventilation systemsNatural and mixed ventilation systems recorded higher levels of NO2; mechanical systems recorded higher levels of CO2 and lower levels of PM than the others.
Montgomery et al. [20],
2015
CO2, TVOCs, PMCompare natural and mechanical ventilation systems for controlling indoor air qualityMechanical ventilation superior for controlling TVOC and CO2 levels regardless of occupancy levels. PM I/O ratios were lower for mechanical ventilation than natural ventilation.
Table 2. IAQ studies with the used of IoT technologies.
AuthorsApplication(s)Sensing ParametersCommunication Protocols/Standards and Cloud PlatformsSensors and Controller Platforms
Al-Okby et al. [21]Evaluate IAQ and TVOC sensors accuraciesTemperature, Humidity, TVOC, CO2, and a proprietary VOC indexWi-Fi, a generic HTTP webserver and SQL databaseSGPG30, SGP40, SHTC3, ESP8266
Ceccarini et al. [22]Monitor IAQ (to plant health)Temperature, Humidity, CO2, Light Intensity, Soil MoistureWi-Fi, a Node.js based server with a MySQL databaseCanarin II Sensors Station, TEMT6000, CCS811, ESP8266, Raspberry Pi
Hapsari et al. [23]Monitor IAQTemperature, Humidity, CO2, NH3, NOX, Wi-Fi, MQTT, a Node.js-based server with a MySQL databaseDHT11, MQ135, DSM501A, ESP8266
Kadir et al. [24]Monitor IAQTemperature, Humidity, CO2, and Total Volatile Organic Compound (TVOC)Wi-Fi, Freeboard.io, Amazon Web ServicesBME680, DHT11, DHT22, CCS811, ESP32
Palco et al. [25]Monitor IAQTemperature, Humidity, CO2, PM2.5, PM10Unknow communication standard(s), a web service based on LabViewUnknow sensor(s), a generic high-performance embedded controller with network connectivity
Permana and Kuncoro [26]Monitor Temperature and HumidityTemperature, HumidityWi-Fi (WINC1510), Adafruit IO platformMikroE SHT click, Arduino-based
Raj and Vijila [27]Monitor IAQTemperature, Humidity, CO, Smoke, Low Pressure Gas (LPG), Combustible GasesWi-Fi, Think SpeakDHT11, MQ6, MQ7, MQ9, MQ135, ATMega328P
Rastogi et al. [28]Measure Predicted Mean Vote (PMV), and Ventilation Rate (VR)Temperature, Humidity, CO2, Occupancy LevelBluetooth (HC-05), Amazon Web ServicesDHT22, Sharp GP2Y0A02YK0F, MQ135, Arduino-based
Sajjan and Sharma [29]Monitor Air PollutionTemperature, Humidity, Combustible Gases, including LPG, Natural Gas, Coal Gas, etc.Wi-Fi (Raspberry Pi), Thing SpeakMQ5, Raspberry Pi
Zhao et al. [30] Monitor IAQTemperature, Humidity, CO2, PM2.5, PM10, and FormaldehydeModbus, LoRa, Wi-Fi, NB-IoT, GPRS, a generic Cloud platformSHT30, PMS5003, WZ-S-K, S8 0053, STM32F103C8T6
Table 3. Sensing devices used in study.
DeviceSensor(s)Sampling IntervalCommunication TechnologyPower Supply
Netatmo Weather Station (indoor module)Temperature (°C)
Humidity (%RH)
Pressure (bar)
CO2 (ppm)
Noise (dB)
5 minWiFi5V micro-USB
Netatmo Weather Station (outdoor module)Temperature (°C)
Humidity (%RH)
5 minWiFi2×AAA battery
SenseCap Barometric Pressure modulePressure (Pa)
Battery level (%)
10 minLoRaWANLithium battery
CloudGarden Indoor Air
Quality Monitor
Temperature (°C)
Humidity (%RH)
CO2 (ppm)
TVOCs (ppb)
PM1/PM2.5/PM10 (µg/m3)
1 minWiFi5V micro-USB
Monnit ALTA open/close sensorDoor/window state
Battery level (%)
On-change433 MHz
Proprietary
AA battery
Publisher’s Note: MDPI stays neutral with regard to jurisdictional claims in published maps and institutional affiliations.

