Abstract
Recommendation attack attempts to bias the recommendation results of collaborative recommender systems by injecting malicious ratings into the rating database. A lot of methods have been proposed for detecting such attacks. Among these works, the deep learning-based detection methods get rid of the dependence on hand-designed features of recommendation attack besides having excellent detection performance. However, most of them optimize the key hyperparameters by manual analysis which relies too much on domain experts and their experience. To address this issue, in this paper we propose an approach based on the Harris Hawks Optimization (HHO) algorithm to improve the deep learning-based detection methods. Being different from the original detection methods which optimize the key hyperparameters manually, the improved deep learning-based detection methods can optimize the key hyperparameters automatically. We first convert the key hyperparameters of discrete type to continuous type according to the uniform distribution theory to expand the application scope of HHO algorithm. Then, we use the detection stability as an early stop condition to reduce the optimization iterations to improve the HHO algorithm. After that, we use the improved HHO algorithm to automatically optimize the key hyperparameters for the deep learning-based detection methods. Finally, we use the optimized key hyperparameters to train the deep learning-based detection methods to generate classifiers for detecting the recommendation attack. The experiments conducted on two benchmark datasets illustrate that the improved deep learning-based detection methods have effective performance.
1. Introduction
Nowadays, the rapid growth of information aggravates the problem of information overload. Collaborative recommender systems (CRS) [1], which can filter out the information that users are interested in according to the user profiles, are designed to deal with this problem. They have been successfully applied in many fields, such as product sales (https://www.amazon.com/ (accessed on 15 July 2022)), multimedia services (https://www.netflix.com/ (accessed on 15 July 2022)), and so on.
Open nature is an essential characteristic of CRS. For this reason, the CRS are vulnerable to recommendation attack [2,3,4]. Fake profiles are injected into the rating database of CRS by attackers to influence the recommendation results in the recommendation attack. Fake profiles are usually called attack profiles.
The recommendation attack with the purpose of promoting or demoting the target item is called push and nuke attack [5], respectively. At the beginning, attack models [5] are used to construct attack profiles. Random, average, and bandwagon [2,6,7] attacks are three representative attack models. Rich attack profiles with different attack strength can be obtained by setting the attack strategy, attack size, and filler size of the attack model [5]. In recent years, attack profiles in the real scene are labeled from the Amazon Review dataset [8]. This work further enriches the mode of the recommendation attack.
To detect the attack, a lot of unsupervised [9,10,11,12,13,14,15,16], semi-supervised [17,18], and supervised [19,20,21,22,23,24,25,26,27] detection methods have been proposed. One advantage of unsupervised detection methods is that labeled user profiles are not required for the detection. It is for this reason that unsupervised detection methods need some prior knowledge or some assumptions to perform the detection. For example, PCA-based detection method [10] takes the attack size as a prior knowledge. Clustering-based detection methods [12,13,14,15,16] usually assume that the test sets contain both genuine and attack profiles. However, above prior knowledge is usually hard to get and above assumption is not always true in real application.
Semi-supervised detection methods first train weak classifiers with a few labeled user profiles. Then, some unlabeled user profiles are used to improve the weak classifiers. This type of method reduces the dependence on prior knowledge and assumptions. However, existing semi-supervised detection methods need extract hand-designed features of recommendation attack which is a challenging task even for domain experts.
Supervised detection methods usually have good detection performance by training the classifiers with labeled user profiles. They learn knowledge from the training samples instead of depending on prior knowledge or assumptions for the detection. In particular, the recently proposed deep learning-based detection methods [23,24,25,26,27] do not need the hand-designed features and can automatically learn the features of recommendation attack besides having excellent detection performance.
In the deep learning-based detection methods, there are usually many hyperparameters need to be set. These hyperparameters can greatly affect the detection performance of the detection methods. Although, some of the hyperparameters such as learning rate, loss function, and so on can be well determined by referring to relevant research results, the remaining hyperparameters such as activation function, epochs, and so on, which are called key hyperparameters for ease of discussion, need to be optimized differently for different CRS.
In most of the existing deep learning-based detection methods, however, the key hyperparameters are optimized by manual analysis. That is, domain experts are employed to determine the key hyperparameters by analyzing the detection performance of candidate solutions. This way of determining key hyperparameters relies too much on domain experts and their experience.
The swarm intelligence optimization algorithms have been effectively applied in intrusion detection (ID) for many years [28,29,30]. For example, the Genetic Algorithm (GA) is used to optimize features and parameters of the classifier which is used to identify attacks in the ID systems [28,31]. The Particle Swarm Optimization (PSO) algorithm is combined with some machine learning algorithms, such as k-means, to improve the performance of anomaly detection [28,32]. The Ant Colony Optimization (ACO) algorithm is combined with Decision Tree to build a multiple level hybrid classifier for classifying attacks in the ID systems [28,33].
Inspired by these works, in this paper, to improve the deep learning-based detection methods we propose an approach based on the Harris Hawks Optimization (HHO) algorithm [34] for the recommendation attack. The improved detection methods replace the manual optimization in the original detection methods by automatic optimization for optimizing the key hyperparameters. Major contributions of this work are described as follows.
- We proposed a hyperparameter type conversion algorithm to convert the key hyperparameters of discrete type to continuous type according to the uniform distribution theory to expand the application scope of HHO algorithm.
- We reduced the optimization iterations by using the detection stability as an early stop condition to improve the HHO algorithm. We proposed a hyperparameter automatic optimization algorithm based on the improved HHO algorithm to automatically optimize the key hyperparameters for the deep learning-based detection methods. We proposed a detection algorithm for the recommendation attack by training the deep learning-based detection methods with the optimized key hyperparameters to generate classifiers for the detection.
- We conducted a large number of experiments on two benchmark datasets to verify the effectiveness of the proposed approach.
2. Related Work and Background
2.1. Related Work
In unsupervised detection methods, several statistical based metrics are firstly proposed by analyzing the difference of rating patterns among user profiles [9]. Attack profiles with high filler sizes can be successfully detected by this method. By calculating the principal components in the rating database, the PCA-based detection method [10] has effective detection performance. However, this detection method assumes that attack size is known. In practice, the prior knowledge such as attack size is not easy to get. Based on the theory of Beta distribution, the Beta-Protection detection method is proposed [11]. This method can identify certain types of attack profiles. However, this method has poor detection performance when facing recommendation attack with large-scale attack sizes. The clustering-based detection methods [12,13,14,15,16] assume that the test sets contain both genuine and attack profiles at the same time. Then, the test sets are clustered to different clusters for the detection. However, in practical applications the test sets may only contain genuine profiles or attack profiles. In these cases, the assumption of these methods can no longer be satisfied.
In semi-supervised detection methods, a detection method based on Bayesian classifier is firstly proposed [17]. After enhancement training with unlabeled user profiles, this method has high recall but low precision when detecting the attack. After that, the ensemble learning method is used to improve the detection performance [18]. However, these existing methods require the features of user profiles which are extracted manually.
In supervised detection methods, three famous machine learning algorithms are firstly trained to construct classifiers for detecting the attack [19]. Although, these methods have high recall, they suffer from low precision. Based on a variant of AdaBoost algorithm, a detection method RadaBoost is proposed. RadaBoost is used to improve the performance for detecting the attack with imbalanced samples [20]. The SVM-based detection method is proposed in paper [21]. In this work, the genuine and attack profiles are first balanced before being used for training. The precision is improved by analyzing the target item analysis. One drawback of this method is that it is a challenging task to determine the target item since the rating database usually contains a large number of items. For improving the detection performance of single classifier, the trust features are extracted and used to train an SVM-based classifier [22]. However, this work also faces the challenge of determining target items. Recently, the methods based on the technologies of deep learning are proposed to detect the attack [23,24,25,26,27]. Deep neural networks, which contain single convolutional layer, multiple convolutional layers, or hybrid layers, are designed to establish detection methods, respectively. These deep learning-based detection methods do not require the hand-designed features. Instead, they learn the features of recommendation attack, automatically. Benefit from the strong learning ability of deep learning, most of these methods usually have excellent detection performance. However, the key hyperparameters of the existing deep learning-based detection methods are optimized by manual analysis which relies too much on domain experts and their experience.
2.2. Background
HHO algorithm [34] is a gradient-free swarm intelligence optimization algorithm. The main advantages of this algorithm include easy to implement, simple to use, and strong versatility. Research results in many applications show that the performance of this algorithm, such as speed and accuracy, is the same as or better than these of famous optimization algorithms, such as genetic algorithm, particle swarm optimization algorithm and so on [34,35].
The Harris’ hawk belongs to a kind of raptors which lives in southern half of Arizona, USA [34]. When hunting, they show good intelligence [34]. The HHO algorithm simulates the hunting behavior of Harris’ hawks. Each hawk denotes a candidate solution. Hawks approximate the optimal solution (a prey, such as a rabbit) with iteration through cooperative foraging activities.
The same as most population-based optimization algorithms, the HHO algorithm consists of two phases which are exploration and exploitation phases. The exploration phase usually refers to the early step of the search process, which emphasizes the randomness of the search behavior and strengthens the search process of the global range. The exploitation phase usually focuses on searching the neighborhood of better solutions and strengthens the search process of local area.
Details of the HHO algorithm is introduced in the following three subsections.
2.2.1. Exploration Phase
In the stage of initialization, Harris’ hawks randomly perch in some positions in the search range [, ]. and denote the search boundaries. In the stage of iteration, the following two strategies are used to update the locations [34]:
where, denotes the position vector of a hawk in the (t + 1)th iteration, denotes the position vector of a hawk in the tth iteration, denotes a randomly selected hawk, denotes the position vector of the rabbit, denotes the average position of all the hawks, , and q denote random numbers in the open interval from 0 to 1.
As shown in Equation (1), the first strategy determines the new position according to the current position and a randomly selected position. The second strategy considers the best location to date and the average position. At the same time, a randomly-scaled component is also considered to increase the randomness of this strategy where denotes a scaling coefficient.
The average position of hawks is defined as follows [34]:
where, t represents the current number of iterations, X represents a position vector, and N represents the total number of hawks.
2.2.2. Transition from Exploration to Exploitation
During the escape of a prey, its energy will gradually decrease. At the same time, HHO algorithm will transfer from exploration to exploitation. The follow equation is used to model this process [34]:
where, E denotes the escaping energy of the prey, T denotes the maximum number of iterations, and denotes the initial value of the energy. is randomly selected from the open interval from −1 to 1 at each iteration.
With the number of iterations t increases, E gradually decreases. When , the escaping energy of the prey is large. Hawks continuously monitor and locate the prey. HHO algorithm is at the stage of exploration as shown in Section 2.2.1. When , the escaping energy of the prey becomes small. Hawks began to chase their prey. HHO algorithm is at the stage of exploitation as shown in Section 2.2.3.
2.2.3. Exploitation Phase
In the phase of exploitation, the Harris’ hawks attack the prey found in the phase of exploration. However, the prey often attempts to escape from danger. Therefore, the hawks will perform different attack strategies according to the escaping behaviors of the prey for each attack.
Let r denote the probability of successful escape () or not successful escape () before the prey is attacked. According to the value of E, the hawks execute different attack strategies. When , the hawks perform soft besiege. When , the hawks perform hard besiege. Four different attack strategies proposed in HHO algorithm are shown as follows.
- (1)
- Soft besiege
When and , although the prey has enough energy to escape, it fails to escape. As the prey attempts to escape, the hawks slowly surround the prey to make the prey exhausted. Then, the hawks launch an attack. The following rules are used to model the above behaviors [34]:
where, denotes the difference between the position vector of the prey and the current location in the tth iteration, denotes the random jump strength of the prey when the prey escapes, and denotes a random number in the open interval from 0 to 1. The value of J changes randomly at each iteration to simulate the randomness of the prey motion.
- (2)
- Hard besiege
When and , the prey is exhausted and lack of escaping energy. The hawks perform the surprise pounce. In this situation, the positions are updated using the following equation [34]:
- (3)
- Soft besiege with progressive rapid dives
When and , the prey has enough energy to escape successfully. The Harris’ hawks will construct a soft besiege before the surprise pounce. In this process, the hawks have two methods to update the positions as shown in Equations (7) and (8) [34], respectively:
where, D denotes the dimension of problem, S denotes a random vector of size, and denotes the Levy flight function which is used to simulate the irregular movement of the hawks. In the process of chasing, this movement can deceive the prey. The function can be calculated as follows [34]:
where, and denote random numbers in the open interval from 0 to 1, and is a constant which default value is 1.5.
Based on above discussions, the positions of hawks are updated as follows [34]:
where, F denotes the fitness function.
- (4)
- Hard besiege with progressive rapid dives
When and , the prey has insufficient energy, but still successfully escapes through random movement. In this situation, the Harris’ hawks will construct a hard besiege before the surprise pounce to reduce the average distance between them and their prey. The following rules are used to update the positions [34]:
3. Proposed Approach
In this section, we first describe the basic structure of the proposed detection framework. Then, we show the proposed detection algorithms.
3.1. Detection Framework
Figure 1 describes the basic structure of the proposed detection framework. As shown in this figure, a hyperparameter type conversion algorithm is proposed to convert the discrete key hyperparameters to continuous key hyperparameters. Based on the improved HHO algorithm, a hyperparameter automatic optimization algorithm is proposed to automatically optimize the key hyperparameters for the deep learning-based detection methods. After the optimal hyperparameters are obtained, the training set is used to train the deep learning-based detection method with these hyperparameters to generate a classifier. This classifier will be used to detect the test sets for the detection.
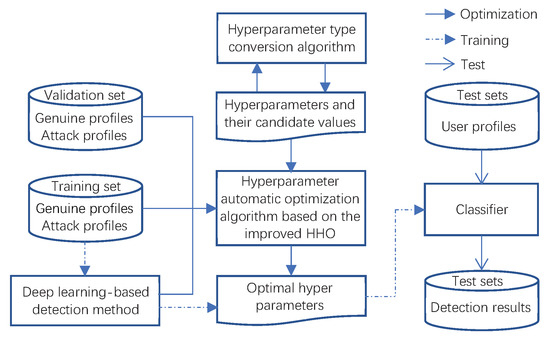
Figure 1.
Proposed detection framework.
3.2. Detection Algorithms
The original HHO algorithm is designed to search the optimal solution in the continuous numerical interval. It cannot perform the search and optimization in discrete candidate spaces. However, many key hyperparameters of the deep learning-based detection methods belong to the discrete type.
To make HHO algorithm search and optimize discrete key hyperparameters, in this paper we propose a hyperparameter type conversion algorithm to convert the key hyperparameters from discrete to continuous.
As described in Section 2.2, the HHO algorithm randomly searches the optimal solution in the way of equal probability. That is, all candidate solutions have the same probability of being found. This constraint should also be satisfied when we map the discrete key hyperparameters to the continuous key hyperparameters.
According to the probability theory, the probability density function of uniform distribution of continuous random variables is defined as follows [36]:
The uniform distribution has the following equal possibilities. If , then the probability that X falls on any sub-interval in interval can be calculated as follows [36]:
As shown in Equation (15), the probability is only related to the length of interval .
We assume that one key hyperparameter is a random variable with uniform distribution. Based on the uniform distribution theory, we only need to map the discrete candidate values to the continuous numerical spaces which have the same intervals. Then, when the HHO algorithm performs random search, the candidate values can be found with equal probability.
According to above discussions, we propose a hyperparameter type conversion algorithm to convert the key hyperparameter from discrete to continuous as shown in Algorithm 1.
| Algorithm 1 Hyperparameter type conversion algorithm for converting the key hyperparameter from discrete to continuous. |
Require: candidate values of a discrete key hyperparameter {}. Ensure: search range of each candidate value for the discrete key hyperparameter , search range of the discrete key hyperparameter .
|
We take the activation function as an example to further illustrate Algorithm 1. The activation function is a key hyperparameter which is usually optimized manually in the deep learning-based detection methods [23,25]. Suppose that the candidate values of the activation function contain {linear, sigmoid, tanh, elu, relu, and selu}. These values are used as input of Algorithm 1. The corresponding outputs of Algorithm 1 are , , , , , and and . denotes the search range for the linear function. The meaning of other intervals is similar to this meaning. The range [0.5, 6.5) denotes the entire search range of the activation function. Obviously, all the candidate values have the same intervals.
Generally, it is not necessary to let the optimization algorithm continue to run after the learning performance is stable. Driven by this idea, the early stop conditions have been successfully applied in many learning models to speed up training and optimization [37,38]. However, the original HHO algorithm has no early stop condition yet. Therefore, the number of iterations performed by the HHO algorithm must be the maximum. Based on this analysis, in this paper, to improve the original HHO algorithm we use the detection stability as an early stop condition, as shown in lines 7 to 9 of Algorithm 2, to reduce the optimization iterations of the HHO algorithm. From our experiments, it can be found that this is a useful improvement. Benefit from this improvement the detection approach can maintain good detection performance while the number of iterations is reduced greatly.
| Algorithm 2 Hyperparameter automatic optimization algorithm based on the improved HHO algorithm. |
Require: training set , validation set , deep learning-based detection method , key hyperparameters and their candidate values , the population size N, and the maximum number of iterations T. Ensure: The location of rabbit which denotes the optimal solution.
|
Let denote a rating vector of user u where denotes the number of items in a recommender system. Let denote the training set where denotes the number of users in the training set. Let denote the validation set where denotes the number of users in the validation set. Let denote a deep learning-based detection method which has a certain number of key hyperparameters. Let denote the dth key hyperparameter with its candidate values derived from . Therefore, a solution X for a can be denoted as where D denotes the number of key hyperparameters and is a candidate value of . Taking the DL-DRA-HHO method in our experiments as an example, D is set to 4 as shown in Table 5. and are set to size of the square, activation function, batch size, and epoch, respectively. The candidate values of and are integers between [20, 100], elements in set {linear, sigmoid, tanh, elu, relu, and selu}, integers between [8, 128], and integers between [3, 30], respectively. Based on these descriptions and the improved HHO algorithm, we propose a hyperparameter automatic optimization algorithm as described in Algorithm 2 to optimize key hyperparameters for the deep learning-based detection methods.

Table 5.
Key hyperparameters and their search spaces based on DL-DRA.
In Algorithm 2, line 1 performs the data type conversion to meet the requirements of HHO algorithm. Lines 2 and 3 initialize the population and the best solution. Line 4 sets the maximum number of iterations. Line 5 calculates the fitness for each solution. F-measure is used as the fitness in this paper. Line 6 filters the optimal solution after each iteration. Lines 7 to 9 add an early stop condition to improve the original HHO algorithm. If the maximum fitness has not changed for m consecutive iterations, it indicates that the current optimal solution has a certain stability. The iteration will be terminated. Moreover, m is set to 5 in our experiments. Lines 10 to 28 execute the exploration and exploitation operations to find the optimal solution. Line 30 returns the search result. In Algorithm 2, line 1 performs the data type conversion to meet the requirements of HHO algorithm. After this step, both discrete and continuous key hyperparameters can be optimized by the HHO algorithm. Lines 2 and 3 initialize the population and the best solution. The algorithm randomly generates initial positions. The number of initial positions is the same as the size of population. Line 4 sets the maximum number of iterations. Line 5 calculates the fitness for each solution. F-measure is the weighted adjusted average of precision and recall, which can comprehensively reflect the classification performance of the detection model. Therefore, F-measure is used as the fitness for each solution in this paper. Line 6 filters the optimal solution after each iteration. The best solution in the current population will be found in this step. Lines 7 to 9 add an early stop condition to improve the original HHO algorithm. If the maximum fitness has not changed for m consecutive iterations, it indicates that the current optimal solution has a certain stability. The iteration will be terminated. Furthermore, m is set to 5 in our experiments. Lines 10 to 28 execute the exploration and exploitation operations to find the optimal solution. In the phase of exploration, the random factors , , , , and q in Equation (1) can effectively expand the scope of the global search. Meanwhile, the search algorithm can avoid falling into the local optimal solution in the early stage of the algorithm. In the phase of exploitation, the algorithm searches for the local optimal solution through four attack strategies as shown in Equations (4), (6), (10) and (11). Line 30 returns the search result. After this step, the optimal solution is obtained.
Based on the optimal key hyperparameters obtained from Algorithm 2, we propose Algorithm 3 to detect the recommendation attack.
As shown in Algorithm 3, user profiles in the set of detection result are classified into two categories: genuine profile or attack profile.
| Algorithm 3 Recommendation attack detection algorithm with the optimized key hyperparameters. |
Require: training set , test set , deep learning-based detection method , and the optimal key hyperparameters . Ensure: detection result set .
|
4. Experiments and Analysis
The details of settings for the experiments are first described in this section. Secondly, we show the key hyperparameters and their optimization process. Then, we set the comparative experiments. Finally, we show the results of the comparative experiments and discuss them.
4.1. Experimental Data and Settings
MovieLens 10 M [39] and Amazon [8] used in our experiments are two benchmark datasets in the fields of CRS. MovieLens 10 M contains only one type of user profiles, i.e., genuine profiles. Attack profiles are constructed by attack models and injected into this dataset for training and testing. We can build test sets with multiple attack combinations to verify the detection performance of the detection methods. Amazon dataset contains both types of user profiles. We can use this dataset to verify the detection performance in the real-world scenario.
MovieLens 10 M consists of 71,567 user profiles and 10,681 movies. The number of ratings which are rated by users on the items is 10,000,054. Numbers and types of user profiles used in the training set based on this dataset are shown in Table 1. Three common attack models are used to construct various attack profiles. The genuine profiles are selected from the dataset in a random manner.
Table 1.
Numbers and types of user profiles which constitute the training set for MovieLens 10 M dataset.
Except for the number of samples, the validation set is constructed in the same way as the training set as described in Table 2.
Table 2.
Numbers and types of user profiles which constitute the validation set for MovieLens 10 M.
To verify the detection performance of the detection methods, we establish a large number of test sets in our experiments. Each test set contains 1000 genuine profiles which are randomly selected from the remaining MovieLens 10 M dataset. Three common attack models with various attack sizes and filler sizes are used to generate attack profiles as shown in Section 4.5.
Users whose number of ratings is less than 5 are removed from the Amazon dataset. The remaining samples are used to build the training, validation, and test sets for our experiments as shown in Table 3.
Table 3.
Numbers and types of user profiles used in the experimental sets for Amazon dataset.
In our experiments, recall, precision, and AUC [40,41] which are three standard metrics are used to evaluate the detection results. F-measure [40,41] is used as the fitness in Algorithm 2.
4.2. Deep Learning-Based Detection Methods and Their Key Hyperparameters
CNN-SAD [23] and DL-DRA [25] are two representative deep learning-based detection methods. They consist of one layer and two layers of convolutional neural network, respectively. Both have excellent performance when detecting various types of recommendation attack. The reason for choosing these two methods to improve in our experiments are shown as follows. The key hyperparameters are manually and clearly analyzed and determined in both methods. These operations provide a basis for our experiments to select which key hyperparameters to optimize automatically.
In CNN-SAD algorithm, a rating vector is reshaped into a rectangle as the input of the network. The length of the rectangle denotes the number of items in a recommender system. As a key hyperparameter, the size, i.e., the long side and the short side, of the rectangle is confirmed by manual analysis. Since the long side can be determined by the short side for a rectangle with a fixed perimeter, the short side is selected as one key hyperparameter for the automatic optimization in our experiments.
In DL-DRA algorithm, the rating vector is resized into a square as the input of the network using the bicubic interpolation technique. The size of the square is a key hyperparameter as shown in the DL-DRA algorithm. In our experiments, we select the size of the square as one key hyperparameter for the automatic optimization.
In both CNN-SAD and DL-DRA algorithms, the activation function, batch size, and epochs are three key hyperparameters which are manually optimized. The settings and combinations of these hyperparameters can greatly affect the detection performance of the detection algorithms. Therefore, we also set them as key hyperparameters for the automatic optimization in our experiments.
Based on above discussions, key hyperparameters with their search spaces used in our experiments for automatic optimization are shown in Table 4 and Table 5.
Table 4.
Key hyperparameters and their search spaces based on CNN-SAD.
4.3. Automatic Optimization Process of Key Hyperparameters
We use CNN-SAD-HHO to denote the CNN-SAD method after being improved by the proposed hyperparameter automatic optimization algorithm. That is, CNN-SAD method is used as the of Algorithm 2 for automatically optimizing the key hyperparameters. Similarly, we use DL-DRA-HHO to denote the DL-DRA method after being improved by Algorithm 2.
Except for the key hyperparameters described in Section 4.2, other settings in CNN-SAD-HHO and DL-DRA-HHO are the same as these in the CNN-SAD and DL-DRA, respectively. In Algorithm 2, N is set to 30 and T is set to 500 which are the default settings of HHO algorithm.
The automatic optimization process of key hyperparameters for CNN-SAD-HHO and DL-DRA-HHO when performing Algorithm 2, which uses the training and validation sets of MovieLens 10 M dataset as its input, are shown in Figure 2 and Figure 3, respectively.
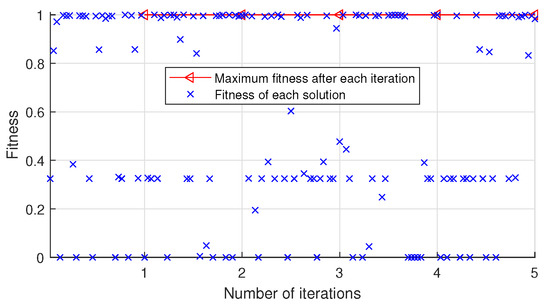
Figure 2.
Automatic optimization process of key hyperparameters for CNN-SAD-HHO on MovieLens 10 M dataset.
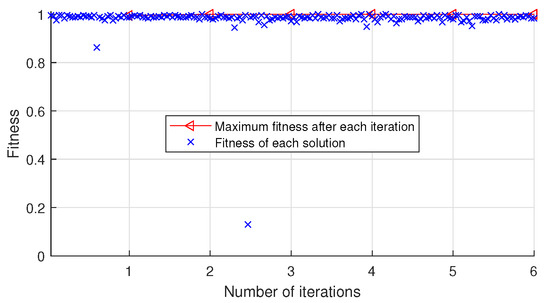
Figure 3.
Automatic optimization process of key hyperparameters for DL-DRA-HHO on MovieLens 10 M dataset.
As shown in Figure 2, we record the fitness of all solutions in the automatic optimization process. After the iteration is completed, the optimal solution corresponding to the maximum fitness is (97, linear, 39,12). As shown in Figure 3, after the iteration is completed, the optimal solution corresponding to the maximum fitness is (20, linear, 8, 3).
The automatic optimization process of key hyperparameters for CNN-SAD-HHO and DL-DRA-HHO when performing Algorithm 2, which uses the training and validation sets of Amazon dataset as its input, are shown in Figure 4 and Figure 5, respectively.
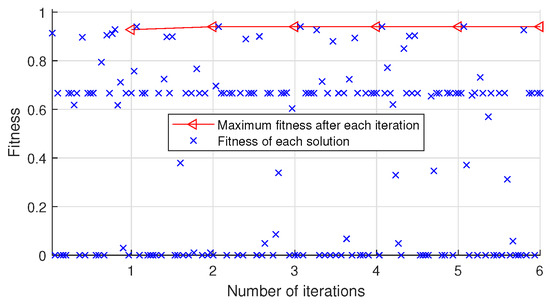
Figure 4.
Automatic optimization process of key hyperparameters for CNN-SAD-HHO on Amazon dataset.
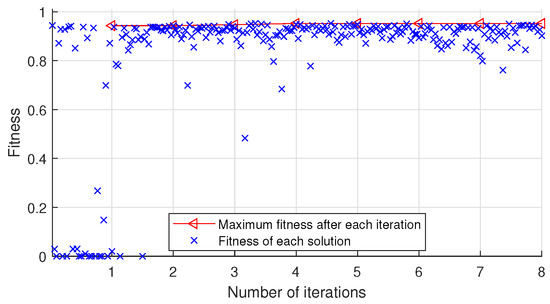
Figure 5.
Automatic optimization process of key hyperparameters for DL-DRA-HHO on Amazon dataset.
As shown in Figure 4, after the iteration is completed, the optimal solution corresponding to the maximum fitness is (84, tanh, 87, 25). As shown in Figure 5, after the iteration is completed, the optimal solution corresponding to the maximum fitness is (84, elu, 14, 15).
As shown in Figure 2 and Figure 4, CNN-SAD method is sensitive to the key hyperparameters. The fitness fluctuates greatly with the change of key hyperparameters. Compared with CNN-SAD, DL-DRA method has better robustness as shown in Figure 3 and Figure 5. The fitness of DL-DRA tends to be more stable. The reason for this phenomenon may be that DL-DRA method, which is an improvement of CNN-SAD method, uses more convolution and pooling layers to construct more reasonable neural network for the detection of recommendation attack.
Although, the maximum number of iterations T is set to 500 in our experiments, only 5, 6, 6, and 8 iterations are performed as shown in Figure 2, Figure 3, Figure 4 and Figure 5. The number of iterations is much less than 500. This is due to the proposed early stop condition set in line 7 of Algorithm 2. When the fitness tends to be stable, the iteration stops. The results indicate that the optimization algorithm used in this paper is very successful and effective, and can quickly search the optimal solution.
4.4. Settings of Comparative Experiments
Two groups of comparative experiments are used to verify the effectiveness of the detection methods.
- (1)
- In the first group, we compare the original methods CNN-SAD [23] and DL-DRA [25] with the improved approaches CNN-SAD-HHO and DL-DRA-HHO.
- The CNN-SAD and DL-DRA methods employ manual analysis to determine the key hyperparameters. During the manual analysis, one key hyperparameter is used as a variable while other key hyperparameters are fixed. The detection results on the validation set are observed manually. The candidate solution corresponding to the best detection performance is judged as the optimal solution.
- CNN-SAD-HHO and DL-DRA-HHO approaches employ Algorithm 2 to automatically optimize the key hyperparameters. With the output of Algorithm 2, the Algorithm 3 is used to generate classifiers and detect the test sets.
- (2)
- In the second group, we compare the following representative detection methods with the improved approaches CNN-SAD-HHO and DL-DRA-HHO.
- PCA-VarSelect [10]: This is one of the representative works in unsupervised detection methods. In this method, the PCA technique is used to compute the covariance among users for the detection.
- SSADR-CoF [18]: This is a representative semi-supervised detection method. The ensemble learning is used to reduce the dependence of the training model on labeled user profiles.
- CNN-LSTM [24]: This is a hybrid supervised detection method based on two types of deep neural networks CNN and LSTM.
4.5. Experimental Results and Analysis
In this section, we describe and analyze the experimental results of the two groups of comparative experiments.
4.5.1. Comparison with Original Methods
The performance comparison of multiple detection methods when detecting the test sets injected with random, average, and bandwagon attack on Movielens 10 M dataset are shown in Figure 6, Figure 7 and Figure 8, respectively. As shown in Figure 6, Figure 7 and Figure 8, the four detection methods have good detection performance overall. Through further observation, it can be found that the DL-DRA, CNN-SAD-HHO, and DL-DRA-HHO methods maintain high detection performance on most of the test sets. The strong learning and recognition ability of deep learning are well developed and demonstrated in these methods. The comparison results show the success of the proposed approach.
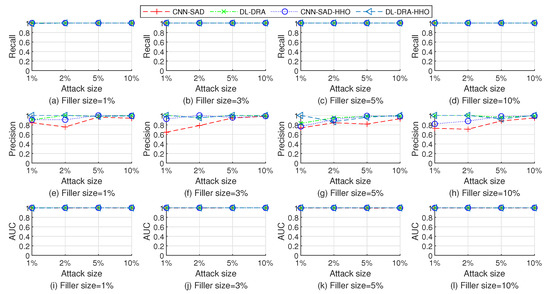
Figure 6.
Performance comparison of the four detection methods when detecting the test sets injected with random attack on Movielens 10 M dataset.
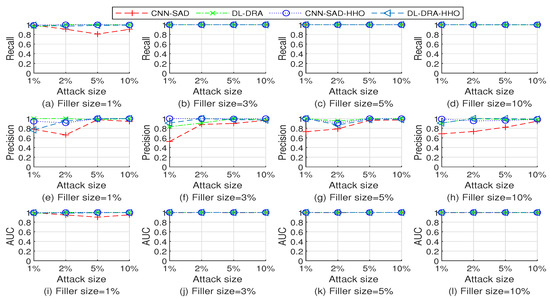
Figure 7.
Performance comparison of the four detection methods when detecting the test sets injected with average attack on Movielens 10 M dataset.
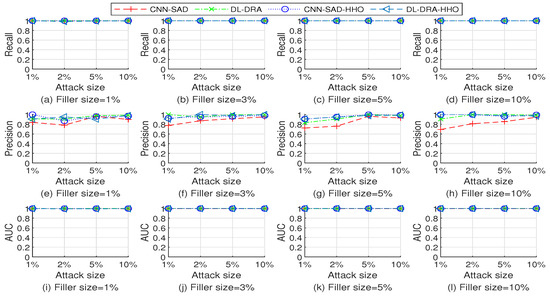
Figure 8.
Performance comparison of the four detection methods when detecting the test sets injected with bandwagon attack on Movielens 10 M dataset.
In terms of recall and AUC, CNN-SAD and CNN-SAD-HHO have similar performance. However, in terms of precision the performance of the improved approach CNN-SAD-HHO is better than that of the original method CNN-SAD. This is because although both methods can effectively identify attack profiles, more genuine profiles are identified as attack profiles in the original method.
The performance comparison of multiple detection methods when detecting the test set on Amazon dataset are shown in Table 6.
Table 6.
Performance comparison of the four detection methods when detecting the test set on Amazon dataset.
As shown in Table 6, most detection results of the improved methods are better than those of the original methods on the dataset of real scene. The DL-DRA-HHO method has the best detection performance. The experiments show the success of the proposed approach.
To illustrate the cost of time, we record the training time of the multiple detection methods with the key hyperparameter optimization process as shown in Table 7. The computer configuration for running the experiments is as follows: NVIDIA GeForce RTX2080, 32 G RAM, Win 10 OS. Python 3.7 (https://www.python.org/ (accessed on 15 July 2022)) and Tensorflow 2.4 (https://www.tensorflow.org/ (accessed on 15 July 2022)) are employed for coding.
Table 7.
Training time (measured in minutes) of the multiple detection methods with the key hyperparameter optimization process.
As shown in Table 7, CNN-SAD method has the longest training time. DL-DRA method has the shortest training time. The training time of the proposed methods CNN-SAD-HHO and DL-DRA-HHO is at the middle level.
4.5.2. Comparison with Representative Methods
The performance comparison of multiple detection methods when detecting the test sets injected with random, average, and bandwagon attack on Movielens 10 M dataset are shown in Figure 9, Figure 10 and Figure 11, respectively.
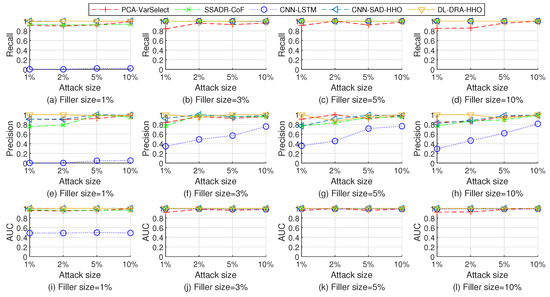
Figure 9.
Performance comparison of the five detection methods when detecting the test sets injected with random attack on Movielens 10 M dataset.
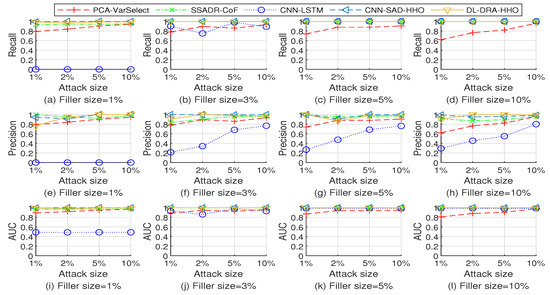
Figure 10.
Performance comparison of the five detection methods when detecting the test sets injected with average attack on Movielens 10 M dataset.
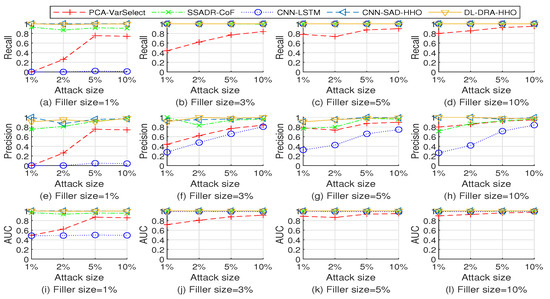
Figure 11.
Performance comparison of the five detection methods when detecting the test sets injected with bandwagon attack on Movielens 10 M dataset.
As shown in Figure 9, Figure 10 and Figure 11, the PCA-VarSelect has low performance when detecting the bandwagon attack. The possible reason is that there are many common ratings, which correspond to the popular items, between attack profiles and genuine profiles. The principal component analysis technology determines some of the attack profiles as principal components. Therefore, the performance of PCA-VarSelect decreases.
The CNN-LSTM method has poor detection performance for small filler sizes. The reason for this phenomenon might be that attack profiles with small filler sizes contain a few ratings. The detection method CNN-LSTM cannot effectively capture enough knowledge for recognizing the patterns of attack profiles.
The SSADR-CoF, CNN-SAD-HHO, and DL-DRA-HHO have good detection performance for most of the test sets. The experimental results fully show the effectiveness of the proposed approach.
The detection results of PCA-VarSelect, SSADR-CoF, CNN-LSTM, CNN-SAD-HHO, and DL-DRA-HHO on the test set of Amazon dataset are shown in Table 8.
Table 8.
Performance comparison of the five detection methods when detecting the test set on Amazon dataset.
As shown in Table 8, the performance of PCA-VarSelect decreases greatly on the real dataset. The reason for this phenomenon might be that the real dataset usually contains multiple groups of attack profiles. The groups of attack profiles interfere with the principal component analysis and reduce the detection performance.
The methods SSADR-CoF, CNN-LSTM, CNN-SAD-HHO, and DL-DRA-HHO have certain detection performance on the real dataset. Benefit from ensemble learning, the SSADR-CoF method has the largest recall. The improved method DL-DRA-HHO has the largest precision and AUC. Note that, the recall of DL-DRA-HHO is only 0.01 less than that of SSADR-CoF. The comparison results fully illustrate the success of the proposed approach.
As a nonparametric test method, Friedman test uses rank to determine whether there is significant difference between multiple population distributions [42]. In our experiments, we use this method to measure the stability of the proposed detection method. We independently run the DL-DRA-HHO method with the Amazon dataset in the real scene for 30 times. Meanwhile, the detection results of recall, precision, and AUC for each time are recorded. The null hypothesis is that there is no significant difference among the 30 detection results. The alternate hypothesis is that there is significant difference among the 30 detection results. One group of each detection result can be described as where t denotes the tth detection result and t is an integer between [1, 30]. The p-value of Friedman test for all the 30 groups is 0.08 which is larger than 0.05. Therefore, we can accept the null hypothesis. The test results verify the stability of the proposed approach.
4.6. Discussions
The original HHO algorithm can only search and optimize on the continuous numerical intervals. However, in practical application many variables are belong to the discrete type, such as the activation function in our experiments. Therefore, the original HHO algorithm has great limitations in the application scope. In this paper, a type conversion algorithm is proposed to convert the variables from discrete to continuous according to the uniform distribution theory. As a result, the HHO algorithm can deal with the discrete and continuous search space at the same time. The proposed Algorithm 1 effectively expands the application scope of HHO algorithm.
As shown in Figure 6, Figure 7 and Figure 8 and Table 6, the improved detection methods outperform the original detection methods on many test sets. This is because the proposed automatic optimization algorithm used in the improved methods can find more appropriate key hyperparameters for the detection. During the manual analysis of original detection methods, one of the key hyperparameters is set as a variable while others are fixed. Therefore, only one optimal key hyperparameter is found each time. Finally, the single found key hyperparameters are simply combined into a solution. The problem with this method of determining key hyperparameters is that the simple combination of key hyperparameters may not be the optimal solution. Being different from the above manual analysis, the proposed automatic optimization algorithm directly takes the combination of key hyperparameters as the optimization goal. Therefore, the improved method can find more appropriate solution for the detection.
Generally, there are many key hyperparameters in the deep learning-based detection methods. Which key hyperparameters are selected from them for the automatic optimization is a topic worthy of study. This is where our work needs to be further explored.
5. Conclusions and Future Work
In this paper, an approach based on the HHO algorithm is proposed for improving the deep learning-based recommendation attack detection methods. A hyperparameter type conversion algorithm is proposed for converting the discrete key hyperparameters to continuous type according to the uniform distribution theory. With this proposed algorithm, the application scope of HHO algorithm is extended from only continuous type to both continuous type and discrete type. An early stop condition is proposed by using the detection stability for improving the original HHO algorithm. With this condition, the optimization iterations of the improved HHO algorithm are greatly reduced. A hyperparameter automatic optimization algorithm is proposed based on the improved HHO algorithm to automatically optimize the key hyperparameters for the deep learning-based detection methods. This algorithm reduces the dependence of deep learning-based detection methods on the domain experts and their experience when optimizing the key hyperparameters. A detection algorithm is proposed based on the deep learning-based detection method and the optimized key hyperparameters. This algorithm can successfully detect the recommendation attack. Experiments on two benchmark datasets demonstrate that the improved deep learning-based detection methods have good detection performance. On some test sets, the improved detection methods are better than the original detection methods. On most of the test sets, the improved detection methods are the same as or better than the representative methods.
In future work, it is worth studying how to introduce more intelligent optimization algorithms into the deep learning-based detection methods.
Author Contributions
Conceptualization, Q.Z. and L.D.; methodology, Q.Z.; software, C.H.; validation, Q.Z.; formal analysis, C.H.; investigation, L.D.; resources, C.H.; data curation, Q.Z.; writing—original draft preparation, Q.Z.; writing—review and editing, Q.Z.; visualization, C.H.; supervision, L.D.; project administration, Q.Z.; funding acquisition, Q.Z. All authors have read and agreed to the published version of the manuscript.
Funding
This research was funded by the Shandong Provincial Natural Science Foundation of China under grant number ZR2020QF044.
Institutional Review Board Statement
Not applicable.
Informed Consent Statement
Not applicable.
Data Availability Statement
The datasets used in the paper are benchmark and public datasets which can be easily downloaded from the Internet.
Conflicts of Interest
The authors declare no conflict of interest.
References
- Bobadilla, J.; Dueñas, J.; Gutiérrez, A.; Ortega, F. Deep variational embedding representation on neural collaborative filtering recommender systems. Appl. Sci. 2022, 12, 4168. [Google Scholar] [CrossRef]
- Lam, S.K.; Riedl, J. Shilling recommender systems for fun and profit. In Proceedings of the 13th International Conference on World Wide Web, New York, NY, USA, 17–20 May 2004; pp. 393–402. [Google Scholar] [CrossRef]
- Zhang, S.; Ouyang, Y.; Ford, J.; Makedon, F. Analysis of a low-dimensional linear model under recommendation attacks. In Proceedings of the 29th Annual International ACM SIGIR Conference on Research and Development in Information, Seattle, WA, USA, 6–11 August 2006; pp. 517–524. [Google Scholar] [CrossRef]
- Rezaimehr, F.; Dadkhah, C. A survey of attack detection approaches in collaborative filtering recommender systems. Artif. Intell. Rev. 2021, 54, 2011–2066. [Google Scholar] [CrossRef]
- Mahony, M.O.; Hurley, N.; Kushmerick, N.; Silvestre, G. Collaborative recommendation: A robustness analysis. ACM Trans. Internet Technol. 2004, 4, 344–377. [Google Scholar] [CrossRef]
- Burke, R.; Mobasher, B.; Zabicki, R.; Bhaumik, R. Identifying attack models for secure recommendation. In Beyond Personalization: A Workshop on the Next Generation of Recommender Systems; ACM: New York, NY, USA, 2005; pp. 347–361. Available online: https://www.semanticscholar.org/paper/Identifying-Attack-Models-for-Secure-Recommendation-Burke-Mobasher/68e3c286a65321620f74a12bbdf55c682b0983e9 (accessed on 15 July 2022).
- Barbieri, J.; Alvim, L.G.M.; Braida, F.; Zimbrão, G. Simulating real profiles for shilling attacks: A generative approach. Knowl.-Based Syst. 2021, 230, 107390. [Google Scholar] [CrossRef]
- Xu, C.; Zhang, J.; Chang, K.; Long, C. Uncovering collusive spammers in Chinese review websites. In Proceedings of the 22nd ACM International Conference on Information & Knowledge Management, San Francisco, CA, USA, 27 October–1 November 2013; pp. 979–988. [Google Scholar] [CrossRef]
- Chirita, P.A.; Nejdl, W.; Zamfir, C. Preventing shilling attacks in online recommender systems. In Proceedings of the 7th Annual ACM International Workshop on Web Information and Data Management, Bremen, Germany, 4 November 2005; pp. 67–74. [Google Scholar] [CrossRef]
- Mehta, B.; Hofmann, T.; Fankhauser, P. Lies and propaganda: Detecting spam users in collaborative filtering. In Proceedings of the 12th International Conference on Intelligent User Interfaces, Honolulu, HI, USA, 28–31 January 2007; pp. 14–21. [Google Scholar] [CrossRef]
- Chung, C.Y.; Hsu, P.Y.; Huang, S.H. βP: A novel approach to filter out malicious rating profiles from recommender systems. Decis. Support Syst. 2013, 55, 314–325. [Google Scholar] [CrossRef]
- Lee, J.S.; Zhu, D. Shilling attack detection-A new approach for a trustworthy recommender system. INFORMS J. Comput. 2012, 24, 117–131. [Google Scholar] [CrossRef]
- Yang, Z.; Sun, Q.; Zhang, Y.; Zhang, B. Uncovering anomalous rating behaviors for rating systems. Neurocomputing 2018, 308, 205–226. [Google Scholar] [CrossRef]
- Zhang, Z.; Zhang, Z.; Zhang, P.; Wang, S. UD-HMM: An unsupervised method for shilling attack detection based on hidden markov model and hierarchical clustering. Knowl.-Based Syst. 2018, 148, 146–166. [Google Scholar] [CrossRef]
- Cai, H.; Zhang, F. BS-SC: An unsupervised approach for detecting shilling profiles in collaborative recommender systems. IEEE Trans. Knowl. Data Eng. 2021, 33, 1375–1388. [Google Scholar] [CrossRef]
- Zhang, F.; Wang, S. Detecting group shilling attacks in online recommender systems based on bisecting k-means clustering. IEEE Trans. Comput. Soc. Syst. 2020, 7, 1189–1199. [Google Scholar] [CrossRef]
- Wu, Z.; Wu, J.; Cao, J.; Tao, D. HySAD: A semi-supervised hybrid shilling attack detector for trustworthy product recommendation. In Proceedings of the 18th ACM SIGKDD International Conference on Knowledge Discovery and Data Mining, Beijing, China, 12–16 August 2012; pp. 985–993. [Google Scholar] [CrossRef]
- Zhou, Q.; Duan, L. Semi-supervised recommendation attack detection based on Co-Forest. Comput. Secur. 2021, 109, 102390. [Google Scholar] [CrossRef]
- Williams, C.A.; Mobasher, B.; Burke, R. Defending recommender systems: Detection of profile injection attacks. Serv. Oriented Comput. Appl. 2007, 1, 157–170. [Google Scholar] [CrossRef]
- Yang, Z.; Xu, L.; Cai, Z. Re-scale adaboost for attack detection in collaborative filtering recommender systems. Knowl.-Based Syst. 2016, 100, 74–88. [Google Scholar] [CrossRef]
- Zhou, W.; Wen, J.; Xiong, Q.; Gao, M.; Zeng, J. SVM-TIA a shilling attack detection method based on SVM and target item analysis in recommender systems. Neurocomputing 2016, 210, 197–205. [Google Scholar] [CrossRef]
- Xu, Y.; Zhang, F. Detecting shilling attacks in social recommender systems based on time series analysis and trust features. Knowl.-Based Syst. 2019, 178, 25–47. [Google Scholar] [CrossRef]
- Tong, C.; Yin, X.; Li, J.; Zhu, T.; Lv, R.; Sun, L.; Rodrigues, J. A shilling attack detector based on convolutional neural network for collaborative recommender system in social aware network. Comput. J. 2018, 61, 949–958. [Google Scholar] [CrossRef]
- Ebrahimian, M.; Kashef, R. Detecting shilling attacks using hybrid deep learning models. Symmetry 2020, 12, 1805. [Google Scholar] [CrossRef]
- Zhou, Q.; Wu, J.; Duan, L. Recommendation attack detection based on deep learning. J. Inf. Secur. Appl. 2020, 52, 102493. [Google Scholar] [CrossRef]
- Li, H.; Gao, M.; Zhou, F.; Wang, Y.; Fan, Q.; Yang, L. Fusing hypergraph spectral features for shilling attack detection. J. Inf. Secur. Appl. 2021, 63, 103051. [Google Scholar] [CrossRef]
- Wang, S.; Zhang, P.; Wang, H.; Chao, J.; Zhang, F. A shilling group detection framework based on deep learning techniques. Secur. Commun. Netw. 2022, 2022, 2323132. [Google Scholar] [CrossRef]
- Thakkar, A.; Lohiya, R. Role of swarm and evolutionary algorithms for intrusion detection system: A survey. Swarm Evol. Comput. 2020, 53, 100631. [Google Scholar] [CrossRef]
- Nasir, M.H.; Khan, S.A.; Khan, M.M.; Fatima, M. Swarm intelligence inspired intrusion detection systems—A systematic literature review. Comput. Netw. 2022, 205, 108708. [Google Scholar] [CrossRef]
- Nayak, J.; Vakula, K.; Dinesh, P.; Naik, B. Significance of particle swarm optimization in intrusion detection: Crossing a decade. Proceedings of International Conference on Application of Robotics in Industry Using Advanced Mechanisms, Bhubaneswar, India, 16–17 August 2019; pp. 187–202. [Google Scholar] [CrossRef]
- Binitha, S.; Siva Sathya, S. A survey of bio inspired optimization algorithms. Int. J. Soft Comput. Eng. 2012, 2, 137–151. Available online: https://www.oalib.com/paper/2760442 (accessed on 15 July 2022).
- Karami, A.; Guerrero-Zapata, M. A fuzzy anomaly detection system based on hybrid PSO-Kmeans algorithm in content-centric networks. Neurocomputing 2015, 149, 1253–1269. [Google Scholar] [CrossRef]
- Rajeswari, L.P.; Kannan, A.; Baskaran, R. An escalated approach to ant colony clustering algorithm for intrusion detection system. In Proceedings of the International Conference on Distributed Computing and Networking, Kolkata, India, 5–8 January 2008; pp. 393–400. [Google Scholar] [CrossRef]
- Heidari, A.A.; Mirjalili, S.; Faris, H.; Aljarah, I.; Mafarja, M.; Chen, H. Harris hawks optimization: Algorithm and applications. Future Gener. Comput. Syst. 2019, 97, 849–872. [Google Scholar] [CrossRef]
- Alabool, H.M.; Alarabiat, D.; Abualigah, L.; Heidari, A.A. Harris hawks optimization: A comprehensive review of recent variants and applications. Neural Comput. Appl. 2021, 33, 8939–8980. [Google Scholar] [CrossRef]
- Dekking, F.M.; Kraaikamp, C.K.; Lopuhaa, H.P.; Meester, L.E. A Modern Introduction to Probability and Statistics: Understanding Why and How; Springer: London, UK, 2005; pp. 60–61. [Google Scholar]
- Kim, D.G.; Choi, J.Y. Optimization of design parameters in LSTM model for predictive maintenance. Appl. Sci. 2021, 11, 6450. [Google Scholar] [CrossRef]
- Chen, J.F.; Do, Q.H.; Hsieh, H.N. Training artificial neural networks by a hybrid PSO-CS algorithm. Algorithms 2015, 8, 292–308. [Google Scholar] [CrossRef]
- Harper, F.M.; Konstan, J.A. The MovieLens datasets: History and context. ACM Trans. Interact. Intell. Syst. 2015, 5, 1–19. [Google Scholar] [CrossRef]
- Fawcett, T. An introduction to ROC analysis. Pattern Recognit. Lett. 2006, 27, 861–874. [Google Scholar] [CrossRef]
- Si, M.; Li, Q. Shilling attacks against collaborative recommender systems: A review. Artif. Intell. Rev. 2020, 53, 291–319. [Google Scholar] [CrossRef]
- Friedman, M. The use of ranks to avoid the assumption of normality implicit in the analysis of variance. J. Am. Stat. Assoc. 1937, 32, 675–701. [Google Scholar] [CrossRef]
Publisher’s Note: MDPI stays neutral with regard to jurisdictional claims in published maps and institutional affiliations. |
© 2022 by the authors. Licensee MDPI, Basel, Switzerland. This article is an open access article distributed under the terms and conditions of the Creative Commons Attribution (CC BY) license (https://creativecommons.org/licenses/by/4.0/).