Article

Spectroscopic and Molecular Docking Analysis of π-Acceptor Complexes with the Drug Barbital

by
Abdulhakeem S. Alamri
1,2,
Majid Alhomrani
1,2,
Walaa F. Alsanie
1,2,
Hussain Alyami
3,
Sonam Shakya
4,
Hamza Habeeballah
5,
Osama Abdulaziz
1,
Abdulwahab Alamri
6,
Heba A. Alkhatabi
7,8,9,
Raed I. Felimban
7,10,
Abdulhameed Abdullah Alhabeeb
11,
Moamen S. Refat
12,* and
Ahmed Gaber
2,13,*
1
Department of Clinical Laboratories Sciences, The Faculty of Applied Medical Sciences, Taif University, Taif 21944, Saudi Arabia
2
Centre of Biomedical Sciences Research (CBSR), Deanship of Scientific Research, Taif University, Taif 21944, Saudi Arabia
3
College of Medicine, Taif University, Taif 21944, Saudi Arabia
4
Department of Chemistry, Faculty of Science, Aligarh Muslim University, Aligarh 202002, India
5
Department of Medical Laboratory Technology, Faculty of Applied Medical Sciences in Rabigh, King Abdulaziz University, Jeddah 21589, Saudi Arabia
6
Department of Pharmacology and Toxicology, College of Pharmacy, University of Hail, Hail 55211, Saudi Arabia
7
Department of Medical Laboratory Sciences, Faculty of Applied Medical Sciences, King Abdulaziz University, Jeddah 21589, Saudi Arabia
8
Center of Excellence in Genomic Medicine Research (CEGMR), King Abdulaziz University, Jeddah 21589, Saudi Arabia
9
King Fahd Medical Research Centre, Hematology Research Unit, King Abdulaziz University, Jeddah 21589, Saudi Arabia
10
Center of Innovation in Personalized Medicine (CIPM), 3D Bioprinting Unit, King Abdulaziz University, Jeddah 21589, Saudi Arabia
11
National Centre for Mental Health Promotion, Riyadh 11525, Saudi Arabia
12
Department of Chemistry, College of Science, Taif University, Taif 21944, Saudi Arabia
13
Department of Biology, College of Science, Taif University, Taif 21944, Saudi Arabia
*
Authors to whom correspondence should be addressed.
Appl. Sci. 2022, 12(19), 10130; https://doi.org/10.3390/app121910130
Submission received: 13 August 2022 / Revised: 3 October 2022 / Accepted: 5 October 2022 / Published: 9 October 2022

Abstract

:
The drug barbital (Bar) has a strong sedative–hypnotic effect. The intermolecular charge transfer compounds associated with the chemical reactions between Bar and some π acceptors, such as 2,6-dibromoquinone-4-chloroimide (DBQ), tetracyanoquinodimethane (TCNQ), chloranil (CHL), and chloranilic acid (CLA), have been synthesized and isolated in solid state. The synthesized products have the molecular formulas (Bar–DBQ), (Bar–TCNQ), (Bar–CHL), and (Bar–CLA) with 1:1 stoichiometry based on Raman, IR, TG, 1H NMR, XRD, SEM, and UV-visible analysis techniques. Additionally, the comparative analysis of molecular docking between the donor reactant moiety, Bar, and its four CT complexes was conducted using two neurotransmitter receptors (dopamine and serotonin). The docking results obtained from AutoDockVina software were investigated by a molecular dynamics simulation technique with 100ns run. The molecular mechanisms behind receptor–ligand interactions were also looked into. The DFT computations were conducted using theory at the B3LYP/6-311G++ level. In addition, the HOMO LUMO electronic energy gap and the CT complex’s optimal geometry and molecule electrostatic potential were examined.

1. Introduction

Owing to its importance in pharmacology, medicine, and biology, the chemistry of barbital (Bar, also known as barbiturates) has received a lot of interest [1,2]. A number of barbiturates are important medically due to their pharmacological properties, which include their anesthetic, sedative, anticonvulsant, and hypnotic activities. They are also used as central nervous system depressants and sedative-hypnotics [3,4,5].
The chemistry of charge-transfer (CT) reactions has drawn a lot of attention from biologists and pharmacists. This interest is a result of the products’ potential uses in a variety of industries and sectors, including biological and chemical ones. Computed program reactions have also been used to develop quick, dependable, efficient, and straightforward methods for the detection, identification, and quantification of medicines in the pure and psychoactive forms [6,7,8,9,10,11,12,13,14,15,16,17,18].
The crystallographic properties, thermal stability, solvent effects, temperature, concentration of reagent, and other properties of CT complexes have been discussed and described in several reports [19,20,21,22,23,24]. Previously, we have studied the CT interactions of other medications with other receptors, including fluoxetine, haloperidol, trazodone, phenytoin, risperidone, and metoclopramide, in order to better understand the chemistry of diverse drug CT compounds and to gain insight into how these medications behave when donated to a variety of acceptors [25,26,27].
We focused on two types of important neurotransmitter in the brain, serotonin and dopamine, because of their crucial involvement in a range of physical processes, including mood, sleep, and general body health. As a result, we undertook this study to investigate whether the drug barbital’s ability to bind to serotonin and/or dopamine would be enhanced by the use of π-acceptor complexes. We then used the molecular docking technique with AutoDockVina software to theoretically analyze the interactions between all the produced ligands and two neurotransmitters (serotonin and dopamine). The binding energy, interpolated charge, SAS, ionizability, hydrophobic interactions, hydrogen bonds, and aromatic surfaces along the contact sites were also investigated.
To better understand receptor–ligand interactions, the molecular dynamics simulation was run at 100 ns at constant temperature (300 K) and pressure (1.0 bar). To compare the complexes’ dynamic properties, solvent-accessible surface area, structural stability, residue flexibility, hydrogen bond interactions, and structure compactness were examined. The optimized geometry for the CT complex (Bar–CLA) was obtained through B-3LYP/ 6-311G++ density functional theory calculations. Vital parameters like structural, spectroscopic, and chemical properties of (Bar–CLA) were calculated.

2. Materials and Methods

2.1. Compounds

Bar pure drug (98%) was purchased from the Fluka chemical company (Geel, Belgium). The organic π acceptors—DBQ (97%), TCNQ (98%), CHL (99%), and CLA (98%)—were obtained from Sigma-Aldrich (Darmstadt, Germany). The Merck (Darmstadt, Germany)-provided solvents were utilized directly without filtration.

2.2. Preparation of the CT Complexes

The four solid CT complexes were obtained through a Bar reaction with the four acceptors DBQ, TCNQ, CHL, and CLA, by heating them for 15 min in 25 mL methanol solutions at 60 °C. This solution was then magnetically stirred continuously for 45 min. The final product was precipitated by letting the solution remain at room temperature for 24 h in a water bath. All precipitates were collected, filtered, and thoroughly washed with the same solvent. They were then allowed to dry in vacuum with CaCl2 for 60 h. The final products were colored dark red, for DBQ, green (TCNG), yellow (CHL), and light reddish orange (CLA).

2.3. Molecular Docking

The processor used for the docking experiment was an Intel(R) Core (TM) i5 running at 1.60 GHz, 2.10 GHz, and 2.30 GHz in 64-bit mode. Using the OpenBabelIGUI 2.4.1 software, the PDBQT format structures for Bar and its four CT complexes were obtained [28]. The energy of the structures was minimized using an MMFF94 force field at 200 steps and applying a conjugate gradient optimization algorithm through PyRx-Python prescription 0.8 [29]. From the online protein data bank, the structures of dopamine (PDB:6CM4) and serotonin (PDB:6BQH) were downloaded [30].
In order to make the receptors ready for docking, a Discovery Studio (DS) Visualizer (v19.1.0.18287) removed the other heteroatoms, including water and the native ligands that were linked to the receptors. Polar hydrogen atoms were inserted using the AutoDockTool, and the receptors’ Kollman charges were also calculated [31]. Partial charges were assigned using the Geistenger method. AutoDockVina software [32] was used for docking. The resulting docked positions were evaluated and confirmed using a DS Visualizer (https://www.3ds.com/products-services/biovia/ accessed on 1 April 2022).

2.4. Molecular Dynamics (MD) Investigation

The best-docked pose of Bar and (Bar–CLA) complex were used for simulation and conformational space evaluation. Parameter files and topology of the ligands used were generated through the latest CGenFF using CHARMM-GUI [33,34]. To perform MD simulation analysis, the GROMACS program with the force field of GROMOS96-43a1 was used. Receptor–ligand structures in a triclinic box were obtained using SPC water models [35]. At a salt concentration of 0.15 M, 29 Cl and 27 Na+ ions were supplied to the systems to neutralize them and to simulate physiological salt concentrations (Figure 1). To remove unfavorable contact inside the system, energy minimization utilizing the steepest descent method with 50,000 steps was applied [36]. The equilibration of this complex system was obtained by the following two steps. Firstly, an NVT ensemble having a constant number of particles, temperature and volume was maintained for 2 ns. This ensemble is referred to as “isothermal-isochoric”. In the second step, the NPT ensemble containing a constant number of particles, temperature and pressure was equilibrated for 10 ns. Both systems were subjected to periodic boundary conditions using a leapfrog MD integrator during the NPT/NVT equilibration, run at constant temperature (300 K) and pressure (1.0 bar) [37].
GROMACS analytic techniques were used for trajectory analysis [38]. The root-mean-square deviation (RMSD) was calculated using gmxrms instruments. Hydrogen bonding was investigated by gmxhbond instruments. The gmxgyrate tool was used to quantify the gyration radius, and the gmxsasa tool was used to obtain the solvent-accessible surface area of the protein in unbound and ligand-bound conditions. Various graphs were made using PyMol/VMD and Grace Software [39].

2.5. Binding Free Energy Calculation Using MM-PBSA

The binding free energy of protein–ligand complexes was calculated via the molecular-mechanics Poisson–Boltzmann surface area (MM-PBSA) method. In this instance, binding free energy was calculated using the most recent, stable 30 ns trajectories determined by the RMSD plot. For better structure–function correlation, the frames at 200 ps intervals encompassed a wide range of trajectories and a diversity of conformational spaces.
In the single trajectory approach, the following equation represents the full process:
Δ G Binding   =   G Complex     ( G Receptor   +   G Ligand )
Δ G MM-PBSA   =   Δ E vdW   +   Δ E ele   +   Δ G polar   +   Δ G nonpolar
The GComplex represents the total MM-PBSA energy of the protein–ligand complex, GReceptor and GLigand correspond to the total solution free energies of the isolated receptor and ligand, respectively. The Δ GMM-PBSA value of the protein–ligand complex was determined from the sum of gas-phase electrostatic energy (Eele), van der Waals (EvdW), polar (Gpolar), and nonpolar (Gnonpolar) components [40].

2.6. Density Functional Theory (DFT)

DFT analysis was achieved by Gaussian 09RevD.01 software [41]. The fundamental set of Pople, B3LYP/6-311G++, was used to perform gradient-corrected correlation [42]. The B3LYP/6-311G++ basic program was used to determine the best structure for the (Bar–CLA) complex. The electrostatic potential map (MEP), lowest unoccupied molecular orbital (LUMO), and highest occupied molecular orbital (HOMO) of the (Bar–CLA) complex, were also examined [43]. The system’s chemical stability was determined by frontier molecular orbitals. Additionally, using this method, gas-phase metrics including atomic charges, bond angles, electronic properties, bond lengths, energy of frontier molecular orbitals, and total energy were calculated. The ChemCraft 1.5 program was used for visualization [44].

3. Results and Discussion

3.1. Spectroscopic Analysis on Charge-Transfer Complexes of Bar

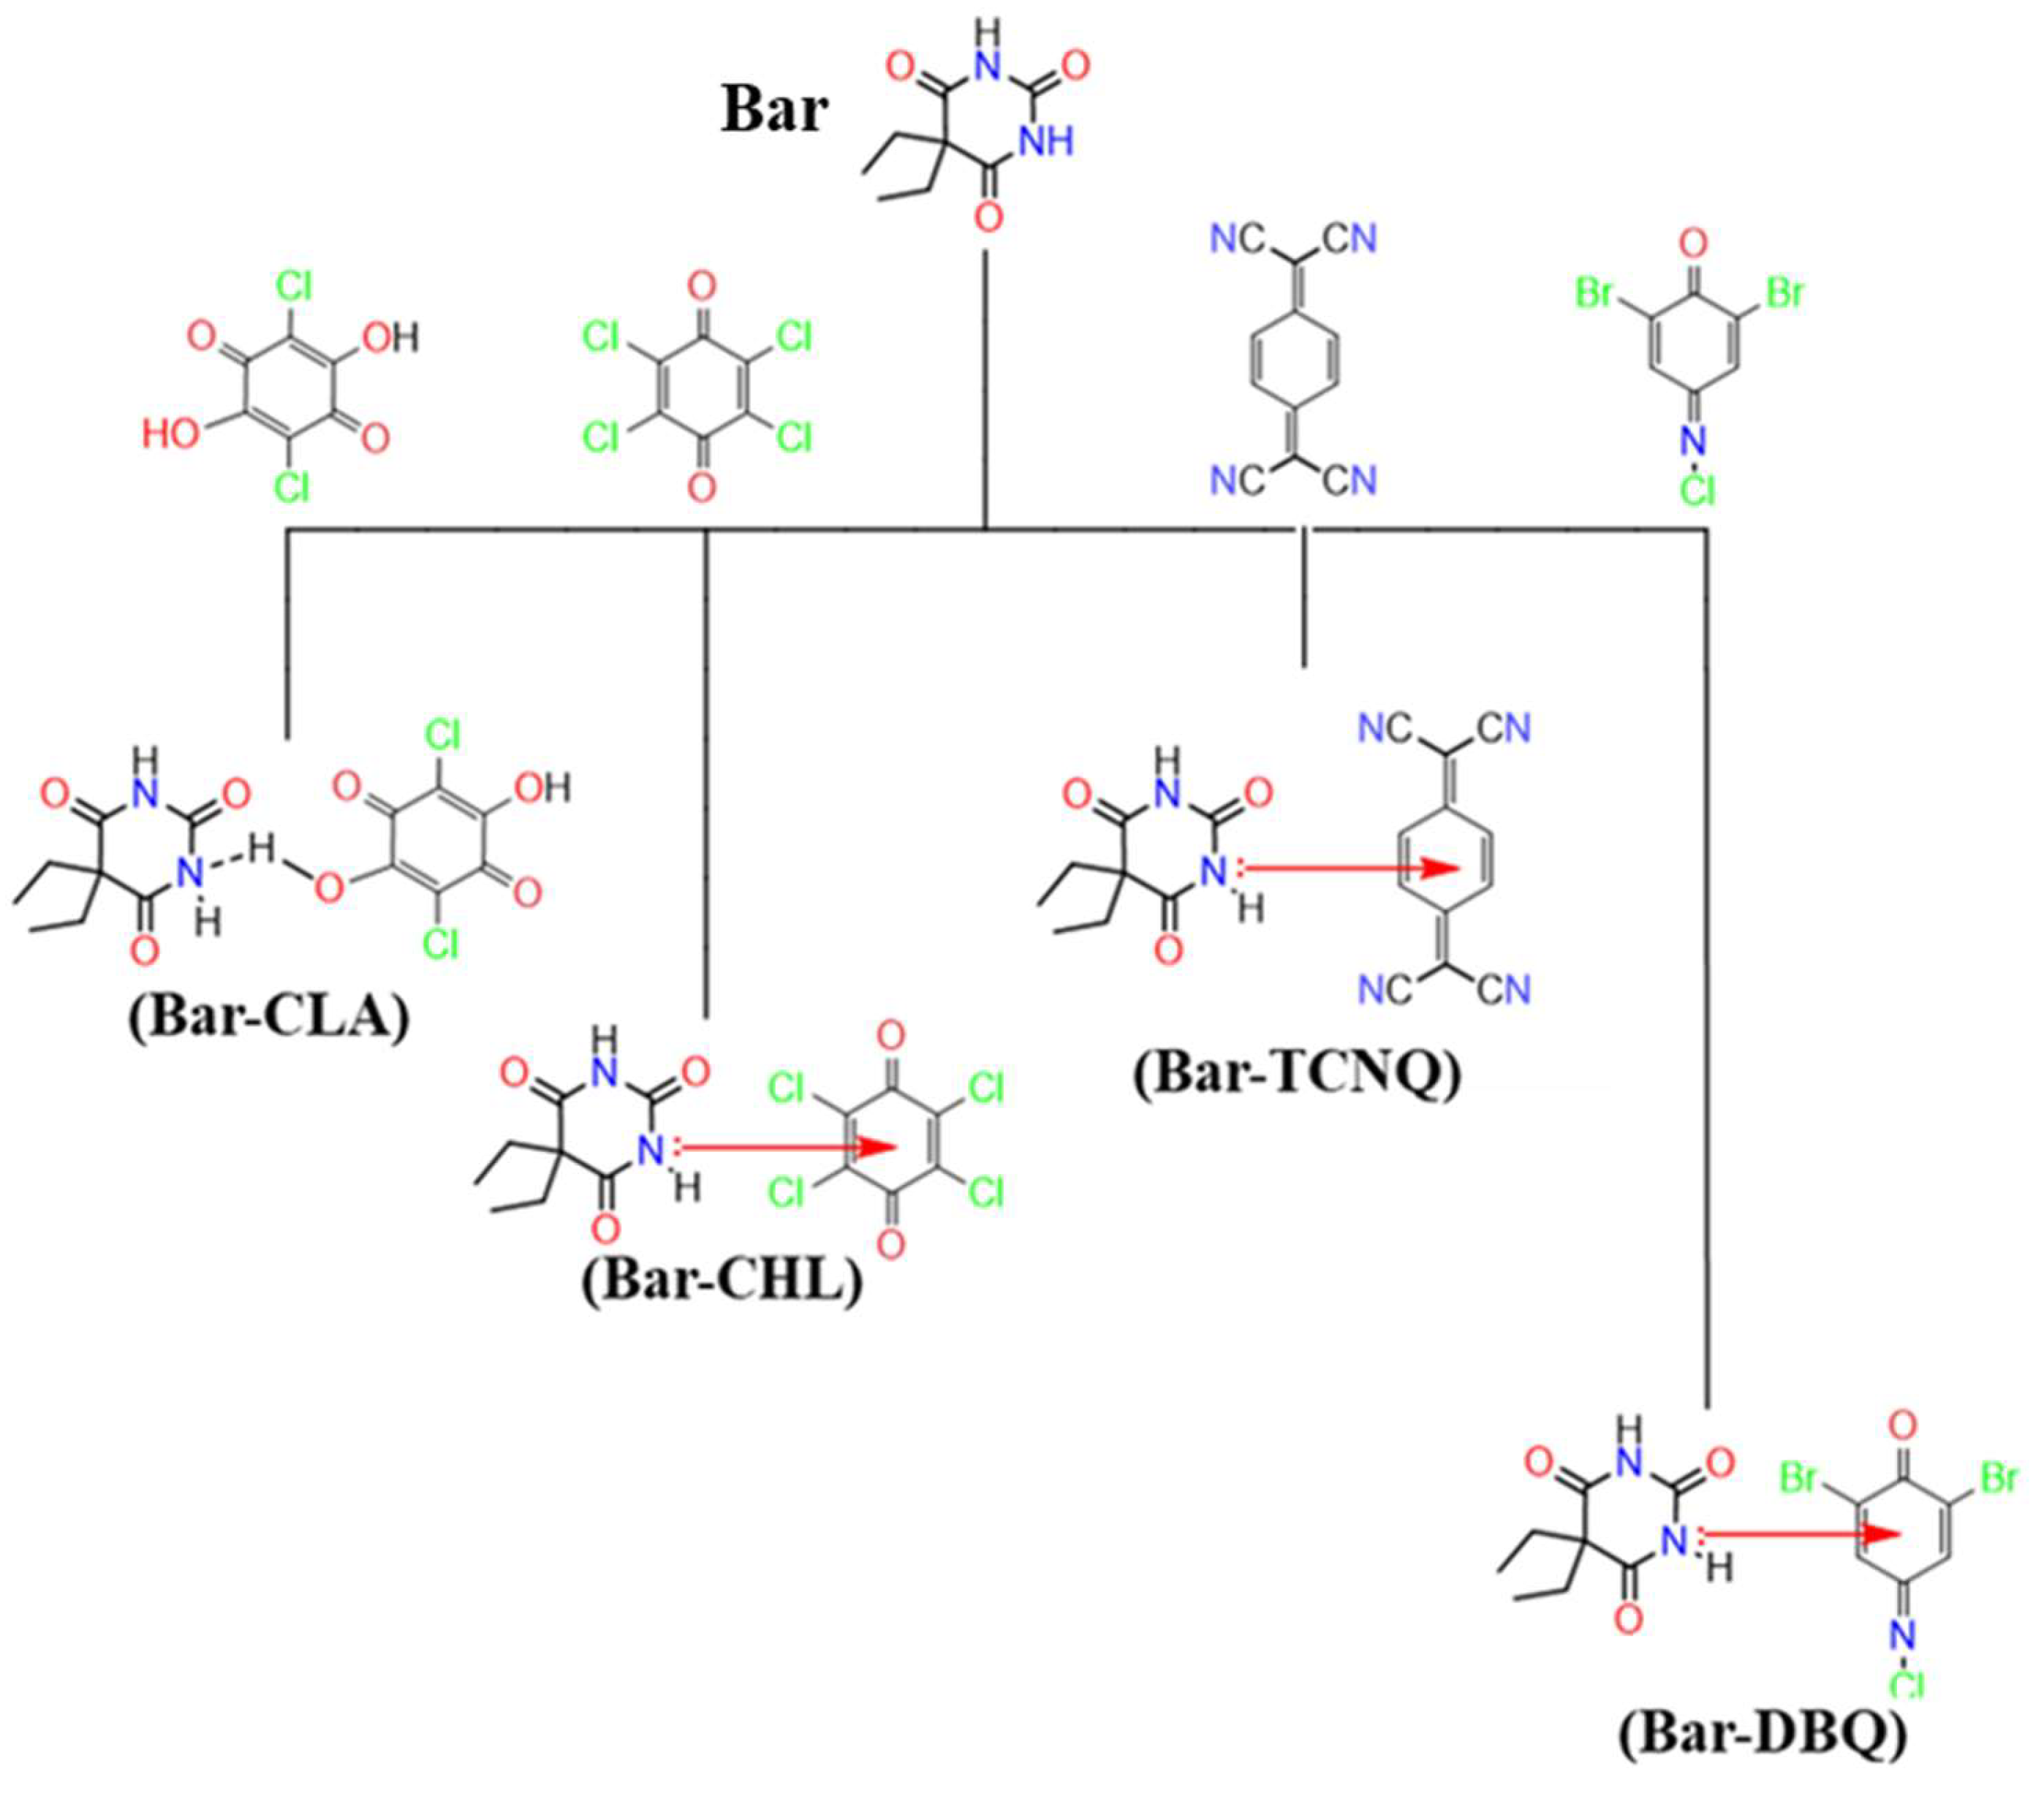
The main characterized analyses of the four synthesized Bar charge-transfer complexes (Figure 2) can be explained in Table 1.
The molar ratios between Bar donor and the four acceptors were deduced according to the spectrophotometric titration at room temperature [45]. This titration was performed at 300, 360, 320, and 520 nm for (Bar–DBQ), (Bar–TCNQ), (Bar–CHL), and (Bar–CLA), respectively, in methanol solvent at variable receptor concentrations, ranging from 4 × 10⁻⁴ to 0.25 × 10⁻⁴ M, and at a fixed Bar concentration of 1.0 × 10⁻⁴ M, resulting in a molar ratio of the product (Bar: acceptor) spanning the range from 4:1 to 1:4. It can be seen that the largest interaction occurs between Bar and DBQ, TCNQ, CHL, and CLA in a 1:1 ratio. In addition, weak bands at 2705, 2656, 2600, and 2565 that result from hydrogen bonding in the byproduct (N–H∙∙∙O) were seen in the infrared spectra of (Bar–CLA). These findings suggest that Bar and the CLA acceptor have formed an intermolecular H-bond [46,47]. The CHL receptor’s infrared spectrum characterized the main bands at (903 and 709), 1263, 1487, 1567, and 1685 cm−1 for ν(C–Cl), ν(C–O), ν(C=C), νs(C=O), and νas(C=O), respectively (Figure S1). The CHL, TCNQ, and DBQ receptors have an electron-withdrawing action that makes it simpler for them to take n electrons from the Bar molecule. The main bands of ν(N−H) vibrations at 3234 and 3103 cm−1 for (Bar–CHL), were found to be shifted to 3242 and 3160 cm−1, 3209 and 3171 cm−1 for (Bar–TCNQ), and 3256 and 3168 cm−1 for (Bar–DBQ), due to complexity (Figure S1).
In the spectra of the four acceptors, the protons of (NH) groups were up-field shifted to 11.37, 11.17, 11.33, and 11.31 ppm for CLA, CHL, TCNQ and DBQ, respectively (Figure S2). It is possible that the complexation process is what caused these protons’ up-field shift. Owing to the electronic clouds in the acceptors, all of the CT products that formed between Bar and the four acceptors had a shielding effect on the (NH) proton (Figure S2). The amount of shielding is dependent on the size of the electronic cloud and the electron-withdrawing the electron-donating properties of the acceptor. Compared to free Bar and other products, (Bar–TCNQ) demonstrated high thermal stability. TG thermogram results indicated that the four complexes were thermally stable up to 175, 200, 145, and 170 °C for (Bar–DBQ), (Bar–TCNQ), (Bar–CHL), and (Bar–CLA), respectively. It was observed that (Bar–TCNQ), (Bar–CHL), and (Bar–CLA) were thermally degraded in one step. Whereas, for (Bar–DBQ), the product diagram indicates that this product is thermally degraded in two steps in the temperature range of 175–315 and 315–600 °C.
The determined particle diameters for (Bar–DBQ), (Bar–TCNQ), (Bar–CHL), and (Bar–CLA) were 48, 49, 70, and 56 nm, respectively. These results demonstrated the nanoscale nature of the products. The elemental compositions determined by EDX analyses and those determined by elemental analyses, as well as the suggested chemical composition of the products, are in good agreement. The products generally have a clear form, with homogenous and well-defined shape, according to SEM micrographs. Their particles have high homogeneity and resemblance and are evenly scattered.

3.2. Molecular Docking Studies

All of the produced CT complexes were docked against serotonin and dopamine receptors. The donor molecule (Bar) was used as control. The potential binding energy of the four CT complexes was larger than that of Bar drug alone in both receptors (Table 2).
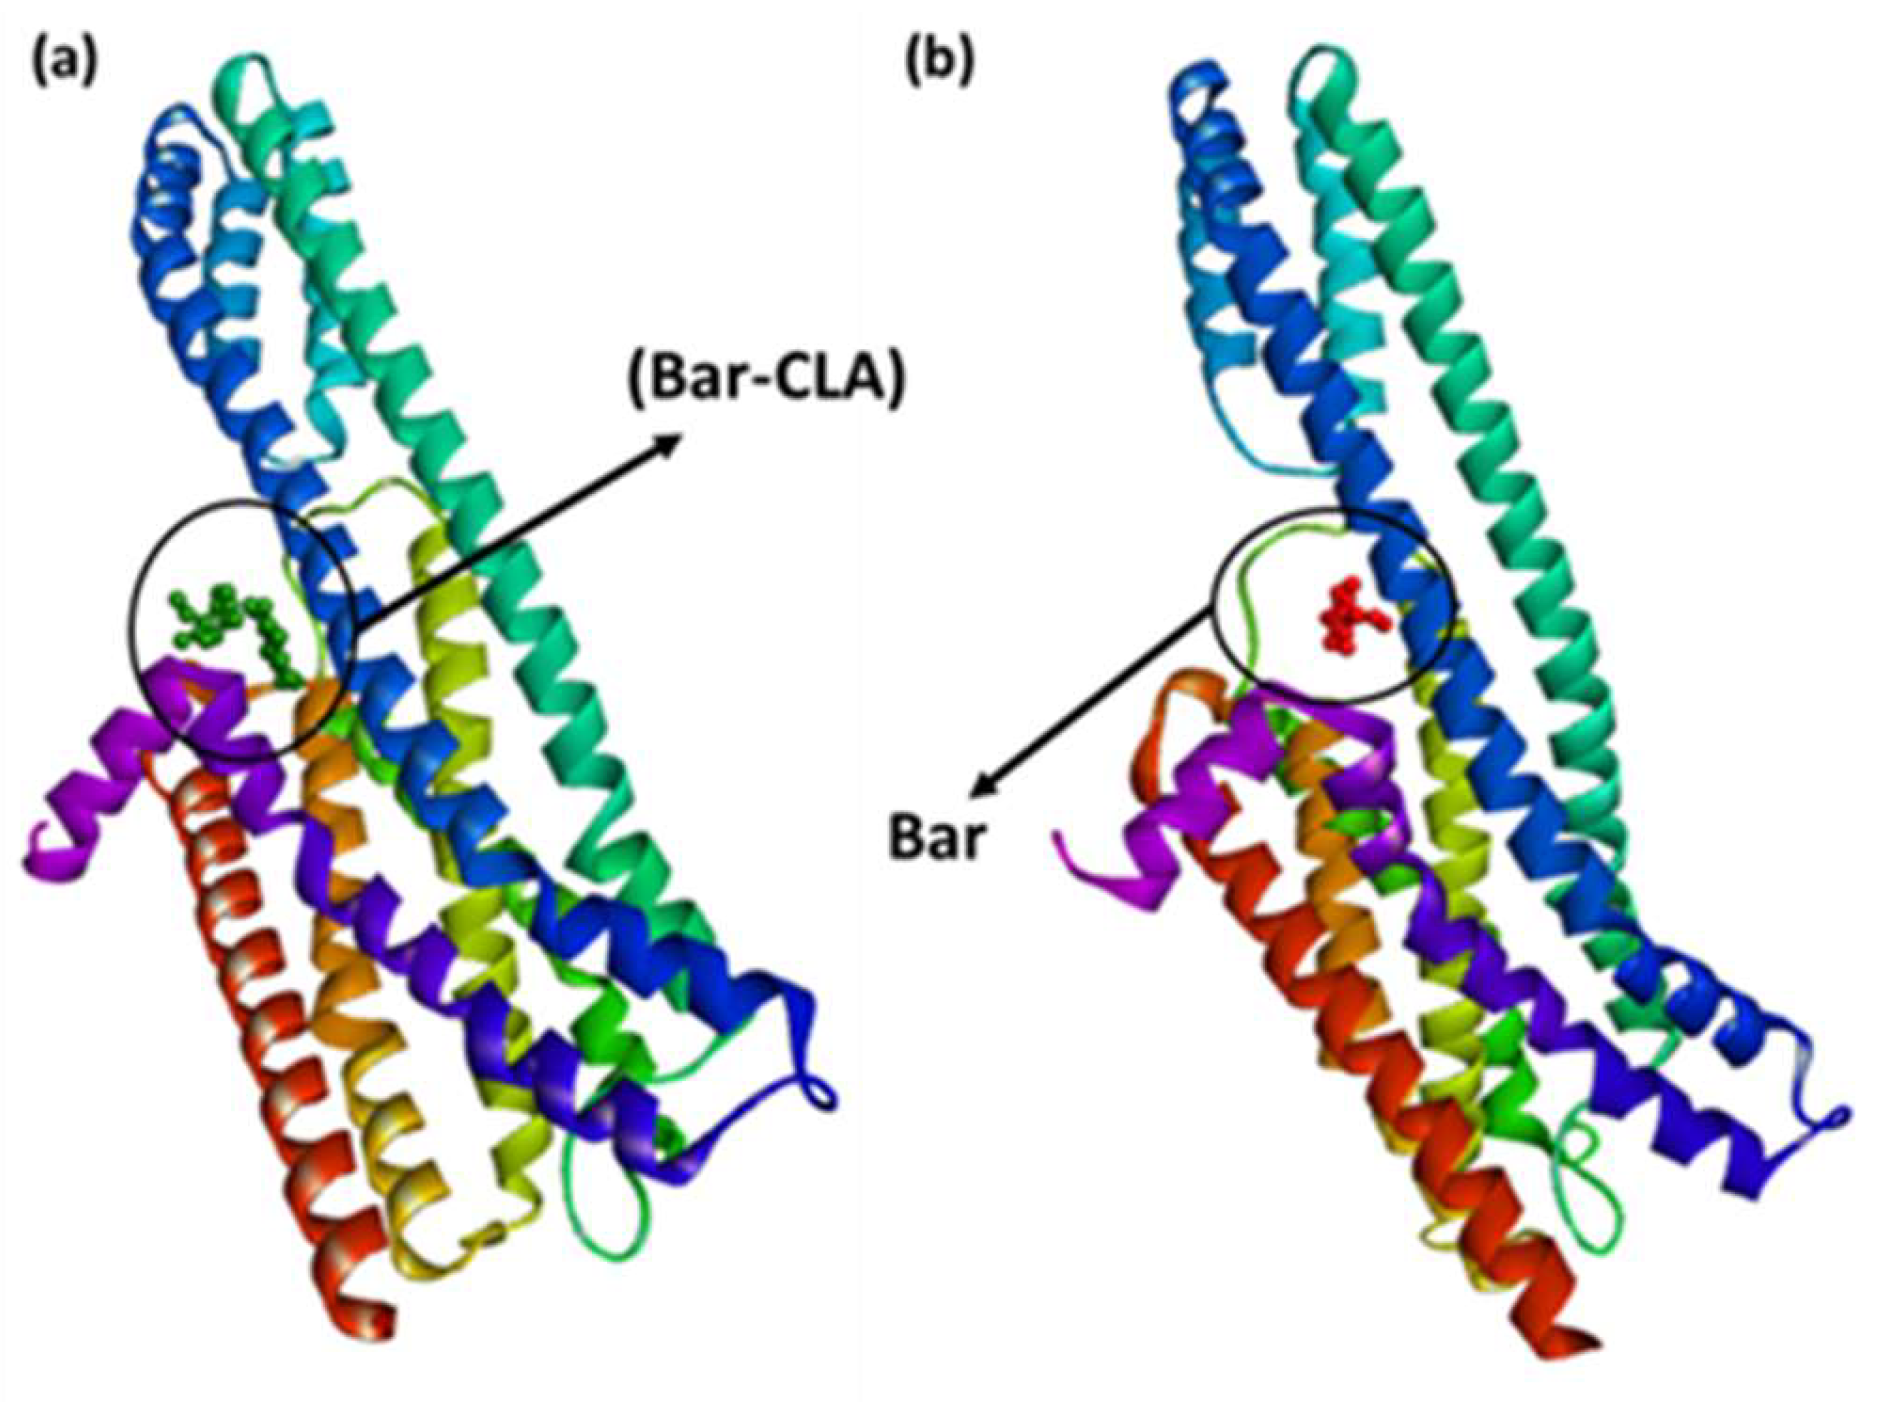
When (Bar–CLA) was molecularly docked with serotonin and dopamine, the theoretical binding energies were found to be −8.2 and −7.8 kcal/mol, respectively (Table 2). Serotonin and (Bar–CLA) have a greater interaction than dopamine does with (Bar–CLA) due to their higher binding energies. The best (Bar–CLA) docking data are shown in Figure 3 and Table 3.
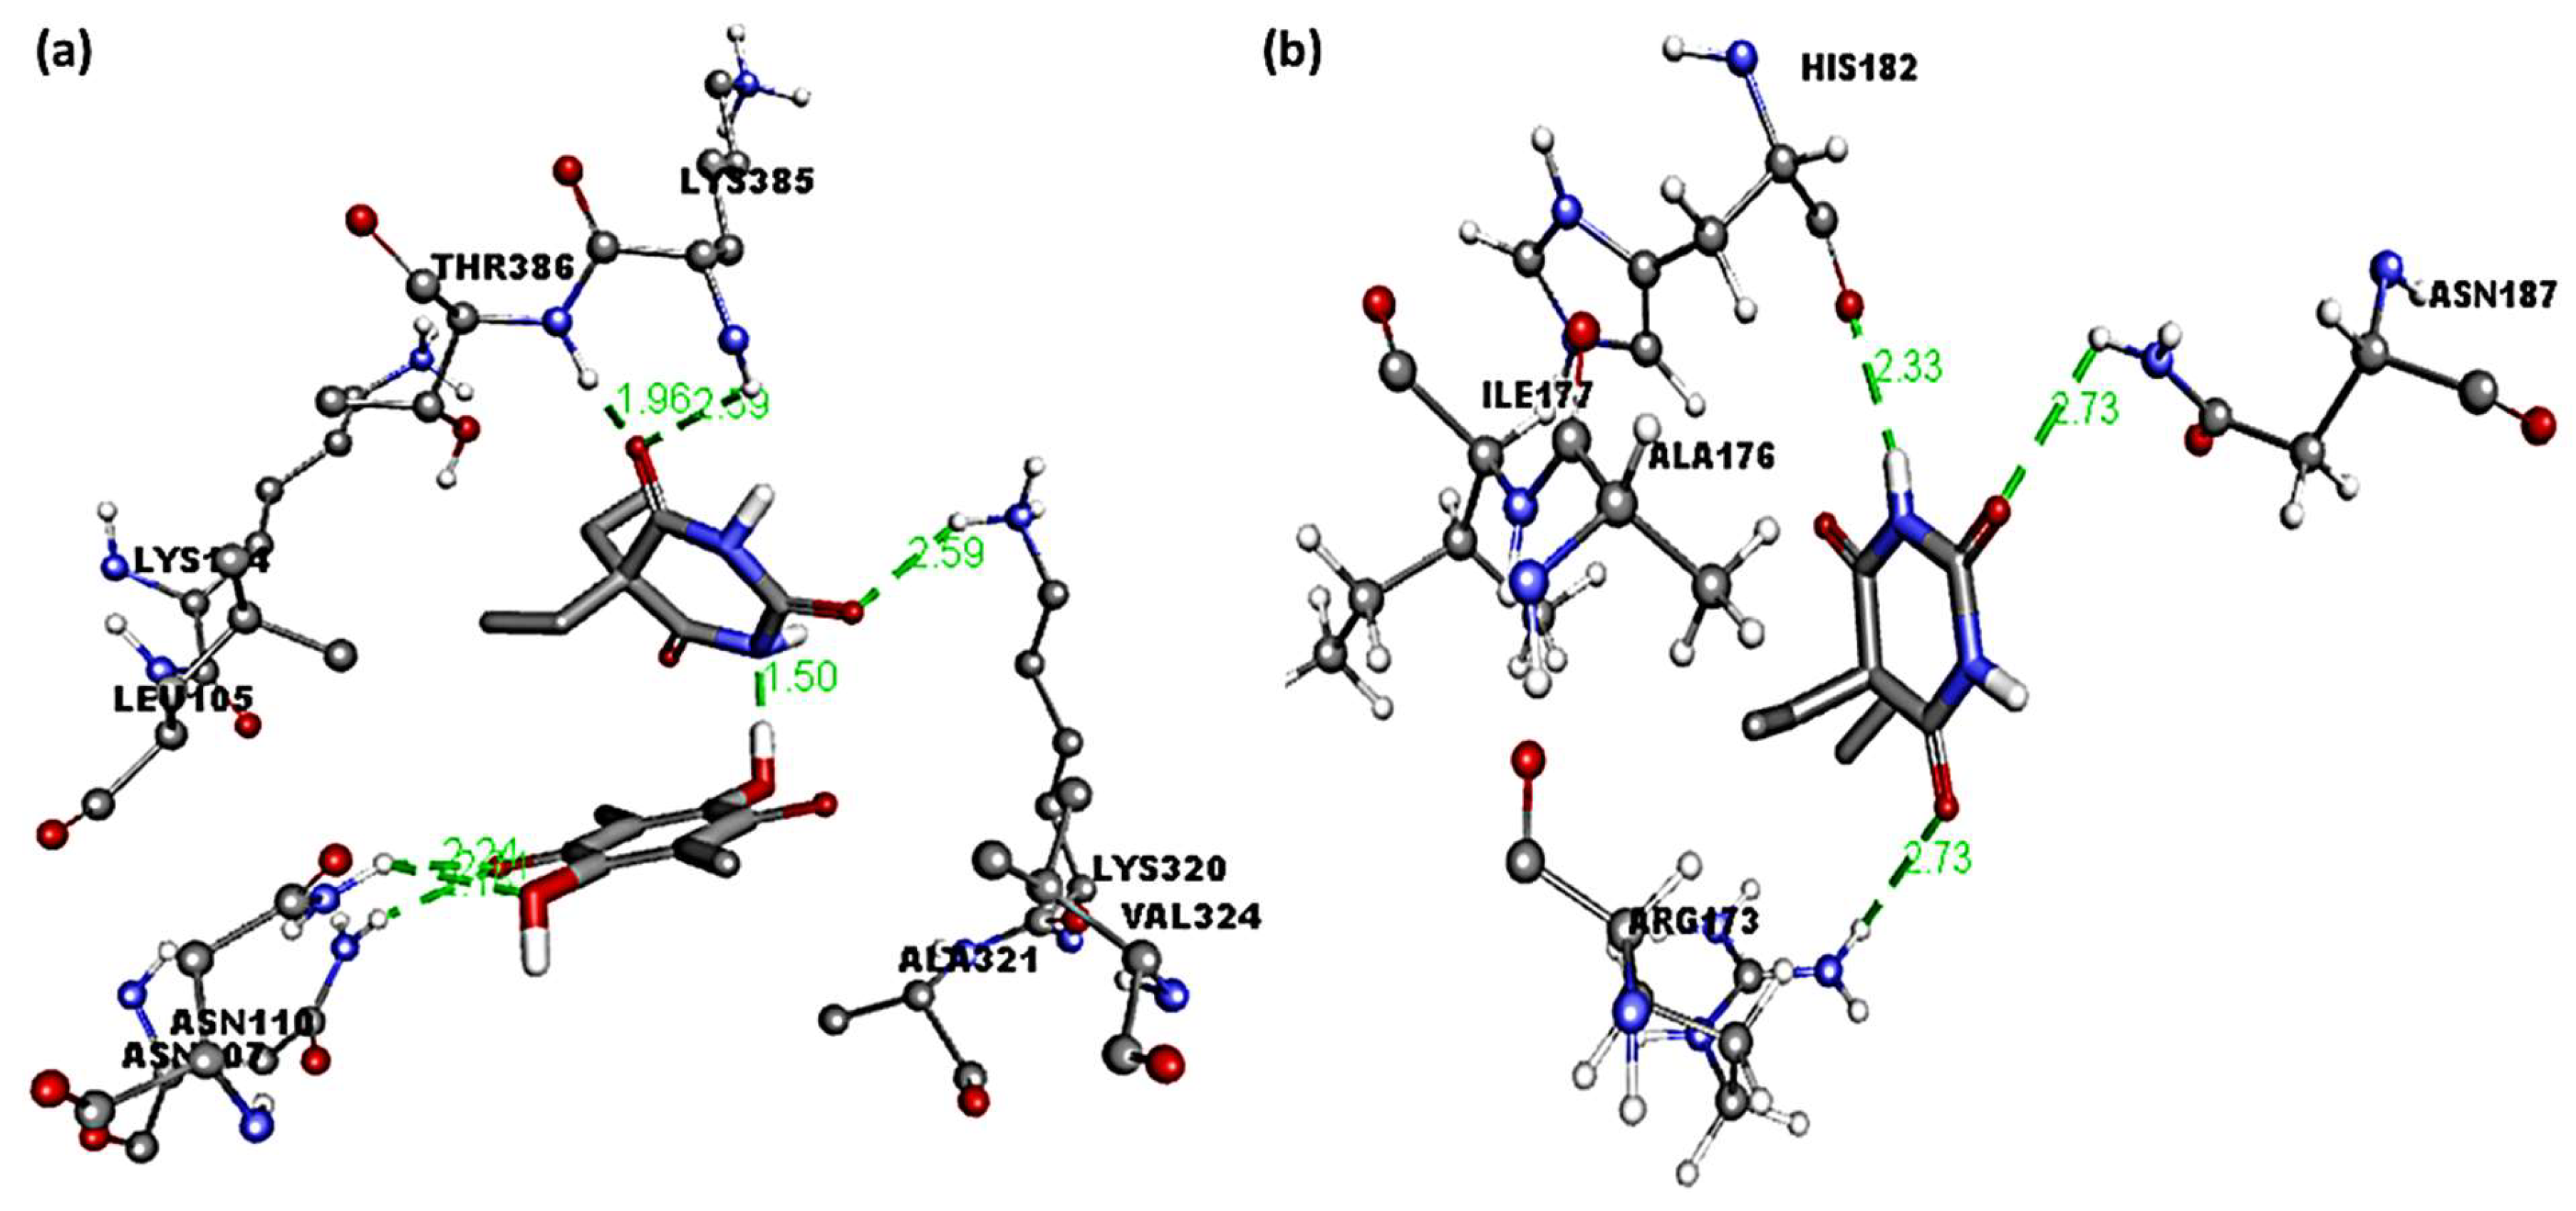
Figure 4 shows a 3D representation of the molecular docking interactions of (Bar–CLA)–serotonin (BarCS) or (Bar)–serotonin (BarS).
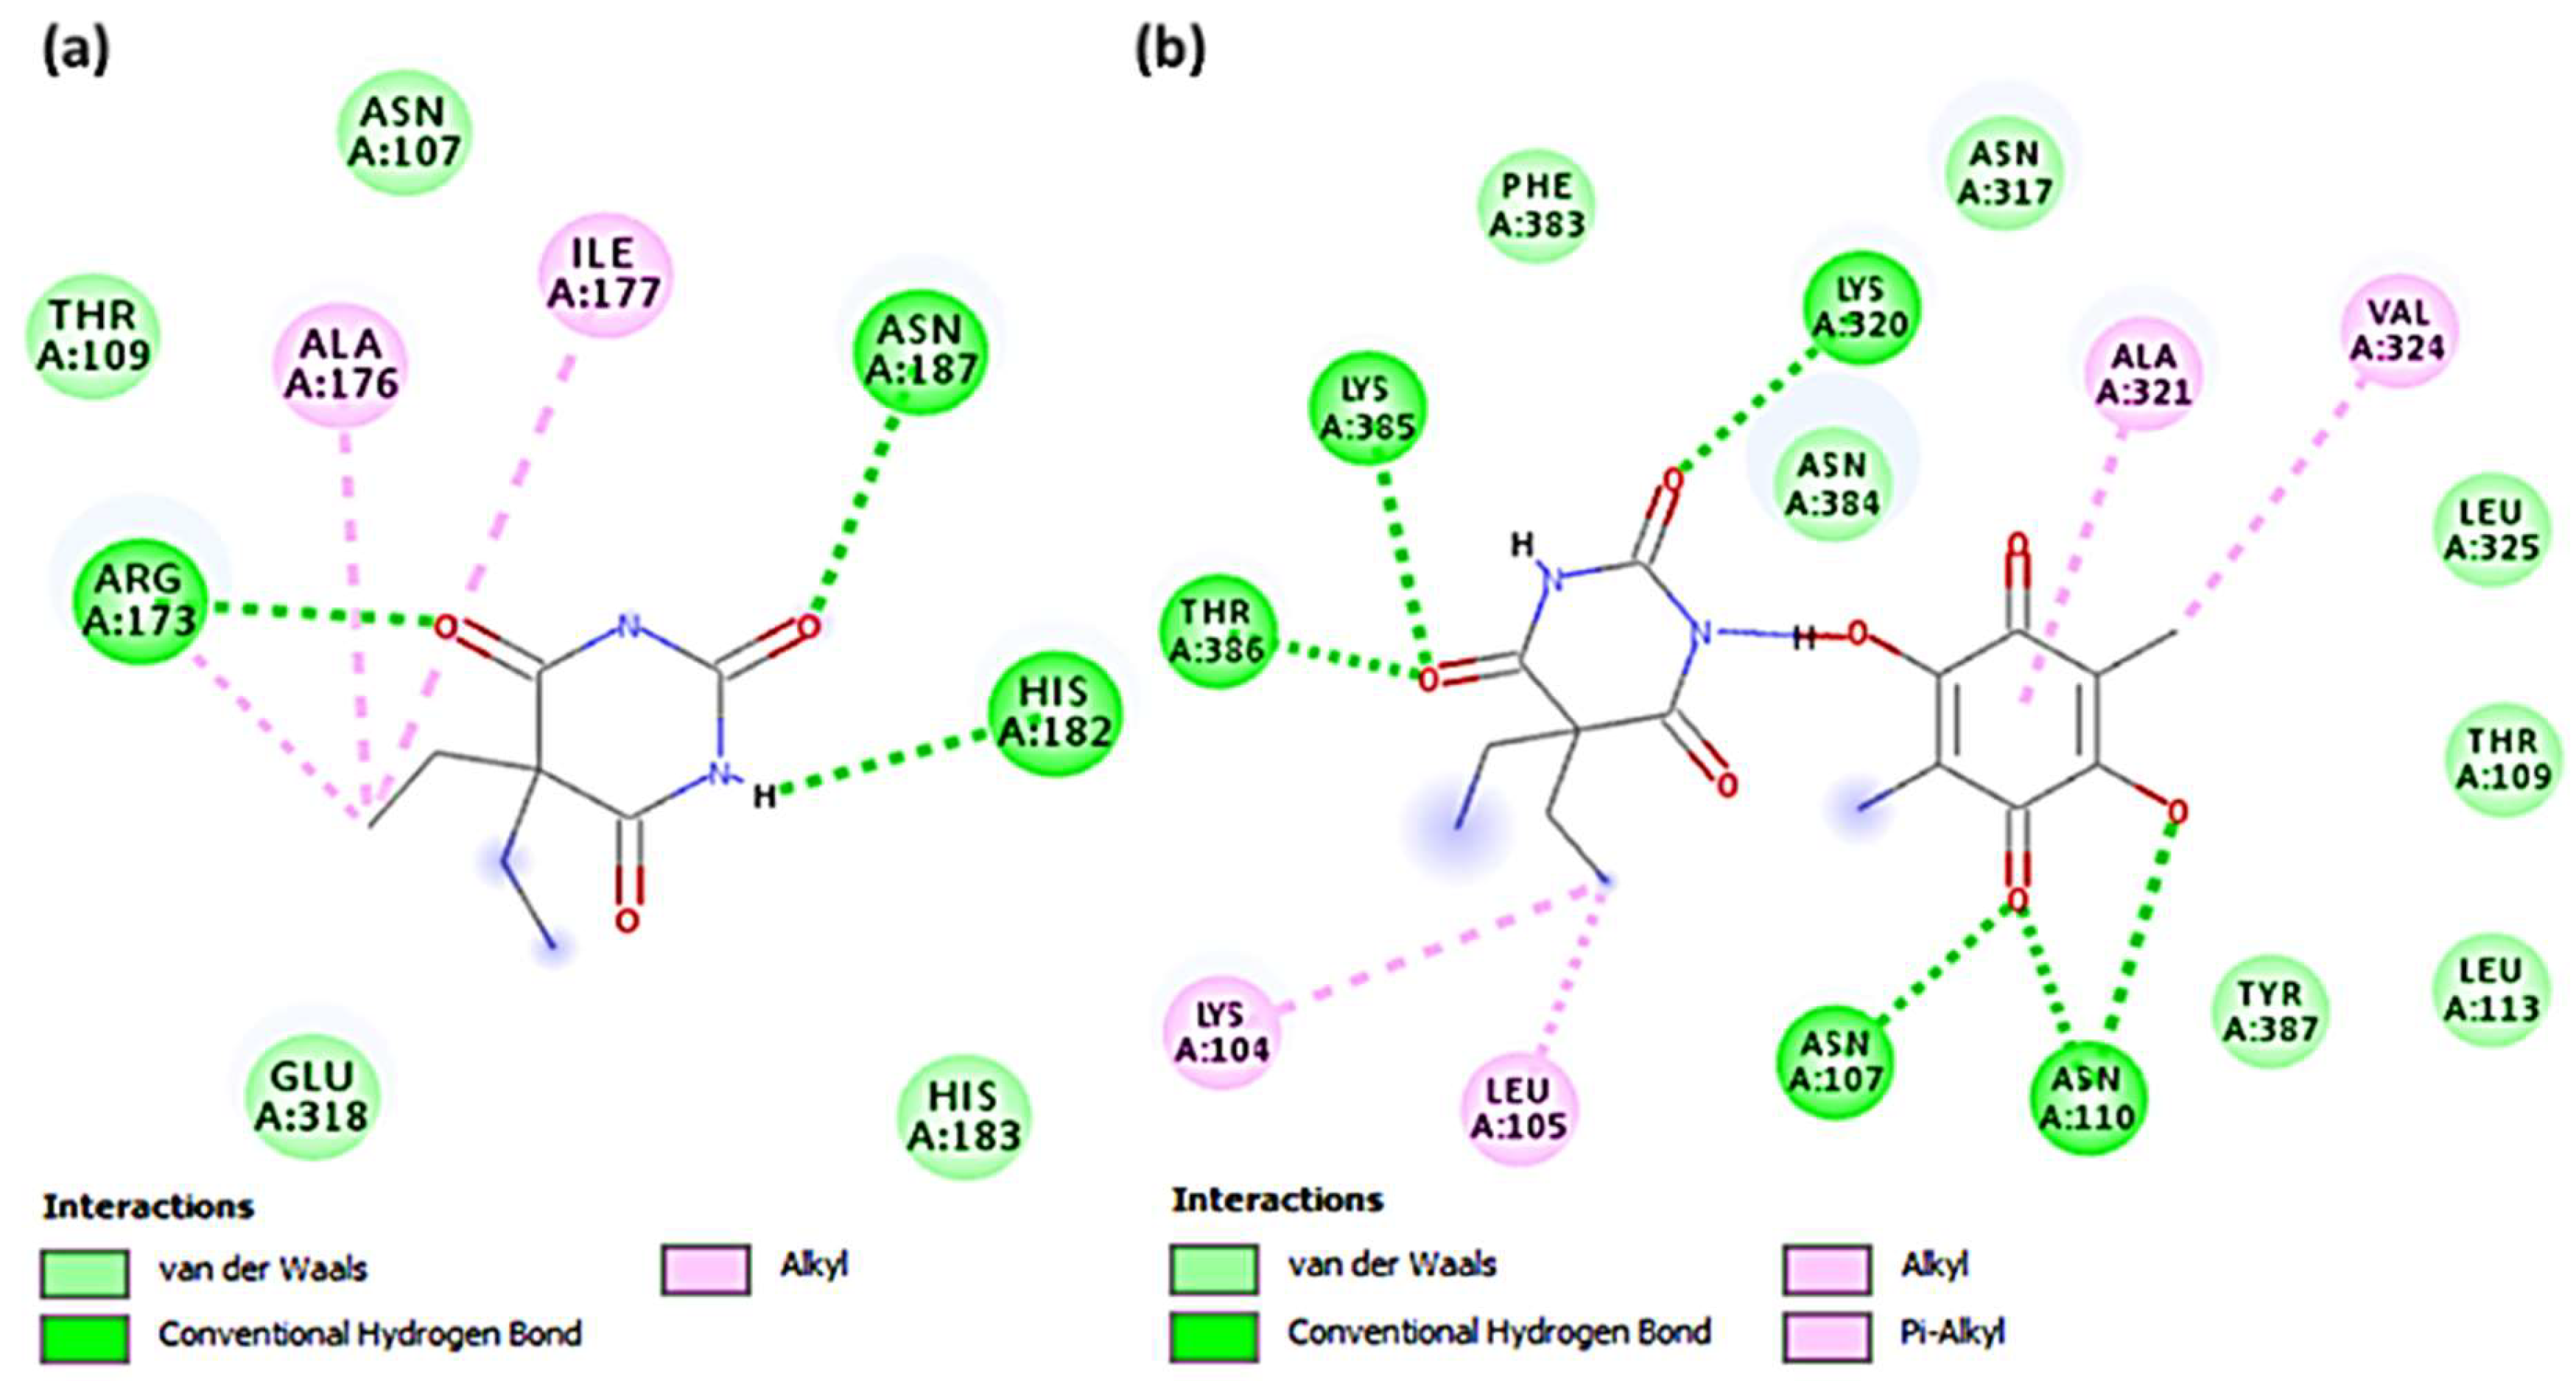
Thr386, Lys385, Lys320, Asn110, and Asn107, among other amino acid residues, were found to form hydrogen bond interactions with O atoms in the BarCS complex (Figure 4a). Lys104, Val324, and Leu105 were also present as π–alkyl interactions with C, Cl, and C atom in BarCS [48,49]; whereas the amino acid residues Arg173, Asn187, and His182 formed hydrogen bonds with O atom in the BarS complex (Figure 4b). Ala176 and Ile177 were also found as π–alkyl interactions with C atom in BarS (Table S2).
Two-dimensional illustrations of interactions between receptors and ligands are represented in Figure 5. All the other data are presented in detail in Supplementary Tables S1 and S2.

3.3. MD Simulation

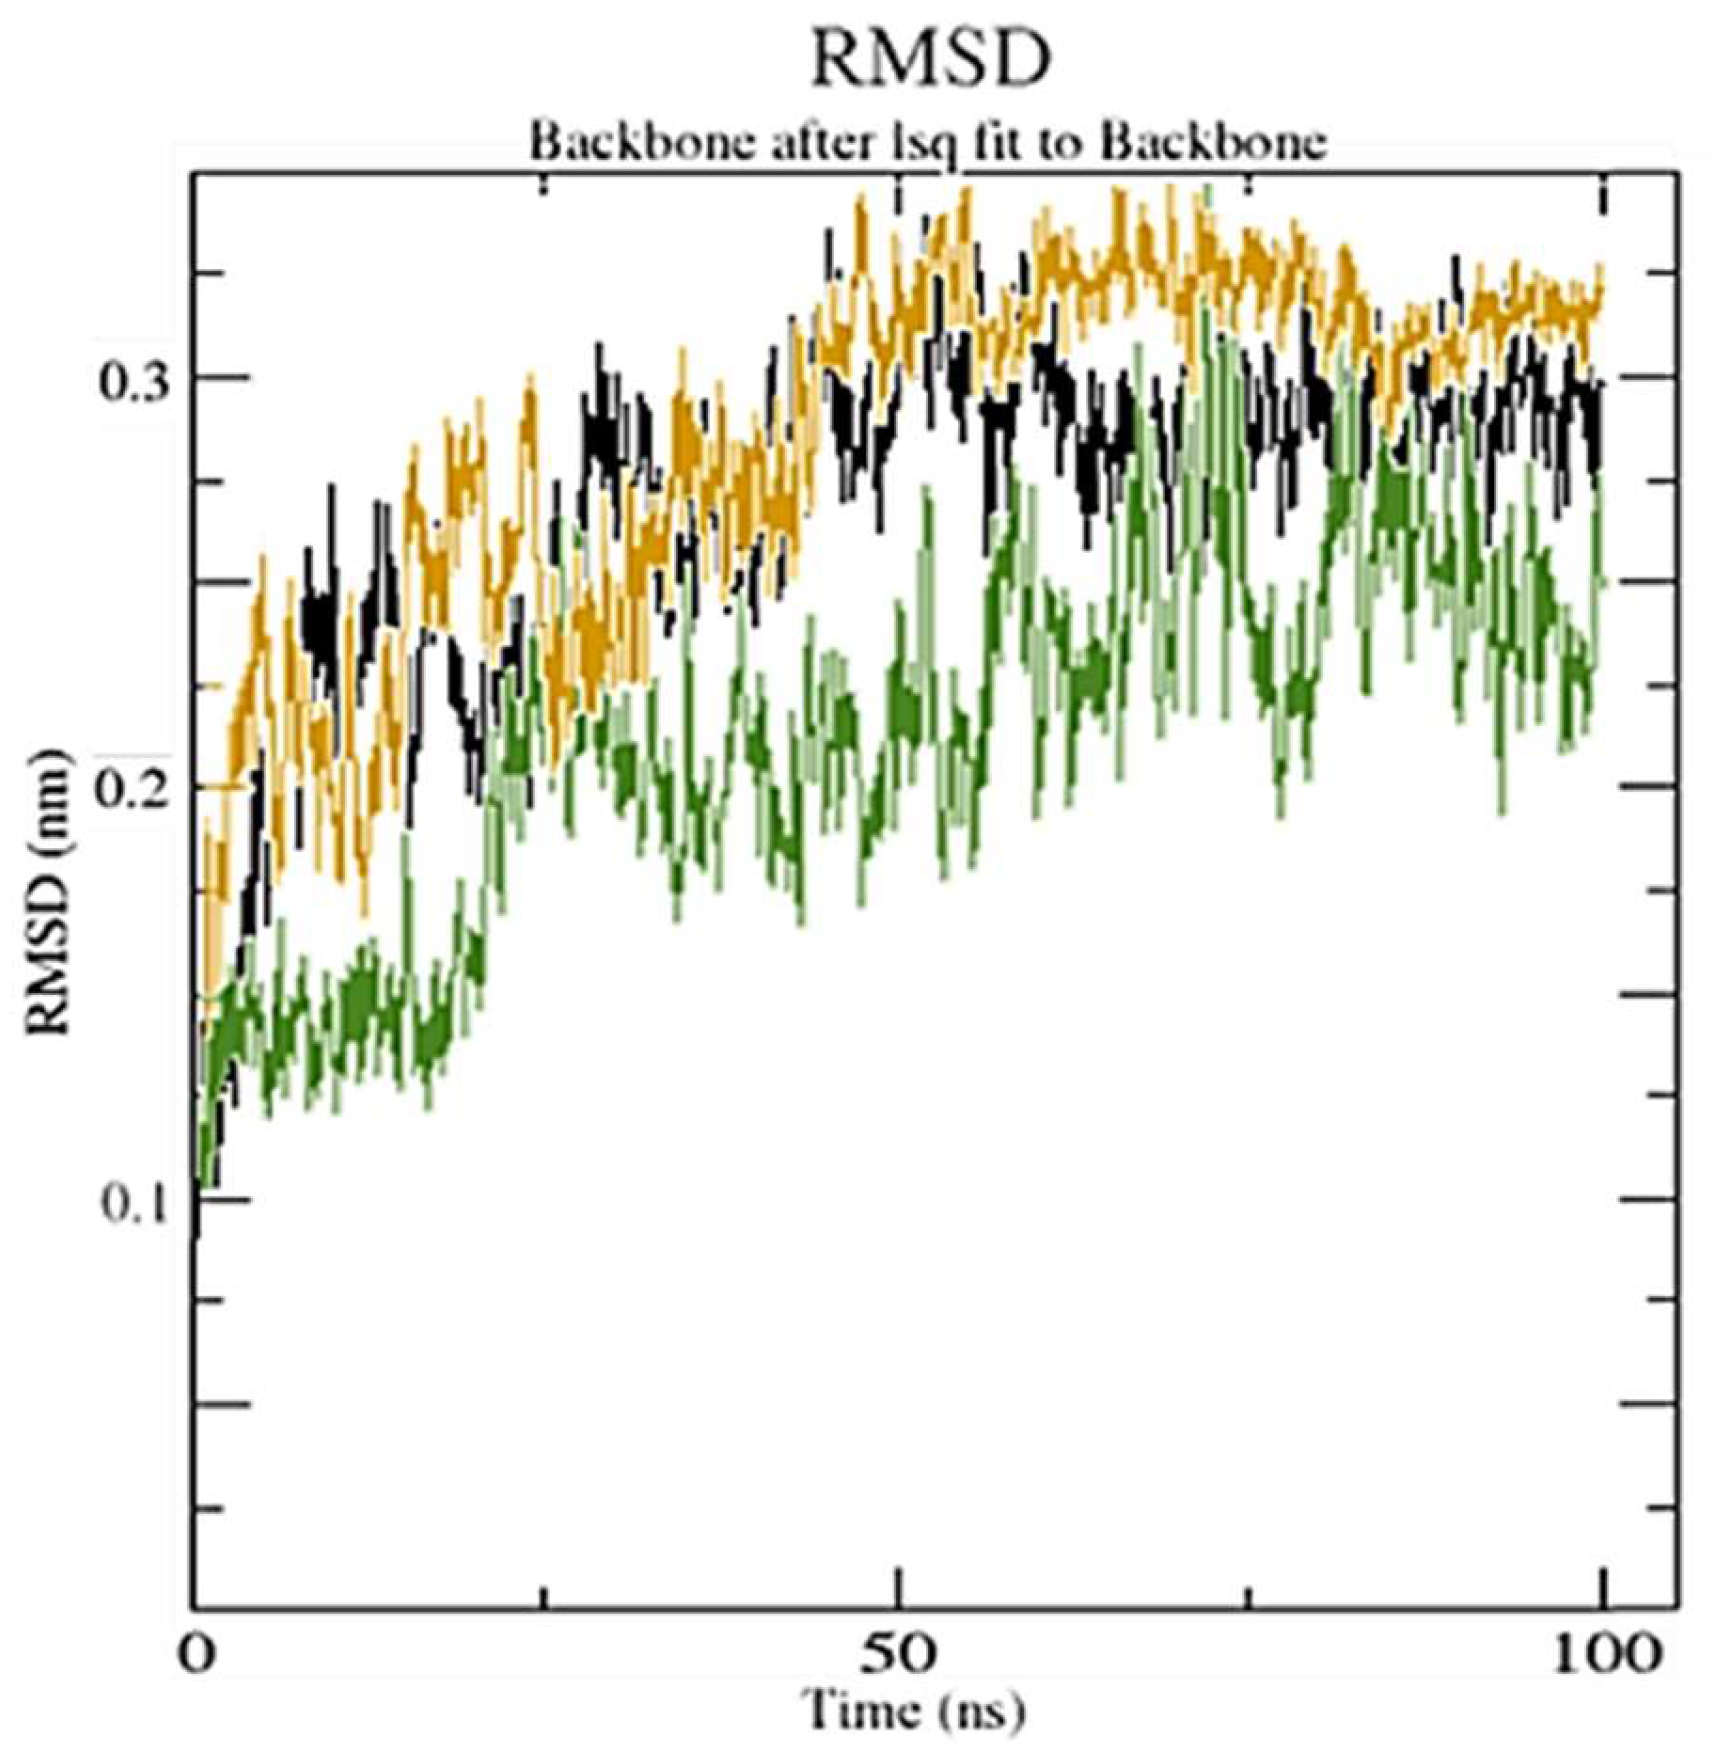
The best-docked poses of BarCS and BarS that were obtained from molecular docking analysis through AutoDockVina were taken as the initial structure and were subjected to 100 ns of MD simulation [50]. Data from MD simulations were processed by computing the RMSD in order to look into the structural stability.
Average protein (considering only heavy backbone atoms) RMSD value calculated over the last 50 ns of MD simulations for BarCS and BarS is 2.412 and 2.875 Å, respectively.
Both BarCS and BarS formed stable formations after 40 and 50 ns, respectively (Figure 6). Several reports state that an RMSD value of less than 3.0 Å is the most acceptable [51,52].
The lower RMSD values of the BarCS complex indicate smaller deviation from the initial protein structure. This result demonstrates that BarCS creates a more stable complex. The protein structures before and after the MD simulation were compared by studying superimposed structures using Chimera 1.15 software, using tool–structure comparison followed by the MatchMaker feature (Figure 7). MatchMaker performs a fit after automatically identifying which residues should be paired. The findings support the view that ligand–receptor interaction increases the compactness of the protein structure (Figure 7) [53].
The radius of gyration data (Rg) for BarS and BarCS for over the last 20 ns of MD simulations were 26.42 and 26.07 Å, respectively (Figure 8). The Rg data for BarCS and BarS were decreased along with the time of the simulation, indicating that structures became more compact (Figure 8).

3.3.1. Hydrogen Bond Analysis

The grid search at 25 × 11 × 14 = grid and rcut = 0.35, revealed the H-bonds between ligand and receptor combinations (BarS and BarCS); these were plotted against time (Figure S5). On calculating hydrogen bonds between ligand [(Bar = 15 atom and (Bar–CLA) = 27 atom] and receptor (3706 atoms), 509 donors and 993 and 989 acceptors for BarS and BarCS, respectively, were observed. The number of H-bonds per timeframe on average were found to be 1.594 out of a possible 251,700 for BarS and 1.856 out of a possible 252,718 for BarCS. Overall, it was discovered that better binding of Bar–CLA than Bar alone with serotonin is also evident form a larger average number of hydrogen bonds that Bar–CLA makes with the protein than Bar alone.

3.3.2. Solvent-Accessible Surface Area Analysis

The solvent-accessible surface area (SASA) determines the bimolecular surface area accessible for surrounding solvent molecules. The SASA of the protein was calculated during the MD simulation in unbound and ligand-bound conditions (Figure S6). The change in SASA values is due to the binding of the ligand to the protein. The average SASA values for serotonin alone, BarS and BarCS for the last 20 ns are 159.37, 158.75 and 154.38 nm2, respectively.

3.4. Binding Free Energy Calculation Using MM-PBSA

The binding free energy of the simulated BarCS and BarS complexes was calculated at 30 ns of MD trajectories to revalidate the inhibitor affinity that was predicted by the docking simulation studies. The MM-PBSA technique was used to compute the total of the nonpolar, polar, and nonbonded interaction energies (electrostatic interaction and Vander Waals) for both complexes (Table 4).
According to the calculations, the binding energies of the BarCS and BarS complexes are −40.642 and −31.089 kJ/mol, respectively. The binding energies obtained from MD simulations are in agreement with docking results which predict better binding of Bar–CLA to serotonin than Bar alone to serotonin.

3.5. Density Functional Theory (DFT) Calculations

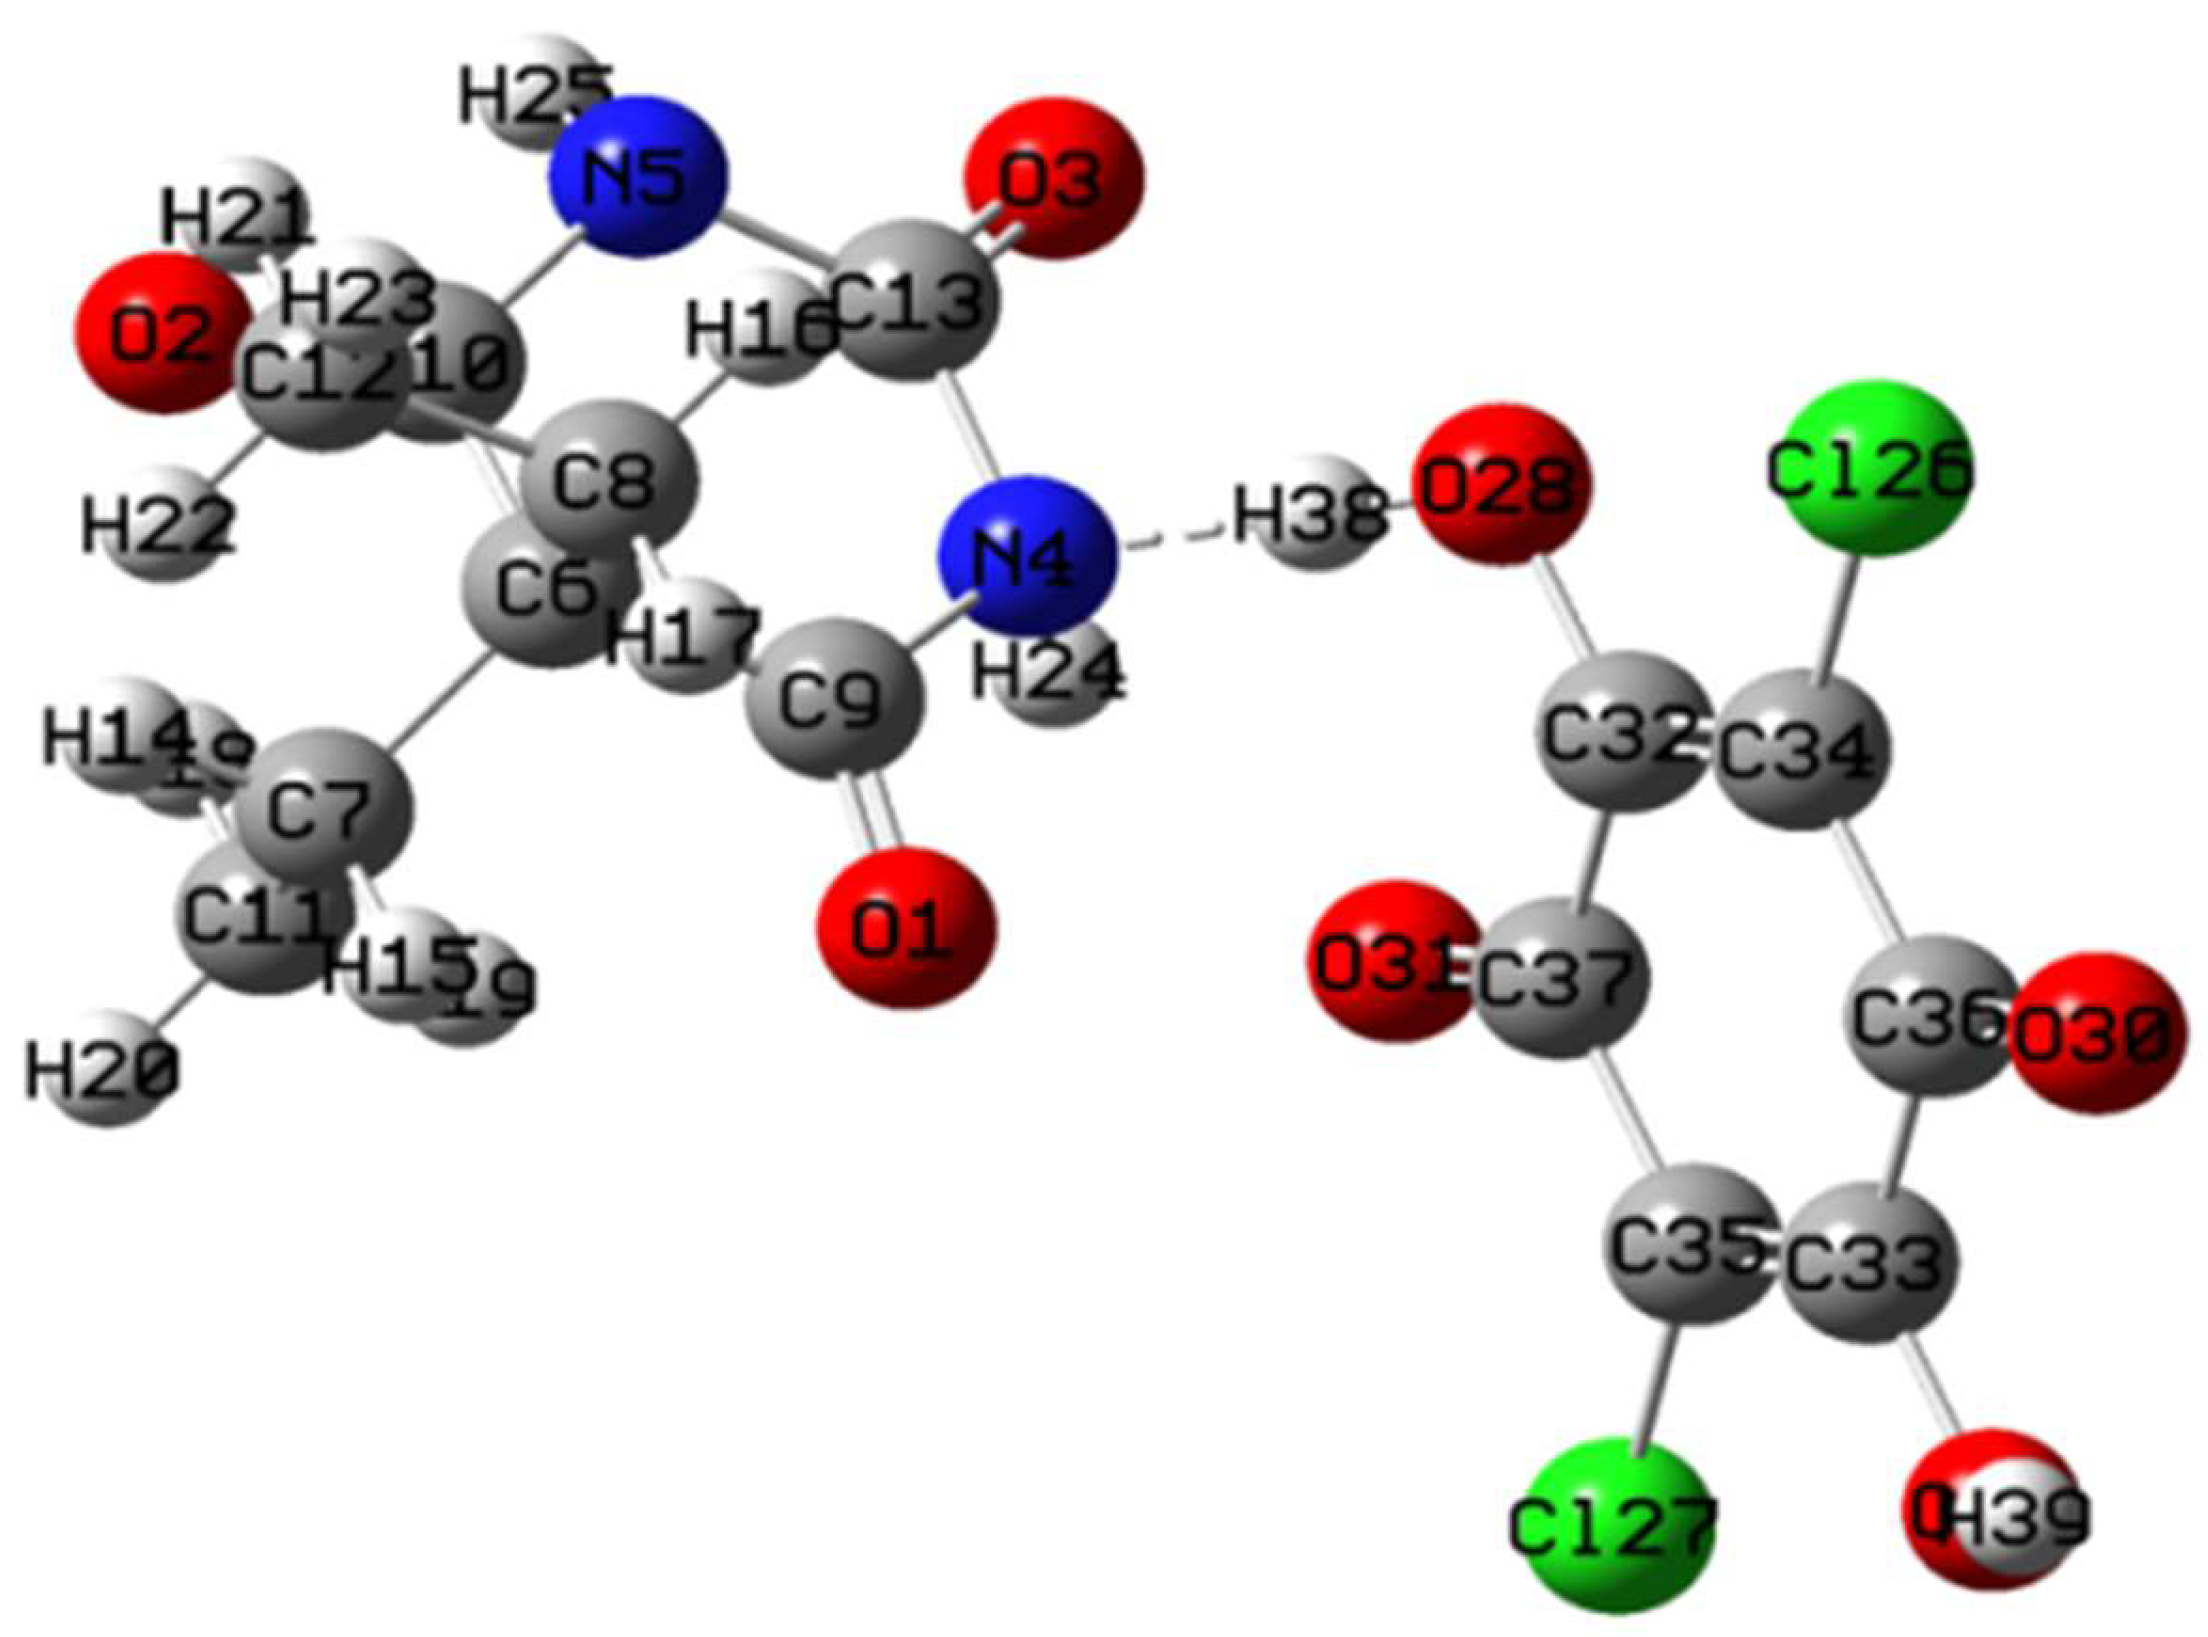
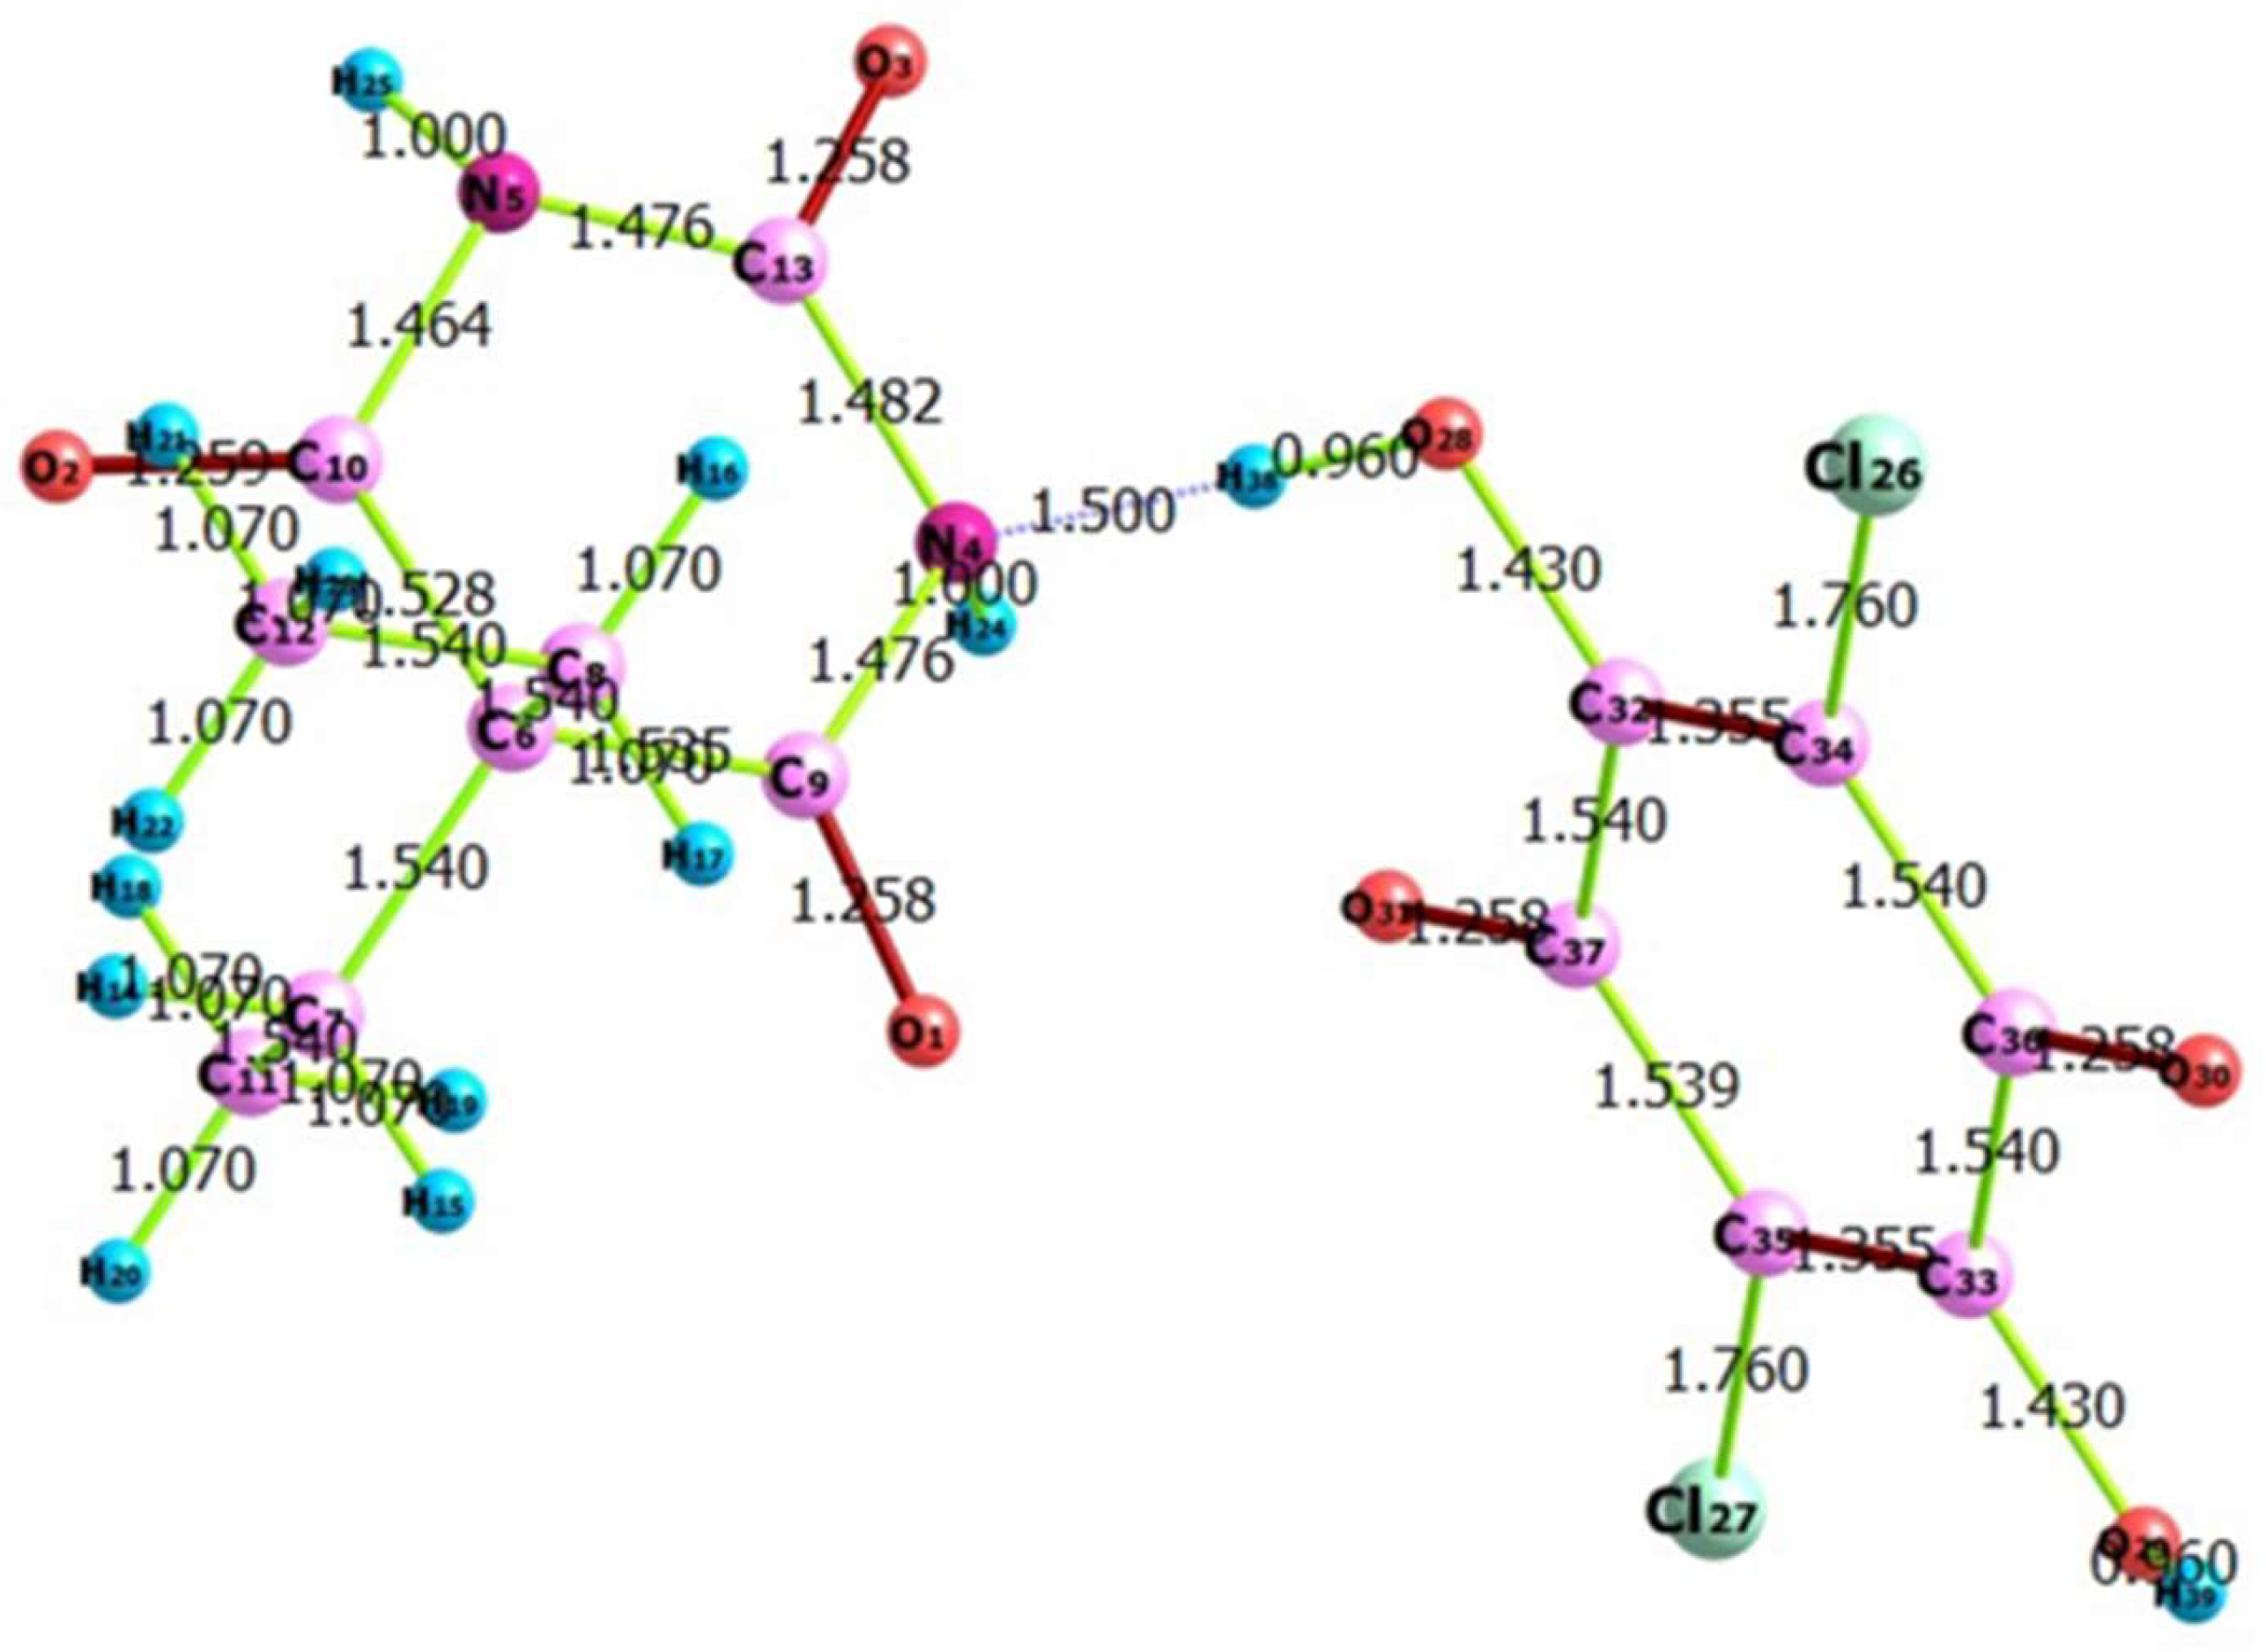
The DFT calculations (B3LYP functional) with 6-311G++ basis set were used to obtain the optimized structure of the (Bar–CLA) complex. The minimum SCF energy after 54 optimization steps was found to be −2097.881963 a.u (Figure S7). The optimized geometry of the (Bar–CLA) complex with the Mulliken atom-numbering scheme is shown in Figure 9. The optimized structure that shows the bond lengths of the (Bar–CLA) complex is represented in Figure 10.
The bond lengths and bond angles are presented in Supplementary Tables S3 and S4. The Mulliken charges for (Bar–CLA) complex were also calculated and are represented in Supplementary Table S5.
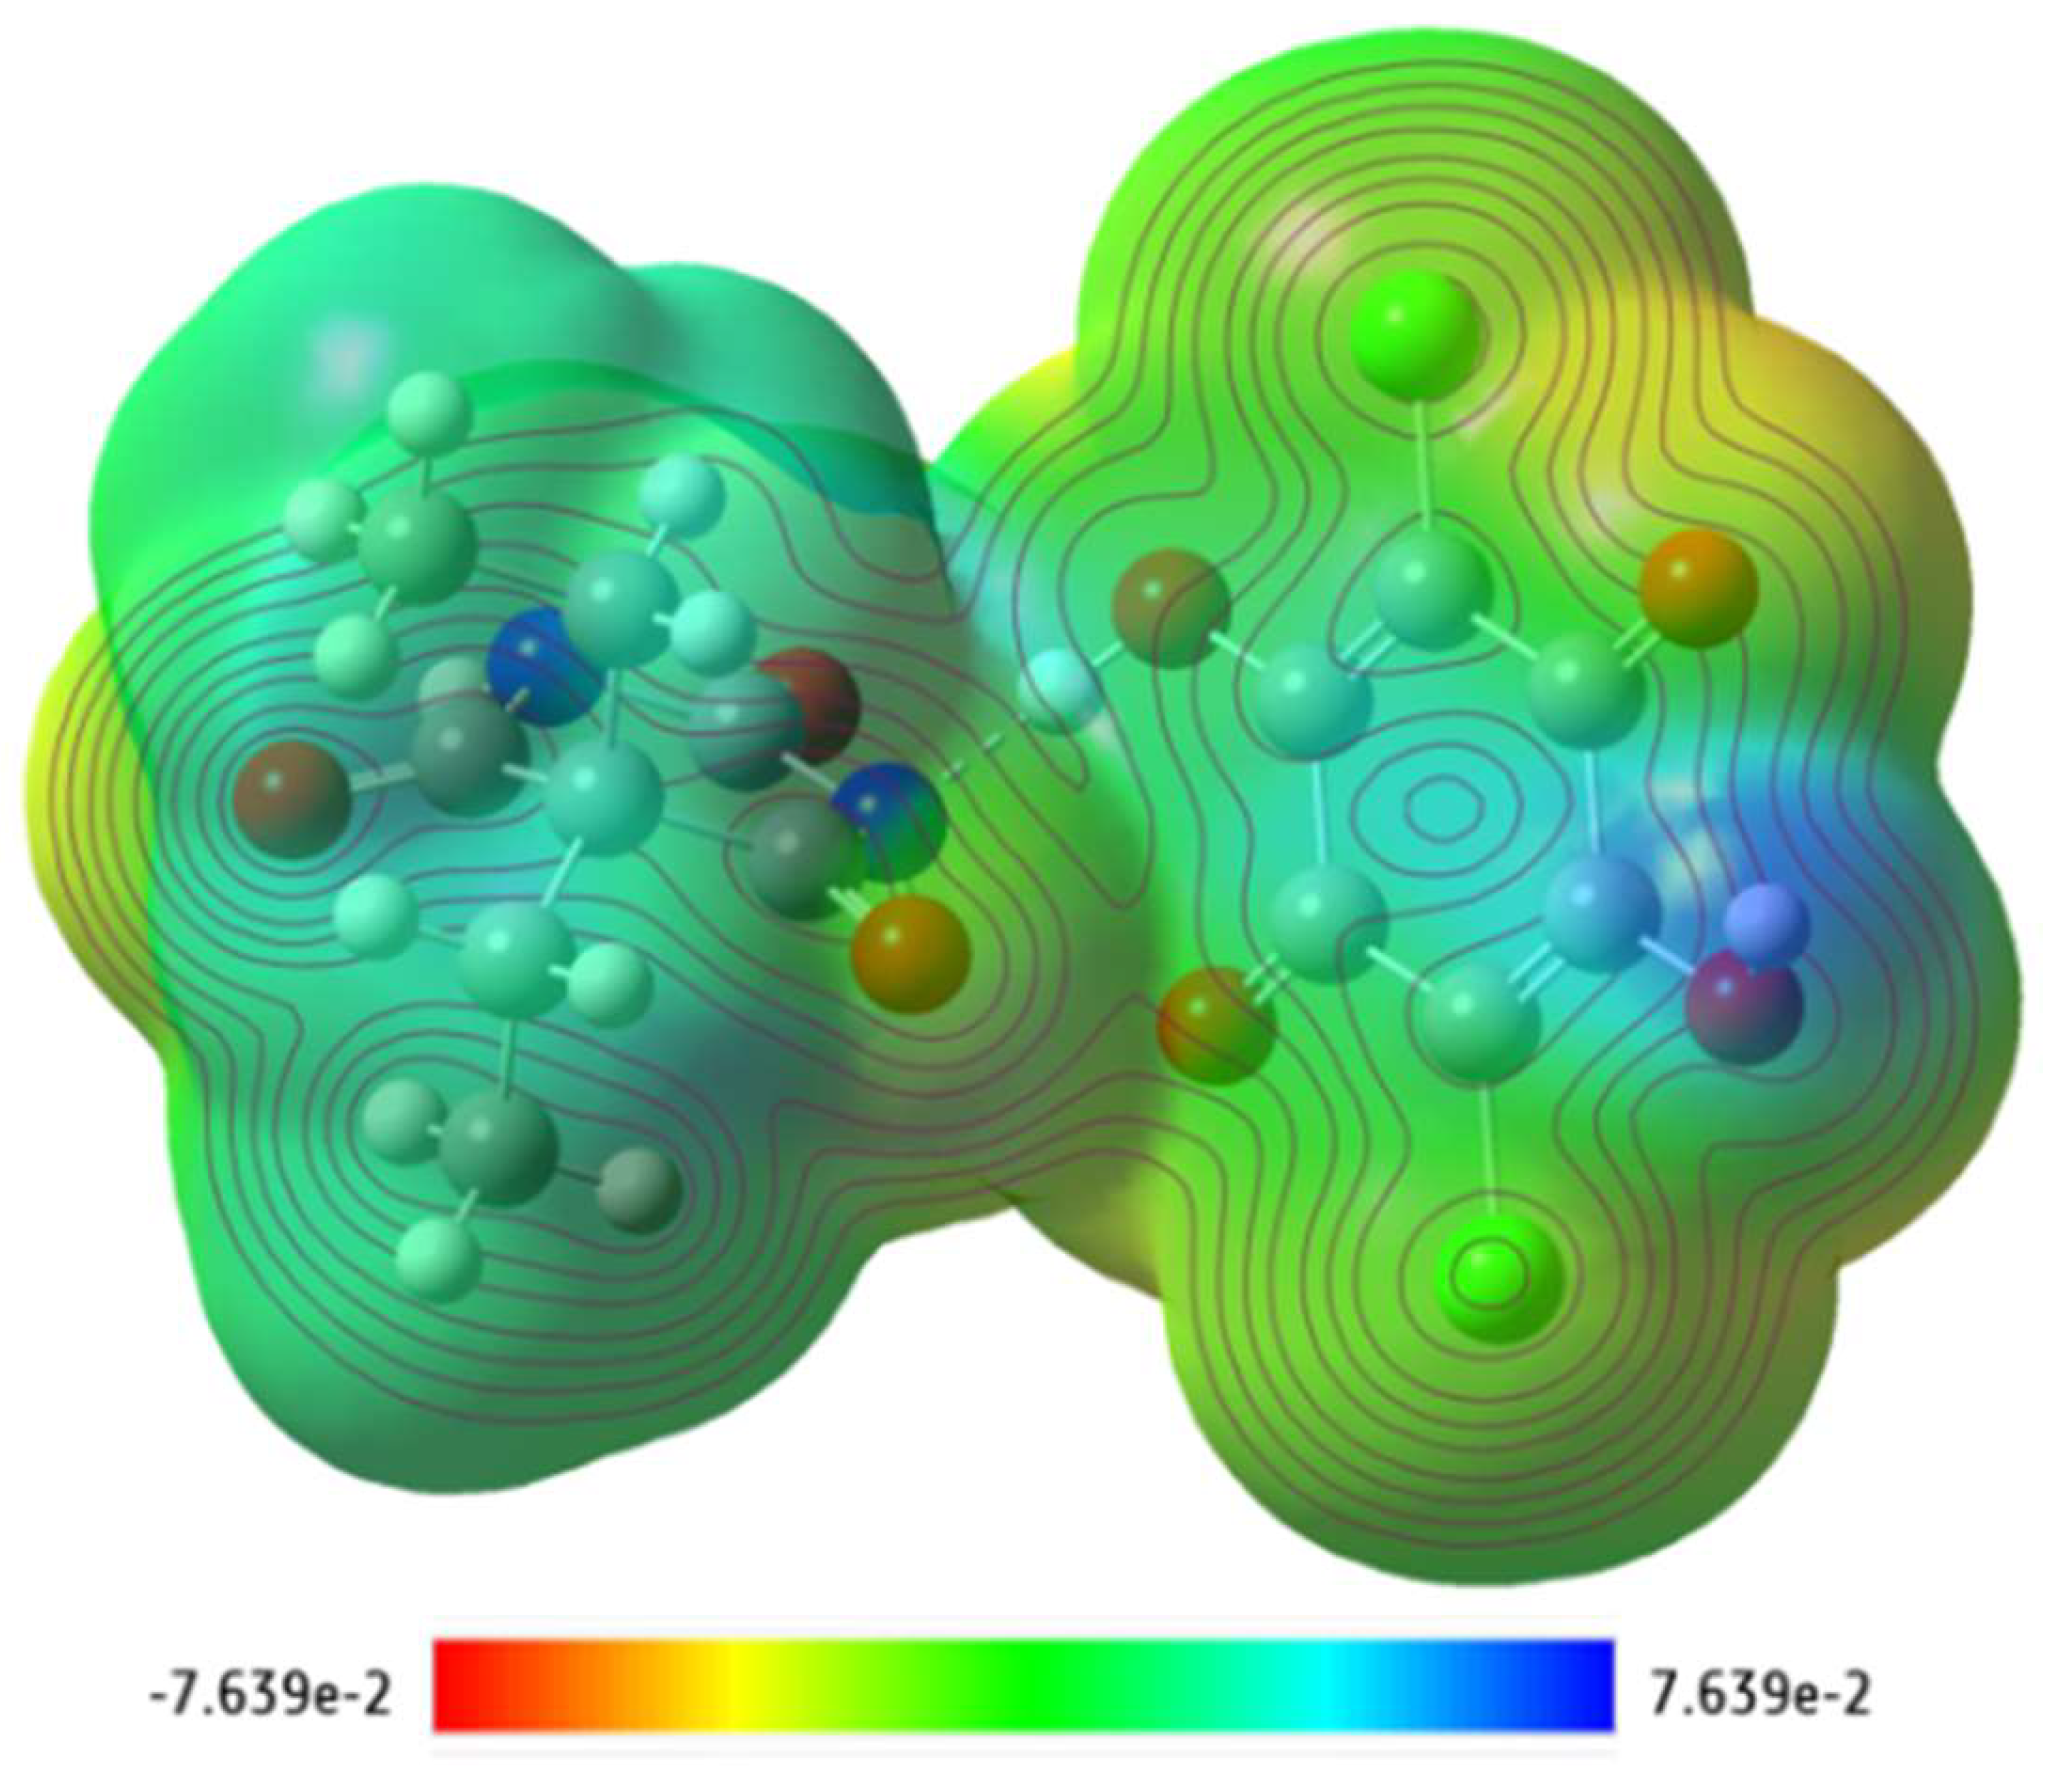
The molecular electrostatic potential (MEP) in connection to color grading can display charge distribution in 3D. The MEP makes it simple to determine the shape, size, chemical reactivity, and electrostatic potential of a substance. The strength of the electrostatic potentials of the (Bar–CLA) complex is represented through an MEP map (Figure 11).
The MEP surface generated by DFT describes the nucleophilic or electrophilic properties. Electropositive regions are shown in blue and electronegative zones are shown in red (Figure 11). The red region, referred to as the nucleophilic area and susceptible to electrophilic attack, indicates the highest negative range for (Bar–CLA), which was −7.639 × 10⁻² The maximum positive range, shown by a blue region and referred as an electrophilic area susceptible to nucleophilic attack, was +7.639 × 10⁻² (Figure 11). These results show the preferential binding sites for electrophilic and nucleophilic regions on the molecule [54,55]. The MEP surface map revealed, by evaluating the data, that all hydrogen atoms had positive potential values and that N, O, and Cl atoms had negative potential values.
The experimental electronic absorption spectra of (Bar–CLA) exhibited an absorption band with λmax at 520 nm [56]. By using the TD-DFT method in the gas phase, the nature of the electronic transitions was investigated (Figure S8). From TD-DFT calculations at 508 and 419 nm, two electronic absorption bands were produced (Figure S8). The first excited state (508 nm) was attributed to the HOMO to LUMO transition, whereas the second excited state (419 nm) was ascribed to the HOMO-1 to LUMO transition. The HOMO can be seen mainly in the CLA moiety of the (Bar–CLA) complex. The LUMO can be seen in the Bar moiety of the (Bar–CLA) complex [57]. The spatial arrangements of HOMO and LUMO, and the HOMO–LUMO gap, and associated energies are shown in Figure 12. The MO energy level diagram of the (Bar–CLA) is shown in Figure S9.
The HOMO to LUMO and HOMO-1 to LUMO gaps (∆E) for (Bar–CLA) were observed to be 2.4406 and 2.9533 eV, respectively (Figure 12) [58]. Table S6 lists a few gas-phase molecular parameters according to HOMO–LUMO plot.
The FTIR spectrum was explored by the DFT, B3LYP/6-311G++ level of theory (Figure 13).
Major vibrational bands that were observed in the (Bar–CLA) complex’s FTIR spectrum were found to resemble simulated IR spectrum patterns. The slight difference between theoretical and experimental frequencies is due to the theoretical values being acquired in the gas phase whereas experimental values were obtained in the solid phase. Therefore, to reduce these differences, the scaling factor 0.8924 was used. For the (Bar–CLA) complex, the simulated frequency for ν(N–H) appears at 3277 & 3372 cm−1. The band appearing at 1514 cm−1 represents ν(C=O). The bands that appeared at 1460 cm−1 is due to ν(C=C), 1425 cm−1 is for δ(N–H), and 1375 is for δ(C–H). These calculated vibrational frequencies vary to a small extent from experimental results due to neglecting the incompleteness and anharmonicity of the basis set [59].

4. Conclusions

In the current study, the intermolecular charge-transfer compounds associated with the chemical reactions between Bar and some π acceptors have been synthesized and isolated in the solid state. The synthesized compounds exhibit a 1:1 stoichiometry structure, according to multiple analytical techniques. According to molecular docking analysis, the (Bar–CLA) complex interacts with serotonin and dopamine receptors more effectively than did all other complexes as well as the free reactant donor (Bar) alone. The (Bar–CLA)–serotonin complex had the greatest binding energy value of all the compounds. The 100 ns-run molecular dynamic simulation revealed higher RMSD values for the (Bar)–serotonin complex compared to the (Bar–CLA)–serotonin complex. The theoretical data obtained by DFT calculations helped to explore the molecular geometry of the (Bar–CLA) complex.

Supplementary Materials

The following supporting information can be downloaded at: https://www.mdpi.com/article/10.3390/app121910130/s1. Figure S1. The IR spectra of Bar-CT complexes. Figure S2: The 1H NMR spectra of Bar-CT complexes. Figure S3: The docking results of (Bar-CLA)-serotonin complex. a: aromatic surface, b: hydrogen binding surface, c: hydrophobic surface, d: ionizability surface, e: solvent accessible surface, and f: Interpolated charge [(FXN)(PA)]. Figure S4: The docking results of (Bar)-serotonin complex. a: aromatic surface, b: hydrogen binding surface, c: hydrophobic surface, d: ionizability surface, e: solvent accessible surface, and f: Interpolated charge. Figure S5: Number of average hydrogen bonding interactions between (a) BarScomplex and (b) BarCS complex during 100 ns simulation time. Figure S6: Solvent accessible surface area analysis for unbound serotonin receptor (black), BarS complex (orange) and BarCS complex (green) during 100 ns simulation time. Figure S7: Optimization Steps for (Bar-CLA) (B3LYP/6-311G++). Figure S8: UV-visible spectrum of (Bar-CLA) obtained through TD-DFT calculations. Figure S9: MO energy level diagram of the CT complex (Bar-CLA). Table S1: (Bar-CLA)-dopamine interactions results by DS. Table S2: Bar-dopamine interactions results by DS. Table S3: The bond lengths of the CT complex (Bar-CLA) obtained through DFT. Table S4: The bond angles of the CT complex (Bar-CLA) obtained through DFT. Table S5: Mulliken atomic charges of the CT complex (Bar-CLA) atoms. Table S6: Theoretical molecular properties of (Bar-CLA) complex and their constituents.

Author Contributions

Conceptualization, visualization, and investigation, A.A., O.A., H.A.A., R.I.F. and H.H.; data curation, formal analysis, and methodology, S.S., M.S.R., A.S.A., W.F.A. and A.G.; writing, review, and editing, A.G., M.S.R., S.S., M.A., A.S.A., W.F.A., A.A.A. and H.A.; funding acquisition, M.A. and W.F.A. All authors have read and agreed to the published version of the manuscript.

Funding

The authors expand their gratitude to the Deputyship for Research and Innovation, Ministry of Education in Saudi Arabia for funding this work through project number 1-441-120.

Institutional Review Board Statement

Not applicable.

Informed Consent Statement

Not applicable.

Data Availability Statement

Data is contained within article.

Acknowledgments

The authors are grateful to Christian M. Nefzgar, Institute for Molecular Bioscience, The University of Queensland, Brisbane, QLD, Australia, for his technical support.

Conflicts of Interest

The authors declare no conflict of interest.

References

  1. Patrick, G.L. An Introduction to Medicinal Chemistry, 4th ed.; Oxford University Press: Oxford, UK, 2009; p. 752. [Google Scholar]
  2. Muthiah, P.T.; Hemamalini, M.; Bocelli, G.; Cantoni, A. Hydrogen-bonded supramolecular motifs in crystal structures of trimethoprim barbiturate monohydrate (I) and 2-amino-4,6-dimethylpyrimidinium barbiturate trihydrate (II). Struct. Chem. 2007, 18, 171. [Google Scholar] [CrossRef]
  3. Habibi, A.; Tarameshloo, Z. A new and convenient method for synthesis of barbituric acid derivatives. Iran J. Chem. Soc. 2011, 8, 287. [Google Scholar] [CrossRef]
  4. Vieira, A.; Gomes, N.; Matheus, M.; Fernandes, P.; Figueroa-Villar, J.; Braz, J. Synthesis and In Vivo Evaluation of 5-Chloro-5-benzobarbiturates as New Central Nervous System Depressants. Chem. Soc. 2011, 22, 364. [Google Scholar] [CrossRef]
  5. Mallah, E.; Sweidan, K.; Engelmann, J.; Steimann, M.; Kuhn, N.; Maier, M.E. Nucleophilic substitution approach towards 1,3-dimethylbarbituric acid derivatives—New synthetic routes and crystal structures. Tetrahedron 2012, 68, 1005. [Google Scholar] [CrossRef]
  6. Mohamed, M.E.; Frag, E.Y.Z.; Hathoot, A.A.; Shalaby, E.A. Spectrophotometric determination of fenoprofen calcium drug in pure and pharmaceutical preparations. Spectroscopic characterization of the charge transfer solid complexes. Spectrochim. Acta A 2018, 189, 357. [Google Scholar] [CrossRef]
  7. Shehab, O.R.; AlRabiah, H.; Abdel-Aziz, H.A.; Mostafa, G.A.E. Charge-transfer complexes of cefpodoxime proxetil with chloranilic acid and 23-dichloro-56-dicyano-14-benzoquinone: Experimental and theoretical studies. J. Mol. Liq. 2018, 257, 42. [Google Scholar] [CrossRef]
  8. Mohamed, G.G.; Hamed, M.M.; Zaki, N.G.; Abdou, M.M.; Mohamed, M.E.; Abdallah, A.M. Melatonin charge transfer complex with 2,3-dichloro-5,6-dicyano-1,4-benzoquinone: Molecular structure, DFT studies, thermal analyses, evaluation of biological activity and utility for determination of melatonin in pure and dosage forms. Spectrochim. Acta A 2017, 182, 143. [Google Scholar] [CrossRef]
  9. Adegoke, O.A.; Babalola, C.P.; Kotila, O.A.; Obuebhor, O. Simultaneous spectrophotometric determination of trimethoprim and sulphamethoxazole following charge-transfer complexation with chloranilic acid. Arab. J. Chem. 2017, 10 (Suppl. 2), S3848. [Google Scholar] [CrossRef] [Green Version]
  10. Sawsan, A.A.; Nahla, S.N.; Manal, F.M.; Shimaa, A.; Naglaa, E. Spectrophotometric determination and thermodynamic studies of the charge transfer complexation of emedastine difumarate with some π-acceptors. Arab. J. Chem. 2017, 10 (Suppl. 2), S1855. [Google Scholar] [CrossRef] [Green Version]
  11. Ismail, N.B.S.; Narayana, B. Spectrophotometric and spectroscopic studies on charge transfer complexes of the antifungal drug clotrimazole. JTUSCI11 2017, 5, 710. [Google Scholar] [CrossRef]
  12. Adegoke, O.A.; Thomas, O.E.; Emmanuel, S.N. Colorimetric determination of olanzapine via charge-transfer complexation with chloranilic acid. JTUSCI 2016, 10, 651. [Google Scholar]
  13. Abdulrahman, S.A.M.; Devi, O.Z.; Basavaiah, K.; Vinay, K.B. Use of picric acid and iodine as electron acceptors for spectrophotometric determination of lansoprazole through a charge-transfer complexation reaction. JTUSCI 2016, 10, 80. [Google Scholar] [CrossRef] [Green Version]
  14. Rahman, N.; Sameen, S.; Kashif, M. Spectroscopic study of charge transfer complexation between doxepin and π–acceptors and its application in quantitative analysis. J. Mol. Liq. 2016, 222, 944. [Google Scholar] [CrossRef]
  15. Belal, T.S.; El-Kafrawy, D.S.; Mahrous, M.S.; Abdel-Khalek, M.M.; Abo-Gharam, A.H. Validated spectrophotometric methods for determination of sodium valproate based on charge transfer complexation reactions. Spectrochim. Acta A 2016, 155, 47. [Google Scholar]
  16. Gouda, A.A.; Kasssem, M. Novel spectrophotometric methods for determination of desloratidine in pharmaceutical formulations based on charge transfer reaction. Arab. J. Chem. 2016, 9 (Suppl. 2), S1712. [Google Scholar] [CrossRef] [Green Version]
  17. Alzoman, N.Z.; Alshehri, J.M.; Darwish, I.A.; Khalil, N.Y.; Abdel-Rahman, H.M. Charge-transfer reaction of 2,3-dichloro-1,4-naphthoquinone with crizotinib: Spectrophotometric study, computational molecular modeling and use in development of microwell assay for crizotinib. Saudi Pharm. J. 2015, 23, 75. [Google Scholar]
  18. Elqudaby, H.M.; Mohamed, G.G.; El-Din, G.M.G. Analytical studies on the charge transfer complexes of loperamide hydrochloride and trimebutine drugs. Spectroscopic and thermal characterization of CT complexes. Spectrochim. Acta A 2014, 129, 84. [Google Scholar] [CrossRef]
  19. Soltani, S.; Magri, P.; Rogalski, M.; Kadri, M. Charge-transfer complexes of hypoglycemic sulfonamide with π-acceptors: Experimental and DFT-TDDFT studies. J. Mol. Struct. 2019, 1175, 105. [Google Scholar]
  20. Fathima, K.S.; Sathiyendran, M.; Anitha, K. Structure elucidation, biological evaluation and molecular docking studies of 3-aminoquinolinium 2-carboxy benzoate- A proton transferred molecular complex. J. Mol. Struct. 2019, 1176, 238. [Google Scholar] [CrossRef]
  21. Man, L.; Li, T.; Wu, X.; Lu, K.; Yang, L.; Liu, X.; Yang, Z.; Zhou, J.; Ni, C. Synthesis, crystal structure, vibrational spectra, nonlinear optical property of an organic charge-transfer compound―4-nitrobenzyl isoquinolinium picrate based on DFT calculations. J. Mol. Struct. 2019, 1175, 971. [Google Scholar] [CrossRef]
  22. Afroz, Z.; Faizan, M.; Alam, M.J.; Rodrigues, V.H.N.; Ahmad, S.; Ahmad, A. Synthesis, structural, hirshfeld surface, spectroscopic studies and quantum chemical calculation of the proton transfer complex between 2-amino-4-hydroxy-6-methylpyrimidine and salicylic acid. J. Mol. Struct. 2018, 1171, 438. [Google Scholar] [CrossRef]
  23. Alghanmi, R.M.; Soliman, S.M.; Basha, M.T.; Habeeb, M.M. Electronic spectral studies and DFT computational analysis of hydrogen bonded charge transfer complexes between chloranilic acid and 2,5-dihydroxy-p-benzoquinone with 2-amino-4-methylbenzothiazole in methanol. J. Mol. Liq. 2018, 256, 433. [Google Scholar] [CrossRef]
  24. Al-Ahmary, K.M.; Habeeb, M.M.; Al-Obidan, A.H. Charge transfer complex between 2,3-diaminopyridine with chloranilic acid. Synthesis, characterization and DFT, TD-DFT computational studies. Spectrochim. Acta A 2018, 196, 247. [Google Scholar] [CrossRef] [PubMed]
  25. Alhomrani, M.; Alsanie, W.F.; Alamri, A.S.; Alyami, H.; Habeeballah, H.; Alkhatabi, H.A.; Felimban, R.I.; Haynes, J.M.; Shakya, S.; Raafat, B.M.; et al. Enhancing the Antipsychotic Effect of Risperidone by Increasing Its Binding Affinity to Serotonin Receptor via Picric Acid: A Molecular Dynamics Simulation. Pharmaceuticals 2022, 15, 285. [Google Scholar] [CrossRef] [PubMed]
  26. Alsanie, W.F.; Alamri, A.S.; Alyami, H.; Alhomrani, M.; Shakya, S.; Habeeballah, H.; Alkhatabi, H.A.; Felimban, R.I.; Alzahrani, A.S.; Alhabeeb, A.A.; et al. Increasing the Efficacy of Seproxetine as an Antidepressant Using Charge-Transfer Complexes. Molecules 2022, 27, 3290. [Google Scholar] [CrossRef] [PubMed]
  27. Alamri, A.S.; Alhomrani, M.; Alsanie, W.F.; Alyami, H.; Shakya, S.; Habeeballah, H.; Alamri, A.; Alzahrani, O.; Alzahrani, A.S.; Alkhatabi, H.A.; et al. Enhancement of Haloperidol Binding Affinity to Dopamine Receptor via Forming a Charge-Transfer Complex with Picric Acid and 7,7,8,8-Tetracyanoquinodimethane for Improvement of the Antipsychotic Efficacy. Molecules 2022, 27, 3295. [Google Scholar] [CrossRef] [PubMed]
  28. O’Boyle, N.M.; Banck, M.; James, C.A.; Morley, C.; Vandermeersch, T.; Hutchison, G.R. Open Babel: An open chemical toolbox. J. Cheminform. 2011, 3, 33. [Google Scholar] [CrossRef] [Green Version]
  29. Dallakyan, S. PyRx-Python Prescription v. 0.8; The Scripps Research Institute: San Diego, CA, USA, 2008. [Google Scholar]
  30. Chu, C.-H.; Li, K.-M.; Lin, S.-W.; Chang, M.D.-T.; Jiang, T.-Y.; Sun, Y.-J. Crystal structures of starch binding domain from Rhizopusoryzaeglucoamylase in complex with isomaltooligosaccharide: Insights into polysaccharide binding mechanism of CBM21 family. Proteins Struct. Funct. Bioinform. 2014, 82, 1079–1085. [Google Scholar] [CrossRef]
  31. Rehman, M.T.; AlAjmi, M.F.; Hussain, A. Natural compounds as inhibitors of SARS-CoV-2 main protease (3CLpro): A molecular docking and simulation approach to combat COVID-19. Curr. Pharm. Des. 2021, 27, 3577–3589. [Google Scholar] [CrossRef]
  32. Trott, O.; Olson, A.J. AutoDockVina: Improving the speed and accuracy of docking with a new scoring function, efficient optimization, and multithreading. J. Comput. Chem. 2010, 31, 455–461. [Google Scholar]
  33. Bekker, H.; Berendsen, H.J.C.; Dijkstra, E.J.; Achterop, S.; Vondrumen, R.; Vanderspoel, D.; Sijbers, A.; Keegstra, H.; Renardus, M.K.R. Gromacs—A parallel computer for molecular-dynamics simulations. In Proceedings of the 4th International Conference on Computational Physics (PC 92), Prague, Czech Republic, 24–28 August 1992; World Scientific Publishing: Singapore, 1993; pp. 252–256. [Google Scholar]
  34. Yu, W.; He, X.; Vanommeslaeghe, K.; MacKerell, A.D., Jr. Extension of the CHARMM General Force Field to sulfonylcontaining compounds and its utility in biomolecular simulations. J. Comput. Chem. 2012, 33, 2451–2468. [Google Scholar] [CrossRef] [Green Version]
  35. Abraham, M.J.; Murtola, T.; Schulz, R.; Páll, S.; Smith, J.C.; Hess, B.; Lindahl, E. GROMACS: High performance molecular simulations through multi-level parallelism from laptops to supercomputers. SoftwareX 2015, 1, 19–25. [Google Scholar] [CrossRef] [Green Version]
  36. Allen, M.P.; Tildesley, D.J. Computer Simulations of Liquids; Clarendon Press: Oxford, UK, 1987. [Google Scholar]
  37. Oostenbrink, C.; Villa, A.; Mark, A.E.; Van Gunsteren, W.F. A biomolecular force field based on the free enthalpy of hydration and solvation: The GROMOS force-field parameter sets 53A5 and 53A6. J. Comput. Chem. 2004, 25, 1656–1676. [Google Scholar] [CrossRef]
  38. Steinbach, P.J.; Brooks, B.R. New Spherical-Cutoff Methods for Long-Range Forces in Macromolecular Simulation. J. Comput. Chem. 1994, 15, 667–683. [Google Scholar] [CrossRef]
  39. DeLano, W.L. PyMOL; DeLano Scientific: Palo Alto, CA, USA, 2002. [Google Scholar]
  40. Lee, H.K.; Zhang, L.; Smith, M.D.; Walewska, A.; Vellore, N.A.; Baron, R.; McIntosh, J.M.; White, H.S.; Olivera, B.M.; Bulaj, G. A marine analgesic peptide, Contulakin-G, and neurotensin are distinct agonists for neurotensin receptors: Uncovering structural determinants of desensitization properties. Front. Pharmacol. 2015, 6, 11. [Google Scholar] [CrossRef]
  41. Frisch, M.J.; Clemente, F.R. Gaussian 09, Revision A. 01; Gaussian, Inc.: Wallingford, CT, USA, 2009; pp. 20–44. [Google Scholar]
  42. Hariharan, P.C.; Pople, J.A. The effect of d-functions on molecular orbital energies for hydrocarbons. Chem. Phys. Lett. 1972, 16, 217–219. [Google Scholar] [CrossRef]
  43. Zhurko, G.A.; Zhurko, D.A. Chemcraft—Graphical Program for Visualization of Quantum Chemistry Computations, Academic Version 1.5; Grigoriy Andrienko: Ivanovo, Russia, 2004; Available online: https://www.chemcraftprog.com/ (accessed on 5 September 2022).
  44. Shakya, B.; Shakya, S.; Hasan Siddique, Y. Effect of geraniol against arecoline induced toxicity in the third instar larvae of transgenic Drosophila melanogaster (hsp70-lacZ) Bg9. Toxicol. Mech. Methods 2019, 29, 187–202. [Google Scholar] [CrossRef]
  45. Skoog, D.A. Principle of Instrumental Analysis, 3rd ed.; Saunders: New York, NY, USA, 1985; Chapter 7. [Google Scholar]
  46. Ding, X.; Li, Y.; Wang, S.; Li, X.; Huang, W. Proton-transfer supramolecular salts based on proton sponge 2,2′-dipyridylamin. J. Mol. Struct. 2013, 1051, 124. [Google Scholar] [CrossRef]
  47. Ding, X.; Li, Y.; Wang, S.; Li, X.; Huang, W. Proton-transfer supramolecular salts of d-/l-tartaric acid and 1-(2-Pyrimidyl)piperazine. J. Mol. Struct. 2014, 1062, 61. [Google Scholar] [CrossRef]
  48. Akram, M.; Lal, H.; Shakya, S.; Kabir-ud-Din. Multispectroscopic and Computational Analysis Insight into the Interaction of Cationic Diester-Bonded Gemini Surfactants with Serine Protease α-Chymotrypsin. ACS Omega 2020, 5, 3624–3637. [Google Scholar] [CrossRef] [PubMed]
  49. Khan, I.M.; Shakya, S.; Islam, M.; Khan, S.; Najnin, H. Synthesis and spectrophotometric studies of CT complex between 1, 2-dimethylimidazole and picric acid in different polar solvents: Exploring antimicrobial activities and molecular (DNA) docking. Phys. Chem. Liq. 2021, 59, 753–769. [Google Scholar] [CrossRef]
  50. Krivák, R.; Jendele, L.; Hoksza, D. Peptide-Binding Site Prediction from Protein Structure via points on the Solvent Accessible Surface. In Proceedings of the 2018 ACM International Conference on Bioinformatics, Computational Biology, and Health Informatics, Washington, DC, USA, 29 August–1 September 2018; p. 645. [Google Scholar]
  51. Ranjbar, A.; Jamshidi, M.; Torabi, S. Molecular modelling of the antiviral action of Resveratrol derivatives against the activity of two novel SARS-CoV-2 and 2019-nCoV receptors. Eur. Rev. Med. Pharmacol. Sci. 2020, 24, 7834–7844. [Google Scholar] [PubMed]
  52. Kufareva, I.; Abagyan, R. Methods of protein structure comparison. Methods Mol. Biol. 2012, 857, 231–257. [Google Scholar]
  53. Wu, S.; Zhang, Y. A comprehensive assessment of sequence-based and template-based methods for protein contact prediction. Bioinformatics 2008, 24, 924–931. [Google Scholar] [CrossRef] [Green Version]
  54. Shakya, S.; Khan, M.I.; Ahmad, M. Charge transfer complex based real-time colorimetric chemosensor for rapid recognition of dinitrobenzene and discriminative detection of Fe2+ ions in aqueous media and human hemoglobin. J. Photochem. Photobiol. A Chem. 2020, 392, 112402. [Google Scholar] [CrossRef]
  55. Islam, M.R.; Shakya, S.; Selim, A.; Alam, M.S.; Ali, M. Solvatochromic Absorbance and Fluorescence Probe Behavior within Ionic Liquid+ γ-Butyrolactone Mixture. J. Chem. Eng. Data 2019, 64, 4169–4180. [Google Scholar] [CrossRef]
  56. Al-Saif, F.A.; El-Habeeb, A.A.; Refat, M.S.; Adam, A.M.A.; Saad, H.A.; El-Shenawy, A.I.; Fetooh, H. Characterization of charge transfer products obtained from the reaction of the sedative-hypnotic drug barbital with chloranilic acid, chloranil, TCNQ and DBQ organic acceptors. J. Mol. Liq. 2019, 287, 110981. [Google Scholar] [CrossRef]
  57. Murugavel, S.; Ravikumar, C.; Jaabil, G.; Alagusundaram, P. Synthesis, crystal structure analysis, spectral investigations (NMR, FT-IR, UV), DFT calculations, ADMET studies, molecular docking and anticancer activity of 2-(1-benzyl-5-methyl-1H-1, 2, 3-triazol-4-yl)-4-(2-chlorophenyl)-6-methoxypyridine—A novel potent human topoisomerase IIα inhibitor. J. Mol. Struct. 2019, 1176, 729–742. [Google Scholar]
  58. Khan, I.M.; Shakya, S. Exploring Colorimetric Real-Time Sensing Behavior of a Newly Designed CT Complex toward Nitrobenzene and Co2+: Spectrophotometric, DFT/BarCS-DFT, and Mechanistic Insights. ACS Omega 2019, 4, 9983–9995. [Google Scholar] [CrossRef]
  59. Foresman, J.B. Exploring Chemistry with Electronic Structure Methods: A Guide to Using Gaussian; Frisch, E., Ed.; Gaussian: Pittsburg, PA, USA, 1996. [Google Scholar]
Figure 1. Receptor–ligand complex (a) (Bar)–Serotonin and (b) (Bar–CLA)–serotonin with 27 Na+ and 29 Cl ions for neutralizing in a triclinic box solvated with water molecules.
Applsci 12 10130 g001
Figure 2. Suggested structures of barbital (Bar) charge transfer complexes.
Applsci 12 10130 g002
Figure 3. Serotonin (PDB ID: 6BQH) helical model in the best docking position with (a) (Bar–CLA) complex or (b) Bar alone.
Applsci 12 10130 g003
Figure 4. The 3D illustration of a serotonin receptor docked with (a) (Bar–CLA) complex and (b) Bar alone.
Applsci 12 10130 g004
Figure 5. Two-dimensional illustrations of a serotonin receptor docked with (a) (Bar–CLA) complex and (b) Bar alone.
Applsci 12 10130 g005
Figure 6. The RMSD over 100 ns. The black color represents serotonin receptor alone, orange color represents the BarS complex, and green color represents the BarCS complex.
Applsci 12 10130 g006
Figure 7. Superimposed structures of (a) unbounded serotonin (pink) and serotonin after simulation (orange) for BarS and (b) serotonin after simulation (green) for BarCS.
Applsci 12 10130 g007
Figure 8. The Rg data over 100 ns simulation time. Black color represents serotonin receptor alone, orange color represents the BarS complex, and green color represents the BarCS complex.
Applsci 12 10130 g008
Figure 9. Optimized structure of the (Bar–CLA) complex with the Mulliken atom-numbering scheme.
Applsci 12 10130 g009
Figure 10. Optimized structure of the (Bar–CLA) complex showing bond lengths.
Applsci 12 10130 g010
Figure 11. MEP surface map of the (Bar–CLA) complex with respective color scales.
Applsci 12 10130 g011
Figure 12. HOMO, HOMO-1 and LUMO plot. Numbers represent energy gaps.
Applsci 12 10130 g012
Figure 13. Simulated FTIR spectrum of (Bar–CLA) by DFT.
Applsci 12 10130 g013
Table 1. The spectroscopic characterization of all Barbital CT complexes.
CT ComplexM.Wt
g/mol
F.WtElemental
Analysis %
(Calcd.)
Infrared
Assignments
cm−1
1HNMR
Assignments
δ (ppm)
(Bar–CLA)393.17C14H14Cl2N2O7N; 7.07 (7.12)
H; 3.50 (3.56)
C; 42.66 (42.73)
1174; νs(C–N)
1270; νas(C–N)
1368 and 1456; δ(C–H)
1544; ν(C=C)
1625; δ(N–H)
1674 and 1712; νs(C=O)
1771; νas(C=O)
3220 and 3170; ν(N–H)
11.37; (s, 2H, 2NH)
10.05; (s, 2H, 2OH)
1.89; (q, 4H, 2CH2)
0.81; (t, 6H, 2CH3)
(Bar–CHL)430.05C14H12Cl4N2O5N; 6.43 (6.51)
H; 2.84 (2.79)
C; 39.13 (39.07)
1107; νs(C–N)
1320; νas(C–N)
1371 and 1439; δ(C–H)
1460; ν(C=C)
1574; δ(N–H)
1684; νs(C=O)
1752; νas(C=O)
3160 and 3242; ν(N–H)
11.17; (s, 2H, 2NH)
1.92; (q, 4H, 2CH2)
0.83; (t, 6H, 2CH3)
(Bar–TCNQ)388.38C20H16N6O3N; 21.70 (21.63)
H; 4.08 (4.12)
C; 61.75 (61.80)
1138; νs(C–N)
1321; νas(C–N)
1380 and 1468; δ(C–H)
1521; ν(C=C)
1675; δ(N–H)
1714; νs(C=O)
1763; νas(C=O)
2223; ν(C≡N)
3171 and 3209; ν(N–H)
11.33; (s, 2H, 2NH)
7.72; (s, 4H, ArH)
1.90; (q, 4H, 2CH2)
0.82; (t, 6H, 2CH3)
(Bar–DBQ)483.54C14H14Br2ClN3O4N; 8.64 (8.69)
H; 2.96 (2.90)
C; 34.70 (34.74)
1157; νs(C–N)
1241; νas(C–N)
1380 and 1409; δ(C–H)
1473; ν(C=C)
1568; ν(C=N)
1669; δ(N–H)
1718; νs(C=O)
1767; νas(C=O)
3168 and 3256; ν(N–H)
11.31; (s, 2H, 2NH)
7.27; (s, 2H, ArH)
1.91; (q, 4H, 2CH2)
0.80; (t, 6H, 2CH3)
Table 2. Docking score of Bar and four synthesized CT complexes against serotonin (6BQH) and dopamine (6CM4).
Docking Score (kcal/mol)
PDB:6BQHPDB:6CM4
(Bar–CHL)−7.7−6.9
(Bar–TCNQ)−8.1−7.1
(Bar–DBQ)−7.5−7.2
(Bar–CLA)−8.2−7.8
Bar−5.3−5.1
Table 3. The interaction data between (Bar–CLA) or Bar and serotonin (6BQH).
ReceptorBinding Free Energy (kcal/mol)Interactions
HBondOthers
(Bar–CLA)−8.2Thr386, Lys385, Lys320, Asn110, and Asn107Ala321, Val324, Leu105, and Lys104 (π–alkyl)
Bar−5.3Arg173, Asn187, and His182Ala176 and Ile177 (π–alkyl)
Table 4. Binding free energies (± standard deviations) from MM-PBSA calculations for BarCS complex and BarS complex.
Energies in (kJ/mol)
BarCS ComplexBarS Complex
Binding energy (Total)−40.642 ± 4.324−31.089 ± 9.997
Van der Waals energy (EvdW)−83.954 ± 7.623−39.276 ± 11.001
Electrostatic energy (Eelec)−186.670 ± 4.302−288.981 ± 8.653
Nonpolar solvation energy (Gnonpolar)−58.527 ± 3.121−31.801 ± 9.741
Polar solvation energy (Gpolar)288.509 ± 2.652328.969 ± 3.955
Publisher’s Note: MDPI stays neutral with regard to jurisdictional claims in published maps and institutional affiliations.