
Modeling the Ignition Risk: Analysis before and after Megafire on Maule Region, Chile
 ,
,
Abstract
:1. Introduction
2. Case Background
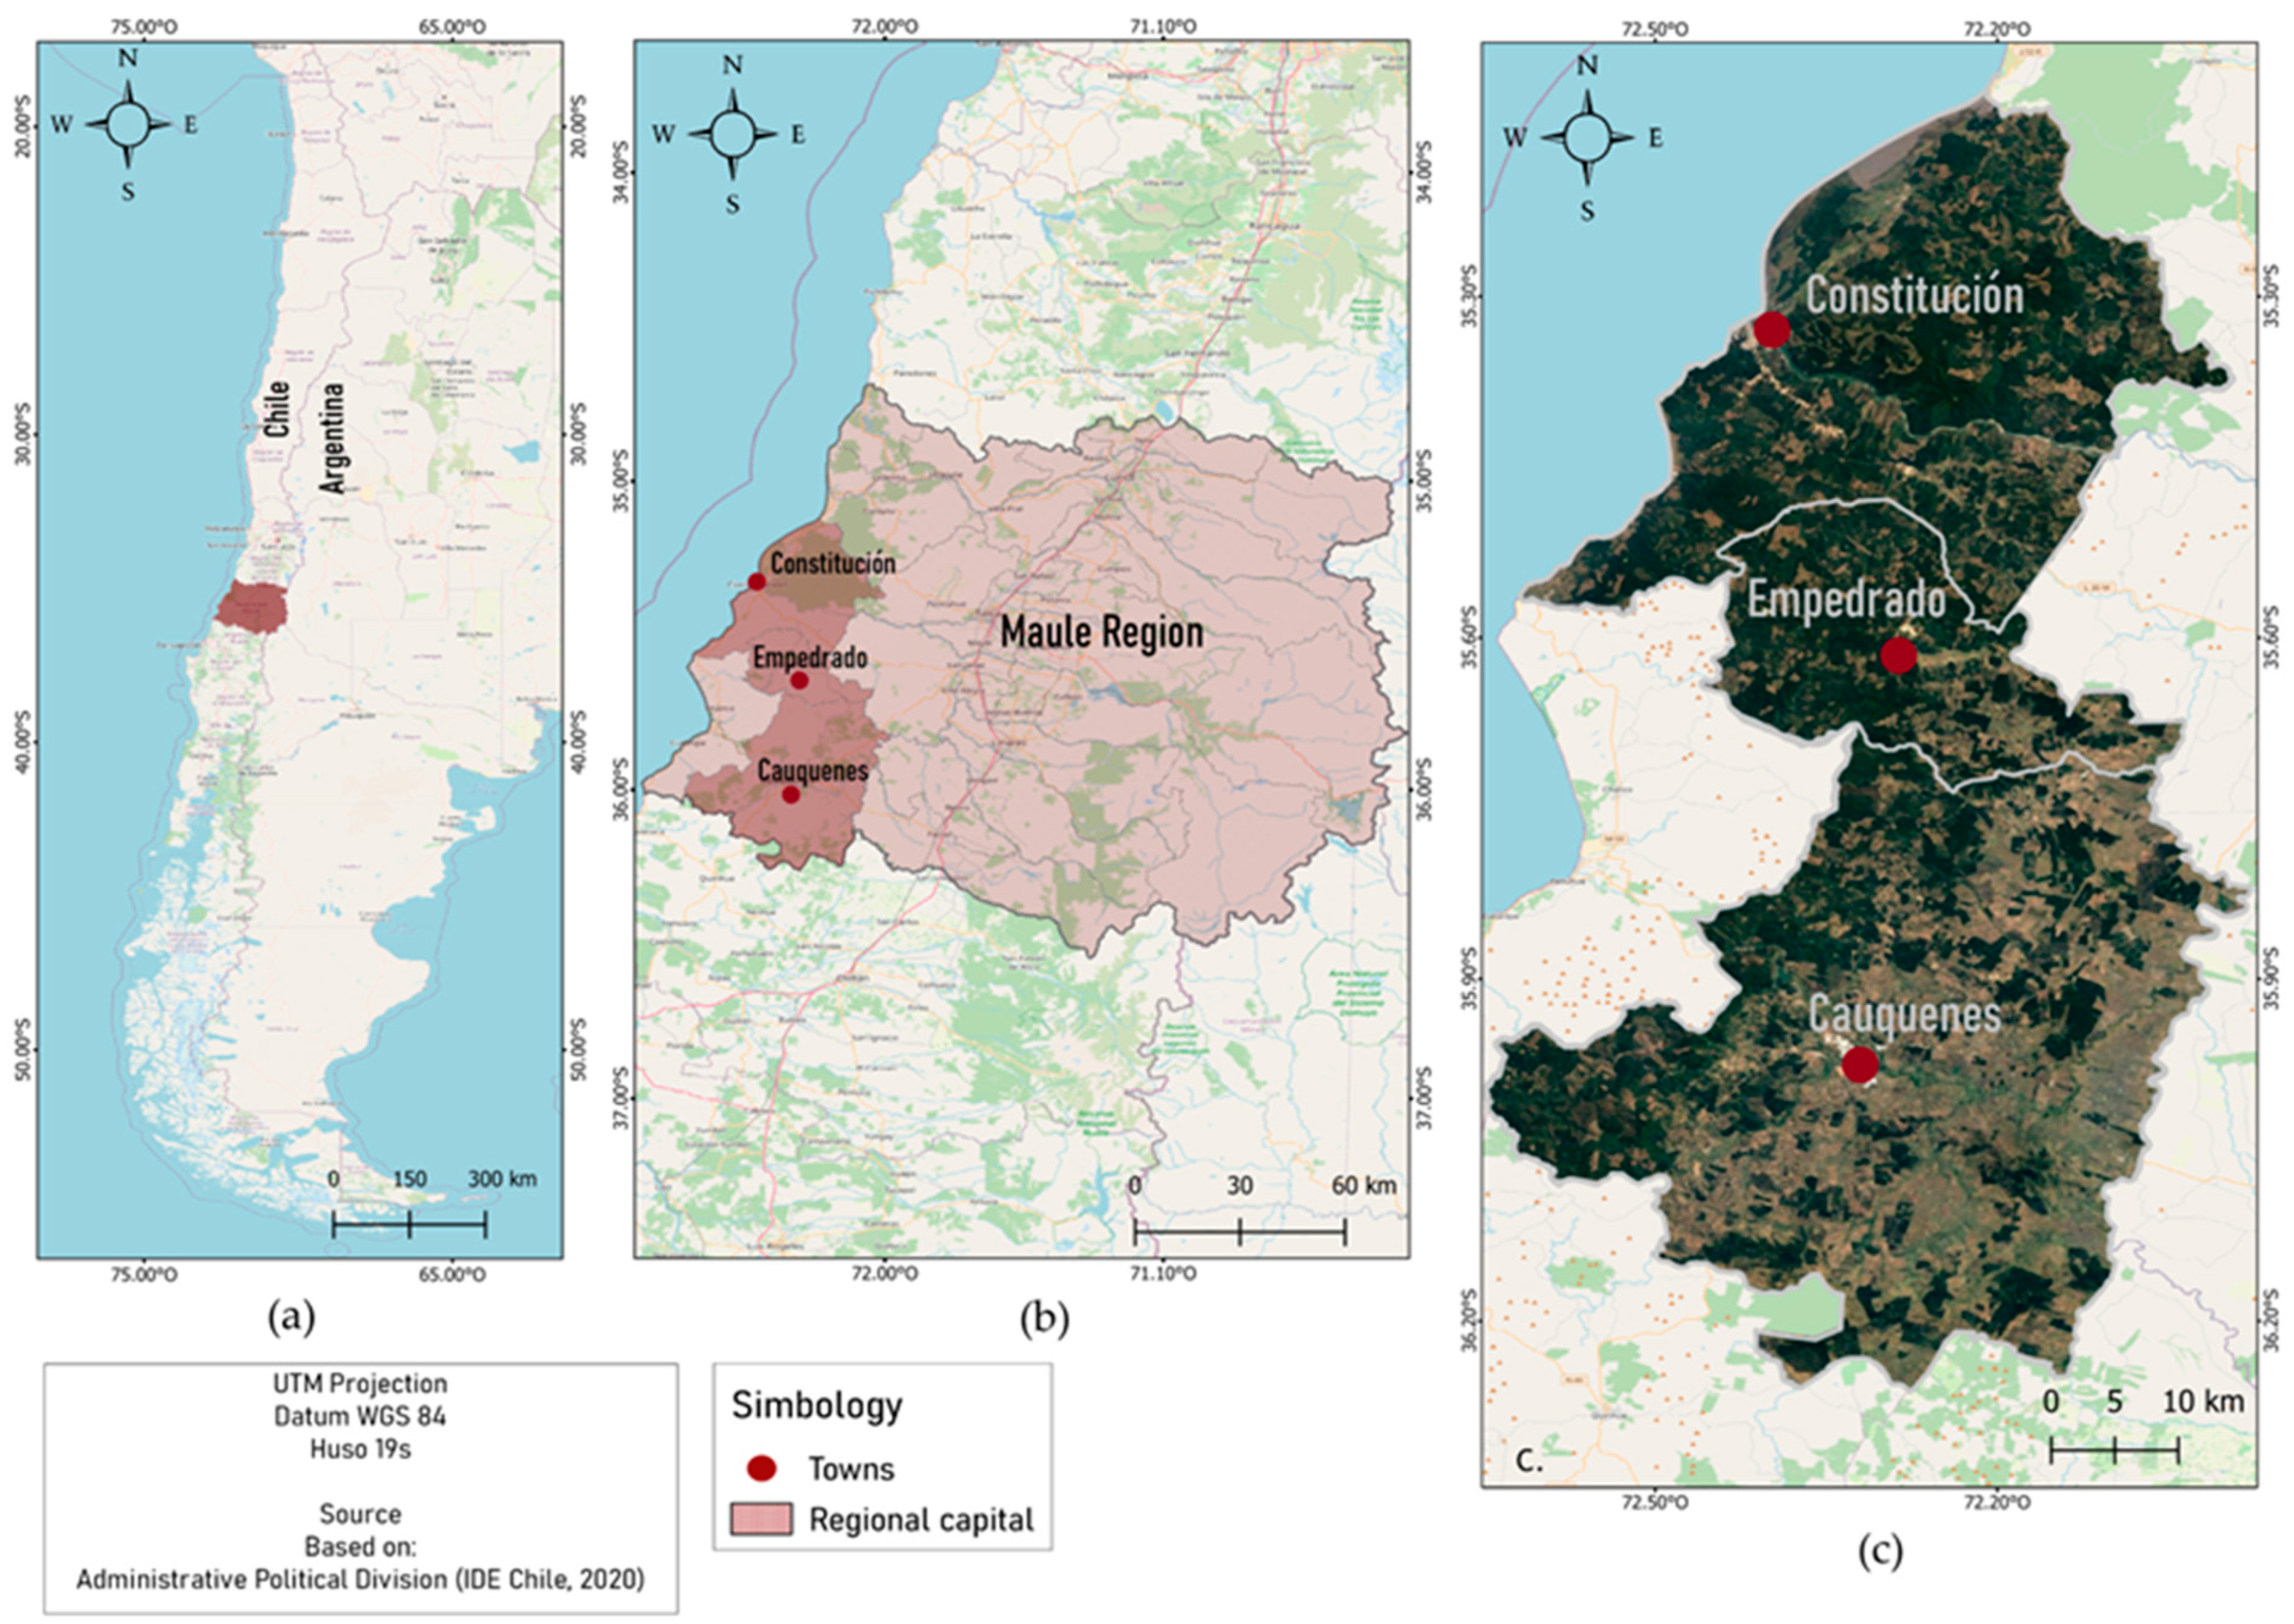
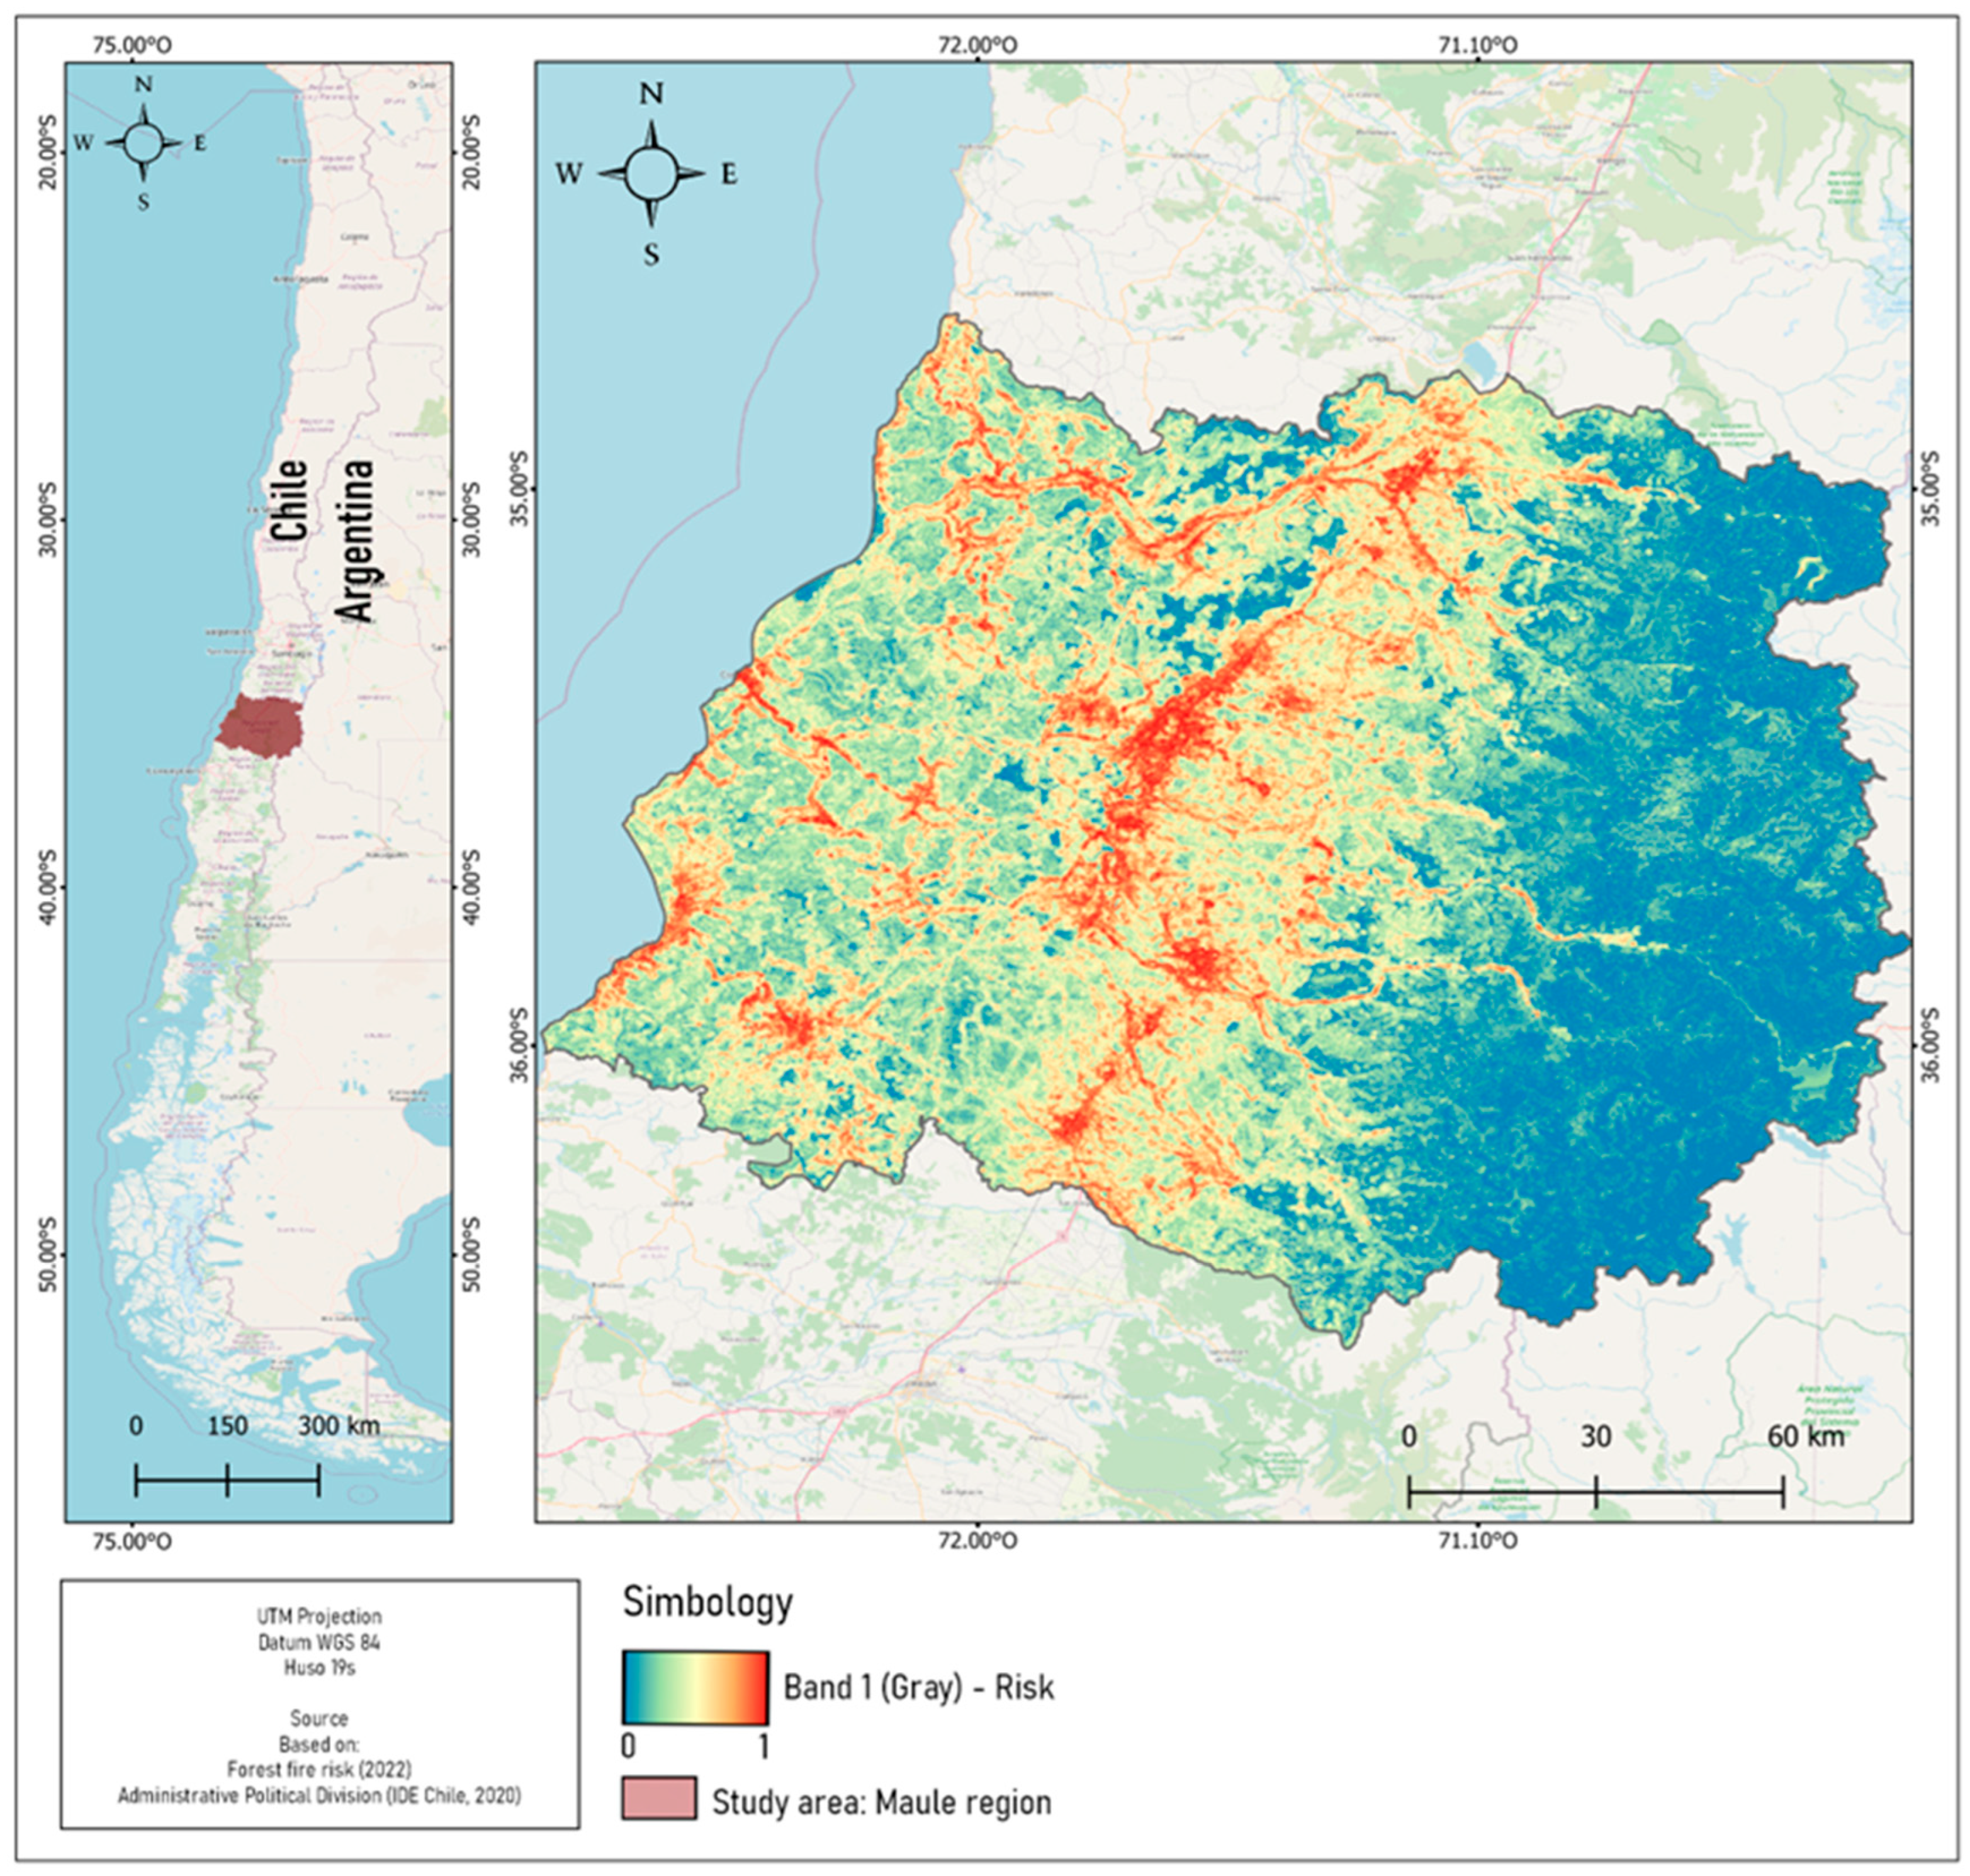
2.1. Study Area
Region of Maule
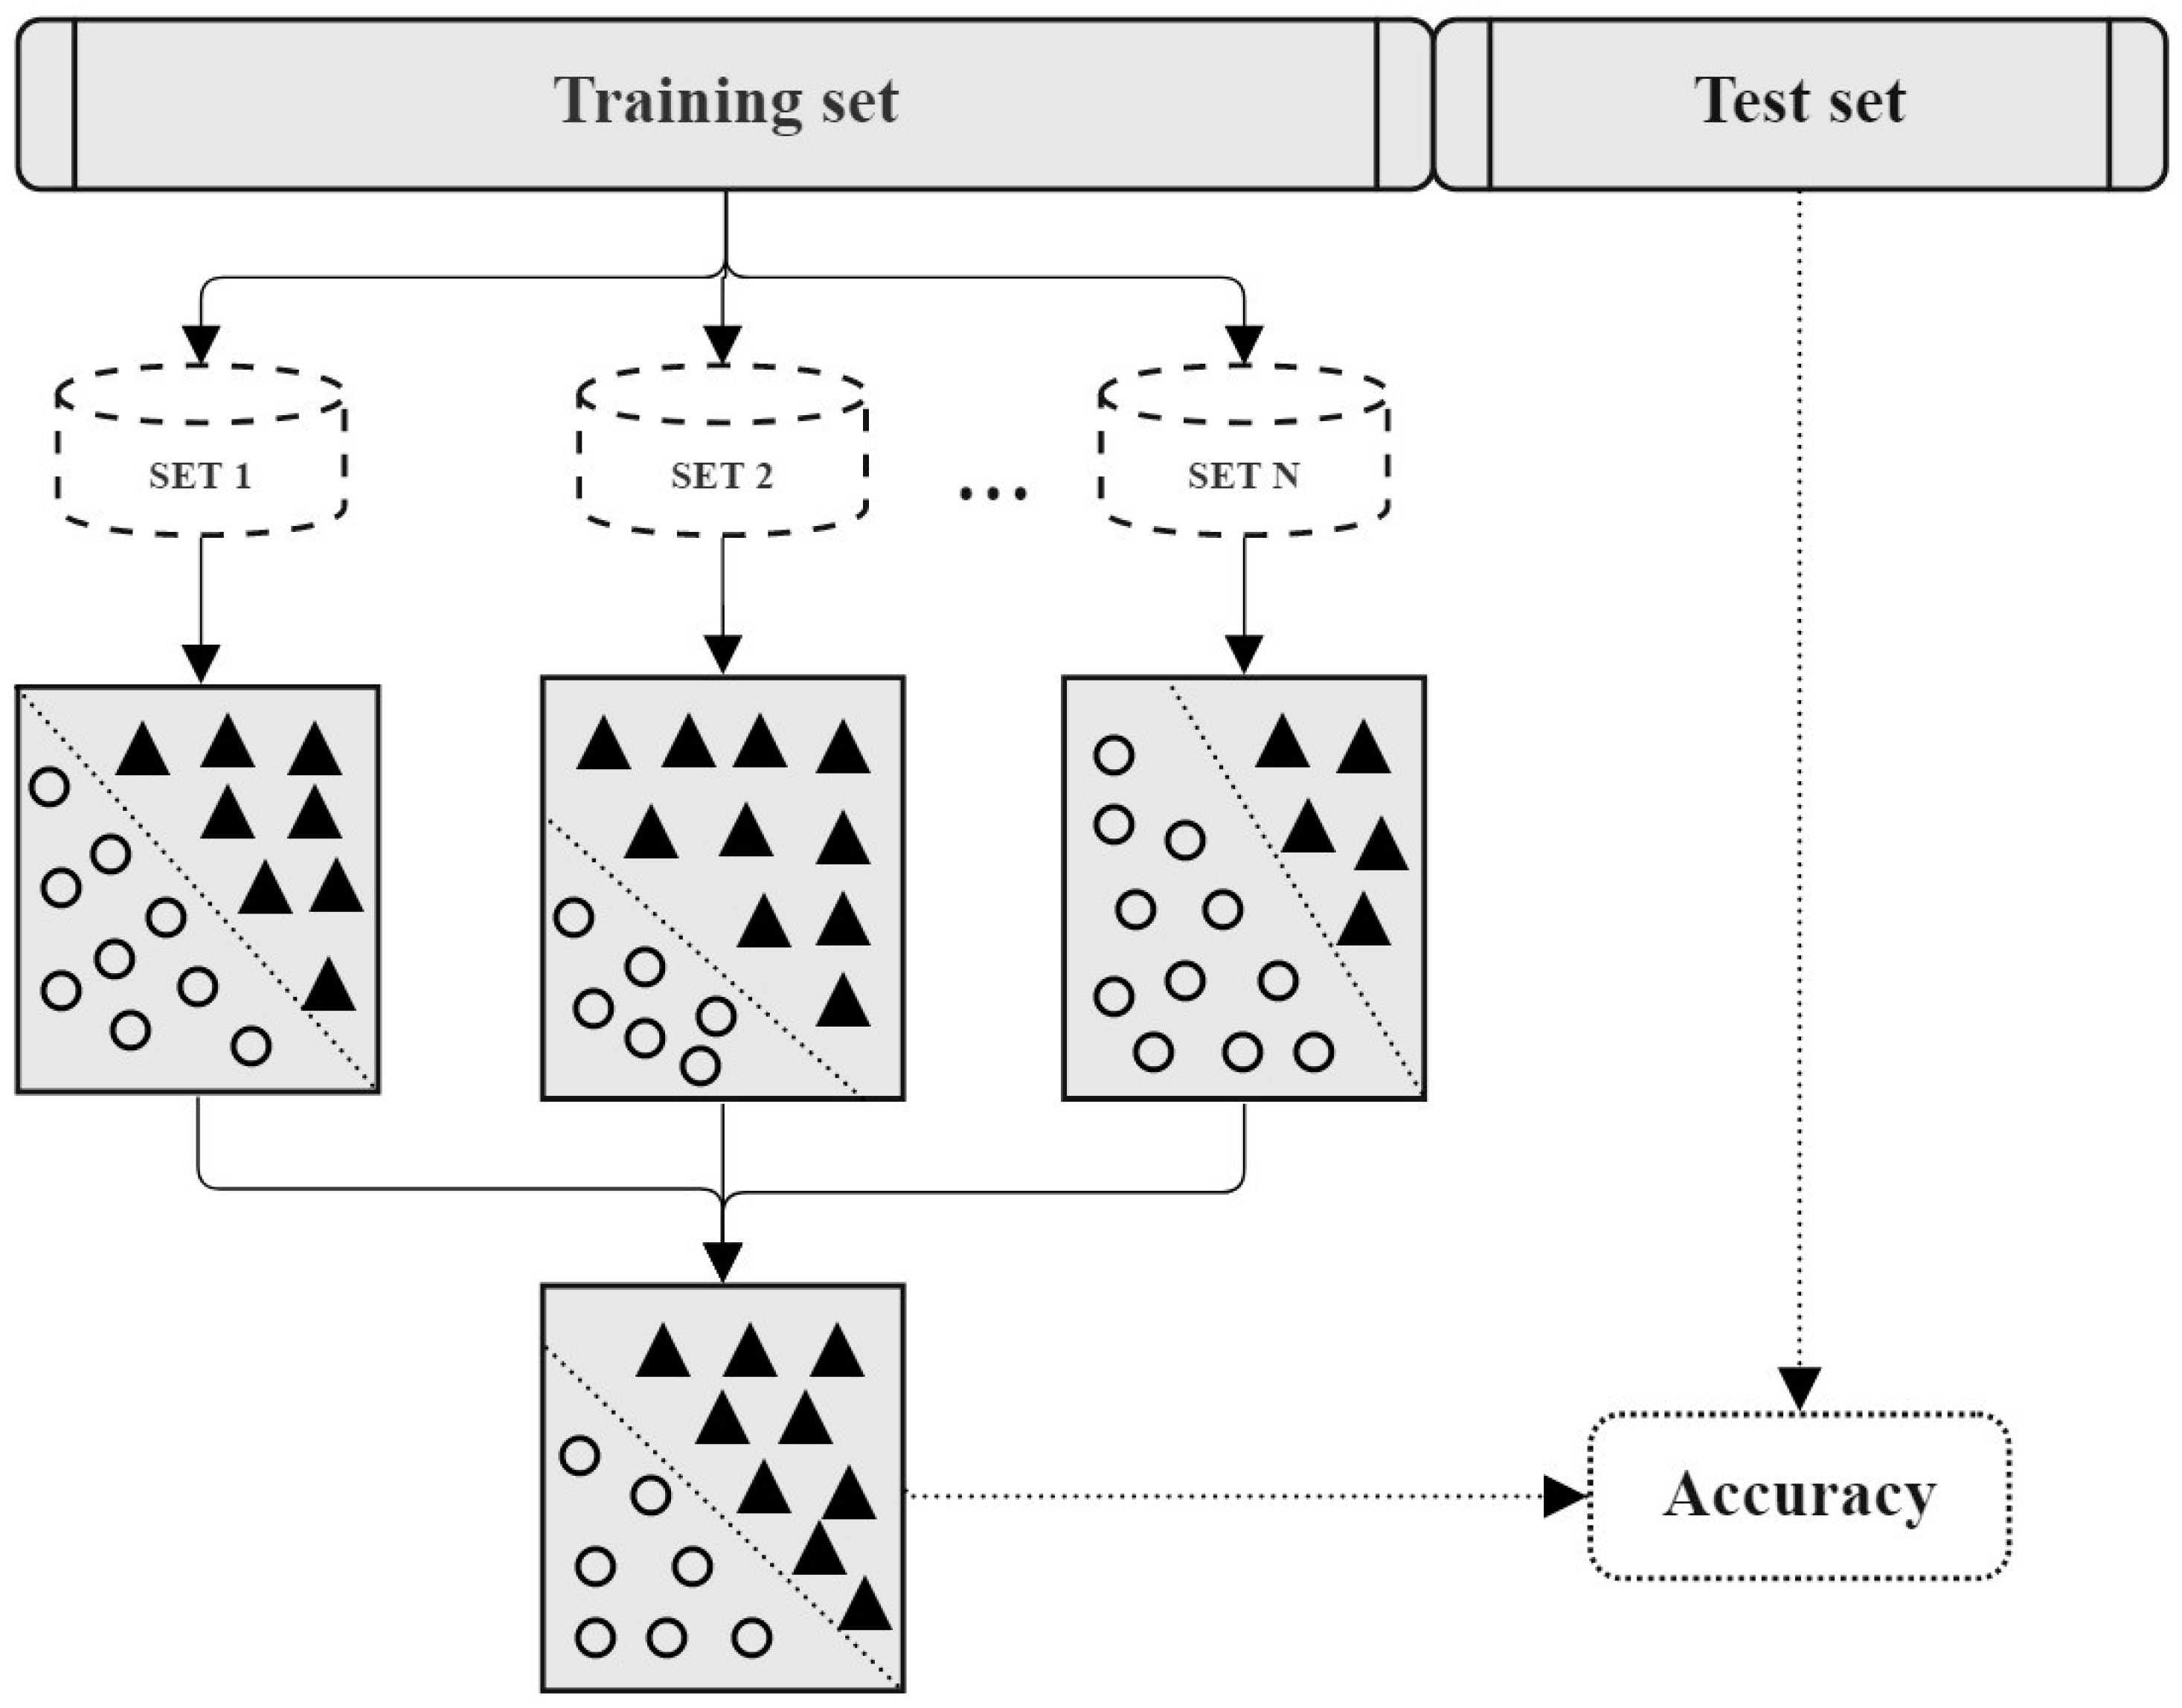
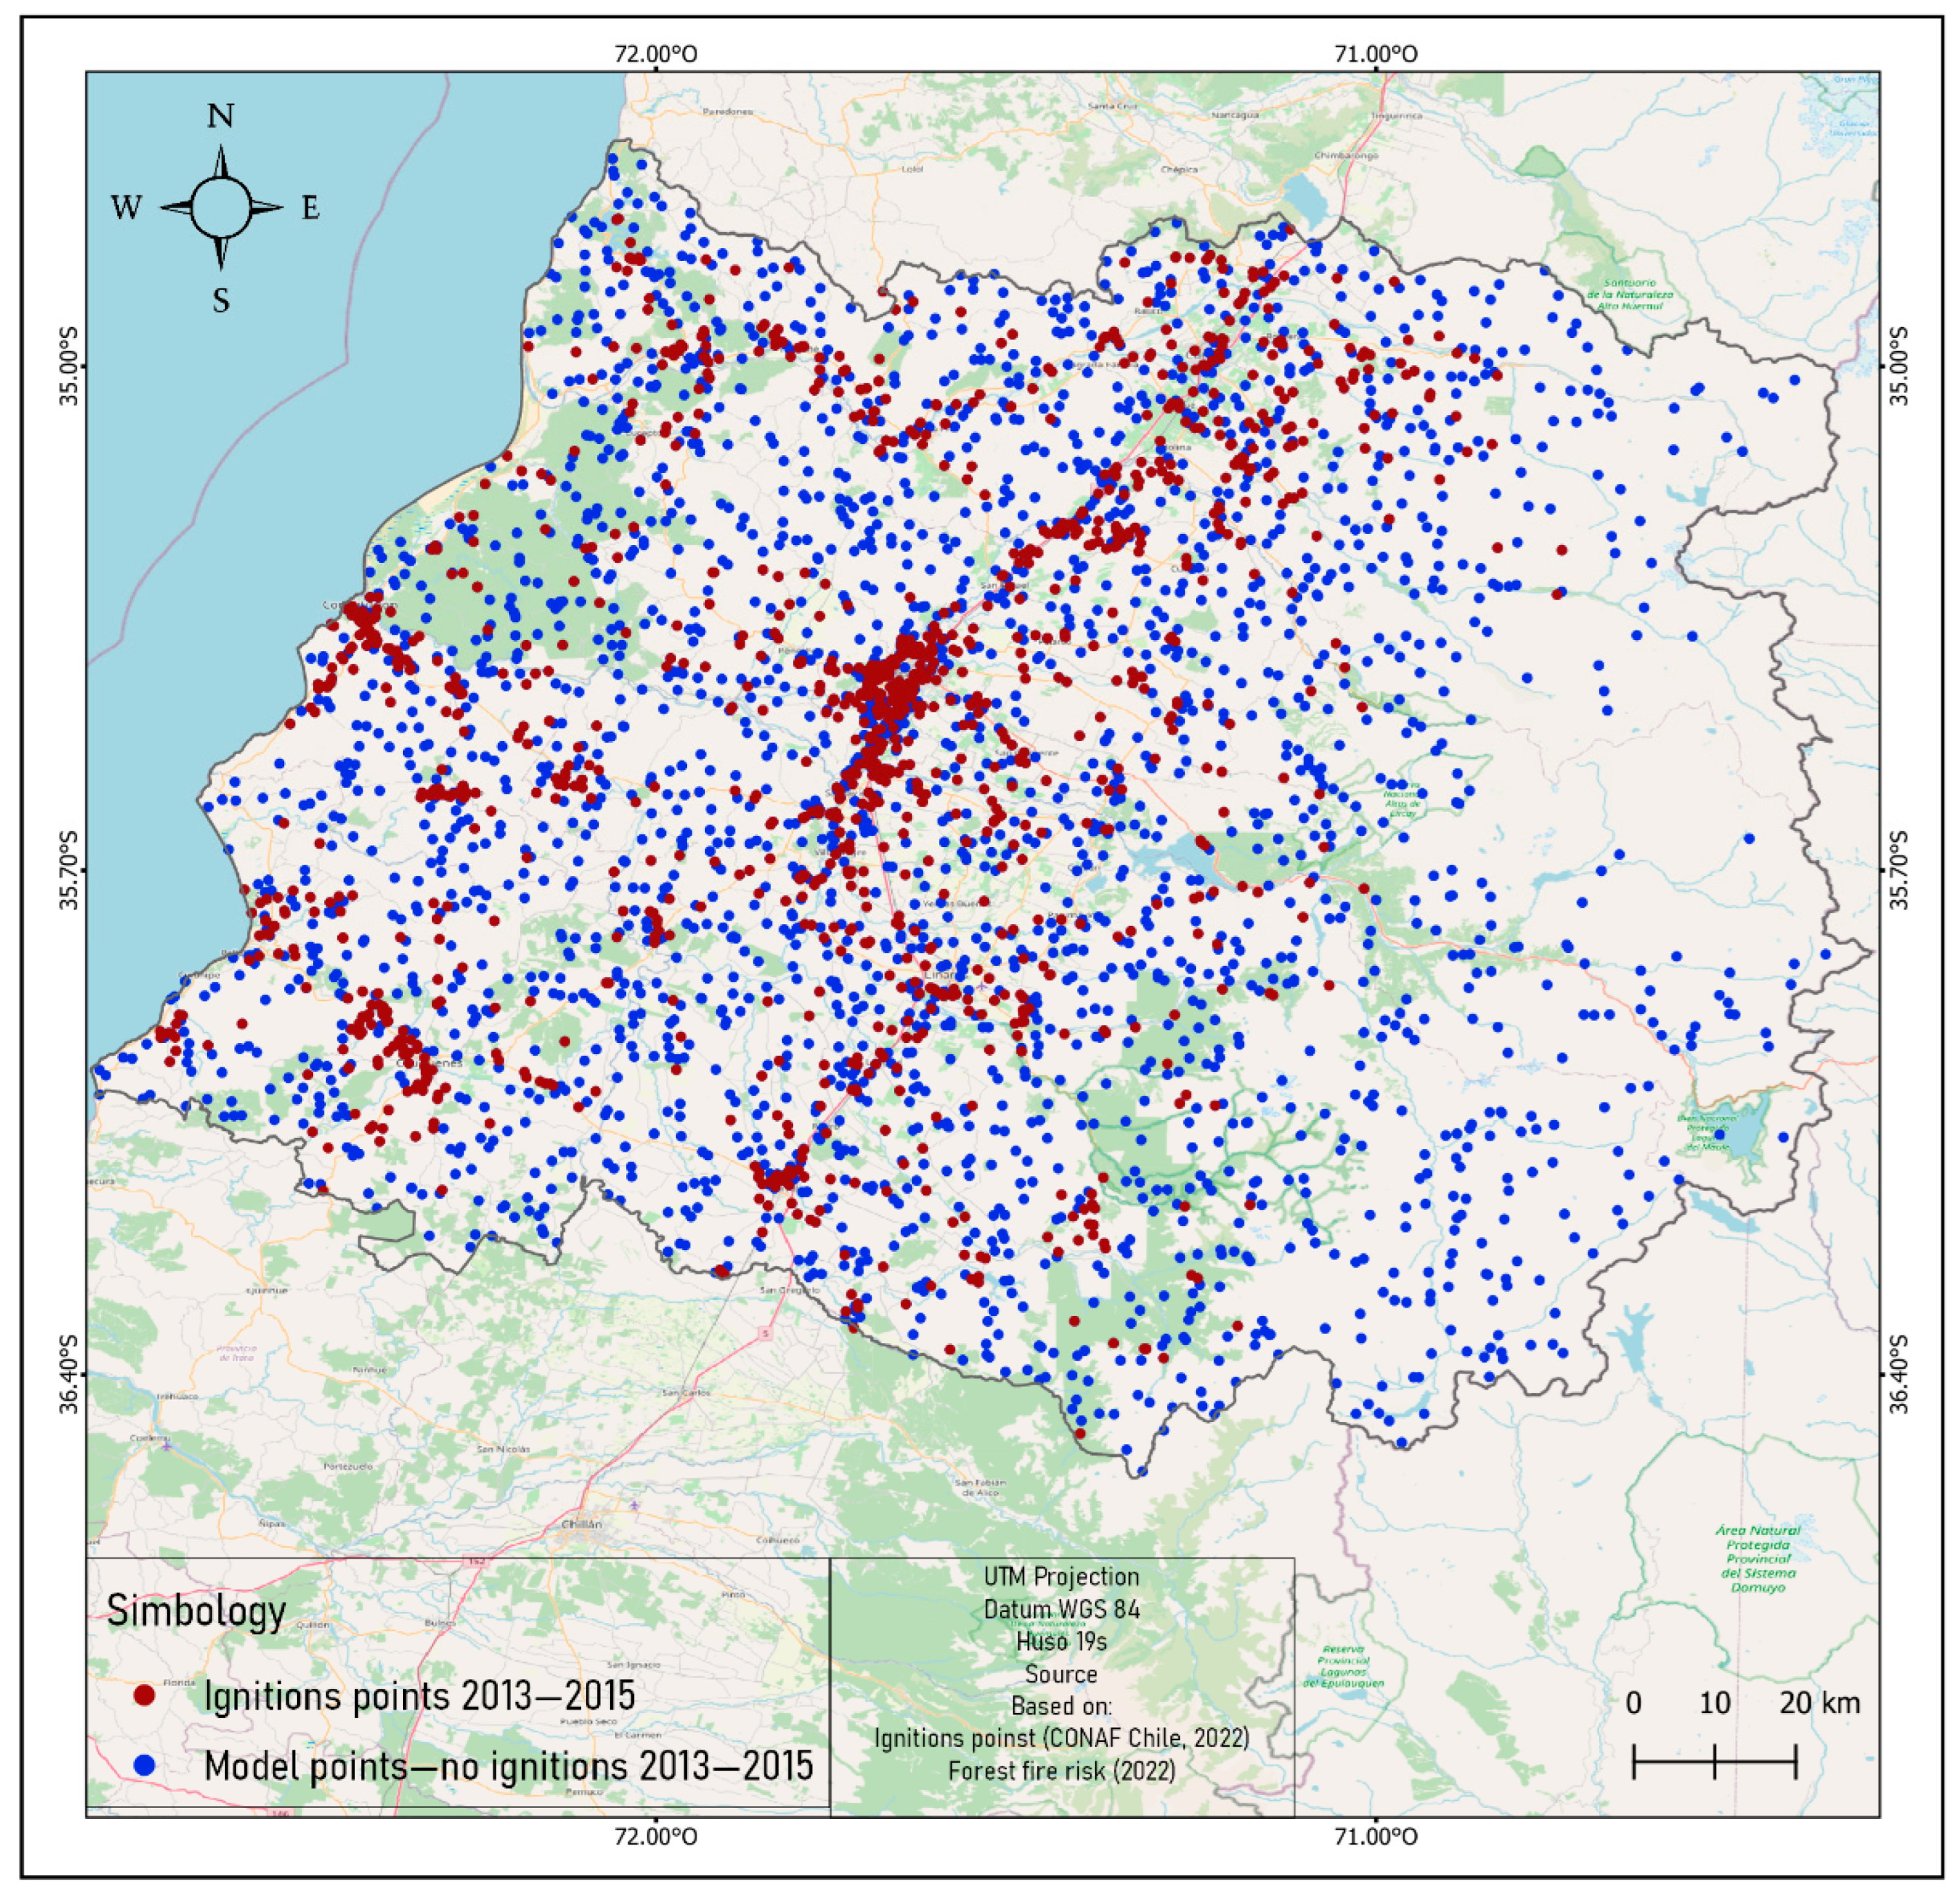
3. Materials and Methods
4. Results
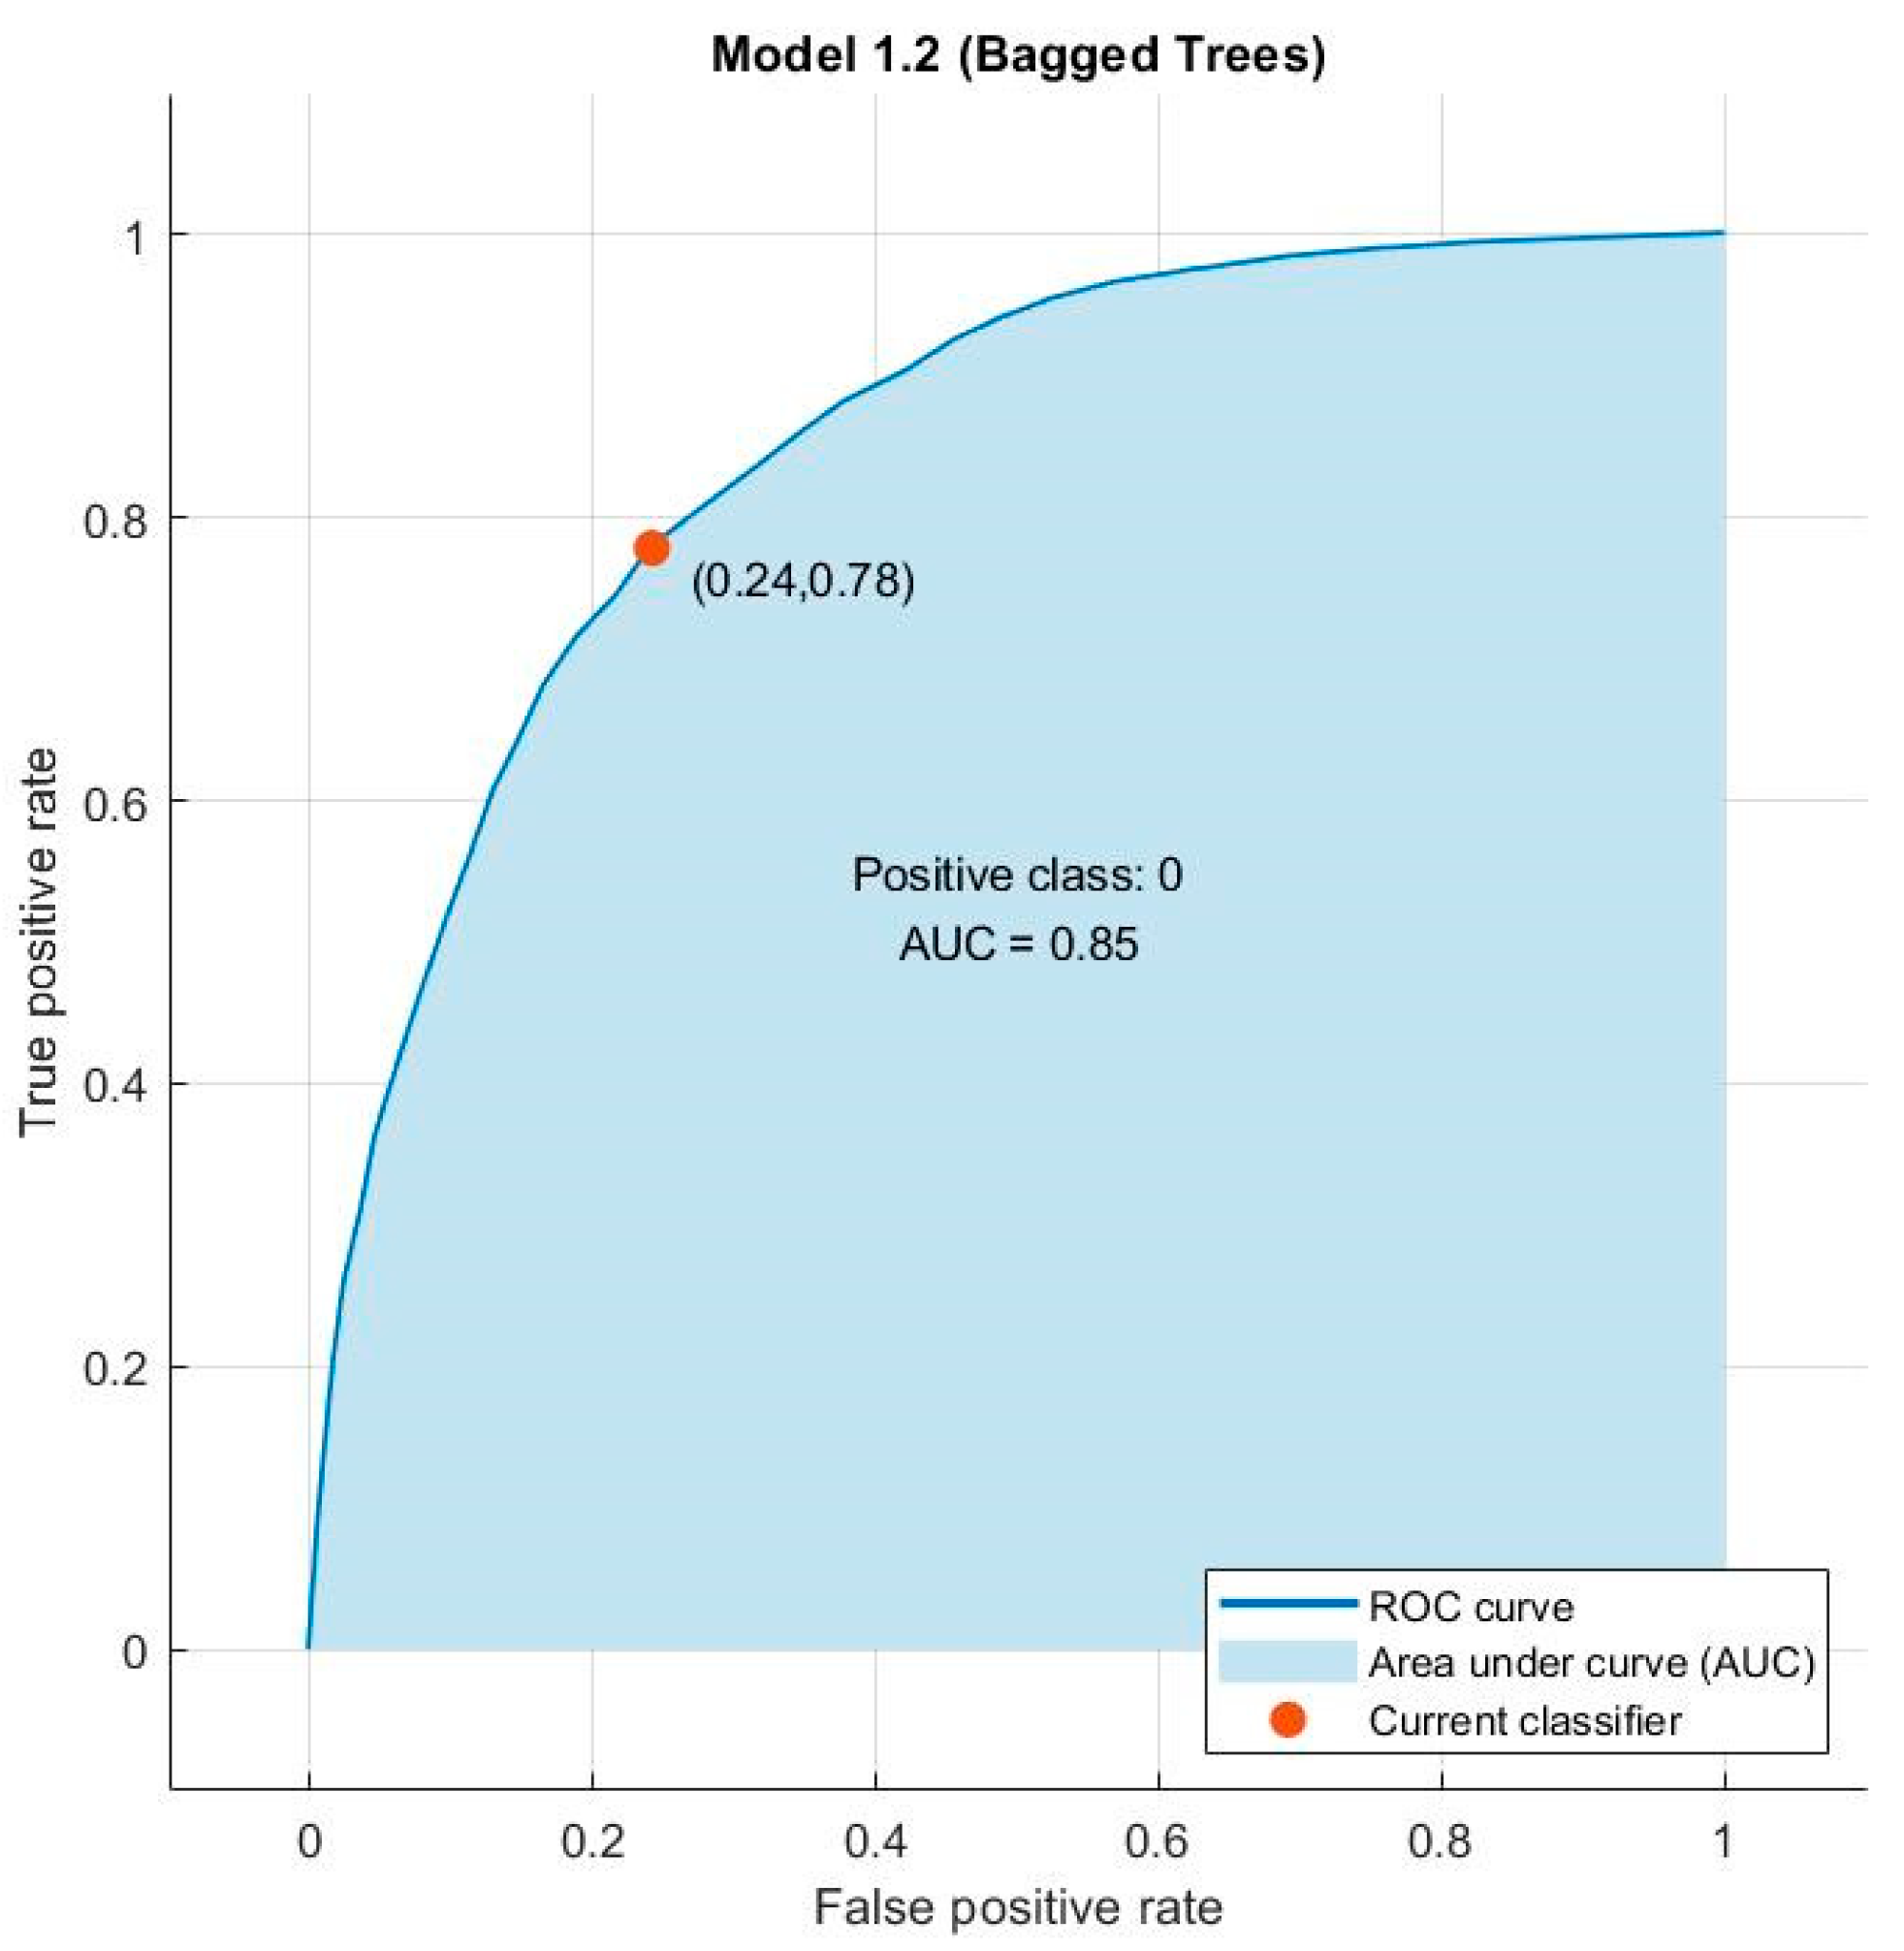
4.1. Model Fit
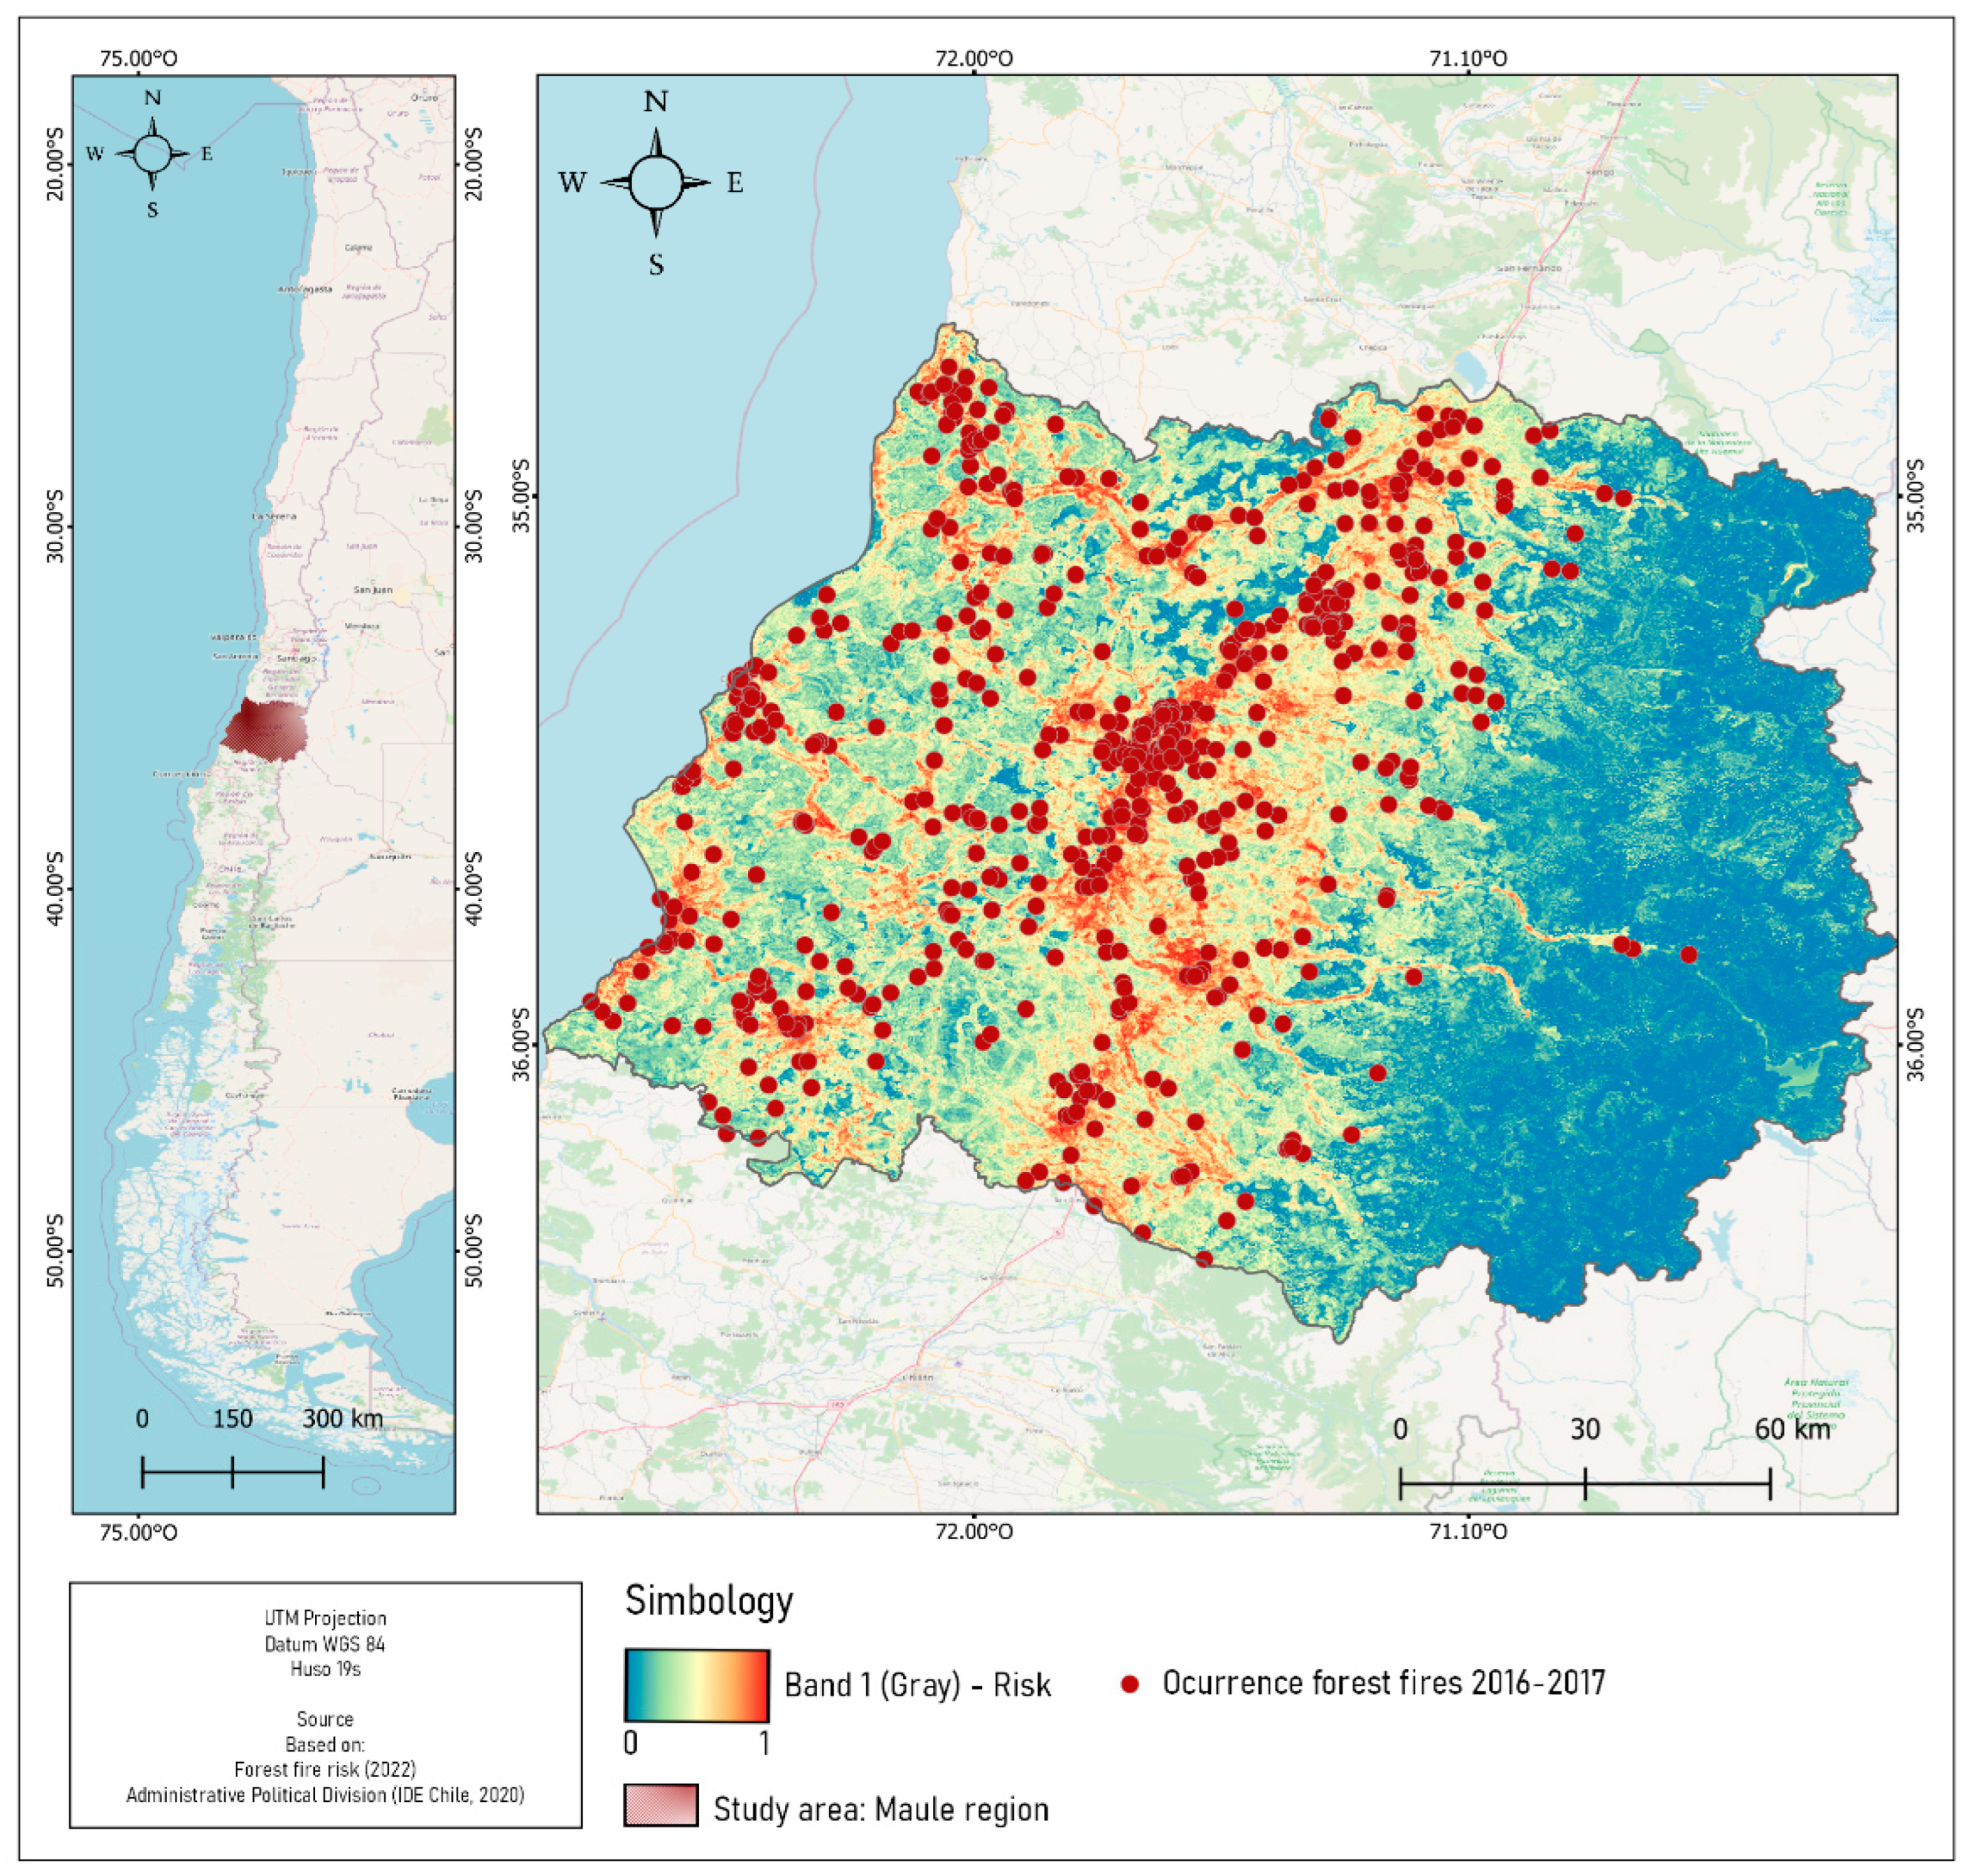
4.2. Ignition Risk Model Map
4.3. Model Validation
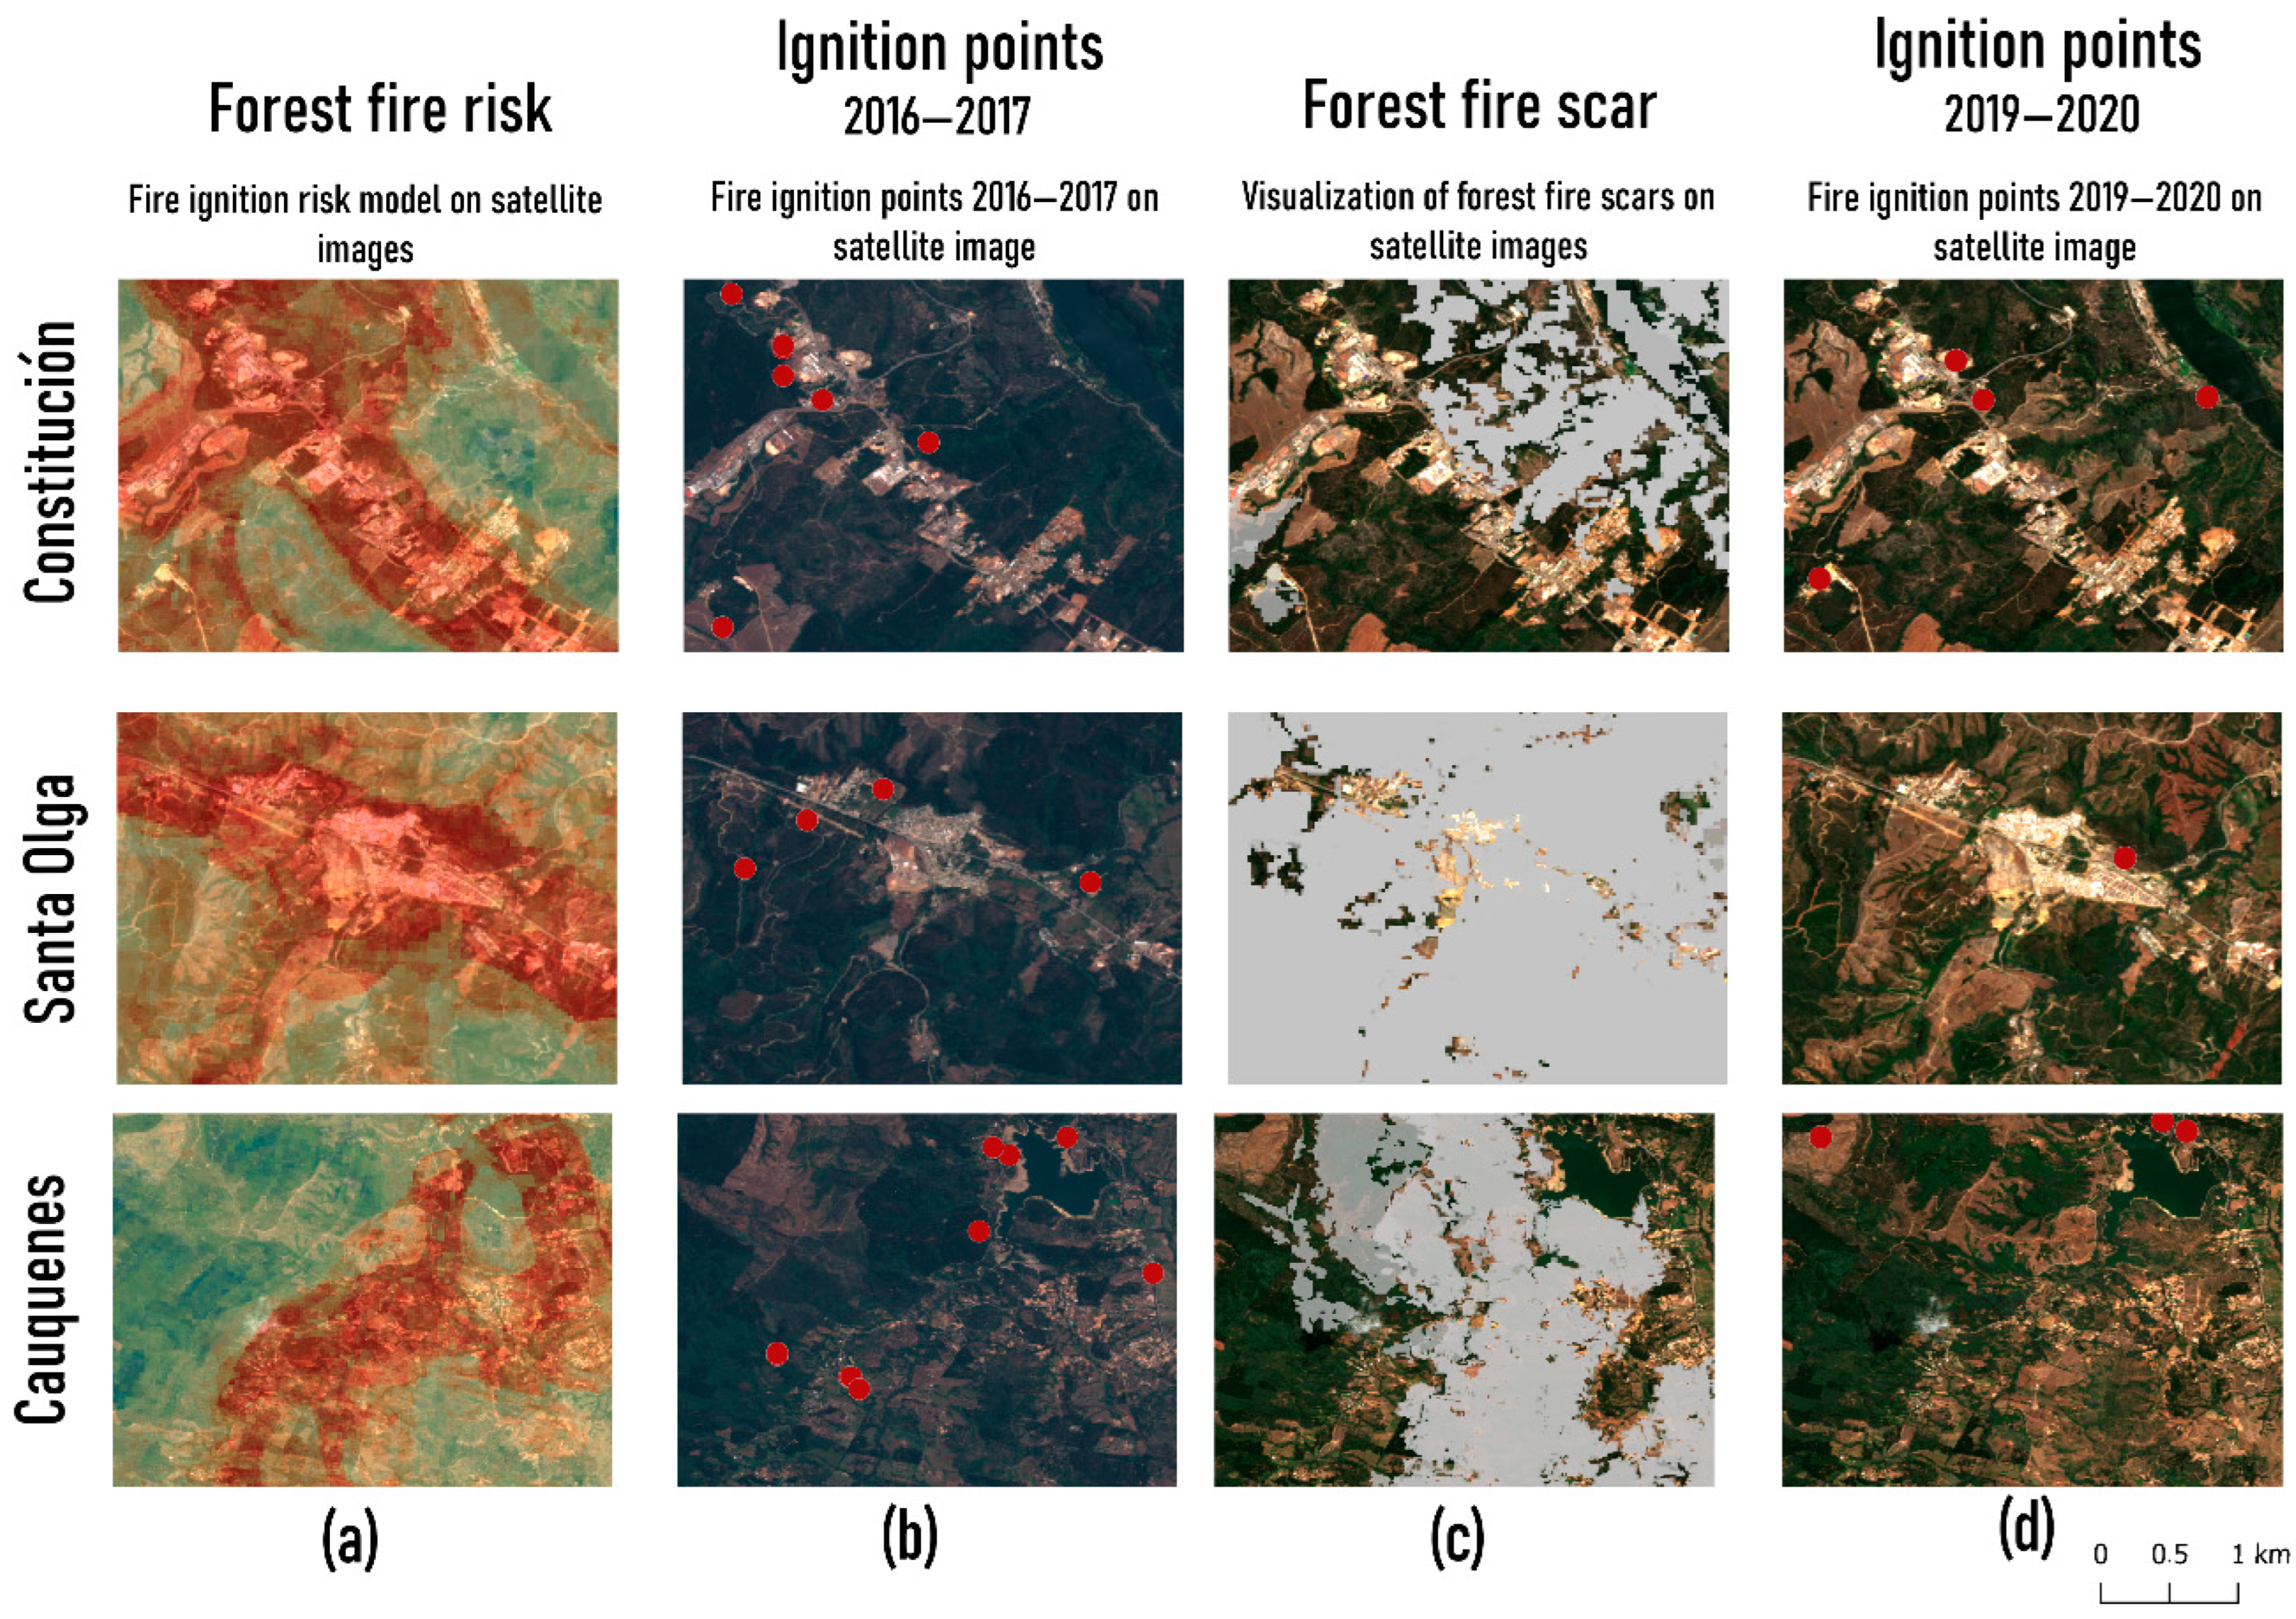
4.4. Temporal Comparative Matrix of Interface Zones
5. Discussion and Conclusions
Author Contributions
Funding
Institutional Review Board Statement
Informed Consent Statement
Data Availability Statement
Conflicts of Interest
References
- CEPAL. Recomendaciones Institucionales y Metodológicas para la Medición de Indicadores ODS Relacionados con Desastres y con el Marco de Sendai para la Reducción del Riesgo de Desastres. Grupo de Trabajo Sobre la Medición y Registro de Indicadores Relativos a la Reducción del Riesgo de Desastres en América Latina y el Caribe 2020–2021; Report; CEPAL: Santiago, Chile, 2021. [Google Scholar]
- Seidl, R.; Thom, D.; Kautz, M.; Martin-Benito, D.; Peltoniemi, M.; Vacchiano, G.; Wild, J.; Ascoli, D.; Petr, M.; Honkaniemi, J.; et al. Forest disturbances under climate change. Nat. Publ. Group 2017, 7, 395–402. [Google Scholar] [CrossRef] [PubMed]
- Maniatis, Y.; Doganis, A.; Chatzigeorgiadis, M. Fire Risk Probability Mapping Using Machine Learning Tools and Multi-Criteria Decision Analysis in the GIS Environment: A Case Study in the National Park Forest Dadia-Lefkimi-Soufli, Greece. Appl. Sci. 2022, 12, 2938. [Google Scholar] [CrossRef]
- Kang, Y.; Jang, E.; Im, J.; Kwon, C.; Kim, S. Developing a new hourly forest fire risk index based on catboost in South Korea. Appl. Sci. 2020, 10, 8213. [Google Scholar] [CrossRef]
- Xofis, P.; Konstantinidis, P.; Papadopoulos, I.; Tsiourlis, G. Integrating remote sensing methods and fire simulation models to estimate fire hazard in a south-east mediterranea protected area. Fire 2020, 3, 31. [Google Scholar] [CrossRef]
- Ricotta, C.; Bajocco, S.; Guglietta, D.; Conedera, M. Assessing the influence of roads on fire ignition: Does land cover matter? Fire 2018, 1, 24. [Google Scholar] [CrossRef]
- Ganteaume, A.; Camia, A.; Jappiot, M.; San-Miguel-Ayanz, J.; Long-Fournel, M.; Lampin, C. A Review of the Main Driving Factors of Forest Fire Ignition Over Europe. Environ. Manag. 2013, 51, 651–662. [Google Scholar] [CrossRef] [PubMed]
- Quiroz, N.; Walls, R.; Cicione, A. Towards understanding fire causes in informal settlements based on inhabitant risk perception. Fire 2021, 4, 39. [Google Scholar] [CrossRef]
- Özbayoǧlu, A.; Bozer, R. Estimation of the burned area in forest fires using computational intelligence techniques. Procedia Comput. Sci. 2012, 12, 282–287. [Google Scholar] [CrossRef]
- Schaefer, A.J.; Magi, B.I. Land-cover dependent relationships between fire and soil moisture. Fire 2019, 2, 55. [Google Scholar] [CrossRef]
- Van Hoang, T.; Chou, T.Y.; Fang, Y.M.; Nguyen, N.T.; Nguyen, Q.H.; Canh, P.X.; Toan, D.N.B.; Nguyen, X.L.; Meadows, M.E. Mapping forest fire risk and development of early warning system for NW Vietnam using AHP and MCA/GIS methods. Appl. Sci. 2020, 10, 4348. [Google Scholar] [CrossRef]
- Hassan, Q.K.; Rahaman, K.R.; Ahmed, M.R.; Hossain, S.M. Examining post-fire perceptions of selected mitigation strategies after the 2016 horse river wildland fire in alberta, Canada. Appl. Sci. 2021, 11, 10155. [Google Scholar] [CrossRef]
- Jolly, W.M.; Freeborn, P.H.; Page, W.G.; Butler, B.W. Severe fire danger index: A forecastable metric to inform firefighter and community wildfire risk management. Fire 2019, 2, 47. [Google Scholar] [CrossRef]
- Connors, S.; Dionne, M.; Hanák, G.; Musulin, R.; Aellen, N.; Amjad, M.; Bowen, S.; Carrascal, D.R.; Coppola, E.; Dal Moro, E.; et al. Climate Science: A Summary for Actuaries—What the IPCC Climate Change Report 2021 Means for the Actuarial Profession. 2022. Available online: www.actuaries.orgwww.actuaries.org|secretariat@actuaries.org (accessed on 3 June 2022).
- Bowman, D.M.J.S.; Moreira-Muñoz, A.; Kolden, C.A.; Chávez, R.O.; Muñoz, A.A.; Salinas, F. Human-environmental drivers and impacts of the globally extreme 2017 Chilean fires. Tapuya Lat. Am. Sci. Technol. Soc. 2021, 4, 350–362. [Google Scholar] [CrossRef] [PubMed]
- Bowman, D.M.J.S.; Williamson, G.J. River flows are a reliable index of forest fire risk in the temperate Tasmanian wilderness world heritage area, Australia. Fire 2021, 4, 22. [Google Scholar] [CrossRef]
- Parisien, M.A.; Parks, S.A.; Krawchuk, M.A.; Little, J.M.; Flannigan, M.D.; Gowman, L.M.; Moritz, M.A. An analysis of controls on fire activity in boreal Canada: Comparing models built with different temporal resolutions. Ecol. Appl. 2014, 24, 1341–1356. [Google Scholar] [CrossRef]
- Westerling, A.L.; Hidalgo, H.G.; Cayan, D.R.; Swetnam, T.W. Warming and earlier spring increase Western U.S. forest wildfire activity. Science 2006, 313, 940–943. [Google Scholar] [CrossRef]
- Evers, C.; Holz, A.; Busby, S.; Nielsen-Pincus, M. Extreme Winds Alter Influence of Fuels and Topography on Megafire Burn Severity in Seasonal Temperate Rainforests under Record Fuel Aridity. Fire 2022, 5, 41. [Google Scholar] [CrossRef]
- Ghorbanzadeh, O.; Blaschke, T.; Gholamnia, K.; Aryal, J. Forest fire susceptibility and risk mapping using social/infrastructural vulnerability and environmental variables. Fire 2019, 2, 50. [Google Scholar] [CrossRef]
- Liu, Q.; Shan, Y.; Shu, L.; Sun, P.; Du, S. Spatial and temporal distribution of forest fire frequency and forest area burnt in Jilin Province, Northeast China. J. For. Res. 2018, 29, 1233–1239. [Google Scholar] [CrossRef]
- Meneses, B.M. Vegetation recovery patterns in burned areas assessed with landsat 8 OLI imagery and environmental biophysical data. Fire 2021, 4, 76. [Google Scholar] [CrossRef]
- Caggiano, M.D.; Hawbaker, T.J.; Gannon, B.M.; Hoffman, C.M. Building loss in WUI disasters: Evaluating the core components of the wildland–urban interface definition. Fire 2020, 3, 73. [Google Scholar] [CrossRef]
- Jolly, W.M.; Cochrane, M.A.; Freeborn, P.H.; Holden, Z.A.; Brown, T.J.; Williamson, G.J.M.; Bowman, D.M. Climate-induced variations in global wildfire danger from 1979 to 2013. Nat. Commun. 2015, 6, 1–11. [Google Scholar] [CrossRef] [PubMed]
- Flannigan, M.; Stocks, B.; Turetsky, M.; Wotton, M. Impacts of climate change on fire activity and fire management in the circumboreal forest. Glob. Change Biol. 2009, 15, 549–560. [Google Scholar] [CrossRef]
- Montiel-Molina, C.; Vilar, L.; Romão-Sequeira, C.; Karlsson, O.; Galiana-Martín, L.; de Lomana, G.M.G.; Palacios-Estremera, M.T. Have historical land use/land cover changes triggered a fire regime shift in central Spain? Fire 2019, 2, 44. [Google Scholar] [CrossRef]
- Couto, F.T.; Iakunin, M.; Salgado, R.; Pinto, P.; Viegas, T.; Pinty, J.P. Lightning modelling for the research of forest fire ignition in Portugal. Atmos. Res. 2020, 242, 104993. [Google Scholar] [CrossRef]
- Dowdy, A.J. Climatology of thunderstorms, convective rainfall and dry lightning environments in Australia. Clim. Dyn. 2020, 54, 3041–3052. [Google Scholar] [CrossRef]
- Castedo-Dorado, F.; Rodriguez-Perez, J.R.; Marcos-Menendez, J.L.; Alvarez-Taboada, M.F. Modelling the probability of lightning-induced forest fire occurrence in the province of León (NW Spain). For. Syst. 2001, 20, 95–107. [Google Scholar] [CrossRef]
- Podschwit, H.; Miller, C.; Alvarado, E. Spatiotemporal prescribed fire patterns in Washington state, USA. Fire 2021, 4, 19. [Google Scholar] [CrossRef]
- Ahn, Y.S.; Ryu, S.-R.; Lim, J.; Choong, H.L.; Shin, J.H.; Choi, W.I.L.; Lee, B.; Jeong, J.-H.; An, K.W.; Jung, I.S. Effects of forest fires on forest ecosystems in eastern coastal areas of Korea and an overview of restoration projects. Landsc. Ecol. 2014, 10, 229–237. [Google Scholar] [CrossRef]
- Herbert, C. Assessing the Effectiveness of Green Landscape Buffers to Reduce Fire Severity and Limit Fire Spread in California: Case Study of Golf Courses. Fire 2022, 5, 44. [Google Scholar] [CrossRef]
- Fischer, J.; Gardner, T.A.; Bennett, E.M.; Balvanera, P.; Biggs, R.; Carpenter, S.; Daw, T.; Folke, C.; Hill, R.; Hughes, T.P.; et al. Advancing sustainability through mainstreaming a social-ecological systems perspective. In Current Opinion in Environmental Sustainability; Elsevier: Amsterdam, The Netherlands, 2015; Volume 14, pp. 144–149. [Google Scholar]
- Folke, C. Resilience: The emergence of a perspective for social-ecological systems analyses. Glob. Environ. Change 2006, 16, 253–267. [Google Scholar] [CrossRef]
- Olsson, P.; Folke, C.; Hahn, T. Social-Ecological Transformation for Ecosystem Management: The Development of Adaptive Co-management of a Wetland Landscape in Southern Sweden. Ecol. Soc. 2004, 9, 2. [Google Scholar] [CrossRef]
- Olsson, P.; Folke, C.; Berkes, F. Adaptive comanagement for building resilience in social-ecological systems. Environ. Manag. 2004, 34, 75–90. [Google Scholar] [CrossRef] [PubMed]
- Scheer, D.; Benighaus, C.; Benighaus, L.; Renn, O.; Gold, S.; Röder, B.; Böl, G.F. The Distinction Between Risk and Hazard: Understanding and Use in Stakeholder Communication. Risk Anal. 2014, 34, 1270–1285. [Google Scholar] [CrossRef]
- Dong, X.; Shao, G.; Limin, D.; Zhanqing, H.; Lei, T.; Hui, W. Mapping forest fire risk zones with spatial data and principal component analysis. Sci. China Ser. E Technol. Sci. 2006, 49, 140–149. [Google Scholar] [CrossRef]
- Aragoneses, E.; Chuvieco, E. Generation and mapping of fuel types for fire risk assessment. Fire 2021, 4, 59. [Google Scholar] [CrossRef]
- Miranda, A.; Carrasco, J.; González, M.; Pais, C.; Lara, A.; Altamirano, A.; Weintraub, A.; Syphard, A.D. Evidence-based mapping of the wildland-urban interface to better identify human communities threatened by wildfires. Environ. Res. Lett. 2020, 15, 094069. [Google Scholar] [CrossRef]
- Chuvieco, E.; Aguado, I.; Yebra, M.; Nieto, H.; Salas, J.; Martín, M.P.; Vilar, L.; Martínez, J.; Martín, S.; Ibarra, P.; et al. Development of a framework for fire risk assessment using remote sensing and geographic information system technologies. Ecol. Model. 2010, 221, 46–58. [Google Scholar] [CrossRef]
- Keane, R.E.; Drury, S.A.; Karau, E.C.; Hessburg, P.F.; Reynolds, K.M. A method for mapping fire hazard and risk across multiple scales and its application in fire management. Ecol. Model. 2010, 221, 2–18. [Google Scholar] [CrossRef]
- Luhmann, N. Organización y decisión. Autopoiesis, Acción y Entendimiento Comunicativo; Universidad Iberoamericana: Barcelona, España, 1995. [Google Scholar]
- Giddens, A. The Sociology of Risk and Gambling Reader; Routledge: London, UK, 2006. [Google Scholar]
- Beck, U. A Critical Introduction to Risk Society; Pluto Press: London, UK, 2004. [Google Scholar]
- Abram, N.J.; Henley, B.J.; Gupta, A.S.; Lippmann, T.J.R.; Clarke, H.; Dowdy, A.J.; Sharples, J.J.; Nolan, R.H.; Zhang, T.; Wooster, M.J.; et al. Connections of climate change and variability to large and extreme forest fires. In Communications Earth and Environment; Nature Publishing Group: Berlin, Germany, 2021. [Google Scholar] [CrossRef]
- Martin, J.; Hillen, T. The spotting distribution of wildfires. Appl. Sci. 2016, 6, 177. [Google Scholar] [CrossRef]
- Pérez-Sánchez, J.; Jimeno-Sáez, P.; Senent-Aparicio, J.; Díaz-Palmero, J.M.; de Cabezas-Cerezo, J.D. Evolution of burned area in forest fires under climate change conditions in southern Spain using ANN. Appl. Sci. 2019, 9, 4155. [Google Scholar] [CrossRef]
- Minsavage-Davis, C.D. Evaluating the Performance of Fire Rate of Spread Models in Northern-European Calluna vulgaris Heathlands. Fire 2022, 5, 46. [Google Scholar] [CrossRef]
- Syphard, A.D.; Rustigian-Romsos, H.; Keeley, J.E. Multiple-scale relationships between vegetation, the wildland–urban interface, and structure loss to wildfire in California. Fire 2021, 4, 12. [Google Scholar] [CrossRef]
- De la Barrera, F.; Ruiz, V.; Quense, J. Evaluación del Impacto de los Incendios de Chile Centro-Sur en el Verano del año 2017; Primera entrega; International Association of Landscape Ecology (IALE)-Chile: Santiago, Chile, 2017. [Google Scholar]
- Hendrychová, M.; Kabrna, M. An analysis of 200-year-long changes in a landscape affected by large-scale surface coal mining: History, present and future. Appl. Geogr. 2016, 1, 151–159. [Google Scholar] [CrossRef]
- Lee, C.; Schlemme, C.; Murray, J.; Unsworth, R. The cost of climate change: Ecosystem services and wildland fires. Ecol. Econ. 2015, 116, 261–269. [Google Scholar] [CrossRef]
- San-Miguel-Ayanz, J.; Moreno, J.M.; Camia, A. Analysis of large fires in European Mediterranean landscapes: Lessons learned and perspectives. For. Ecol. Manag. 2013, 294, 11–22. [Google Scholar] [CrossRef]
- Moritz, M.A.; Batllori, E.; Bradstock, R.A.; Gill, A.M.; Handmer, J.; Hessburg, P.F.; Leonard, J.; McCaffrey, S.; Odion, D.C.; Schoennagel, T.; et al. Learning to coexist with wildfire. Nature 2014, 515, 58–66. [Google Scholar] [CrossRef]
- McWethy, D.B.; Pauchard, A.; García, R.A.; Holz, A.; González, M.E.; Veblen, T.T.; Stahl, J.; Currey, B. Landscape drivers of recent fire activity (2001–2017) in south-central Chile. PLoS ONE 2018, 13, e0205287. [Google Scholar] [CrossRef]
- CONAF. Análisis de la Afectación y Severidad de los Incendios Forestales; Report; Corporación Nacional Forestal (CONAF): Santiago, Chile, 2017. [Google Scholar]
- Levin, N.; Tessler, N.; Smith, A.; Mcalpine, C. The Human and Physical Determinants of Wildfires and Burnt Areas in Israel. Environ. Manag. 2016, 58, 549–562. [Google Scholar] [CrossRef] [PubMed]
- Salis, M.; Ager, A.A.; Finney, M.A.; Arca, B.; Finney, M.A. Analyzing spatiotemporal changes in wildfire regime and exposure across a Mediterranean fire-prone area. Nat. Hazards 2014, 71, 1389–1418. [Google Scholar] [CrossRef]
- Santelices-Moya, R.; Gibson-Carpintero, S.; Cabrera-Ariza, A.; Santini-Junior, L.; Venegas-González, A. Reduced Rainfall Variability Reduces Growth of Nothofagus alessandrii Espinosa (Nothofagaceae) in the Maule Region, Chile. Forests 2022, 13, 1184. [Google Scholar] [CrossRef]
- González, M.E.; Gómez-González, S.; Lara, A.; Garreaud, R.; Díaz-Hormazábal, I. The 2010–2015 Megadrought and its influence on the fire regime in central and south-central Chile. Ecosphere 2018, 9, e02300. [Google Scholar] [CrossRef]
- ODEPA. Región del Maule: Información Regional; Oficina de Estudios y Políticas Agrariasm: Santiago, Chile, 2018.
- INE. División Político-Administrativa y Censal Región del Maule; Instituto Nacional de Estadísticas: Santiago, Chile, 2019.
- Díaz-Hormazábal, I.; González, M.E. Spatio-temporal analyses of wildfires in the region of Maule, Chile. Bosque 2016, 37, 147–158. [Google Scholar] [CrossRef]
- CONAF. Monitoreo de Cambios, Corrección Cartográfica y Actualización del Catastro de los Recursos Vegetacionales Nativos de la Región Del Maule; Corporación Nacional Forestal: Santiago, Chile, 2018; Available online: http://www.biblioteca.digital.gob.cl/bitstream/handle/123456789/2341/Resumen%20Ejecutivo%20Catastro%20Maule_2016.pdf (accessed on 2 June 2022).
- Valencia, D.; Saavedra, J.; Brull, J.; Santelices, R. Fire severity damages caused on Nothofagus alessandrii forest on the Maule Region of Chile. Gayana Botánica 2018, 75, 531–534. [Google Scholar] [CrossRef]
- Gálvez, M.G.; Gallegos, F.; Turén, V. Unfinished extinction and the velocities of capitalist sacrifices in the woodlands of central Chile. Tapuya Lat. Am. Sci. Technol. Soc. 2021, 4, 1939491. [Google Scholar] [CrossRef]
- Municipalidad de Constitución. Plan de Desarrollo Comunal Ilustre Municipalidad de Constitución Informe Etapa 1; Municipalidad de Constitución: Maule, Chile, 2016. [Google Scholar]
- CIREN. Comuna de Empedrado; Recursos Naturales: Empedrado, Chile, 2020.
- Municipalidad de Cauquenes. Plan de Desarrollo Comunal 2014–2018; Ilustre Municipalidad de Cauquenes: Cauquenes, Chile, 2018.
- Instituto Nacional de Estadísticas (INE). 2022. Available online: https://www.ine.cl/herramientas/portal-de-mapas/geodatos-abiertos (accessed on 5 June 2022).
- Ministerio de Obras Públicas (MOP). 2022. Available online: https://ide.mop.gob.cl/geomop/ (accessed on 5 June 2022).
- Earth Resources Observation and Science Center (EROS). Available online: https://www.usgs.gov/centers/eros/data-tools (accessed on 5 June 2022).
- Zhao, Y.; Feng, D.; Yu, L.; Wang, X.; Chen, Y.; Bai, Y.; Hernández, H.J.; Galleguillos, M.; Estades, C.; Biging, G.S.; et al. Detailed dynamic land cover mapping of Chile: Accuracy improvement by integrating multi-temporal data. Remote Sens. Environ. 2016, 183, 170–185. [Google Scholar] [CrossRef]
- Breiman, L. Bagging Predictors. Mach. Learn. 1996, 24, 123–140. [Google Scholar] [CrossRef]
- Miranda, A.; Mentler, R.; Moleto-Lobos, I.; Alfaro, G.; Aliaga, L.; Balbontín, D.; Barraza, M.; Baumbach, S.; Calderón, P.; Urrutia, V.; et al. The Landscape Fire Scars Database: Mapping historical burned area and fire severity in Chile. Earth Syst. Sci. Data Discuss. 2022, 14, 3599–3613. [Google Scholar] [CrossRef]
- Martinez, J.L.; Lucas-borja, M.E.; Plaza-alvarez, P.A.; Denisi, P.; Moreno, M.A.; Hernández, D.; González-Romero, J.; Zema, D.A. Comparison of satellite and drone-based images at two spatial scales to evaluate vegetation regeneration after post-fire treatments in a mediterranean forest. Appl. Sci. 2021, 11, 5423. [Google Scholar] [CrossRef]
- Nunes, L.J.R.; Raposo, M.A.M.; Pinto Gomes, C.J. A historical perspective of landscape and human population dynamics in guimarães (Northern Portugal): Possible implications of rural fire risk in a changing environment. Fire 2021, 4, 49. [Google Scholar] [CrossRef]
- Berry, L.E.; Sitters, H.; Abrams, R.W.; Heneberg, P.; Arsenault, A. Regional Case Studies: Southeast Australia, Sub-Saharan Africa, Central Europe, and Boreal Canada: Case Study: The Ecology of Mixed-Severity Fire in Mountain Ash Forests. In The Ecological Importance of Mixed-Severity Fires: Nature’s Phoenix; Elsevier Inc.: Amsterdam, The Netherlands, 2015; pp. 210–222. [Google Scholar] [CrossRef]
- Henriquez, E.M.; González, P.S.N. Análisis del Déficit Hídrico de la Región del Maule, Chile. Rev. Interam. De Ambiente Y Tur. RIAT 2012, 7, 25–32. [Google Scholar] [CrossRef]


| Variables Classes | Name | Label | Source |
|---|---|---|---|
| Human activity | DensPop | Population density of the point (inhabitants/census district) | Instituto Nacional de Estadísticas: https://www.ine.cl/herramientas/portal-de-mapas/geodatos-abiertos (accessed on 2 April 2022) [71] |
| DistCit | Distance from point to nearest city (m) | ||
| DistRoad_buff | Average distance from the 500 m radius buffer to the nearest road (m) | Ministerio de Obras Públicas: https://ide.mop.gob.cl/geomop/ (accessed on 2 April 2022) [72] | |
| Geography and topography | Exposition | Point exposition (indices) | Earth Resources Observation and Science Center (EROS), https://www.usgs.gov/centers/eros/data-tools (accessed on April 2022) [73] |
| Slope | Point slope (grades) | ||
| Elev | Point elevation (m.a.s.l.) | ||
| Land cover | Crop_buff | Proportion of crops in a 500 m radius buffer (proportion) | Zhao Y et al. 2016 [74] |
| Nat_buff | Proportion of native forest in a 500 m radius buffer (proportion) | ||
| ForPlan_buff | Proportion of forests plantation in a 500 m radius buffer (proportion) | ||
| Grass_buff | Proportion of grassland in a 500 m radius buffer (proportion) | ||
| Scrub_buff | Proportion of scrubs in a 500 m radius buffer (proportion) | ||
| Imper_buff | Proportion of impermeable land in a 500 m radius buffer (proportion) | ||
| BareSoil_buff | Proportion of bare soil in a 500 m radius buffer (proportion) | ||
| LC | Type of land cover predominant in the point (categorical) |
| Variable Importance | Variable Label | Variable Name |
|---|---|---|
| 18.9599929 | Proportion of crops in a 500 m radius buffer (proportion) | Crop_buff |
| 15.2302175 | Average distance from the 500 m radius buffer to the nearest road (m) | DistRoad_buff |
| 15.046572 | Distance from point to the nearest city (m) | DistCit |
| 8.80795483 | Proportion of forest plantation in a 500 m radius buffer (proportion) | ForPlan_buff |
| 7.63480897 | Proportion of grassland in a 500 m radius buffer (proportion) | Grass_buff |
| 6.82820899 | Proportion of scrubs in a 500 m radius buffer (proportion) | Scrub_buff |
| 6.35721698 | Point exposition (indices) | Exposition |
| 5.09869124 | Population density of the point (inhabitants/census district) | DensPop |
| 4.0326676 | Point elevation (m.a.s.l.) | Elev |
| 4.01163185 | Point slope (grades) | Slope |
| 2.78965119 | Proportion of impermeable land in a 500 m radius buffer (proportion) | Imper_buff |
| 2.31063774 | Proportion of native forest in a 500 m radius buffer (proportion) | Nat_buff |
| 1.84278487 | Type of land cover predominant in the point (categorical) | LC |
| 1.04896344 | Proportion of bare soil in a 500 m radius buffer (proportion) | BareSoil_buff |
| Ignition Probability | Risk Level | Points Frequency | Ignitions 2016–2020 (%) |
|---|---|---|---|
| 0–20 | Very low | 113 | 3.19% |
| 20–40 | Low | 424 | 11.99% |
| 40–60 | Medium | 728 | 20.58% |
| 60–80 | High | 941 | 26.60% |
| 80–100 | Very high | 1331 | 37.63% |
| TOTAL | 3537 | 100.00% |
Publisher’s Note: MDPI stays neutral with regard to jurisdictional claims in published maps and institutional affiliations. |
© 2022 by the authors. Licensee MDPI, Basel, Switzerland. This article is an open access article distributed under the terms and conditions of the Creative Commons Attribution (CC BY) license (https://creativecommons.org/licenses/by/4.0/).
Share and Cite
Azócar de la Cruz, G.; Alfaro, G.; Alonso, C.; Calvo, R.; Orellana, P. Modeling the Ignition Risk: Analysis before and after Megafire on Maule Region, Chile. Appl. Sci. 2022, 12, 9353. https://doi.org/10.3390/app12189353
Azócar de la Cruz G, Alfaro G, Alonso C, Calvo R, Orellana P. Modeling the Ignition Risk: Analysis before and after Megafire on Maule Region, Chile. Applied Sciences. 2022; 12(18):9353. https://doi.org/10.3390/app12189353
Chicago/Turabian StyleAzócar de la Cruz, Gabriela, Gabriela Alfaro, Claudia Alonso, Rubén Calvo, and Paz Orellana. 2022. "Modeling the Ignition Risk: Analysis before and after Megafire on Maule Region, Chile" Applied Sciences 12, no. 18: 9353. https://doi.org/10.3390/app12189353
APA StyleAzócar de la Cruz, G., Alfaro, G., Alonso, C., Calvo, R., & Orellana, P. (2022). Modeling the Ignition Risk: Analysis before and after Megafire on Maule Region, Chile. Applied Sciences, 12(18), 9353. https://doi.org/10.3390/app12189353