
Operational Mapping and Post-Disaster Hazard Assessment by the Development of a Multiparametric Web App Using Geospatial Technologies and Data: Attica Region 2021 Wildfires (Greece)

 ,
,  ,
,  and
and 
Abstract
:1. Introduction
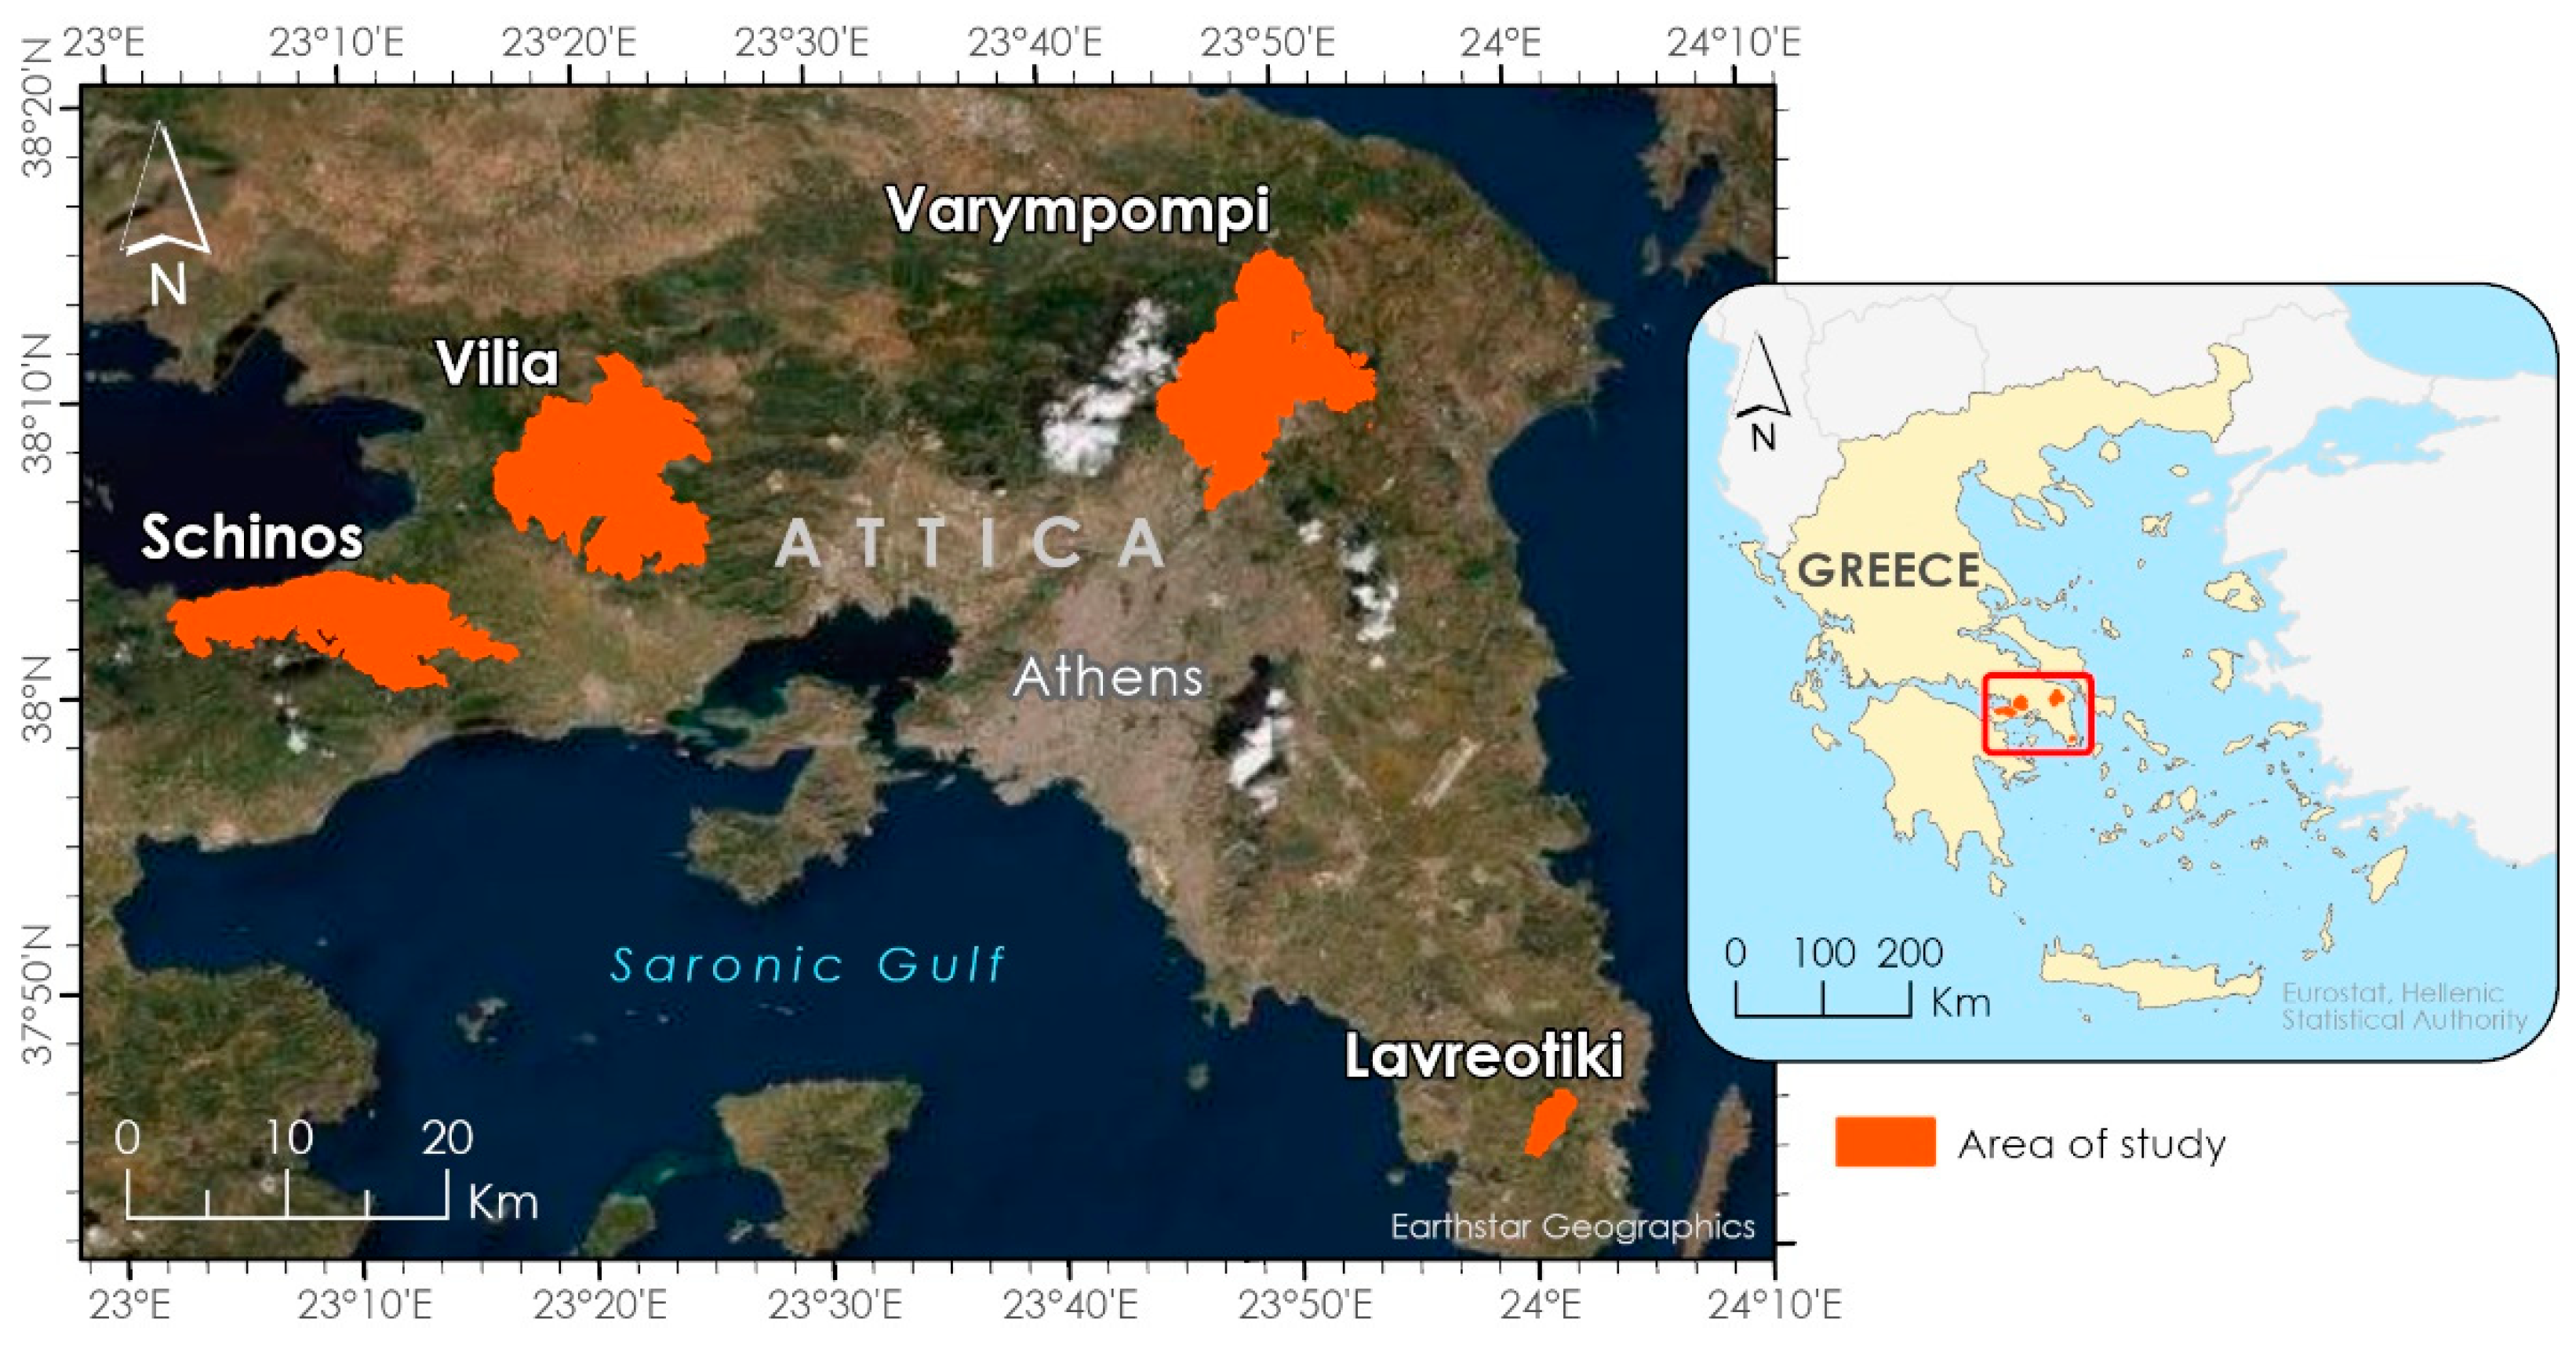
2. Wildfires in Attica Region 2021
3. Materials and Methods
3.1. Data and Software
3.2. Methodology
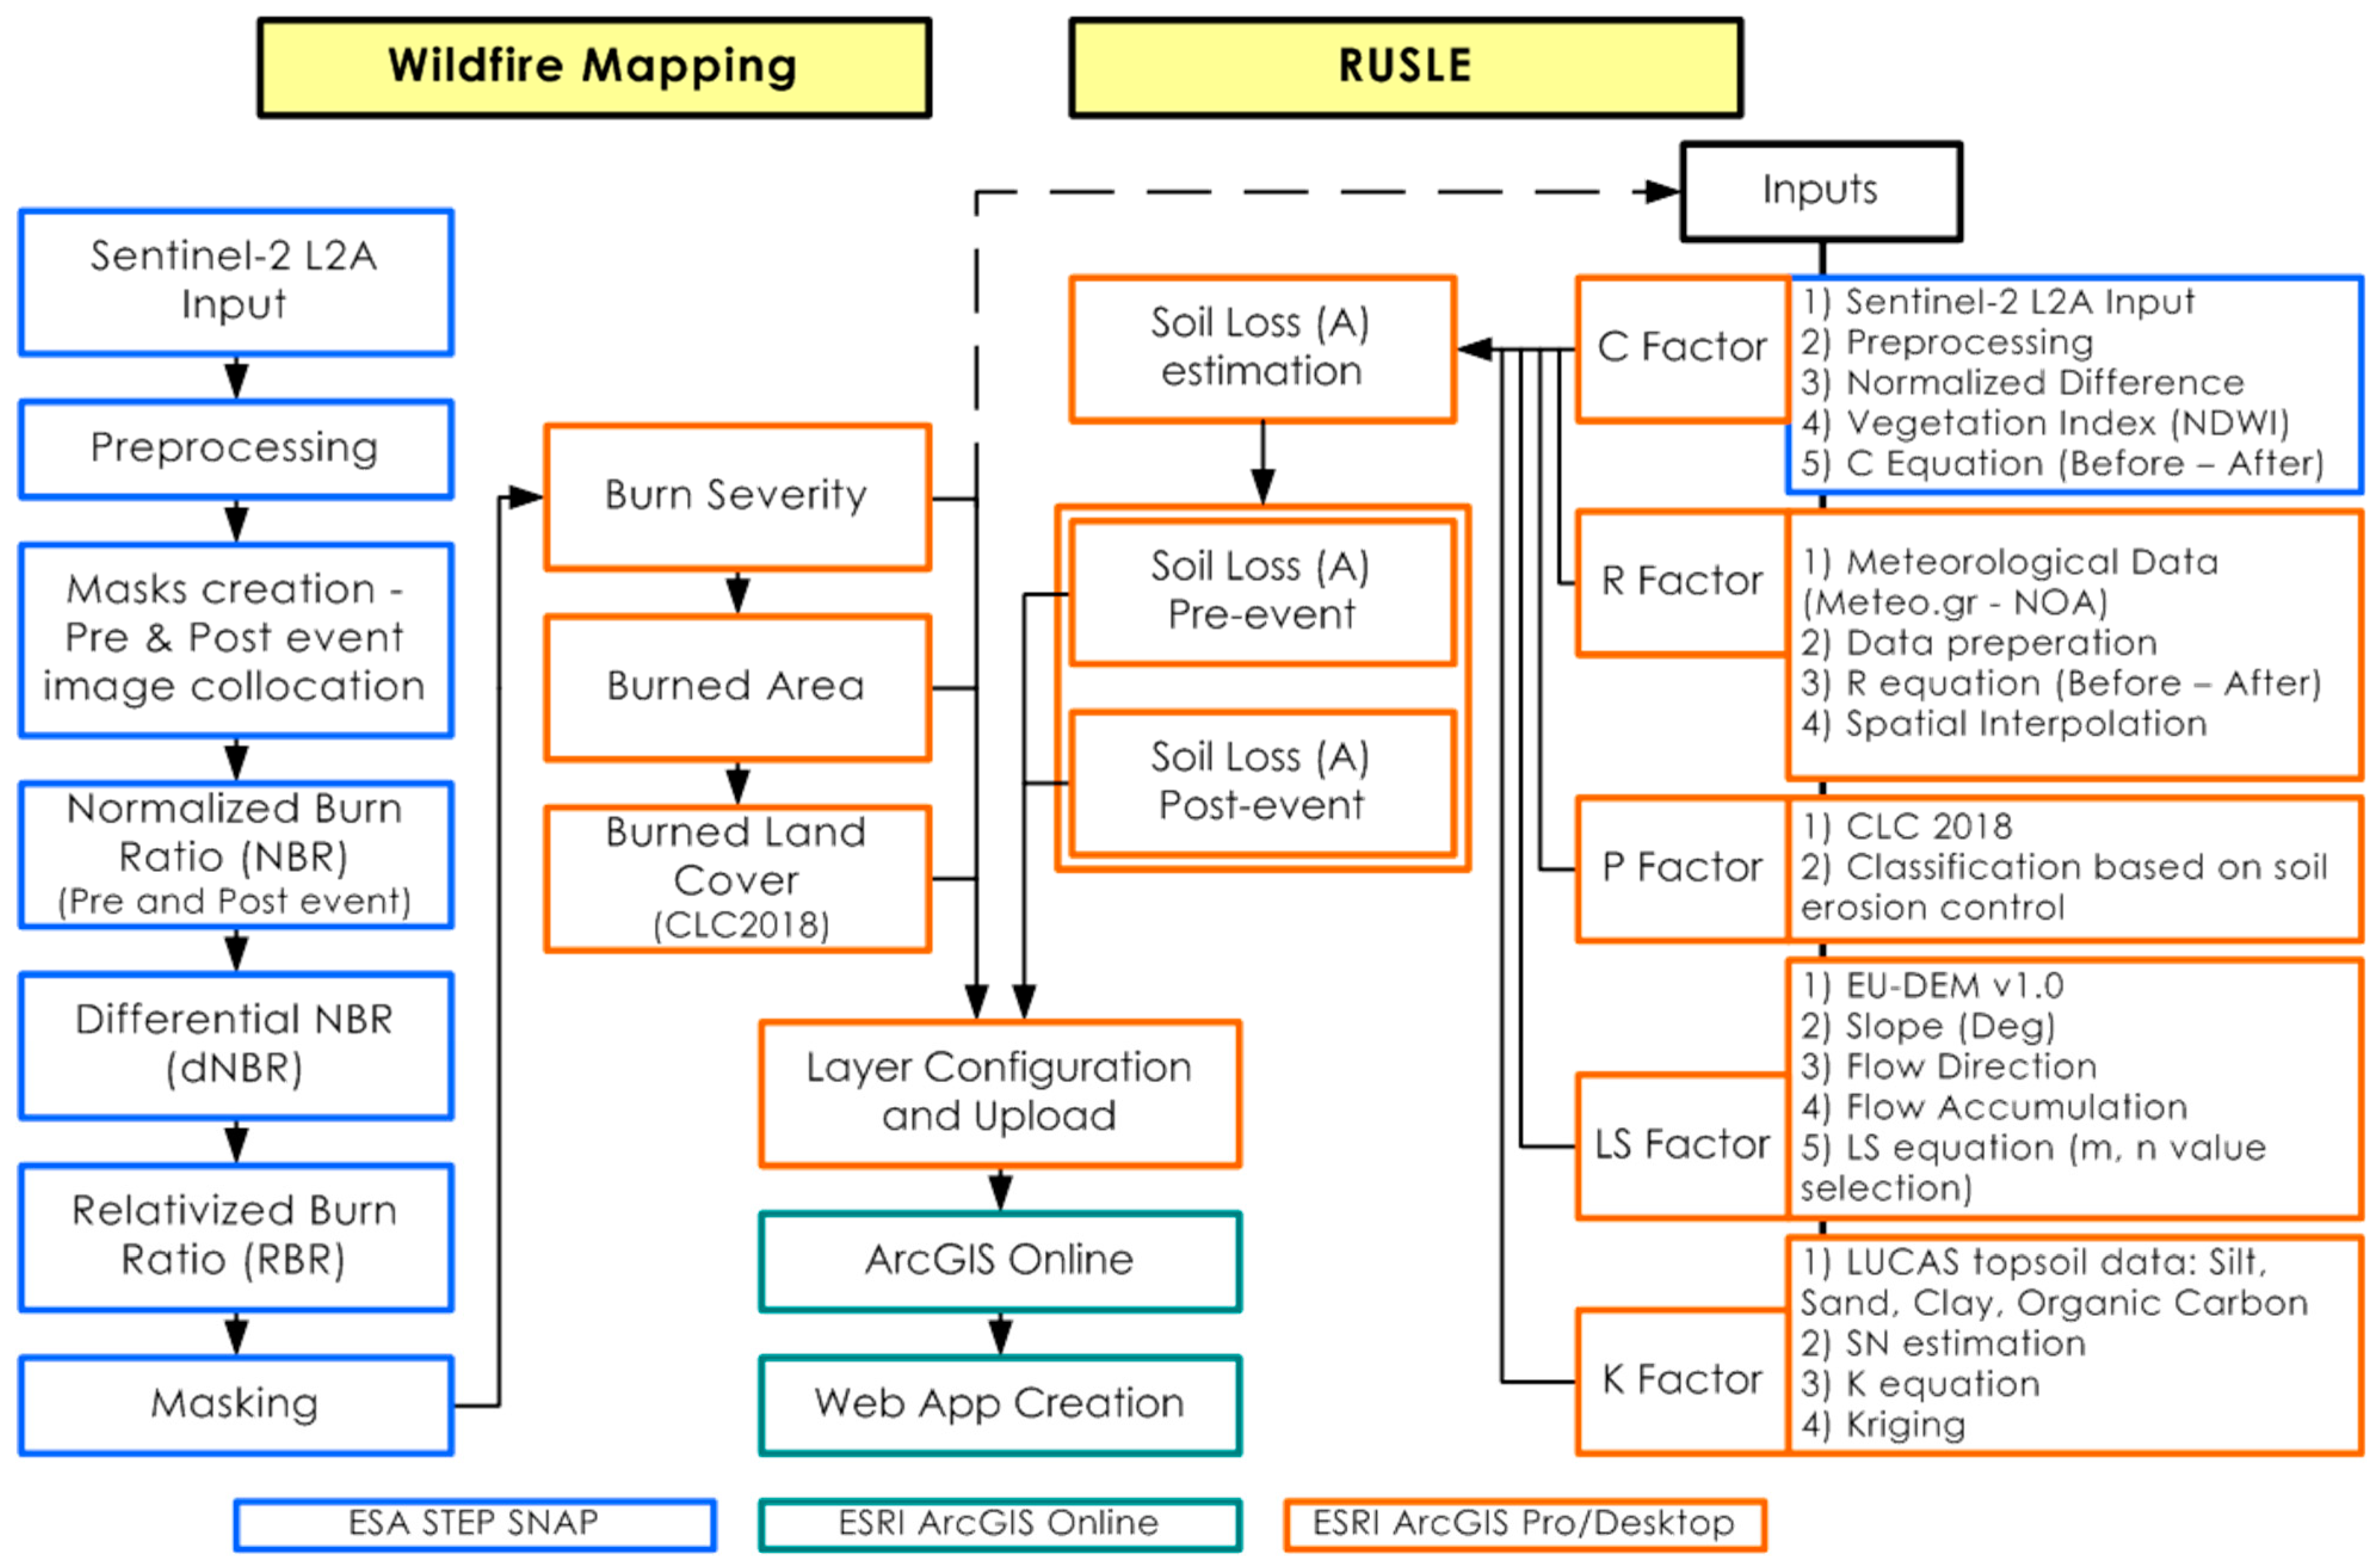
3.2.1. Operational Wildfire Mapping
3.2.2. Revised Universal Soil Loss Equation (RUSLE)
3.2.3. Web App Development
4. Results
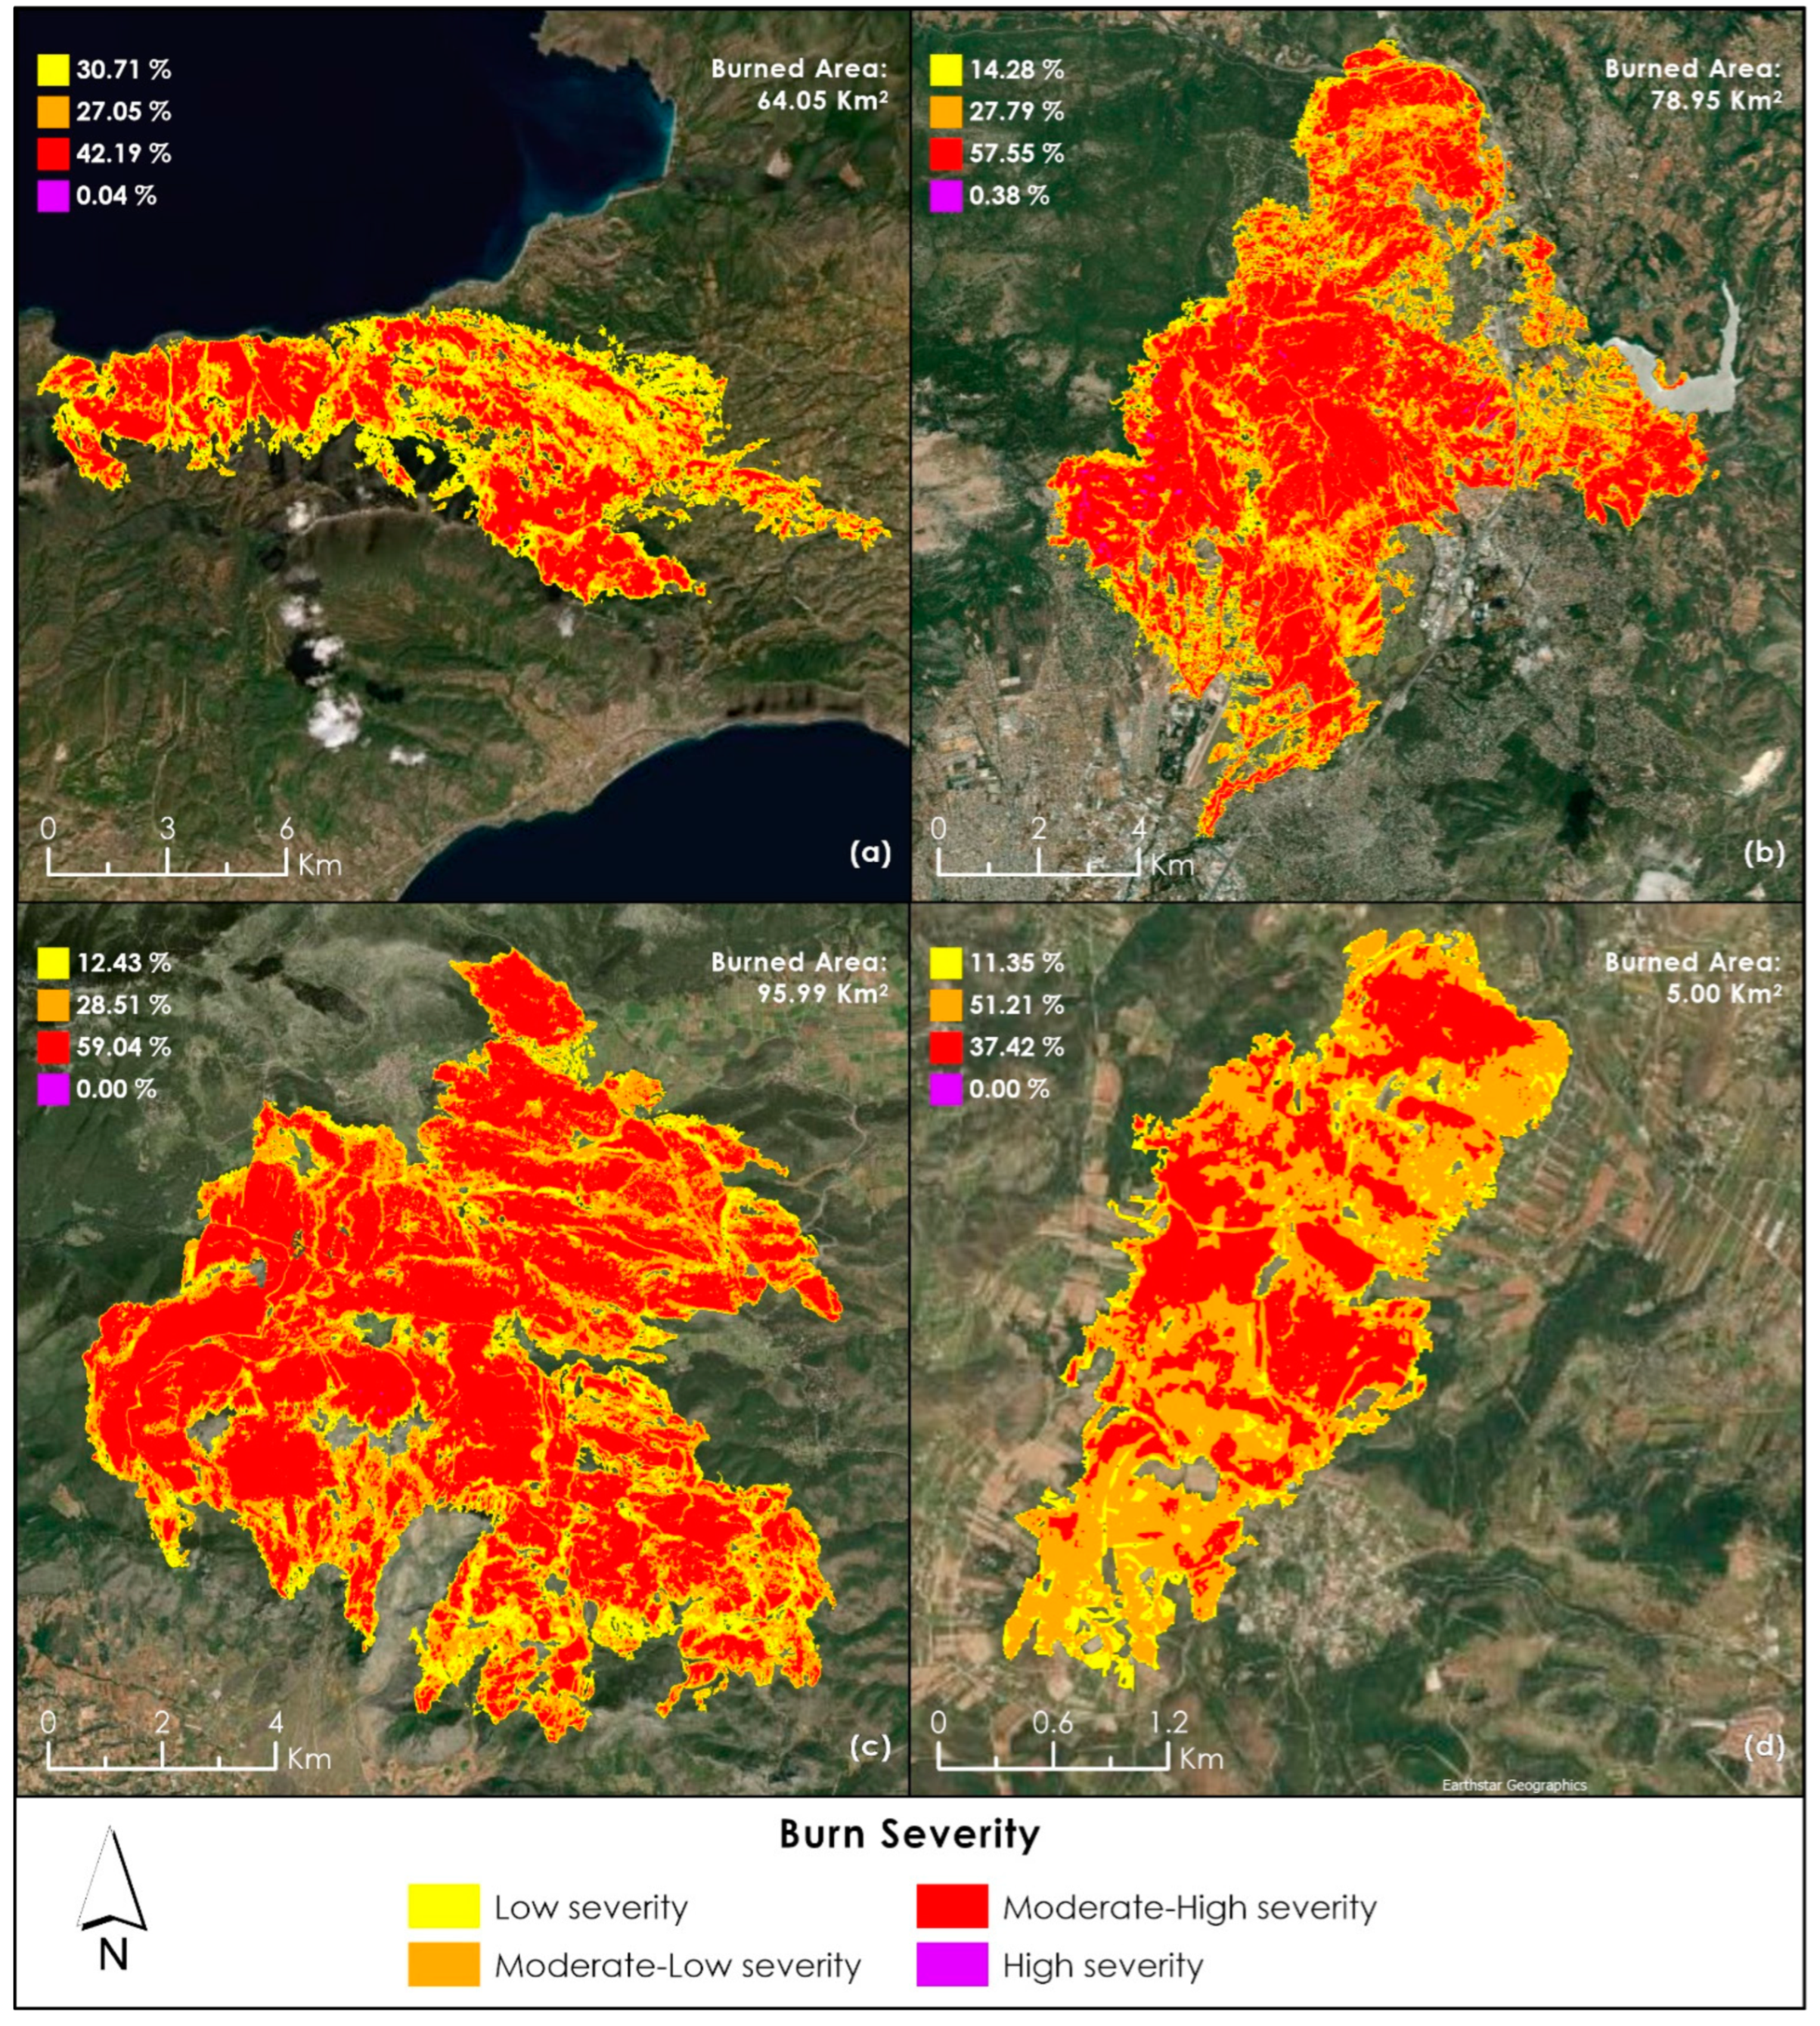
4.1. Burned Areas and Burn Severity
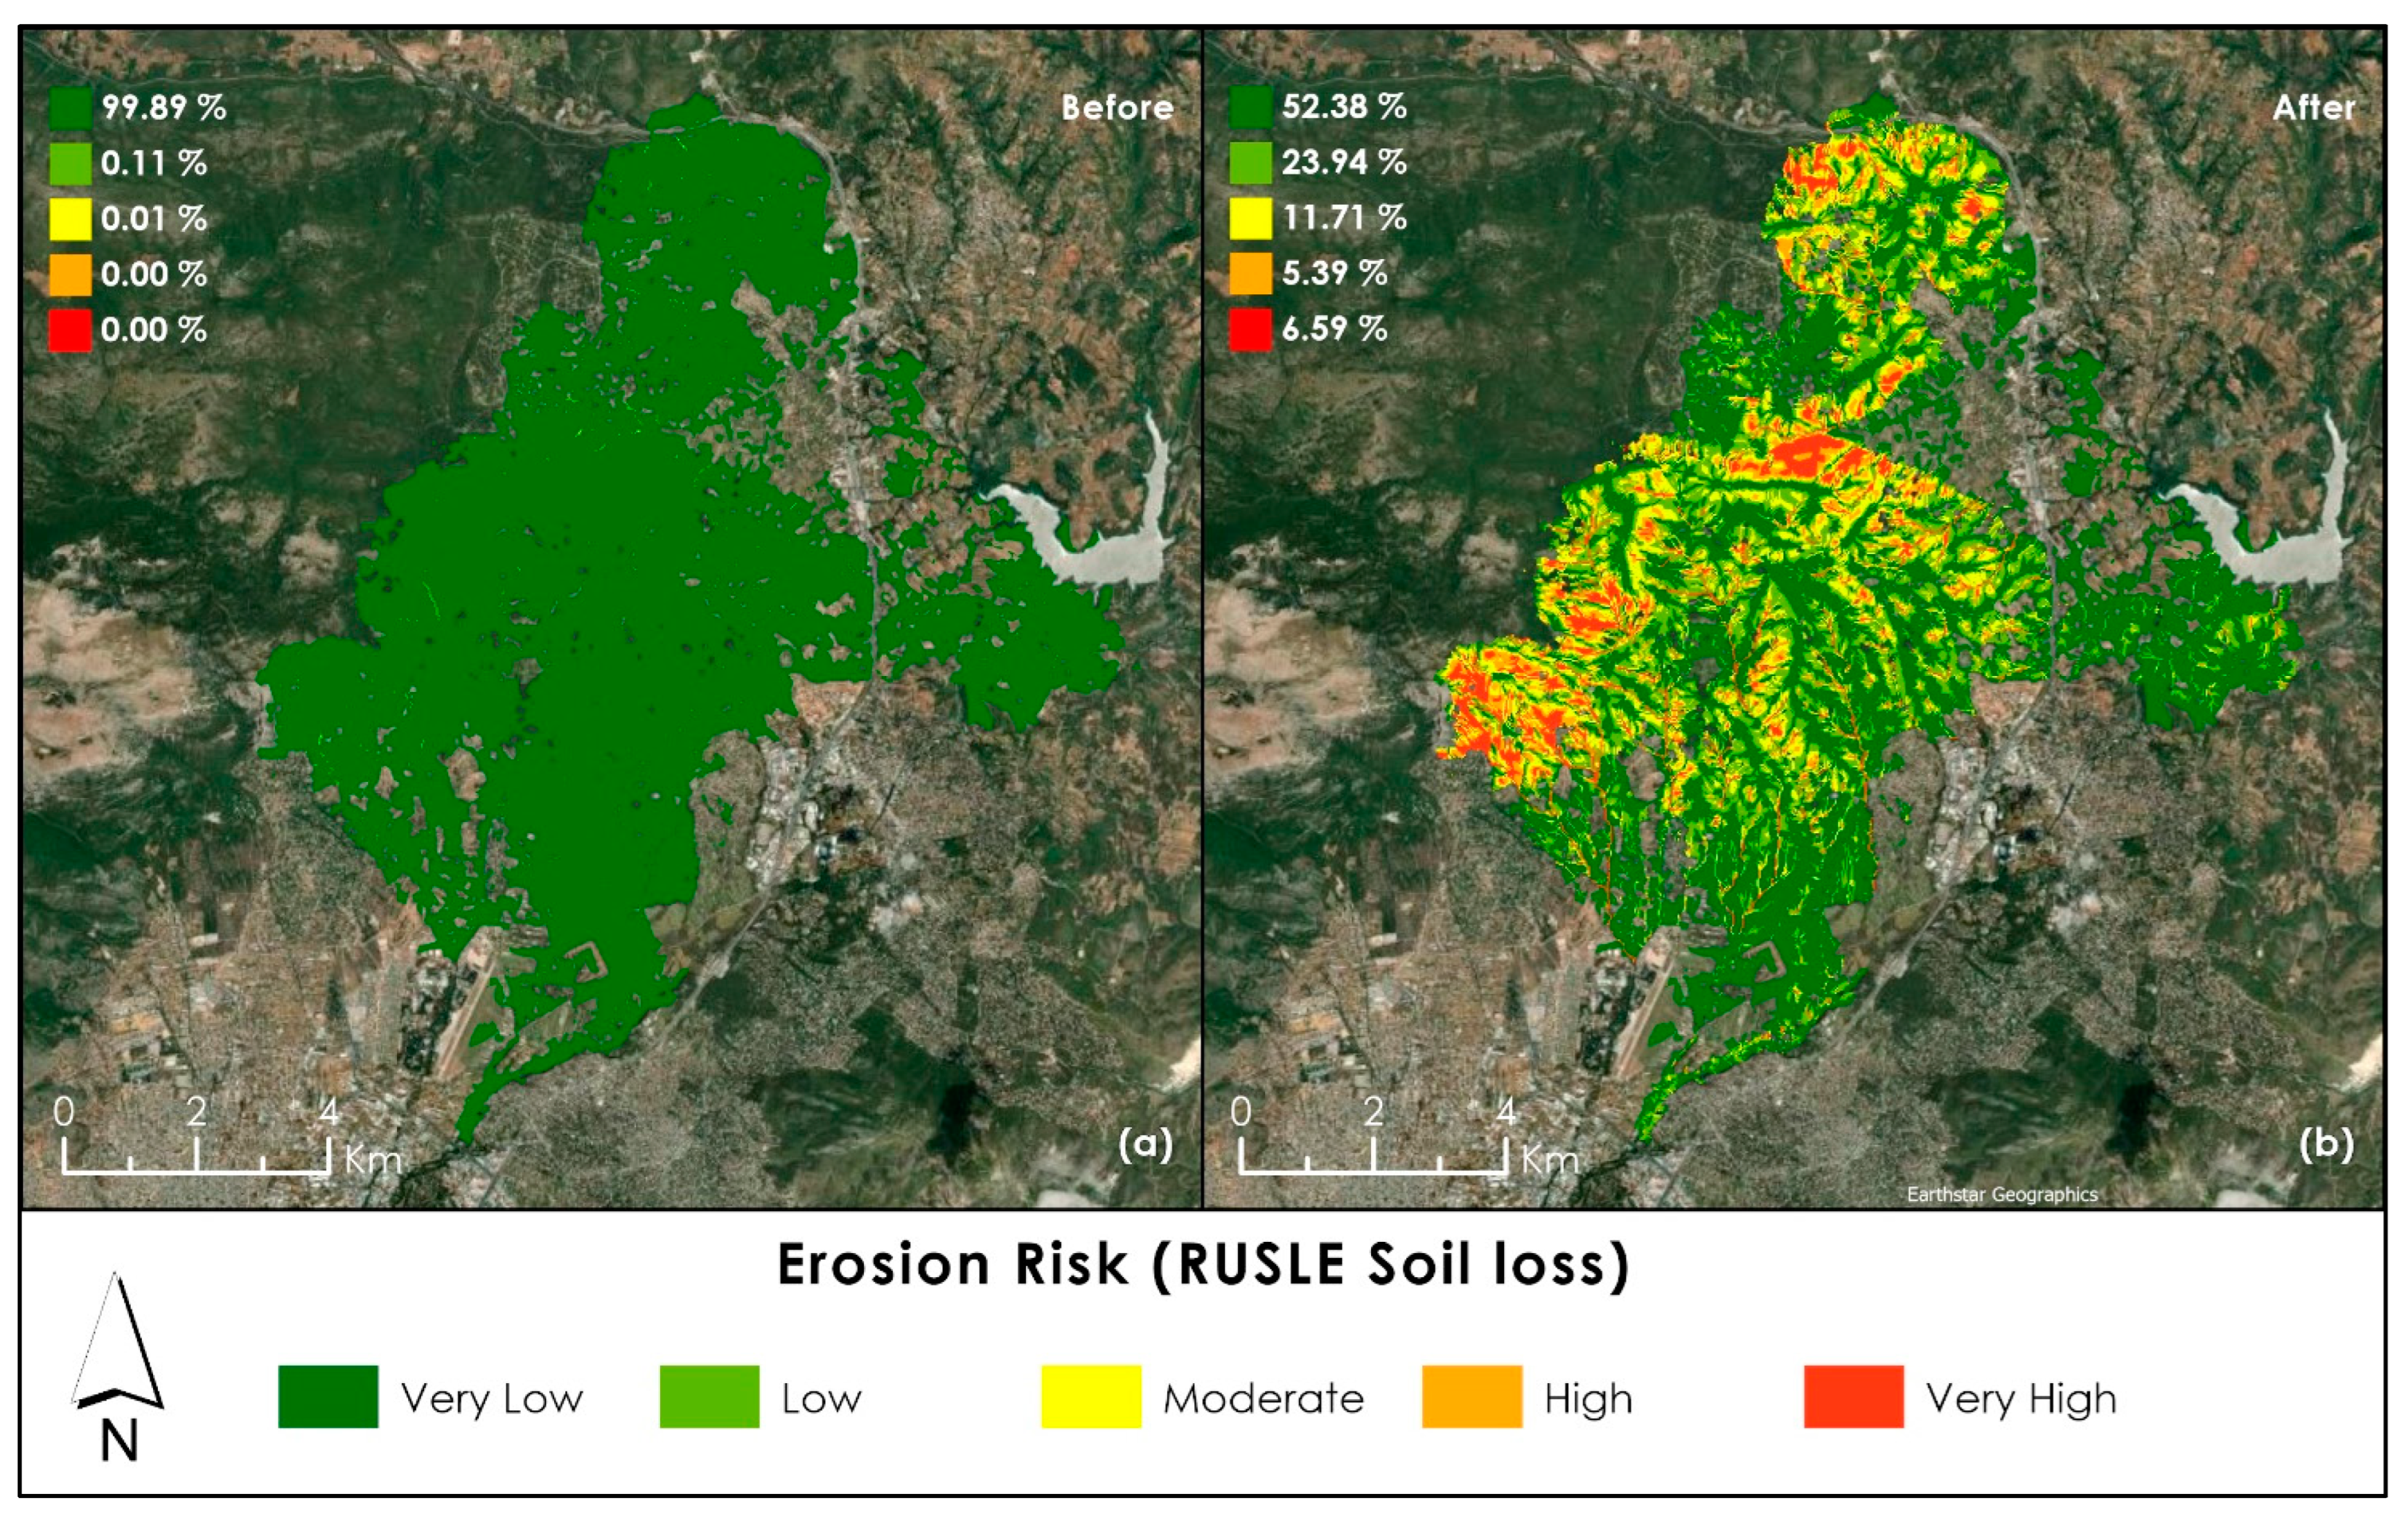
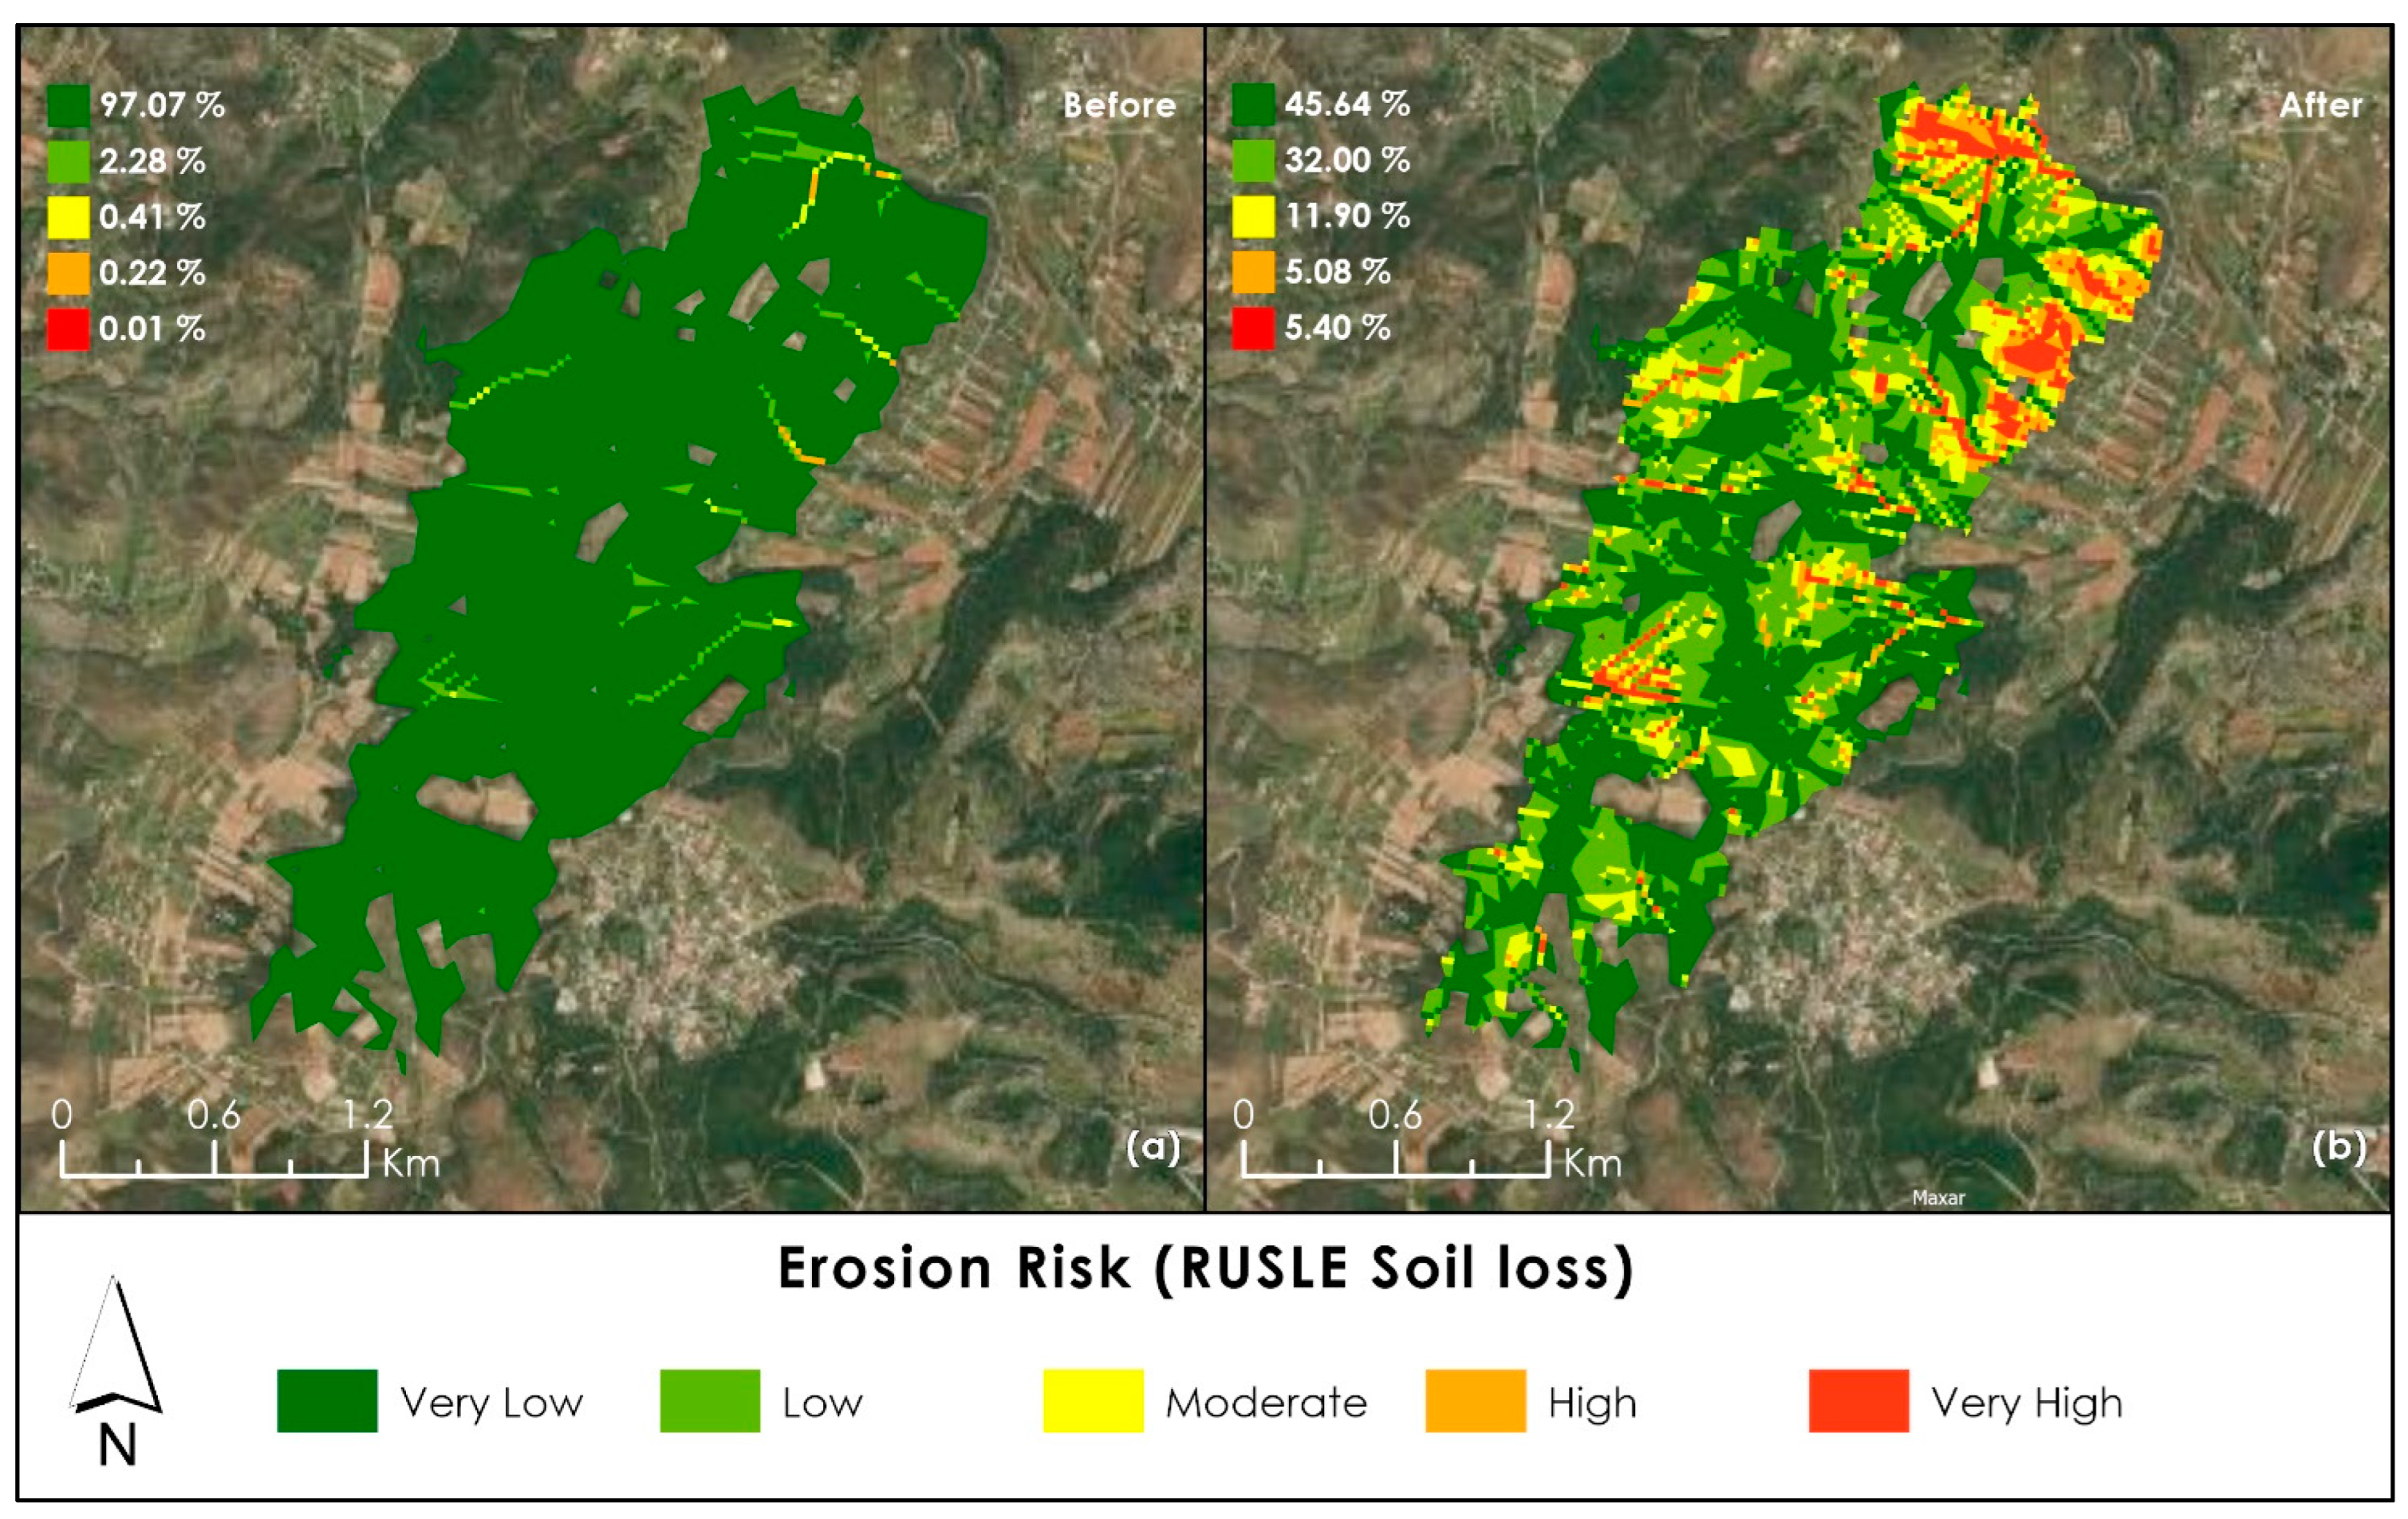
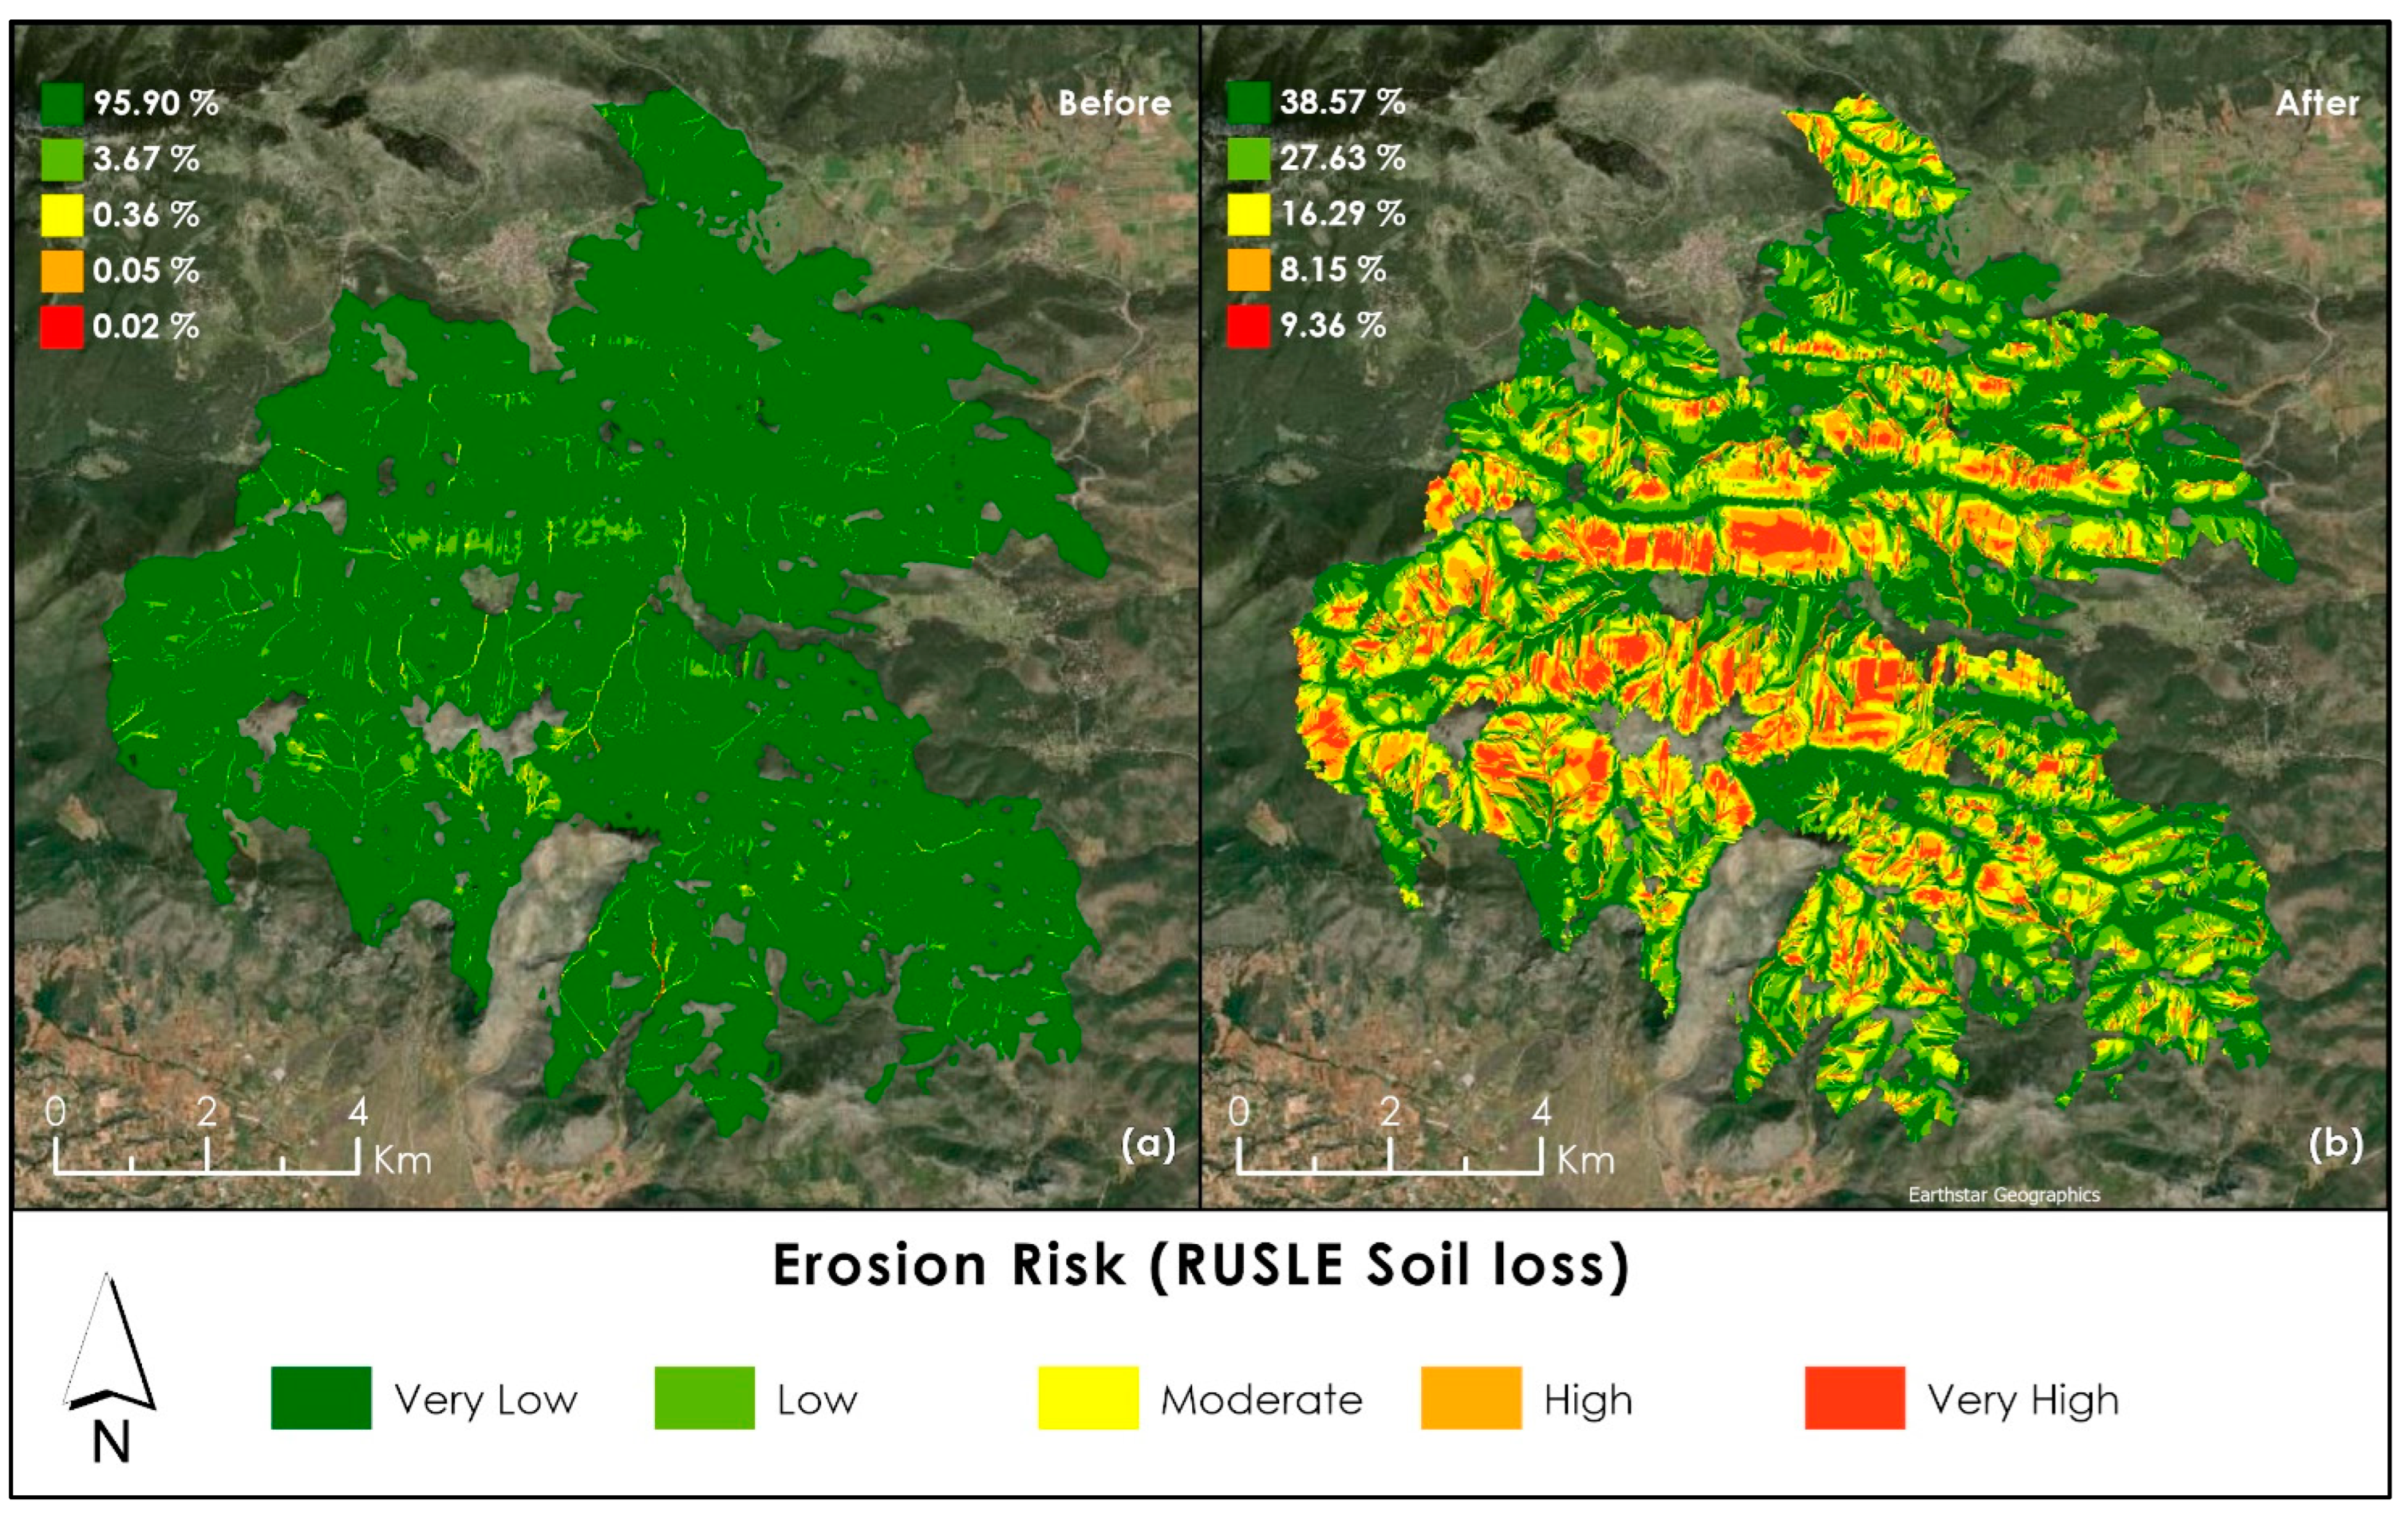
4.2. Soil Erosion Risk
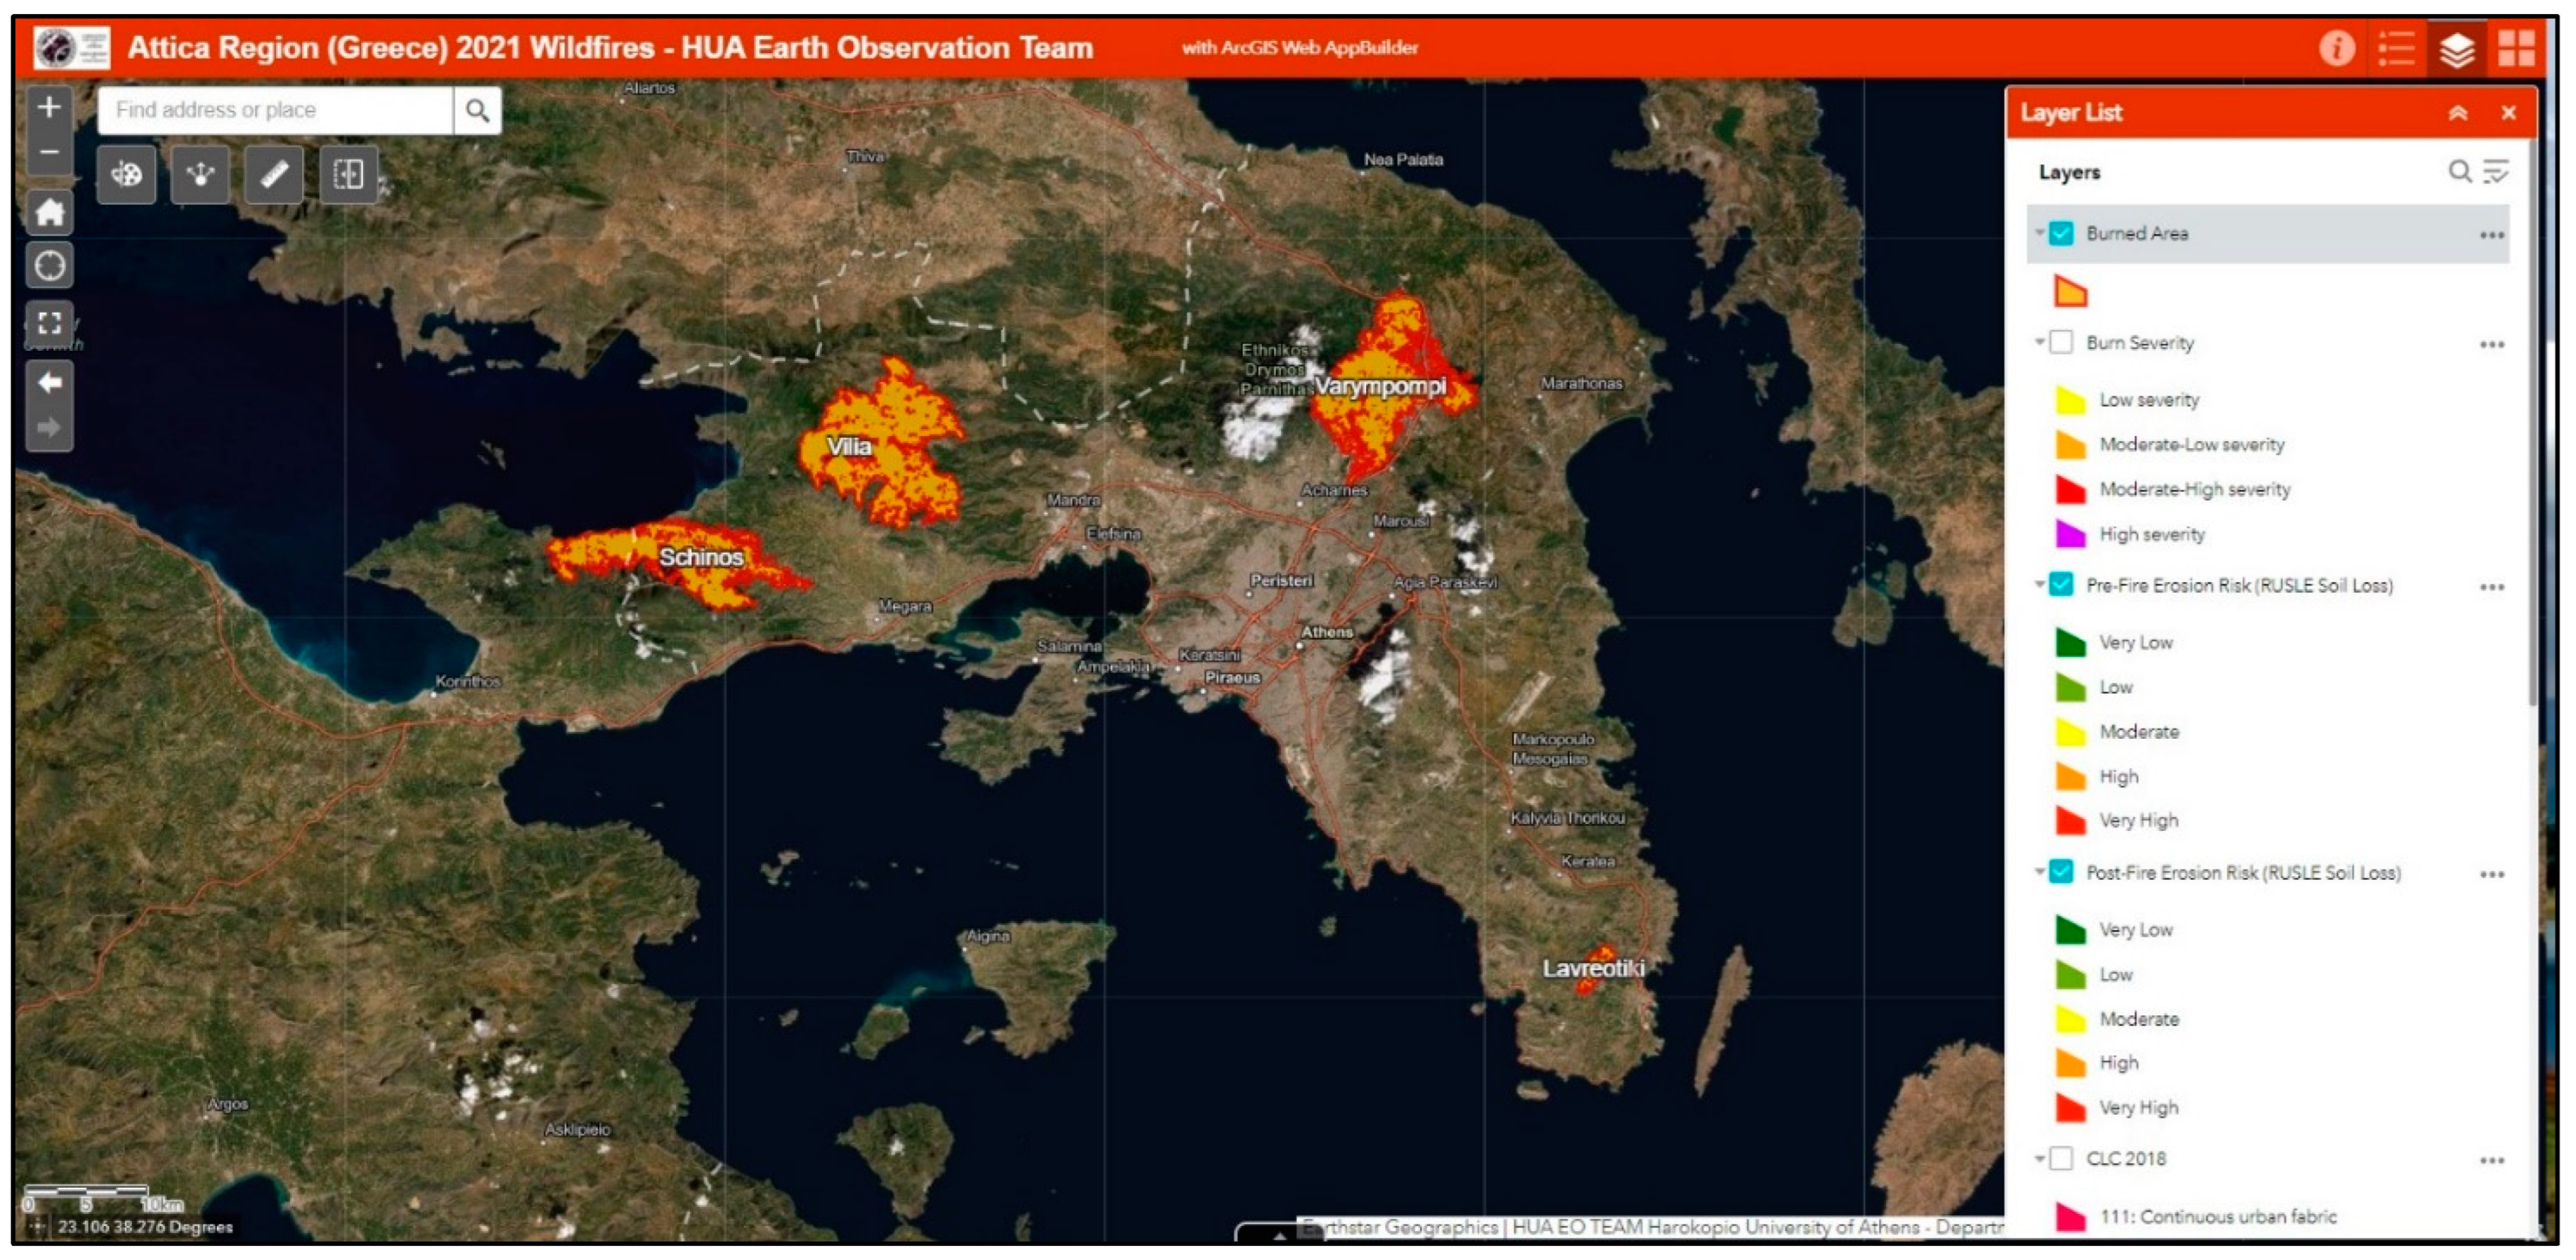
4.3. Web App
5. Discussion
6. Conclusions
Author Contributions
Funding
Data Availability Statement
Acknowledgments
Conflicts of Interest
References
- Lekkas, E.; Parcharidis, I.; Arianoutsou, M.; Lozios, S.; Mavroulis, S.; Spyrou, N.I.; E Antoniou, V.; Nastos, P.T.; Mavrouli, M.; Kranis, H.; et al. The July–August 2021 Wildfires in Greece. Newsl. Environ. Disaster Cris. Manag. Strateg. 2021, 25, 1–271. [Google Scholar] [CrossRef]
- Tselka, I.; Krassakis, P.; Rentzelos, A.; Koukouzas, N.; Parcharidis, I. Assessing Post-Fire Effects on Soil Loss Combining Burn Severity and Advanced Erosion Modeling in Malesina, Central Greece. Remote Sens. 2021, 13, 5160. [Google Scholar] [CrossRef]
- Di Piazza, G.V.; Di Stefano, C.; Ferro, V. Modelling the Effects of a Bushfire on Erosion in a Mediterranean Basin/Modélisation Des Impacts d’un Incendie Sur l’érosion Dans Un Bassin Méditerranéen. Hydrol. Sci. J. 2007, 52, 1253–1270. [Google Scholar] [CrossRef]
- Fernández, C.; Vega, J.A.; Vieira, D.C.S. Assessing Soil Erosion after Fire and Rehabilitation Treatments in NW Spain: Performance of Rusle and Revised Morgan-Morgan-Finney Models: Assessing soil erosion after fire. Land Degrad. Dev. 2010, 21, 58–67. [Google Scholar] [CrossRef] [Green Version]
- Stoyanova, J.S.; Georgiev, C.G.; Neytchev, P.N. Satellite Observations of Fire Activity in Relation to Biophysical Forcing Effect of Land Surface Temperature in Mediterranean Climate. Remote Sens. 2022, 14, 1747. [Google Scholar] [CrossRef]
- Depountis, N.; Michalopoulou, M.; Kavoura, K.; Nikolakopoulos, K.; Sabatakakis, N. Estimating Soil Erosion Rate Changes in Areas Affected by Wildfires. ISPRS Int. J. Geo-Inf. 2020, 9, 562. [Google Scholar] [CrossRef]
- Katagis, T.; Gitas, I.Z. Assessing the Accuracy of MODIS MCD64A1 C6 and FireCCI51 Burned Area Products in Mediterranean Ecosystems. Remote Sens. 2022, 14, 602. [Google Scholar] [CrossRef]
- Sánchez Sánchez, Y.; Martínez Graña, A.; Santos- Francés, F. Remote Sensing Calculation of the Influence of Wildfire on Erosion in High Mountain Areas. Agronomy 2021, 11, 1459. [Google Scholar] [CrossRef]
- Chuvieco, E. Global Impacts of Fire. In Earth Observation of Wildland Fires in Mediterranean Ecosystems; Chuvieco, E., Ed.; Springer: Berlin/Heidelberg, Germany, 2009; pp. 1–10. ISBN 978-3-642-01753-7. [Google Scholar] [CrossRef]
- Pérez-Cabello, F.; Echeverría, M.T.; Ibarra, P.; de la Riva, J. Effects of Fire on Vegetation, Soil and Hydrogeomorphological Behavior in Mediterranean Ecosystems. In Earth Observation of Wildland Fires in Mediterranean Ecosystems; Chuvieco, E., Ed.; Springer: Berlin/Heidelberg, Germany, 2009; pp. 111–128. [Google Scholar] [CrossRef]
- Markogiannaki, O.; Karavias, A.; Bafi, D.; Angelou, D.; Parcharidis, I. A Geospatial Intelligence Application to Support Post-Disaster Inspections Based on Local Exposure Information and on Co-Seismic DInSAR Results: The Case of the Durres (Albania) Earthquake on November 26, 2019. Nat. Hazards 2020, 103, 3085–3100. [Google Scholar] [CrossRef]
- van Westen, C.J. Remote sensing for natural disaster management. In Proceedings of the ISPRS 2000 Congress: Geoinformation for All, Amsterdam, The Netherlands, 16–23 July 2000; pp. 1700–1707. [Google Scholar]
- Chuvieco, E.; Mouillot, F.; van der Werf, G.R.; San Miguel, J.; Tanase, M.; Koutsias, N.; García, M.; Yebra, M.; Padilla, M.; Gitas, I.; et al. Historical Background and Current Developments for Mapping Burned Area from Satellite Earth Observation. Remote Sens. Environ. 2019, 225, 45–64. [Google Scholar] [CrossRef]
- Chuvieco, E.; Martín, M.P.; Palacios, A. Assessment of Different Spectral Indices in the Red-near-Infrared Spectral Domain for Burned Land Discrimination. Int. J. Remote Sens. 2002, 23, 5103–5110. [Google Scholar] [CrossRef]
- Key, C.; Benson, N. The Normalized Burned Ratio, a Landsat TM Radiometric Index of Burn Severity Incorporating Multi-Temporal Differencing; Geological Survey: Reston, VA, USA, 1999. [Google Scholar]
- Key, C.H.; Benson, N. Landscape assessment (LA). In FIREMON: Fire Effects Monitoring and Inventory System; Lutes, D.C., Keane, R.E., Caratti, J.F., Key, C.H., Benson, N.C., Sutherland, S., Gangi, L.J., Eds.; USDA Forest Service, Rocky Mountain Research Station: Ogden, UT, USA, 2006; pp. 1–51. [Google Scholar]
- Petropoulos, G.P.; Griffiths, H.M.; Kalivas, D.P. Quantifying Spatial and Temporal Vegetation Recovery Dynamics Following a Wildfire Event in a Mediterranean Landscape Using EO Data and GIS. Appl. Geogr. 2014, 50, 120–131. [Google Scholar] [CrossRef] [Green Version]
- Sourn, T.; Pok, S.; Chou, P.; Nut, N.; Theng, D.; Prasad, P.V.V. Assessment of Land Use and Land Cover Changes on Soil Erosion Using Remote Sensing, GIS and RUSLE Model: A Case Study of Battambang Province, Cambodia. Sustainability 2022, 14, 4066. [Google Scholar] [CrossRef]
- AbdulKadir, T.S.; Muhammad, R.M.; Khamaruzaman, W.Y.; Ahmad, M.H. Geo-statistical based susceptibility mapping of soil erosion and optimization of its causative factors: A conceptual framework. J. Eng. Sci. Technol. 2017, 12, 2880–2895. [Google Scholar]
- Esteves, T.C.J.; Kirkby, M.J.; Shakesby, R.A.; Ferreira, A.J.D.; Soares, J.A.A.; Irvine, B.J.; Ferreira, C.S.S.; Coelho, C.O.A.; Bento, C.P.M.; Carreiras, M.A. Mitigating Land Degradation Caused by Wildfire: Application of the PESERA Model to Fire-Affected Sites in Central Portugal. Geoderma 2012, 191, 40–50. [Google Scholar] [CrossRef]
- Miller, M.E.; Billmire, M.; Elliot, W.J.; Endsley, K.A.; Robichaud, P.R. Rapid Response Tools and Datasets for Post-Fire Modeling: Linking Earth Observations and Process-Based Hydrological Models to Support Post-Fire Remediation. ISPRS—Int. Arch. Photogramm. Remote Sens. Spat. Inf. Sci. 2015, XL-7/W3, 469–476. [Google Scholar] [CrossRef] [Green Version]
- Yang, X.; Zhang, M.; Oliveira, L.; Ollivier, Q.R.; Faulkner, S.; Roff, A. Rapid Assessment of Hillslope Erosion Risk after the 2019–2020 Wildfires and Storm Events in Sydney Drinking Water Catchment. Remote Sens. 2020, 12, 3805. [Google Scholar] [CrossRef]
- Wischmeier, W.H.; Smith, D.D. Predicting rainfall erosion losses: A guide to conservation planning. In Agriculture Handbook; US Department of Agriculture Science and Education Administration: Washington, DC, USA, 1978; Volume 537, pp. 1–69. [Google Scholar]
- Renard, K.G.; Foster, G.R.; Weesies, G.A.; McCool, D.; Yoder, D. Predicting soil erosion by water: A guide to conservation planning with the revised universal soil loss equation (RUSLE). In Agriculture Handbook; US Department of Agriculture: Washington, DC, USA, 1997; Volume 703, pp. 1–251. [Google Scholar]
- Flanagan, D.C.; Nearing, M.A. USDA Water Erosion Prediction Project: Hillslope Profile and Watershed Model Documentation; NSERL Report Number 10; USDA-ARS National Soil Erosion Research Laboratory: West Lafayette, IN, USA, 1995. [Google Scholar]
- Evelpidou, N.; Tzouxanioti, M.; Gavalas, T.; Spyrou, E.; Saitis, G.; Petropoulos, A.; Karkani, A. Assessment of Fire Effects on Surface Runoff Erosion Susceptibility: The Case of the Summer 2021 Forest Fires in Greece. Land 2022, 11, 21. [Google Scholar] [CrossRef]
- Lanorte, A.; Cillis, G.; Calamita, G.; Nolè, G.; Pilogallo, A.; Tucci, B.; De Santis, F. Integrated Approach of RUSLE, GIS and ESA Sentinel-2 Satellite Data for Post-Fire Soil Erosion Assessment in Basilicata Region (Southern Italy). Geomat. Nat. Hazards Risk 2019, 10, 1563–1595. [Google Scholar] [CrossRef]
- Lekkas, E.; Diakakis, M.; Spyrou, N.I.; Kranis, H.; Vassilakis, E.; Carydis, P.; Kosmopoulos, E.; Stamati, E.; Arianoutsou, M.; Mavroulis, S.; et al. The May 19, 2021, Schinos [Greece] forest fire. Newsl. Environ. Disaster Cris. Manag. Strateg. 2021, 23, 1–56. [Google Scholar] [CrossRef]
- List of EMS Rapid Mapping Activations. Copernicus Emergency Management Service. Available online: https://emergency.copernicus.eu/mapping/list-of-activations-rapid (accessed on 10 March 2022).
- Copernicus Open Access Hub. Available online: https://scihub.copernicus.eu/ (accessed on 23 December 2021).
- Sentinel-2 User Handbook; European Space Agency: Paris, France, 2015; Available online: https://sentinel.esa.int/documents/247904/685211/Sentinel-2_User_Handbook (accessed on 27 December 2021).
- CLC 2018. Copernicus Land Monitoring Service. Available online: https://land.copernicus.eu/pan-european/corine-land-cover/clc2018 (accessed on 21 December 2021).
- Büttner, G.; Kosztra, B.; Soukup, T.; Sousa, A.; Langanke, T. CLC2018 Technical Guidelines; European Environment Agency: Copenhagen, Denmark, 2017; Available online: https://land.copernicus.eu/user-corner/technicallibrary/clc2018technicalguidelines_final.pdf (accessed on 27 December 2021).
- Meteo.gr Meteo Search. Available online: https://meteosearch.meteo.gr/ (accessed on 14 January 2022).
- EU-DEM v1.0. Copernicus Land Monitoring Service. Available online: https://land.copernicus.eu/imagery-in-situ/eu-dem/eu-dem-v1-0-and-derived-products/eu-dem-v1.0 (accessed on 23 December 2021).
- Panagos, P.; Van Liedekerke, M.; Jones, A.; Montanarella, L. European Soil Data Centre: Response to European policy support and public data requirements. Land Use Policy 2012, 29, 329–338. [Google Scholar] [CrossRef]
- European Soil Data Centre (ESDAC). Available online: https://esdac.jrc.ec.europa.eu (accessed on 25 January 2022).
- McFeeters, S.K. The use of the Normalized Difference Water Index (NDWI) in the delineation of open water features. Int. J. Remote Sens. 1996, 17, 1425–1432. [Google Scholar] [CrossRef]
- Miller, J.D.; Thode, A.E. Quantifying burn severity in a heterogeneous landscape with a relative version of the delta Normalized Burn Ratio (dNBR). Remote Sens. Environ. 2007, 109, 66–80. [Google Scholar] [CrossRef]
- Key, C.H.; Benson, N. Measuring and remote sensing of burn severity: The CBI and NBR. In Proceedings of the Joint Fire Science Conference and Workshop, Boise, ID, USA, 15–17 June 1999. [Google Scholar]
- Keeley, J.E. Fire Intensity, Fire Severity and Burn Severity: A Brief Review and Suggested Usage. Int. J. Wildland Fire 2009, 18, 116–126. [Google Scholar] [CrossRef]
- Casady, G.M.; van Leeuwen, W.J.D.; Marsh, S.E. Evaluating Post-Wildfire Vegetation Regeneration as a Response to Multiple Environmental Determinants. Environ. Model. Assess. 2010, 15, 295–307. [Google Scholar] [CrossRef]
- Eidenshink, J.; Schwind, B.; Brewer, K.; Zhu, Z.-L.; Quayle, B.; Howard, S. A Project for Monitoring Trends in Burn Severity. Fire Ecol. 2007, 3, 3–21. [Google Scholar] [CrossRef]
- Veraverbeke, S.; Lhermitte, S.; Verstraeten, W.; Goossens, R. The temporal dimension of differenced Normalized Burn Ratio (dNBR) fire/burn severity studies: The case of the large 2007 Peloponnese wildfires in Greece. Remote Sens. Environ. 2010, 114, 2548–2563. [Google Scholar] [CrossRef] [Green Version]
- Parks, S.A.; Dillon, G.K.; Miller, C. A New Metric for Quantifying Burn Severity: The Relativized Burn Ratio. Remote Sens. 2014, 6, 1827–1844. [Google Scholar] [CrossRef] [Green Version]
- UN-SPIDER Knowledge Portal. Normalized Burn Ratio (NBR). Available online: https://un-spider.org/advisory-support/recommended-practices/recommended-practice-burn-severity/in-detail/normalized-burn-ratio (accessed on 2 April 2022).
- Polykretis, C.; Alexakis, D.; Grillakis, M.G.; Manoudakis, S. Assessment of intra-annual and inter-annual variabilities of soil erosion in Crete Island (Greece) by incorporating the dynamic “nature” of R and C-factors in RUSLE modeling. Remote Sens. 2020, 12, 2439. [Google Scholar] [CrossRef]
- Ouma, Y.O.; Lottering, L.; Tateishi, R. Soil Erosion Susceptibility Prediction in Railway Corridors Using RUSLE, Soil Degradation Index and the New Normalized Difference Railway Erosivity Index (NDReLI). Remote Sens. 2022, 14, 348. [Google Scholar] [CrossRef]
- Renard, K.G.; Freimund, J.R. Using Monthly Precipitation Data to Estimate the R-Factor in the Revised USLE. J. Hydrol. 1994, 157, 287–306. [Google Scholar] [CrossRef]
- de Santos Loureiro, N.; de Azevedo Coutinho, M. A New Procedure to Estimate the RUSLE EI30 Index, Based on Monthly Rainfall Data and Applied to the Algarve Region, Portugal. J. Hydrol 2001, 250, 12–18. [Google Scholar] [CrossRef]
- Williams, J.R.; Renard, K.G.; Dyke, P.T. EPIC: A New Method for Assessing Erosion’s Effect on Soil Productivity. J. Soil Water Conserv. 1983, 38, 381. [Google Scholar]
- Moore, I.D.; Burch, G.J. Physical Basis of the Length-Slope Factor in the Universal Soil Loss Equation. Soil Sci. Soc. Am. J. 1986, 50, 1294–1298. [Google Scholar] [CrossRef]
- Durigon, V.L.; Carvalho, D.F.; Antunes, M.A.H.; Oliveira, P.T.S.; Fernandes, M.M. NDVI Time Series for Monitoring RUSLE Cover Management Factor in a Tropical Watershed. Int. J. Remote Sens. 2014, 35, 441–453. [Google Scholar] [CrossRef]
- Vidali, M. Estimation of Soil Erosion Model in the Reservoir of the Pinios Dam of Ilia Prefecture. Master’s Thesis, University of Patras, Patras, Greece, 2013. [Google Scholar]
- Yang, D.; Kanae, S.; Oki, T.; Koike, T.; Musiake, K. Global Potential Soil Erosion with Reference to Land Use and Climate Changes. Hydrol. Process. 2003, 17, 2913–2928. [Google Scholar] [CrossRef]
- ArcGIS Online. Available online: https://www.esri.com/en-us/arcgis/products/arcgis-online/overview (accessed on 20 March 2022).
- ArcGIS Web AppBuilder. Available online: https://www.esri.com/en-us/arcgis/products/arcgis-web-appbuilder/overview (accessed on 20 March 2022).
- Panagos, P.; Borrelli, P.; Meusburger, K.; van der Zanden, E.H.; Poesen, J.; Alewell, C. Modelling the Effect of Support Practices (P-Factor) on the Reduction of Soil Erosion by Water at European Scale. Environ. Sci. Policy 2015, 51, 23–34. [Google Scholar] [CrossRef]
- Zevgoli, E.; Xanthopoulos, G.; Psomiadis, E.; Papanikolaοu, I. Forest Fire Severity Assessment Through Field Sampling and Satellite Remote Sensing Methods and Correlation of Their Results. In Proceedings of the 20th Congress of Hellenic Forestry Society, Trikala, Greece, 3–6 October 2021; pp. 333–344. [Google Scholar]


| Datasets | Format | Resolution Spatial | Temporal | Source | Purpose/Use |
|---|---|---|---|---|
| Sentinel-2 imagery 1 | Optical Level-2A | 10 m (Used) | 2021 | Copernicus Open Access Hub | Wildfire Mapping and C Factor |
| Corine Land Cover 2018 | Vector (Polygon) |
| Copernicus Land Monitoring Service | Wildfire Mapping and P Factor |
| EU-DEM v1.0 | Raster | 25 m | 2000 (2016) | Copernicus Land Monitoring Service | LS Factor |
| Meteorological data | Text |
| Meteo.gr of the National Observatory of Athens (NOA) | R Factor |
| Topsoil physical properties for Europe (based on LUCAS topsoil data) | Raster | 500 m | 2015 | European Soil Data Centre (ESDAC) of Joint Research Centre (JRC) | K Factor |
| Topsoil organic carbon (LUCAS) for EU25 | Raster | 500 m | 2014 | European Soil Data Centre (ESDAC) of Joint Research Centre (JRC) | K Factor |
| Area | Wildfire Start Date | Sentinel-2 Acquisition Date | Relation with the Wildfire Event | Purpose |
|---|---|---|---|---|
| Schinos | 19 May 2021 | 18 May 2021 | Pre-event | Wildfire Mapping |
| 23 May 2021 | Post-event | |||
| Varympompi | 3 August 2021 | 29 July 2021 | Pre-event | |
| 8 August 2021 | Post-event | |||
| Lavreotiki | 16 August 2021 | 13 August 2021 | Pre-event | |
| 18 August 2021 | Post-event | |||
| Vilia | 16 August 2021 | 29 July 2021 | Pre-event | |
| 26 August 2021 | Post-event | |||
| All the areas | - | 10 May 2021 | Pre-event | C Factor |
| 17 September 021 | Post-event |
| dNBR Value * | Burn Severity |
|---|---|
| 0.100–0.269 | Low severity |
| 0.270–0.439 | Moderate-low severity |
| 0.440–0.659 | Moderate-high severity |
| 0.660–1.300 | High severity |
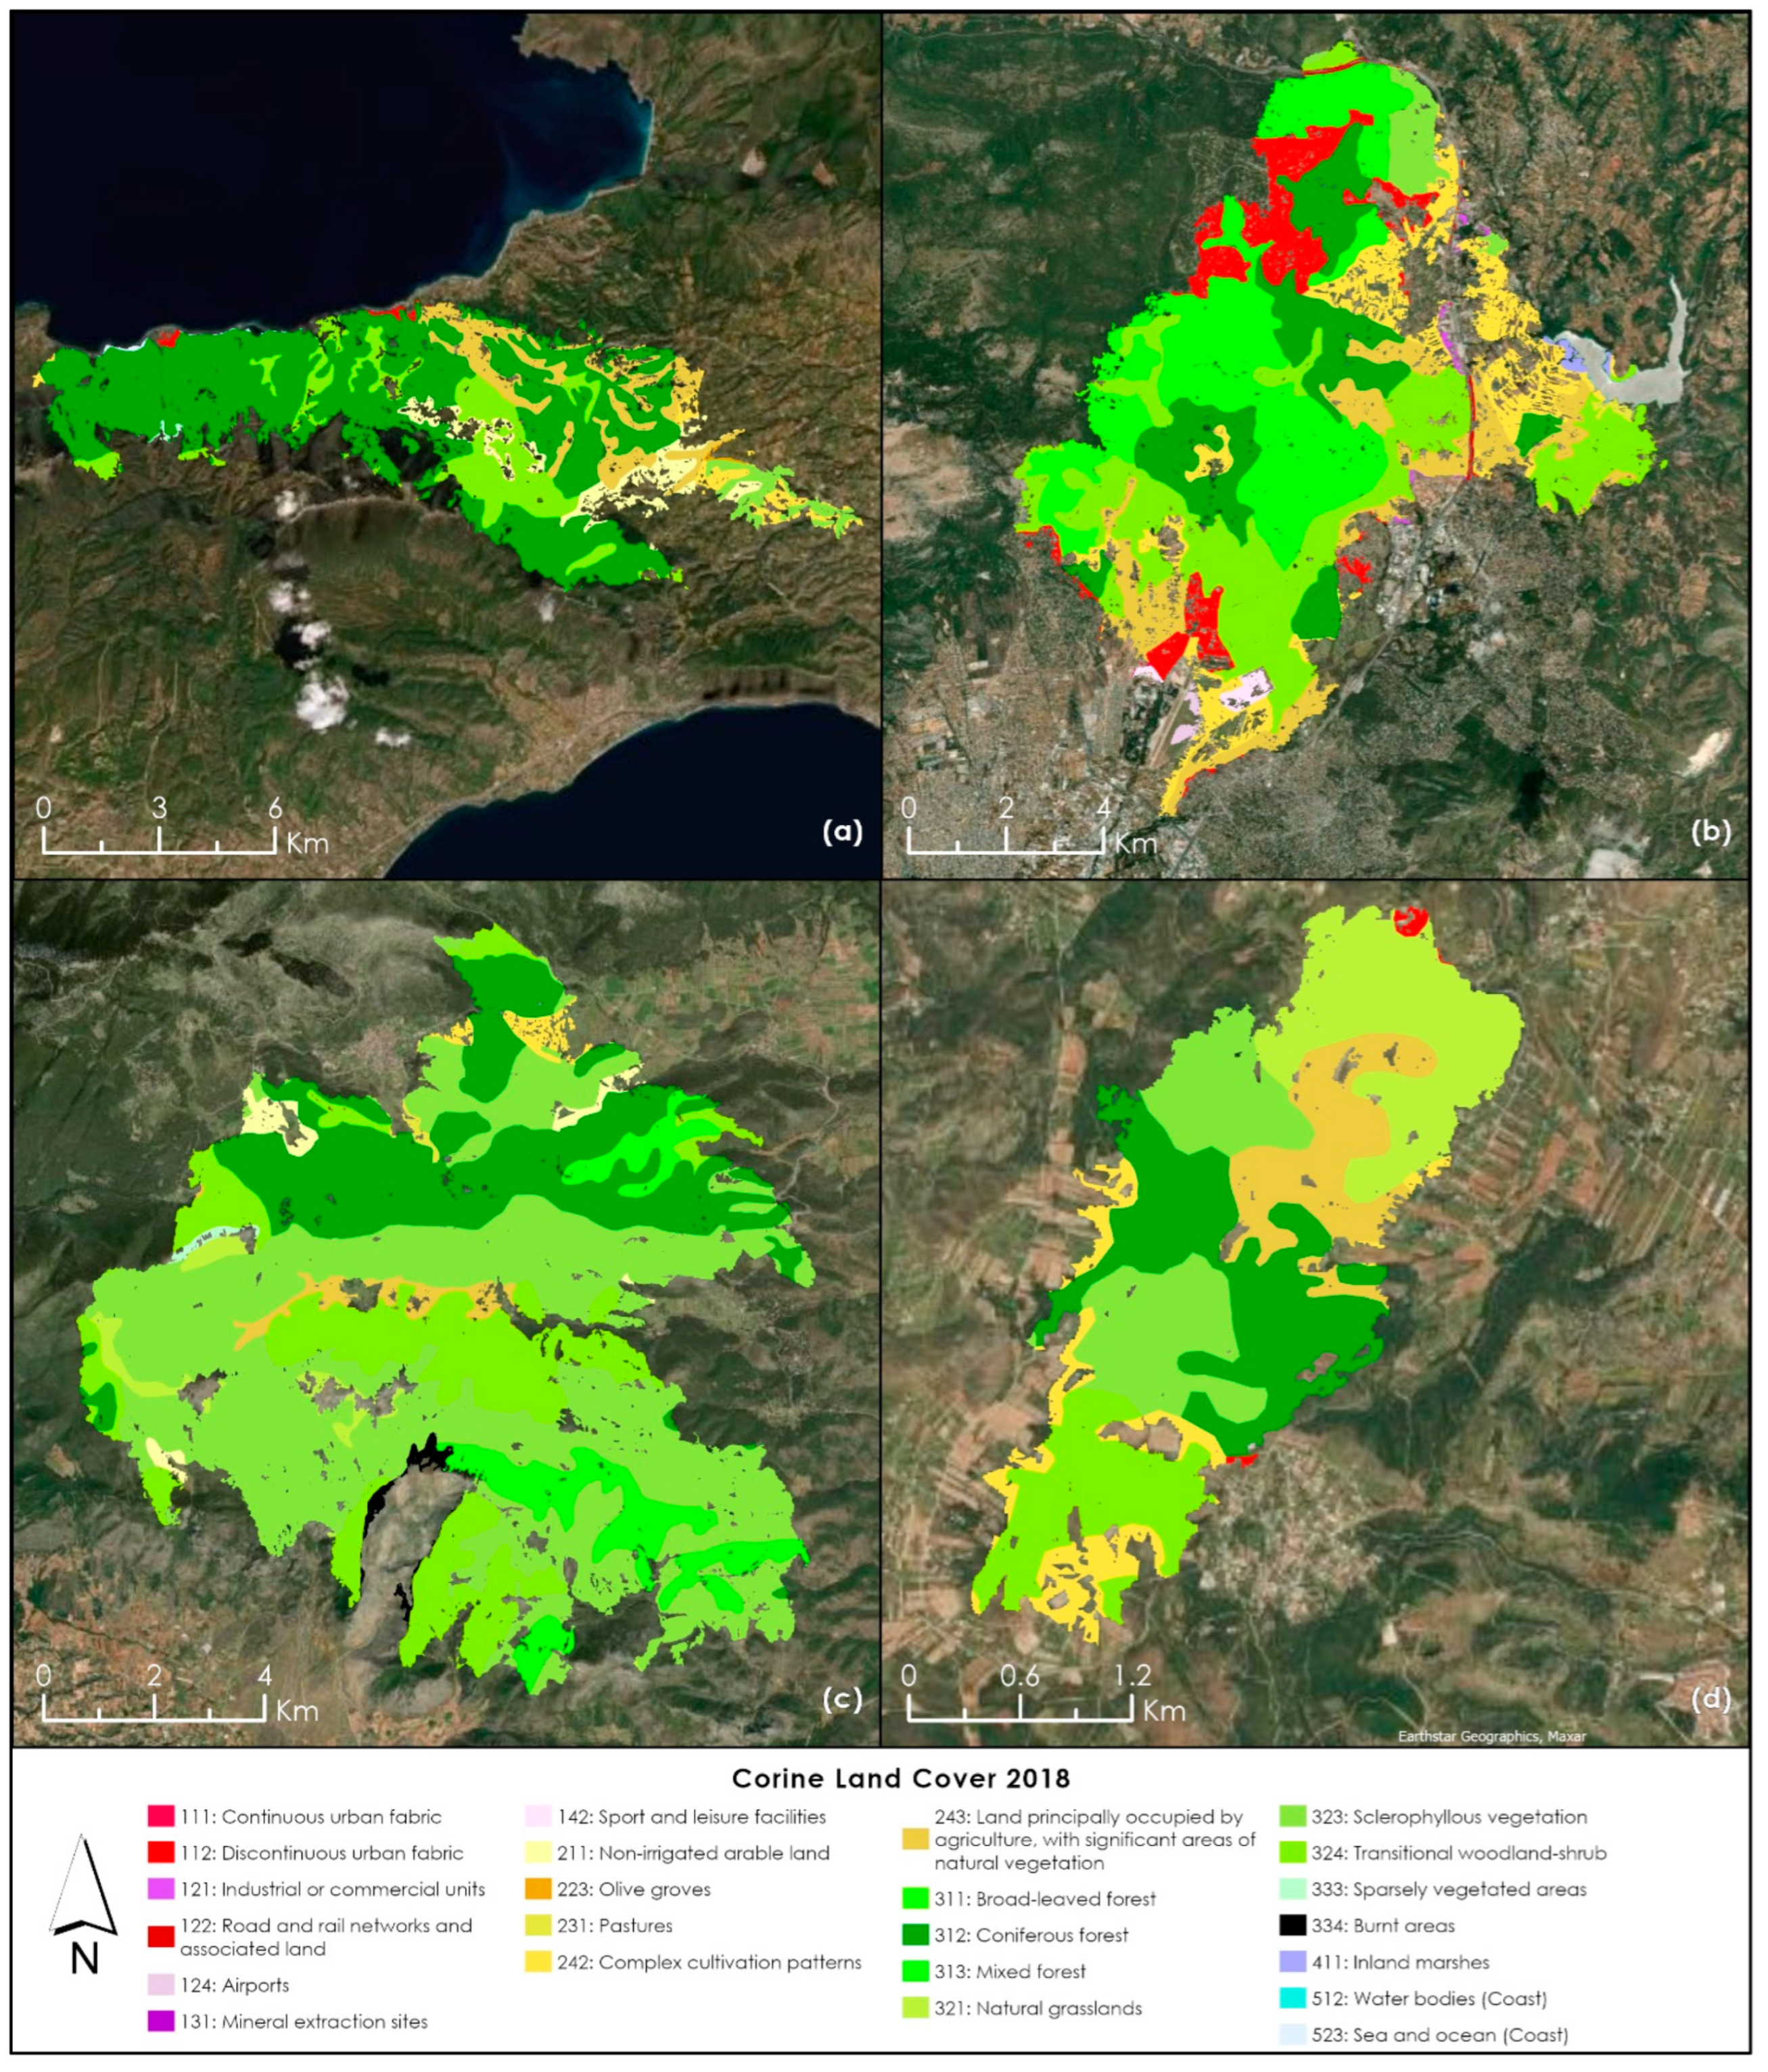
| CLC 2018 | Schinos | Varympompi | Lavreotiki | Vilia |
|---|---|---|---|---|
| 111: Continuous urban fabric | 0.02% | |||
| 112: Discontinuous urban fabric | 0.42% | 7.96% | 0.47% | |
| 121: Industrial or commercial units | 0.29% | |||
| 122: Road and rail networks and associated land | 0.36% | |||
| 124: Airports | 0.31% | |||
| 131: Mineral extraction sites | 0.00% | |||
| 142: Sport and leisure facilities | 0.63% | |||
| 211: Non-irrigated arable land | 5.47% | 1.29% | ||
| 223: Olive groves | 0.16% | |||
| 231: Pastures | 0.23% | 0.19% | ||
| 242: Complex cultivation patterns | 2.42% | 10.76% | 8.21% | 0.76% |
| 243: Land principally occupied by agriculture, with significant areas of natural vegetation | 10.58% | 9.87% | 13.06% | 1.45% |
| 311: Broad-leaved forest | 4.33% | |||
| 312: Coniferous forest | 62.79% | 15.41% | 23.18% | 19.73% |
| 313: Mixed forest | 0.01% | 22.11% | 7.58% | |
| 321: Natural grasslands | 20.92% | 1.57% | ||
| 323: Sclerophyllous vegetation | 3.04% | 2.88% | 20.35% | 49.21% |
| 324: Transitional woodland-shrub | 14.77% | 24.49% | 13.81% | 17.34% |
| 333: Sparsely vegetated areas | 0.16% | 0.21% | ||
| 334: Burnt areas (Previous wildfire) | 0.65% | |||
| 411: Inland marshes | 0.32% | |||
| 512: Water bodies (Coast) | 0.02% | |||
| 523: Sea and ocean (Coast) | 0.18% |
| Erosion Risk | Schinos | Varympompi | Lavreotiki | Vilia |
|---|---|---|---|---|
| Very Low | 0.00–122.44 | 0.00–235.67 | 0.00–42.60 | 0.00–1957.77 |
| Low | 122.44–244.88 | 235.67–471.34 | 42.60–85.20 | 1957.77–3915.54 |
| Moderate | 244.88–367.32 | 471.341–707.01 | 85.20–127.80 | 3915.54–5873.31 |
| High | 367.32–489.76 | 707.01–942.68 | 127.80–170.40 | 5873.31–7831.08 |
| Very High | >489.76 | >942.681 | >170.401 | >7831.08 |
Publisher’s Note: MDPI stays neutral with regard to jurisdictional claims in published maps and institutional affiliations. |
© 2022 by the authors. Licensee MDPI, Basel, Switzerland. This article is an open access article distributed under the terms and conditions of the Creative Commons Attribution (CC BY) license (https://creativecommons.org/licenses/by/4.0/).
Share and Cite
Falaras, T.; Tselka, I.; Papadopoulos, I.; Nikolidaki, M.; Karavias, A.; Bafi, D.; Petani, A.; Krassakis, P.; Parcharidis, I. Operational Mapping and Post-Disaster Hazard Assessment by the Development of a Multiparametric Web App Using Geospatial Technologies and Data: Attica Region 2021 Wildfires (Greece). Appl. Sci. 2022, 12, 7256. https://doi.org/10.3390/app12147256
Falaras T, Tselka I, Papadopoulos I, Nikolidaki M, Karavias A, Bafi D, Petani A, Krassakis P, Parcharidis I. Operational Mapping and Post-Disaster Hazard Assessment by the Development of a Multiparametric Web App Using Geospatial Technologies and Data: Attica Region 2021 Wildfires (Greece). Applied Sciences. 2022; 12(14):7256. https://doi.org/10.3390/app12147256
Chicago/Turabian StyleFalaras, Triantafyllos, Ioanna Tselka, Ioannis Papadopoulos, Maria Nikolidaki, Andreas Karavias, Despoina Bafi, Aliki Petani, Pavlos Krassakis, and Issaak Parcharidis. 2022. "Operational Mapping and Post-Disaster Hazard Assessment by the Development of a Multiparametric Web App Using Geospatial Technologies and Data: Attica Region 2021 Wildfires (Greece)" Applied Sciences 12, no. 14: 7256. https://doi.org/10.3390/app12147256
APA StyleFalaras, T., Tselka, I., Papadopoulos, I., Nikolidaki, M., Karavias, A., Bafi, D., Petani, A., Krassakis, P., & Parcharidis, I. (2022). Operational Mapping and Post-Disaster Hazard Assessment by the Development of a Multiparametric Web App Using Geospatial Technologies and Data: Attica Region 2021 Wildfires (Greece). Applied Sciences, 12(14), 7256. https://doi.org/10.3390/app12147256