


The Effect of the Petrography, Mineralogy, and Physical Properties of Limestone on Mode I Fracture Toughness under Dry and Saturated Conditions

 ,
, 

Abstract
:1. Introduction
2. Materials and Methods
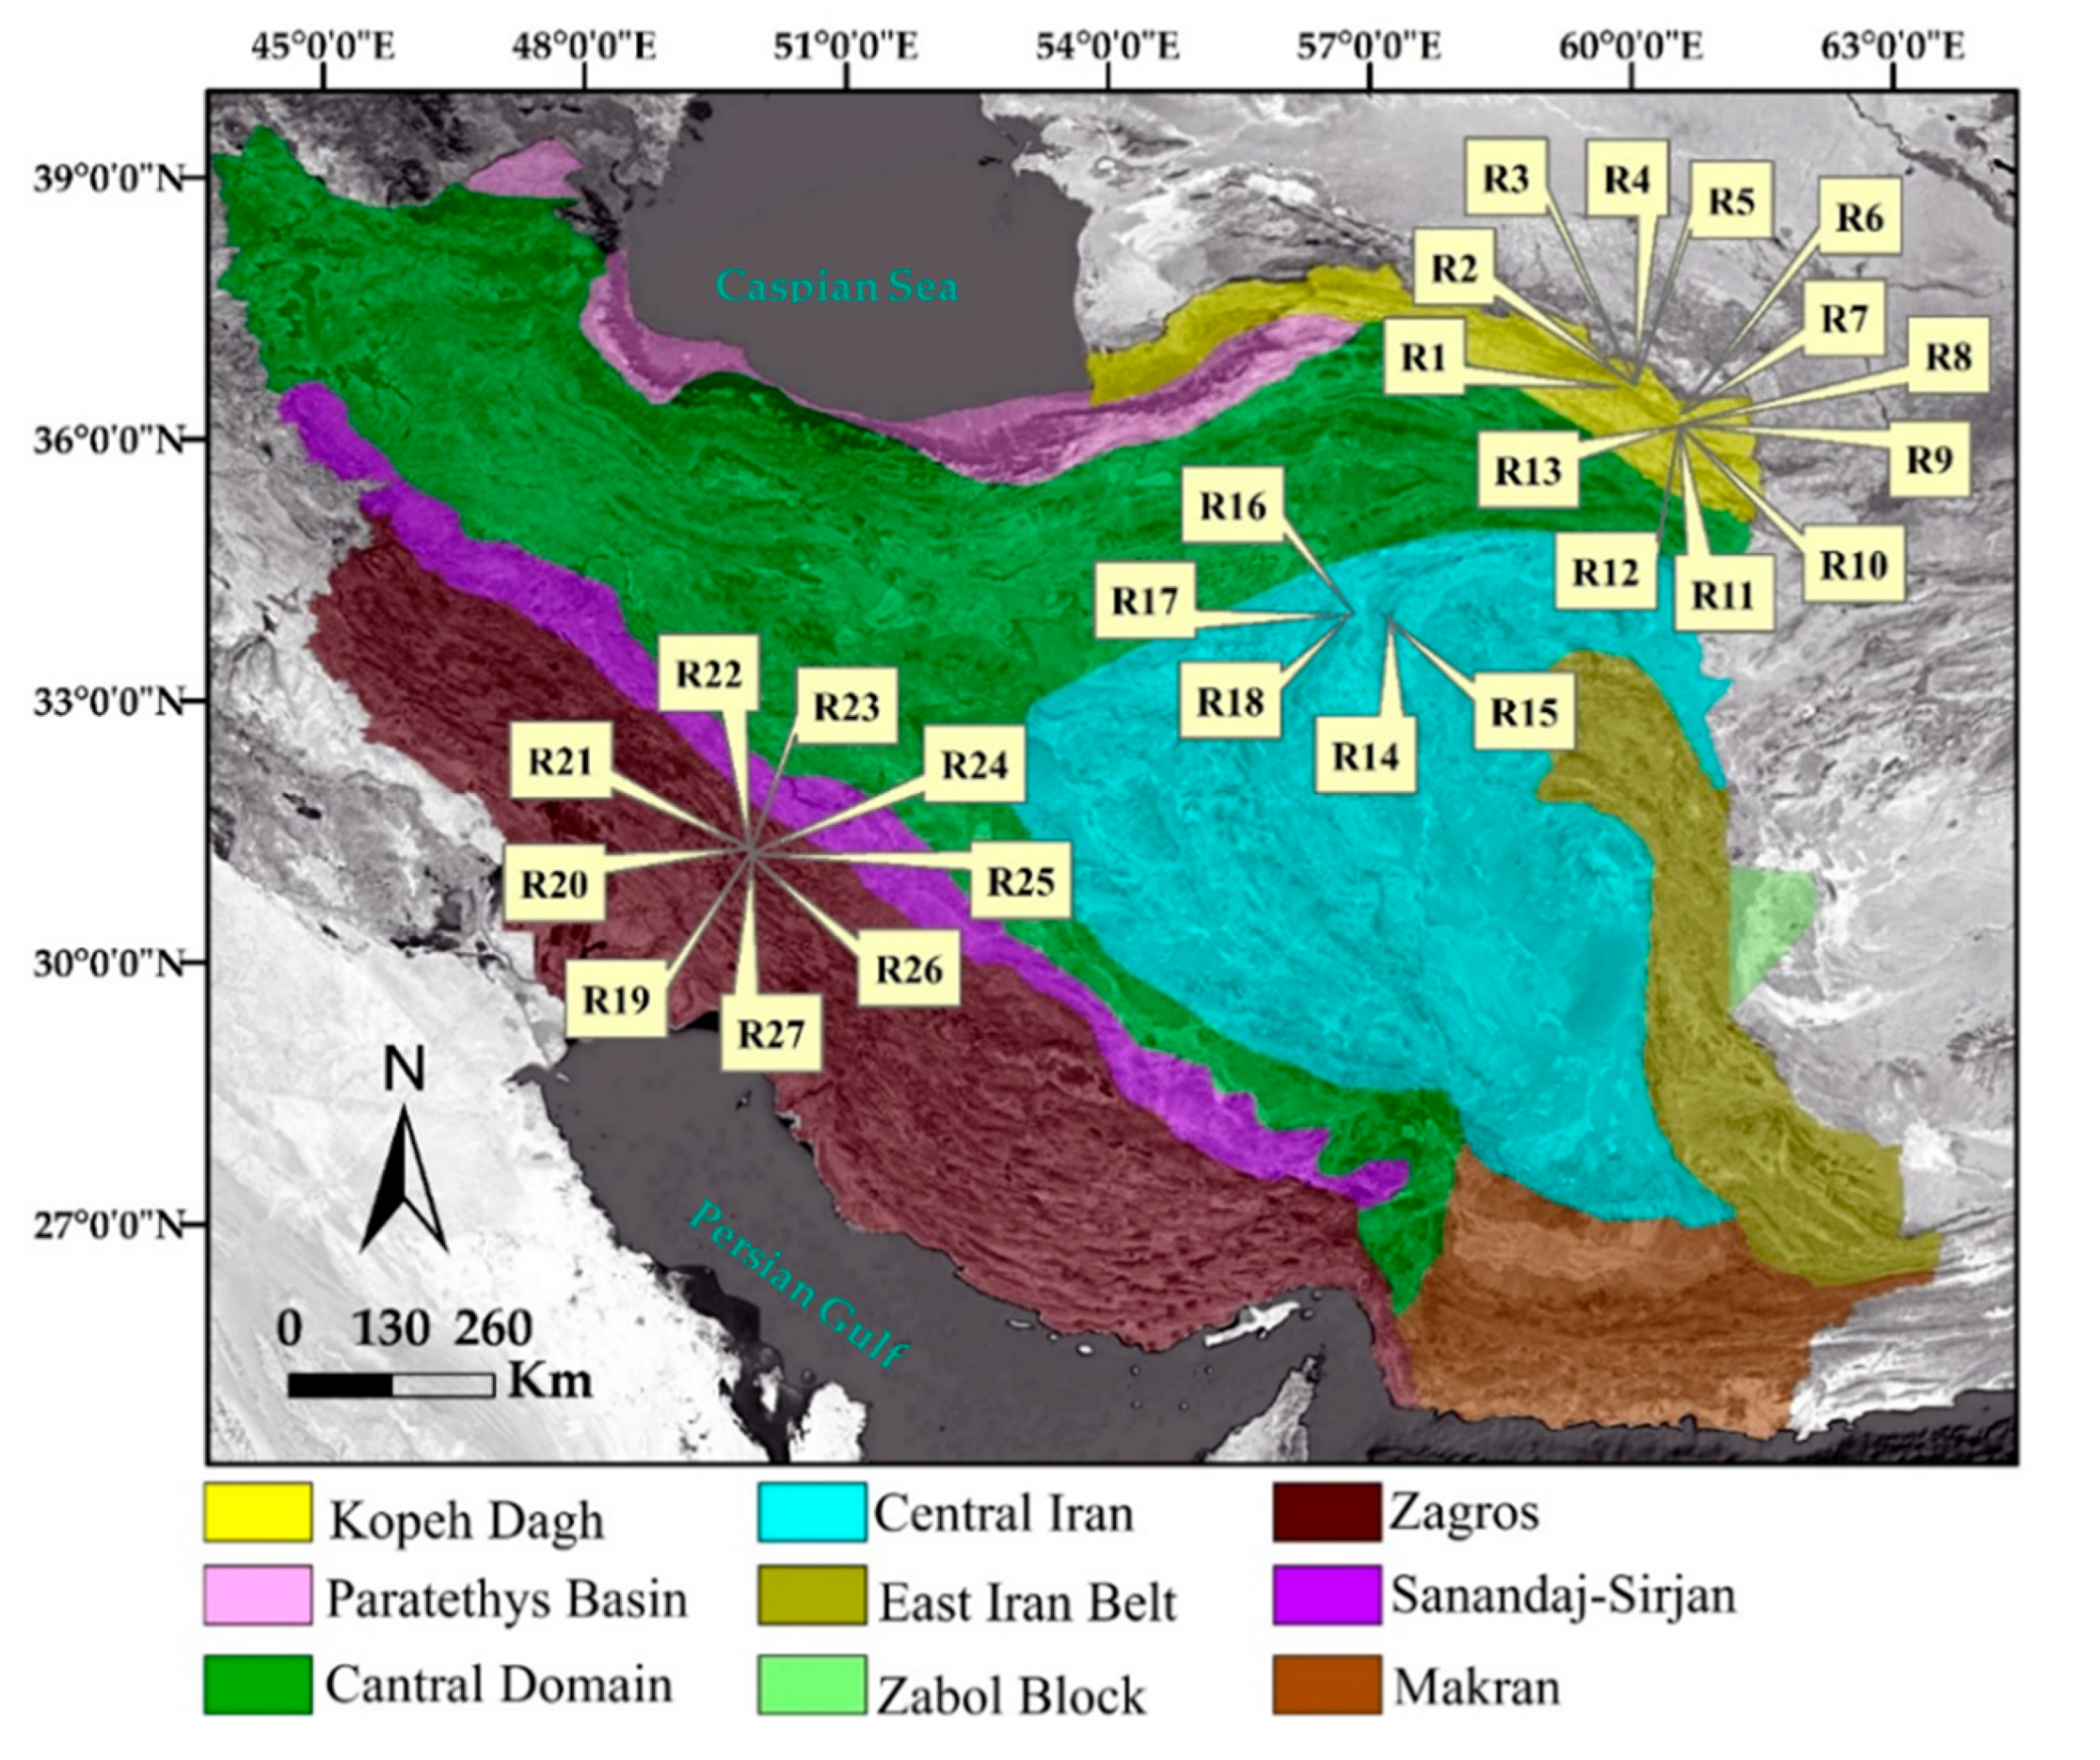
2.1. Materials
2.2. Physicomechanical Tests
2.3. Mode I Fracture Toughness Tests
3. Results and Discussion
3.1. Analyzing the Behavior of Samples under Dry and Saturated States
3.2. Normality Test of the Data
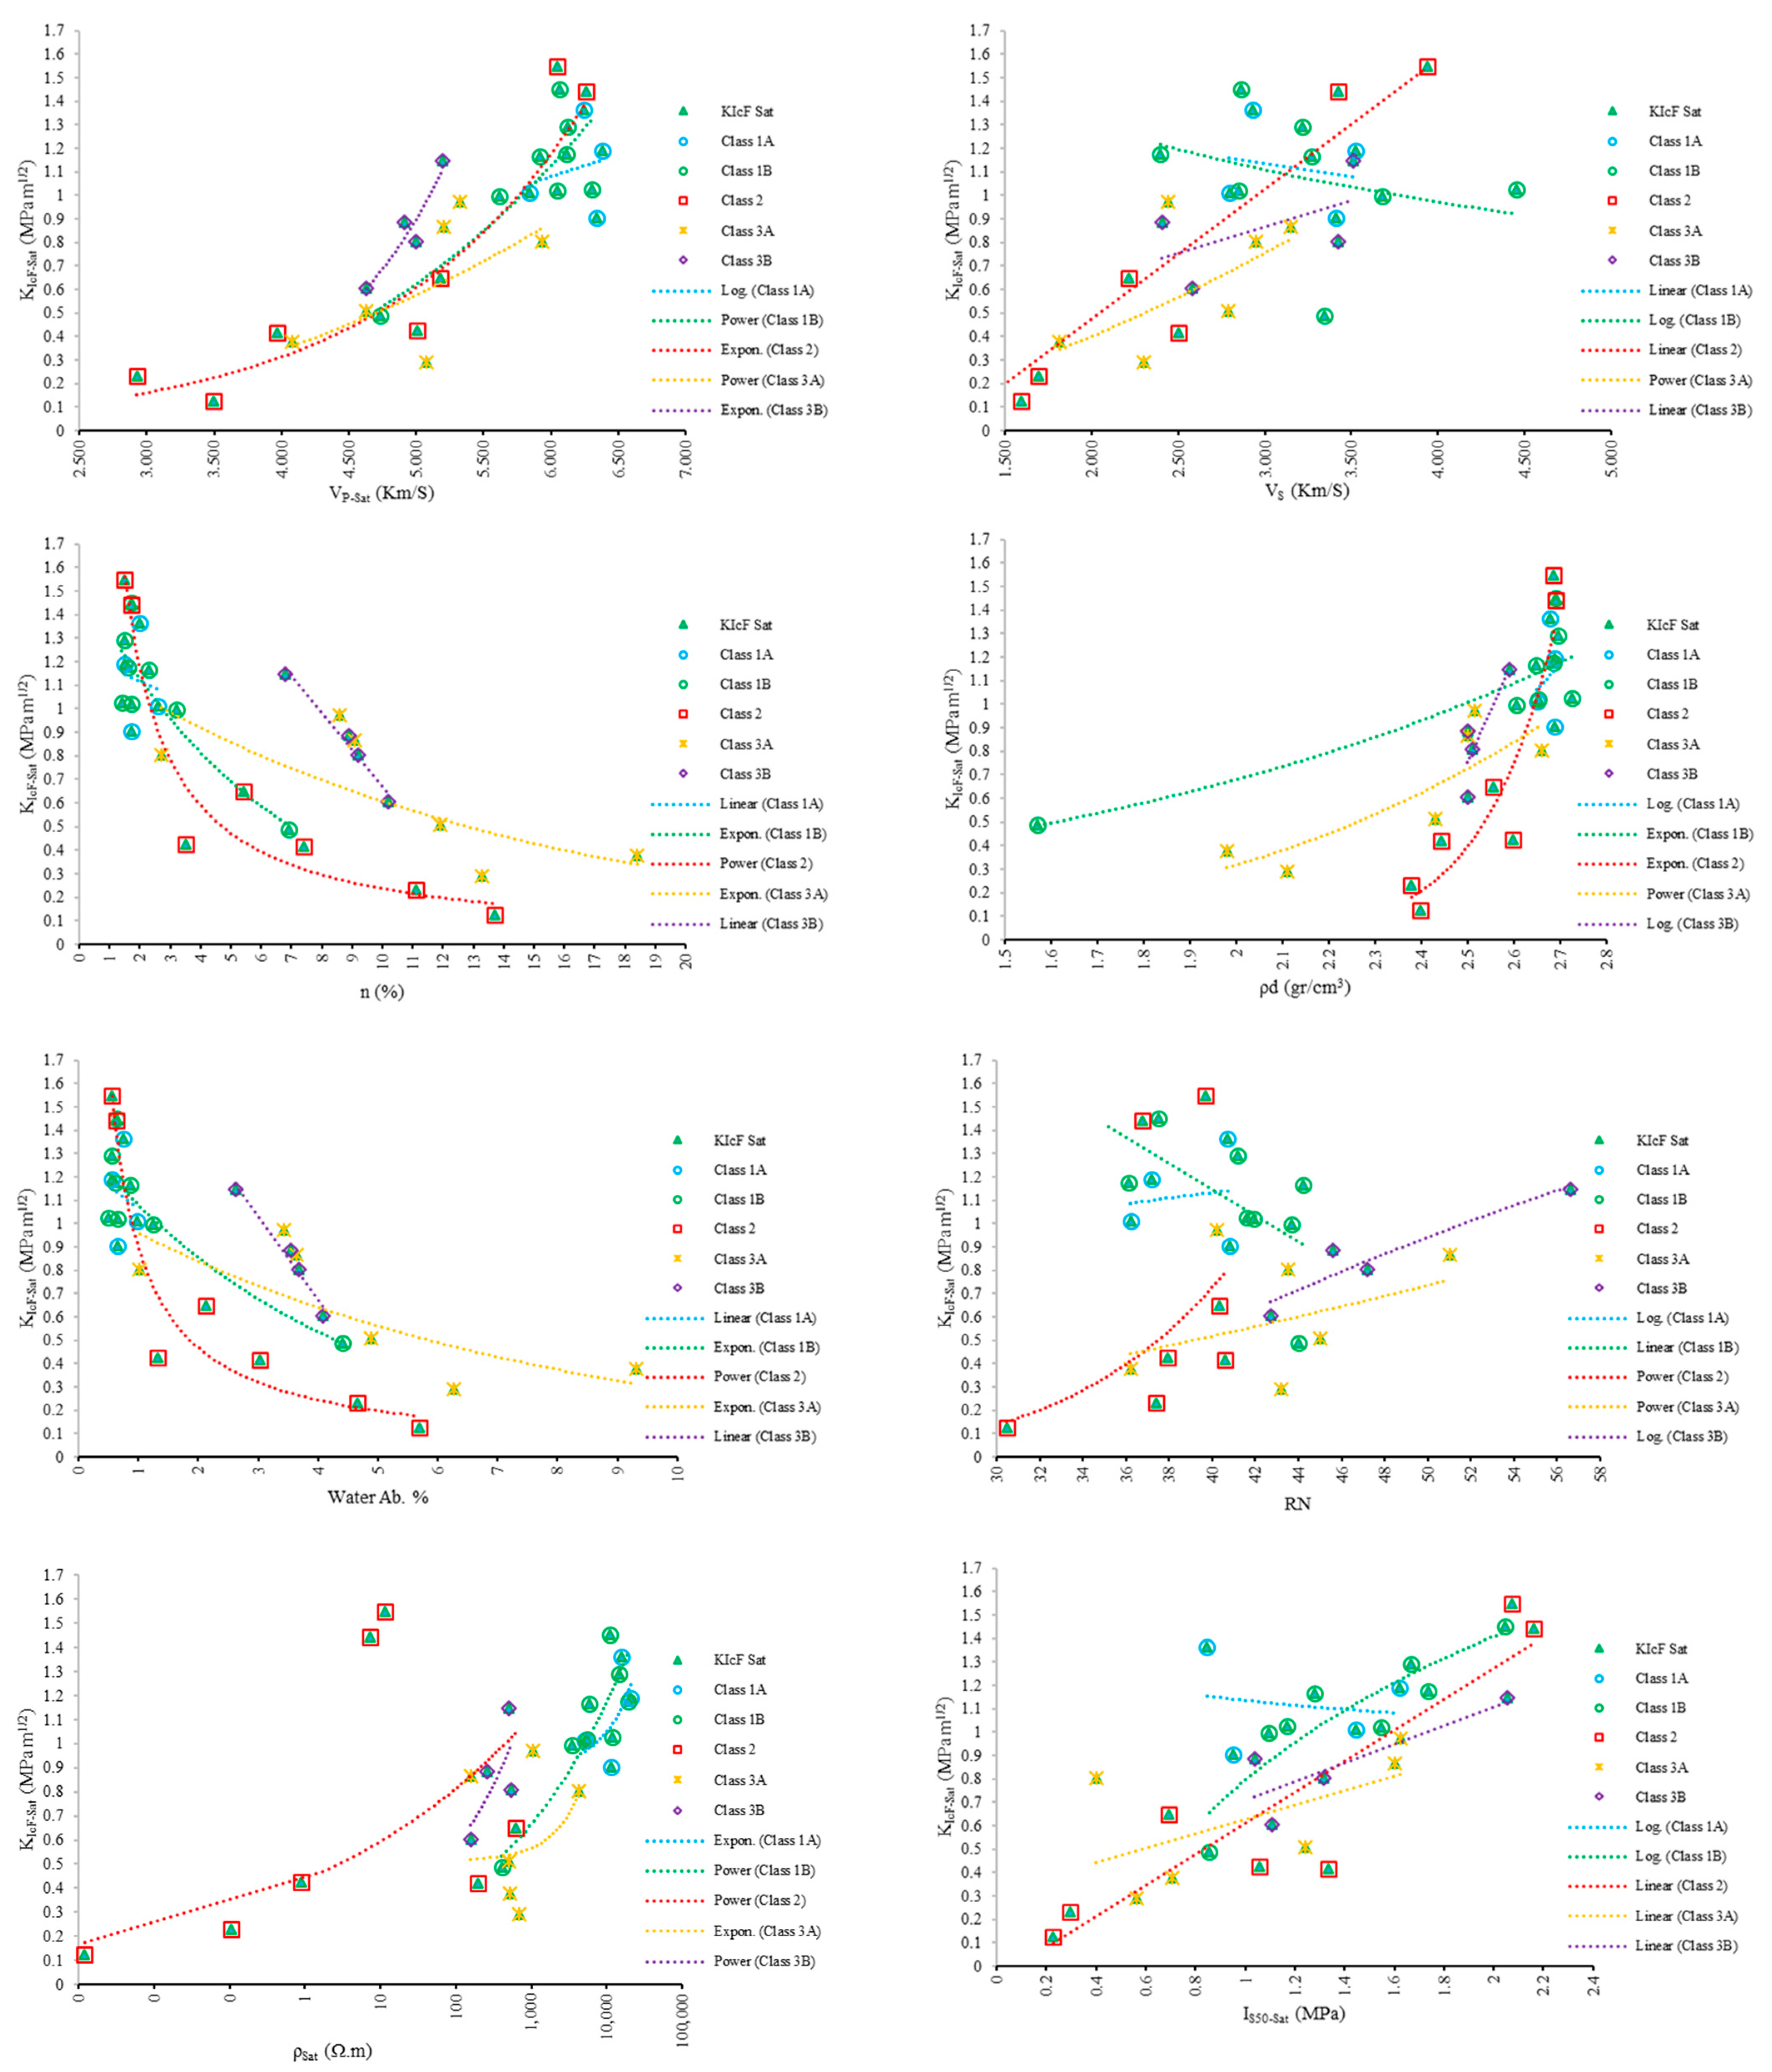
3.3. Simple Regression
3.4. Multiple Linear Regression
4. Conclusions
- The fracture toughness of the studied limestones decreased under a saturated state, except for the samples that were be categorized as wacketon, packstone, grainstone, and framestone, which indicates a complex behavior. In these limestone classes, porosity is the main factor affecting the ratio of dry to saturated fracture toughness. In the samples with a porosity of less than 2.5%, fracture toughness is higher under saturated condition, while in samples with a porosity more than 2.5%, fracture toughness is higher under dry condition.
- No meaningful relationship between clay content with the ratio of saturated to dry fracture toughness is found.
- The value of KIC calculated from the different methods proposed by Atkinson, Fowell, and Wang were similar and showed perfect correlations.
- KICsat and KICdry of the limestone could be predicted with a high accuracy from index tests if careful classification based on their petrography was utilized.
Author Contributions
Funding
Institutional Review Board Statement
Data Availability Statement
Conflicts of Interest
Nomenclature
| Half initial crack length | Normalized initial crack length | ||
| Half final crack length | Normalized final crack length | ||
| B | Specimen thickness | Normalized specimen thickness | |
| RS | Saw radius | Normalized saw diameter | |
| Half crack length | Normalized crack length | ||
| R | Specimen radius | D | Specimen diameter |
| PMax | Maximum load | NI | Auxiliary variable |
| Minimum normalized stress intensity factor | KIC | Mode I fracture toughness | |
| CCNBD | Cracked chevron notched Brazilian disc | L | Specimen length |
| ISRM | International Society for Rock Mechanics | ρSat | Electrical resistivity |
| A | Cross section area | n | Porosity |
| ρ | Dry density | VP | P-Wave velocity |
| W.A. | Water Absorption | VS | S-Wave velocity |
| VP-Dry | P-Wave velocity under dry state | RN | Schmidt rebound number |
| VP-Sat | P-Wave velocity under saturated state | R2 | Correlation coefficient |
| XRD | X-ray diffraction | VIF | Variance inflation factor |
| EDS | Energy dispersive spectroscopy | ||
| RMSE | Root mean square error | ||
| R2 Adjust | Adjusted correlation coefficient | ||
| p-Value | Probability value | ||
| IS50-Dry | Point load strength index under a dry state | ||
| IS50-Sat | Point load strength index under a saturated state | ||
| KICF-Dry | Mode I fracture toughness calculated using the Fowell method under a dry state | ||
| KICF-Sat | Mode I fracture toughness calculated using the Fowell method under a saturated state | ||
| KICW-Dry | Mode I fracture toughness calculated using the Wang method under a dry state | ||
| KICW-Sat | Mode I fracture toughness calculated using the Wang method under a saturated state | ||
| KIC-Dry | Mode I fracture toughness calculated using the Atkinson method under a dry state | ||
| KIC-Sat | Mode I fracture toughness calculated using the Atkinson method under a saturated state | ||
References
- Anderson, T.L. Fracture Mechanics: Fundamentals and Applications, 3rd ed.; CRC press: Boca Raton, FL, USA, 2005. [Google Scholar]
- Çobanoğlu, İ.; Çelik, S.B. Estimation of uniaxial compressive strength from point load strength, Schmidt hardness and P-wave velocity. Bull. Eng. Geol. Environ. 2008, 67, 491–498. [Google Scholar] [CrossRef]
- Karakul, H. Investigation of saturation effect on the relationship between compressive strength and Schmidt hammer rebound. Bull. Eng. Geol. Environ. 2017, 76, 1143–1152. [Google Scholar] [CrossRef]
- Kılıç, A.; Teymen, A. Determination of mechanical properties of rocks using simple methods. Bull. Eng. Geol. Environ. 2008, 67, 237. [Google Scholar] [CrossRef]
- Mousavi, E.; Cheshomi, A.; Ashtari, M. Estimating elasticity modulus and uniaxial compressive strength of sandstone using indentation test. J. Pet. Sci. Eng. 2018, 169, 157–166. [Google Scholar] [CrossRef]
- Shalabi, F.I.; Cording, E.J.; Al-Hattamleh, O.H. Estimation of rock engineering properties using hardness tests. Eng. Geol. 2007, 90, 138–147. [Google Scholar] [CrossRef]
- Vasanelli, E.; Colangiuli, D.; Calia, A.; Sileo, M.; Aiello, M.A. Ultrasonic pulse velocity for the evaluation of physical and mechanical properties of a highly porous building limestone. Ultrasonics 2015, 60, 33–40. [Google Scholar] [CrossRef]
- Tang, S. The effects of water on the strength of black sandstone in a brittle regime. Eng. Geol. 2018, 239, 167–178. [Google Scholar] [CrossRef]
- Ng, I.-T.; Yuen, K.-V.; Lau, C.-H. Predictive model for uniaxial compressive strength for Grade III granitic rocks from Macao. Eng. Geol. 2015, 199, 28–37. [Google Scholar] [CrossRef]
- Yao, Q.; Chen, T.; Tang, C.; Sedighi, M.; Wang, S.; Huang, Q. Influence of moisture on crack propagation in coal and its failure modes. Eng. Geol. 2019, 258, 105156. [Google Scholar] [CrossRef]
- Aligholi, S.; Lashkaripour, G.R.; Ghafoori, M. Estimating engineering properties of igneous rocks using semi-automatic petrographic analysis. Bull. Eng. Geol. Environ. 2019, 78, 2299–2314. [Google Scholar] [CrossRef]
- Jamei, M.; Mohammed, A.S.; Ahmadianfar, I.; Sabri, M.M.S.; Karbasi, M.; Hasanipanah, M. Predicting Rock Brittleness Using a Robust Evolutionary Programming Paradigm and Regression-Based Feature Selection Model. Appl. Sci. 2022, 12, 7101. [Google Scholar] [CrossRef]
- Huang, J.; Zhou, M.; Yuan, H.; Sabri, M.M.S.; Li, X. Prediction of the Compressive Strength for Cement-Based Materials with Metakaolin Based on the Hybrid Machine Learning Method. Materials 2022, 15, 3500. [Google Scholar] [CrossRef]
- Aligholi, S.; Lashkaripour, G.R.; Ghafoori, M.; Azali, S.T. Evaluating the Relationships Between NTNU/SINTEF Drillability Indices with Index Properties and Petrographic Data of Hard Igneous Rocks. Rock Mech. Rock Eng. 2017, 50, 2929–2953. [Google Scholar] [CrossRef]
- Hua, W.; Dong, S.; Fan, Y.; Pan, X.; Wang, Q. Investigation on the correlation of mode II fracture toughness of sandstone with tensile strength. Eng. Fract. Mech. 2017, 184, 249–258. [Google Scholar] [CrossRef]
- Bao, H.; Wu, F.; Niu, J. Effects of test procedures and lithology on estimating the mode I fracture toughness of rocks using empirical relations: Einfluss der Prüfverfahren und der Lithologie auf die Bestimmung der Mode I-Bruchzähigkeit von Steinen mittels empirischer Beziehungen. Mater. Und Werkst. 2018, 49, 951–962. [Google Scholar] [CrossRef]
- Zhou, Z.; Cai, X.; Ma, D.; Cao, W.; Chen, L.; Zhou, J. Effects of water content on fracture and mechanical behavior of sandstone with a low clay mineral content. Eng. Fract. Mech. 2018, 193, 47–65. [Google Scholar] [CrossRef]
- Wang, J.-J.; Zhu, J.-G.; Chiu, C.; Zhang, H. Experimental study on fracture toughness and tensile strength of a clay. Eng. Geol. 2007, 94, 65–75. [Google Scholar] [CrossRef]
- Aligholi, S.; Ponson, L.; Torabi, A.R.; Zhang, Q.B. A new methodology inspired from the Theory of Critical Distances for determination of inherent tensile strength and fracture toughness of rock materials. Int. J. Rock Mech. Min. Sci. 2022, 152, 105073. [Google Scholar] [CrossRef]
- Jia, B.; Xian, C.-G. Permeability measurement of the fracture-matrix system with 3D embedded discrete fracture model. Pet. Sci. 2022. [Google Scholar] [CrossRef]
- Akram, M.; Farooq, S.; Naeem, M.; Ghazi, S. Prediction of mechanical behaviour from mineralogical composition of Sakesar limestone, Central Salt Range, Pakistan. Bull. Eng. Geol. Environ. 2017, 76, 601–615. [Google Scholar] [CrossRef]
- Aligholi, S.; Lashkaripour, G.R.; Ghafoori, M. Strength/brittleness classification of igneous intact rocks based on basic physical and dynamic properties. Rock Mech. Rock Eng. 2017, 50, 45–65. [Google Scholar] [CrossRef]
- Roy, D.G.; Singh, T.; Kodikara, J.; Das, R. Effect of water saturation on the fracture and mechanical properties of sedimentary rocks. Rock Mech. Rock Eng. 2017, 50, 2585–2600. [Google Scholar]
- Ajalloeian, R.; Mansouri, H.; Baradaran, E. Some carbonate rock texture effects on mechanical behavior, based on Koohrang tunnel data, Iran. Bull. Eng. Geol. Environ. 2017, 76, 295–307. [Google Scholar] [CrossRef]
- Zhixi, C.; Mian, C.; Yan, J.; Rongzun, H. Determination of rock fracture toughness and its relationship with acoustic velocity. Int. J. Rock Mech. Min. Sci. 1997, 34, 49.e1–49.e11. [Google Scholar] [CrossRef]
- Saeidi, O.; Torabi, S.R.; Ataei, M.; Hoseinie, S. Prediction of rock fracture toughness modes I and II utilising brittleness indexes. Int. J. Min. Mineral. Eng. 2012, 4, 163–173. [Google Scholar] [CrossRef]
- Chang, S.-H.; Lee, C.-I.; Jeon, S. Measurement of rock fracture toughness under modes I and II and mixed-mode conditions by using disc-type specimens. Eng. Geol. 2002, 66, 79–97. [Google Scholar] [CrossRef]
- Brown, G.; Reddish, D. Experimental relations between rock fracture toughness and density. Int. J. Rock Mech. Min. Sci. 1997, 34, 153–155. [Google Scholar] [CrossRef]
- Roy, D.G.; Singh, T.; Kodikara, J.; Talukdar, M. Correlating the mechanical and physical properties with Mode-I fracture toughness of rocks. Rock Mech. Rock Eng. 2017, 50, 1941–1946. [Google Scholar]
- Gunsallus, K.t.; Kulhawy, F. A comparative evaluation of rock strength measures. Int. J. Rock Mech. Min. Sci. Geomech. Abstr. 1984, 21, 233–248. [Google Scholar] [CrossRef]
- Dunham, R.J. Classification of carbonate rocks according to depositional textures. AAPG Bull. 1962, 308, 108–121. [Google Scholar]
- Embry, A.F.; Klovan, J.E. A late Devonian reef tract on northeastern Banks Island, N. W.T. Bull. Can. Pet. Geol. 1971, 19, 730–781. [Google Scholar]
- Aghanabati, A. Geology of Iran; Geological Survey of Iran: Tehran, Iran, 2004. [Google Scholar]
- ISRM. Rock Characterization, Testing and Monitoring; Pergamon press: Oxford, UK, 1981. [Google Scholar]
- ISRM. The Complete ISRM Suggested Methods for Rock Characterization, Testing and Monitoring: 1974–2006. Suggested Methods Prepared by the Commission on Testing Methods; Ulusay, R., Hudson, J.A., Eds.; International Soc. for Rock Mechanics, Commission on Testing Methods: Ankara, Turkey, 2007. [Google Scholar]
- ISRM. Suggested method for determining point load strength. Int. J. Rock Mech. Min. Sci. Geomech. Abstr. 1985, 35, 51–60. [Google Scholar]
- Chong, K.; Kuruppu, M. New specimen for fracture toughness determination for rock and other materials. Int. J. Fract. 1984, 26, R59–R62. [Google Scholar] [CrossRef]
- Guo, H.; Aziz, N.; Schmidt, L. Rock fracture-toughness determination by the Brazilian test. Eng. Geol. 1993, 33, 177–188. [Google Scholar] [CrossRef]
- Sheity, D.K.; Rosenfield, A.R.; Duckworth, W.H. Fracture toughness of ceramics measured by a chevron-notch diametral-compression test. J. Am. Ceram. Soc. 1985, 68, C-325–C-327. [Google Scholar] [CrossRef]
- Szendi-Horvath, G. Fracture toughness determination of brittle materials using small to extremely small specimens. Eng. Fract. Mech. 1980, 13, 955–961. [Google Scholar] [CrossRef]
- Wang, Q.-Z.; Xing, L. Determination of fracture toughness KIC by using the flattened Brazilian disk specimen for rocks. Eng. Fract. Mech. 1999, 64, 193–201. [Google Scholar] [CrossRef]
- Awaji, H.; Sato, S. Combined mode fracture toughness measurement by the disk test. J. Eng. Mater. Technol. 1978, 100, 175–182. [Google Scholar] [CrossRef]
- Kuruppu, M.D.; Obara, Y.; Ayatollahi, M.R.; Chong, K.P.; Funatsu, T. ISRM-Suggested Method for Determining the Mode I Static Fracture Toughness Using Semi-Circular Bend Specimen. Rock Mech. Rock Eng. 2014, 47, 267–274. [Google Scholar] [CrossRef]
- Atkinson, C.; Smelser, R.; Sanchez, J. Combined mode fracture via the cracked Brazilian disk test. Int. J. Fract. 1982, 18, 279–291. [Google Scholar] [CrossRef]
- Fowell, R.; Hudson, J.; Xu, C.; Zhao, X. Suggested method for determining mode I fracture toughness using cracked chevron notched Brazilian disc (CCNBD) specimens. Int. J. Rock Mech. Min. Sci. Geomech. Abstr. 1995, 32, 322A. [Google Scholar] [CrossRef]
- Wang, Q.; Fan, H.; Gou, X.; Zhang, S. Recalibration and clarification of the formula applied to the ISRM-suggested CCNBD specimens for testing rock fracture toughness. Rock Mech. Rock Eng. 2013, 46, 303–313. [Google Scholar] [CrossRef]
- Amrollahi, H.; Baghbanan, A.; Hashemolhosseini, H. Measuring fracture toughness of crystalline marbles under modes I and II and mixed mode I–II loading conditions using CCNBD and HCCD specimens. Int. J. Rock Mech. Min. Sci. 2011, 48, 1123–1134. [Google Scholar] [CrossRef]


| Empirical Relation | Rock Type | R2 (%) | Units | Reference |
|---|---|---|---|---|
| KIC = 0.00035 VP − 0.18 | Granite and marble | 64 | KIC (MPa m1/2), VP (m/s) | [27] |
| KIC = 0.00071 VS − 0.29 | Granite and marble | 44 | KIC (MPa m1/2), VS (m/s) | [27] |
| KIC = 2.45 ρ − 5.19 | Granite and marble | 26 | KIC (MPa m1/2), ρ (gr/cm3) | [27] |
| KIC = −0.5 n + 1.7 | Granite and marble | 36 | KIC (MPa m1/2), n (%) | [27] |
| KIC = 3.21 ρ − 6.95 | Different types | 91 | KIC (MPa m1/2), ρ (gr/cm3) | [28] |
| KIC = 0.45 VP − 0.58 | Sedimentary and igneous rocks | 55 | KIC (MPa m1/2), VP (Km/s) | [29] |
| KIC = 0.9 VS − 1.06 | Sedimentary and igneous rocks | 60 | KIC (MPa m1/2), VS (Km/s) | [29] |
| KIC = 0.0037 e0.0022 ρ | Sedimentary and igneous rocks | 54 | KIC (MPa m1/2), ρ (Kg/m3) | [29] |
| KIC = −0.8111 VP + 1.7901 | Sandstone | 79 | KIC (MPa m1/2), VP (m/s) | [23] |
| KIC = 0.000361 VP − 0.332 | Sandstone | 92 | KIC (MPa m1/2), VP (m/s) | [25] |
| KIC = 0.0006147 VS − 0.5517 | Sandstone | 90 | KIC (MPa m1/2), VS (m/s) | [25] |
| KIC = 0.000054074 VP + 0.3876 | Shale | 56 | KIC (MPa m1/2), VP (m/s) | [25] |
| KIC = 0.0001021 VS + 0.349 | Shale | 64 | KIC (MPa m1/2), VS (m/s) | [25] |
| KIC = 0.0995 IS50 + 1.11 | Sedimentary rock | 45 | KIC (MPa m1/2), IS50 (MPa) | [30] |
| Zone | Formation | Specimen No. | Age | Rock Type |
|---|---|---|---|---|
| Koppeh Dagh | Chehel Kaman | R9 | Paleocene | Sandy Limestone |
| Pesteligh | R2 | Paleocene | Sandy Limestone | |
| R10 | Sandy Limestone | |||
| Kalat | R11 | Maastrichtian | Sandy Limestone | |
| Neyzar | R1 | Maastrichtian | Sandy Limestone | |
| Aitamir | R12 | Upper Aptian–Middle Cenomanian | Rudstone | |
| Sarcheshmeh | R13 | Upper Barremian–Middle Aptian | Grainstone | |
| Tirgan | R6 | Barremian–Aptian | Grainstone | |
| R5 | Mudstone | |||
| R4 | Packstone | |||
| R3 | Grainstone | |||
| R14 | Grainstone | |||
| R15 | Packstone | |||
| Shurijeh | R7 | Upper Jurassic–Lower Cretaceous | Sandy Limestone | |
| R8 | Sandy Limestone | |||
| Mozduran | R17 | Upper Jurassic | Dolomitic limestone | |
| R16 | Dolostone | |||
| Central Iran | Qaleh Dokhtar | R18 | Callovian–Kimmeridgian | Wackestone |
| Esfandiar | R19 | Tithonian | Floatstone | |
| Jamal | R20 | Early Gzhelian–Asselian | Wackestone | |
| R21 | Framestone | |||
| Zagros | Asmari | R30 | Oligo–Myocene | Dolomitic limestone |
| R29 | Dolomitic limestone | |||
| R28 | Dolo Mudstone | |||
| R27 | Dolo Mudstone | |||
| R26 | Dolo Mudstone | |||
| R25 | Dolo Mudstone | |||
| R24 | Dolo Mudstone | |||
| R23 | Packstone | |||
| R25 | Dolomitic limestone |
| Sample Name | VS (Km/s) | VP-Dry (Km/s) | VP-Sat (Km/s) | n (%) | ρSat (Ω.m) | ρd (gr/cm3) | Water Ab. % | RN | IS50-Dry (MPa) | IS50-Sat (MPa) | KICF-Dry (MPa m1/2) | KICF-Sat (MPa m1/2) | KICW-Dry (MPa m1/2) | KICW-Sat (MPa m1/2) | KIC-Dry (MPa m1/2) | KIC-Sat (MPa m1/2) |
|---|---|---|---|---|---|---|---|---|---|---|---|---|---|---|---|---|
| R1 | 1.392 | 4.704 | 5.007 | 3.5 | 0.881 | 2.597 | 1.33 | 38 | 1.58 | 1.056 | 1.089 | 0.428 | 1.223 | 0.476 | 1.249 | 0.489 |
| R2 | 1.59 | 2.477 | 3.499 | 13.7 | 0.001 | 2.398 | 5.7 | 30 | 0.645 | 0.226 | 0.394 | 0.126 | 0.436 | 0.141 | 0.45 | 0.144 |
| R3 | 2.865 | 6.008 | 6.067 | 1.7 | 11,085.196 | 2.691 | 0.64 | 38 | 1.817 | 2.045 | 1.357 | 1.453 | 1.523 | 1.632 | 1.532 | 1.643 |
| R4 | 3.219 | 6.404 | 6.124 | 1.5 | 14,465.061 | 2.696 | 0.56 | 41 | 1.704 | 1.667 | 1.239 | 1.293 | 1.361 | 1.46 | 1.367 | 1.469 |
| R5 | 3.413 | 6.235 | 6.342 | 1.7 | 11,434.227 | 2.687 | 0.65 | 41 | 0.888 | 0.953 | 1.072 | 0.906 | 1.197 | 1.007 | 1.205 | 1.012 |
| R6 | 2.395 | 6.319 | 6.114 | 1.6 | 19,190.949 | 2.685 | 0.61 | 36 | 1.698 | 1.735 | 1.149 | 1.176 | 1.279 | 1.304 | 1.287 | 1.312 |
| R7 | 3.941 | 6.048 | 6.048 | 1.5 | 11.503 | 2.686 | 0.56 | 40 | 2.145 | 2.075 | 1.549 | 1.547 | 1.727 | 1.727 | 1.773 | 1.772 |
| R8 | 3.424 | 6.057 | 6.261 | 1.7 | 7.363 | 2.69 | 0.64 | 37 | 2.578 | 2.163 | 1.655 | 1.443 | 1.831 | 1.59 | 1.891 | 1.647 |
| R9 | 2.212 | 4.704 | 5.184 | 5.4 | 623.915 | 2.556 | 2.13 | 40 | 1.573 | 0.693 | 1.011 | 0.649 | 1.12 | 0.728 | 1.126 | 0.733 |
| R10 | 1.692 | 2.718 | 2.925 | 11.1 | 0.104 | 2.378 | 4.66 | 37 | 0.48 | 0.293 | 0.31 | 0.231 | 0.347 | 0.254 | 0.355 | 0.263 |
| R11 | 2.501 | 3.764 | 3.965 | 7.4 | 193.511 | 2.444 | 3.03 | 41 | 2 | 1.333 | 1.26 | 0.419 | 1.381 | 0.459 | 1.386 | 0.46 |
| R12 | 3.842 | 5.139 | 5.714 | 3.1 | 3878.783 | 2.635 | 1.17 | 35 | 1.68 | 1.653 | 1.241 | _ | 1.364 | _ | 1.369 | _ |
| R13 | 3.676 | 5.324 | 5.615 | 3.2 | 3435.236 | 2.606 | 1.24 | 44 | 1.547 | 1.093 | 1.017 | 0.996 | 1.133 | 1.097 | 1.14 | 1.102 |
| R14 | 2.851 | 6 | 6.044 | 1.7 | 5409.651 | 2.653 | 0.65 | 42 | 1.28 | 1.547 | 1.011 | 1.02 | 1.12 | 1.11 | 1.126 | 1.157 |
| R15 | 3.269 | 6.109 | 5.92 | 2.3 | 5800.758 | 2.649 | 0.86 | 44 | 1.28 | 1.28 | 0.866 | 1.166 | 0.948 | 1.286 | 0.951 | 1.293 |
| R16 | 2.438 | 4.87 | 5.323 | 8.6 | 1066.068 | 2.516 | 3.42 | 40 | 2.08 | 1.627 | 1.099 | 0.971 | 1.217 | 1.074 | 1.224 | 1.079 |
| R17 | 2.951 | 6 | 5.938 | 2.7 | 4319.988 | 2.661 | 1.02 | 44 | 0.667 | 0.4 | 0.832 | 0.803 | 0.913 | 0.91 | 0.916 | 0.916 |
| R18 | 2.793 | 5.782 | 5.844 | 2.6 | 5162.635 | 2.65 | 0.98 | 36 | 1.756 | 1.447 | 1.111 | 1.012 | 1.243 | 1.129 | 1.25 | 1.136 |
| R19 | 4.451 | 6.544 | 6.301 | 1.4 | 11,958.108 | 2.726 | 0.5 | 42 | 1.392 | 1.17 | 1.11 | 1.028 | 1.227 | 1.137 | 1.233 | 1.144 |
| R20 | 3.527 | 6.277 | 6.385 | 1.5 | 20,879.598 | 2.687 | 0.55 | 37 | 1.488 | 1.622 | 1.061 | 1.193 | 1.187 | 1.327 | 1.195 | 1.335 |
| R21 | 2.928 | 5.798 | 6.249 | 2 | 15,471.565 | 2.679 | 0.74 | 41 | 1.531 | 0.845 | 1.074 | 1.363 | 1.194 | 1.509 | 1.201 | 1.517 |
| R22 | 1.815 | 3.984 | 4.081 | 18.4 | 531.007 | 1.98 | 9.31 | 36 | 0.609 | 0.707 | 0.589 | 0.377 | 0.65 | 0.413 | 0.653 | 0.414 |
| R23 | 3.346 | 4.762 | 4.734 | 6.9 | 407.021 | 1.57 | 4.41 | 44 | 0.956 | 0.854 | 0.726 | 0.487 | 0.791 | 0.53 | 0.793 | 0.531 |
| R24 | 3.151 | 5.582 | 5.202 | 9.1 | 158.746 | 2.5 | 3.64 | 51 | 2.218 | 1.602 | 0.963 | 0.867 | 1.05 | 0.945 | 1.052 | 0.947 |
| R25 | 2.584 | 4.922 | 4.63 | 10.2 | 157.699 | 2.5 | 4.09 | 43 | 2.03 | 1.108 | 0.836 | 0.604 | 0.917 | 0.654 | 0.92 | 0.654 |
| R26 | 3.425 | 5.167 | 5.003 | 9.2 | 540.381 | 2.51 | 3.67 | 47 | 2.086 | 1.315 | 1.144 | 0.806 | 1.249 | 0.881 | 1.252 | 0.883 |
| R27 | 3.51 | 5.424 | 5.2 | 6.8 | 501.929 | 2.59 | 2.62 | 57 | 2.806 | 2.056 | 1.241 | 1.149 | 1.364 | 1.266 | 1.369 | 1.271 |
| R28 | 2.405 | 5.04 | 4.915 | 8.9 | 257.932 | 2.5 | 3.54 | 46 | 0.353 | 1.037 | 1.124 | 0.887 | 1.224 | 0.972 | 1.227 | 0.975 |
| R29 | 2.303 | 4.196 | 5.074 | 13.3 | 684.546 | 2.11 | 6.27 | 43 | 0.627 | 0.561 | 0.334 | 0.292 | 0.364 | 0.318 | 0.365 | 0.318 |
| R30 | 2.787 | 4.591 | 4.631 | 11.9 | 502.143 | 2.43 | 4.89 | 45 | 1.266 | 1.24 | 0.765 | 0.511 | 0.844 | 0.56 | 0.849 | 0.562 |
| KICW-Dry (MPa m1/2) | KIC-Dry (MPa m1/2) | ||
|---|---|---|---|
| KICF-Dry (MPa m1/2) | RMSE | 0.0108 | 0.0181 |
| R2 (%) | 99.91 | 99.75 | |
| Adj. R2 (%) | 99.91 | 99.74 | |
| p-Value | 0.000 | 0.000 | |
| Equation | KICW-Dry = 1.11203 KICF-Dry − 0.00633 | KIC-Dry = 1.1329 KICF-Dry − 0.018 | |
| KICW-Sat (MPa m1/2) | KIC-Sat (MPa m1/2) | ||
|---|---|---|---|
| KICF-Sat (MPa m1/2) | RMSE | 0.0109 | 0.01492 |
| R2 (%) | 99.94 | 99.89 | |
| Adj. R2 (%) | 99.94 | 99.89 | |
| p-Value | 0.000 | 0.000 | |
| Equation | KICW-Sat = 1.11653 KICF-Sat − 0.00839 | KIC-Sat = 1.13465 KICF-Sat − 0.01444 | |
| Rock Code | Class | Petrography | Rock Code | Class | Petrography |
|---|---|---|---|---|---|
| R5 | 1A | Mudstone | R10 | 2 | Sandy limestone |
| R18 | 1A | Wackestone | R8 | 2 | Sandy limestone |
| R20 | 1A | Wackestone | R7 | 2 | Sandy limestone |
| R21 | 1A | Framestone | R2 | 2 | Sandy limestone |
| R19 | 1B | Floatstone | R1 | 2 | Sandy limestone |
| R4 | 1B | Packstone | R22 | 3A | Dolomitic limestone |
| R23 | 1B | Packstone | R16 | 3A | Dolostone |
| R15 | 1B | Packstone | R29 | 3A | Dolomitic limestone |
| R6 | 1B | Grainstone | R17 | 3A | Dolomitic limestone |
| R3 | 1B | Grainstone | R30 | 3A | Dolomitic limestone |
| R13 | 1B | Grainstone | R24 | 3A | Dolostone |
| R14 | 1B | Grainstone | R25 | 3B | Dolo mudstone |
| R12 | 1B | Rudstone | R28 | 3B | Dolo mudstone |
| R9 | 2 | Sandy Limestone | R26 | 3B | Dolo mudstone |
| R11 | 2 | Sandy Limestone | R27 | 3B | Dolo mudstone |
| n | VS | VPDry | VPSat | ρSat | ρd | WA | RN | IS50Dry | IS50Sat | ||
|---|---|---|---|---|---|---|---|---|---|---|---|
| All Data | KICFDry | 46.92 | 29.27 | 44.22 | 41.34 | 5.40 | 35.16 | 48.86 | 0.96 | 52.27 | 68.56 |
| KICFSat | 58.68 | 44.09 | 73.27 | 71.23 | 28.30 | 41.22 | 57.91 | 1.82 | 29.48 | 58.98 | |
| Class 1A | KICFDry | 94.28 | 65.43 | 51.56 | 97.81 | 83.07 | 95.45 | 95.84 | 23.65 | 27.52 | 2.36 |
| KICFSat | 1.66 | 4.12 | 11.58 | 5.02 | 34.64 | 3.49 | 3.43 | 2.18 | 23.83 | 1.64 | |
| Class 1B | KICFDry | 46.24 | 0.62 | 18.49 | 44.49 | 35.26 | 48.58 | 47.47 | 54.02 | 87.42 | 72.93 |
| KICFSat | 73.79 | 8.65 | 55.35 | 67.90 | 43.97 | 73.10 | 73.96 | 34.50 | 76.39 | 74.30 | |
| Class 2 | KICFDry | 83.36 | 64.00 | 85.38 | 79.39 | 0.25 | 75.86 | 83.17 | 35.52 | 98.41 | 91.78 |
| KICFSat | 69.89 | 87.24 | 85.19 | 80.28 | 0.64 | 80.10 | 68.56 | 15.76 | 65.77 | 82.81 | |
| Class 3A | KICFDry | 30.41 | 16.66 | 30.05 | 14.33 | 8.70 | 55.93 | 35.42 | 0.00 | 63.35 | 45.03 |
| KICFSat | 56.08 | 24.81 | 51.65 | 42.39 | 26.22 | 69.65 | 58.76 | 0.95 | 49.00 | 23.58 | |
| Class 3B | KICFDry | 68.80 | 27.68 | 9.00 | 38.35 | 69.34 | 44.88 | 68.53 | 41.50 | 0.12 | 25.05 |
| KICFSat | 95.84 | 30.80 | 40.67 | 67.06 | 29.94 | 67.12 | 95.06 | 84.82 | 6.23 | 64.02 |
| Dependent Variable | Independent Variables | Predictive Model | R2 (%) | p-Value | |
|---|---|---|---|---|---|
| All Data | KICF-Dry | IS50-Sat | y = 0.891 × e0.596 | 69.5 | 0.000 |
| KICF-Sat | VP-Sat | y = 0.008 × e2.758 | 75.2 | 0.000 | |
| Class 1A | KICF-Dry | VP-Sat | y = −0.087x + 1.62 | 97.9 | 0.011 |
| n | y = 0.044x + 0.994 | 94.3 | 0.029 | ||
| ρSat | y = 1.4586 × e−0.032 | 93.1 | 0.035 | ||
| ρd | y = −3.229ln(x) + 4.257 | 95.5 | 0.023 | ||
| W.A. | y = 0.999 × e0.107x | 96.0 | 0.020 | ||
| Class 1B | KICF-Dry | IS50-Sat | y = 0.616 ln(x) + 0.871 | 73.1 | 0.003 |
| IS50-Dry | y = 0.756 × e0.902 | 88.4 | 0.000 | ||
| KICF-Sat | VP-Sat | y = 0.003 × e3.24 | 80.3 | 0.003 | |
| n | y = 1.567 × e−0.164x | 84.6 | 0.001 | ||
| ρSat | y = 0.122 × 0.246 | 83.5 | 0.001 | ||
| ρd | y = 0.141 × e0.786x | 86.7 | 0.001 | ||
| W.A. | y = 1.362 × e−0.233x | 86.9 | 0.001 | ||
| IS50-Sat | y = 0.887ln(x) + 0.795 | 79.6 | 0.003 | ||
| Class 2 | KICF-Dry | VP-Dry | y = 1.359ln(x) − 0.889 | 86.8 | 0.002 |
| VP-Sat | y = 0.038 × 2.08 | 80.5 | 0.006 | ||
| n | y = −0.102x + 1.683 | 83.4 | 0.004 | ||
| ρd | y = 8.823ln(x) − 7.161 | 76.1 | 0.010 | ||
| W.A. | y = −0.239x + 1.654 | 83.2 | 0.004 | ||
| IS50-Sat | y = 0.573ln(x) + 1.14 | 97.1 | 0.000 | ||
| IS50-Dry | y = 0.647 × e1.036 | 99.4 | 0.000 | ||
| KICF-Sat | Vs | y = 0.553x − 0.631 | 87.3 | 0.002 | |
| VP-Sat | y = 0.022 × e0.66x | 84.3 | 0.004 | ||
| n | y = 2.338 × e−0.994 | 89.2 | 0.001 | ||
| W.A. | y = 0.898 × e−0.939 | 88.7 | 0.002 | ||
| IS50-Sat | y = 0.663x − 0.051 | 82.8 | 0.004 | ||
| Class 3A | KICF-Dry | IS50-Dry | y = 0.36ln(x) + 0.74 | 64.9 | 0.050 |
| KICF-Sat | ρd | y = 0.025 × e3.697 | 74.8 | 0.026 | |
| Class 3B | KICF-Dry | VP-Sat | y = 3.524ln(x) − 4.537 | 95.3 | 0.024 |
| KICF-Sat | VP-Sat | y = 0.0004 × e1.068x | 90.7 | 0.048 | |
| n | y = −0.156x + 2.229 | 97.5 | 0.013 | ||
| W.A. | y = −0.359x + 2.111 | 97.2 | 0.014 | ||
| RN | y = 1.767ln(x) − 5.969 | 89.2 | 0.055 |
| Class | Dependent Variable | Independent Variable | VIF | p-Value | Predictive Model | RMSE | R2 (%) | Adj. R2 | p-Value |
|---|---|---|---|---|---|---|---|---|---|
| All Data | KICF-Sat | Constant | 0.000 | KICF−Sat = 0.2646 VP−Sat + 0.3123 IS50−Sat − 0.924 | 0.1557 | 85.22 | 84.08 | 0.000 | |
| VP-Sat (Km/s) | 1.43 | 0.000 | |||||||
| IS50-Sat (MPa) | 1.43 | 0.000 | |||||||
| Constant | 0.000 | KICF−Sat = −0.04204 n + 0.3769 IS50−Sat + 0.656 | 0.1879 | 78.46 | 76.81 | 0.000 | |||
| n (%) | 1.31 | 0.000 | |||||||
| IS50-Sat (MPa) | 1.31 | 0.000 | |||||||
| Constant | 0.000 | KICF−Sat = −0.0873 W.A. + 0.3765 IS50−Sat + 0.627 | 0.1931 | 77.27 | 75.52 | 0.000 | |||
| W.A. (%) | 1.33 | 0.000 | |||||||
| IS50-Sat (MPa) | 1.33 | 0.000 | |||||||
| Constant | 0.002 | KICF−Sat = 0.1824 VS + 0.523 ρd + 0.3246 IS50−Sat − 1.367 | 0.1934 | 78.07 | 75.43 | 0.000 | |||
| VS (Km/s) | 1.36 | 0.005 | |||||||
| ρd (gr/cm3) | 1.26 | 0.004 | |||||||
| IS50-Sat (MPa) | 1.54 | 0.001 | |||||||
| Constant | 0.018 | KICF−Sat = 0.1540 VS + 0.000014 ρSat + 0.377 ρd + 0.3367 IS50Sat − 0.997 | 0.1786 | 82.03 | 79.04 | 0.000 | |||
| VS (Km/s) | 1.43 | 0.011 | |||||||
| ρSat (Ω.m) | 1.32 | 0.030 | |||||||
| ρd (gr/cm3) | 1.48 | 0.030 | |||||||
| IS50-Sat (MPa) | 1.54 | 0.000 | |||||||
| VS (Km/s) | 9.06 | 0.008 | KICF-Sat = 0.1059 VS + 0.000020 ρSat + 0.3928 IS50Sat | 0.1936 | 96.30 | 95.87 | 0.000 | ||
| ρSat (Ω.m) | 1.69 | 0.002 | |||||||
| IS50-Sat (MPa) | 8.69 | 0.000 | |||||||
| ρSat (Ω.m) | 1.61 | 0.001 | KICF-Sat = 0.000024 ρSat + 0.5984 IS50Sat | 0.2182 | 95.11 | 94.75 | 0.000 | ||
| IS50-Sat (MPa) | 1.61 | 0.000 | |||||||
| KICF-Dry | VPDry (Km/s) | 1.18 | 0.001 | KICF-Dry = 0.116301 VP-Dry + 0.270473 IS50-Dry | 0.1778 | 70.00 | 69.72 | 0.000 | |
| IS50-Dry (MPa) | 1.18 | 0.000 | |||||||
| Constant | 0.000 | KICF−Dry = − 0.03318 n + 0.2757 IS50−Dry + 0.789 | 0.1677 | 73.56 | 71.60 | 0.000 | |||
| n (%) | 1.14 | 0.000 | |||||||
| IS50-Dry (MPa) | 1.14 | 0.000 | |||||||
| Constant | 0.000 | KICF−Dry = −0.0701 W.A. + 0.2646 IS50Dry + 0.786 | 0.1711 | 72.48 | 70.45 | 0.000 | |||
| W.A. (%) | 1.19 | 0.000 | |||||||
| IS50-Dry (MPa) | 1.19 | 0.000 | |||||||
| Class 1A | KICF-Sat | Constant | 0.032 | KICF−Sat = −0.6096 VS + 0.000040 ρSat + 2.518 | 0.0210 | 99.64 | 98.91 | 0.060 | |
| VS (Km/s) | 1.82 | 0.047 | |||||||
| ρSat (Ω.m) | 1.82 | 0.039 | |||||||
| KICF-Dry | Constant | 0.001 | KICF−Dry = 0.038435 VP−Dry + 0.062731 n + 0.72566 | 0.0000 | 100 | 100 | 0.001 | ||
| VP-Dry (Km/s) | 3.95 | 0.004 | |||||||
| n % | 3.95 | 0.001 | |||||||
| Constant | 0.003 | KICF−Dry = −0.000001 ρSat − 0.85596 ρd + 3.3853 | 0.0001 | 100 | 100 | 0.003 | |||
| ρSat (Ω.m) | 2.82 | 0.010 | |||||||
| ρd (gr/cm3) | 2.82 | 0.005 | |||||||
| Class 1B | KICF-Sat | Constant | 0.034 | KICF−Sat = −0.1115 W.A. + 0.379 IS50−Sat + 0.67 | 0.1077 | 89.75 | 85.66 | 0.003 | |
| W.A. (%) | 1.74 | 0.040 | |||||||
| IS50-Sat (MPa) | 1.74 | 0.039 | |||||||
| Class 2 | KICF-Sat | Constant | 0.004 | KICF−Sat = 0.3552 VS + 0.2052 VP−Sat − 1.122 | 0.1244 | 96.86 | 95.30 | 0.001 | |
| VS (Km/s) | 2.16 | 0.01 | |||||||
| VP-Sat (Km/s) | 2.16 | 0.025 | |||||||
| Constant | 0.005 | KICF−Sat = 0.3570 VS + 2.052 ρd − 5.366 | 0.0919 | 98.29 | 97.43 | 0.000 | |||
| VS (Km/s) | 2.00 | 0.003 | |||||||
| ρd (gr/cm3) | 2.00 | 0.007 | |||||||
| Class 3A | KICF-Sat | ρSat (Ω.m) | 1.19 | 0.003 | KICF-Sat = 0.000140 ρSat + 0.4767 IS50-Sat | 0.0903 | 98.87 | 98.30 | 0.000 |
| IS50-Sat (MPa) | 1.19 | 0.000 | |||||||
| KICF-Dry | Constant | 0.043 | KICF−Dry = 0.679 VS − 0.0687 RN + 0.3097 IS50−Dry + 1.597 | 0.0711 | 97.28 | 93.20 | 0.041 | ||
| VS (Km/s) | 4.82 | 0.042 | |||||||
| RN | 4.97 | 0.041 | |||||||
| IS50-Dry (MPa) | 1.36 | 0.025 | |||||||
Publisher’s Note: MDPI stays neutral with regard to jurisdictional claims in published maps and institutional affiliations. |
© 2022 by the authors. Licensee MDPI, Basel, Switzerland. This article is an open access article distributed under the terms and conditions of the Creative Commons Attribution (CC BY) license (https://creativecommons.org/licenses/by/4.0/).
Share and Cite
Safari Farrokhad, S.; Lashkaripour, G.R.; Hafezi Moghaddas, N.; Aligholi, S.; Sabri, M.M.S. The Effect of the Petrography, Mineralogy, and Physical Properties of Limestone on Mode I Fracture Toughness under Dry and Saturated Conditions. Appl. Sci. 2022, 12, 9237. https://doi.org/10.3390/app12189237
Safari Farrokhad S, Lashkaripour GR, Hafezi Moghaddas N, Aligholi S, Sabri MMS. The Effect of the Petrography, Mineralogy, and Physical Properties of Limestone on Mode I Fracture Toughness under Dry and Saturated Conditions. Applied Sciences. 2022; 12(18):9237. https://doi.org/10.3390/app12189237
Chicago/Turabian StyleSafari Farrokhad, Sajad, Gholam Reza Lashkaripour, Nasser Hafezi Moghaddas, Saeed Aligholi, and Mohanad Muayad Sabri Sabri. 2022. "The Effect of the Petrography, Mineralogy, and Physical Properties of Limestone on Mode I Fracture Toughness under Dry and Saturated Conditions" Applied Sciences 12, no. 18: 9237. https://doi.org/10.3390/app12189237
APA StyleSafari Farrokhad, S., Lashkaripour, G. R., Hafezi Moghaddas, N., Aligholi, S., & Sabri, M. M. S. (2022). The Effect of the Petrography, Mineralogy, and Physical Properties of Limestone on Mode I Fracture Toughness under Dry and Saturated Conditions. Applied Sciences, 12(18), 9237. https://doi.org/10.3390/app12189237