Article

Experimental and Numerical Investigation of the Damage Characteristics of Rocks under Ballistic Penetration

1
School of Mechanical Engineering, Nanjing University of Science and Technology, Nanjing 210094, China
2
Shandong Institute of Nonmetallic Materials, Jinan 250031, China
*
Author to whom correspondence should be addressed.
Appl. Sci. 2022, 12(12), 6120; https://doi.org/10.3390/app12126120
Submission received: 18 April 2022 / Revised: 10 June 2022 / Accepted: 13 June 2022 / Published: 16 June 2022
(This article belongs to the Special Issue Mechanical Properties and Fracture Behavior of Rocks)

Abstract

:
Rock penetration is an inevitable problem in the study of drilling and projectile penetration. The penetration resistance of red sandstone and limestone was investigated at projectile speeds ranging from 600–1200 m/s. The damage characteristics of these rocks were studied via experimental tests and numerical simulations. The damage condition of the target surface, internal damage state and crack distribution were obtained. It was concluded that the maximum error of the numerical simulation and experimental results was not more than 10%. The penetration resistance of limestone was approximately 23.8% stronger than that of red sandstone. However, the energy absorption effect of limestone was weaker than that of red sandstone, and large cracks can be more easily formed. The compaction area of red sandstone was softer, with obvious crack compaction in the crater area, and particle detachment can more easily occur. Red sandstone was more sensitive to the impact angle of the projectile. With oblique penetration, the projectile was more likely to deflect inside the red sandstone target.

1. Introduction

To cope with the threat of increasingly powerful earth-penetrating weapons, in modern wars ammunition depots, command posts and other fortifications are mostly located inside mountains. Mountains contain soil, crushed stones, large rocks and other media, resulting in complex penetration conditions. Red sandstone, limestone and granite are common rocks in mountains and can be used as natural defense barriers. Therefore, it is of certain practical significance to study the damage characteristics of projectiles to different rocks and provide some reference for the research of earth-penetrating projectiles [1,2,3,4].
Researchers have conducted extensive penetration tests on concrete and granite. Mu et al. [5] carried out penetration tests on concrete with 51 MPa strength in the speed range of 500–1500 m/s and proposed a theoretical model for determining the upper limit of rigid penetration velocity. Zhao et al. [6] studied the relationship between the shape coefficient of the abraded projectile head and the target velocity after the test and proposed a modified model for calculating the penetration depth. Zhang et al. [7] studied the penetration regularity of projectiles into granite in a large velocity range. Wang et al. [8] obtained the destruction effects of crater diameter, crater depth and crack distribution on the surface of the target at three impact speeds. Li et al. [9] carried out tests on the penetration of high-strength steel projectiles with oval-head long rods into granite at impact speeds of 1200–2400 m/s with a light-gas gun and proposed a penetration calculation model considering the mass loss of projectiles. Zhang et al. [10] obtained the relationship between the penetration depth and penetration speed of granite and established an empirical formula for predicting the penetration depth of high strength rock. Besides, the synthesis and characterization of some new brittle materials were also very important topics for several applications [11,12,13,14,15,16]. However, limestone and red sandstone, as common mountain materials, lack relevant penetration experimental research.
In recent years, research on the static and dynamic mechanical properties of granite, limestone and red sandstone has been very rich, and the mechanical properties of limestone and red sandstone have been well revealed [17,18]. Yuan et al. [19] found that the fracture/damage mode of granite is mainly brittle and that the damage starts at the weak rock–crystal interface. Hoerth et al. [20] analyzed the propagation process of stress waves in sandstone under high dynamic loading. Yue et al. [21] found that the peak strength, maximum strain and elastic modulus of prefractured red sandstone increased with increasing crack inclination. Zhang [22] carried out an experimental study on the mechanical properties of frozen–thawed red sandstone. During the freeze–thaw process, there are three deterioration modes: cracking, particle shedding and sheet shedding. According to Grady’s viewpoint on energy fracture, the influence of the target surface fracture on the energy loss of the projectile can be obtained [23,24]. The mechanical characteristics of uniaxial reloading of limestone after damage can be divided into three stages: the stable stage, stable growth stage and secondary stable stage [25]. Limestone undergoes a linear elastic stage, plastic hardening stage and failure stage during compression [26,27]. The damage mode of granite is mainly brittle, whereas limestone and red sandstone have certain elastic–plastic properties. The mechanical properties of concrete and rock have been well studied by scholars, but research on the penetration and failure characteristics of rock is very limited.
In limited related studies, the ballistic properties of limestone were revealed to some extent. Rosenberg et al. [28] penetrated a large number of limestone targets with rigid projectiles of similar shape and different sizes. It was found that the penetration resistance of the projectiles decreased with increasing projectile size. Forrestal et al. [29,30,31,32] found that the minimum velocity of a 4340 steel projectile penetrating a limestone target was 300 m/s. Antoun et al. [33] found that a long-rod projectile with a length-to-diameter ratio of 8.75 had a stronger penetration ability into limestone than a spherical projectile. Warren [34,35] carried out oblique penetration tests of limestone targets with a 15–30° inclination using a blunt-head projectile and developed a penetration model suitable for calculating projectile deformation based on the test data obtained. Although there is a certain research basis for the small-bore penetration of limestone at present, the size effect has a great influence on rock penetration. There is no systematic research on the penetration of shot with a diameter greater than φ30 mm, the penetration performance of red sandstone or the destruction characteristics of limestone and red sandstone.
Numerical simulation is an important method to study the damage and damage laws of materials under impact. With appropriate numerical simulation methods, the generation and propagation of material cracks can be better simulated and the failure mode of materials can be better characterized [36,37,38,39].
At present, there is little penetration test research on red sandstone and limestone due to the high test cost and high launching requirement of large-bore projectiles. To obtain the destruction characteristics of different rocks and to clarify the difference in penetration resistance of common hard targets such as limestone and red sandstone, relevant experiments and numerical studies are carried out in this paper. First, the failure characteristics of the two rocks are obtained by penetrating red sandstone and limestone targets with 30 mm projectiles at different speeds. Then, the relevant numerical model is established and verified with the experiment. Finally, a wide range of parameter analyses are carried out by means of numerical simulation, including analyses of the influence of the penetration speed, target impact angle and intensity on penetration performance.

2. Experimental Study

2.1. Materials and Properties

The rock used in this test came from Jiangsu Province, China. Due to the different environments of the region, the mechanical properties of the same type of rock can also be different. Moreover, the formation and composition of different rocks can also be very different. The particle size of red sandstone is approximately 0.1~0.5 mm [40], and the particle size of limestone is 0.01~0.10 mm [41]. Therefore, it was necessary to study the mechanical properties of the rock before testing and numerical simulation to ensure the reliability of rock data in numerical simulation. This section introduces the preparation of rock specimens and carries out quasistatic compression tests and static Brazilian disc splitting tests on red sandstone and limestone to obtain the uniaxial compressive strength and tensile strength of the two rocks. The mechanical properties of the two rocks are compared and analyzed in detail, and the reasons for the differences are obtained.
Quasistatic compression tests were performed on cylindrical specimens with a size of 40 × 80 using strain rates of 2 × 10⁻⁴ s−1 and 2 × 10⁻³ s−1. Three tests were conducted for each material, and the test groups are shown in Table 1. The average compressive strength of limestone was 117.36 MPa, and the average compressive strength of red sandstone was 56.10 MPa.
The Brazilian disk splitting test was performed on cylindrical specimens with a dimension of 50 × 25. To ensure the repeatability of the test data, three tests were carried out for each rock. The size and results of the test pieces are shown in Table 2. The average tensile strength of limestone was 4.437 MPa, and the average tensile strength of red sandstone was 1.483 MPa.

2.2. Experimental Setup

Considering the test cost, the experiment was conducted two times. The projectile with the lower speed was fired with a 30 mm smoothbore gun, and the field layout is shown in Figure 1a. The projectile with the higher speed was fired with a 60 mm smoothbore gun, and the field layout is shown in Figure 1b. The projectile body was launched by a 30 mm gun with a nylon airlock ring, as shown in Figure 2a. The projectile body was fired with a 60 mm gun with a nylon sabot and the projectile surface was painted to facilitate better capture of the projectile with the high-speed camera, as shown in Figure 2b. The rock target was a 600 mm × 600 mm square area with a length of 1 m. The rock target was placed in a steel ring with a diameter of 1 m and C40 concrete was filled between the target and the steel ring, as shown in Figure 3. The projectile material was 30CrMnSiNi2A. After heat treatment, the dynamic yield strength exceeded 1 GPa, and its composition distribution is shown in Table 3.
To study the differences in penetration resistance of different rocks, three test schemes for the penetration of red sandstone and limestone at different speeds were designed, as shown in Table 4. In the experiment, a high-speed photography system was placed in front of the target to measure the actual impact velocity and target attitude of the projectile.

2.3. Experimental Results and Discussion

To study the difference in penetration resistance between red sandstone and limestone, penetration tests on red sandstone and limestone targets were conducted at three different projectile speeds of 600 m/s, 900 m/s and 1200 m/s. An analysis of the total penetration depth P , crater depth H , crater diameter , crack propagation, etc., was carried out, and the results are shown in Figure 4. The conditions of the red sandstone and limestone targets after testing are shown in Figure 5.
Figure 4 shows that when the penetration speed was 1100 m/s, the limestone target was close to being penetrated, but the red sandstone target was penetrated. It can be concluded that the penetration resistance of limestone is stronger than that of red sandstone, but the opening and collapse area of the limestone target surface is large because limestone is more brittle than red sandstone. With increasing impact velocity, the growth trends of the penetration depth and crater depth of limestone and red sandstone were similar, and the crater diameter hardly changed.
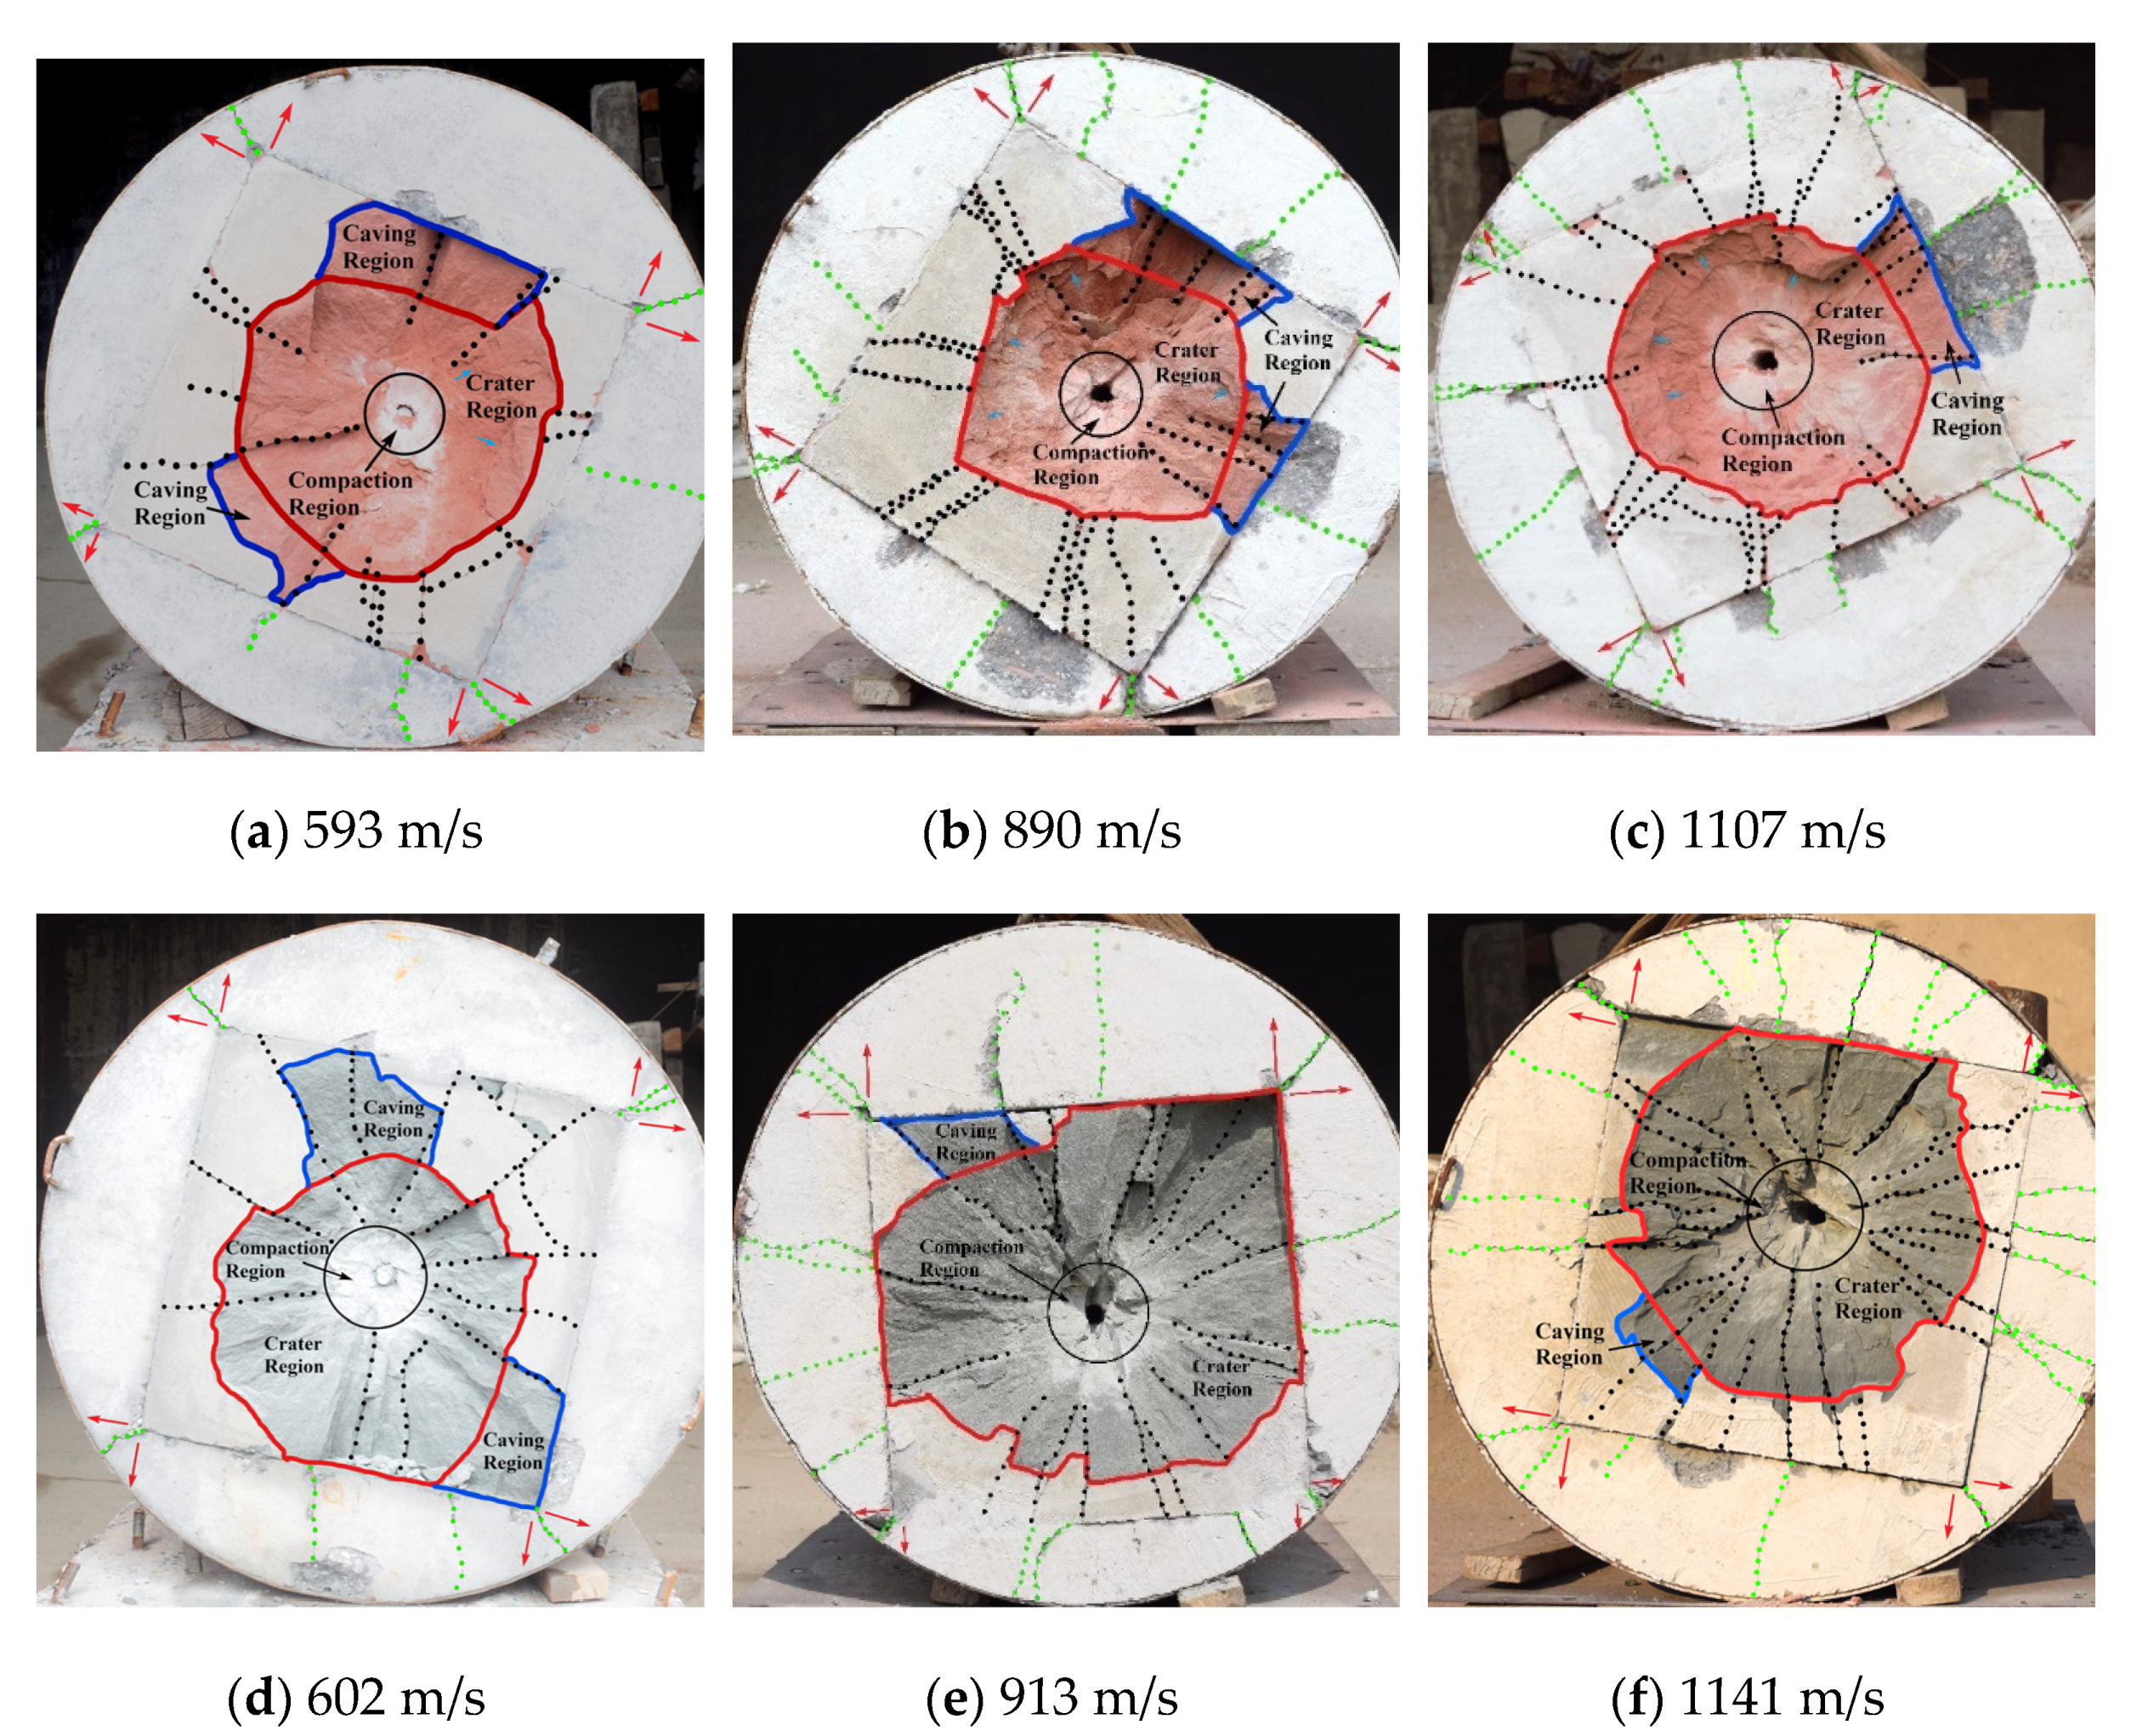
Figure 5a–c,e–g show the front views of the red sandstone and limestone targets after penetration, respectively. When the projectile penetrates the target, the stress wave was transmitted from the target point to the rock–concrete contact surface in four directions. Part of the stress wave was emitted to form a reflected wave, resulting in cracks on the rock target. Part of the stress wave perpendicular to the rock–concrete contact surface was transmitted into the concrete to form a transmission wave; this wave was reflected back and forth on the steel hoop and rock–concrete contact surface, resulting in cracks on the concrete target. The concrete at the top corner of the two adjacent contact surfaces was subjected to stress in the direction of the red arrow in the figure; the stress concentration will most likely cause cracks and collapse. The target surface cracks increased with increasing penetration velocity. The limestone target surface cracks extended radially from the compaction area to the target edge. Most of the target surface cracks of the red sandstone extended radially from the edge of the crater region to the target edge. Only a few large cracks existed in the crater region. This was because the grains in red sandstone were looser than those in limestone, resulting in the compaction of most of the cracks in the crater region. At the same impact velocity, there were more cracks on the limestone target than on the red sandstone target, which also showed that limestone more easily formed cracks than red sandstone.
The damaged areas of the rock target surface were the crater region (red solid line area in the figure), collapse area (blue solid line area in the figure) and crack propagation area (black dotted line in the figure). Figure 5 shows that with increasing impact velocity, the greater the crater region close to the regular circle was, the smaller the collapse area was. The shape of the crater region on the red sandstone target surface was close to a disk. There were obvious spallation marks in the crater region of red sandstone, which are indicated by the blue arrow in the figure. With increasing projectile impact velocity, the more spallation marks there were, the more obvious they were, which was related to the nature of the granular clastic structure of red sandstone. The shape of the crater region on the limestone target was close to a funnel shape. At the corresponding impact velocity, the limestone collapse area was smaller than that of red sandstone, and the collapse area was always accompanied by cracks. The target surface of red sandstone had the phenomenon of lamination, which was more sensitive to the impact of target surface cracks.
In summary, the study of limestone and red sandstone anti-assault tests resulted as follows: Limestone had a higher penetration resistance ability than red sandstone. Due to the stronger brittleness of limestone, limestone was more likely to have large cracks and a greater open area during the invasive process. Due to the granular debris structure of the red sandstone, penetration of the red sandstone target surface was more likely to occur, and the target surface was more likely to be affected by cracks.

3. Numerical Simulation Analysis

3.1. Simulation Model Setup

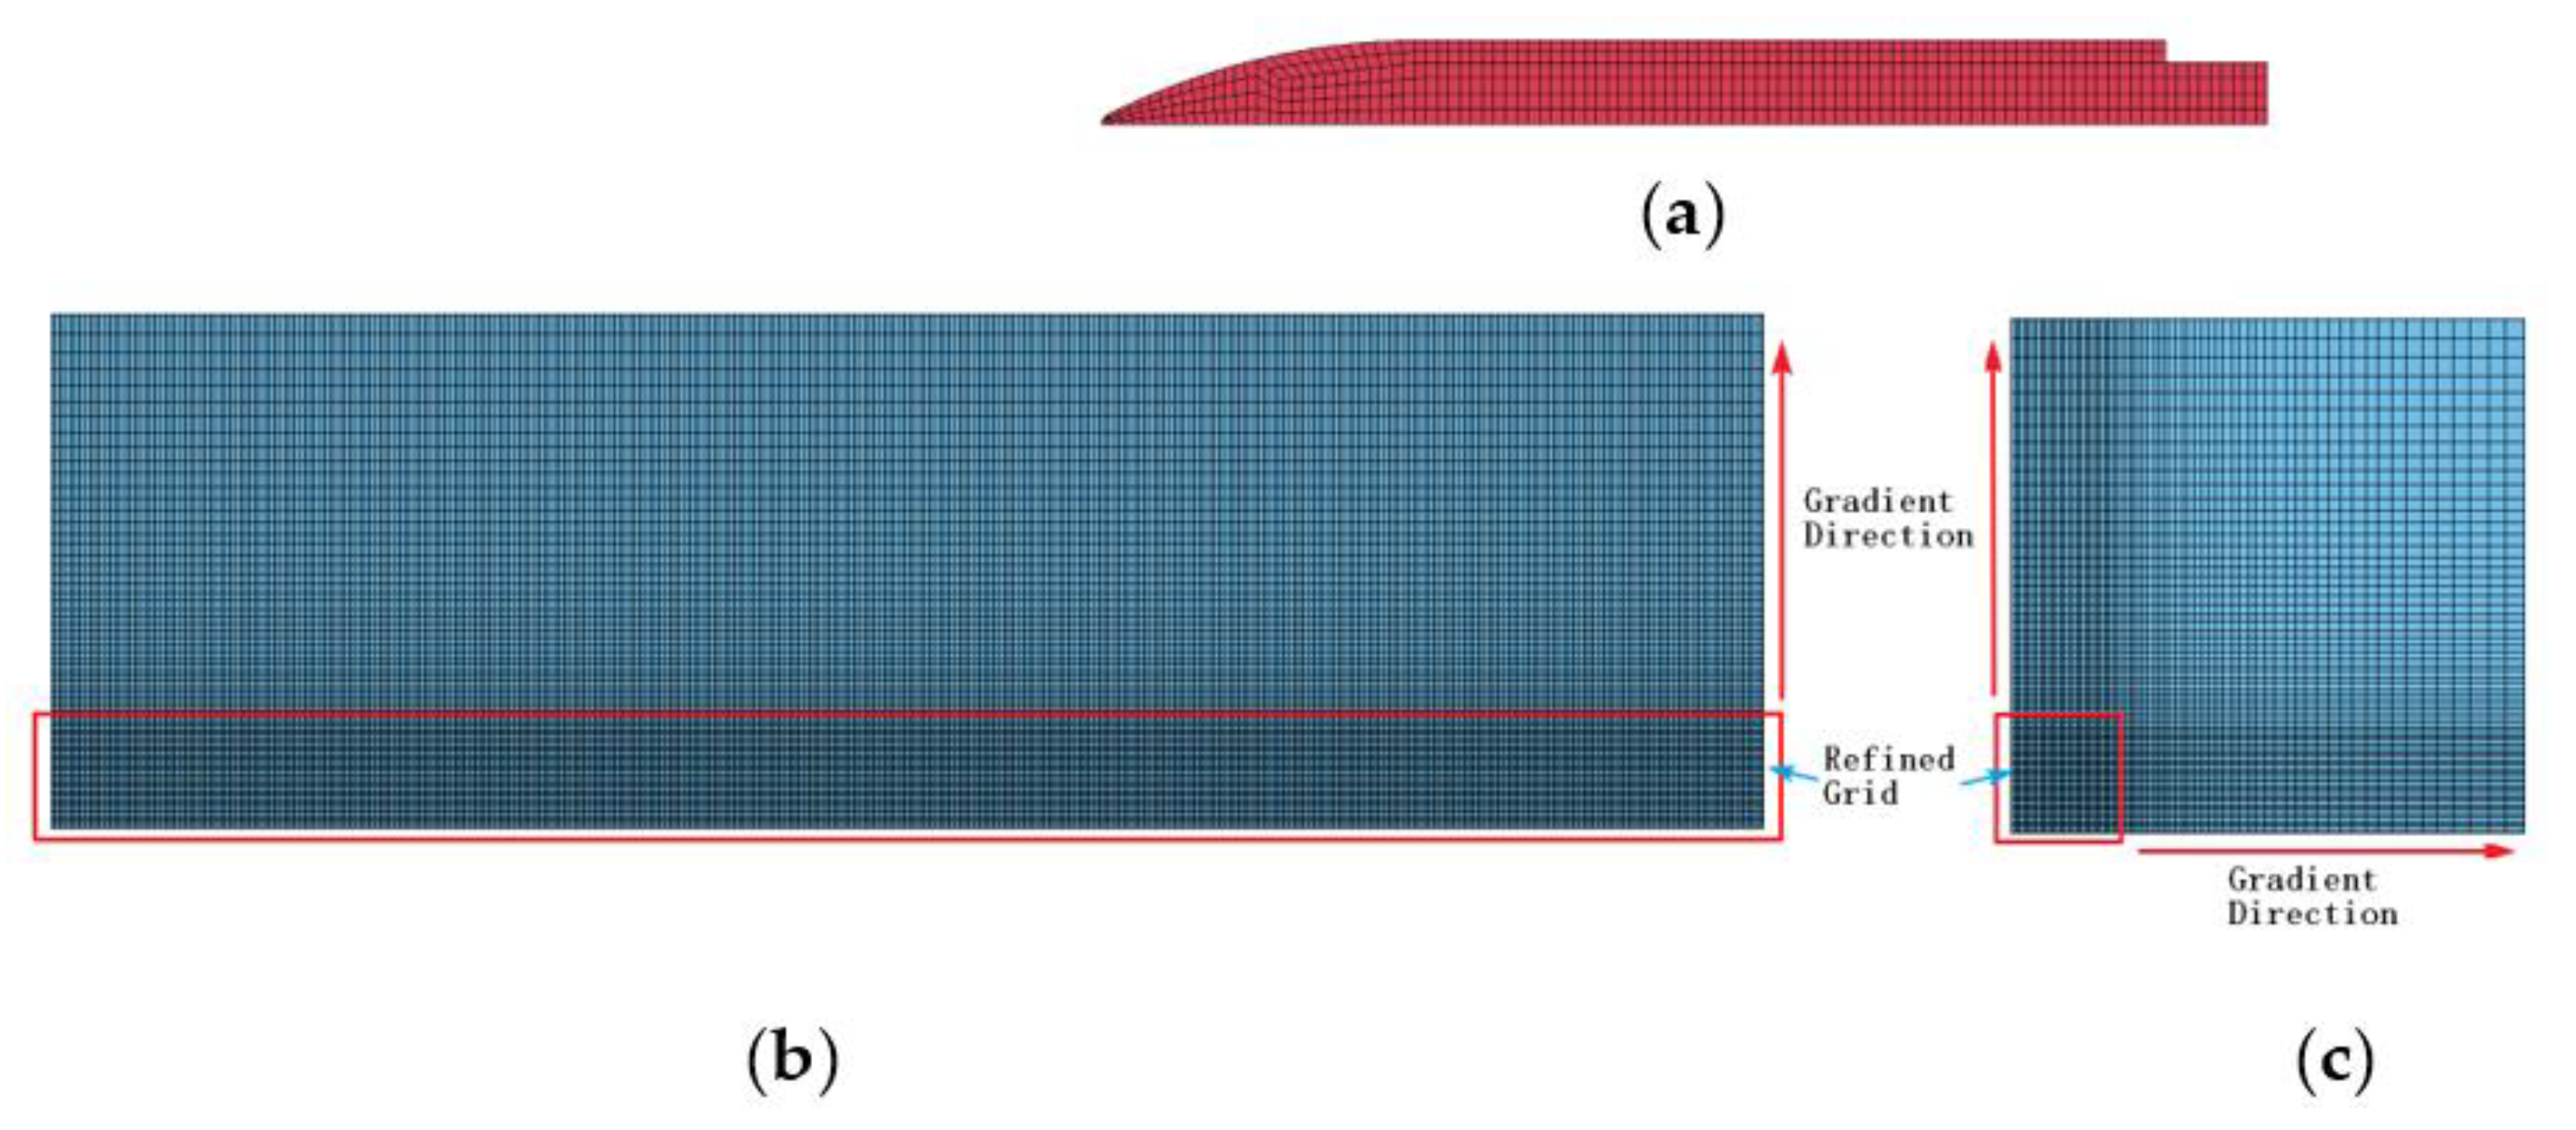
The projectile used in this paper was a solid projectile. The diameter of the projectile was 30 mm, the length was 205 mm, the curvature-diameter ratio φ   was 4 and the head of the projectile had a 2 mm fillet. The mesh size of the projectile was 2 mm. The target had a 600 mm × 600 mm square area and the target thickness was 1 m. To reduce the computation period, the target was processed in two steps. First, because forward penetration was studied in this paper, 1/4 of the models were used for modeling. Second, grid densification was carried out within the range of 150 mm × 150 mm (in the red box in Figure 6) centered on the impact point of the projectile to improve the contact accuracy of the projectile target. The mesh size of the encrypted area was 2 mm. The remaining part adopted the grid processing method of the grid’s gradual change (the direction indicated by the red arrow in Figure 6), and the gradual change rate was 1.03 to ensure correct stress wave propagation and crack propagation in the target. The 3D modeling of the target and the projectile is shown in Figure 6.
In the model, the projectile consisted of 30CrMnSiNi2A, of which the material parameters are shown in Table 5. The targets were red sandstone and limestone. Since the projectile velocity studied in this paper was 600–1200 m/s, which belongs to the medium and low speed ranges, and the penetration process had little impact on the projectile shape and quality, the projectile was regarded as a rigid body for numerical simulation and the projectile adopted the *MAT_RIGID material model, as shown in Table 5. Limestone adopted the *MAT_RHT material model. The projectile-target contact used *CONTACT_ERODING_SURFACE_TO_SURFACE to describe the interaction between the projectile and target.
The Riedel–Hiermaier–Thoma (RHT) constitutive model, proposed by Riedel W., Thoma K., Hiermaier S. and Schmolinske E. in 1999, comprehensively considers various damage factors of concrete, such as compression damage, cracking and softening [42,43]. The RHT model integrates the characteristics of various constitutive models describing concrete materials, considers various phenomena, such as compression damage, strain hardening, strain softening and cracking softening after failure, and is suitable for calculating the deep penetration process of rock and concrete materials [44,45].
According to the results of the quasistatic test, dynamic mechanical test and Brazilian disc splitting test, key parameters such as the uniaxial compressive strength and tensile strength were fitted, and then other parameters were obtained by reference to previous tests [46]. Finally, the different rock material model parameters are shown in Table 6.

3.2. Model Verification

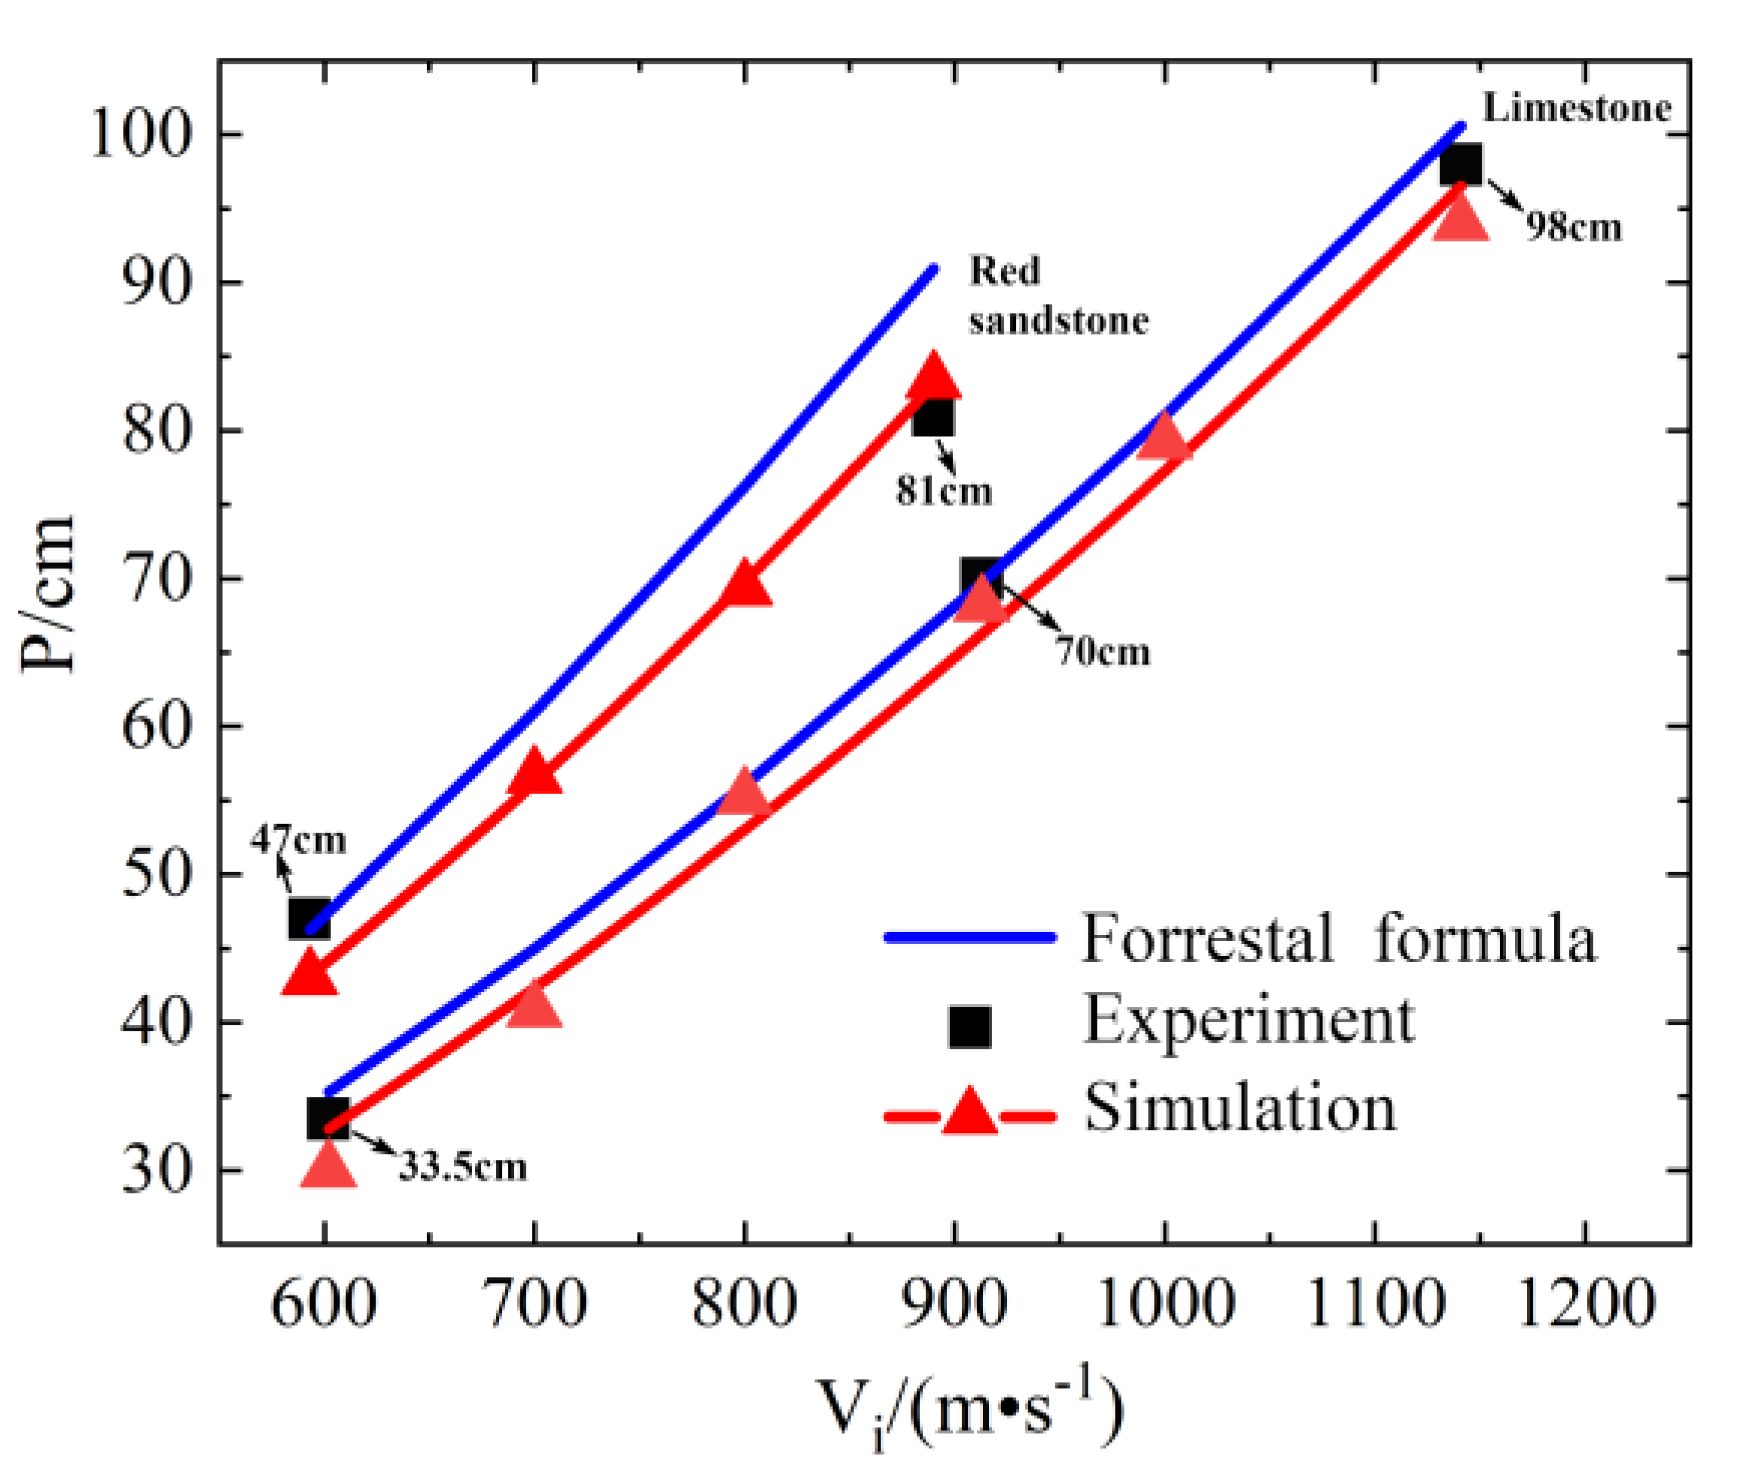
The Forrestal penetration formula, numerical simulation calculations and experimental tests of projectile penetration into limestone are introduced and the research data are shown in Figure 7 and Table 7. After the experimental tests, to study the internal crack distribution of the rock target, cross-sectional target analysis was carried out for the red sandstone target with a projectile impact speed of 1107 m/s, as shown in Figure 8. In addition, cross-sectional target analysis was carried out for the limestone target with an impact speed of 913 m/s, as shown in Figure 9.
Figure 7 shows the effect of the projectile impact velocity on the penetration depth of the red sandstone and limestone targets. The blue curve is the result calculated by the Forrestal penetration formula, the black square scatter represents the test data, the red triangle is the numerical simulation data and the red curve is the result obtained by fitting the numerical simulation data. With increasing impact velocity, the penetration depth gradually increased, and the curve was slightly concave. When the projectile penetrated the red sandstone target at low speed, the numerical simulation results and Forrestal penetration calculation results were in good agreement with the experimental data. When the speed reached medium and high speeds, the error became larger, and the trends of the Forrestal curve and numerical simulation curve were similar. The experimental data of the projectile penetrating the limestone target were almost consistent with the calculation curve of the Forrestal penetration formula.
Table 7 shows the results of the experimental tests, numerical simulation and Forrestal penetration formula of projectile penetration into the red sandstone target and limestone target as well as the error analysis among them. The error between the calculation results of the experimental tests and numerical simulation was less than 10%. Through experimental verification, the correctness of the numerical simulation calculation was proven. Additionally, the Forrestal penetration formula was also applicable to the penetration calculation of red sandstone and limestone.
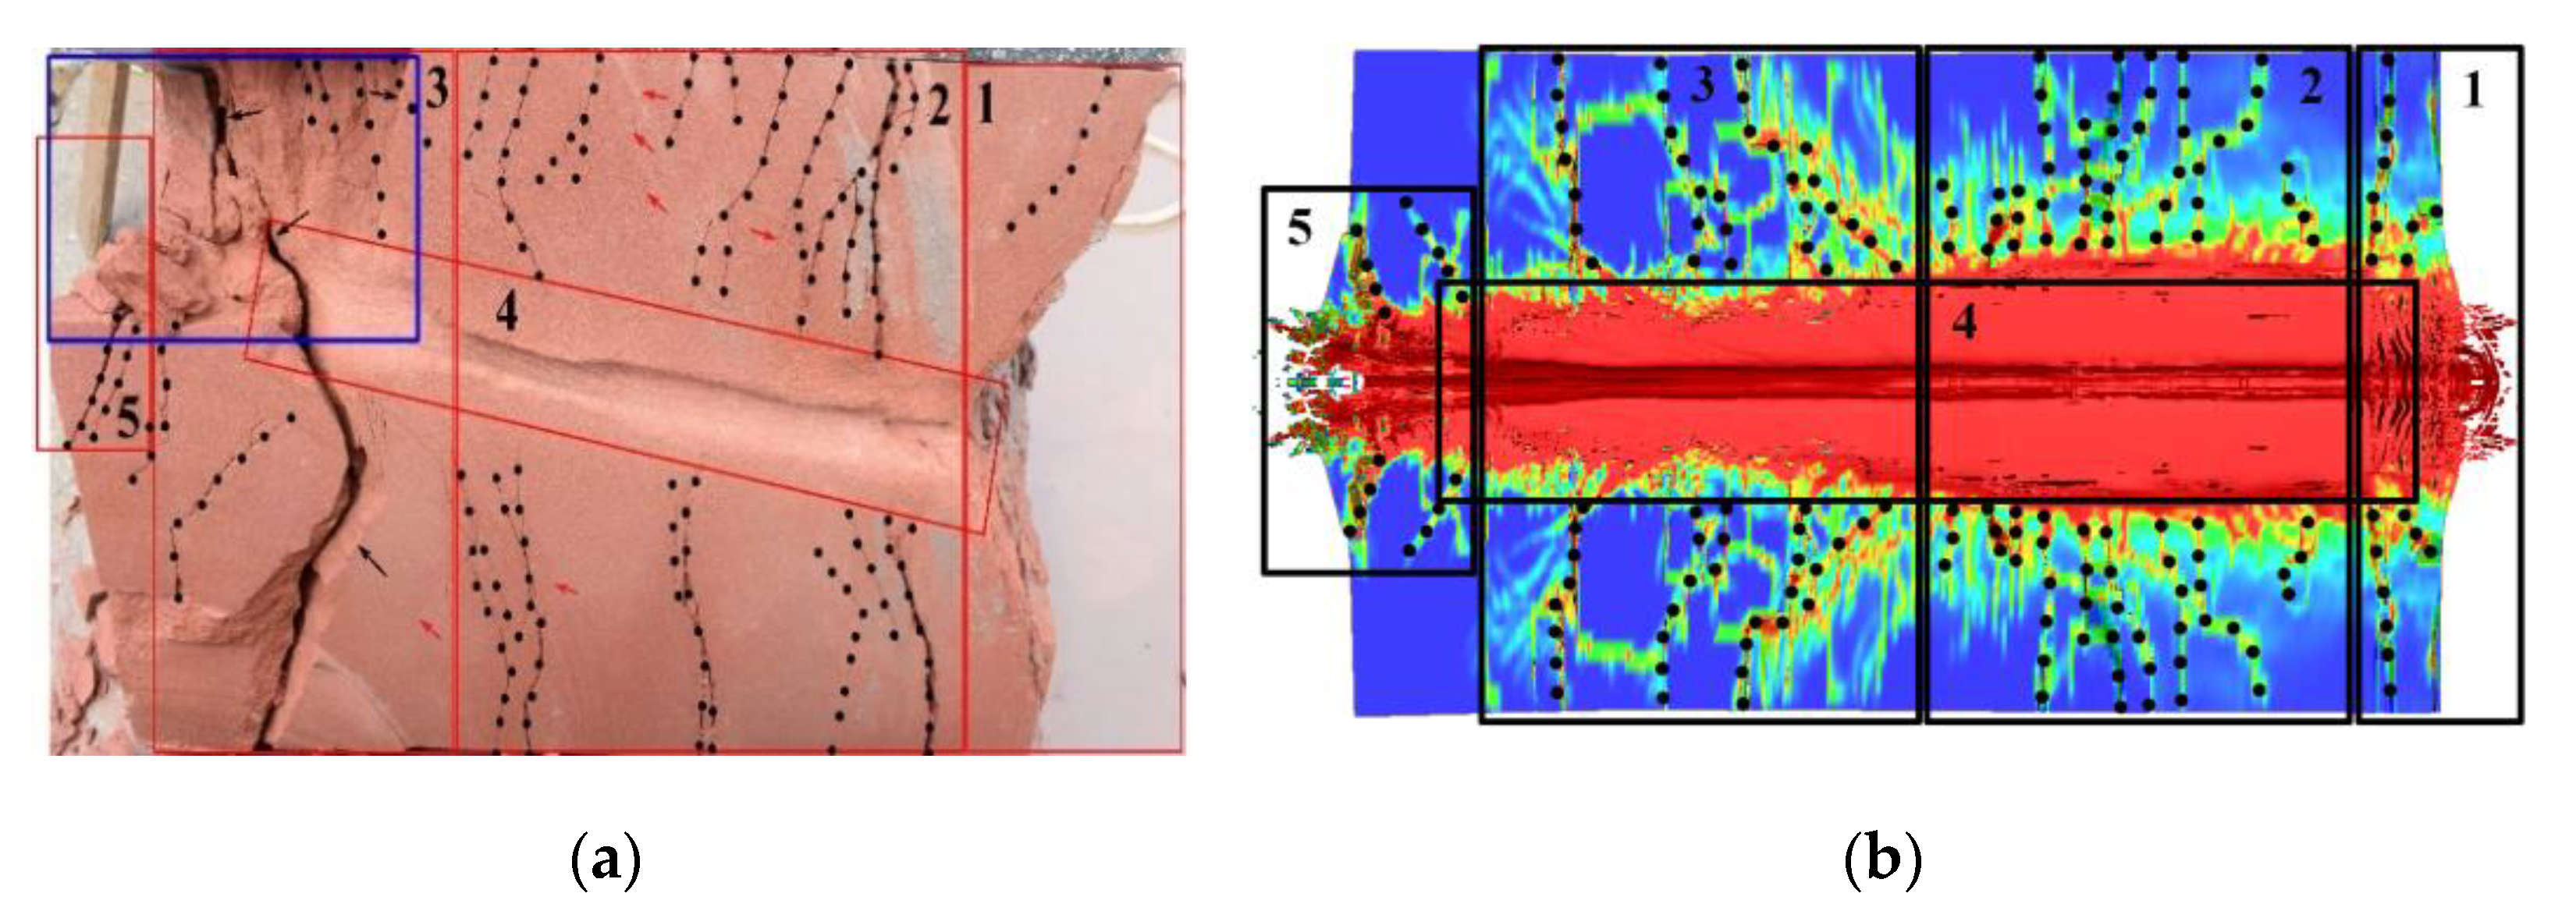
Figure 8 shows the distribution of internal cracks in the target after the projectile with an impact velocity of 1107 m/s penetrated the red sandstone. Figure 8a and Figure 9a show the test results, and Figure 8b and Figure 9b illustrate the numerical simulation results. Figure 9 shows the distribution of internal cracks in the target after the projectile with an impact velocity of 913 m/s penetrated the red sandstone. Figure 8a,b are divided into five areas. Area 1 is the crater region; zone 2 is the radial crack zone; zone 3 is an oblique crack zone extending along the penetration direction; zone 4 is the compaction zone and tunnel zone; and zone 5 is the back crater area caused by scouring. Figure 9a,b are divided into four areas, which are the same as the first four areas in Figure 8.
Figure 8a shows the red sandstone target. When the projectile entered the target at certain angles, the penetration trajectory was tilted. Figure 8a depicts a large red sandstone particle falling off the blue frame, which was due to the large crack indicated by the black arrow at the tail of the target that resulted in the fragmentation of some red sandstone particles during target cutting. In the process of target cutting, due to the cracks under the target surface and the soft material of red sandstone, the hole diameter and depth of the target were increased.
Figure 8 and Figure 9 show that in zone 1 of the target, after the projectile penetrated the red sandstone and limestone targets, a more standard conical crater was formed. However, the opening diameter in the simulation model was slightly smaller than that of the test results because the test target fell off and was damaged during the target cutting process.
Figure 8 and Figure 9 show that in zone 2 of the target there were many cracks in the red sandstone target, but most of the cracks were narrow, whereas there were few cracks in the limestone target, but these cracks were wide. Compacted cracks were found in zone 2 of the red sandstone target, as shown by the red arrow in Figure 8a. The numerical simulation was in good agreement with the number, trend and position of cracks in the test results.
Figure 8 and Figure 9 show that in zone 3 of the target, the number of cracks along the penetration direction in the limestone target was increasingly obvious. The numerical simulation agreed well with the trend and position of cracks in the test results, but the number of cracks was slightly different.
Zone 4 in Figure 8b and Figure 9b shows that the diameter of the compacted zone of red sandstone was significantly larger than that of limestone because the red sandstone material was easier to crush and damage at the same speed. The diameter of the compacted zone was similar to that of the test results.
In Figure 8a, the upper part of zone 5 became detached during target cutting and the lower part had two oblique cracks along the penetration direction, which caused the red sandstone near the penetration hole to fall off and form a back crater area in the red sandstone. There were two short cracks along the penetration direction in the upper/lower part of zone 5 in Figure 8b, which is very similar to Figure 8a. Since the limestone target was not penetrated, there was no back crater area.
In summary, after the projectile penetrated the rock, the cracks formed on the limestone target were few and wide, whereas the cracks formed on the red sandstone target were dense and fine. The diameter of the compaction zone of red sandstone was larger than that of limestone, and the damage to the penetration path was more serious. The penetration resistance of red sandstone was obviously weaker than that of limestone, but the surface collapse area of the red sandstone target was smaller. In the process of penetration, red sandstone was more sensitive to the attitude of the projectile. The numerical simulation results were very similar to the experimental results, which shows the reliability of the material parameters and constitutive equation. The Forrestal penetration formula was also applicable to the penetration calculation of red sandstone and limestone. When the projectile penetrated red sandstone at low speed and limestone at medium speed, the three results demonstrated the best agreement, and the error was no more than 5%.

3.3. Parameter Analysis

3.3.1. Effect of Impact Velocity on Penetration Performance

The impact velocity range of the projectile was 600 m/s–1200 m/s and the interval between two adjacent impact velocities was 100 m/s. The damage to the target after penetration is shown in Figure 10. The depth versus time curves, penetration speed versus time curves and acceleration versus time curves of the projectile penetrating red sandstone and limestone are shown in Figure 11 and Figure 12, respectively.
Figure 10 shows that after the projectile penetrated the rock target, there were obvious crater regions, tunnel areas, compaction areas, plug blocks and cracks on the target. When the projectile hits the target, it produced a strong impact force. The projectile was squeezed into the target, resulting in the fragmentation of nearby rocks into fine particles. Then, it was squeezed between the projectile and the undamaged target and compacted to form a compaction area (red area in the figure). As the impact force of the projectile decreased with increasing penetration depth, the farther away it was from the projectile surface, the smaller the diameter of the compaction area. With increasing projectile impact velocity, the diameter of the compaction area of the red sandstone target increased slightly, and the diameter of the compaction area of the limestone target obviously increased. The diameter of the compaction area of red sandstone was generally larger than that of limestone. This was because the strength of red sandstone was less than that of limestone, and the material had a granular clastic structure, which was easier to crush.
With increasing projectile impact velocity, the penetration depth of the projectile increased gradually. When the projectile impact velocity was greater than 1000 m/s, the projectile penetrated the red sandstone target. There were large cracks across the entire target around the tunnel area, and the number of cracks gradually increased with increasing projectile impact speed. There were fewer large cracks in the red sandstone target than in the limestone target because the red sandstone material had a better energy absorption effect and did not easily form large cracks.
Figure 10 shows that when the impact speed of the projectile was 1141 m/s, the projectile penetrated the 1 m thick limestone target, an obvious blanking block was formed behind the target, and the crack extended behind the target.
Figure 11a and Figure 12a show that the limit velocity of the projectile penetrating the 1 m thick red sandstone target was 900–1000 m/s, whereas the limit velocity of the projectile penetrating the 1 m thick limestone target was 1100–1200 m/s. Taking the intermediate values for their limit speed, the anti-aggressive ability of limestone compared with that of red sandstone increased by 23.8%.
Figure 11b and Figure 12b show the curves of the velocity of the projectile penetrating the red sandstone and limestone targets with time. The curves of the projectile penetrating velocity with time were basically similar. When the impact velocity was 1000 m/s, the residual velocity after the projectile penetrated the target was 146 m/s; when the impact velocity was 1107 m/s, the residual velocity after the projectile penetrated the target was 220 m/s.
Figure 11c and Figure 12c show the time-varying curves of the acceleration of the projectile penetrating the red sandstone and limestone targets with time. The time-varying curve of the acceleration of the projectile penetrating the red sandstone target was similar to that of the limestone target. In the process of penetration, the acceleration of the projectile first increased sharply, then decreased at a faster speed, and then decreased slowly to 0. Regardless of the impact velocity of the projectile, the maximum acceleration of the projectile occurred when the projectile just entered the target. The higher the projectile impact velocity was, the greater the maximum acceleration in the penetration process.

3.3.2. Effect of Impact Angle on Penetration Performance

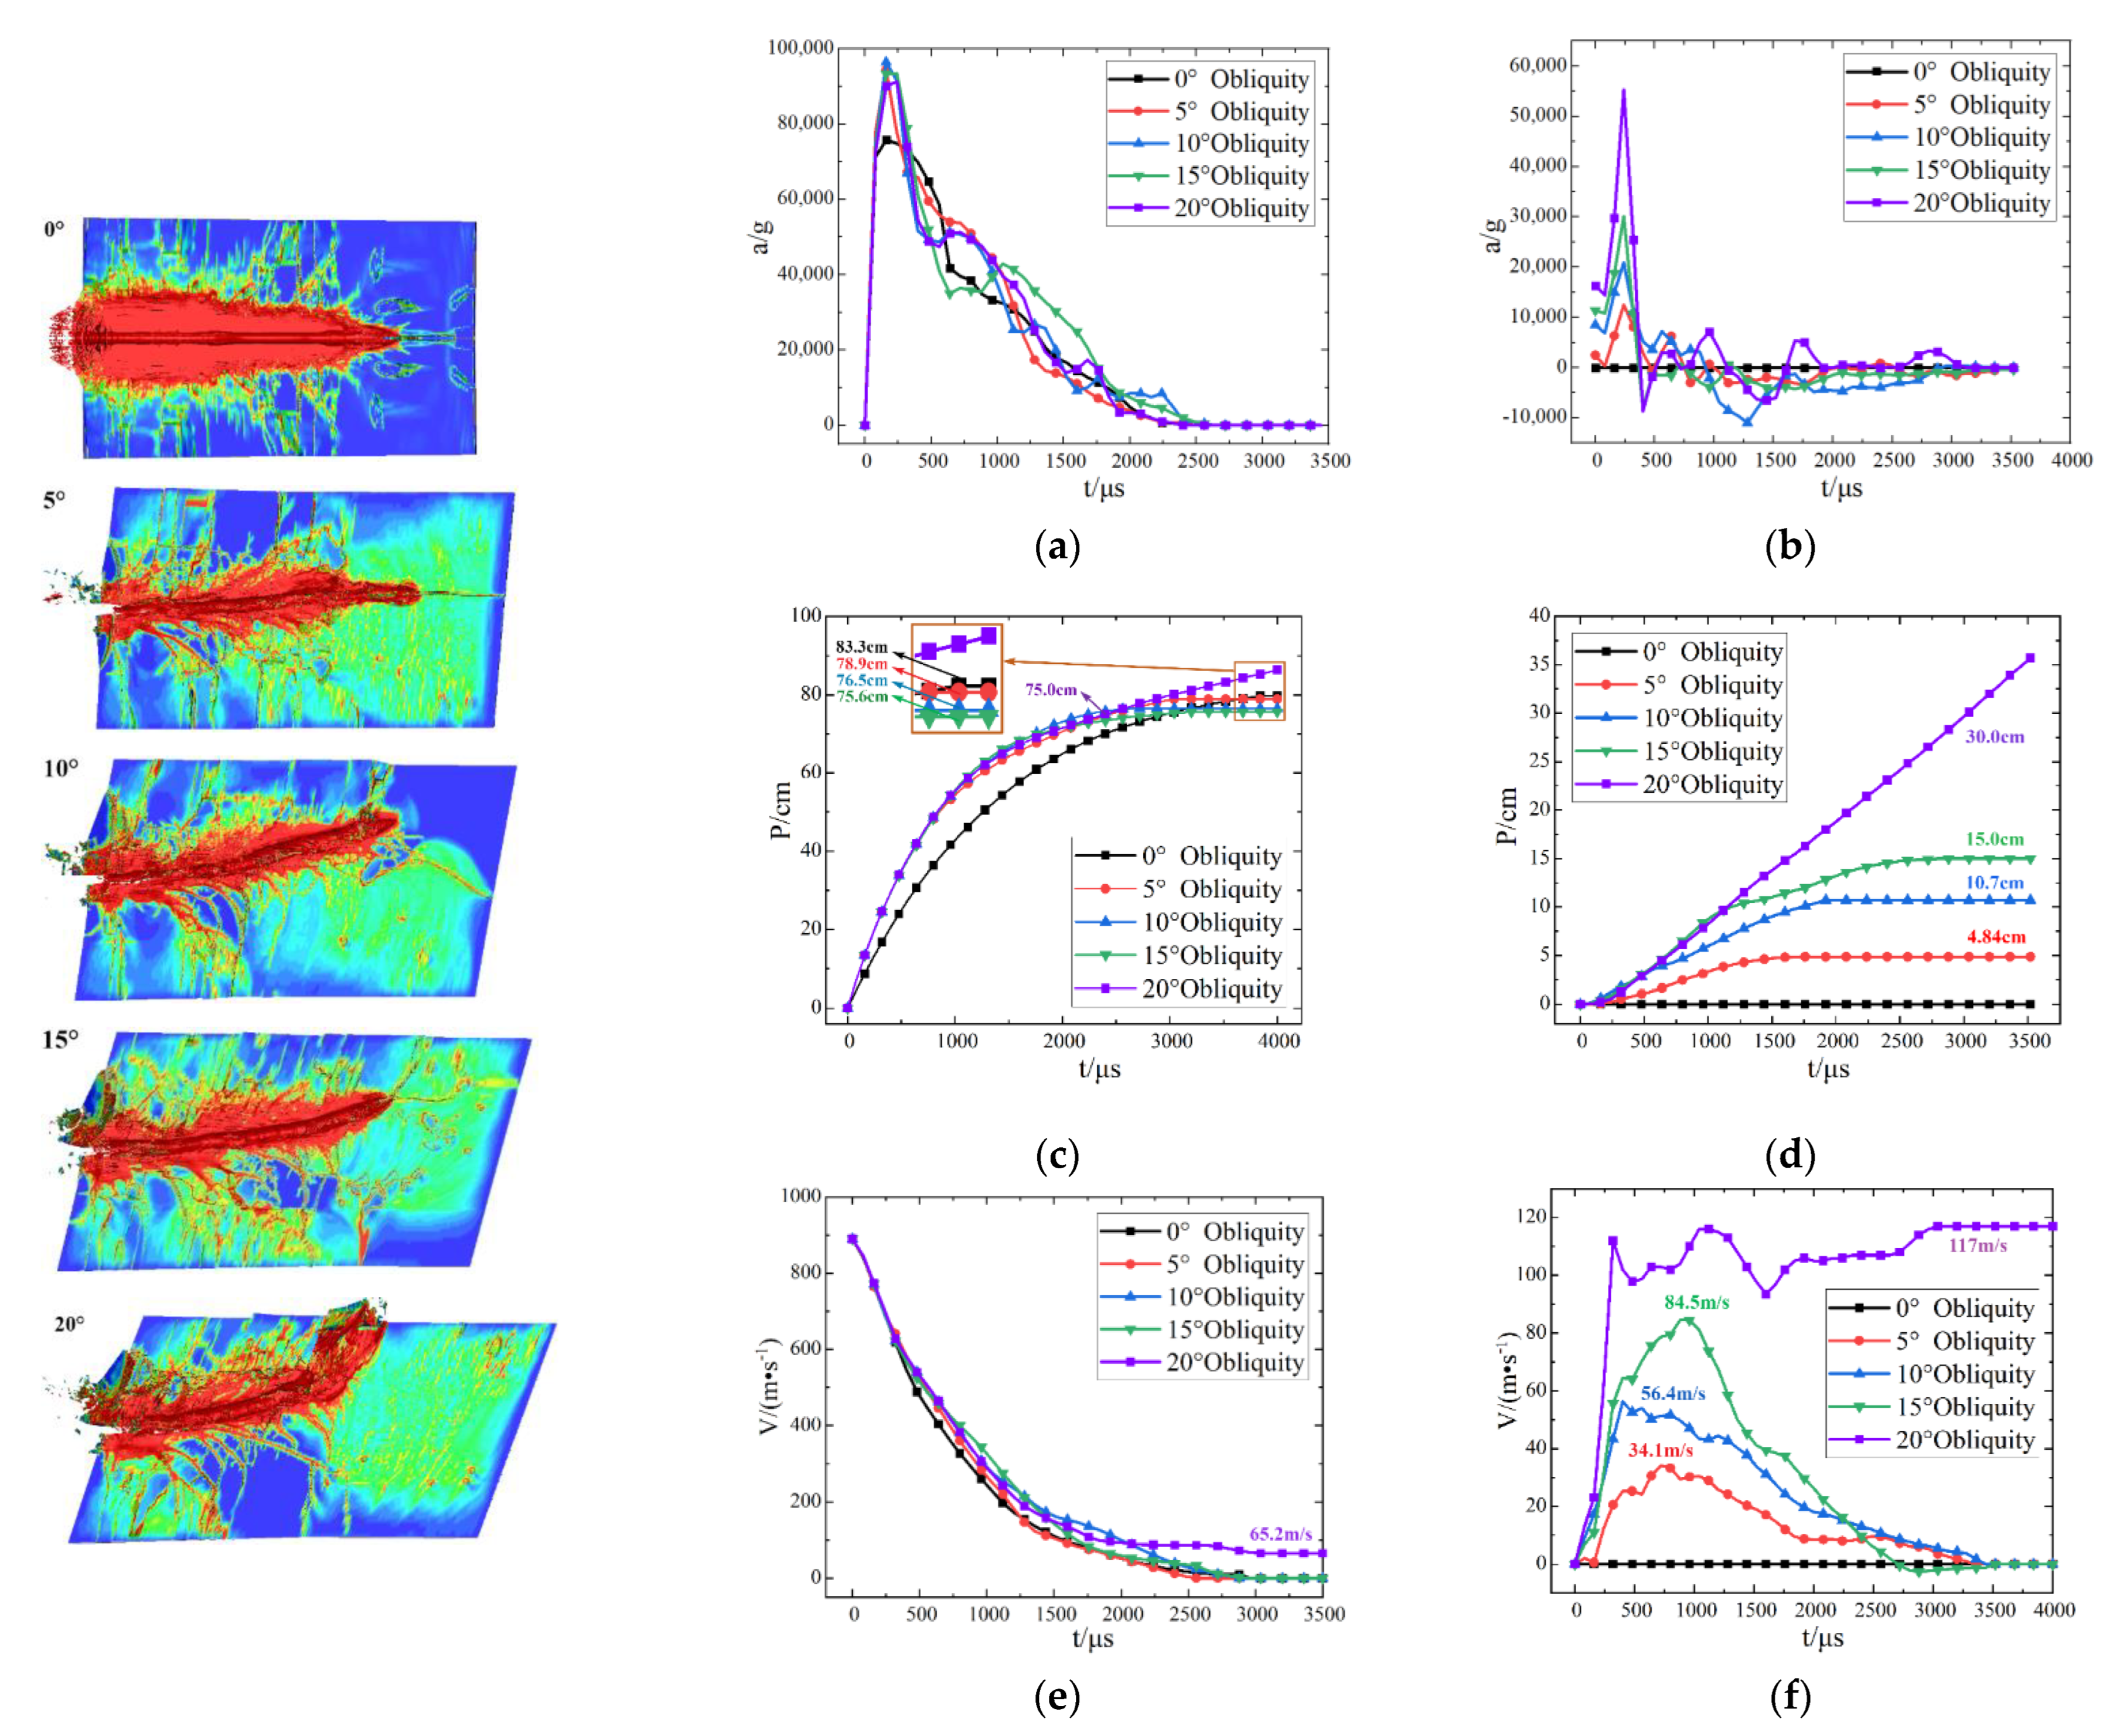
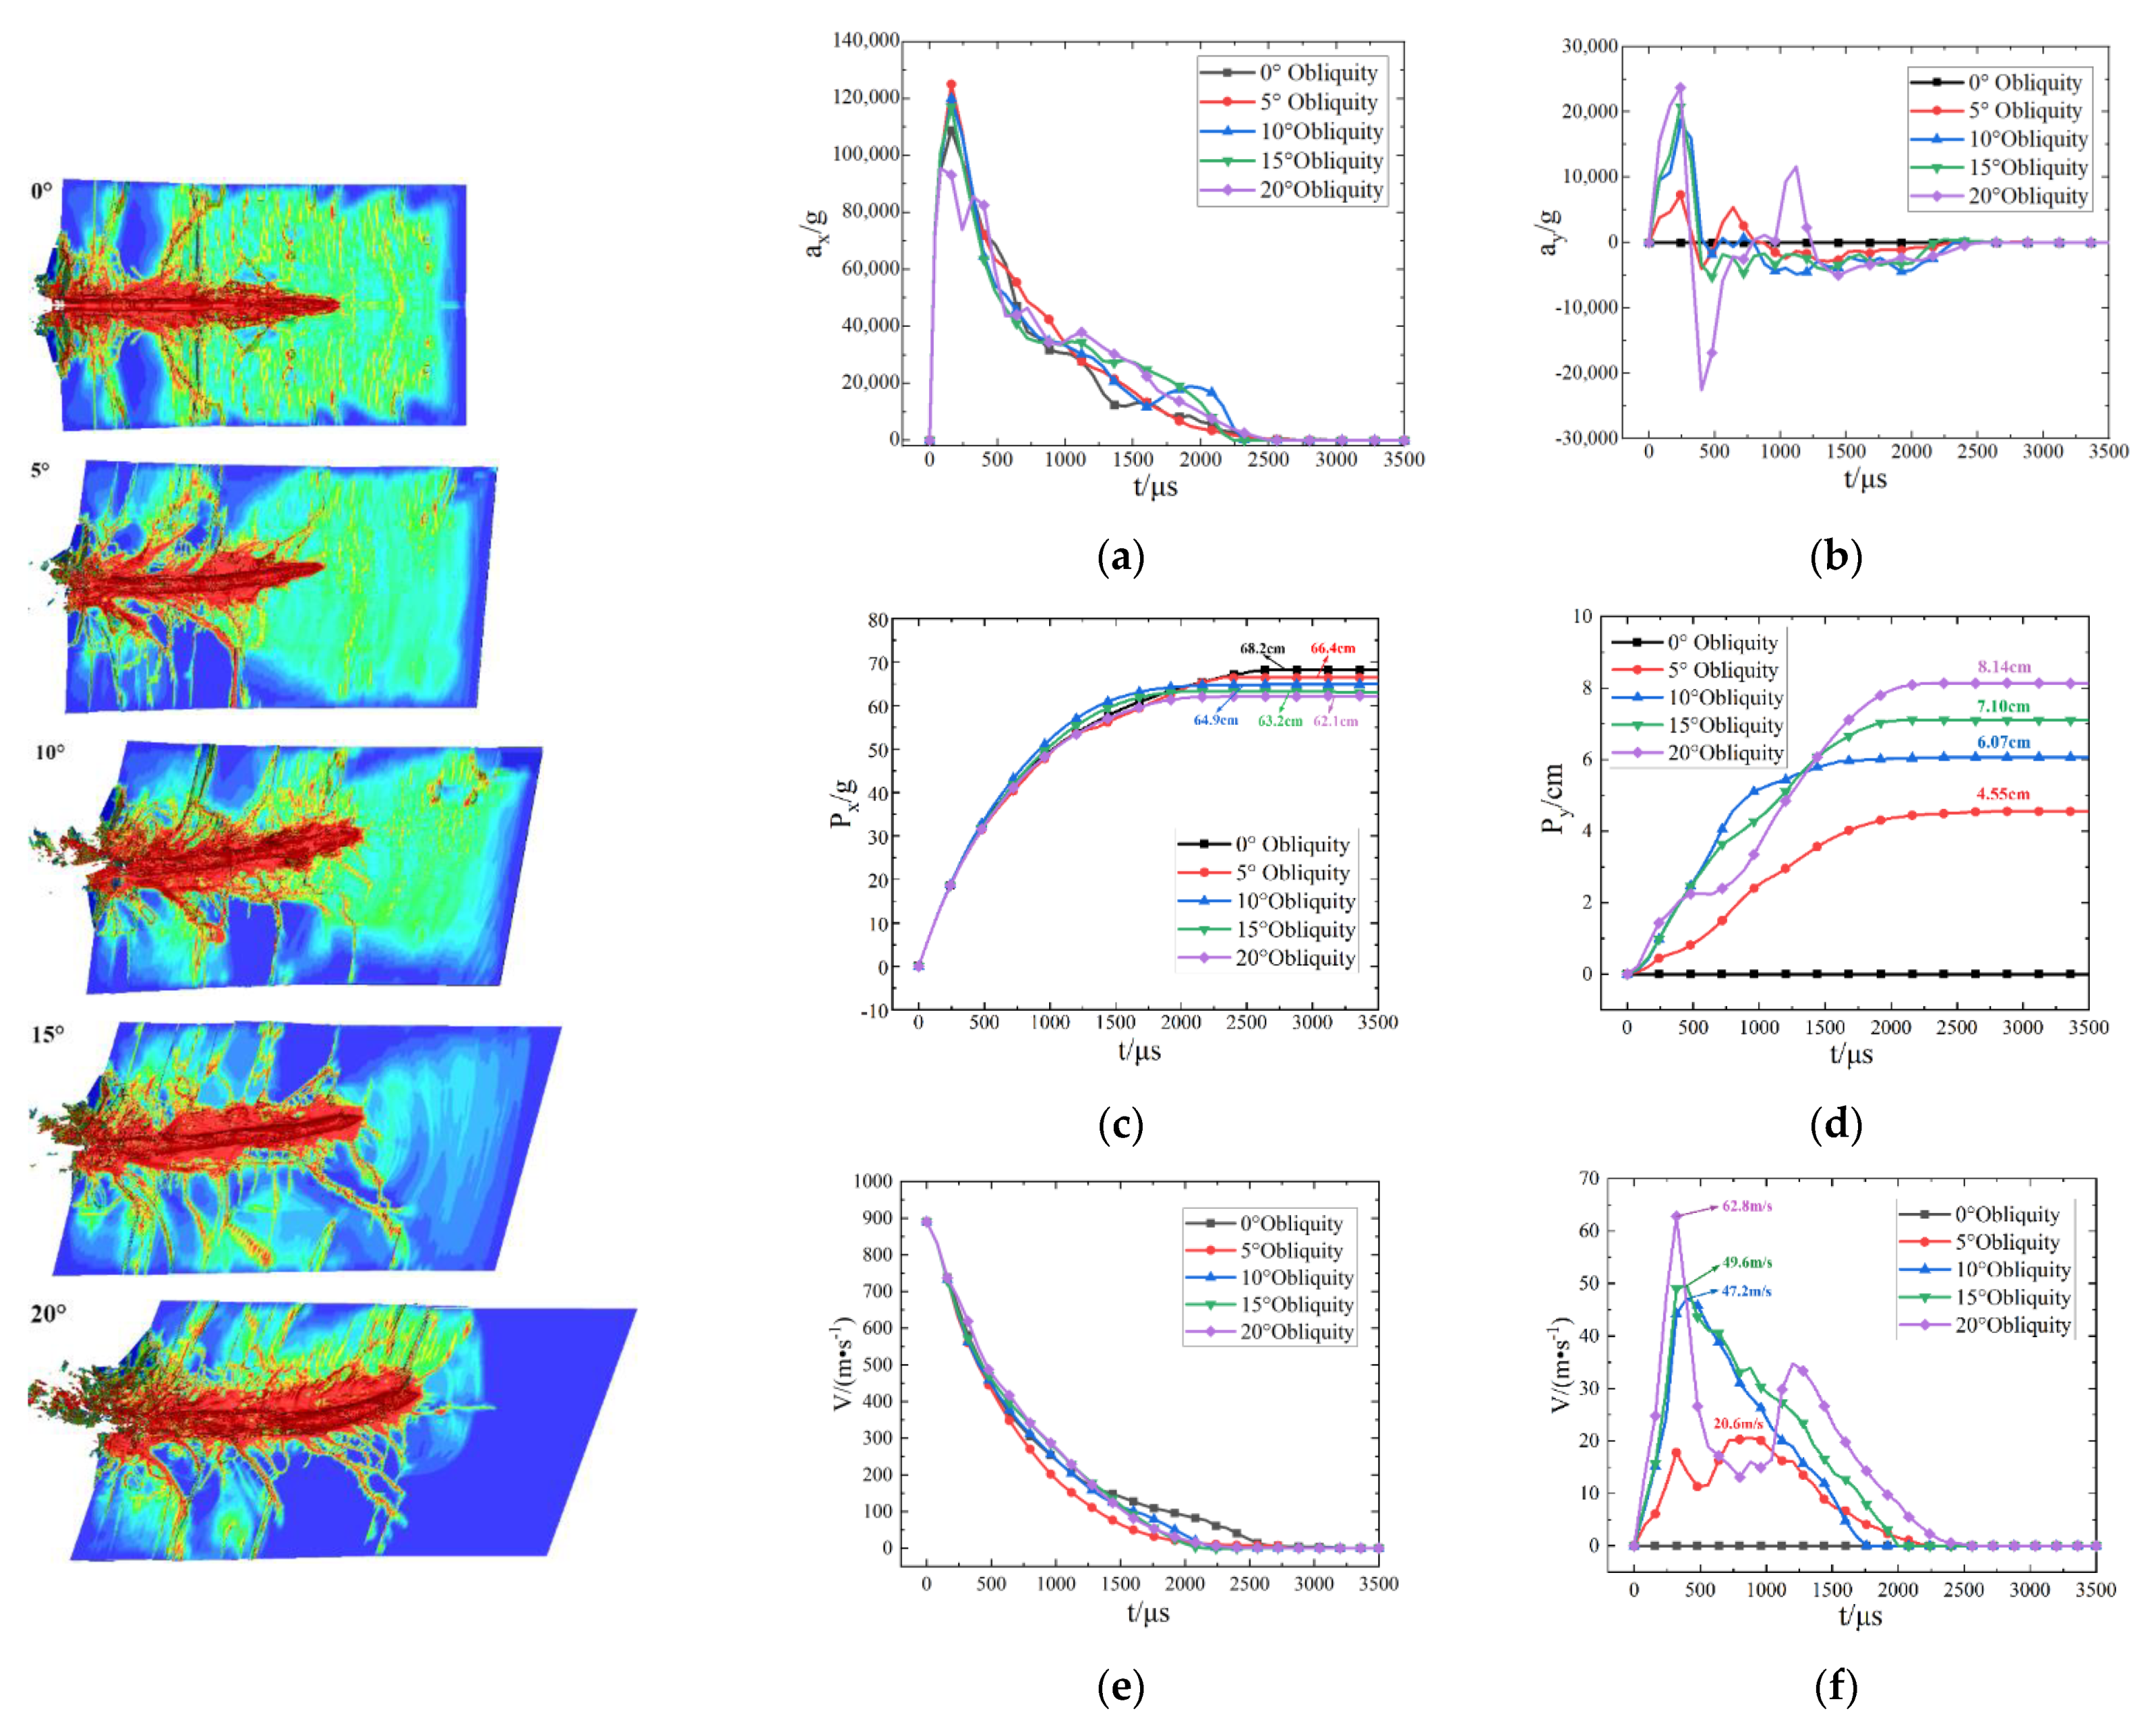
The impact velocity of the projectile was 890 m/s when the impact angle of the projectile was 0°, 5°, 10°, 15° and 20°. The crack distribution results, acceleration versus time curves, depth versus time curves and velocity versus time curves of projectiles penetrating red sandstone and limestone are shown in Figure 13 and Figure 14, respectively.
According to the damage results of the target in Figure 13 and Figure 14, the larger the impact angle of the projectile was, the more serious the path deflection of the projectile in the target. However, red sandstone was more sensitive to the impact angle of the projectile than limestone. When the impact angle of the projectile was 20°, the projectile deviated out of the target from the side. The cracks deviating from the deflection direction were generally long, and the cracks formed by the red sandstone target were fine and dense, whereas the cracks formed by the limestone target were wide and long. The larger the impact angle of the projectile was, the more serious the collapse at the opening of the target. The collapse at the opening of the limestone was more serious than that of the red sandstone. This was because the material of the red sandstone had a granular elastic structure, which has a good energy absorption effect and can be more easily compacted, whereas limestone is brittle.
Figure 13a and Figure 14a show the acceleration curves of the projectile in the X direction with time. The acceleration of the projectile penetrating limestone was larger than that of the projectile penetrating red sandstone. When the impact angle of the projectile was 5°, the maximum acceleration of the projectile was the largest, and then the maximum acceleration decreased slightly with the increasing impact angle. According to the time-varying curves of acceleration in the Y direction in Figure 13b and Figure 14b, the acceleration of the projectile penetrating red sandstone was less than that of penetrating limestone as a whole because the deflection of the projectile in the limestone target was less than that of red sandstone. With increasing projectile angle of incidence, the maximum acceleration of the projectile gradually increased.
Figure 13c and Figure 14c show the time-varying curves of the depth of the projectile in the X direction. The penetration depth of the projectile in the X direction changed as a log function with time. When the projectile penetrated the red sandstone target at an angle of 20°, the penetration depth of the projectile in the X direction first changed as a log function and then changed linearly with time because the projectile deviated from the target to the side. The penetration depth of the projectile in the X direction increased with increasing landing angle. Figure 13d and Figure 14d show the time-varying curves of the depth in the Y direction of the projectile. The penetration depth in the Y direction of the projectile decreased with increasing landing angle. The penetration resistance of limestone was stronger than that of red sandstone. Compared with limestone, red sandstone was more sensitive to changes in the projectile angle.
From the time-varying curves of the projectile velocity in Figure 13e,f and Figure 14e,f, it was found that the velocity of the projectile in the Y direction increased first and then decreased. When the projectile penetrated the limestone target, the maximum velocity in the Y direction was less than that of the red sandstone as a whole. When the projectile penetrated the red sandstone target with an impact angle of 20°, the residual velocities in the X direction and Y direction were 68.2 m/s and 117 m/s, respectively.

3.3.3. Effect of Target Material Strength on Penetration Performance

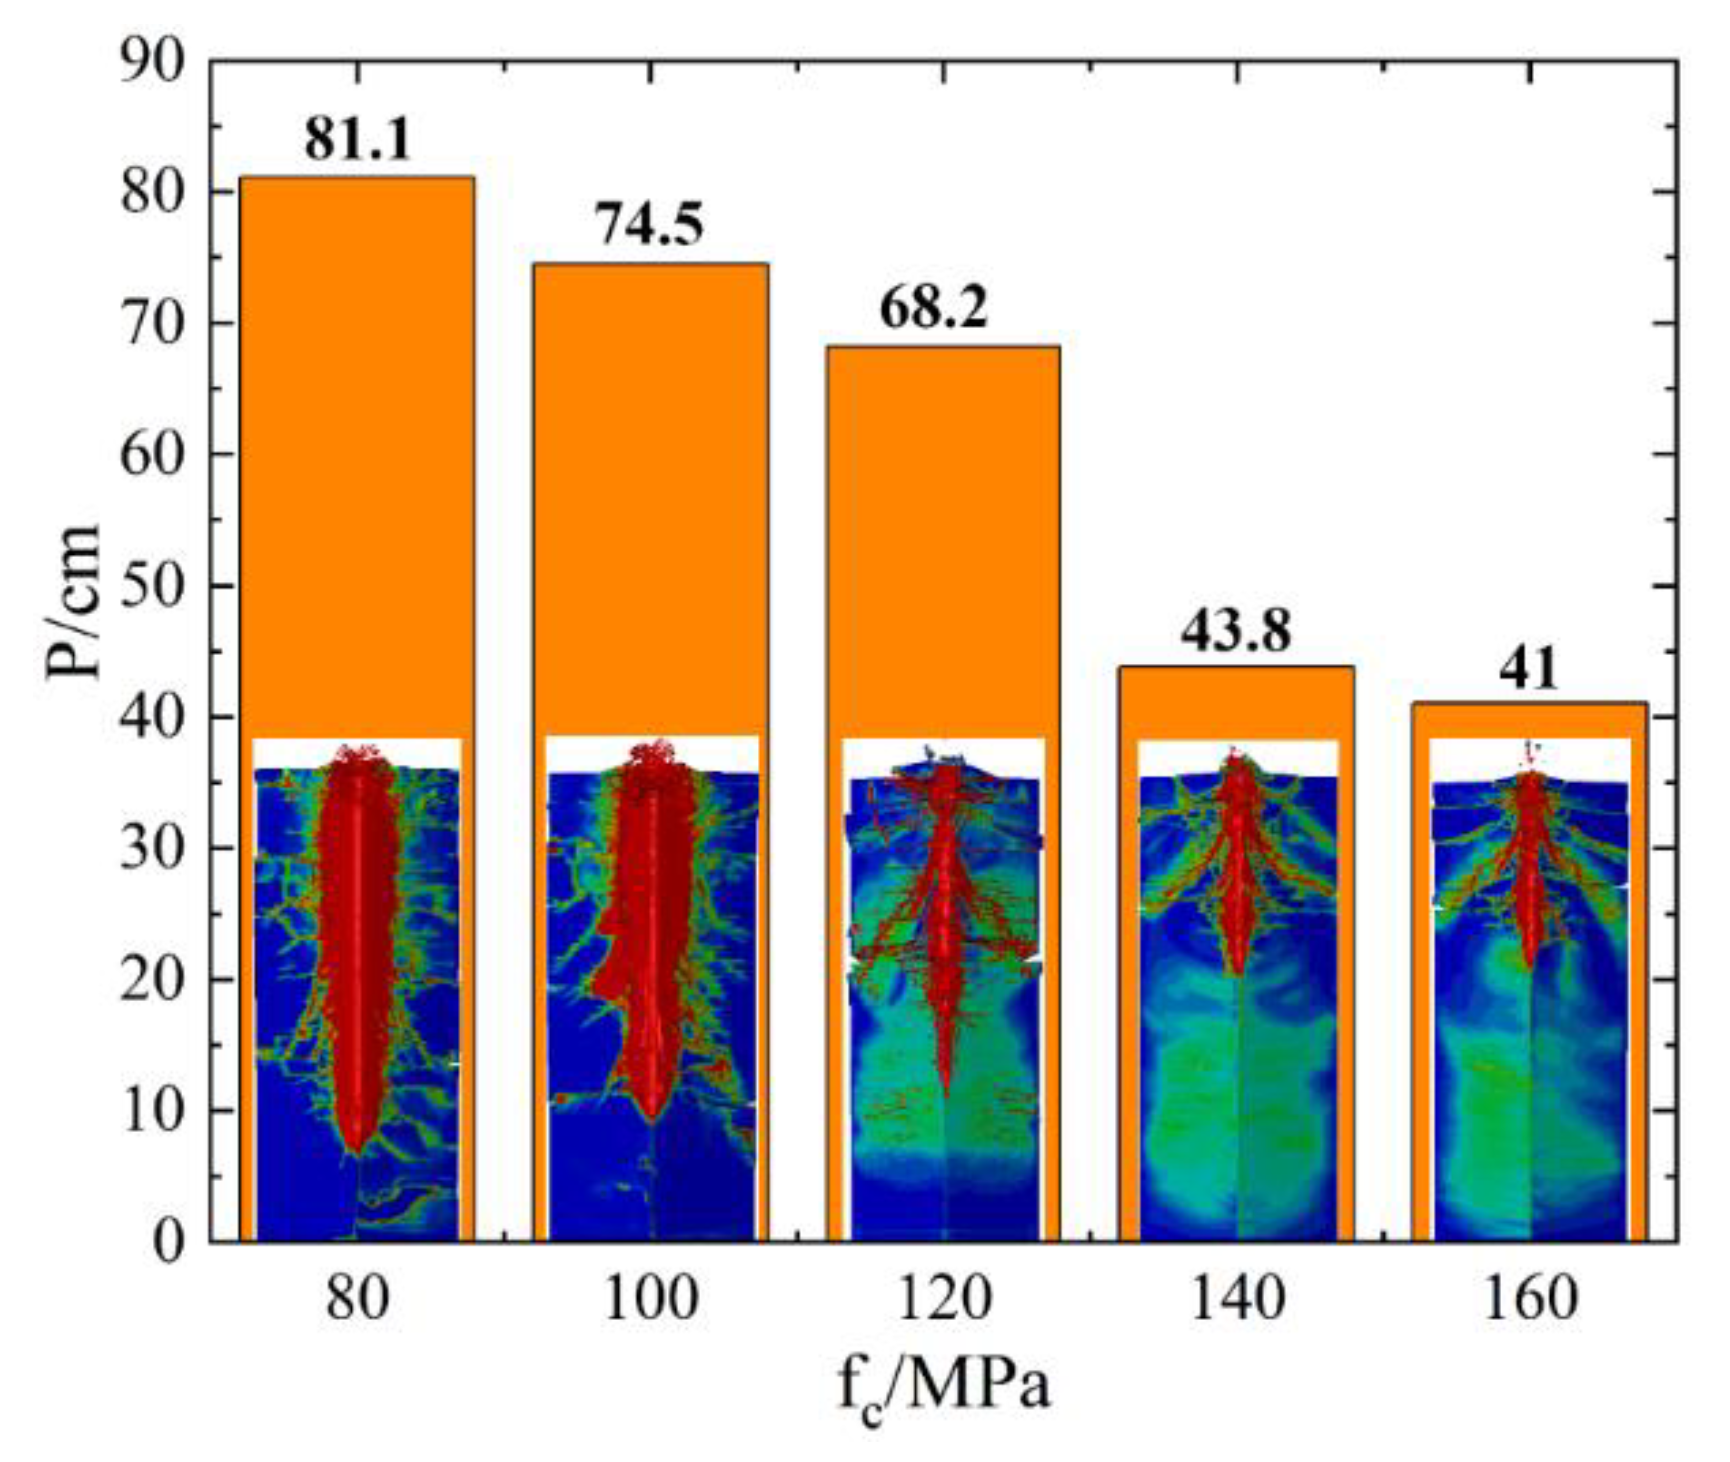
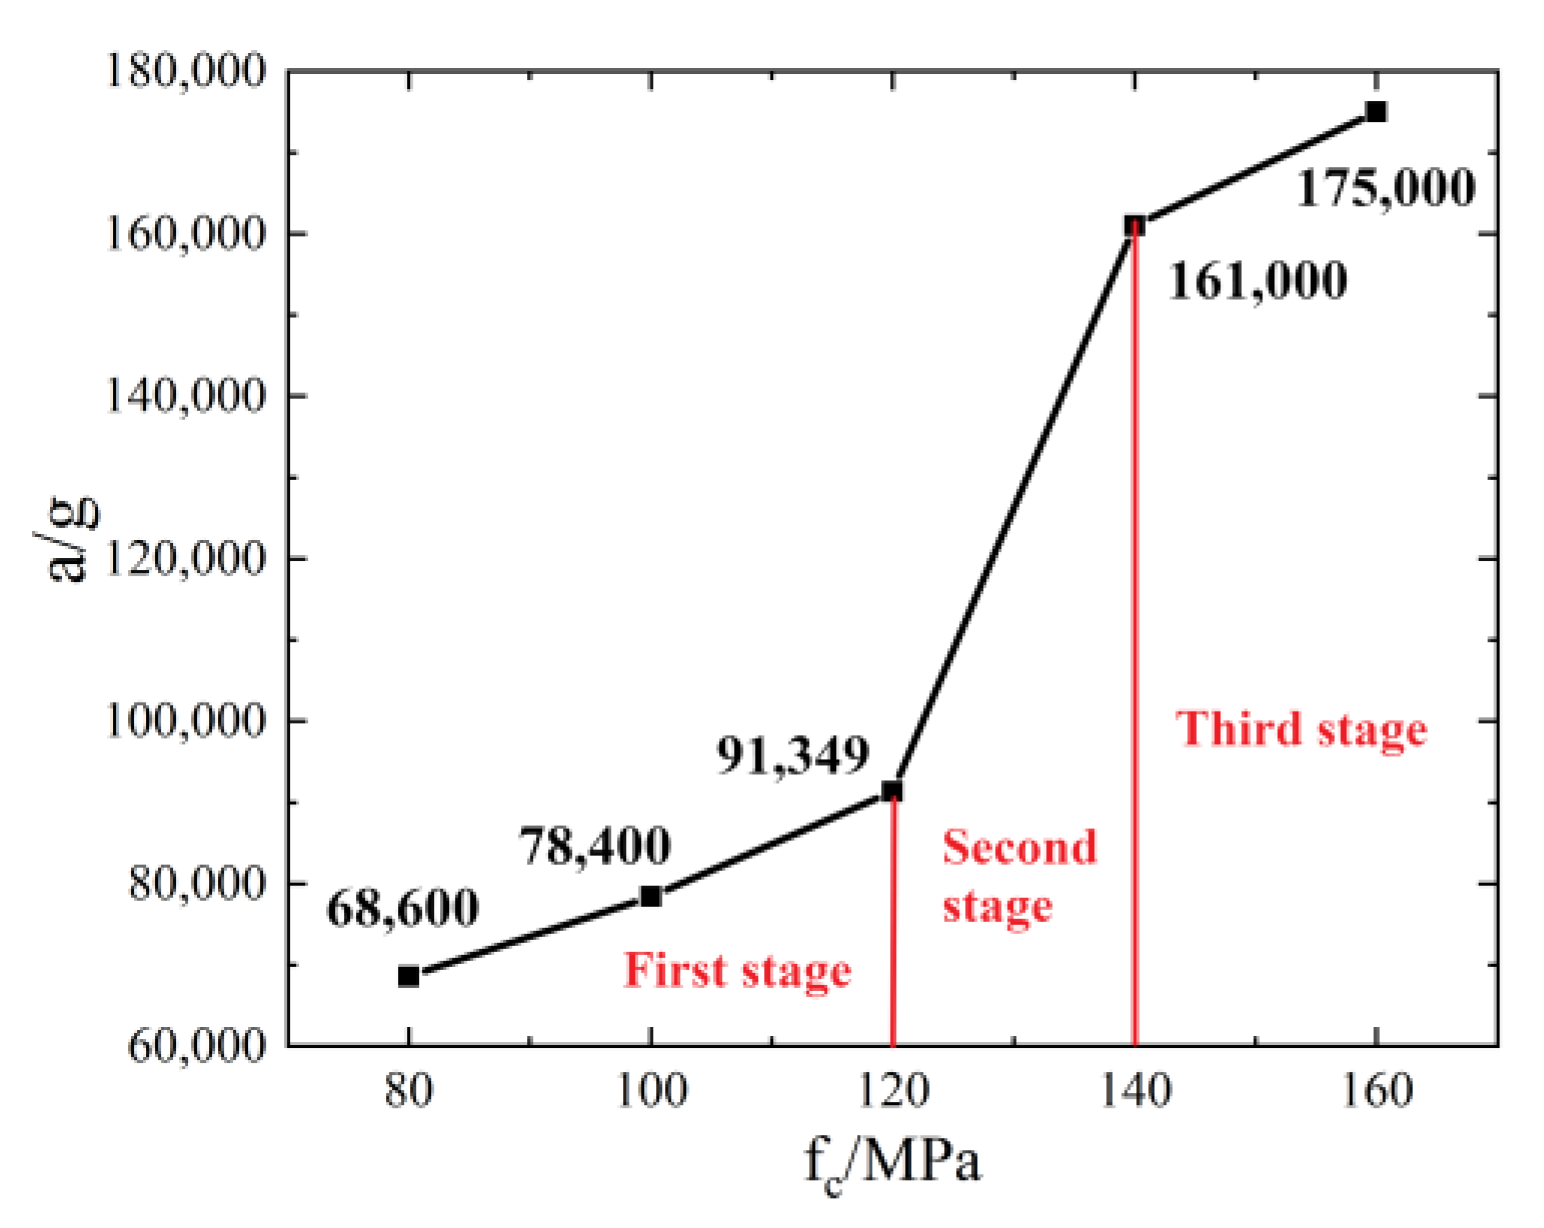
The projectile impact speed was set at 890 m/s. Penetration tests were carried out on five targets with uniaxial compressive strengths of 80 MPa, 100 MPa, 120 MPa, 140 MPa and 160 MPa. An elastoplastic model was selected for the projectile. The internal damage and penetration depth of the target are shown in Figure 15. The maximum acceleration of the target is shown in Figure 16.
Figure 15 shows that when the strength of the target was not greater than 100 MPa, the diameter of the compacted zone was large, and the cracks on the section were fine and dense. When the strength of the target was greater than 120 MPa, the diameter of the compacted zone was small, and the cracks were small and wide. When the target strength was not greater than 120 MPa, the penetration depth decreased linearly with increasing target strength. When the target strength was greater than or equal to 140 MPa, the penetration depth decreased gradually with increasing target strength. The penetration depth decreased sharply from 120 MPa to 140 MPa. When the target strength varied from 80 MPa to 160 MPa, the penetration depth decreased in three stages (i.e., gently decreased, sharply decreased and gently decreased).
Figure 16 shows that the penetration acceleration increased with increasing target strength, and the mode of increase was also three-staged. The first stage was from 80 MPa to 120 MPa, which was a gentle growth stage. The second stage was from 120 MPa to 140 MPa, which was a period of rapid growth. The third stage was from 140 MPa to 160 MPa, which was a flat growth stage, in which the acceleration growth rate was similar to that of the first stage. The trend of the acceleration increasing with the target strength was similar to that of the depth decreasing with the target strength in Figure 16, which was in a three-section form.

4. Conclusions

In this paper, the damage characteristics of red sandstone and limestone targets under different impact velocities were studied by means of experiments, numerical simulations and Forrestal semiempirical penetration calculations. The following conclusions were obtained within the scope of this paper:
(1)
As the target speed increases, the number of cracks in the same region increases. At the same speed, since the energy absorption effect of limestone is weaker than that of red sandstone, the cracks formed on the limestone target are few and wide, whereas the cracks formed on the red sandstone target are dense and fine.
(2)
At the same speed, the impact angle of the projectile has little effect on the axial penetration depth and acceleration but has obvious effect on the radial penetration depth and acceleration. Compared with limestone, red sandstone is more sensitive to the impact angle of the projectile.
(3)
The limit velocity of the projectile penetrating the 1 m-thick red sandstone target was 900–1000 m/s, whereas the limit velocity of the projectile penetrating the 1 m-thick limestone target was 1100–1200 m/s. Therefore, the penetration resistance of limestone is approximately 23.8% stronger than that of red sandstone.
(4)
The numerical simulation results are in good agreement with the experimental results, and the error is less than 10%.
(5)
When the target strength changes from 80 MPa to 160 MPa, the depth of the invasion decreases in three stages (i.e., a gentle drop, a sharp drop and a gentle decline), and the invasive acceleration is a three-stage decline (i.e., a gentle rise, a sharp rise and a gentle rise).
Through experimental and numerical simulation research in this study, the damage characteristics and damage differences between red sandstone and limestone were obtained under low-speed to medium-high-speed penetration. Additionally, the correctness of the numerical simulation model was demonstrated. This investigation provides a reference for future research studies of projectile penetration into red sandstone and limestone and has a certain significance for the development of projectile design and underground protection technology.

Author Contributions

Conceptualization, X.Z. (Xiaojing Zhang) and W.Y.; data curation, X.Z. (Xiaojing Zhang) and W.Y.; formal analysis, X.Z. (Xiaojing Zhang), W.Y., X.W., W.Z., Z.L., H.H. and X.Z. (Xintao Zhu); funding acquisition, W.Y.; investigation, X.Z. (Xiaojing Zhang); supervision, W.Y.; writing—original draft, X.Z. (Xiaojing Zhang); writing—review and editing, X.Z. (Xiaojing Zhang) and W.Y. All authors have read and agreed to the published version of the manuscript.

Funding

This research received no external funding.

Institutional Review Board Statement

Not applicable.

Informed Consent Statement

Not applicable.

Data Availability Statement

The data presented in this study are available on request from the corresponding author.

Conflicts of Interest

The authors declare no conflict of interest.

References

  1. Wang, M. Ground Penetration Damage and Engineering Protection of Ultra-High-Speed Kinetic Energy Weapons; Science Press: Beijing, China, 2021; pp. 3–12. [Google Scholar]
  2. Zuo, K.; Zeng, X.; Wang, Q.; Li, L. Second Time Penetration of Earth-penetrating Model Projectile in Rock Medium. J. PLA Univ. Sci. Technol. (Nat. Sci. Ed.) 2007, 6, 626–629. [Google Scholar] [CrossRef]
  3. Wang, S. End-Point Effects; Science Press: Beijing, China, 2019; pp. 71–80. [Google Scholar]
  4. Lu, Z. Research on Anti-Penetration Effects of Three Kinds of Rock Media. Ph.D. Thesis, Nanjing University of Science and Technology, Nanjing, China, 2020. [Google Scholar]
  5. Mu, Z.; Zhang, W. An investigation on mass loss of ogival projectiles penetrating concrete targets. Int. J. Impact Eng. 2011, 38, 770–778. [Google Scholar] [CrossRef]
  6. Zhao, J.; Chen, X.; Jin, F.; Xu, Y. Depth of penetration of high-speed penetrator with including the effect of mass abrasion. Int. J. Impact Eng. 2010, 37, 971–979. [Google Scholar] [CrossRef]
  7. Zhang, G.X.; Qiang, H.F.; Wang, G.; Huang, Q.Z.; Yang, Y.Q. Numerical simulation of the penetration of granite at wide-range velocities with a new SPH method. AIP Adv. 2019, 9, 015220. [Google Scholar] [CrossRef] [Green Version]
  8. Wang, H.B.; Shou, L.F.; Zhang, J.X.; Tian, Y.; Ou, Z.C.; Zhou, G. Experiments and Numerical Analusis of Destructive Effects of Granite Target Under Impact of Projectile. Chin. J. Rock Mech. Eng. 2014, 33, 366–375. [Google Scholar] [CrossRef]
  9. Li, G.; Song, C.; Qiu, Y.; Wang, M. Theoretical and experimental studies on the phenomenon of reduction in penetration depth of hyper-velocity projectiles into granite. J. Rock Mech. Eng. 2018, 37, 60–66. [Google Scholar] [CrossRef]
  10. Zhang, D.Z.; Zhang, X.R.; Lin, J.D.; Tang, R.D. Penetration Experiments for Normal Impact into Granite Targets with High-strength Steel Projectile. J. Rock Mech. Eng. 2005, 24, 1612–1618. [Google Scholar] [CrossRef]
  11. Alrowaili, Z.A.; Ali, A.M.; Al-Baradi, A.M.; Al-Buriahi, M.S.; Wahab, E.A.; Shaaban, K.S. A significant role of MoO3 on the optical, thermal, and radiation shielding characteristics of B2O3–P2O5–Li2O glasses. Opt. Quantum Electron. 2022, 54, 1–19. [Google Scholar] [CrossRef]
  12. Saeed, A.; Alomairy, S.; Sriwunkum, C.; Al-Buriahi, M.S. Neutron and charged particle attenuation properties of volcanic rocks. Radiat. Phys. Chem. 2021, 184, 109454. [Google Scholar] [CrossRef]
  13. Alzahrani, J.S.; Sharma, A.; Nazrin, S.N.; Alrowaili, Z.A.; Al-Buriahi, M.S. Optical and radiation shielding effectiveness of a newly fabricated WO3 doped TeO2–B2O3 glass system. Radiat. Phys. Chem. 2022, 193, 109968. [Google Scholar] [CrossRef]
  14. Alzahrani, J.S.; Alrowaili, Z.A.; Saleh, H.H.; Hammoud, A.; Alomairy, S.; Sriwunkum, C.; Al-Buriahi, M.S. Synthesis, physical and nuclear shielding properties of novel Pb–Al alloys. Prog. Nucl. Energy 2021, 142, 103992. [Google Scholar] [CrossRef]
  15. Al-Buriahi, M.S.; Hessien, M.; Alresheedi, F.; Al-Baradi, A.M.; Alrowaili, Z.A.; Kebaili, I.; Olarinoye, I.O. ZnO–Bi2O3 nanopowders: Fabrication, structural, optical, and radiation shielding properties. Ceram. Int. 2022, 48, 3464–3472. [Google Scholar] [CrossRef]
  16. Alrowaili, Z.A.; Taha, T.A.; Ibrahim, M.; Saron, K.M.A.; Sriwunkum, C.; Al-Baradi, A.M.; Al-Buriahi, M.S. Synthesis and characterization of B2O3-Ag3PO4-ZnO-Na2O glasses for optical and radiation shielding applications. Optik 2021, 248, 168199. [Google Scholar] [CrossRef]
  17. Zhang, S.; Kong, X.; Fang, Q.; Hong, J. Numerical simulation on ground shock wave induced by projectile hypervelocity penetration into limestone target. J. Explos. Impact. 2022, 42, 1–15. [Google Scholar] [CrossRef]
  18. Wu, Y. Study on Dynamic Impact Mechanical Behavior of Porous Rock Materials Containing Water. Ph.D. Thesis, Nanjing University of Science and Technology, Nanjing, China, 2016. [Google Scholar]
  19. Yuan, F.; Prakash, V. Plate impact experiments to investigate shock-induced inelasticity in Westerly granite. Int. J. Rock Mech. Min. Sci. 2013, 60, 277–287. [Google Scholar] [CrossRef] [Green Version]
  20. Hoerth, T.; Bagusat, F.; Hiermaier, S. Hugoniot data of Seeberger sandstone up to 7 GPa. Int. J. Impact Eng. 2017, 99, 122–130. [Google Scholar] [CrossRef]
  21. Yuan, Y.; Fu, J.; Wang, X.; Shang, X. Experimental Study on Mechanical Properties of Prefabricated Single-Cracked Red Sandstone under Uniaxial Compression. Adv. Civ. Eng. 2020, 2020, 1–14. [Google Scholar] [CrossRef]
  22. Zhang, J.; Tian, Z.; Liu, H. Experimental Research of Physical and Mechanical Damage Evolution of Freeze-thaw Red Sandstone. Min. Res. Dev. 2020, 40, 79–84. [Google Scholar] [CrossRef]
  23. Yin, F.; Wang, M.; Qian, Q. Calculation of Penetration Depth to Consider Surface Fragmentation of Rock Target. Chin. J. Rock Mech. Eng. 1996, S1, 551–555. [Google Scholar]
  24. Wang, M.; Tan, K.; Wu, H.; Qian, Q. New Method of Calculation of Projectile penetration depth of earth-boring projectiles. Chin. J. Rock Mech. Eng. 2009, 28, 1863–1869. [Google Scholar]
  25. Zhu, Y.; Ren, H.; Wang, P. Mechanical properties and failure mechanism of damaged limestone under uniaxial reloading. J. Harbin Inst. Technol. 2020, 53, 119–120. [Google Scholar] [CrossRef]
  26. Li, H.; Feng, Z. Study on Triaxial Mechanical Properties of Limestone Under Different Loading Modes and Loading Rates. Min. Res. Dev. 2020, 40, 52–56. [Google Scholar] [CrossRef]
  27. Jin, J.; Cheng, Y.; Chang, X. Experimental Study on Stress Wave Propagation Characteristics in Red Sandstone under Axial Static Stress. J. Rock Mech. Eng. 2017, 36, 1939–1950. [Google Scholar] [CrossRef]
  28. Rosenberg, Z.; Vayig, Y.; Malka-Markovitz, A.; Kositski, R. The penetration of limestone targets by rigid projectiles: Revisited. Int. J. Prot. Struct. 2020, 12, 110–125. [Google Scholar] [CrossRef]
  29. Forrestal, M.J.; Hanchak, S.J. Penetration Limit Velocity for Ogive-Nose Projectiles and Limestone Targets. J. Appl. Mech. 2002, 69, 853. [Google Scholar] [CrossRef]
  30. Frew, D.J.; Forrestal, M.J.; Hanchak, S.J. Penetration Experiments with Limestone Targets and Ogive-Nose Steel Projectiles. J. Appl. Mech. 2000, 67, 841–845. [Google Scholar] [CrossRef]
  31. Forrestal, M.J.; Altman, B.S.; Cargile, J.D.; Hanchak, S.J. An empirical equation for penetration depth of ogive-nose projectiles into concrete targets. Int. J. Impact Eng. 1994, 15, 395–405. [Google Scholar] [CrossRef]
  32. Forrestal, M.J.; Frew, D.J.; Hanchak, S.J.; Brar, N.S. Penetration of grout and concrete targets with ogive-nose steel projectiles. Int. J. Impact Eng. 1996, 18, 465–476. [Google Scholar] [CrossRef] [Green Version]
  33. Antoun, T.H.; Glenn, L.A.; Walton, O.R.; Goldstein, P.; Lomov, I.N.; Liu, B. Simulation of hypervelocity penetration in limestone. Int. J. Impact Eng. 2006, 33, 45–52. [Google Scholar] [CrossRef] [Green Version]
  34. Warren, T.L.; Hanchak, S.J.; Poormon, K.L. Penetration of limestone targets by ogive-nosed VAR 4340 steel projectiles at oblique angles: Experiments and simulations. Int. J. Impact Eng. 2003, 30, 1307–1331. [Google Scholar] [CrossRef]
  35. Warren, T.L. Simulations of the penetration of limestone targets by ogive-nose 4340 steel projectiles. Int. J. Impact Eng. 2002, 27, 475–496. [Google Scholar] [CrossRef]
  36. Funari, M.F.; Greco, F.; Lonetti, P. A moving interface finite element formulation for layered structures. Compos. Part B 2016, 96, 325–337. [Google Scholar] [CrossRef]
  37. Shi, Y.; Pinna, C.; Soutis, C. Modelling impact damage in composite laminates: A simulation of intra- and inter-laminar cracking. Compos. Struct. 2014, 114, 10–19. [Google Scholar] [CrossRef]
  38. Funari, M.F.; Greco, F.; Lonetti, P.; Luciano, R.; Penna, R. An interface approach based on moving mesh and cohesive modeling in Z-pinned composite laminates. Compos. Part B Eng. 2018, 135, 207–217. [Google Scholar] [CrossRef]
  39. Bouvet, C.; Castanié, B.; Bizeul, M.; Barrau, J.J. Low velocity impact modelling in laminate composite panels with discrete interface elements. Int. J. Solids Struct. 2009, 46, 2809–2821. [Google Scholar] [CrossRef] [Green Version]
  40. Feng, C.; Huang, R. Plastic Strain Analysis of Mineral Particles in Red Sandstone. Gold Sci. Technol. 2019, 27, 557–564. Available online: https://jglobal.jst.go.jp/en/detail?JGLOBAL_ID=202002210282485785 (accessed on 9 June 2022).
  41. Cheng, H. Lithofacies and Geochemical Characteristics of Ordovician Limestone in Shuntuguole Area. Tarim Basin D; Xi’an Shiyou University: Xi’an, China, 2020. [Google Scholar]
  42. Tu, Z.; Lu, Y. Modifications of RHT material model for improved numerical simulation of dynamic response of concrete. Int. J. Impact Eng. 2010, 37, 1072–1082. [Google Scholar] [CrossRef] [Green Version]
  43. Xin, J. Sensitivity Analysis of RHT Model Parameters under Explosive Attack. Ship Electron. Eng. 2019, 39, 111–113. [Google Scholar]
  44. Nie, Z.; Peng, Y.; Chen, R.; Cai, Z.; Li, F. Sensitivity Analysis of RHT Model Parameters for Rock Materials under Penetrating Condition. Vib. Impact 2021, 40, 108–116. [Google Scholar] [CrossRef]
  45. Wang, Y. The Study of the Broken Model for Rock Mass Blasting Based on RHT Constitutive Equation. Ph.D. Thesis, China Mining University, Beijing, China, 2015. [Google Scholar]
  46. Lu, Z.; Li, W.; Yao, W.; Peng, H. Experimental Study on Compression and Fracture Characteristics of Two Kinds of Rocks Under Different Strain Rates. Chin. J. High Press. Phys. 2021, 35, 52–60. [Google Scholar]
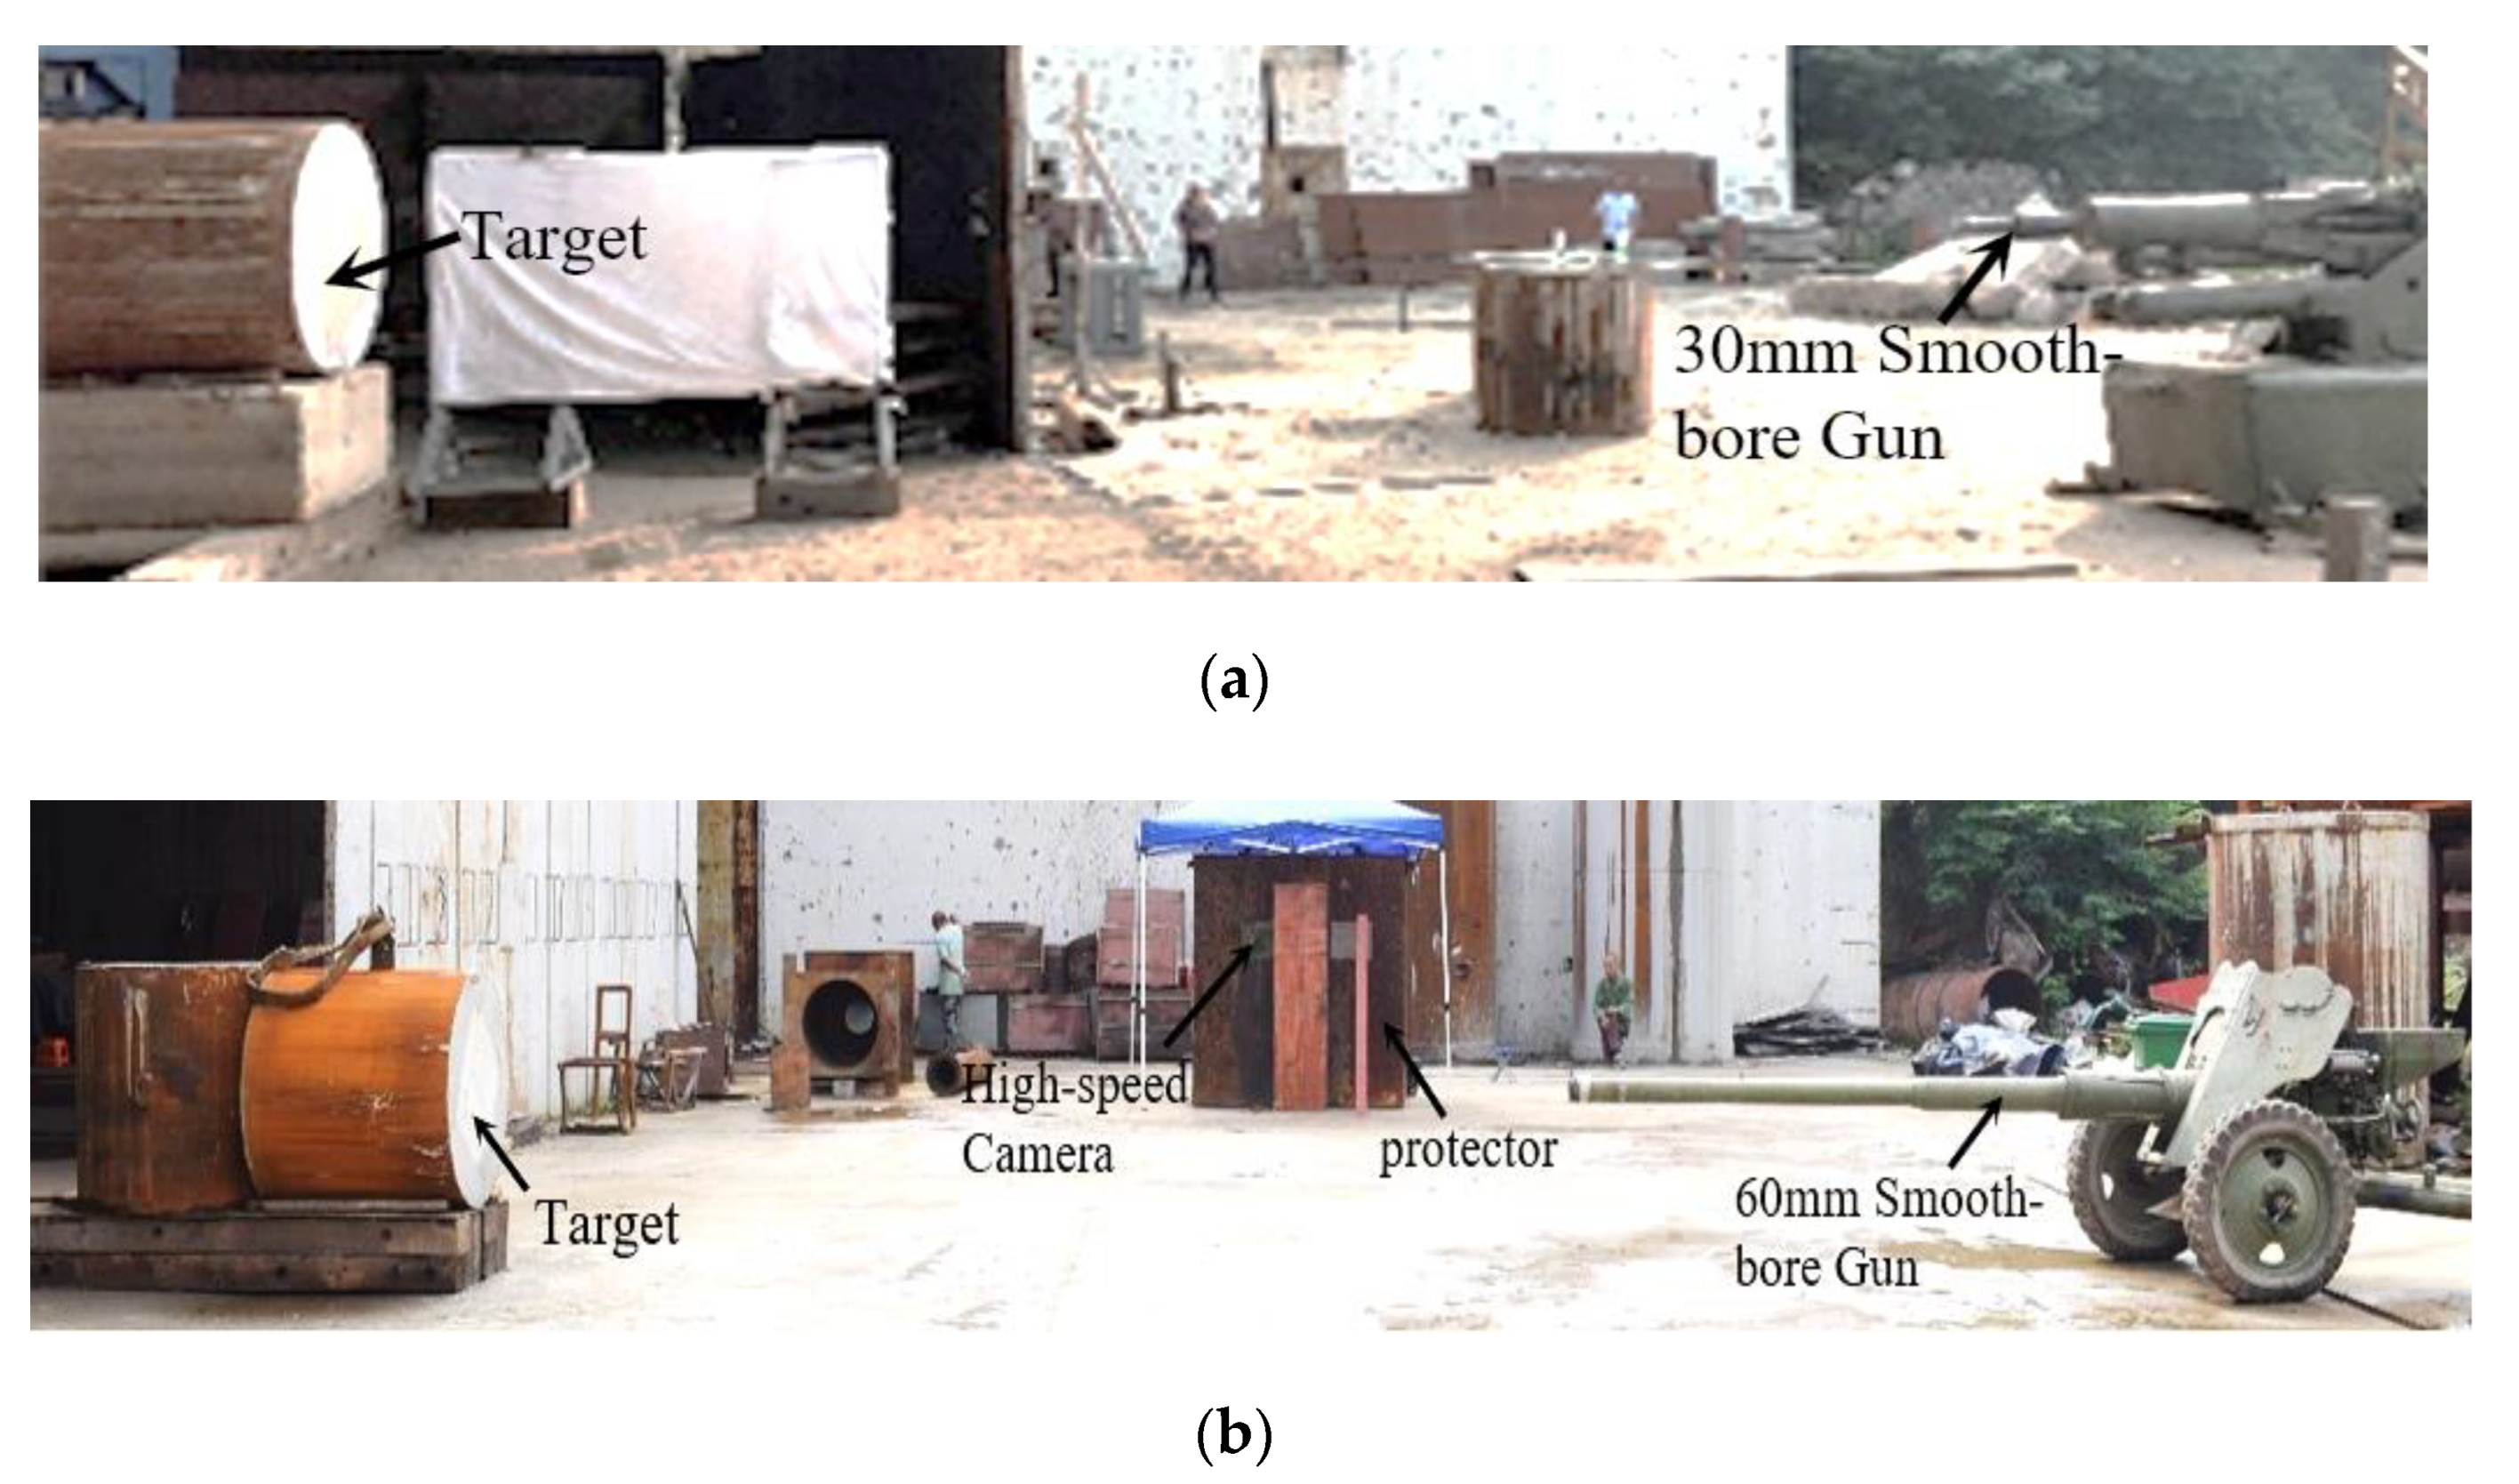
Figure 1. Test site layout: (a) 30 mm-diameter smoothbore gun; (b) 60 mm-diameter smoothbore gun.
Applsci 12 06120 g001
Figure 2. Test projectile: (a) 30 mm smoothbore gun test projectile; (b) 60 mm smoothbore gun test projectile.
Applsci 12 06120 g002
Figure 3. Test target: (a) red sandstone target; (b) limestone target.
Applsci 12 06120 g003
Figure 4. Test results: (a) penetration depth; (b) crater depth; (c) crater diameter.
Applsci 12 06120 g004
Figure 5. Red sandstone and limestone targets after tests: (ac) are red sandstone; (df) are limestone.
Applsci 12 06120 g005
Figure 6. Establishment of 3D model: (a) projectile model; (b) sectional view of target 1/4 model; (c) target impact surface 1/4 model.
Applsci 12 06120 g006
Figure 7. Effect of velocity on penetration depth.
Applsci 12 06120 g007
Figure 8. Internal crack of red sandstone target at impact velocity of 1107 m/s: (a) experimental result; (b) numerical simulation results.
Applsci 12 06120 g008
Figure 9. Internal crack of the limestone target at a projectile impact speed of 913 m/s: (a) experimental result; (b) numerical simulation results.
Applsci 12 06120 g009
Figure 10. Distribution of internal cracks in limestone after penetration at different speeds.
Applsci 12 06120 g010
Figure 11. Data of projectile penetrating red sandstone target: (a) penetration depth versus time curve; (b) penetration velocity versus time curve; (c) penetration acceleration versus time curve.
Applsci 12 06120 g011
Figure 12. Data of projectile penetration into limestone target: (a) penetration depth versus time curve; (b) penetration velocity versus time curve; (c) penetration acceleration versus time curve.
Applsci 12 06120 g012
Figure 13. Results of projectile oblique penetration into red sandstone target: (a) penetration acceleration curve in X direction; (b) penetration acceleration curve in Y direction; (c) penetration depth-variation curve in X direction; (d) penetration depth-variation curve in Y direction; (e) penetration velocity-variation curve in X direction; (f) penetration velocity-variation curve in Y direction.
Applsci 12 06120 g013
Figure 14. Results of projectile oblique penetration into limestone target: (a) penetration acceleration curve in X direction; (b) penetration acceleration curve in Y direction; (c) penetration depth-variation curve in X direction; (d) penetration depth-variation curve in Y direction; (e) penetration velocity-variation curve in X direction; (f) penetration velocity-variation curve in Y direction.
Applsci 12 06120 g014
Figure 15. Relation between penetration depth and target strength.
Applsci 12 06120 g015
Figure 16. Relation between penetration acceleration and target strength change.
Applsci 12 06120 g016
Table 1. Groups of quasistatic compression tests.
Specimen NumberStrain Rate/(s−1)Specimen Size/mmCompressive Strength/MPa
Red Sandstone-12 × 10−4 41.3 × 79.6 59.12
Red Sandstone-22 × 10−4 40.5 × 79.5 58.28
Red Sandstone-32 × 10−3 41.9 × 79.4 50.89
Limestone-12 × 10−4 42.5 × 80.0 110.79
Limestone-22 × 10−4 41.9 × 80.0 114.48
Limestone-32 × 10−3 42.3 × 79.9 126.80
Table 2. Splitting test grouping.
SpecimenCompression Speed/(m·s−1)Diameter/mmThickness/mmTensile Strength/MPa
Red Sandstone-12.0 × 10−749.0825.901.51
Red Sandstone-22.0 × 10−749.3625.801.11
Red Sandstone-32.0 × 10−750.1124.891.83
Limestone-12.0 × 10−748.2424.713.77
Limestone-22.0 × 10−748.5824.744.05
Limestone-32.0 × 10−749.4424.675.49
Table 3. Steel composition for 30CrMnSiNi2A.
ComponentCSiMnCrNiSP
proportion (%)0.311.081.161.071.670.0050.011
Table 4. Test scheme.
Target NumberTarget MaterialTarget Size(mm)Projectile Mass (g)Projectile Diameter (mm)Projectile Velocity (m/s)Launch Carrier
R1Red sandstone 1000 × 1000 968.83060030 mm artillery
R290060 mm artillery
R3120060 mm artillery
L1Limestone 1000 × 1000 968.83060030 mm artillery
L290060 mm artillery
L3120060 mm artillery
Table 5. Main parameters of projectile materials.
NameMaterialDensity/ ( g · c m 3 ) Young’s Modulus/GPaPoisson’s Ratio
Projectile 30CrMnSiNi2A7.852110.3
Table 6. Main parameters of limestone and red sandstone materials.
Name ρ / ( g · c m 3 ) f c / MPa f t / MPa f t * G / GPa ε p m B D 1 D 2
Red Sandstone 2.57556.101.480.02410.50.010.01050.0531
Limestone 2.651117.364.440.02816.70.0121.60.0581
Table 7. Red sandstone and limestone penetration depth data.
V(M/S) P 1 /CM P 2 /CM P 3 /CM τ 1 /% τ 2 /% τ 3 /%
Red
Sandstone
5934746.25431.601.300.03
8908190.9583.312.282.88.4
11071 *129.581 *------
Limestone 60233.535.3315.377.4612.18
9137069.7268.20.42.572.18
114198100.61942.664.086.57
Note: P 1 is the test result; P 2 is the calculation result of Forrestal formula; P 3 is the numerical simulation calculation result; * indicates that the target is penetrated; τ 1 is the error between P 1 and P 2 ; τ 2 is an error between P 1 and P 3 ; τ 3 is the error between P 2 and P 3 ; -- means no data.
Publisher’s Note: MDPI stays neutral with regard to jurisdictional claims in published maps and institutional affiliations.