Article

The Association between Cranial Base and Maxillomandibular Sagittal and Transverse Relationship: A CBCT Study

by
Nora Alhazmi
1,2,*,
Abdulaziz Almihbash
1,2,
Salman Alrusaini
1,2,
Saud Bin Jasser
1,2,
Mohammad Saleh Alghamdi
1,2,
Ziad Alotaibi
1,2,
Ahmed Mohammed Alshamrani
1,2 and
Maram Albalawi
2
1
Department of Preventive Dental Science, College of Dentistry, King Saud bin Abdulaziz University for Health Sciences, Riyadh 14611, Saudi Arabia
2
King Abdullah International Medical Research Center, Riyadh 11481, Saudi Arabia
*
Author to whom correspondence should be addressed.
Appl. Sci. 2022, 12(18), 9199; https://doi.org/10.3390/app12189199
Submission received: 28 July 2022 / Revised: 31 August 2022 / Accepted: 10 September 2022 / Published: 14 September 2022
(This article belongs to the Special Issue Applications of Three-Dimensional Technology in Health Care Sciences)

Abstract

:
The cranial base has a crucial effect on the position of the maxilla and mandible. This study aims to investigate the relationship between the cranial base sagittal and transverse dimensions in different skeletal patterns. This is a retrospective study of pre-existing CBCT images of 132 subjects (60 males and 72 females) from Saudi Arabia with a mean age of 35 years old. The grouping of the subjects was based on the ANB angle of Steiner’s analysis. One-way ANOVA was used to compare the means of the sagittal and transverse dimensions between different skeletal patterns, followed by a post hoc test for individual comparisons. Logistic regression analysis was performed to test the relationship between gender, age, and cephalometric values between the three groups. The significance level was 0.05. One-way ANOVA revealed a statistically significant difference in posterior cranial base length (p < 0.05) and total cranial base length (p < 0.05) among different skeletal patterns. Tukey’s post hoc analysis showed that skeletal class II had a smaller posterior cranial base and total cranial base length when compared to the other groups. The class II skeletal pattern has a smaller posterior cranial base and total cranial base when compared to skeletal class I and class III skeletal patterns.

1. Introduction

Skull base growth has a crucial effect on the position of the maxilla and mandible, which in turn affects the skeletal pattern and dental occlusion [1]. The cranial base forms the floor of the cranial cavity and affects the growth pattern of skull regions, which includes the nasal cavity, oral cavity, and pharynx [1]. Because of the cranial base’s impact on craniofacial functions and esthetics, the relationship between the cranial base and malocclusion has been a subject of interest for researchers for many years [2].
The cranial base has an impact on the sagittal relationship between the maxilla and mandible [3]. For instance, the cartilages formed in the anterior cranial base segment affect the formation and growth of the maxilla [4]. On the other hand, the size and shape of the posterior cranial base influence the anteroposterior position of the mandible [5]. Previous studies have investigated the cranial base and maxillomandibular relationship, but the results were inconclusive, and different hypotheses were suggested [6,7]. For example, a study found that class III malocclusion has smaller linear and angular cranial base measurements, while others failed to show a reduced cranial base length in skeletal class III [8,9]. It is important to mention that environmental context and ethnic variations in the genetic background could play a role in cranial base dimensions [10,11]. Given these controversial results, we focused on the Saudi Arabian population.
The main limitation of previous studies was the use of two-dimensional (2D) cephalometric radiographs to estimate the relationship between the three-dimensional (3D) cranial base and malocclusion [7,11]. Another limitation of the 2D cephalometric analysis was the superimposition of deep landmarks, such as Basion and Sella turcica [11]. Moreover, a meta-analysis reported no sufficient evidence regarding the relationship between the posterior cranial base and sagittal jaw discrepancies [7]. To the best of our knowledge, this is the first orthodontic research to investigate the relationship between the cranial base and maxillomandibular relationship using cone-beam computed tomography (CBCT) images. The study aims to obtain a more accurate reading by using CBCT radiographs in order to identify the relationship between the sagittal and transverse cranial base and maxillomandibular relationship. The null hypothesis in this study is that there is no association between the sagittal and transverse cranial base and maxillomandibular relationship. This study provides a vertical gain of knowledge in cranial base characteristics of different skeletal malocclusions and sets landmarks to improve orthodontic diagnosis and treatment planning. Since cranial base abnormalities might be associated with skeletal malocclusion occurrence, understanding cranial base morphological features might contribute to early diagnosis of skeletal malocclusion and create a good foundation for accurate treatment planning [12,13,14]. Therefore, this study provides various cephalometric characteristics for a specific racial group with particular reference to early orthodontic diagnosis and treatment planning.

2. Materials and Methods

The pre-existing CBCT records of 132 Saudi adults (60 male and 72 female; ages 18 to 68) were randomly selected. These records were screened and collected from the National Guard Hospital and College of Dentistry at King Saud Bin Abdulaziz University for Health Sciences in Riyadh, Saudi Arabia. The retrospective data were from 2017 until 2022. The study protocol was approved by the institutional review board of King Abdullah International Medical Research Center (KAIMRC) (SP21R/356/06). All subjects were Saudi Arabian and aged above 18 years, with pre-treatment CBCT radiographs that were taken from the same machine (Planmeca Promax 3D Proface, manufactured by Planmeca OY, Helsinki, Finland, 2015) and were obtained in a standard manner according to the manufacturer’s instructions and oriented in natural head position with teeth in maximum intercuspation. In addition, CBCT images with a volume size of 23.0 × 17.3 cm or above and a voxel size of 400 µm were included. Two technicians experienced in CBCT imaging performed the scanning procedure utilizing the same protocol. Any subject with congenital anomalies, previous jaw pathology, previous trauma to the jaws, previous orthodontic treatment, or previous orthognathic surgery treatment was excluded from the study. In addition, any CBCT images with unclear landmarks were excluded.
To standardize the 3D head orientation, we selected the Frankfort horizontal plane as our reference plane based on its common use and acceptance in orthodontics [1,15]. Following data collection, the skeletal classification was based on the ANB angle of Steiner’s analysis, and it is a clinically appropriate method [16,17]. The classification of subjects and data measurements were performed by one examiner (N.A.) since the author was the most experienced in CBCT data analysis. CBCT radiographs were divided into 3 groups using Romexis imaging software (Romexis V 6.1, Planmeca OY, Helsinki, Finland):
Group 1: skeletal class I malocclusion (1 ≤ ANB ≤ 4).
Group 2: skeletal class II malocclusion (ANB > 4).
Group 3: skeletal class III malocclusion (ANB ≤ 0).
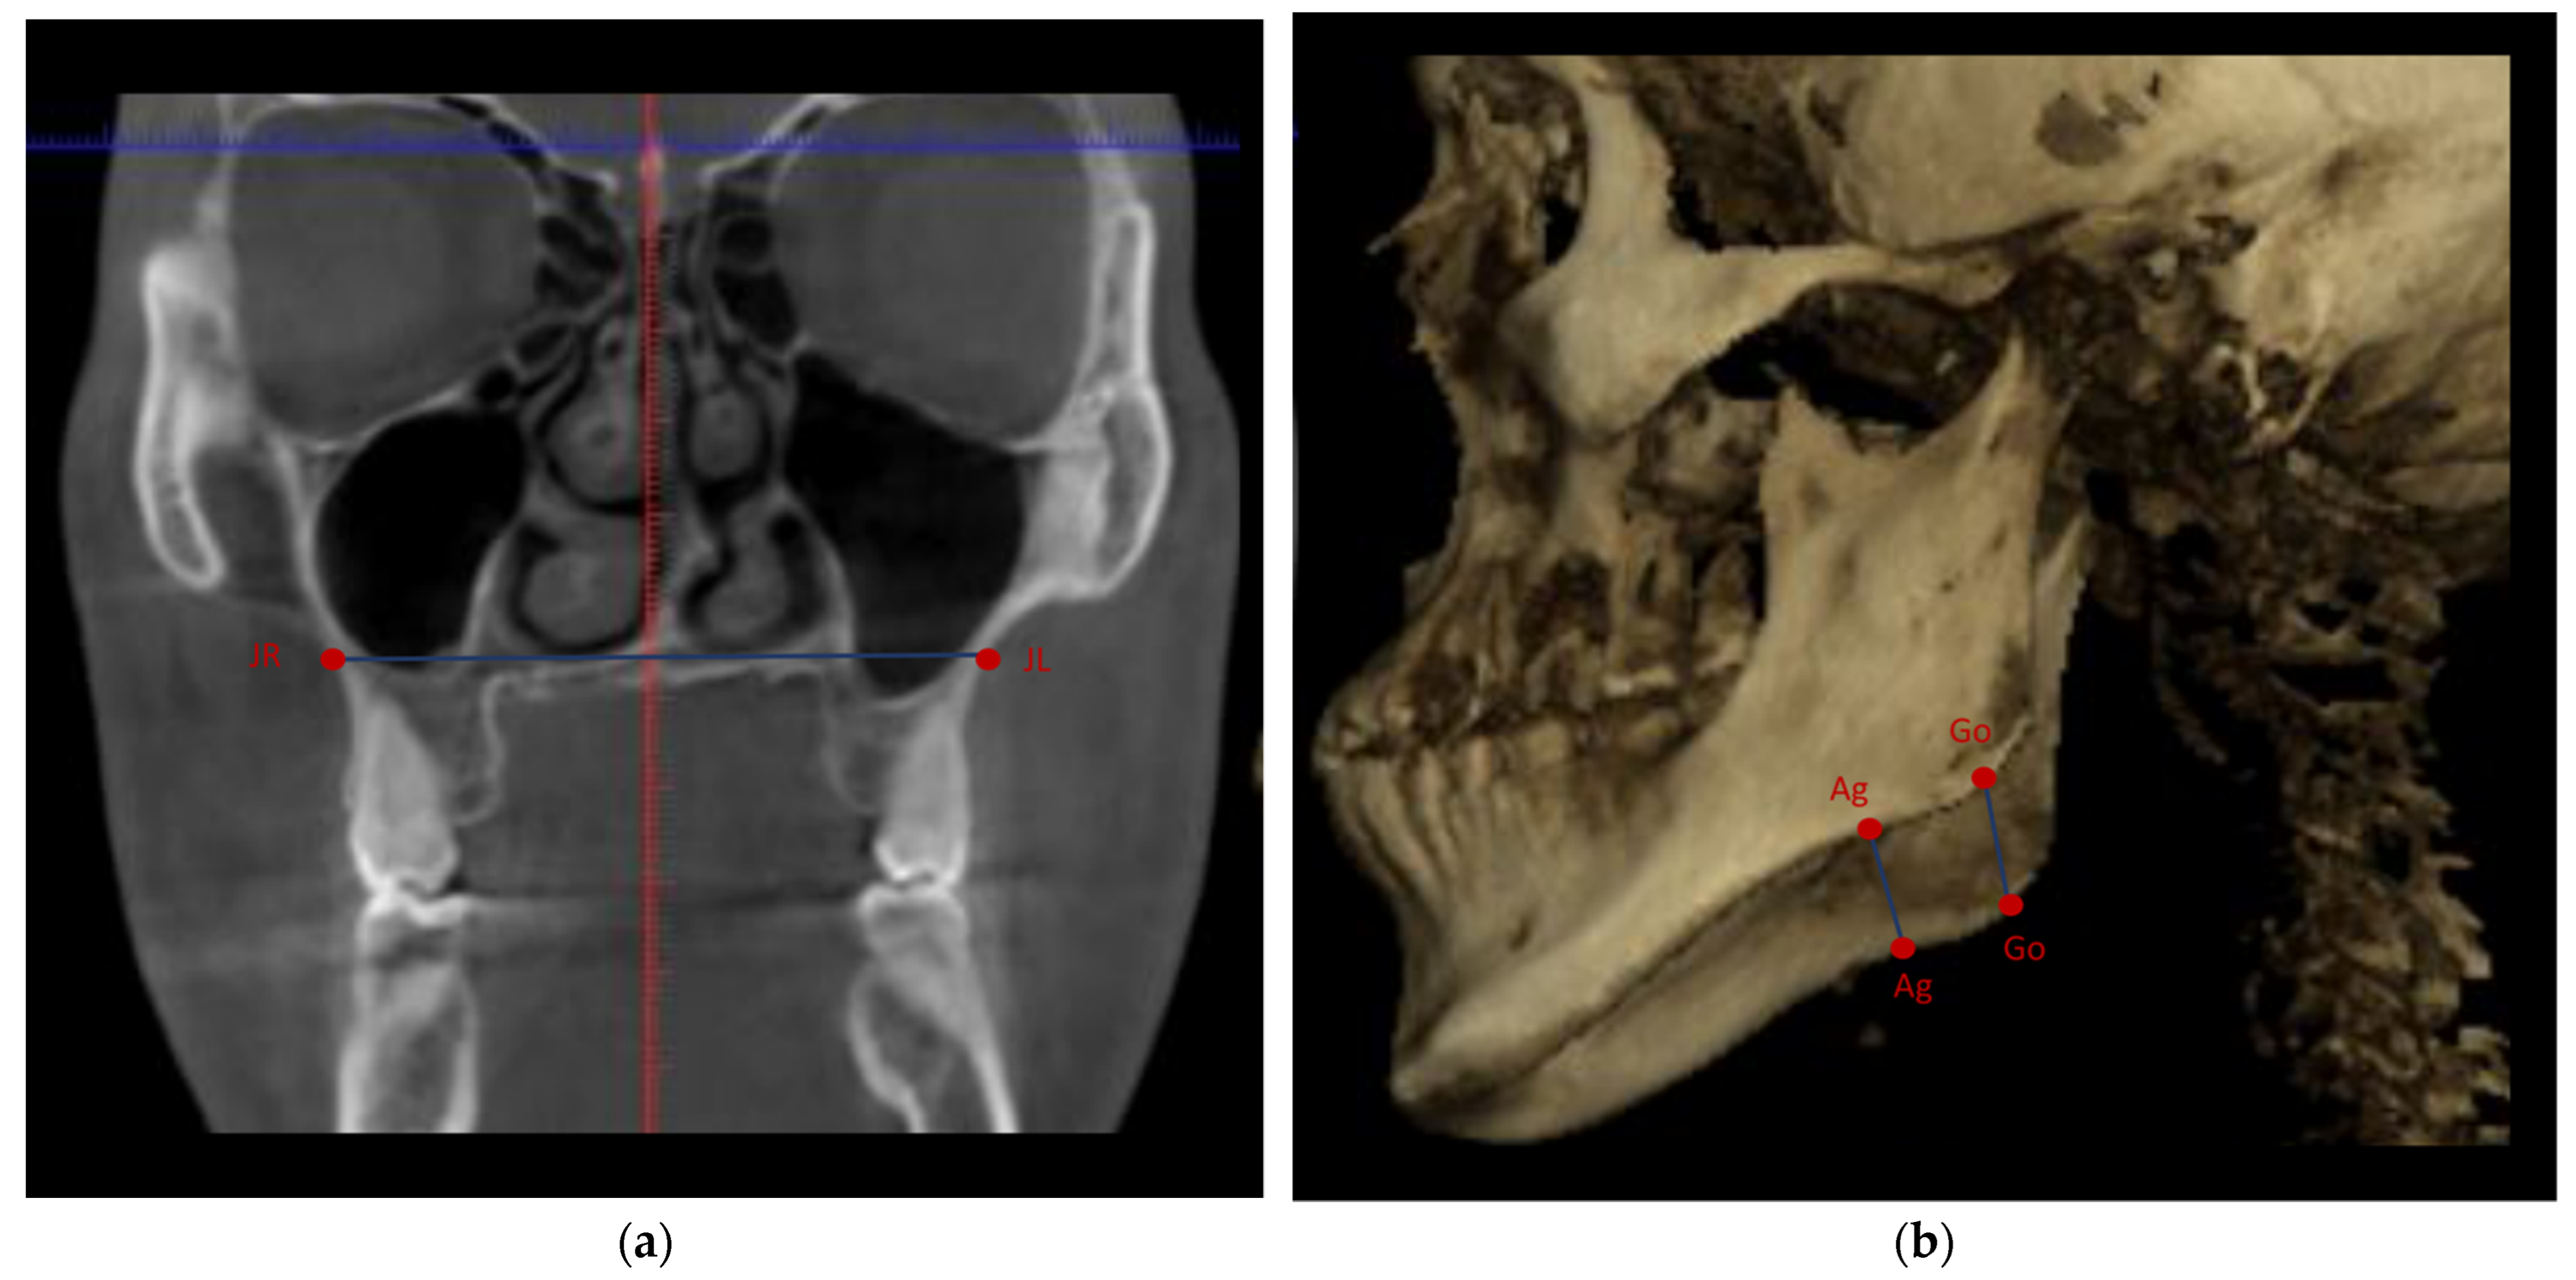
Then, the investigator (N.A.) was blinded to the skeletal groups by providing a new Microsoft Excel sheet (version 2011, Microsoft Corp., Redmond, WA, USA) without skeletal groups for cephalometric measurements. Definitions of cephalometric landmarks are presented in Table 1 and Figure 1 and Figure 2.
The distribution of the study sample per skeletal class is presented in Table 2. Table 3 demonstrates the age distribution among the skeletal groups.
Statistical analysis:
The sample size calculations were conducted using the NCSS (Number Cruncher Statistical System) 2021 and the PASS (Power Analysis and Sample Size) version 15 statistical software, based on a Kerr et al. study [8]. A sample size of 21 subjects from each skeletal group was determined to obtain a Type I error rate of 5% and 90% power. Descriptive statistics and a chi-square test were used to measure the association between gender and skeletal groups. One-way ANOVA was used to test the relationship between age and cephalometric values between the groups. Logistic regression analysis was used to study the relationship between gender, age, and cephalometric values. p values less than 0.05 were considered statistically significant.
For intra-examiner reliability, 20 CBCT scans were randomly selected 8 weeks after the initial analysis for re-measurements by the same orthodontist (N.A.). The Intraclass Correlation Coefficient (ICC) was used to test the intra-examiner reliability. All data analyses were conducted using SAS software version 9.4 (SAS Institute Inc., Cary, NC, USA).

3. Results

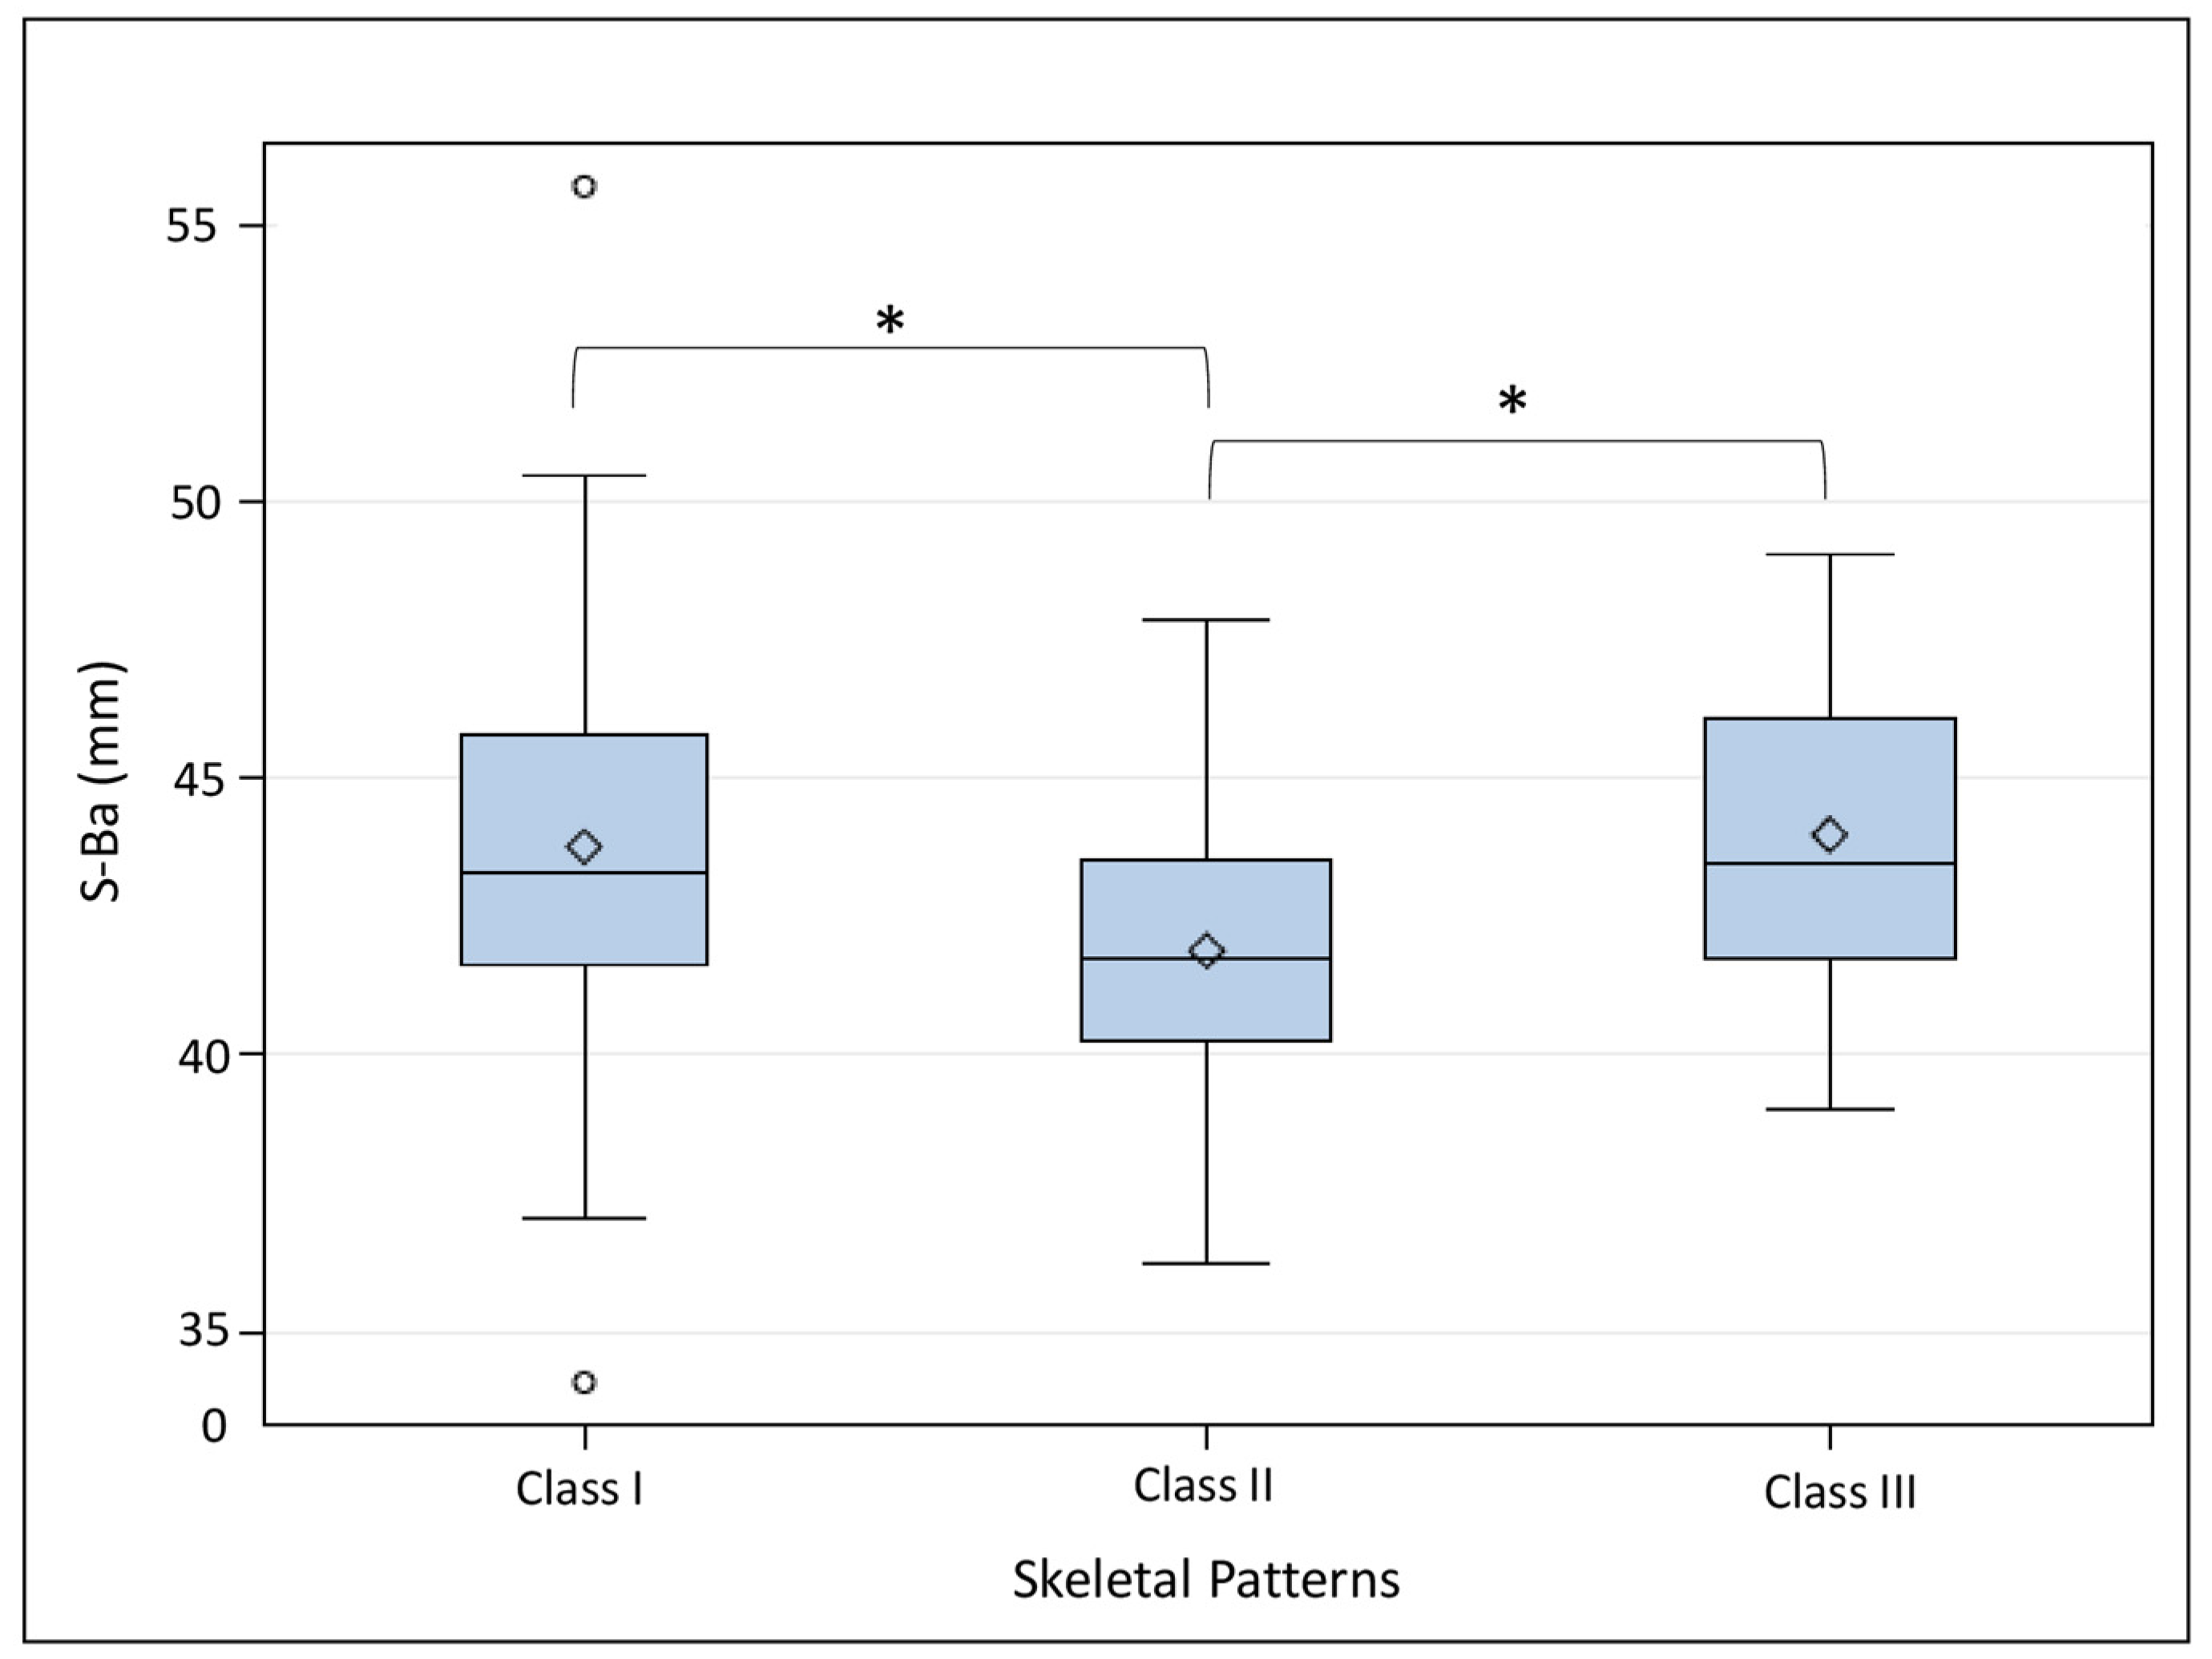
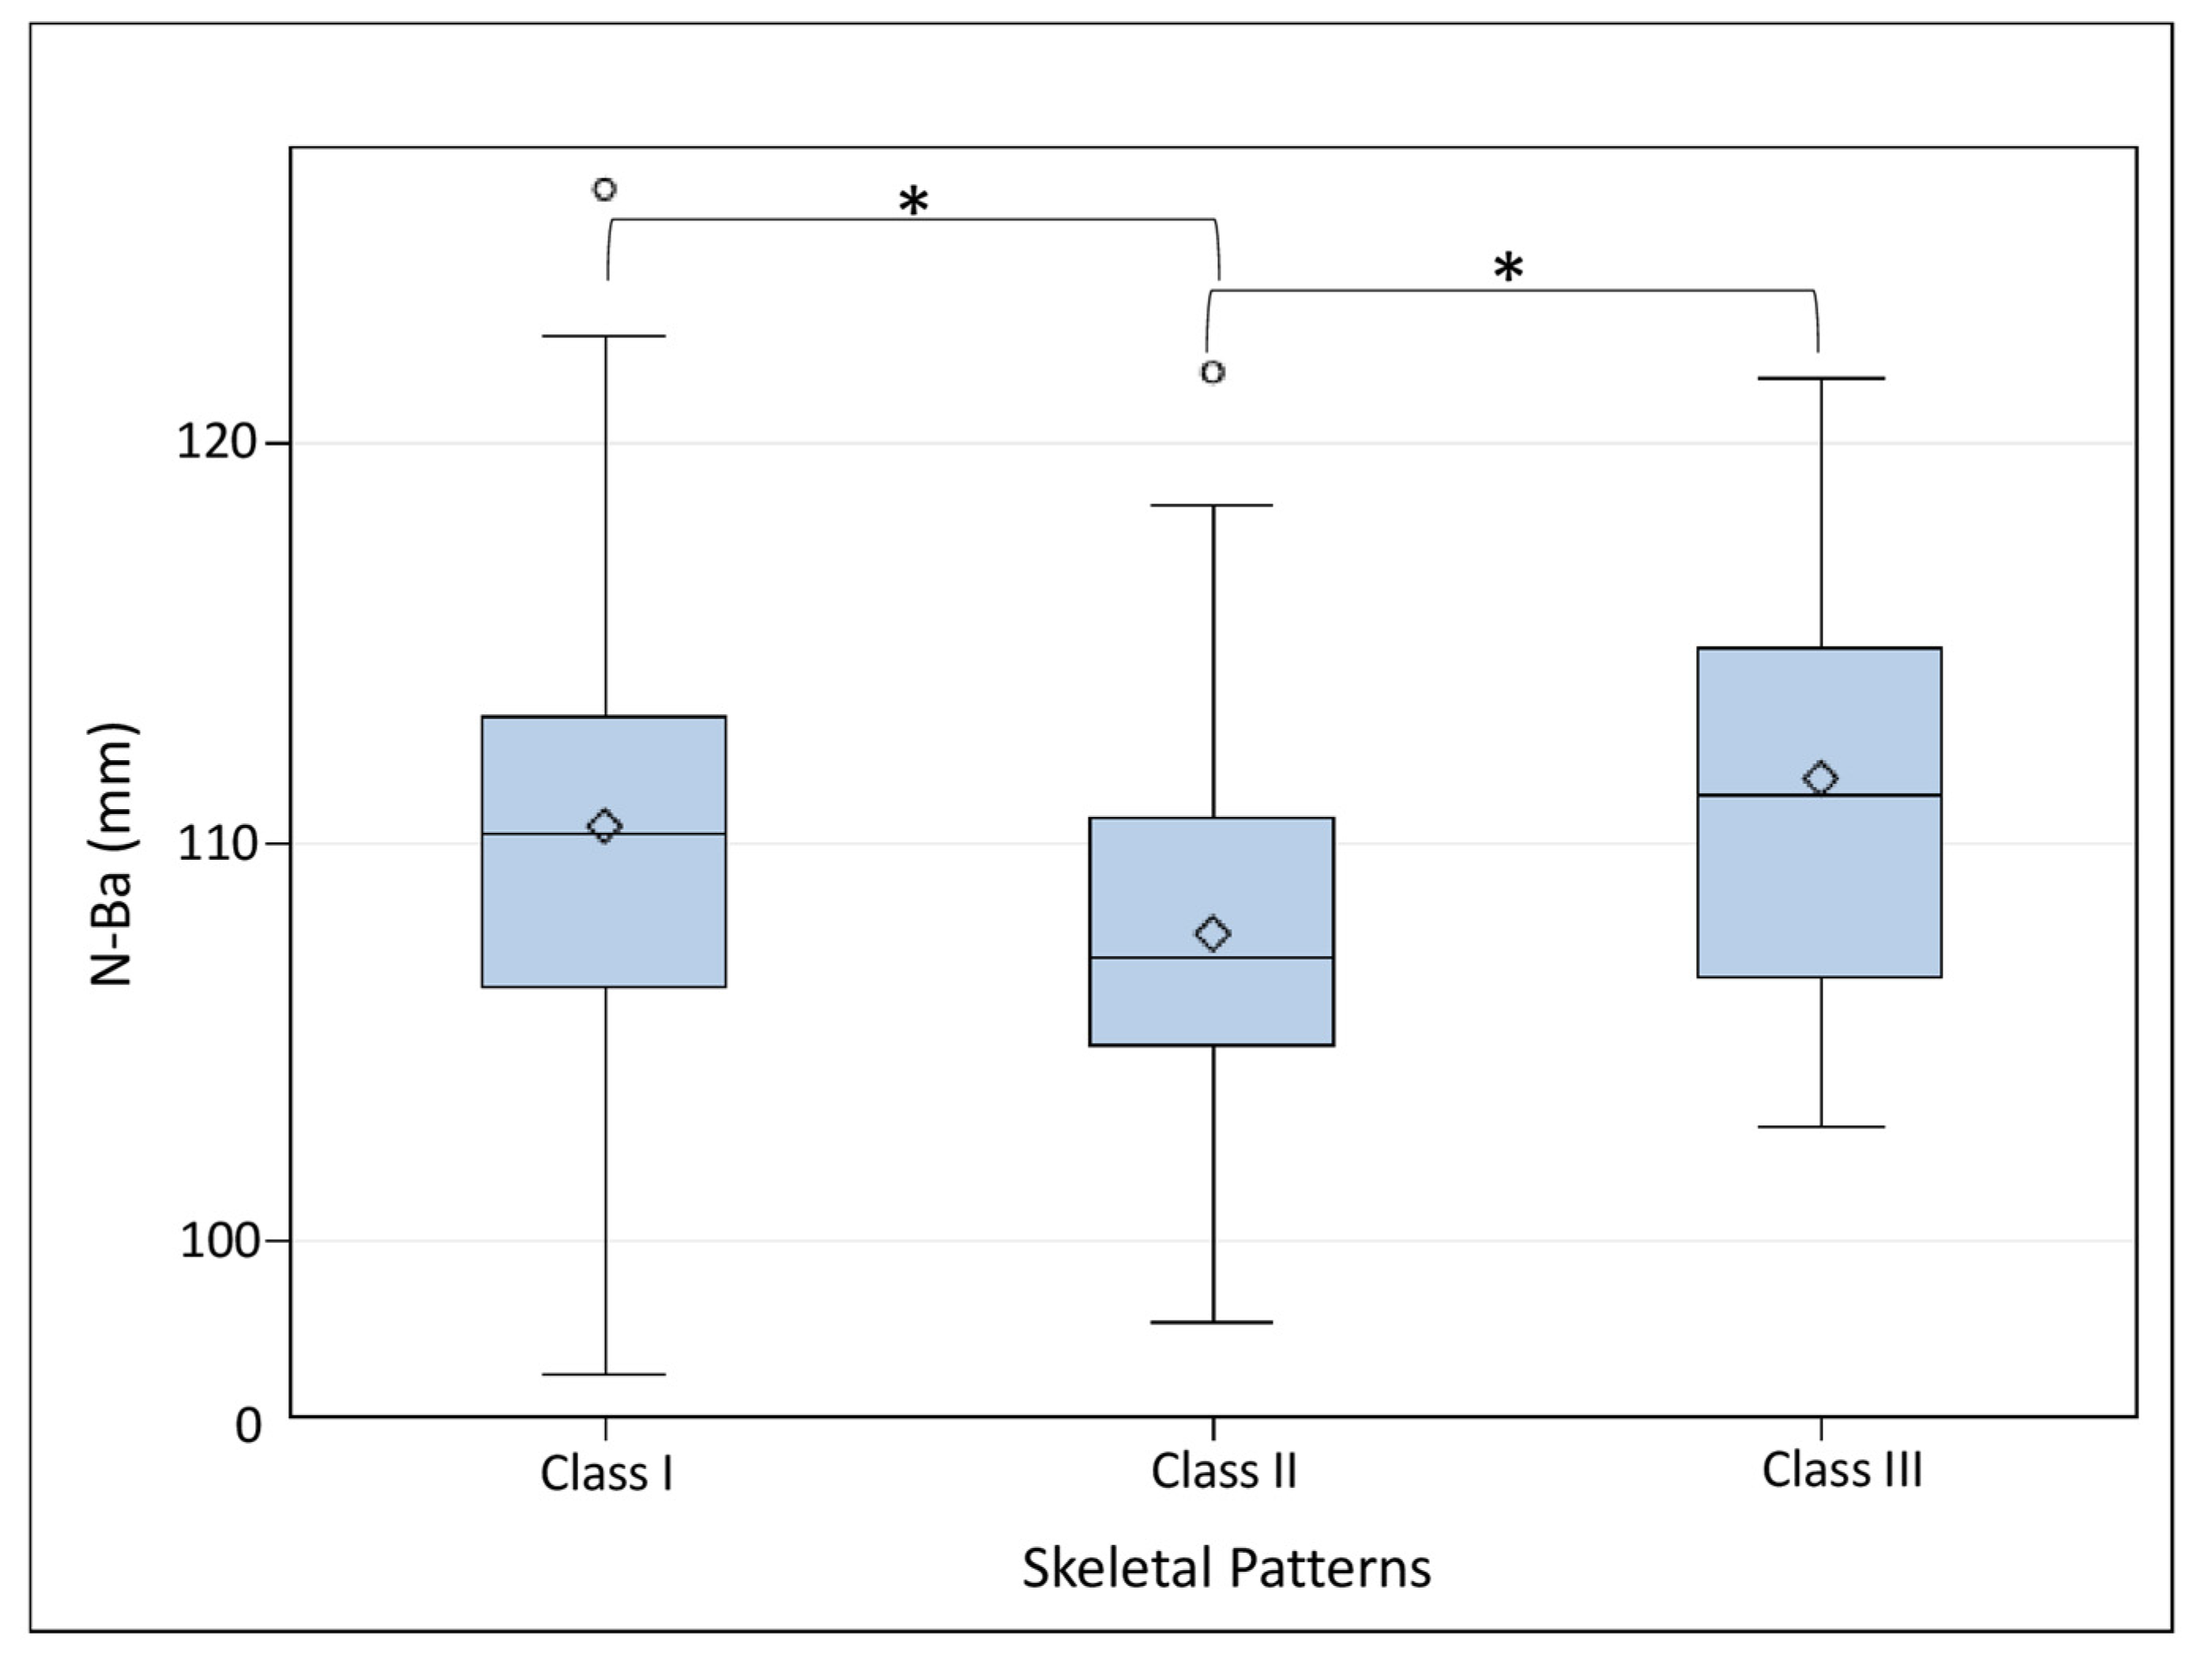
The chi-squared test revealed a statistically significant difference in the association between gender and skeletal groups (p < 0.0001). In the study sample, 61.11% of female subjects were skeletal class II, and 51.66% of male subjects were skeletal class I. The cephalometric values for the whole sample and each subgroup are presented in Table 4. Kolmogorov–Smirnov tests and histograms showed that each data set conformed to the homogeneity of variance tests and normal distribution. Hence, a parametric test (one-way ANOVA) was used in this study, and it revealed no significant differences in the mean age between skeletal groups (p > 0.05). One-way ANOVA was also used to compare the three groups and cranial base measurements. The anterior cranial base length revealed no statistically significant differences between the three groups (p > 0.05). There was a statistically significant difference in posterior cranial base length (p = 0.0023) and total cranial base length (p = 0.0031) between the skeletal groups (Table 4).
Tukey’s post hoc analysis revealed that skeletal class II had a smaller posterior cranial base (Figure 3) and smaller total cranial base length (Figure 4) when compared to skeletal class I and class III groups.
One-way ANOVA showed that there were no statistically significant differences in the deflection angle of the cranial base between the three groups (p > 0.05). Transverse cranial base measurements showed no statistically significant differences between skeletal class I, class II, and class III groups (p > 0.05).
Multivariate logistic regression analysis showed no significant differences between age and cephalometric measurements (p > 0.05). However, the model revealed an association between gender and linear cephalometric values (p ≤ 0.001). Our references were male subjects with S-N > 66.43 mm, S-Ba > 42.97 mm, and N-Ba > 109.40 mm. We measured the probability of S-N ≤ 66.43 mm, and we found that female subjects were more likely to have S-N ≤ 66.43 mm. In addition, we measured the probability of S-Ba ≤ 42.97 mm, and we found that female subjects were more likely to have S-Ba ≤ 42.97 mm. Moreover, the probability of N-Ba ≤ 109.40 mm was measured, and we found that female subjects were more likely to have N-Ba ≤ 109.40 mm. Although the association between gender and angular cephalometric values was not significant, we noticed reduced N-S-Ba (°) values in males compared to females, as demonstrated in Table 5. In summary, cephalometric linear values were significantly less in females compared to males, whereas cephalometric angular measurements were less in males compared to females (Table 5 and Table 6).
According to the ICC guidelines [18], the intra-observer reliability of the measurements of all descriptions was excellent (ICC values were greater than 0.90). The maxillary width reliability was good (values were between 0.75 and 0.90).

4. Discussion

Knowledge of the relationship between the cranial base morphology and different skeletal patterns could be of great importance for orthodontic diagnosis and treatment planning [19,20]. As recently described in the literature, previous studies used 2D cephalometric radiographs to estimate the relationship between the cranial base and malocclusion [7,11]. Therefore, our study utilized 3D analysis to overcome the limitations of the 2D image (such as tissue superimposition) and obtain a more accurate reading [11,21]. In addition, unlike most previous studies that have only compared one or two malocclusion classes with the cranial base morphology [15,22], the current study provided a piece of new information by comparing all three skeletal malocclusions with cranial base dimensions.
The majority of human skull growth and morphological maturation of the cranial base, maxilla, and mandible would predominantly take place before the age of 18 years [23,24,25,26,27]. Accordingly, the criteria for selection of the subjects were limited to subjects who passed the pubertal growth spurt (18 years of age and older) since, by then, most of the growth changes have been attained [23,24,25,26,27]. In addition, our study included subjects from Saudi Arabia to eliminate ethnic variations and genetic differences. Moreover, subjects with previous jaw pathology, previous trauma, congenital anomalies, and previous orthodontic and orthognathic treatment were excluded as they might have altered cranial base dimensions, changed maxillomandibular relationships, and unclear landmarks.
Our findings showed gender differences between the three skeletal groups. In the study sample, 61.11% of female subjects were associated with skeletal class II, and 51.66% of male subjects were associated with skeletal class I. However, previous studies found no gender differences in skeletal relationships [28,29,30]. This could be due to the influence of study sample selections and ethnic variations.
Regarding anterior cranial base length, no significant differences were found between the skeletal groups. In agreement with our results, previous data demonstrated no significant difference in anterior cranial base length between the skeletal groups [1,31,32]. On the other hand, other studies reported increased anterior cranial base length in class II malocclusions [6,7,33], while in class III malocclusions, a shorter anterior cranial base was observed [15,34]. The different results could be due to different ethnic groups and the method of data analysis.
In terms of posterior cranial base length, it is worth noting that there is debate about whether to use the Basion or articular landmarks [6]. Bjork suggested the use of the articular point as a landmark for posterior cranial base measurements since it is easier to locate [35]. Other investigators recommended Basion landmarks for measuring the cranial base [5]. However, it was reported that using the Basion or articular points was very similar [36]. In the present study, Basion landmarks were used in measuring the posterior cranial base length and cranial base angle.
Our study findings showed that the posterior cranial base length was statistically significantly different among the skeletal groups. Skeletal class II subjects have smaller posterior cranial base lengths compared to skeletal classes I and III. These findings are consistent with the Sayin et al. study [37]. However, it is important to mention that controversial data were found regarding the relationship between posterior cranial base lengths and skeletal malocclusion. For example, a study found that increased posterior cranial base length was associated with class II subjects compared to class I subjects [2]. Moreover, a reduced posterior cranial base length was noted in class III malocclusions [15]. In addition, other studies reported no differences in posterior cranial base length in the skeletal groups [1,6,31,32]. The controversial results could be due to different study samples and ethnic variations. Moreover, it is important to point out that there were more female subjects in the class II group (61.11%) in our study sample, and this might lead to the smaller cranial measurements in the class II group compared to the other groups.
Significant differences were found in the total cranial base length between the three skeletal patterns. Skeletal class II had a significantly smaller total cranial base length compared to the other skeletal patterns. In contrast to our results, Gong et al. demonstrated that total cranial base length was significantly larger in class II subjects than in class III [7]. The discrepancy between these results and those presented in previous studies can be attributed to sampling selection and different radiographic tools. Our theory is that reduced posterior and total cranial base length in class II subjects could be due to genetic influence [38]. Negative influence on Runt-Related Transcription Factor 2 (RUNX2) leads to mandibular retrognathism and skeletal class II malocclusion [38,39]. In addition, inhibition of RUNX2 induces early ossification of the spheno-occipital synchondrosis [40].
Regarding cranial base angle, our findings revealed no significant difference in the cranial base angle in all skeletal groups. These results coincide with the findings of previous data [1,22,41]. However, other studies reported a significant difference in the cranial base angle in different skeletal patterns [6,32,42,43]. Meanwhile, our results demonstrated that the cranial width and transverse jaw dimensions showed no significant differences among the skeletal groups. To date, no previous studies have investigated the relationship between the cranial base and maxillomandibular transverse relationship.
The present analysis demonstrated the gender differences in cephalometric values. Female subjects showed reduced cephalometric linear measurements and increased cranial base angle compared to male subjects. This could be explained by the early maturation of females and the increased growth potential in males [44]. In agreement with our findings, previous data found increased cranial base dimensions in males compared to females [6,22,32,44].
These study findings could potentially help orthodontists understand the relationship between the cranial base and the maxillomandibular complex to facilitate orthodontic diagnosis and treatment planning. The clinical implication of this study is that analyzing the cranial base morphological features and skeletal malocclusions will provide data for a specific racial group with particular reference for early diagnosis, prediction, and treatment planning. Moreover, instead of focusing on the maxillomandibular postural relationship, clinicians must pay attention to the cranial base morphological characteristics to evaluate the etiology, diagnosis, and prognosis of such malocclusion [45]. In addition, the orthodontists will be familiar with the gender differences in cranial base morphological features. Interestingly, a study reported a correlation between cranial base values and their skeletal components with orthodontic treatment duration [46]. A smaller posterior cranial base length in an obtuse posterior cranial base angle increased the vertical component of the mandible and thereby prolonged the treatment duration [46]. Therefore, understanding the relationship between the cranial base and the maxillomandibular relationship could indicate treatment duration [46]. The limitation of our study is restricting our sample to Saudi Arabian subjects. In addition, grouping the subjects based on the ANB angle might introduce some bias in the results since the ANB angle may change with age [47]. Future studies are suggested to include more ethnic groups.

5. Conclusions

  • Skeletal class II subjects have smaller posterior and total cranial base lengths.
  • There are no significant differences between cranial width and transverse jaw dimensions among the skeletal groups.
  • Females were more likely to have reduced linear cranial base measurements compared to males.

Author Contributions

Conceptualization, N.A., A.A., S.A., S.B.J., M.S.A., Z.A. and A.M.A.; methodology, N.A. and S.B.J.; software, M.A.; validation, N.A.; formal analysis, M.A.; investigation, N.A.; resources, N.A.; data curation, N.A., A.A., S.A., S.B.J., M.S.A., Z.A. and A.M.A.; writing—original draft preparation, N.A., A.A., S.A., S.B.J., M.S.A., Z.A. and A.M.A.; writing—review and editing, N.A. and M.A.; visualization, N.A.; supervision, N.A.; project administration, N.A., A.A. and S.A. All authors have read and agreed to the published version of the manuscript.

Funding

This work was supported by King Abdullah International Medical Research Center (KAIMRC) (funding number: SP21R/356/06).

Institutional Review Board Statement

This study was conducted in accordance with the Declaration of Helsinki and approved by the Institutional Review Board of KAIMRC (protocol code SP21R/356/06 in 29 July 2021).

Informed Consent Statement

Informed consent was obtained from all subjects involved in the study.

Data Availability Statement

The data presented in this study are available on request from the corresponding author. The data are not publicly available due to ethical and subject privacy reasons.

Conflicts of Interest

The authors declare no conflict of interest.

References

  1. Polat, Ö.; Kaya, B. Changes in cranial base morphology in different malocclusions. Orthod. Craniofacial Res. 2007, 10, 216–221. [Google Scholar] [CrossRef] [PubMed]
  2. Dhopatkar, A.; Bhatia, S.; Rock, P. An Investigation Into the Relationship Between theCranial Base Angle and Malocclusion. Angle Orthod. 2002, 72, 456–463. [Google Scholar]
  3. Chin, A.; Perry, S.; Liao, C.; Yang, Y. The relationship between the cranial base and jaw base in a Chinese population. Head Face Med. 2014, 10, 31. [Google Scholar] [CrossRef] [PubMed]
  4. Scott, J. The cranial base. Am. J. Phys. Anthropol. 1958, 16, 319–348. [Google Scholar] [CrossRef] [PubMed]
  5. Kerr, W.J.S.; Philip Adams, C. Cranial base and jaw relationship. Am. J. Phys. Anthropol. 1988, 77, 213–220. [Google Scholar] [CrossRef]
  6. Monirifard, M.; Sadeghian, S.; Afshari, Z.; Rafiei, E.; Sichani, A.V. Relationship between cephalometric cranial base and anterior-posterior features in an Iranian population. Dent. Res. J. 2020, 17, 60. [Google Scholar]
  7. Gong, A.; Li, J.; Wang, Z.; Li, Y.; Hu, F.; Li, Q.; Miao, D.; Wang, L. Cranial base characteristics in anteroposterior malocclusions: A meta-analysis. Angle Orthod. 2016, 86, 668–680. [Google Scholar] [CrossRef]
  8. Kerr, W.J.S.; Ford, I. The variability of some craniofacial dimensions. Angle Orthod. 1991, 61, 205–210. [Google Scholar]
  9. Proff, P.; Will, F.; Bokan, I.; Fanghänel, J.; Gedrange, T. Cranial base features in skeletal Class III patients. Angle Orthod. 2008, 78, 433–439. [Google Scholar] [CrossRef]
  10. Kuroe, K.; Rosas, A.; Molleson, T. Variation in the cranial base orientation and facial skeleton in dry skulls sampled from three major populations. Eur. J. Orthod. 2004, 26, 201–207. [Google Scholar] [CrossRef]
  11. Chien, P.; Parks, E.; Eraso, F.; Hartsfield, J.; Roberts, W.; Ofner, S. Comparison of reliability in anatomical landmark identification using two-dimensional digital cephalometrics and three-dimensional cone beam computed tomography in Vivo. Dentomaxillofac. Radiol. 2009, 38, 262–273. [Google Scholar] [CrossRef] [PubMed]
  12. Baccetti, T.; Antonini, A.; Franchi, L.; Tonti, M.; Tollaro, I. Glenoid fossa position in different facial types: A cephalometric study. Br. J. Orthod. 1997, 24, 55–59. [Google Scholar] [CrossRef] [PubMed]
  13. Ishii, N.; Deguchi, T.; Hunt, N.P. Morphological differences in the craniofacial structure between Japanese and Caucasian girls with Class II Division 1 malocclusions. Eur. J. Orthod. 2002, 24, 61–67. [Google Scholar] [CrossRef] [PubMed] [Green Version]
  14. Hayashi, I. Morphological relationship between the cranial base and dentofacial complex obtained by reconstructive computer tomographic images. Eur. J. Orthod. 2003, 25, 385–391. [Google Scholar] [CrossRef]
  15. Mouakeh, M. Cephalometric evaluation of craniofacial pattern of Syrian children with Class III malocclusion. Am. J. Orthod. Dentofac. Orthop. 2001, 119, 640–649. [Google Scholar] [CrossRef]
  16. Steiner, C.C. The use of cephalometrics as an aid to planning and assessing orthodontic treatment: Report of a case. Am. J. Orthod. 1960, 46, 721–735. [Google Scholar] [CrossRef]
  17. Ishikawa, H.; Nakamura, S.; Iwasaki, H.; Kitazawa, S. Seven parameters describing anteroposterior jaw relationships: Postpubertal prediction accuracy and interchangeability. Am. J. Orthod. Dentofac. Orthop. 2000, 117, 714–720. [Google Scholar] [CrossRef]
  18. Koo, T.K.; Li, M.Y. A guideline of selecting and reporting intraclass correlation coefficients for reliability research. J. Chiropr. Med. 2016, 15, 155–163. [Google Scholar] [CrossRef]
  19. Arnett, G.W.; Bergman, R.T. Facial keys to orthodontic diagnosis and treatment planning. Part I. Am. J. Orthod. Dentofac. Orthop. 1993, 103, 299–312. [Google Scholar] [CrossRef]
  20. Sassouni, V. Diagnosis and treatment planning via roentgenographic cephalometry. Am. J. Orthod. 1958, 44, 433–463. [Google Scholar] [CrossRef]
  21. Li, C.; Teixeira, H.; Tanna, N.; Zheng, Z.; Chen, S.H.Y.; Zou, M.; Chung, C.-H. The reliability of two-and three-dimensional cephalometric measurements: A CBCT study. Diagnostics 2021, 11, 2292. [Google Scholar] [CrossRef] [PubMed]
  22. Wilhelm, B.M.; Beck, F.M.; Lidral, A.C.; Vig, K.W. A comparison of cranial base growth in Class I and Class II skeletal patterns. Am. J. Orthod. Dentofac. Orthop. 2001, 119, 401–405. [Google Scholar] [CrossRef] [PubMed]
  23. Powell, T.V.; Brodie, A.G. Closure of the spheno-occipital synchondrosis. Anat. Rec. 1963, 147, 15–23. [Google Scholar] [CrossRef] [PubMed]
  24. Ford, E. Growth of the human cranial base. Am. J. Orthod. 1958, 44, 498–506. [Google Scholar] [CrossRef]
  25. Dixon, A.D.; Hoyte, D.A.; Ronning, O. Fundamentals of Craniofacial Growth; Crc Press: Boca Raton, FL, USA, 2017. [Google Scholar]
  26. Bastir, M.; Rosas, A.; O’Higgins, P. Craniofacial levels and the morphological maturation of the human skull. J. Anat. 2006, 209, 637–654. [Google Scholar] [CrossRef]
  27. Nanda, S.K. Growth patterns in subjects with long and short faces. Am. J. Orthod. Dentofac. Orthop. 1990, 98, 247–258. [Google Scholar] [CrossRef]
  28. Aldrees, A.M. Pattern of skeletal and dental malocclusions in Saudi orthodontic patients. Saudi Med. J. 2012, 33, 315–320. [Google Scholar]
  29. Trottman, A.; Elsbach, H.G. Comparison of malocclusion in preschool black and white children. Am. J. Orthod. Dentofac. Orthop. 1996, 110, 69–72. [Google Scholar] [CrossRef]
  30. Bugaighis, I.; Karanth, D. The prevalence of malocclusion in urban Libyan schoolchildren. J. Orthod. Sci. 2013, 2, 1–6. [Google Scholar] [CrossRef]
  31. Sanggarnjanavanich, S.; Sekiya, T.; Nomura, Y.; Nakayama, T.; Hanada, N.; Nakamura, Y. Cranial-base morphology in adults with skeletal Class III malocclusion. Am. J. Orthod. Dentofac. Orthop. 2014, 146, 82–91. [Google Scholar] [CrossRef]
  32. Al Maaitah, E.F.; Alomari, S.; Al-Khateeb, S.N.; Abu Alhaija, E.S. Cranial base measurements in different anteroposterior skeletal relationships using Bjork-Jarabak analysis. Angle Orthod. 2022, 92, 613–618. [Google Scholar] [CrossRef] [PubMed]
  33. Rothstein, T.; Yoon-Tarlie, C. Dental and facial skeletal characteristics and growth of males and females with Class II, Division 1 malocclusion between the ages of 10 and 14 (revisited)—Part I: Characteristics of size, form, and position. Am. J. Orthod. Dentofac. Orthop. 2000, 117, 320–332. [Google Scholar] [CrossRef]
  34. Sundareswaran, S.; Thirumoorty, S.N. Anterior cranial base features in skeletal Class III patients with maxillary recession: A cephalometric study. ORTHODONTICS Art Pract. Dentofac. Enhanc. 2012, 13, e105–e115. [Google Scholar]
  35. Björk, A. Cranial base development: A follow-up x-ray study of the individual variation in growth occurring between the ages of 12 and 20 years and its relation to brain case and face development. Am. J. Orthod. 1955, 41, 198–225. [Google Scholar] [CrossRef]
  36. Bhatia, S.; Leighton, B. Manual of Facial Growth: A Computer Analysis of Longitudinal Cephalometric Growth Data; Oxford University Press, Inc.: New York, NY, USA, 1993. [Google Scholar]
  37. Sayın, M.; Türkkahraman, H. Cephalometric evaluation of nongrowing females with skeletal and dental Class II, division 1 malocclusion. Angle Orthod. 2005, 75, 656–660. [Google Scholar] [PubMed]
  38. Gershater, E.; Li, C.; Ha, P.; Chung, C.-H.; Tanna, N.; Zou, M.; Zheng, Z. Genes and Pathways Associated with Skeletal Sagittal Malocclusions: A Systematic Review. Int. J. Mol. Sci. 2021, 22, 13037. [Google Scholar] [CrossRef]
  39. Shibata, S.; Suda, N.; Yoda, S.; Fukuoka, H.; Ohyama, K.; Yamashita, Y.; Komori, T. Runx2-deficient mice lack mandibular condylar cartilage and have deformed Meckel’s cartilage. Anat. Embryol. 2004, 208, 273–280. [Google Scholar] [CrossRef]
  40. Lei, W.Y.; Wong, R.W.; Rabie, A. Factors regulating endochondral ossification in the spheno-occipital synchondrosis. Angle Orthod. 2008, 78, 215–220. [Google Scholar] [CrossRef]
  41. Thiesen, G.; Pletsch, G.; Zastrow, M.D.; Valle, C.V.M.d.; Valle-Corotti, K.M.d.; Patel, M.P.; Conti, P.C.R. Comparative analysis of the anterior and posterior length and deflection angle of the cranial base, in individuals with facial Pattern I, II and III. Dent. Press J. Orthod. 2013, 18, 69–75. [Google Scholar] [CrossRef]
  42. Awad, A.M.; Gaballah, S.M.; Gomaa, N.E. Relationship between cranial base and jaw base in different skeletal patterns. Orthod. Waves 2018, 77, 125–133. [Google Scholar] [CrossRef]
  43. Flores-Ysla, A.; Arriola-Guillén, L.E.; Rodríguez-Càrdenas, Y.A.; Ruíz-Mora, G.A.; Aliaga-Del Castillo, A.; Janson, G. Skeletal open bite cranial base characteristics in young Latin-American individuals with class I, II and III malocclusions: An observational study. Int. Orthod. 2020, 18, 237–245. [Google Scholar] [CrossRef] [PubMed]
  44. Lewis, A.B.; Roche, A.F.; Wagner, B. Pubertal spurts in cranial base and mandible. Comparisons within individuals. Angle Orthod. 1985, 55, 17–30. [Google Scholar] [PubMed]
  45. Wu, X.-P.; Xuan, J.; Liu, H.-Y.; Xue, M.-R.; Bing, L. Morphological Characteristics of the Cranial Base of Early Angle’s Class II Division 1 Malocclusion in Permanent Teeth. Int. J. Morphol. 2017, 35, 589–595. [Google Scholar] [CrossRef]
  46. Andria, L.M.; Leite, L.P.; Prevatte, T.M.; King, L.B. Correlation of the cranial base angle and its components with other dental/skeletal variables and treatment time. Angle Orthod. 2004, 74, 361–366. [Google Scholar]
  47. Bishara, S.E.; Fahl, J.A.; Peterson, L.C. Longitudinal changes in the ANB angle and Wits appraisal: Clinical implications. Am. J. Orthod. 1983, 84, 133–139. [Google Scholar] [CrossRef]
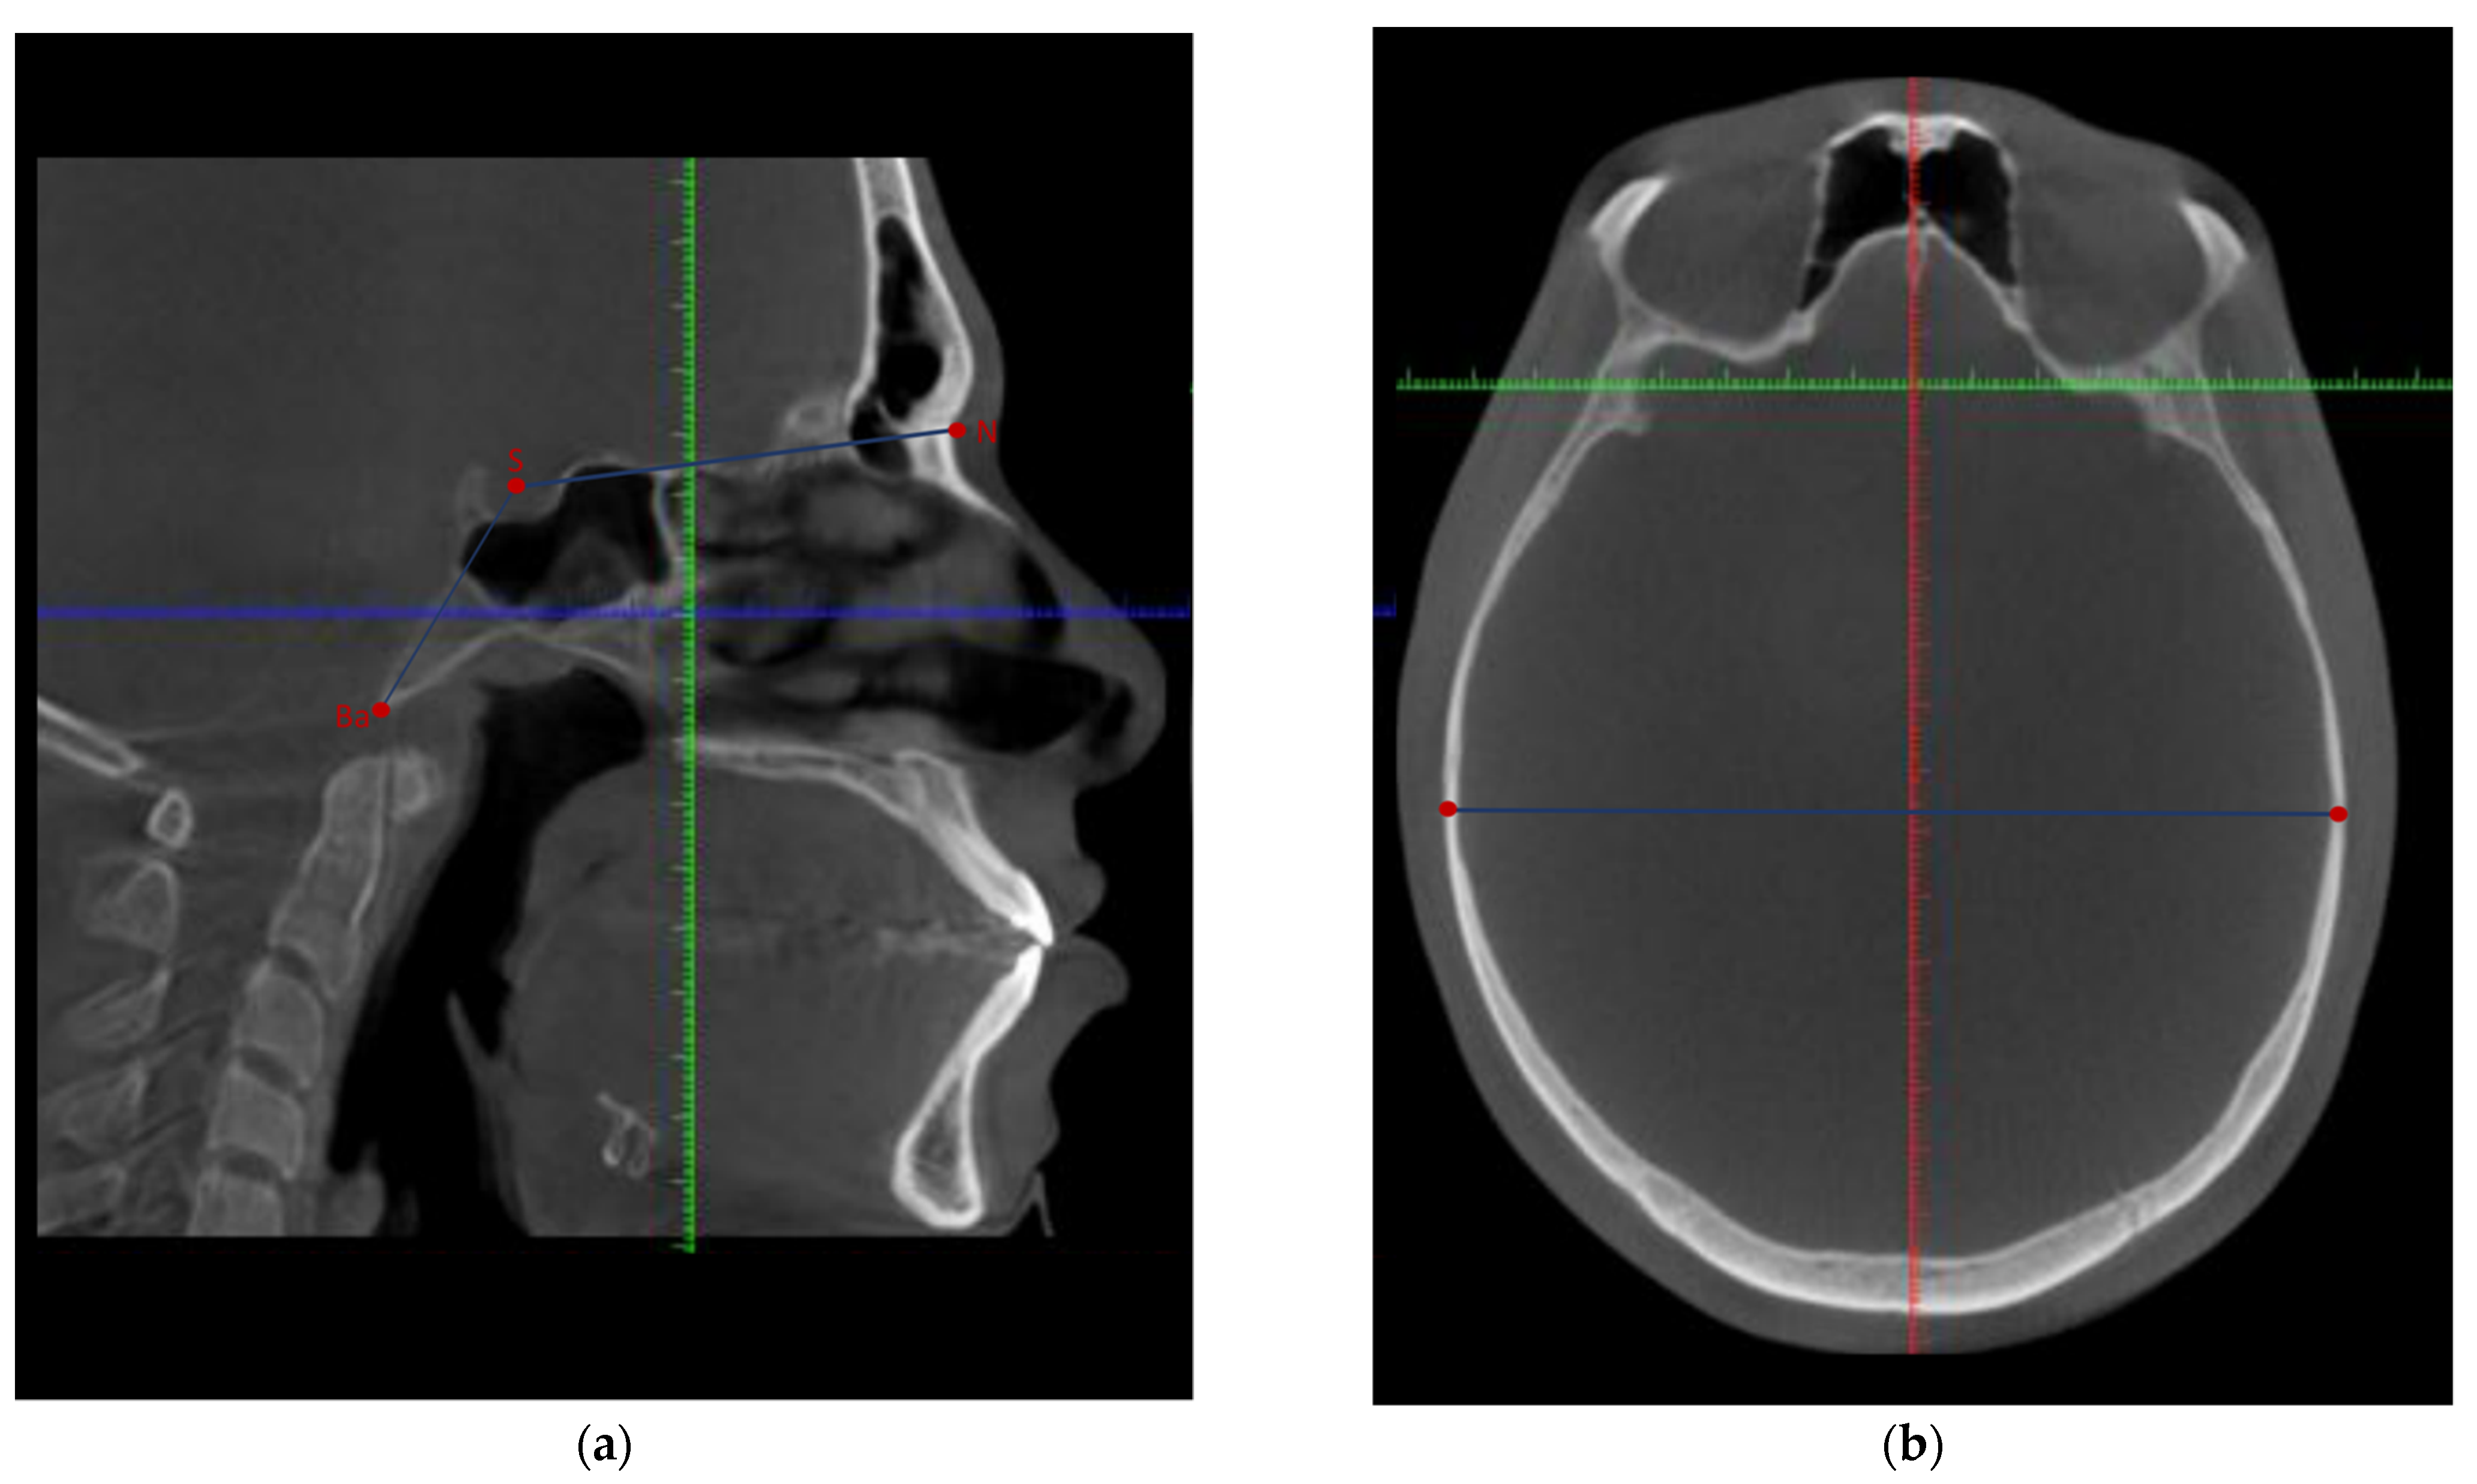
Figure 1. This is a figure showing the definitions and measurements of CBCT landmarks: (a) In sagittal view, the cranial base landmarks (S, N, and Ba; red color) and the linear measurements (blue color) are demonstrated; (b) In transverse view, the Bieuryon width (cranial width; blue color) is presented.
Applsci 12 09199 g001
Figure 2. This is a figure demonstrating additional cephalometric landmarks: (a) The Maxillary width landmarks (JR and JL; red color) and linear measurement (JR-JL; blue color) are demonstrated in coronal view; (b) The 3D image shows the different mandibular width landmarks (Ag and Go; red color) and linear measurements (Go-Go and Ag-Ag; blue color).
Applsci 12 09199 g002
Figure 3. The distribution of posterior cranial base among the three skeletal patterns; * p < 0.05, ◇; the means of the groups, °; outlier.
Applsci 12 09199 g003
Figure 4. The distribution of total cranial base among the three skeletal patterns; * p < 0.05, ◇; the means of the groups, °; outlier.
Applsci 12 09199 g004
Table 1. The definitions of cephalometric landmarks.
LandmarkAbbreviation
(Unit)
DefinitionSagittal ViewAxial ViewCoronal View
Sella-NasionS-N (mm)Anterior cranial base length in millimetersDistance between the middle point of the pituitary fossa and the anterior-most point of the frontonasal sutureDistance between the middle point of the anteroposterior and lateral width of the pituitary fossa and the middle–anterior-most point of the frontonasal sutureDistance between the middle point of the lateral width of the pituitary fossa is determined by the sagittal and axial views and the anterior–middle point of the frontonasal suture
Sella-BasionS-Ba (mm)Posterior cranial base length in millimetersDistance between the middle point of the pituitary fossa and the inferior–posterior-most part on the anterior margin of the foramen magnumDistance between the middle point of the anteroposterior and lateral width of the pituitary fossa and the anterior-most point of the anterior margin of the foramen magnumDistance between the middle point of the lateral width of the pituitary fossa determined by the sagittal and axial views and the middle point on the anterior margin of the foramen magnum
Nasion-BasionN-Ba (mm)Total cranial base length in millimetersThe total linear distance between the anterior-most point of the frontonasal suture, the middle point of the pituitary fossa, and the inferior–posterior-most part on the anterior margin of the foramen magnumThe total linear distance between the middle–anterior-most point of the frontonasal suture, the middle point of the anteroposterior and lateral width of the pituitary fossa, and the anterior-most point of the anterior margin of the foramen magnum The total linear distance between the anterior–middle point of the frontonasal suture, between the middle point of the lateral width of the pituitary fossa, and the middle point on the anterior margin of the foramen magnum
Nasion-Sella-BasionN-S-Ba (°)Cranial base angle in degreesThe angle between the anterior-most point of the frontonasal suture, the middle point of the pituitary fossa, and the inferior–posterior-most part on the anterior margin of the foramen magnumThe angle between the middle–anterior-most point of the frontonasal suture, the middle point of the anteroposterior and lateral width of the pituitary fossa, and the anterior-most point of the anterior margin of the foramen magnum The angle between the anterior–middle point of the frontonasal suture, between the middle point of the lateral width of the pituitary fossa, and the middle point on the anterior margin of the foramen magnum
A point-Nasion-B pointANB (°)The relative position of the maxilla to mandible in degreesThe angle between the most posterior point of the maxillary alveolus concavity, the anterior-most point of the frontonasal suture, and the deepest concavity anteriorly on the mandibular symphysisThe angle between the middle–anterior-most point on the maxillary alveolus contour, the middle–anterior-most point of the frontonasal suture, and the middle–anterior-most point on the mandibular symphysis The angle between the middle point on the maxillary alveolus as determined by the sagittal and axial views, the anterior–middle point of the frontonasal suture, and the middle point on the mandibular symphysis as determined by the sagittal and axial views
Cranial width Bieuryon width (mm)Distance between the most lateral points on the cranium in millimetersDistance between the right inferior-most lateral point of the cranium to the contralateral sideDistance between the right posterior-most lateral point of the cranium to the contralateral sideDistance between the right inferior-most lateral point of the cranium to the contralateral side
Maxillary widthJR-JL (mm)The jugal process is the intersection of maxillary tuberosity outline and zygomatic buttress. Distance between the right jugal process and left jugal process in millimetersDistance between the inferior-most point of the right jugal process and the inferior-most point of the left jugal processThe point determined on the sagittal and coronal viewsDistance between the deepest midpoint of the right jugal process and the deepest midpoint of the left jugal process
Gonion right-Gonion leftGo (r)-Go (l) (mm)Mandibular width in millimetersDistance between the right inferior- and posterior-most point of the mandibular corpus to the contralateral sideDistance between the right posterior-most point of the mandibular corpus to the contralateral sideDistance between the right inferior-most point of mandibular corpus to the contralateral side
Antigonion right-Antigonion leftAg (r)-Ag (l) (mm)Mandibular width in millimetersDistance between the right inferior and posterior of the notch of the lower border of the body of the mandible to the contralateral side Distance between the right posterior of the notch of the lower border of the body of the mandible to the contralateral sideDistance between the right deepest midpoint of the lower border of the body of the mandible to the contralateral side
Table 2. The distribution of study sample based on gender.
Skeletal PatternNPercentage (%)FemaleMale
Class I53.0040.1522.0031.00
Class II58.0043.9344.0014.00
Class III21.0015.906.0015.00
Total/Percentage132.00100.0072.00 (54.54%)60.00 (45.45%)
Table 3. Age distribution (years) of the study sample.
Skeletal PatternMeanStandard DeviationMedianIQRMinimumMaximum
Class I37.0613.7235.0025.0018.0068.00
Class II34.4512.7630.5016.0018.0067.00
Class III31.769.8430.0011.0018.0057.00
Table 4. The cephalometric values in different skeletal patterns *.
Skeletal PatternNCephalometric LandmarksMeanStandard Deviation
Class I53.00S-N (mm)66.643.46
S-Ba (mm)43.763.67
N-Ba (mm)110.405.65
N-S-Ba (°)129.465.52
Bieuryon width (mm)138.757.43
JR-JL (mm)58.865.27
Go (r)-Go (l) (mm)92.527.70
Ag (r)-Ag (l) (mm)89.176.81
Class II58.00S-N (mm)65.813.25
S-Ba (mm)41.88 a,b2.64
N-Ba (mm)107.69 a,b4.34
N-S-Ba (°)130.307.18
Bieuryon width (mm)136.726.52
JR-JL (mm)59.084.07
Go (r)-Go (l) (mm)90.186.82
Ag (r)-Ag (l) (mm)86.546.44
Class III21.00S-N (mm)67.633.75
S-Ba (mm)43.982.83
N-Ba (mm)111.606.00
N-S-Ba (°)127.537.15
Bieuryon width (mm)139.595.12
JR-JL (mm)60.385.22
Go (r)-Go (l) (mm)93.137.00
Ag (r)-Ag (l) (mm)89.284.99
* Significant differences in the S-Ba (mm) (p = 0.0023) and N-Ba (mm) (p = 0.0031) (one-way ANOVA test) between skeletal patterns: a Class II vs. class I (p < 0.05) (Tukey’s Studentized Range test), b class II vs. class III (p < 0.05) (Tukey’s Studentized Range test).
Table 5. The cephalometric values for both genders.
GenderNCephalometric LandmarksMeanStandard Deviation
Female72.00S-N (mm)65.112.65
S-Ba (mm)41.832.56
N-Ba (mm)106.943.58
N-S-Ba (°)130.797.00
Bieuryon width (mm)136.536.23
JR-JL (mm)58.224.07
Go (r)-Go (l) (mm)88.095.83
Ag (r)-Ag (l) (mm)85.015.39
Male58.00S-N (mm)68.023.66
S-Ba (mm)44.353.46
N-Ba (mm)112.365.68
N-S-Ba (°)128.005.73
Bieuryon width (mm)139.747.02
JR-JL (mm)60.375.28
Go (r)-Go (l) (mm)95.796.59
Ag (r)-Ag (l) (mm)91.665.82
Table 6. Logistic regression model demonstrating the relationship between gender, age, and cranial base measurements.
The Relationship between Gender, Age, and Cranial Base MeasurementsIndependent
Variable
Adjusted Odd
Ratio (AOR)
95% CI for AORp Value
LowerUpper
S-N (mm), Cut point (mean) ≤ 66.43Female vs. Male3.751.827.740.0003 **
Age1.010.981.040.664
S-Ba (mm), Cut point (mean) ≤ 42.97Female vs. Male4.482.139.39<0.0001 **
Age0.980.951.010.207
N-Ba (mm), Cut point (mean) ≤ 109.40Female vs. Male7.553.4816.39<0.0001 **
Age0.990.961.020.657
N-S-Ba (°), Cut point (mean) ≤ 129.52Female vs. Male0.600.301.210.155
Age0.980.951.010.135
** p ≤ 0.001.
Publisher’s Note: MDPI stays neutral with regard to jurisdictional claims in published maps and institutional affiliations.