Article

Characterisation of Bario Rice Flour Varieties: Nutritional Compositions and Physicochemical Properties

by
Macdalyna Esther Ronie
1,
Ahmad Hazim Abdul Aziz
1,
Nor Qhairul Izzreen Mohd Noor
1,
Faridah Yahya
2 and
Hasmadi Mamat
1,*
1
Faculty of Food Science and Nutrition, University Malaysia Sabah, Jalan UMS, Kota Kinabalu 88400, Sabah, Malaysia
2
Faculty of Fisheries and Food Science, Universiti Malaysia Terengganu, Kuala Nerus 21030, Terengganu, Malaysia
*
Author to whom correspondence should be addressed.
Appl. Sci. 2022, 12(18), 9064; https://doi.org/10.3390/app12189064
Submission received: 8 August 2022 / Revised: 5 September 2022 / Accepted: 6 September 2022 / Published: 9 September 2022
(This article belongs to the Special Issue Innovative Food Products and Processing)

Abstract

:
Gluten-free grains have been intensively studied as alternatives to wheat flour. Bario rice, an indigenous crop from Sarawak, Malaysia, is noted for its excellent aroma and taste. This research examined the nutritional and physicochemical properties of Bario rice flour variations. Four Bario varieties—Bario Adan Halus (white), Bario Tuan (brown), Bario Celum (black), and Bario Merah Sederhana (red)—were analysed against the reference sample. The results revealed Bario samples containing moisture contents from 8.35% to 8.69%, ash contents from 0.27% to 1.25%, crude protein contents from 6.89% to 9.43%, crude fat contents from 0.16% to 2.45%, crude fibre contents from 0.21% to 0.87%, and carbohydrate contents from 79.17% to 82.13%. All Bario rice flour contains high amylose contents (26.67% to 36.52%), which positively impact loaf volume. The water absorption capacity (1.20 g/g to 1.26 g/g) of all samples shows no significant difference (p > 0.05). The swelling capacity was significantly (p < 0.05) high in non-pigmented rice flour. In contrast, pigmented Bario rice flour presented a greater water solubility index than non-pigmented Bario rice flour. The Bario rice flour gelatinisation onset (71.43 °C to 76.49 °C) and peak (77.03 °C to 79.56 °C) temperature were lower than those of the control sample. Higher gelatinisation enthalpy was presented by Bario rice flour (1.23 J/g to 2.59 J/g) than by the control (0.79 J/g). Retrogradation onset (42.65 °C to 50.79 °C), peak (53.64 °C to 56.15 °C) temperatures, and enthalpy (0.19 J/g to 0.87 J/g) were greater in Bario rice flour compared with those in the control. The research suggests that Bario rice flour has potential for use in gluten-free bread mainly due to the relevant carbohydrates, crude proteins, amylose, and swelling capacity.

1. Introduction

Wheat flour has long been a common ingredient in baked goods and noodles. The presence of gluten proteins in wheat flour greatly influences the structure and texture of wheat based-bakery products. Gluten proteins are the primary determinants of dough because they impart viscoelasticity properties once hydrated and agitated [1]. Due to climatic constraints, wheat is not grown in most Southeast Asian nations, for instance, Malaysia and Indonesia [2]. Hence, those countries have relied on imported wheat to meet their demand for food products based on wheat flour. Recently, the Russia–Ukraine crisis has caused a sudden upsurge in the price of wheat [3]. Therefore, a massive possibility of increments in alternative flour such as rice flours may be in demand instead.
Gluten-related disorders, such as celiac disease, are increasing worldwide. As a result, interest in gluten-free products has intensified among researchers and consumers [4]. A gluten-free diet is the only viable treatment for people with a gluten-related disorder. However, investigations still continue to find the most appropriate and successful therapeutic options [5]. In celiac disease, adaptive immune response is caused by gluten proteins. Due to their unusual repeating patterns, gastric and pancreatic enzymes are unable to degrade these proteins completely, and their resistance to proteolysis is the leading contributor to their immunogenicity [6,7].
Currently, efforts have been focusing on finding wheat flour alternatives for bakery and food production, consequently saving on foreign exchange by reducing wheat importation [8]. Rice flour is one of the essential raw materials for gluten-free bread due to its global availability and cost-effectiveness [9]. It possesses the properties of being easily digested and absorbed. Moreover, it is well-known for its hypoallergenic properties, colourlessness, and a natural flavour, which rarely negatively affect the end products [10,11]. Previous studies have extensively studied the potential application of rice flour in developing gluten-free bread [12,13,14]. Most of those studies indicate that rice flour has the potential to be utilised in gluten-free bread. However, several nutritional and physicochemical factors must be considered, such as amylose content [14], particle size [12,13], and water retention capacity [14].
This research focuses on Bario rice varieties. Bario rice is an indigenous crop in Malaysia. It has established its reputation as one of the finest rice varieties due to its soft texture; fine, elongated grains; and superb flavour and aroma [15]. Bario rice varieties are generally cultivated in the Bario highland in the state of Sarawak by the local ethnic community [16]. Bario rice is grown using the conventional method and is devoid of artificial fertilisers [17]. There are four varieties of Bario rice: Bario Adan Halus, Bario Tuan, Bario Merah Sederhana, and Bario Celum. It has been remarked that Adan Halus is generally classified as white rice; in contrast, Bario Tuan is brownish, and Bario Merah Sederhana and Bario Celum are red and black, respectively [18]. A previous study by Nicholas et al. [18] revealed that Bario Tuan and Bario Celum are classified as rice with a moderate glycaemic index, which is advantageous for human blood glucose. In addition, a similar study also reported that Bario rice is potentially marketed as healthy food due to its good nutritional content [18]. Thus, due to the eating quality and health benefits of Bario rice, these varieties can potentially be used in the development of gluten-free products. Moreover, past research found that pigmented Bario rice exhibited more outstanding total phenolic content than non-pigmented Bario rice [19].
Currently, there is limited scientific research regarding the nutritional value of these cultivars. In addition, no prior research has focused on the physicochemical properties of Bario rice flour, which is one of the most critical factors for understanding the behaviour of flour for future reference in product development. Therefore, this work aims to provide information on the nutritional compositions and physicochemical properties of local Bario rice varieties. Additionally, the present research is an effort to promote the utilisation of locally grown crops, such as Bario rice, as gluten-free rice flour.

2. Materials and Methods

2.1. Materials

The reference sample, TQR rice, was purchased from a local store in Kota Kinabalu, Sabah, Malaysia. TQR is a local rice variety that is broadly cultivated in Sabah. TQR rice was chosen as a control sample because it is commercial rice often consumed in Sabah. Bario rice samples were obtained from two different suppliers. Bario Adan Halus and Bario Tuan were obtained from Dagang Mewah Sdn. Bhd., Rawang Selangor, Malaysia. Bario Merah Sederhana and Bario Celum were obtained from Zulkifli Suli Enterprise, Kuching, Sarawak, Malaysia. Both companies are suppliers that supply authentic Bario rice from Sarawak. In general, the Bario rice varieties were harvested from the highland of Bario, Sarawak, by local farmers.

2.2. Methods

2.2.1. Rice Flour Production

Rice was cleaned individually using tap water for five minutes to ensure that the rice kernels were free from dust and dirt. The rice was then placed on a general flour sifter to remove the remaining water. Upon water draining, the rice was dried in a drying cabinet (Thermoline Scientific TD-78T-SD, Sydney, Australia) at 40 °C approximately for 12 h and above. Dried rice samples were ground to a fine powder using a Waring blender (Panasonic MX-898 M, Selangor, Malaysia) at low speed for 80 s. The grinding process was repeated until fine-sized rice flour could pass through a 250-micron sifter (Endecotts Ltd., London, United Kingdom). The rice flour was sifted using a laboratory sieve shaker (Endecotts Ltd., London, United Kingdom). The fine rice flour was packed in airtight bags and stored at 4 °C until further analysis.

2.2.2. Nutritional Compositions

Determination of moisture content used the 925.10 AOAC (2000) method and the oven drying method. The ash content was determined using the dry weight basis described in the 923.03 AOAC (2000) method. The Fibertherm FT12 (Gerhardt, Brackley, United Kingdom) was utilised to calculate the crude fibre content. Moreover, the Kjeldahl method, detailed in 920.87 (AOAC, 2000), was used to determine the crude protein content of the sample by measuring its protein percentage. This method consists of three parts: digestion, distillation, and titration [20]. Furthermore, the crude fat content was analysed using the fat extraction equipment and the Soxhlet (FOSS SoxhtecTM 2050, Höganäs, Sweden) method described in 920.85 (AOAC, 2000). The carbohydrate content was estimated by deducting the proteins, ash, lipids, and fibre from the samples’ dry weight [21].
The amylose content was determined enzymatically using the Megazyme Amylose/Amylopectin assay kit (Megazyme International Ireland Limited, Wicklow, Ireland). In general, this method has two stages of analysis: (1) starch pre-treatment, and (2) con A precipitation of amylopectin and determination of amylose. The wavelength absorbance for the UV–vis spectrophotometer was at 510 nm against the blank reagent.

2.2.3. Physicochemical Properties

The rice flour colour was determined using a colorimeter (Hunterlab CalorFlex EZ, Sunset Hills Road, Reston). The flour sample was inserted into a glass sample cup. The flour sample should entirely cover the bottom surface of a glass sample cup. Colour profiles were expressed in L*, a*, and b*. The L* value indicates the level of light (L = 100) or dark (L = 0), the a* value indicates the amount of redness (+a) or greenness (−a), and the b* value indicates the amount of yellowness (+b) or blueness (−b) [22]. The CalorFlex EZ was standardised using the standard white tile before analysing the sample to prevent errors during colour reading. The result was reported as the mean of triplicates on each sample.
Water absorption capacity and solubility were determined according to the methods described by Coțovanu and Mironeasa, and by Kraithong et al. [23,24] with slight modification. Approximately 1.00 ± 0.02 g of the sample was weighed and recorded as w0. The sample was then filled into a 50 mL centrifugal tube and weighed again, recorded as w1. Next, 10 mL of distilled water was added into a centrifugal tube. The dispersions were vortexed every 5 min within 30 min at room temperature, followed by centrifugation for 10 min at 2000 rpm (359× g). The supernatant was removed from the centrifugal tube, subsequently weighed, and recorded as w2. The amount of water bound by flour was determined by the difference and expressed as the weight of water bound by dry flour (100 g) [25]. The result was reported as the mean of triplicates on each sample. Water absorption capacity was calculated using Equation (1).
Water   absorption   capacity = w 2 w 1 w 0
where w0 = mass of sample (g), w1 = mass of centrifugal tube + sample (g), and w2 = mass of centrifugal tube + residue after removing the supernatant (g).
The swelling capacity was determined according to the method described by Anyasi et al. [26] with slight modification. First, 1 g (w1) of the rice flour sample was moistened with 30 mL of distilled water in a centrifuge tube. The centrifuge tubes containing the sample were heated at 80 °C in the water bath while shaking continuously. The tubes were taken out and allowed to cool down until the temperature decreased to room temperature. After the cooling process, samples were centrifuged at 2200 rpm for 15 min. The supernatant was removed from the centrifuge tube, and the residue weight was recorded (w2). The swelling capacity (g/g) was determined using Equation (2).
Swelling   capacity   ( g / g ) = w 2 w 1
where w1 = mass of dry sample (g) and w2 = mass of residue (after removing supernatant) (g).
Moreover, the decanted supernatant from the swelling capacity procedure was used to determine the water solubility index of the rice flour. First, the empty crucibles were weighed and recorded as w4, and the supernatant was poured carefully into the tared crucible. Then, the oven drying method was initiated to the supernatant at 105 °C overnight. On the following day, the dried supernatant was cooled in a desiccator to room temperature and weighed as w3. The result was reported as the mean of triplicates on each sample. The water solubility index was calculated using Equation (3).
Water   solubility   index ,   % = w 3 w 4   w 1   × 100  
where w1 = mass of the sample (g), w3 = mass of crucibles and dried supernatant (g), andw4 = mass of crucibles (g).

2.2.4. Thermal Properties

The gelatinisation profiles were determined according to the method described by Gunaratne et al. [27] using a different scanning calorimeter (DSC) (Perkin Elmer, Waltham, MA, USA) equipped with a thermal analysis data station (Pyris Software version 9.0.2.0193 (2008), PerkinElmer, Inc., Waltham, MA, United States) with slight modification. First, 2 mg of the rice flour sample was weighed onto the aluminium DSC pan, followed by 6 µL of distilled water with a micropipette. Next, the pan was sealed and kept at room temperature for 1 h. The scanning temperature range and heating rate were 30 °C to 120 °C and 10 °C min−1, respectively, using an empty pan as a reference. In general, the final result of the DSC instrument was expressed as initial temperature value (T0), peak temperature (Tp), final temperature (Tf), and gelatinisation enthalpy (ΔH) [28].
A retrogradation analysis was conducted according to the method described by Wang et al. [29] with a slight modification. After the gelatinisation in the DSC, the pans were stored at 4 °C for 7 days and rescanned under a constant temperature range from 30 °C to 120 °C and a heating range of 10 °C min−1, similar to the gelatinisation measurement. The final result of the DSC instrument was expressed as initial temperature value (T0), peak temperature (Tp), final temperature (Tf), and retrogradation enthalpy (ΔH).

2.2.5. Statistical Analysis

All experimental data were analysed using Statistical Packages for the Social Sciences (SPSS) version 26.0 in a completely randomised study design. All experimental values were presented as mean ± standard deviation (mean ± SD). In general, a one-way analysis of variance (ANOVA) was employed to determine the significant differences in data among the experimental units. Tukey’s HSD test was utilised for multiple comparisons. Statistical significance was established at p < 0.05.

3. Results and Discussion

3.1. Nutritional Compositions

The nutritional compositions of the five rice flours are presented in Table 1.

3.1.1. Moisture Content

The moisture content was significantly higher for Bario Tuan (8.69%) and Bario Celum (8.67%). Bario Adan Halus (8.35%) had the lowest moisture content. These moisture values are in accordance with past studies, in which the moisture content of various rice ranged from 8% to 9.61% and from 8.44% to 10.04%, respectively [30,31]. However, few previous studies obtained lower moisture contents between 4.25% and 5.06%, and between 5.46% and 7.08%, respectively [32,33]. Generally, a moisture content lower than 14% can be considered safe for an extended storage period, especially for cereal and cereal products [34]. According to USDA Foreign Agricultural Service [35], based on the standard of rice flour production, the moisture content of rice can be more than 10% but less than 15%. In general, a moisture content below 14% can help prevent infestation by insects and microbial growth, which can deteriorate the shelf life of food [36]. As a result, the rice flours in this research should have good shelf lives.

3.1.2. Ash Content

Ash content reflects the total mineral content in the sample [37]. Bario Tuan exhibited the highest ash content (1.25%) among other Bario rice flours, followed by Bario Merah Sederhana (0.98%) and Bario Celum (0.63%), and the lowest ash contents were from Bario Adan Halus and TQR rice. TQR and Bario Adan Halus indicated no significant difference (p > 0.05) in mean ash content. Table 1 shows that the ash content of pigmented rice flour (Bario Tuan, Celum, and Merah Sederhana) is higher than white rice (TQR and Bario Adan Halus). Similarly, research by Thomas et al. [16] and Oppong et al. [32] also discovered consistent results, in which the percentage of ash contents of black and brown rice flour is more significant than white rice. The reason for this is that the outer layer of rice grains can influence the rice flour’s ash content. In this respect, Bello et al. [38] also speculated that the variation in ash content within rice flours depends on the concentration of compounds within the bran layers of the caryopsis. Another factor, such as the degree of severity during milling for bran separation, can also cause variation in the ash concentration among rice flour varieties [39]. Moreover, variation in the ash content within commodities is also related to the agricultural parameters, such as the soil and irrigation sources [36].

3.1.3. Crude Fibre Content

Bario Tuan (0.87%) obtained the highest crude fibre content among the others, followed by Bario Celum (0.55%) and Bario Merah Sederhana (0.62). The lowest crude fibre content was presented by Bario Adan Halus (0.21%) and TQR (0.12%), which exhibited no significant difference from each other (p > 0.05). Overall, the crude fibre content among all samples was below 1%. In addition, it can be observed that rice flour produced from pigmented rice grains contains higher crude fibre than white or polished rice. This finding is comparable with that from past studies by Nicholas et al. [18] and by Thongkaew and Singthong [40]. In general, rice flour’s fibre and ash contents increase proportionally with the amount of bran in flour [41].

3.1.4. Crude Protein Content

The highest crude protein content was presented by Bario Merah Sederhana (9.43%), and the lowest was from Bario Celum (6.89%). In accordance with the present results, previous studies have investigated that rice flour’s protein content was from approximately 6% to 9% [24,30,42]. On the contrary, Nicholas et al. [18] reported that the protein content of Bario rice flour ranges from 5.85% to 7.30%. The most likely causes of differences in crude protein content are external factors such as environmental parameters [43] and storage conditions (time and temperature) [33]. The average protein content of rice flour is 7.33% [44]. Based on Table 1, the protein content for the majority of rice flour samples was more than the average value, except for Bario Celum (6.89%). Previous research by Paz et al. [45] proposed that it is possible to utilise rice flour with higher protein contents in gluten-free rice flour baked items without altering the qualities of the final products. In addition, the application of high protein rice flour in food development reduces the carbohydrate content, decreasing the glycaemic load during absorption and digestion in the human body. Thus, due to the significant protein content in Bario rice flour, this research suggested that Bario rice flour can potentially be used in gluten-free bread.

3.1.5. Crude Fat Content

Bario Tuan had the greatest crude fat content (2.45%), followed by Bario Merah Sederhana (1.32%), Bario Celum (1.13%), TQR (0.2%), and Bario Adan Halus (0.16%). Table 1 shows that the crude fat content for pigmented rice flour is higher than that for white rice (TQR and Bario Adan Halus). Likewise, in the study conducted by Puri et al. [46], brown rice (1.73%) flour contained a higher crude fat content than white rice flour (1.13%). The recent study by Oppong et al. [32] revealed the same result; pigmented (brown rice flour) possesses higher fat content than commercial white rice flour. Pigmented rice flour contains a high fat content mainly because of the outer layer known as bran [24,32]. To a large extent, rice bran is the major part of rice that contains lipids or fats, approximately 20% on a dry basis [47]. Thus, rice flour produced from milled and polished rice contains lower fat than pigmented rice flour. On the other hand, the high fat content has been ascertained to improve the sensorial quality of final products, especially tastes [42].

3.1.6. Carbohydrate Content

The carbohydrate content is in the range from 79.17% to 83.12%. TQR has the highest carbohydrate content, 83.12%, and Bario Merah Sederhana, 79.17%, shows the lowest carbohydrate value. In addition, there is no significant difference (p > 0.05) between Bario Celum (82.13%), TQR (83.12%), and Bario Adan Halus (82.04%). Similarly, Bario Merah Sederhana (79.14%) and Bario Tuan (79.25%) show no significant differences (p > 0.05). In general, TQR contains the highest carbohydrate value of all. Likewise, in the investigation by Oppong et al. [32], the authors discovered that commercial white rice flour contains more carbohydrates than brown rice varieties. This was expected since pigmented rice varieties are covered by the external layer known as bran, mainly concentrated with crude fat and proteins, ash, and crude fibre [48], which decrease the carbohydrate content within the food.

3.1.7. Amylose Content

Starch is recognised as the main composition of rice flour. Generally, rice starch comprises amylose and amylopectin [49]. The quality of gluten-free rice bread generally relies on the amylose content of rice flour [50,51]. The amylose content of control and Bario rice flour varieties are shown in Table 1. In this research, the highest amylose content was presented by Bario Tuan (36.52%), followed by the control sample (32.97%), Bario Merah Sederhana (32.05%), and Bario Celum (26.68%), and the lowest amylose content was from Bario Adan Halus (26.67%). No significant differences (p > 0.05) were exhibited between the three highest amylose contents: Bario Tuan, TQR, and Bario Merah Sederhana. There are five classifications of amylose content: waxy, very low, low, intermediate, and high. Waxy rice possesses amylose contents in the ranges from 0% to 2%, very low ranges from 2% to 10%, low ranges from 10% to 20%, intermediate ranges from 20% to 25% and high has contents above 25% [52]. Table 1 shows that all samples of Bario rice flour had a high amylose content, with values ranging from 26.67% to 36.53%.
Several studies have examined the role of amylose content in developing gluten-free rice bread. Most researchers reported that amylose positively impacts the development of rice-based products. It has been revealed that amylose content positively impacted specific volumes and the leavening process of the dough [14,53]. High amylose content rice flour possesses good gas-holding properties, resulting in a greater loaf volume in 100% prepared rice bread [51]. The reason for this is that amylose can influence the hydrophobicity of starch granules toward stable Pickering emulsion [54]. On the other hand, a few studies found that softer bread textures were developed from rice flour containing low to medium amylose content; on the contrary, high amylose content rice flour produces rice bread with a sandy texture [55,56]. Even though low-amylose rice flour could develop rice bread with a soft texture, Aoki et al. [55] revealed that the final bread quality is not favourable due to its inferior shape. Hence, Bario rice varieties are predicted to have potential as an ingredient in making rice bread with acceptable quality in terms of loaf volume.

3.2. Physicochemical Properties

The physicochemical properties of the five rice flours are stated in Table 2.

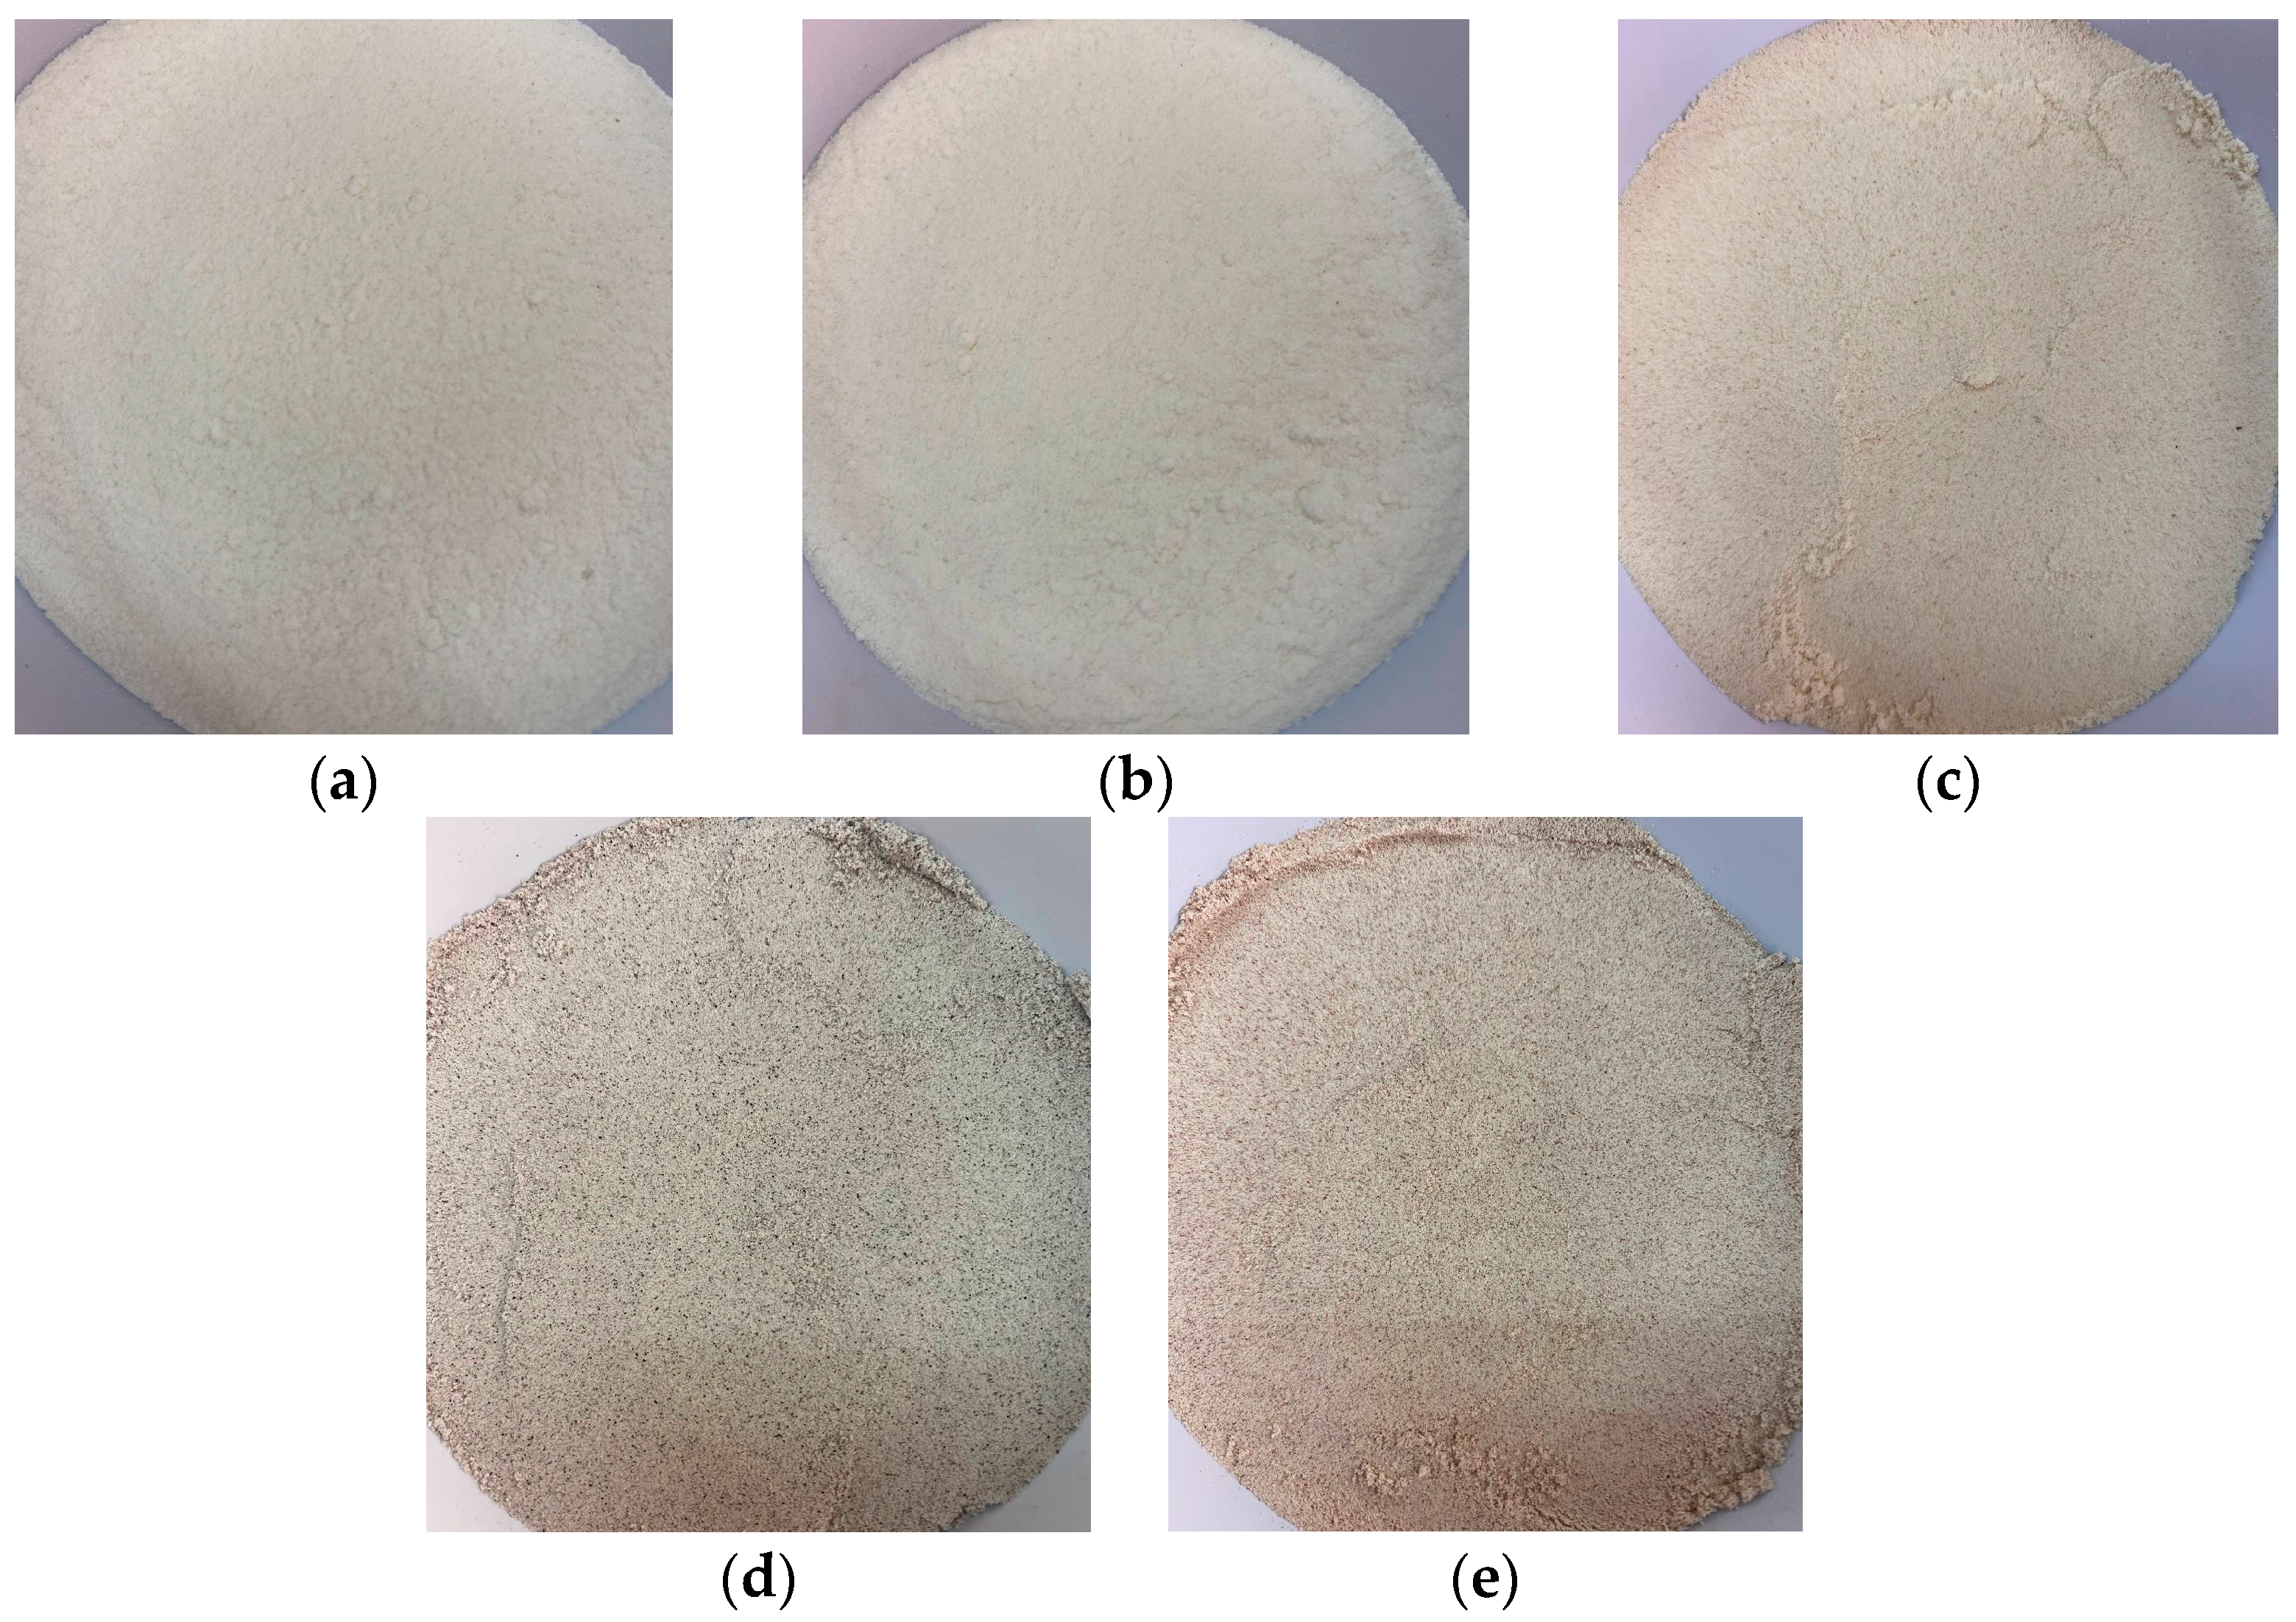
3.2.1. Colour Analysis

The results of the colour analysis of all rice flour samples are shown in Table 2. The L* value expresses the brightness, in which the L* value ranges from 70.99 to 94.34. The brightness of rice flour was more prominent in Bario Adan Halus, followed by TQR. Both varieties exhibited high L* values due to their white appearance. Moreover, Bario Tuan, Bario Merah Sederhana, and Bario Celum rice flour presented lower L* values due to the brown, red, and purple pigmented external layers of the rice grains, respectively. The a* and b* values ranged between −0.15 and 4.80, and between 1.20 and 14.46, respectively. A positive a* value represents red, whereas a negative b* value represents green. Based on the result obtained, a positive a* value was high for Bario Merah Sederhana due to the red pigmentation of the rice bran. On the other hand, b* values ranged from 1.20 to 14.46. Specifically, a positive b* value indicates yellow while a negative b* value represents blue. The colour appearance of TQR and Bario rice flour is shown in Figure 1. In conclusion, the colour profiles of rice flour samples are based on the rice bran’s pigment. Rice grains with a brownish-red pigment are typically called red rice, whereas rice kernels with purple pigmentation are renowned as black rice [57]. Anthocyanins and proanthocyanidins or condensed tannins are common pigments in black and red rice, respectively [58].

3.2.2. Water Absorption Capacity

The water absorption capacity (WAC) of food products generally denotes the flour’s ability to interact with water [32]. Based on Table 2, WAC ranges from 1.20 g/g to 1.26 g/g. The WAC values among the sample show no significant differences (p > 0.05) from each other. The highest WAC value was presented by rice flour made from Bario Adan Halus (1.26 g/g), and the lowest was from TQR (1.20 g/g). Similar values of the WAC rice flour have been stated in previous studies, which is approximately 1.2 g/g [59,60]. Different WACs of rice flour have been associated with starch composition, specifically the amylose and amylopectin ratio; a higher WAC indicates a high amylose content in rice [61]. In this study, Bario Tuan showed the highest amylose concentration; however, Bario Tuan rice flour did not follow that pattern. Alcázar-Alay et al. [62] reported that a high lipid content might decrease WAC because the hydrophobic group of lipids can interfere with the hydration capability of starch granules within rice flour. Based on Table 1, Bario Tuan exhibited the highest crude fat content; thus, it can be concluded that the possibility of a high crude fat content within Bario Tuan might impedes starch granules’ hydration, consequently reducing the WAC. It has been concluded that lower-WAC rice flour (0.99 g/g to 1.07 g/g) provided better rice bread based on its physicochemical properties [63]. Conversely, a study by Cornejo and Rosell [64] discovered that higher-WAC rice flour (1.28 g/g and 1.38 g/g) produced the best gluten-free bread features. According to Han et al. [63], high water absorption decreases stickiness and produces solid dough, and at the bread level, rice flour with low water absorption generates fresh bread.

3.2.3. Swelling Capacity

The swelling of starch granules has occurred during gelatinisation. Starch swelled because the hydroxyl groups within the starch granules formed new hydrogen bonds with water molecules due to the disruption of hydrogen bonds between the hydroxyl group in the double helices of starch molecules [65]. Based on Table 2, the swelling capacity range was between 20.31 g/g and 23.60 g/g. Generally, rice flour produced from Bario Adan Halus (23.60 g/g) exhibited the highest swelling capacity value, and the lowest was presented by Bario Celum (20.32 g/g). Based on the result, pigmented rice flour exhibited significantly (p < 0.05) lower swelling capacities compared with white rice flour. These current findings agree with the research performed by Wani et al. [66] and Li et al. [67]. The reason for this is that the outer bran of the pigmented rice grains delayed water penetration into the starch granules, consequently lowering the swelling capacity of the flour. On the other hand, the swelling of granules can also be hindered by lipids [68]. Likewise, in this study, pigmented rice flour generally contained higher lipid content compared with white rice flour, resulting in a lower swelling capacity than white rice flour (TQR and Bario Adan Halus). In bread development, lower swelling capacity flour is not recommended because it might inhibit the swelling process of the final baked products [69]. For that reason, the possibility for Bario rice flour to be used in gluten-free bread production is high.

3.2.4. Water Solubility Index

The water solubility index (WSI) measures a component’s capacity to dissolve in water in excess water [70]. Bario Merah Sederhana (3.44%) exhibited a significantly highest WSI value (p < 0.05), and the lowest was Bario Adan Halus (1.83%). The greatest WSI rice flour implies a high amount of water-soluble components dispersed aqueously during the cooking process [71]. Based on Table 2, the result indicates that pigmented rice flour has a greater WSI than polished white rice flour. Numerous studies determined that pigmented rice flour usually possesses a lower swelling capacity and a higher WSI compared with white rice flour [66,67,72]. Thiranusornkij et al. [72] have concluded that this might be due to a high concentration of phenolic compounds that has been leached out during processing. However, explanations of the effect of pigmented and non-pigmented rice flour on swelling and water solubility index are still limited; hence further research to be conducted in the future is suggested.

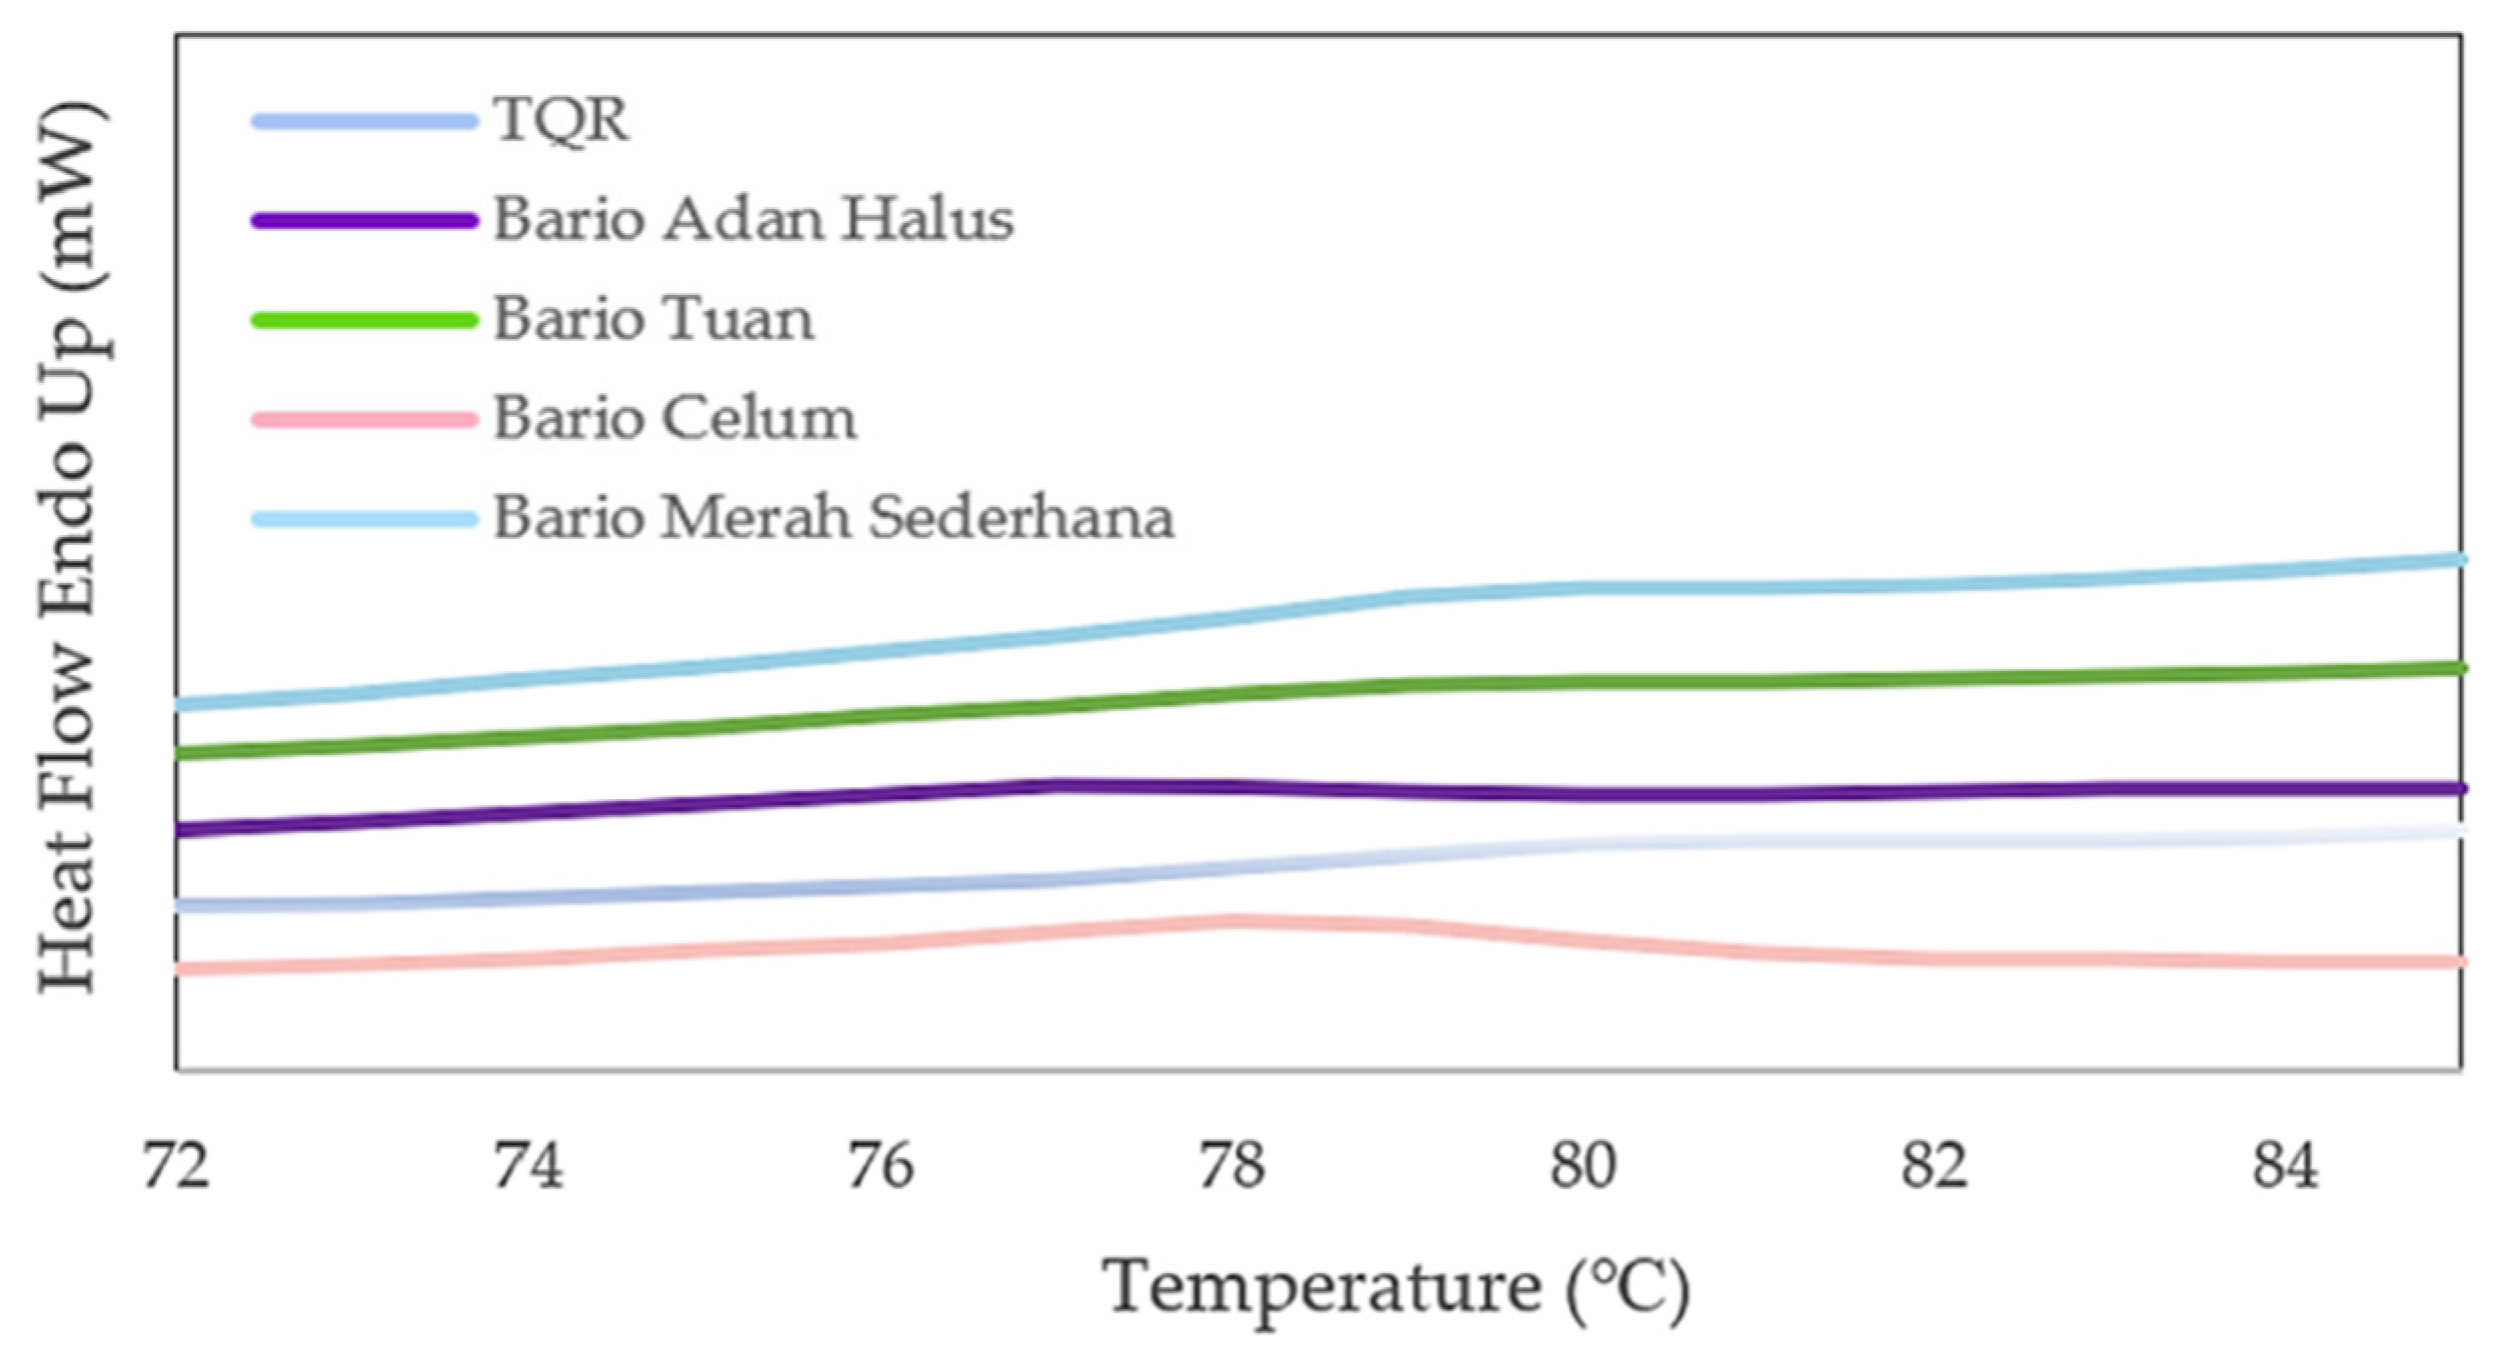
3.2.5. Gelatinitisation

Gelatinisation is identified as a phase transition of starch granules from an ordered to disordered state or known as changes from crystalline to the amorphous structure of starch granules [73]. Gelatinisation occurs in the range from 60 °C to 80 °C with the presence of water during thermal treatment. Figure 2 presents the gelatinisation curve for rice flour samples.
The gelatinisation onset temperature (To) ranges between 71.43 °C and 77.41 °C. The highest value of To was presented by TQR rice flour, at 77.41 °C, and the lowest was from Bario Adan Halus (71.43 °C). Moreover, the Tp and Tf ranged between 77.03 °C and 80.49 °C, and between 80.77 °C and 84.45 °C, respectively. The highest Tp and Tf were shown by TQR rice flour, at 80.49 °C and 83.22 °C, respectively, whereas Bario Adan Halus showed the lowest, at 77.03 °C and 80.77 °C, for Tp and Tf, respectively. Nevertheless, the ΔHgel of rice flour samples varies between 0.79 J/g and 2.59 J/g. ΔHgel denotes the thermal energy required to convert the initial crystalline state to an amorphous structure within the starch granules [74]. A high ΔHgel implies high energy required to transform the starch structure from the ordered (crystal) to disordered (amorphous) forms, whereas a low ΔHgel implies the opposite. The ΔHgel of Bario rice flour varied widely, with the highest value found in Bario Celum rice flour (2.59 J/g) and the lowest value found in TQR rice flour (0.79 J/g). The variation in ΔHgel can be roughly determined by looking at the area under the DSC curve of gelatinised rice flour in Figure 2.
According to the results, the gelatinisation of TQR rice flour generally requires a higher temperature but less energy to initiate the breakdown of hydrogen bonds in a double-helical amylopectin chain. A previous study by Amini et al. [75] reported that the lower ΔHgel is due to the formation of cracks on the starch surface due to the higher gelatinisation temperature, which facilitate water penetration into the starch granules and further penetration into the starch’s crystalline areas, consequently reducing the energy required for gelatinisation. On the other hand, the gelatinisation temperature of Bario Adan Halus was the lowest of all (To = 71.43 °C, Tp = 77.03 °C, and Tf = 80.77 °C) but considerably high in ΔHgel (2.13 J/g). A previous study by Farooq et al. [76] also obtained a similar gelatinisation pattern for rice flours. Biliaderis et al. [77] explained that a lower gelatinisation temperature contributes to the upsurge in ΔHgel, and ΔHgel has an inverse proportional relationship with amylose content, in which ΔHgel increases when amylose concentration decreases. Similarly, the amylose contents of Bario Adan Halus (26.67%) and Bario Celum (26.68%) were the lowest possible among all, thus resulting in the highest ΔHgel, 2.13 J/g and 2.59 J/g, respectively. According to Cornejo and Rosell [64], choosing high ΔHgel flours with low Tp is preferable, especially to improve crumb cohesiveness and resilience. Moreover, a positive correlation exists between Tf and the specific volume of the end product. This outcome might be linked to the rising of bread during baking [64]. Bario Tuan and Bario Merah Sederhana exhibited greater Tf than the control sample, which might have delivered a positive impact on the final product in terms of the specific volume.

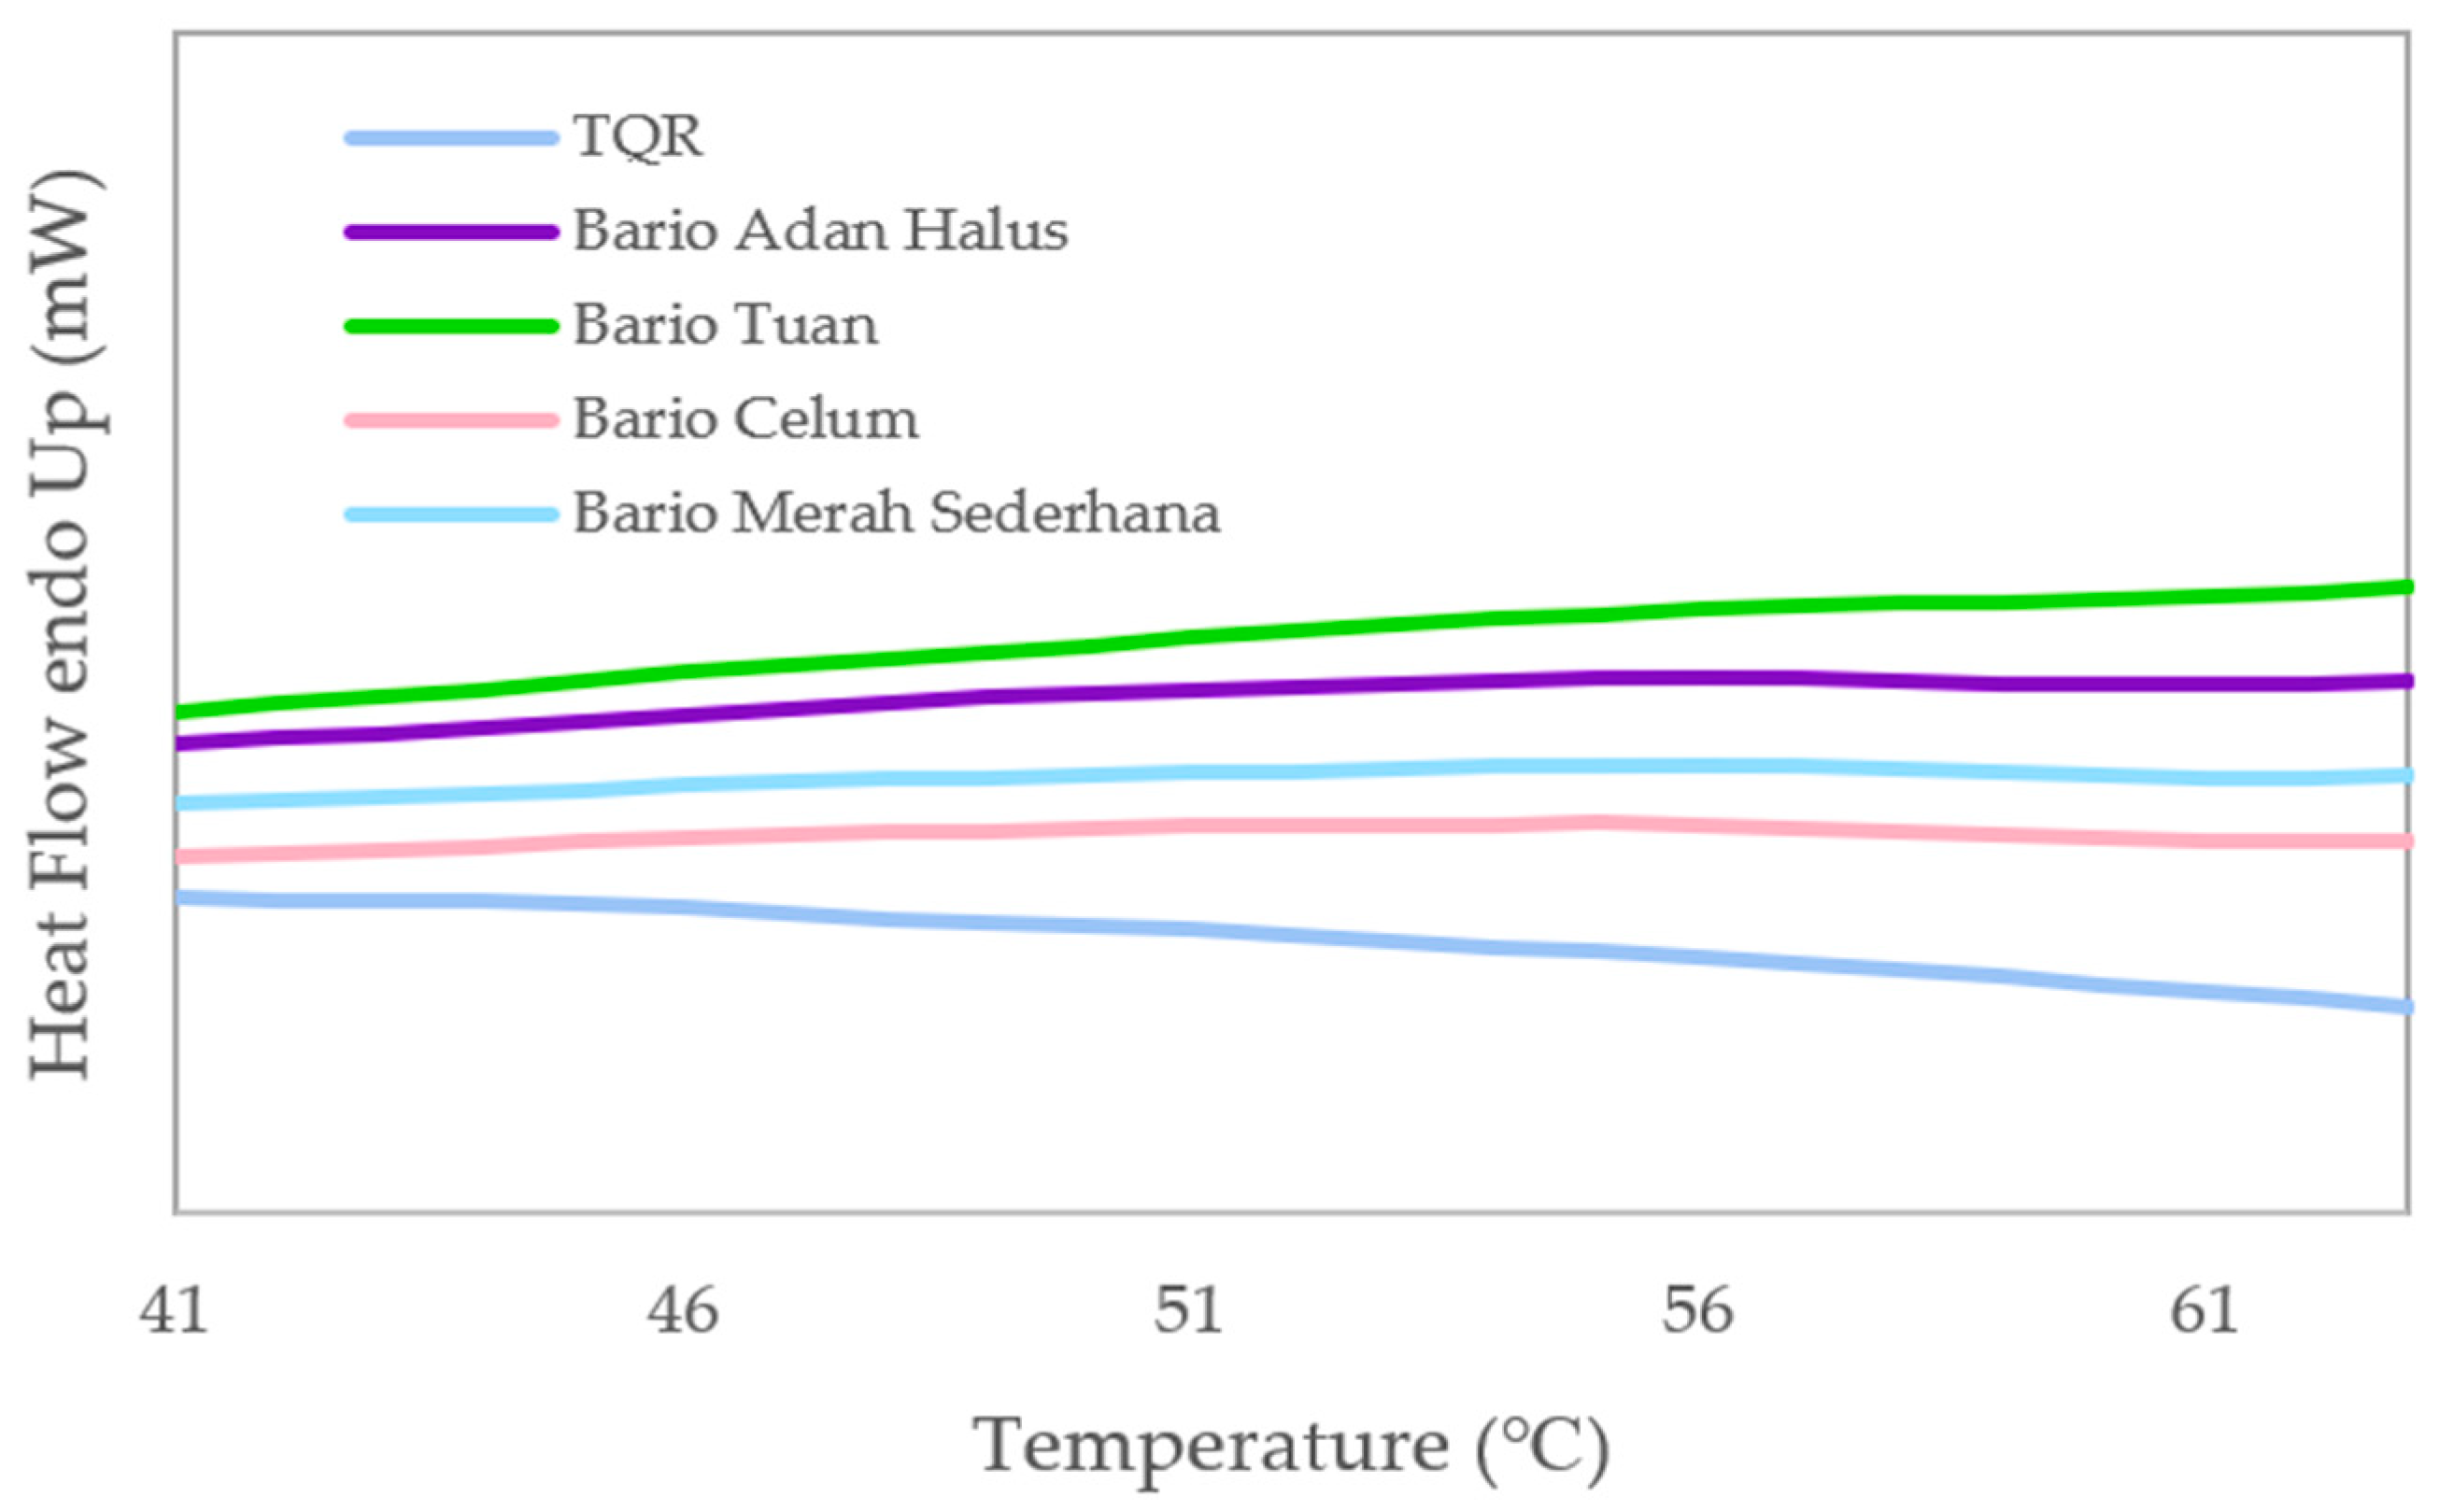
3.2.6. Retrogradation

Retrogradation is defined as a process by which amylose and amylopectin molecules reassociate through hydrogen bonding, consequently developing a three-dimensional network structure [78]. Figure 3 shows the retrogradation curve for rice flour samples.
Table 2 presents the retrogradation profiles of the control and treatment samples. The To range is between 41.80 °C and 50.79 °C. The highest To was exhibited by the Bario Tuan variety (50.79 °C), followed in descending order by Bario Merah Sederhana (45.90 °C); Bario Adan Halus (44.50 °C); Bario Celum (42.65 °C); and the control sample, TQR (41.80 °C). There was a significant difference (p < 0.05) in the To of Bario Tuan compared with other varieties. Moreover, the Tp and Tf ranged between 44.36 °C and 56.15 °C, and between 48.71 °C and 61.25 °C, respectively. The highest Tp was shown by Bario Tuan (56.15 °C), whereas the lowest Tp was showed by the control sample, TQR (44.36 °C). Generally, there are no significant differences (p > 0.05) shown by all varieties, except TQR, which had the significantly (p < 0.05) lowest Tp. On the other hand, Bario Merah Sederhana (61.25 °C) had the highest Tf, whereas the lowest was presented by TQR (48.71 °C). Similarly, all varieties showed no significant difference (p > 0.05), except the TQR variety. In addition, the gap between temperature range (Tf–To) can be determined and related to the length of the double helix, so a wider endotherm suggests a wider range of double-helical lengths [79]. The ΔHret range was between 0.13 J/g and 0.87 J/g. The highest ΔHret was exhibited by Bario Celum (0.87 J/g), and the lowest was the control sample, TQR (0.13 J/g). A high value of ΔHret means more energy is required to break down the reassociated amylopectin formed during the storage period, indicating a higher retrogradation process [80]. Thus, Bario Celum (0.87 J/g) and Bario Adan Halus (0.76 J/g) exhibited significantly (p < 0.05) higher retrogradation processes compared with the other varieties.
According to Chang et al. [81], amylose content is one of the significant factors influencing starch’s retrogradation. Nonetheless, the highest amylose content exhibited by Bario Tuan and ΔHret of Bario Tuan (0.19 J/g) was lower than that in Bario Adan Halus (0.76 J/g). This indicates that the retrogradation enthalpy was less pronounced in Bario Tuan even though the amylose content was high within this variety. This possibly results from the higher fat content within Bario Tuan (2.45%) than within Bario Adan Halus (0.16%), which might develop starch–lipid complexes, consequently decreasing the amount of starch retrogradation. In general, lipid reduces the movement of amylose due to the development of complexes constructed between amylose and lipid [82]. The starch–lipid complex is developed through a hydrophobic effect due to hydrophilic and hydrophobic groups in lipids. The latter group leads the lipids to move closer to the internal hydrophobic cavities of amylose [81]. On the other hand, factors such as small molecular sugar and non-polysaccharides, salt ions, granule size, and the ratio of amylose and amylopectin within starch granules could influence the retrogradation profiles [83,84,85,86].

4. Conclusions

In conclusion, Bario rice flour possesses a good source of protein content. A significant protein content will increase the nutritional value of gluten-free products. Moreover, the results based on proximate composition (ash, crude fat, and crude fibre content) showed that pigmented Bario rice flour contains a higher value than non-pigmented rice flour, including the control sample. This is primarily due to the external layer of rice kernels. In addition, the carbohydrate content in Bario rice flour varieties is lower than that in the control sample because Bario rice flour generally has higher concentrations of the other proximate compositions. All Bario rice flour classified as having high amylose contents could positively impact the bread volume. The colour profiles of Bario rice flour samples varied depending on the rice bran’s pigmentation. The WAC of all samples showed no significant differences (p > 0.05) from each other. The swelling capacity was high in all Bario rice flour and can potentially be used in bread-making due to this easy swelling process. The WSI was higher in pigmented Bario rice flour, most probably due to the high concentrations of phenolic compound leached out during processing. The gelatinisation and retrogradation profiles provide information regarding the behaviour of rice flour during and after processing. Bario Tuan and Bario Merah Sederhana exhibited greater Tf than the control sample. Tf generally correlated positively with the final product’s specific volume.
To summarise, this research suggests the application of Bario rice flour in gluten-free bread, especially considering the nutritional content, mainly the carbohydrate, crude protein, and amylose contents, which positively influence the quality of gluten-free bread. Moreover, Bario rice flour offers promising physicochemical properties regarding its swelling capacity, which is beneficial in developing gluten-free bread. Therefore, this study has investigated the nutritional compositions and physicochemical properties of Bario rice flour, which can be helpful information and knowledge for product development. However, future research could extend this study by looking at the quality of the gluten-free bread developed from Bario rice flour. Such research could help increase the scientific knowledge of Bario rice flour varieties as well as promote the utilisation of local crops in developing gluten-free products.

Author Contributions

Conceptualization, H.M.; Data curation, M.E.R.; Formal analysis, M.E.R., A.H.A.A. and N.Q.I.M.N.; Funding acquisition, H.M.; Methodology, M.E.R., A.H.A.A., N.Q.I.M.N., F.Y. and H.M.; Project administration, M.E.R. and H.M.; Software, F.Y.; Supervision, H.M.; Writing—original draft, M.E.R.; Writing—review & editing, H.M. All authors have read and agreed to the published version of the manuscript.

Funding

This research was funded by Universiti Malaysia Sabah (UMS), SDK0137-2020.

Institutional Review Board Statement

Not applicable.

Informed Consent Statement

Not applicable.

Data Availability Statement

Not applicable.

Acknowledgments

I express my gratitude to Hasmadi Mamat, my supervisor, for his guidance. Special appreciation is also extended to the entire Faculty of Food Science and Nutrition, Universiti Malaysia Sabah lab staff for their excellent assistance and those directly or indirectly involved in this research.

Conflicts of Interest

The authors declare no conflict of interest.

References

  1. Ooms, N.; Delcour, J.A. How to impact gluten protein network formation during wheat flour dough making. Curr. Opin. Food Sci. 2019, 25, 88–97. [Google Scholar] [CrossRef]
  2. Lin, H.I.; Yu, Y.Y.; Wen, F.I.; Liu, P.T. Status of Food Security in East and Southeast Asia and Challenges of Climate Change. Climate 2022, 10, 40. [Google Scholar] [CrossRef]
  3. Grain and Feed Annual (Annual Report MY2022-0001). Available online: https://apps.fas.usda.gov/newgainapi/api/Report/DownloadReportByFileName?fileName=Grain%20and%20Feed%20Annual_Kuala%20Lumpur_Malaysia_MY2022-0001.pdf (accessed on 11 July 2022).
  4. Ren, Y.; Linter, B.R.; Linforth, R.; Foster, T.J. A comprehensive investigation of gluten free bread dough rheology, proving and baking performance and bread qualities by response surface design and principal component analysis. Food Funct. 2020, 11, 5333–5345. [Google Scholar] [CrossRef] [PubMed]
  5. Asri, N.; Rostami-Nejad, M.; Anderson, R.P.; Rostami, K. The gluten gene: Unlocking the understanding of gluten sensitivity and intolerance. Appl. Clin. Genet. 2021, 14, 37. [Google Scholar] [CrossRef]
  6. Catassi, C.; Verdu, E.F.; Bai, J.C.; Lionetti, E. Coeliac disease. Lancet 2021, 399, 2413–2426. [Google Scholar] [CrossRef]
  7. Bascuñán, K.A.; Araya, M.; Roncoroni, L.; Doneda, L.; Elli, L. Dietary gluten as a conditioning factor of the gut microbiota in celiac disease. Adv. Nutr. 2020, 11, 160–174. [Google Scholar] [CrossRef] [PubMed]
  8. Tharise, N.; Julianti, E.; Nurminah, M. Evaluation of physico-chemical and functional properties of composite flour from cassava, rice, potato, soybean and xanthan gum as alternative of wheat flour. Int. Food Res. J. 2014, 21, 1642–1643. [Google Scholar]
  9. Feizollahi, E.; Mirmoghtadaie, L.; Mohammadifar, M.A.; Jazaeri, S.; Hadaegh, H.; Nazari, B.; Lalegani, S. Sensory, digestion, and texture quality of commercial gluten-free bread: Impact of broken rice flour type. J. Texture Stud. 2018, 49, 395–403. [Google Scholar] [CrossRef]
  10. Aleman, R.S.; Paz, G.; Morris, A.; Prinyawiwatkul, W.; Moncada, M.; King, J.M. High protein brown rice flour, tapioca starch & potato starch in the development of gluten-free cupcakes. Food Sci. Technol. 2021, 152, 112326. [Google Scholar] [CrossRef]
  11. Wu, T.; Wang, L.; Li, Y.; Qian, H.; Liu, L.; Tong, L.; Zhou, S. Effect of milling methods on the properties of rice flour and gluten-free rice bread. Food Sci. Technol. 2019, 108, 137–144. [Google Scholar] [CrossRef]
  12. Park, J.H.; Kim, D.C.; Lee, S.E.; Kim, O.W.; Kim, H.; Lim, S.T.; Kim, S.S. Effects of rice flour size fractions on gluten free rice bread. Food Sci. Biotechnol. 2014, 23, 1875–1883. [Google Scholar] [CrossRef]
  13. Luo, S.; Yan, X.; Fu, Y.; Pang, M.; Chen, R.; Liu, Y.; Chen, J.; Liu, C. The quality of gluten-free bread made of brown rice flour prepared by low temperature impact mill. Food Chem. 2021, 348, 129032. [Google Scholar] [CrossRef] [PubMed]
  14. Gui, Y.; Chen, G.; Tian, W.; Yang, S.; Chen, J.; Wang, F.; Li, Y. Normal rice flours perform better in gluten-free bread than glutinous rice flours. J. Food Sci. 2022, 87, 554–566. [Google Scholar] [CrossRef] [PubMed]
  15. Wong, S.C.; Yiu, P.H.; Bong, S.T.W.; Lee, H.H.; Neoh, P.N.P.; Rajan, A. Analysis of Sarawak Bario rice diversity using microsatellite markers. Am. J. Agric. Biol. Sci. 2009, 4, 298–304. [Google Scholar] [CrossRef]
  16. Thomas, R.; Yeoh, T.K.; Wan-Nadiah, W.A.; Bhat, R. Quality evaluation of flat rice noodles (Kway Teow) prepared from Bario and Basmati rice. Sains Malays. 2014, 43, 339–347. Available online: http://www.ukm.edu.my/jsm/pdf_files/SM-PDF-43-3-2014/03%20Rachel%20Thomas.pdf. (accessed on 14 July 2022).
  17. Kevin, M.T.S.; Ahmed, O.H.; Asrina, W.Y.W.; Rajan, A.; Ahzam, M. Towards growing Bario rice on lowland soils: A preliminary nitrogen and potassium fertilization trial. Am. J. Agric. Biol. Sci. 2007, 2, 99–105. [Google Scholar] [CrossRef]
  18. Nicholas, D.; Hazila, K.K.; Chua, H.P.; Rosniyana, A. Nutritional value and glycemic index of Bario rice varieties. J. Trop. Agric. Food Sci. 2014, 42, 1–8. Available online: http://jtafs.mardi.gov.my/jtafs/42-1/Bario%20rice.pdf (accessed on 14 July 2022).
  19. Sharma, K.; Lee, Y.R. Effect of different storage temperature on chemical composition of onion (Allium cepa L.) and its enzymes. J. Food Sci. Technol. 2016, 53, 1620–1632. [Google Scholar] [CrossRef]
  20. Nielsen, S.S. Food Analysis Laboratory Manual, 3rd ed.; Springer International Publishing: Cham, Switzerland, 2017; ISBN 978-3-319-44127-6. [Google Scholar]
  21. Bolea, C.A.; Grigore-Gurgu, L.; Aprodu, I.; Vizireanu, C.; Stănciuc, N. Process-structure-function in association with the main bioactive of black rice flour sieving fractions. Foods 2019, 8, 131. [Google Scholar] [CrossRef]
  22. Hunter L, a, b Versus CIE 1976 L* a* b*. Available online: https://support.hunterlab.com/hc/en-us/article_attachments/201437795/an02_01.pdf (accessed on 20 July 2022).
  23. Coțovanu, I.; Mironeasa, S. Buckwheat Seeds: Impact of milling fractions and addition level on wheat bread dough rheology. Appl. Sci. 2021, 11, 1731. [Google Scholar] [CrossRef]
  24. Kraithong, S.; Lee, S.; Rawdkuen, S. Physicochemical and functional properties of Thai organic rice flour. J. Cereal Sci. 2018, 79, 259–266. [Google Scholar] [CrossRef]
  25. Noorfarahzilah, M.; Mansoor, A.H.; Hasmadi, M. Proximate composition, mineral content and functional properties of Tarap (Artocarpus odoratissimus) seed flour. Food Res. 2017, 1, 89–96. [Google Scholar] [CrossRef]
  26. Anyasi, T.A.; Jideani, A.I.; Mchau, G.R. Effects of organic acid pretreatment on microstructure, functional and thermal properties of unripe banana flour. J. Food Meas. Charact. 2017, 11, 99–110. [Google Scholar] [CrossRef] [Green Version]
  27. Gunaratne, A.; Wu, K.; Collado, L.; Gan, R.Y.; Arachchi, L.V.; Kumara, K.; Corke, H. Physicochemical and functional properties of Caryota urens flour as compared to wheat flour. Int. J. Food Sci. Technol. 2016, 51, 2647–2653. [Google Scholar] [CrossRef]
  28. Wani, I.A.; Andrabi, S.N.; Sogi, D.S.; Hassan, I. Comparative study of physicochemical and functional properties of flours from kidney bean (Phaseolus vulgaris L.) and green gram (Vigna radiata L.) cultivars grown in Indian temperate climate. Legume Sci. 2020, 2, e11. [Google Scholar] [CrossRef]
  29. Wang, S.; Li, C.; Zhang, X.; Copeland, L.; Wang, S. Retrogradation enthalpy does not always reflect the retrogradation behavior of gelatinised starch. Sci. Rep. 2016, 6, 20965. [Google Scholar] [CrossRef]
  30. Islam, M.Z.; Ud-Din, M.S.; Haque, M.A. Studies on the effect of brown rice and maise flour on the quality of bread. J. Bangladesh Agric. Univ. 2011, 9, 297–304. [Google Scholar] [CrossRef]
  31. Muttagi, G.C.; Ravindra, U. Chemical and nutritional composition of traditional rice varieties of Karnataka. J. Pharmacogn. Phytochem. 2020, 9, 2300–2309. [Google Scholar] [CrossRef]
  32. Oppong, D.; Panpipat, W.; Chaijan, M. Chemical, physical, and functional properties of Thai indigenous brown rice flours. PLoS ONE 2021, 16, e0255694. [Google Scholar] [CrossRef]
  33. Jamal, S.; Qazi, I.M.; Ahmed, I. Comparative studies on flour proximate compositions and functional properties of selected Pakistani rice varieties. Pak. Acad. Sci. 2016, 53, 47–56. Available online: https://www.paspk.org/wp-content/uploads/2016/05/Comparative-Studies-on.pdf (accessed on 26 July 2022).
  34. Legal Research Board. Part VIII: Standard and Particular Labelling Requirements for Food (Cereal, Cereal Product, Starch and Bread. In Food Act 1983 (Act 281) & Regulations (Laws of Malaysia); International Law Book Services: Selangor, Malaysia, 2021; p. 99. [Google Scholar]
  35. USDA Foreign Agricultural Service (Rice Flour Standards and Labelling Guidelines Established). Available online: https://apps.fas.usda.gov/newgainapi/api/report/downloadreportbyfilename?filename=Rice%20Flour%20Standards%20and%20Labelling%20Guidelines%20Established_Tokyo_Japan_6-28-2017.pdf (accessed on 20 July 2020).
  36. Verma, D.K.; Srivastav, P.P. Proximate composition, mineral content and fatty acids analyses of aromatic and non-aromatic Indian rice. Rice Sci. 2017, 24, 21–31. [Google Scholar] [CrossRef]
  37. Rahman, A.N.F.; Bilang, M.; Ikawati, L.N. Physical and proximate analysis of green banana cake premix flour. IOP Conf. Ser. Earth Environ. Sci. 2020, 486, 12051. [Google Scholar] [CrossRef]
  38. Bello, B.K.; Hou, Y.; Zhao, J.; Jiao, G.; Wu, Y.; Li, Z.; Zhang, J. NF-YB 1-YC 12-bHLH 144 complex directly activates Wx to regulate grain quality in rice (Oryza sativa L.). Plant Biotechnol. J. 2019, 17, 1222–1235. [Google Scholar] [CrossRef] [PubMed]
  39. Czaja, T.; Sobota, A.; Szostak, R. Quantification of ash and moisture in wheat flour by Raman spectroscopy. Foods 2020, 9, 280. [Google Scholar] [CrossRef] [Green Version]
  40. Thongkaew, C.; Singthong, J. Effect of partial substitution of riceberry rice flour on rice noodles quality. Food Res. 2020, 4, 9–16. [Google Scholar] [CrossRef]
  41. Varastegani, B.; Zzaman, W.; Yang, T.A. Investigation on physicochemical and sensory evaluation of cookies substituted with papaya pulp flour. J. Food Qual. 2015, 38, 175–183. [Google Scholar] [CrossRef]
  42. Yuliana, N.D.; Akhbar, M.A. Chemical and physical evaluation, antioxidant and digestibility profiles of white and pigmented rice from different areas of Indonesia. Braz. J. Food Technol. 2020, 23, 1–13. [Google Scholar] [CrossRef]
  43. Singh, N.; Paul, P.; Virdi, A.S.; Kaur, P.; Mahajan, G. Influence of early and delayed transplantation of paddy on physicochemical, pasting, cooking, textural, and protein characteristics of milled rice. Cereal Chem. 2014, 91, 389–397. [Google Scholar] [CrossRef]
  44. Hager, A.S.; Wolter, A.; Jacob, F.; Zannini, E.; Arendt, E.K. Nutritional properties and ultra-structure of commercial gluten free flours from different botanical sources compared to wheat flours. J. Cereal Sci. 2012, 56, 239–247. [Google Scholar] [CrossRef]
  45. Paz, G.M.; King, J.M.; Prinyawiwatkul, W. High Protein Rice Flour in the Development of Gluten-Free Bread. J. Culin. Sci. Technol. 2021, 19, 315–330. [Google Scholar] [CrossRef]
  46. Puri, S.; Dhillon, B.; Sodhi, N.S. Effect of degree of milling (Dom) on overall quality of rice—A review. Int. J. Adv. Biotechnol. Res. 2014, 5, 474–489. [Google Scholar]
  47. Priya, T.R.; Nelson, A.R.L.E.; Ravichandran, K.; Antony, U. Nutritional and functional properties of coloured rice varieties of South India: A review. J. Ethn. Foods 2019, 6, 11. [Google Scholar] [CrossRef]
  48. Sapwarobol, S.; Saphyakhajorn, W.; Astina, J. Biological functions and activities of rice bran as a functional ingredient: A review. Nutr. Metab. Insights 2021, 14, 11786388211058559. [Google Scholar] [CrossRef] [PubMed]
  49. Araki, E.; Ashida, K.; Aoki, N.; Takahashi, M.; Hamada, S. Characteristics of rice flour suitable for the production of rice flour bread containing gluten and methods of reducing the cost of producing rice flour. Jpn. Agric. Res. Q. JARQ 2016, 50, 23–31. [Google Scholar] [CrossRef]
  50. Takahashi, M.; Homma, N.; Morohashi, K.; Nakamura, K.; Suzuki, Y. Effect of rice cultivar characteristics on the rice flour bread quality. Nippon. Shokuhin Kagaku Kogaku Kaishi = J. Jpn. Soc. Food Sci. Technol. 2009, 56, 394–402. [Google Scholar] [CrossRef] [Green Version]
  51. Yano, H.; Koda, T.; Fujita, N.; Nishioka, A. Effect of amylose content in rice flour on batter rheology and bread baking quality. J. Food Processing Preserv. 2020, 44, e14462. [Google Scholar] [CrossRef]
  52. Zhang, H.; Jang, S.G.; Lar, S.M.; Lee, A.R.; Cao, F.Y.; Seo, J.; Kwon, S.W. Genome-wide identification and genetic variations of the starch synthase gene family in rice. Plants 2021, 10, 1154. [Google Scholar] [CrossRef]
  53. Aoki, N.; Kataoka, T.; Nishiba, Y. Crucial role of amylose in the rising of gluten-and additive-free rice bread. J. Cereal Sci. 2020, 92, 102905. [Google Scholar] [CrossRef]
  54. Yano, H.; Fukui, A.; Kajiwara, K.; Kobayashi, I.; Yoza, K.I.; Satake, A.; Villeneuve, M. Development of gluten-free rice bread: Pickering stabilization as a possible batter-swelling mechanism. LWT-Food Sci. Technol. 2017, 79, 632–639. [Google Scholar] [CrossRef]
  55. Aoki, N.; Umemoto, T.; Hamada, S.; Suzuki, K.; Suzuki, Y. The amylose content and amylopectin structure affect the shape and hardness of rice bread. J. Appl. Glycosci. 2012, 59, 75–82. [Google Scholar] [CrossRef]
  56. Subba, D.; Katawal, S.B. Effect of particle size of rice flour on physical and sensory properties of Sel-roti. J. Food Sci. Technol. 2013, 50, 181–185. [Google Scholar] [CrossRef] [PubMed]
  57. Ponjanta, J.; Chomsri, N.O.; Meechoui, S. Correlation of pasting behaviors with total phenolic compounds and starch digestibility of indigenous pigmented rice grown in upper Northern Thailand. Funct. Foods Health Dis. 2016, 6, 133–143. [Google Scholar] [CrossRef]
  58. Huang, Y.P.; Lai, H.M. Bioactive compounds and antioxidative activity of colored rice bran. J. Food Drug Anal. 2016, 24, 564–574. [Google Scholar] [CrossRef] [PubMed]
  59. Rosniyana, A.; Hazila, K.K.; Syed, A.S.N. Characteristics of local rice flour (MR 220) produced by wet and dry milling methods. J. Trop. Agric. Food Sci. 2016, 44, 147–155. Available online: http://jtafs.mardi.gov.my/jtafs/44-1/characteristics.pdf (accessed on 1 August 2022).
  60. Martínez, M.M.; Gómez, M. Rheological and microstructural evolution of the most common gluten-free flours and starches during bread fermentation and baking. J. Food Eng. 2017, 197, 78–86. [Google Scholar] [CrossRef]
  61. Thomas, R.; Bhat, R.; Kuang, Y.T.; Abdullah, W.N.W. Functional and pasting properties of locally grown and imported exotic rice varieties of Malaysia. Food Sci. Technol. Res. 2014, 20, 469–477. [Google Scholar] [CrossRef] [Green Version]
  62. Alcázar-Alay, S.C.; Meireles, M.A.A. Physicochemical properties, modifications and applications of starches from different botanical sources. Food Sci. Technol. 2015, 35, 215–236. [Google Scholar] [CrossRef]
  63. Han, H.M.; Cho, J.H.; Kang, H.W.; Koh, B.K. Rice varieties in relation to rice bread quality. J. Sci. Food Agric. 2012, 92, 1462–1467. [Google Scholar] [CrossRef]
  64. Cornejo, F.; Rosell, C.M. Physicochemical properties of long rice grain varieties in relation to gluten free bread quality. Food Sci. Technol. 2015, 62, 1203–1210. [Google Scholar] [CrossRef]
  65. Vamadevan, V.; Bertoft, E. Observations on the impact of amylopectin and amylose structure on the swelling of starch granules. Food Hydrocoll. 2020, 103, 105663. [Google Scholar] [CrossRef]
  66. Wani, A.A.; Singh, P.; Shah, M.A.; Schweiggert-Weisz, U.; Gul, K.; Wani, I.A. Rice starch diversity: Effects on structural, morphological, thermal, and physicochemical properties—A review. Compr. Rev. Food Sci. Food Saf. 2012, 11, 417–436. [Google Scholar] [CrossRef]
  67. Li, G.; Zhu, F. Physicochemical properties of quinoa flour as affected by starch interactions. Food Chem. 2017, 221, 1560–1568. [Google Scholar] [CrossRef] [PubMed]
  68. Waziiroh, E.; Schoenlechner, R.; Jaeger, H.; Brusadelli, G.; Bender, D. Understanding gluten-free bread ingredients during ohmic heating: Function, effect and potential application for breadmaking. Eur. Food Res. Technol. 2022, 248, 1021–1034. [Google Scholar] [CrossRef]
  69. Kusumayanti, H.; Handayani, N.A.; Santosa, H. Swelling power and water solubility of cassava and sweet potatoes flour. Procedia Environ. Sci. 2015, 23, 164–167. [Google Scholar] [CrossRef]
  70. Suklaew, P.O.; Chusak, C.; Adisakwattana, S. Physicochemical and functional characteristics of RD43 rice flour and its food application. Foods 2020, 9, 1912. [Google Scholar] [CrossRef] [PubMed]
  71. Shafi, S.; Wani, I.A.; Gani, A.; Sharma, P.; Wani, H.M.; Masoodi, F.A.; Hamdani, A.M. Effect of water and ether extraction on functional and antioxidant properties of Indian horse chestnut (Aesculus indica Colebr) flour. J. Food Meas. Charact. 2016, 10, 387–395. [Google Scholar] [CrossRef]
  72. Thiranusornkij, L.; Thamnarathip, P.; Chandrachai, A.; Kuakpetoon, D.; Adisakwattana, S. Physicochemical properties of Hom Nil (Oryza sativa) rice flour as gluten free ingredient in bread. Foods 2018, 7, 159. [Google Scholar] [CrossRef]
  73. Šárka, E.; Dvořáček, V. New processing and applications of waxy starch (a review). J. Food Eng. 2017, 206, 77–87. [Google Scholar] [CrossRef]
  74. Hasjim, J.; Li, E.; Dhital, S. Milling of rice grains: Effects of starch/flour structures on gelatinisation and pasting properties. Carbohydr. Polym. 2013, 92, 682–690. [Google Scholar] [CrossRef]
  75. Amini, A.M.; Razavi, S.M.A.; Mortazavi, S.A. Morphological, physicochemical, and viscoelastic properties of sonicated corn starch. Carbohydr. Polym. 2015, 122, 282–292. [Google Scholar] [CrossRef]
  76. Farooq, M.A.; Murtaza, M.A.; Aadil, R.M.; Arshad, R.; Rahaman, A.; Siddique, R.; Haq, A.U. Investigating the structural properties and in vitro digestion of rice flours. Food Sci. Nutr. 2021, 9, 2668–2675. [Google Scholar] [CrossRef] [PubMed]
  77. Biliaderis, C.G.; Page, C.M.; Maurice, T.J.; Juliano, B.O. Thermal characterisation of rice starches: A polymeric approach to phase transitions of granular starch. J. Agric. Food Chem. 1986, 34, 6–14. [Google Scholar] [CrossRef]
  78. Wang, S.; Li, C.; Copeland, L.; Niu, Q.; Wang, S. Starch retrogradation: A comprehensive review. Compr. Rev. Food Sci. Food Saf. 2015, 14, 568–585. [Google Scholar] [CrossRef]
  79. Roman, L.; Reguilon, M.P.; Gomez, M.; Martinez, M.M. Intermediate length amylose increases the crumb hardness of rice flour gluten-free breads. Food Hydrocoll. 2020, 100, 105451. [Google Scholar] [CrossRef]
  80. Shi, M.; Chen, Y.; Yu, S.; Gao, Q. Preparation and properties of RS III from waxy maise starch with pullulanase. Food Hydrocoll. 2013, 33, 19–25. [Google Scholar] [CrossRef]
  81. Chang, Q.; Zheng, B.; Zhang, Y.; Zeng, H. A comprehensive review of the factors influencing the formation of retrograded starch. Int. J. Biol. Macromol. 2021, 186, 163–173. [Google Scholar] [CrossRef] [PubMed]
  82. Becker, A.; Hill, S.E.; Mitchell, J.R. Relevance of amylose-lipid complexes to the behaviour of thermally processed starches. Starch-Stärke 2001, 53, 121–130. [Google Scholar] [CrossRef]
  83. Kang, N.; Reddy, C.K.; Park, E.Y.; Choi, H.D.; Lim, S.T. Antistaling effects of hydrocolloids and modified starch on bread during cold storage. Food Sci. Technol. 2018, 96, 13–18. [Google Scholar] [CrossRef]
  84. Fu, Z.; BeMiller, J.N. Effect of hydrocolloids and salts on retrogradation of native and modified maise starch. Food Hydrocoll. 2017, 69, 36–48. [Google Scholar] [CrossRef]
  85. Yamaguchi, Y.; Okawa, Y.; Ninomiya, K.; Kumagai, H.; Kumagai, H. Evaluation and suppression of retrogradation of gelatinised rice starch. J. Nutr. Sci. Vitaminol. 2019, 65, 134–138. [Google Scholar] [CrossRef]
  86. BeMiller, J.N. Pasting, paste, and gel properties of starch–hydrocolloid combinations. Carbohydr. Polym. 2011, 86, 386–423. [Google Scholar] [CrossRef]
Figure 1. The colour diversity of (a) TQR (reference sample) and Bario rice flour, (b) Bario Adan Halus, (c) Bario Tuan, (d) Bario Celum, and (e) Bario Merah Sederhana.
Applsci 12 09064 g001
Figure 2. DSC curve of gelatinised rice flour samples for TQR, Bario Adan Halus, Bario Tuan, Bario Celum, and Bario Merah Sederhana.
Applsci 12 09064 g002
Figure 3. Retrogradation curve of rice flour samples for TQR, Bario Adan Halus, Bario Tuan, Bario Celum, and Bario Merah Sederhana.
Applsci 12 09064 g003
Table 1. Nutritional compositions of Bario rice flour varieties and TQR rice flour as a reference sample.
Nutritional CompositionsTQRBario Adan HalusBario TuanBario CelumBario Merah
Sederhana
Moisture8.47 ± 0.05 b8.35 ± 0.03 c8.69 ± 0.05 a8.67 ± 0.05 a8.50 ± 0.02 b
Ash0.25 ± 0.01 d0.27 ± 0.00 d1.25 ± 0.06 a0.63 ± 0.01 c0.98 ± 0.02 b
Crude fiber0.13 ± 0.03 c0.21 ± 0.03 c0.87 ± 0.05 a0.55 ± 0.07 b0.62 ± 0.09 b
Crude protein7.81 ± 0.45 c8.97 ± 0.08 ab8.66 ± 0.08 b6.89 ± 0.01 d9.43 ± 0.04 a
Crude fat0.22 ± 0.07 c0.16 ± 0.03 c2.45 ± 0.08 a1.13 ± 0.07 b1.32 ± 0.11 b
Carbohydrate83.12 ± 0.35 ab82.04 ± 0.10 ab79.25 ± 1.19 c82.13 ± 0.01 ab79.17 ± 0.29 c
Amylose content32.97 ± 2.96 a26.67 ± 0.49 b36.52 ± 1.37 a26.68 ± 0.69 b32.05 ± 0.81 ab
Mean ± standard deviation, (n = 3), except for amylose content: mean ± standard deviation, (n = 2); Mean values in the same row with different superscripts are significantly different with p < 0.05.
Table 2. Physicochemical properties of Bario rice varieties compared with TQR rice.
AnalysisTQRBario Adan HalusBario TuanBario CelumBario Merah Sederhana
Colour
L*93.62 ± 0.04 a94.34 ± 0.05 b84.84 ± 0.07 c70.99 ± 0.36 d75.26 ± 0.04 e
a*−0.15 ± 0.01 d−0.21 ± 0.02 d2.12 ± 0.07 c2.75 ± 0.06 b4.80 ± 0.01 a
b*5.27 ± 0.07 d6.21 ± 0.03 c14.46 ± 0.13 a1.20 ± 0.05 e7.91 ± 0.04 b
WAC (g/g)1.20 ± 0.00 a1.26 ± 0.04 a1.24 ± 0.03 a1.21 ± 0.00 a1.21 ± 0.01 a
Swelling capacity (g/g)23.53 ± 0.10 a23.60 ± 0.21 a22.97 ± 0.0 b20.31 ± 0.06 c22.91 ± 0.20 b
WSI (%)2.32 ± 0.01c1.83 ± 0.08 d2.84 ± 0.04 b2.70 ± 0.10 b3.44 ± 0.22 a
Gelatinisation
To77.41 ± 0.44 a71.43 ± 0.46 c74.04 ± 0.63 b74.89 ± 0.22 b76.49 ± 0.27 a
Tp80.49 ± 0.35 a77.03 ± 0.15 d78.72 ± 0.50 bc78.24 ± 0.41 c79.56 ± 0.21 ab
Tf83.22 ± 0.33 a80.77 ± 0.44 b84.45 ± 0.67 a81.17 ± 0.26 b84.38 ± 0.68 a
ΔHgel (J/g)0.79 ± 0.07 c2.13 ± 0.32 a1.77 ± 0.08 ab2.59 ± 0.61 a1.23 ± 0.16 bc
Retrogradation
To41.80 ± 0.52 c44.50 ± 1.90 bc50.79 ± 1.35 a42.65 ± 1.24 c45.90 ± 0.29 b
Tp44.36 ± 1.55 b54.01 ± 1.33 a56.15 ± 1.27 a53.64 ± 1.63 a54.91 ± 0.63 a
Tf48.71 ± 1.37 b60.19 ± 1.55 a61.02 ± 1.32 a60.19 ± 1.07 a61.25 ± 1.89 a
ΔHret (J/g)0.13 ± 0.03 c0.76 ± 0.11 a0.19 ± 0.04 c0.87 ± 0.12 a0.42 ± 0.08 b
WAC = water absorption index, WSI = water solubility index, To = onset temperature, Tp = peak temperature, Tf = final temperature, ΔHgel = gelatinisation enthalpy and ΔHret = retrogradation enthalpy; Mean ± standard deviation, (n = 3); Mean values in the same row with different superscripts are significantly different with p < 0.05.
Publisher’s Note: MDPI stays neutral with regard to jurisdictional claims in published maps and institutional affiliations.

