Communication

Electrothermally Activated CNT/GNP-Doped Anti-icing and De-Icing Systems: A Comparison Study of 3D Printed Circuits versus Coatings

by
Alejandro Cortés
*,
Alberto Jiménez-Suárez
,
Alejandro Ureña
,
Silvia G. Prolongo
and
Mónica Campo
*
Materials Science and Engineering Area, Escuela Superior de Ciencias Experimentales y Tecnología, Universidad Rey Juan Carlos, Calle Tulipán s/n, 28933 Móstoles, Spain
*
Authors to whom correspondence should be addressed.
Appl. Sci. 2022, 12(17), 8875; https://doi.org/10.3390/app12178875
Submission received: 27 July 2022 / Revised: 23 August 2022 / Accepted: 1 September 2022 / Published: 4 September 2022

Abstract

:

Featured Application

Anti-icing and de-icing systems.

Abstract

The present work studies the electrical and electrothermal properties of CNT/GNP-doped nanocomposites for optimizing their anti-icing and de-icing capabilities. Here, a comparison between 3D-printed circuits and coatings based on these materials is carried out. In this regard, the higher electrical conductivity that is achieved by the specimens when increasing the nanoparticle content and the higher cross-sectional area of the coatings with regard to the 3D-printed circuits induces a higher heat generated by the Joule’s effect. Moreover, the successful de-icing test performed by the specimen with the highest self-heating capability, evinces that the studied nanocomposites are suitable for de-icing purposes.

1. Introduction

Ice accretion on aerodynamic structures, such as aircraft wings or wind turbine blades, has been a major problem due to the operational and safety issues [1]. In this context, carbon nanoparticle-doped composites, which present excellent electrical and thermal properties [2], have been widely studied as self-heating materials [3]. In this regard, there are some interesting studies about coatings that are based on these materials with anti-icing and de-icing capabilities [4]. On the other hand, there are different approaches that are based on placing the resistive heating element, i.e., metallic wires [5] or carbon nanotube coated fibers [6], just in the desired area. In this context, Direct Write 3D printing technology allows the combining the great self-heating capabilities of carbon nanoparticle-doped composites with the ability of placing the heating material, selectively [7,8]. In the present study, the electrical and electrothermal capabilities of CNT/GNP-doped 3D printed circuits are compared to those coatings with similar characteristics in order to shed light on how these different approaches affect the anti-icing and de-icing performance.

2. Materials and Methods

2.1. Materials

The developed materials were based on a Bisphenol A Diglycidyl Ether (DGEBA), analytical standard resin with a Triethylenetetramine (TETA) hardener, of a technical grade (60%) which were both supplied by Sigma Aldrich, and were doped with carbon nanotubes (CNTs) and graphene nanoplatelets (GNPs). NC7000 CNTs, which present an average diameter of 9.5 nm and an average length of 1.5 µm, were supplied by Nanocyl and M25 GNPs, with an average thickness of 6–8 nm and an average lateral size of 25 μm, were supplied by XGSciences.

2.2. Manufacturing of Nanocomposite Specimens

Before carrying out the manufacturing of the specimens, a previously optimized calendering process using EXAKT 80E equipment was performed to disperse the nanofiller into the matrix [9]. Here, the distance between the rolls decreases with the number of cycles, but the speed of the rolls was kept constant. The 3D-printed circuits and coatings were prepared with four different nanoparticle wt. % contents: 0.5% CNT, 0.5% CNT + 0.5% GNP, 1.0% CNT, and 1.0% CNT + 0.5% GNP. Once the calendering process was completed, the hardener was added in a mass proportion of monomer to hardener of 100 to 14.3. The 3D-printed circuits were prepared using Direct Write technology, which is based on extruding a viscous paste through a pressurized syringe (Figure 1a), and using a BCN3D + printer according to previously optimized geometry and settings [10]. An example of a 3D-printed circuit is shown in Figure 1b. On the other hand, the coatings were prepared by using a 200 µm ZAA 2300 Automatic Film Applicator by Zehntner (Figure 1c). Then, the coatings were prepared to fit the same area to that of the 3D-printed circuits (around 5 × 5 cm2) in order to compare their heating capabilities. Finally, the copper wires were embedded into both the 3D-printed circuits and coatings as electrodes. All of the specimens were cured at room temperature for 48 h. Silver conductive paint was added to the coatings after embedding the electrodes to reduce the contact resistance and power losses. An example of coating is shown in Figure 1d.

2.3. Characterization

2.3.1. Morphological Characterization

A morphological characterization of the cross-section of the specimens were carried out by an image analysis of micrographs that were taken using a Leica DMR Optical Microscope that was equipped with a Nikkon 990 camera. Here, the width, length, thickness, and cross-sectional area of both 3D-printed circuits and coatings were measured using ImageJ software.

2.3.2. Electrical and Electrothermal Characterization

The electrical conductivity tests were carried out using a Keithley 2410 Source-Meter by obtaining the electrical resistance, R, from the V-I (Voltage-Intensity) slope in the range of 0 to 50 V. Then, the electrical conductivity, K, was obtained from the expression (1), with L being the distance between electrodes and A being the cross-sectional area of the specimen.
K = L/(A·R)
On the other hand, the self-heating tests were performed by using the same source-meter unit, Keithley 2410, by applying 1000 V. The self-heating tests were performed in two stages of 5 min each: first, a heating stage was conducted by applying the voltage, and then, a second stage involved cooling by turning off the power source. Here, the average and maximum temperature increments with regard to room temperature, ΔTav and ΔTmax, respectively, were recorded using a FLIR E50 thermal camera.

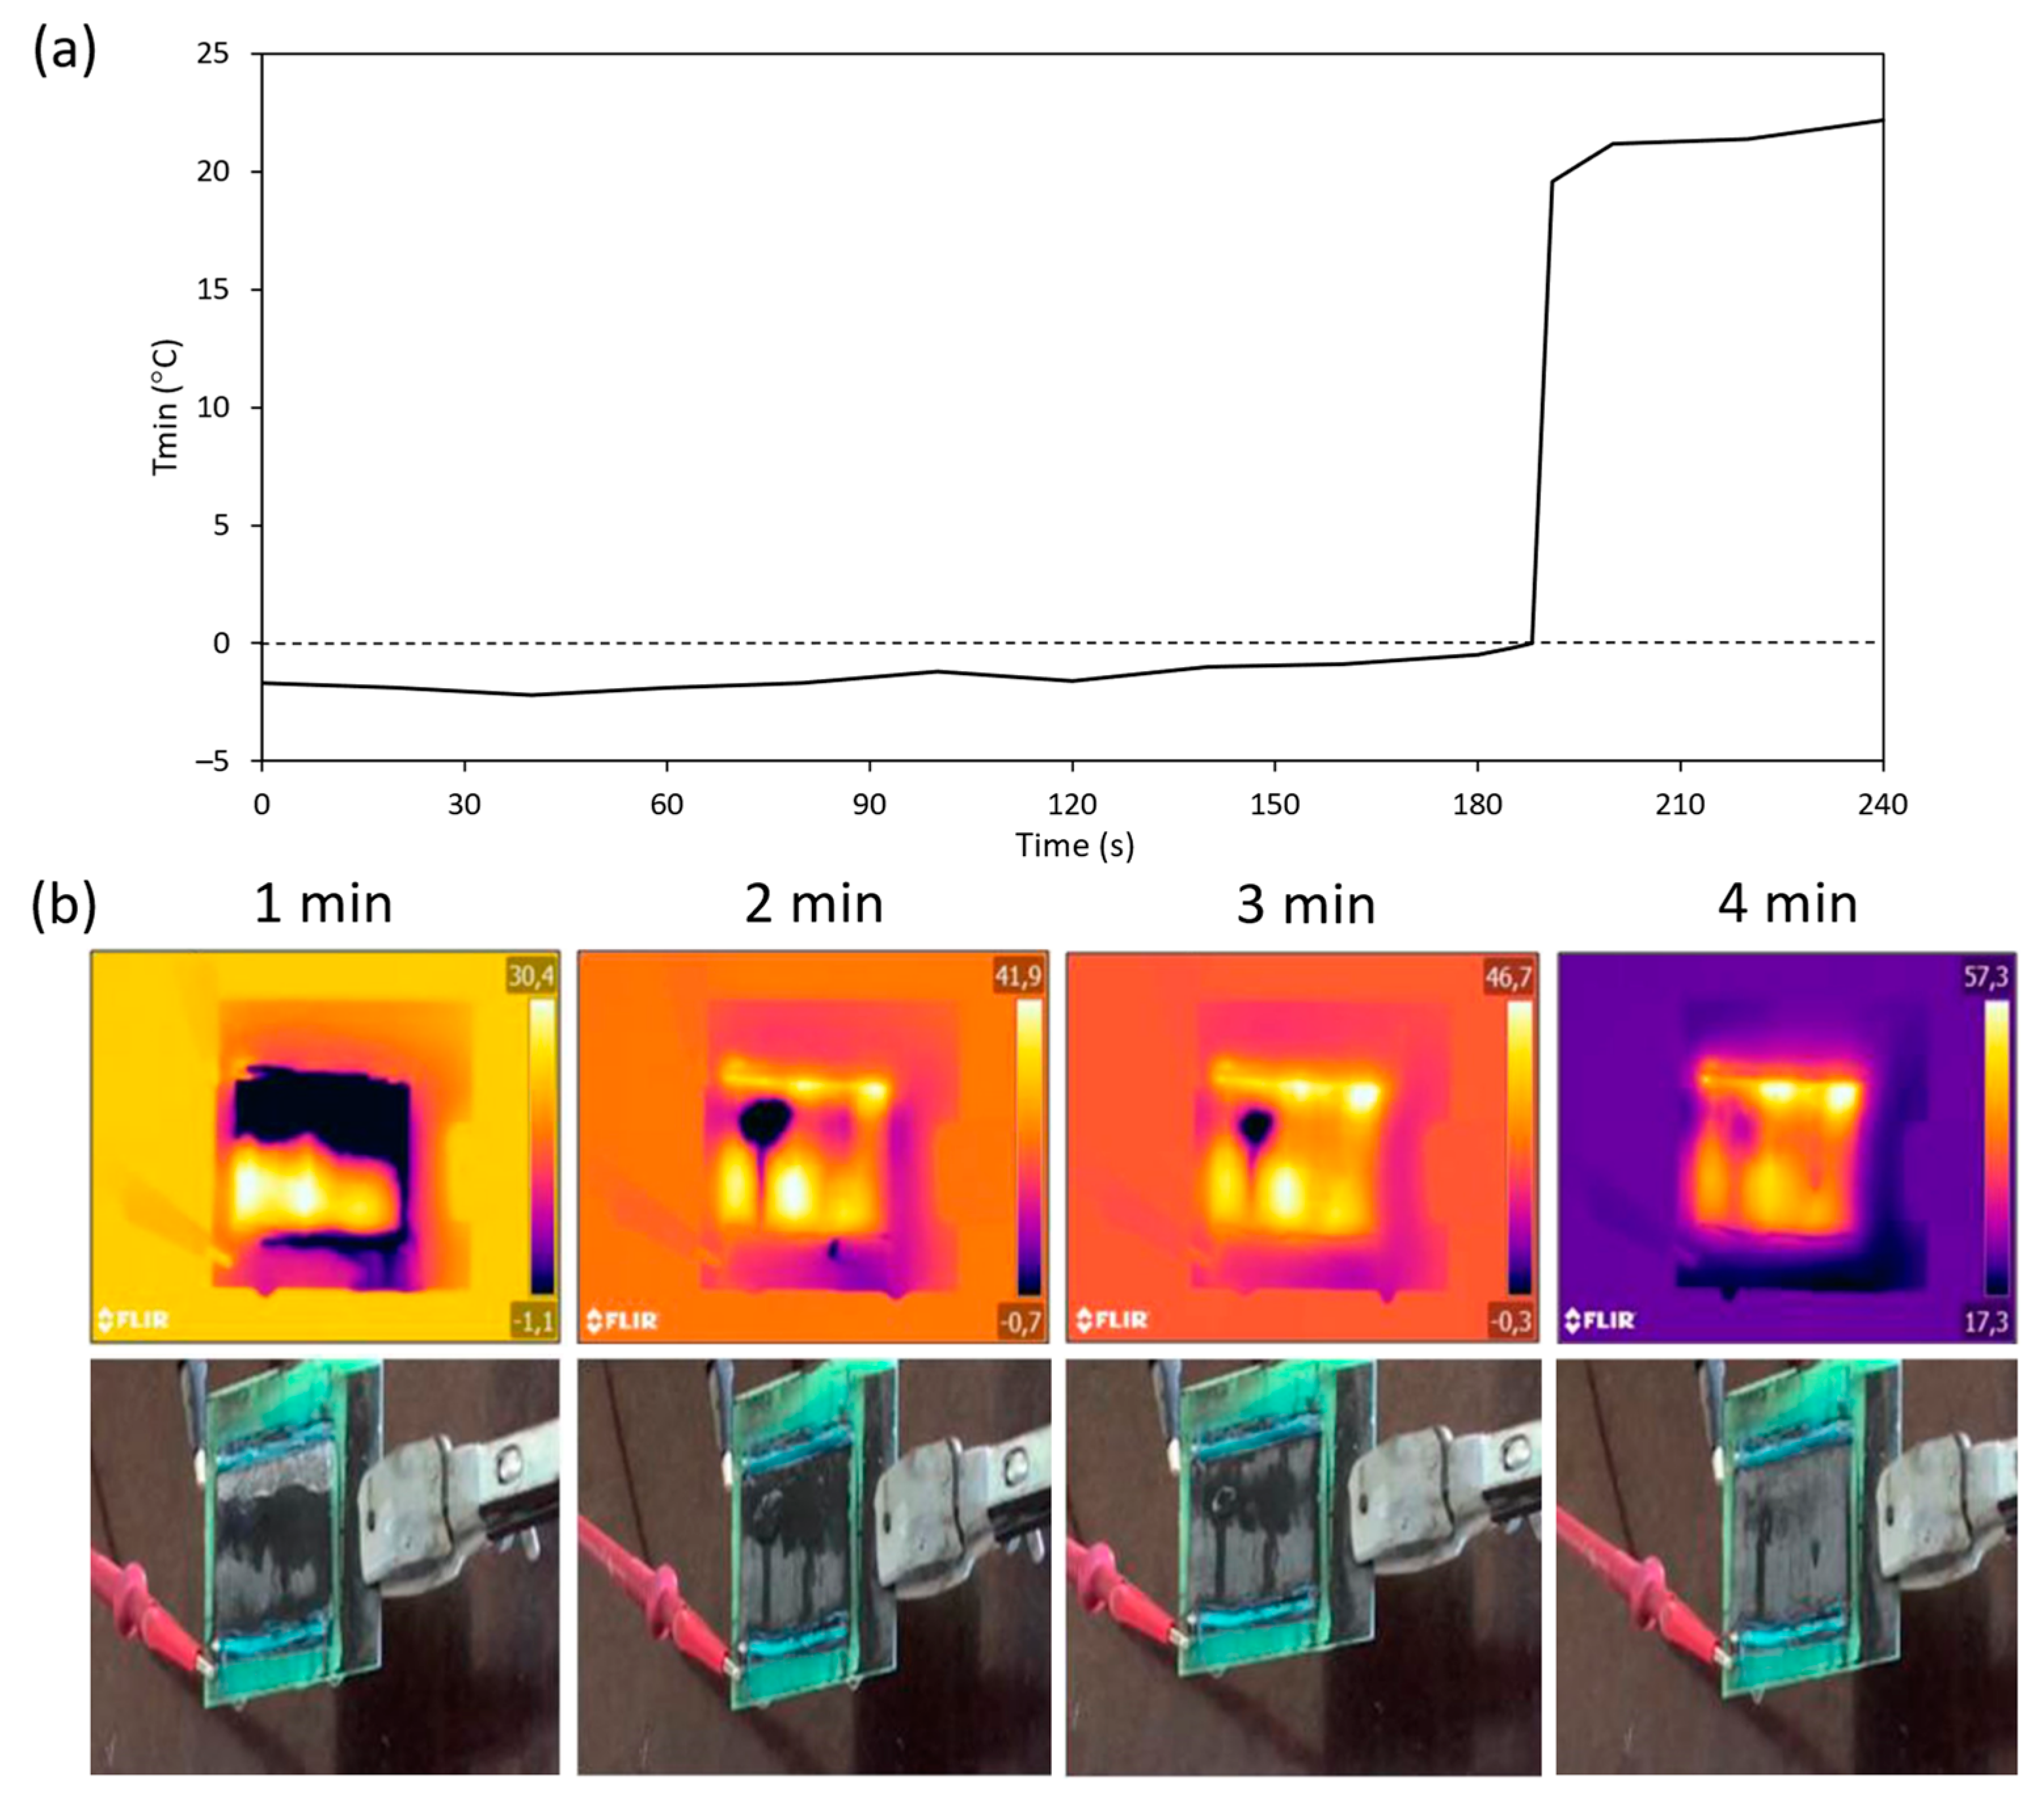
2.3.3. De-Icing Test

A de-icing test was carried out for the specimen that showed the best results in terms of the average temperature during the self-heating test. First, a 2.5 mm thick ice layer is generated in a freezer with deionized water. Then, the de-icing test was carried out by applying 1000 V with the Keithley 2410 equipment to the specimen, placed in vertical position to promote water evacuation during the test. Here, the minimum temperature was recorded using the FLIR E50 thermal camera to evaluate the de-icing time.

3. Results

3.1. Electrical and Electrothermal Characterization

First, the electrical conductivity tests (Figure 2a) showed that for both the 3D-printed circuits and coatings there was an increase in the electrical conductivity when increasing the nanoparticle content, which was expected, due to a higher volume fraction of nanoparticles. In addition, when comparing the 3D-printed circuits with the coatings, the latter showed a slightly higher electrical conductivity. This can be explained by the relatively low cross-sectional area of the printed ribbons (see Table 1), which makes them very sensitive to printing defects as voids or ink flow disruptions, which can hinder the formation of the electrically conductive network.
On the other hand, the average temperature reached by the nanocomposite specimens during the self-heating tests, shown in Figure 2b, present a similar trend when they are compared to the electrical conductivity ones. In this regard, the ΔTav increases with the nanoparticle content, which can be explained by the previously mentioned expression for the electrical conductivity (1), the Ohm’s law (2), and the Joule’s heating law (3):
V = I·R
Q = I2·R·t
where V is the applied voltage, I is the current intensity, Q is the heat generated by Joule’s heating, and t is the time during the experiment.
Here, an increase in the electrical conductivity due to the higher volume fraction of the conductive filler induces a decrease in the electrical resistance. Moreover, this decrease in the electrical resistance is directly related to an increase in current intensity. Finally, the heat that is generated during Joule’s heating is directly related to the square of the current intensity, leading thus, to a higher temperature. In addition to that fact, the coatings reached a significantly higher ΔTav with regard to the 3D-printed circuits because of their higher cross-sectional area (almost three times higher, see Table 1), which reduces the electrical resistance and then increases the heat that is generated by Joule’s heating, as explained before.
When analyzing in detail the specimens with a global content of nanoparticles of 1.0 wt. %, the specimen doped with 0.5% CNT + 0.5% GNP reached a higher ΔTav with regard to the specimen doped with only 1.0%CNT. This can be explained by the higher influence of GNP in the temperature reached by Joule’s heating over CNT when added in low contents [6]. In this regard, the GNPs can act as a bridge between CNTs, enhancing the electrical conductivity and, thus, the temperature reached by the Joule’s effect.
Besides that, Figure 2c shows the ΔTav and ΔTmax as a function of time during the self-heating tests that were reached by the 3D-printed circuit and coating with the best results in terms of Joule’s heating (1.0% CNT + 0.5% GNP). Here, it can be observed a fast heating, followed by a stabilization of the temperature around 5 min, before the cooling stage. Moreover, the difference between the ΔTav and ΔTmax can be explained by the local heterogeneities as the presence of voids or nanoparticle aggregates, which lead to preferred electrical pathways and, consequently, to differences between the maximum and average temperatures reached in the specimen. Furthermore, this difference is higher for the 3D-printed circuits when they are compared to the coatings due to the non-heated regions of the circuit (substrate). Nevertheless, the temperature distribution along the specimens is considerably homogeneous for both 3D-printed circuits and coatings, as shown in Figure 2d.

3.2. De-Icing Test

Figure 3 shows the result of the de-icing test that was performed for the specimen that showed the best results in terms of Joule’s heating: the coating doped with 1.0% CNT + 0.5% GNP. First, Figure 3a shows the minimum temperature of the specimen, located in the ice, as a function of de-icing time. In addition, IR thermographs and pictures of Figure 3b show the progressive reduction of the ice layer. In this regard, the de-icing time of the specimen was around 188 s, which can be observed in Figure 3a, as the sudden increase in the minimum temperature of the specimen ranged from 0 to 20 °C.

4. Conclusions

The electrical and electrothermal capabilities of 3D-printed circuits and coatings were evaluated and compared as a function of CNT/GNP content. Here, an increase in the nanoparticle content induces an increase in the electrical conductivity because of their higher volume fraction and, thus, an increase in the temperature reached by Joules’ heating. Furthermore, the coatings presented a significantly higher temperature when they are compared with the 3D printed circuits due to their higher cross-sectional area, which is directly related to a lower electrical resistance and then, to a higher heat that was generated during Joule’s heating. Finally, the de-icing test that was carried out for the specimen with better results in terms of self-heating showed a de-icing time of 188 s. In this regard, the de-icing capability of the developed materials was proven.

Author Contributions

Conceptualization, A.C., M.C. and A.J.-S.; methodology, A.C.; formal analysis, A.C.; data curation, A.C.; writing—original draft preparation, A.C.; writing—review and editing, A.J.-S., M.C., A.U. and S.G.P.; funding acquisition A.J.-S., M.C., A.U. and S.G.P. All authors have read and agreed to the published version of the manuscript.

Funding

This work was funded by the Ministerio de Economía y Competitividad of Spain Government [PID2019-106703RB-I00], Comunidad de Madrid Government [ADITIMAT-CM S2018/NMT-4411], and Young Researchers R&D Project [Ref. M2183, SMART-MULTICOAT] funded by Universidad Rey Juan Carlos and Comunidad de Madrid.

Data Availability Statement

The data presented in this study are available on request from the corresponding author.

Conflicts of Interest

The authors declare no conflict of interest.

References

  1. Villeneuve, E.; Ghinet, S.; Volat, C. Experimental Study of a Piezoelectric De-Icing SystemImplemented to Rotorcraft Blades. Appl. Sci. 2021, 11, 9869. [Google Scholar] [CrossRef]
  2. Bhutta, M.S.; Xuebang, T.; Akram, S.; Yidong, C.; Ren, X.; Fasehullah, M.; Rasool, G.; Nazir, M.T. Development of novel hybrid 2D-3D graphene oxide diamond micro composite polyimide films to ameliorate electrical & thermal conduction. J. Ind. Eng. Chem. 2022, 114, 108–114. [Google Scholar]
  3. Kenzhebayeva, A.; Bakbolat, B.; Sultanov, F.; Daulbayev, C.; Mansurov, Z. A Mini-Review on Recent Developments in Anti-icing Methods. Polymers 2021, 13, 4149. [Google Scholar] [CrossRef] [PubMed]
  4. Redondo, O.; Prolongo, S.G.; Campo, M.; Sbarufatti, C.; Giglio, M. Anti-icing and De-Icing Coatings Based Joule’s Heating of Graphene Nanoplatelets. Compos. Sci. Technol. 2018, 164, 65–73. [Google Scholar] [CrossRef]
  5. Mohseni, M.; Amirfazli, A. A Novel Electro-Thermal Anti-icing System for Fiber-Reinforced Polymer Composite Airfoils. Cold Reg. Sci. Technol. 2013, 87, 47–58. [Google Scholar] [CrossRef]
  6. Yong, S.M.; Lee, S.J.; Park, J.; Hong, J.; Jung, J.H.; Kim, Y. Fiber-Reinforced Plastic Material with de-Icing Capability for Radome Application. Mater. Lett. 2021, 284, 128943. [Google Scholar] [CrossRef]
  7. Cortés, A.; Romate, X.F.S.; Jiméjez-Suárez, A.; Campo, M.; Prolongo, M.G.; Ureña, A.; Prolongo, S.G. 3D Printed Anti-icing and De-Icing System Based on CNT / GNP Doped Epoxy Composites with Self-Curing and Structural Health Monitoring Capabilities. Smart Mater. Struct. 2021, 30, 025016. [Google Scholar] [CrossRef]
  8. Cortés, A.; Jiménez-Suárez, A.; Campo, M.; Ureña, A.; Prolongo, S.G. Assessment of Manufacturing Parameters for New 3D-Printed Heating Circuits Based on CNT-Doped Nanocomposites Processed by UV-Assisted Direct Write. Appl. Sci. 2021, 11, 7534. [Google Scholar] [CrossRef]
  9. Jiménez-Suárez, A.; Campo, M.; Sánchez, M.; Romón, C.; Ureña, A. Dispersion of Carbon Nanofibres in a Low Viscosity Resin by Calendering Process to Manufacture Multiscale Composites by VARIM. Compos. Part B 2012, 43, 3104–3113. [Google Scholar] [CrossRef]
  10. Cortés, A.; Jiménez-Suárez, A.; Campo, M.; Ureña, A.; Prolongo, S.G. 3D Printed Epoxy-CNTs/GNPs Conductive Inks with Application in Anti-icing and De-Icing Systems. Eur. Polym. J. 2020, 141, 110090. [Google Scholar] [CrossRef]
Figure 1. Schemes of the manufacturing techniques and examples of specimens: (a) Direct Write 3D printing scheme, (b) an example of a 3D-printed circuit specimen, (c) coater scheme, and (d) an example of a coating specimen.
Applsci 12 08875 g001
Figure 2. Electrical and electrothermal characterization as a function of nanoparticle content and specimen morphology. (a) Electrical conductivity, (b) average temperature increment with respect to room temperature, (c) examples of Joule’s heating test for the 3D-printed circuit and coating with 1.0% CNT and 0.5% GNP, and (d) IR images taken during Joule’s heating tests.
Applsci 12 08875 g002
Figure 3. De-icing test of the specimen with better Joule’s heating capability (1.0% CNT + 0.5% GNP). (a) Minimum temperature as a function of time, and (b) IR thermographs and real pictures of the specimen at different times: 1, 2, 3, and 4 min.
Applsci 12 08875 g003
Table 1. Morphological characterization.
SpecimenWidth (mm)Thickness (µm)Cross-Sectional Area (mm2)Volume (mm3)
3D-printed ribbons1.14 ± 0.07439 ± 410.32 ± 0.0416.43 ± 2.04
3D-printed circuit13.69 ± 0.07439 ± 413.88 ± 0.04197.13 ± 24.54
Coating52.79 ± 1.06188 ± 229.93 ± 1.24496.56 ± 61.82
Publisher’s Note: MDPI stays neutral with regard to jurisdictional claims in published maps and institutional affiliations.

