Article

Characterization and Comparison of Raw Brassica and Grass Field Sensorial and Nutritional Quality

1
SOC.AGR. VALLI DI MARCA S.S., Contrada Valle 2, 63068 Montalto delle Marche, Italy
2
Department of Agricultural, Food and Environmental Sciences (D3A), Università Politecnica delle Marche, Via Brecce Bianche 10, 60131 Ancona, Italy
3
Research Group on Foods, Nutritional Biochemistry and Health, Universidad Europea del Atlántico, Isabel Torres 21, 39011 Santander, Spain
*
Authors to whom correspondence should be addressed.
Appl. Sci. 2022, 12(17), 8783; https://doi.org/10.3390/app12178783
Submission received: 10 August 2022 / Revised: 28 August 2022 / Accepted: 29 August 2022 / Published: 31 August 2022
(This article belongs to the Special Issue Chemical and Functional Properties of Food and Natural Products)

Abstract

:
This study reports a characterization of the nutritional quality of several vegetables belonging to Brassica genus and other species cultivated in the central Italy. The aim of this trial is to investigate the antioxidant capacity and phytochemical content of several vegetable products during two consecutive years. The sensorial quality is investigated with the measuring of soluble solid content (SSC), titratable acidity (TA) and pH; the nutritional quality is investigated by the measurement of the total antioxidant capacity (TAC), the total phenols content (TPH), the total anthocyanins content (ACY), and the vitamin C content. The results confirm the highest antioxidant capacity of Brassica genus, in particular, the red curly kale (13.68 and 11.97 mM Trolox/kg fw in the two locations tested); among other vegetables analyzed, the most interesting are chicory and borage (10.3 and 11.94 mM Trolox/kg fw in the first year of cultivation in Valdaso, respectively). A high intake of these vegetables may bring a lot of health benefits linked to their antioxidative capacity and the vitamin C content.

1. Introduction

In Italy, the expenses of the families for fruits and vegetables consumption have increased by about 6% from 2015 to 2020, despite a significant reduction of the total expenses dedicated to the food (ISTAT 2020, https://www.istat.it/it/archivio/202093) (accessed on 22 December 2021); this confirms the consumer trend registered during these years that highlights the increasing attention to healthy foods. Among vegetables, brassicas and field herbs represented rustic and wild species characterized by a strong capacity of adaptation in hostile environments. In Italy, this group of vegetables is particularly widespread, and it can be easily cultivated in the Marche Region in Central Italy, where the ideal and optimal conditions for their growth, like mild climate and clay soils, are present. In this area is also common to find brassicas and grass fields as wild and spontaneous species. The cultivation of these typical vegetables represents a good alternative and economic opportunity for the growers [1].
The present study investigated the nutritional quality of different vegetables belonging to the first-evolved range, an innovative production system that consist in the hand-harvesting and packaging of the edible younger portion of the product (constituted by new shoots and apical part of the plants). This process will provide to consumers a new product proposal of high antioxidant property that maintains and preserves the sensorial and nutritional quality during time. A lot of studies confirm the high quality of the younger portion, given that the antioxidant capacity and the concentration of phytochemical compounds strictly depend by the maturity stage of the plant; Kim et al., 2004, found that the juvenile phase of cabbage has higher flavonols content than the mature phase [2]. In detail, flower buds were found to be the most biologically active part, followed by leaves and steams [3,4]. The hand-harvest of plant portion allows a reduction of soil compaction and an enrichment of soil organic matter during time, because the 80% of the plant remains on the ground acting as a cover and reducing the erosion risk. At the end of production cycles, the plants residues are milled and incorporated into the ground, with high benefits for soil characteristics. Brassica crops are known to play an important role as soil improvers; furthermore, they act as disinfectant for soilborne pests and pathogens, through the production of volatile sulfur compounds [5,6].
The importance of Brassica vegetables and field grass intake is bound to their high concentration of phytochemical compounds and to their potential health promotion. In detail, these vegetables contain phenol compounds that represent, with vitamin C, 80–95% of total antioxidant capacity; among phenolics, anthocyanins (belonging to flavonoids) are responsible for the pigmentation of purple broccoli and red cabbage. Vitamin C includes ascorbic acid and its oxidation products as dehydroascorbic acid. The content of vitamin C varies significantly among and within species and depends by the genotype [7,8]. Regarding the health potential, several medical studies posed strong attention on these vegetables, showing the high capacity to prevent and reduce some chronic illness, cardiovascular and degenerative diseases, and reporting anticancer activities [4,9,10,11].
The aim of this study is to characterize the nutritional and sensorial quality of several first-evolved range fresh vegetables belonging to raw Brassica and grass field. The results will allow to identify the species, among the cultivated vegetables, with the highest antioxidant potential, both for developing future breeding programs, and for providing to consumers high quality and ready-to-eat products, favoring the vegetables intake.

2. Materials and Methods

2.1. Plant Material

Vegetable characterization trials have been carried out in two consecutive years (2016 and 2017). The fresh vegetables were provided by an agricultural company (Valli di Marca Agricultural Society) that realized the cultivation in different production areas. The first area is situated in the south of Marche Region (Italy), in an area specialized in Brassica cultivation called “Valdaso” (136 m.a.s.l.); the second area is “Fucino” upland situated at 680 m.a.s.l. in the Abruzzo Region, in the central-south Italy. The vegetables were cultivated in open field, following the agriculture cultivation system typical of these areas. The fresh vegetables were sampled, harvesting only the edible portion, according to “First evolved range and No-waste protocol” adopted by this company. The samples were selected, sliced, and packaged. The main species cultivated and analyzed for this study are reported in Table 1. During the first year of study, all the species were sampled and analyzed, while for the second year, only the species with the most interesting marketable characteristics were kept. The sampling amount consisted of 200 g of fresh material for each species, immediately analyzed (for sensorial quality) or frozen at −20 °C and subsequently extracted and analyzed (for nutritional quality).

2.2. Chemicals

Methanol (99%, ACS-ISO) was purchased from Carlo Erba Reagents (Milan, Italy). Folin–Ciocalteu reagent, sodium carbonate (anhydrous), potassium chloride, sodium acetate, chloridric acid, glacial acetic acid, ferric chloride hexahydrate 2,4,6-tris(2-pyridyl)-striazine (TPTZ, 99%), 6-hydroxy-2,5,7,8-tetramethylchromane-2-carboxylic acid (Trolox), ferrous sulphate heptahydrate, 3,4,5-trihydroxybenzoic acid (gallic acid), and total vitamin C, were purchased from Sigma-Aldrich (Sigma-Aldrich s.r.l., Milan, Italy).

2.3. Sensorial Quality Parameters

The characterization of the vegetables sensory parameters included the analysis of the content of soluble solids, titratable acidity, and pH; the sensory quality was evaluated at 20.0 ± 0.5 °C on fresh material. First, juice was extracted from fresh vegetables with the utilization of a centrifuge and filtered. For the Soluble Solid Content (SSC) evaluation, some drops of the juice were put on a hand-held refractometer (Atago, Tokio, Japan) and SSC value was immediately red and expressed as °Brix. For the Titratable Acidity (TA) and pH, values were measured with an automatic titrator (HI 84532 Fruit Juice Titratable Acidity- Hanna Instruments, Woonsocket, RI, USA). The analyzed solution consisted of 45 mL of distilled water added to 5 mL of the previous obtained vegetables juice, until reaching 50 mL of final volume. TA results are expressed in % citric acid.

2.4. Nutritional Parameters

2.4.1. Extraction

For the analysis of total phenol content, total anthocyanin content and total antioxidant capacity, a methanolic extract was prepared. Each sample stored at −20 °C was powdered by liquid nitrogen and 10 g of this powder were placed into test-tubes. The extraction went on with the addition of 100 mL of extracting solution constituted by 20:80 water: methanol and 1% of acetic acid. Sample was homogenized using an Ultraturrax T25 homogenizer (Janke and Kunkel, IKA Labortechnik, Staufen, Germany). The homogenized suspension was placed in a fridge at 4 °C in the dark. After 48 h, the suspension was centrifuged at 2500 rpm for 15 min (Thermo Fisher Scientific Heraeus Megafuge 16R Centrifuge, Waltham, MA, USA) and the recovered supernatant was collected and stored in six amber vials of 4 mL each at −20 °C waiting for analysis [12,13].
For the analysis of total vitamin C Content, the extract was obtained according to Helsper et al. (2003) [14] and Tulipani et al. (2008) [15], with slight modifications. Briefly, total vitamin C of each frozen sample was extracted by sonication of 1 g of vegetable in 8 mL of extracting solution, composed of ice-cold water with 5% of metaphosphoric acid and 1 mM Diethylenetriaminepentaacetic acid (DTPA). This step was followed by centrifugation at 4000 rpm for 15 min at 4 °C, and then surnatant was filtered with 0.45 µm NY filters and stored at −20 °C until the HPLC analysis.

2.4.2. Analysis of Total Phenol Content, Total Anthocyanin Content and Total Antioxidant Capacity

Total phenols (TPH) were evaluated using the Folin–Ciocalteu reagent method [16]. Briefly, each sample extract was diluted 1:3 in a glass test-tubes with Folin–Ciocalteu reagent. After 3 min, sodium carbonate (20%) was added to the sample solution, vortexed and stored in the dark. The absorbance of the samples was measured at 760 nm after 60 min by spectrophotometer (UV-1800 Shimadzu, Kyoto, Japan). The data are expressed as mg of gallic acid per kg of fresh sample. Total anthocyanin content (ACY) was measured using the pH differential shift method [17]. Briefly, the sample methanolic extracts were diluted 1:1 (except kale family diluted 1:3) with potassium chloride (pH 1) and, separately, with sodium acetate (pH 4.5), and the maximum absorbance for both solutions was measured (respectively at λ = 520 nm and λ = 700 nm). The data are expressed as mg cyanidin-3-glucoside (the most representative anthocyanin in broccoli) per kg of fresh weight. The total antioxidant capacity (TAC) of vegetables was evaluated using the FRAP (Ferric Reducing Antioxidant Power) assay. The reduction of ferric tripyridyltriazine (Fe+3 –TPTZ) was measured by the method of Benzie and Strain (1996) [18] modified by Deighton et al. (2000) [19] and optimized for Brassica vegetables. FRAP reagent was freshly prepared by mixing 10:1:1 (v/v/v) of sodium acetate (300 mM acidified with acetic acid until pH 3.6), ferric chloride (20 mM) and TPTZ (10 mM in 40 mM HCl). The methanolic extracts was diluted 1:5 with water and vortexed. This solution was further diluted 1:10 adding the FRAP solution previously prepared, vortexed, and put in darkness for 4 min; then absorbance was measured by spectrophotometer (UV-1800 Shimadzu, Kyoto, Japan) at 593 nm. The results are expressed as mM Trolox Equivalent per kg of fresh weight.

2.4.3. Total Vitamin C content

Vitamin C content was evaluated through HPLC system (Jasco Inc., Easton, PA, USA) equipped with a C18 column, 15 cm × 0.46 cm, 5 μm inner particles, and an Autosampler (Jasco Inc., Easton, PA, USA). The mobile phase (aqueous solution of 50 mM phosphate buffered solution, pH 3.2) was slid into isocratic stream at a rate of 0.8 mL/min for 15 min. The HPLC system was coupled to a UV/VIS detector (Jasco Inc., Easton, PA, USA) fixed at 244 nm wavelength, that is comprised in the range of best absorption of total vitamin C [20]. Total vitamin C quantification was made through a standard calibration curve, prepared by running increasing standard concentrations of total vitamin C and measured in duplicate at the beginning and at the end of the analysis. Results are expressed as milligrams of total vitamin C per 100 g of fresh weight.

2.5. Statistical Analysis

The vegetable sensorial and nutritional parameters were analyzed in triplicate for each sample. Data were analyzed with Stat Soft, Tulsa, OK—USA program, using one-way analysis of variance (ANOVA), with each genotype as an independent variable. Significant differences within genotypes were calculated according to Student’s Newman–Keuls (SNK) tests, and differences for p ≤ 0.05 were considered significant.

3. Results and Discussion

The results showed dividing data from the 1st and the 2nd year of harvest in Valdaso area, followed by the average values of the two years in the same area. Finally, the interaction between the environment and the vegetables species is reported, with a comparison between the two different cultivation areas (Fucino vs. Valdaso) during the 2nd year of trial.

3.1. Sensorial Quality Parameters

The results suggested that the genotype had a great influence in the sensorial parameters indeed there was a remarkable difference among the vegetables analyzed for each parameter. Considering the soluble solid content, samples belonging to Brassicacee family, in particular the curly kale group, possessed the highest amount, as showed in Table 2, Table 3, Table 4 and Table 5. In Table 2, in addition to Brassica vegetables like broccoli (9.52 °Brix), savoy cabbage (8.93 °Brix), “getti e foglie” broccoli (9.33 °Brix), kales (8.33, 9.13, and 9.27 °Brix for green curly, red curly, and Russian kale, respectively) and spigariello (8.27 °Brix); in addition, the green beet solid soluble content (8.07 °Brix) stood out. “Getti e foglie” broccoli is the plant extract, which presented the highest values for both SS and TA (9.33 °Brix and 0.19% citric acid, respectively), suggesting that this vegetable is characterized by a balanced taste, as reported in Table 2. Comparing the data deriving from the two years of trial in Valdaso area (Table 2 and Table 3), emerged that the variation among different parameters was more related to cultivation factors other than the genotype; in fact, the species with the best values in the 1st year did not confirm the same performance in the 2nd, resulting in a year-dependent trend. Keeping constant the cultivation area and the cultivation system, the different sensorial parameters detected in the two years of study in the same genotypes can be explained by the influence of the environmental factors like rainfall, temperature, global radiation and photoperiod length, and harvest time.
When the cultivation area changed, e.g., comparing two different environments (Fucino and Valdaso area), the differences in the same genotype became more remarkable; the content of SS detected in Green curly kale, Turnip top and Spigariello cultivated in Valdaso area (12, 7.8 and 9.6 °Brix, respectively) were much higher than these cultivated in Fucino area (9.53, 4.23 and 6.07 °Brix, respectively), while the values of acidity and pH were more constant and similar between the two environments (Table 5).
Therefore, environmental factors, such as composition of the soil and microclimate of the cultivation area, have a clear effect in determining the sensorial parameters of cultivated vegetables, while a variation of sugar amount (in terms of glucose and sucrose content) can be linked with the presence of biotic or abiotic stresses. Water stress, for example, can stimulate the sugar production, while the after-harvesting time can reduce the content of some classes of compounds (e.g., broccoli had the main losses of sugar, organic acids, and protein contents within the first 6 h after harvest) [21,22]. These results also demonstrate the possibility to differentiate, also at commercial level, the quality of a product depending to the specific area of origin.

3.2. Nutritional Parameters

3.2.1. Total Phenol Content, Total Anthocyanin Content and Total Antioxidant Capacity

The nutritional data showed how environment and genotype influenced the phytochemical compounds content. In the present study, it is possible to appreciate several differences among genotypes, that are reported in the Tables below. In the first-year analyses of Valdaso area, the higher antioxidant capacity was detected in Borage (11.94 mM Trolox/kg fw), species that do not belong to Brassicacee family, followed by Chicory (10.3 mM Trolox/kg fw) and Red curly kale (10.51 mM Trolox/kg fw) (Table 6). The same trend is reported for the phenols, where Borage, Chicory, and Radish had the highest content (2239.61, 2493.13, and 2349.92 mg GA/kg fw, respectively). The results of our study agreed with some data found in literature: Abu-Qaoud and co-authors (2018) showed that TPH of wild Borage was 5210 mg GA/kg fw, while TPH of cultivated Borage was 2370 mg GA/kg fw, confirming that cultivated borage possessed lower phenols concentration than the wild one [23]. Regarding chicory and radish, a lot of studies verified their nutritional potential and phytochemical compound presence, measuring their antioxidant potency in correlation with total phenolic and flavonoid content. Thanks to these analyses these species have been introduced in the modern diet as healthy alternative to the vegetables normally consumed [24,25]. Regarding our study, red curly kale possessed the highest content of anthocyanins too (207.32 mg CYA-3-GLU/kg fw).
During the second year, only the analyses of Brassicacee samples were repeated, because they possessed a greater marketability interest. The data showed that Green curly kale had the highest antioxidant capacity and total phenols content (19.36 mM Trolox/kg fw, and 2788.77 mg GA/kg fw, respectively), while Red curly kale registered the highest anthocyanins content (347.21 mg CYA-3-GLU/kg fw) (Table 7). The average data of two years of trials confirmed the results already described, as reported in Table 8. Analyzing them, it emerged that kales family is the richest in phenols (including anthocyanins), probably the major responsible for inducing the high antioxidant capacity, as reported in much research [26,27,28].
The interaction between environment and genotype can influence the phytochemical compounds content (Table 9). Data confirm the high antioxidant capacity of kales tissues, and this result is related to the high content of the main phytochemical compounds found in both green and red curly kale. Regarding TAC and TPH, Green curly kale cultivated in Valdaso area registered the highest values (19.36 mM Trolox/kg fw and 2788.77 mg GA/kg fw, respectively); furthermore, Valdaso is the cultivation area that, for two years, allowed the highest accumulation of antioxidant compounds in all vegetables. The TPH data found in this trial site (1539.63 mg GA/kg fw) were higher than those previously obtained by Lafarga et al. (2018) [29] and lower than those obtained by Olsen et al. (2012) [27]. Consequently, the total antioxidant capacity (9.7 mM Trolox/kg fw) followed the same trend.
ACY results confirmed the high amount of anthocyanins group in Red curly kale variety (437.29 mg CYA-3-GLU/kg fw in Fucino), and vegetables cultivated in Fucino area showed the highest accumulation (75.05 mg CYA-3-GLU/kg fw against 61.6 mg CYA-3-GLU/kg fw of Valdaso area). Olsen et al. (2012) reported that in green curly kale, the concentration of anthocyanins is negligible, while red curly kale possessed a higher concentration than in our trial [27]. The variation of phytochemical compounds content is explained by the interaction environment x genotype. In the Brassica genus, the differences were evident among and within the species and sometimes the content depended also by the type of plant tissue [30]. Environmental factors, such as biotic and abiotic stress, can also change the phytochemical contents as confirmed by many studies [6,8,31].

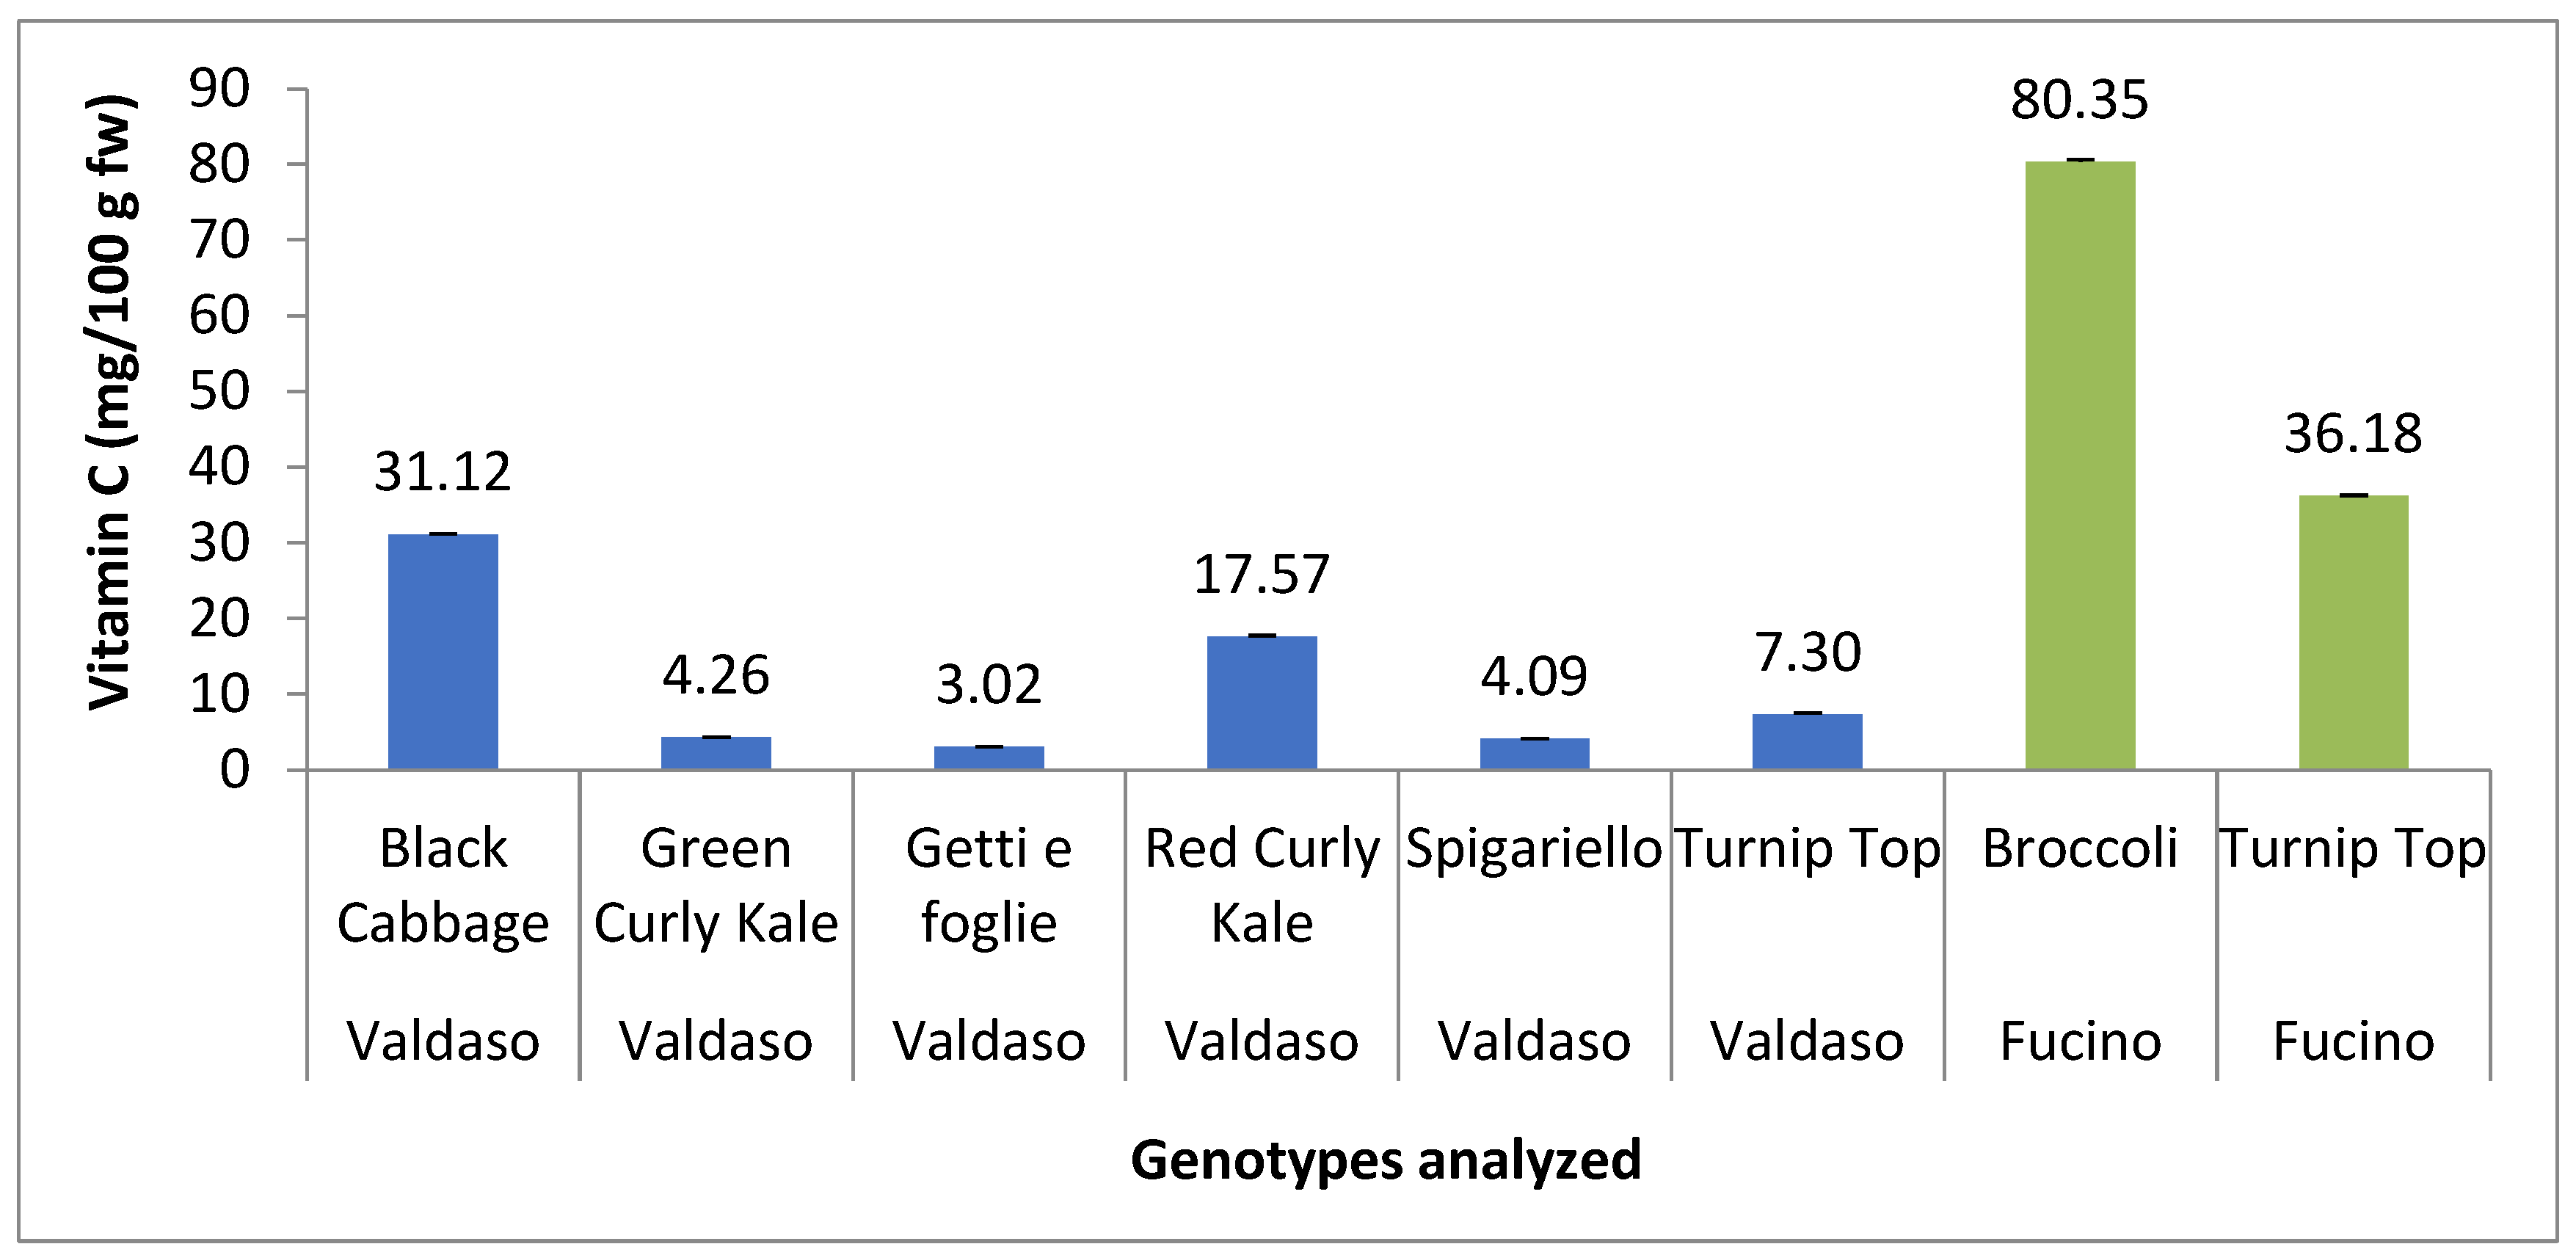
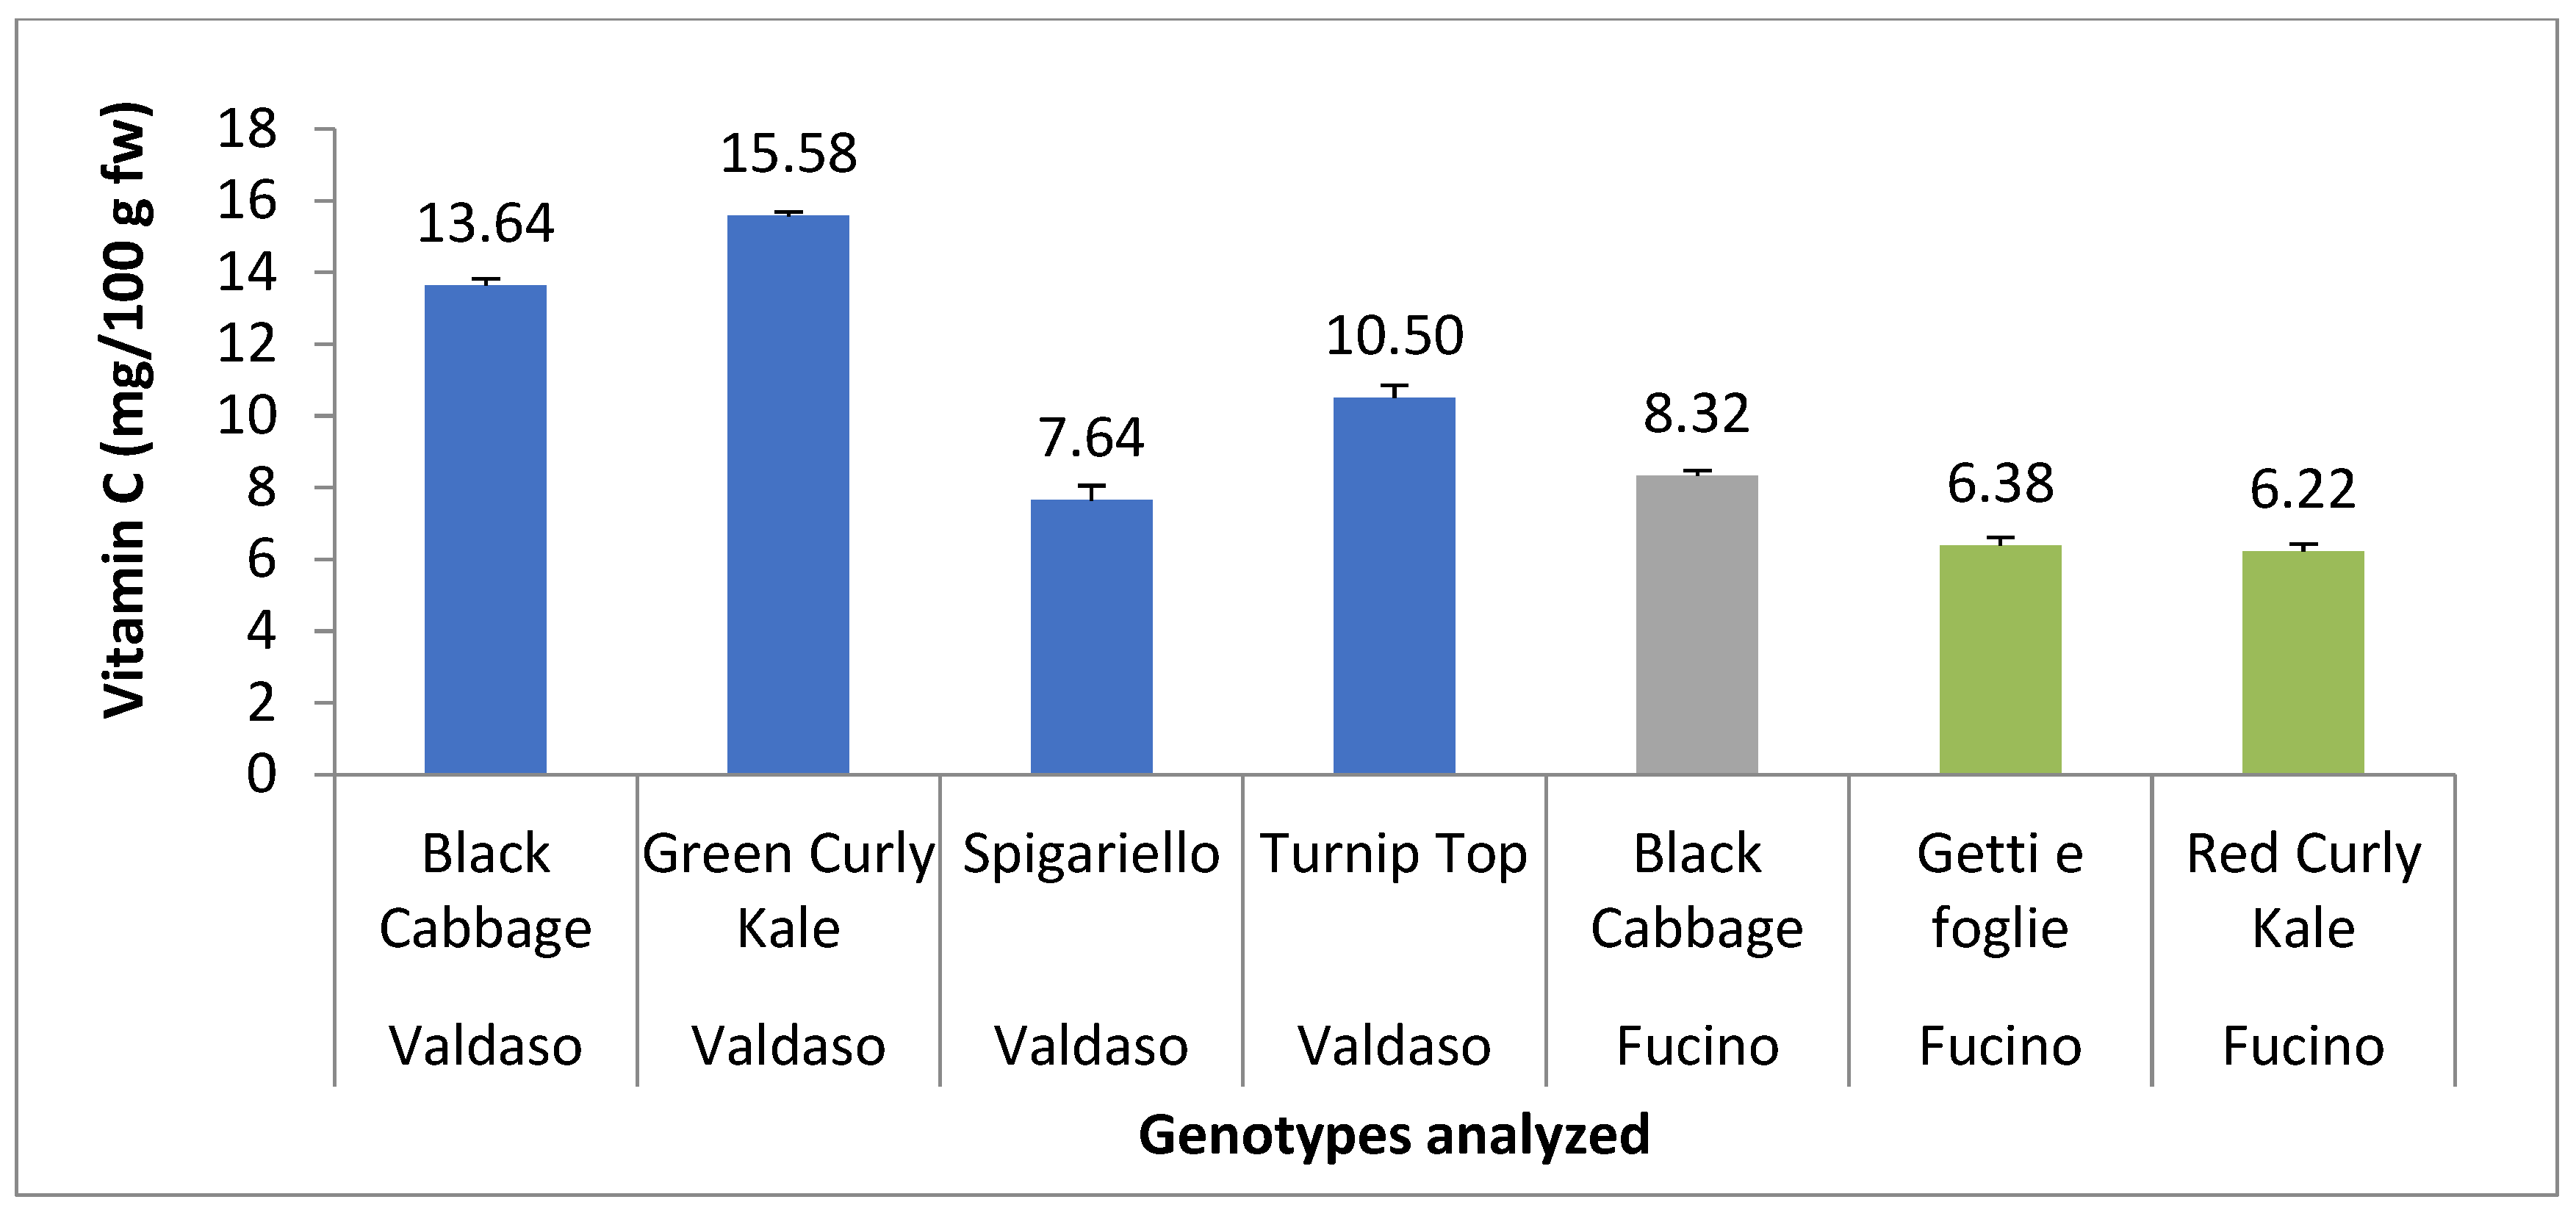
3.2.2. Total Vitamin C Content

The results of our trial confirmed that Brassica plants are rich in vitamin C, but each species analyzed revealed a wide range of variation (Figure 1 and Figure 2); indeed, vitamin C is strongly influenced by environment and genotype. For some vegetables, the data obtained in this study revealed lower vitamin C content than data reported in the literature, e.g., turnip top plants grown in Valdaso accumulated 7.30 and 10.50 mg/100 g fw in the first and second year, respectively, against 25–29 mg/100 g fw reported by Conversa et al. (2016) [32]. Similarly, Green and Red curly kale registered 4.26–15.58 and 17.57–6.22 mg/100 g fw against 52 and 67 mg/100 g fw as reported by Olsen et al. (2012) [27]. Other kales analyzed in the literature registered vitamin C values comprised between 83 and 104 mg/100 g of fw [8,33]. On the contrary, several other vegetables analyzed in our study reported a higher concentration of vitamin C than literature reports, e.g., Fucino turnip top with 36.18 mg/100 g fw was higher than those reported in Conversa et al. (2016) [32]; moreover, Broccoli registered 80.35 mg/100 g fw, slightly greater than 74.8 mg/100 g fw found by Bahorun et al. (2004) [34] and Singh et al. (2007) [35]. This variability can be bound to genetic aspects and to climatic and cultivation conditions of the different areas. The vitamin C level can vary over a 4-fold in broccoli and twice in kale [8,36,37]. Furthermore, several studies reported that the concentration of vitamin C also varied considering the plants portion; indeed, Lafarga et al. (2018) described a major concentration in the inflorescences/leaves than in stems for some varieties, while for others obtained the opposite result [29]. This last affirmation finds support in other work [38]. The strong differences of vitamin C concentration found between our kales and spigariello and the same species analyzed in previously works can be also explained considering that the extraction protocol of vitamin C applied in the present study was not optimized for Brassicacee plants.

4. Conclusions

In this study, the high nutritional and antioxidant potential of Brassicacee plants and field herbs was confirmed. The great variation in sensorial and nutritional parameters, and how they were influenced by the genotype and the environment, was reported. Regarding the other species, such as chicory, borage and radish, this study proved that the cultivated vegetables possessed less accumulation of phytochemicals than the wilds ones, but that, nonetheless, they represented a wide source of antioxidants and phenols, and they can be used as a healthy alternative food for the consumers.
These results can be used by local growers’ organizations to differentiate at commercial level the quality of a product, depending to the specific area of origin. This study strengthens the commercial diffusion and proposal of the first evolved range products as a solution to provide to the consumer a tasty and healthy food vegetables, with different characteristics according to the genotype and the environmental conditions.

Author Contributions

Conceptualization, E.M., M.V. (Massimo Vagnoni), M.V. (Marino Visciglio) and B.M.; Data curation, F.B. (Francesca Biondi) and F.C.; Formal analysis, F.B. (Francesca Biondi), F.B. (Francesca Balducci) and L.M.; Funding acquisition, M.V. (Marino Visciglio) and B.M.; Investigation, E.M. and M.V. (Marino Visciglio); Methodology, F.B. (Francesca Biondi), F.C. and L.M.; Project administration, M.V. (Massimo Vagnoni), M.V. (Marino Visciglio) and B.M.; Resources, M.V. (Massimo Vagnoni), M.V. (Marino Visciglio) and B.M.; Software, F.C.; Supervision, M.V. (Massimo Vagnoni) and B.M.; Validation, L.M.; Visualization, L.M.; Writing—original draft, F.B. (Francesca Biondi); Writing—review and editing, B.M. and L.M. All authors have read and agreed to the published version of the manuscript.

Funding

This research received no external funding.

Institutional Review Board Statement

Not applicable.

Informed Consent Statement

Not applicable.

Data Availability Statement

Not applicable.

Conflicts of Interest

The authors declare no conflict of interest.

References

  1. Timpanaro, G.; Di Vita, G.; Foti, V.T.; Branca, F. Landraces in Sicilian peri-urban horticulture: A participatory approach to brassica production system. Acta Hortic. 2013, 1005, 213–220. [Google Scholar] [CrossRef]
  2. Kim, D.O.; Padilla-Zakour, O.I.; Griffiths, P.D. Flavonoids and antioxidant capacity of various cabbage genotypes at juvenile stage. J. Food Sci. 2004, 69, C685–C689. [Google Scholar] [CrossRef]
  3. Fernandes, F.; Valentao, P.; Sousa, C.; Pereira, C.; Pereira, J.A.; Seabra, R.M.; Andrade, P.B. Chemical and antioxidative assessment of dietary turnip (Brassica rapa var. rapa L.). Food Chem. 2007, 105, 1003–1010. [Google Scholar] [CrossRef]
  4. Soengas, P.; Sotelo, T.; Velasco, P.; Cartea, M.E. Antioxidant Properties of Brassica Vegetables. Funct. Plant Sci. Biotechnol. 2011, 5, 43–55. [Google Scholar]
  5. Larkin, R.P.; Griffin, T.S. Control of soilborne potato diseases using Brassica green manures. Crop Prot. 2007, 26, 1067–1077. [Google Scholar] [CrossRef]
  6. Biondi, F.; Balducci, F.; Capocasa, F.; Visciglio, M.; Mei, E.; Vagnoni, M.; Mezzetti, B.; Mazzoni, L. Environmental conditions and agronomical factors influencing the levels of phytochemicals in Brassica vegetables responsible for nutritional and sensorial properties. Appl. Sci. 2021, 11, 1927. [Google Scholar] [CrossRef]
  7. Fernández-León, M.F.; Fernández-León, A.M.; Lozano, M.; Ayuso, M.C.; González-Gómez, D. Identification, quantification and comparison of the principal bioactive compounds and external quality parameters of two broccoli cultivars. J. Funct. Foods 2012, 4, 465–473. [Google Scholar] [CrossRef]
  8. Podsedek, A. Natural antioxidants and antioxidant capacity of Brassica vegetables: A review. LWT Food Sci. Technol. 2007, 40, 1–11. [Google Scholar] [CrossRef]
  9. Herr, I.; Buchler, M.W. Dietary constituents of broccoli and other cruciferous vegetables: Implications for prevention and therapy of cancer. Cancer Treat. Rev. 2010, 36, 377–383. [Google Scholar] [CrossRef]
  10. Bjorkman, M.; Klingen, I.; Birch, A.; Bones, A.; Bruce, T.; Johansen, T.J.; Meadow, R.; Molmann, J.; Seljasen, R.; Smart, L.E.; et al. Phyto-chemicals of Brassicaceae in plant protection and human health. Influences of climate, environment and agronomic practice. Phytochemistry 2011, 72, 538–556. [Google Scholar] [CrossRef]
  11. Manchali, S.; Murthy, K.C.; Patil, B.S. Crucial facts about health benefits of popular cruciferous vegetables. J. Funct. Foods 2012, 4, 94–106. [Google Scholar]
  12. Wang, S.Y.; Lin, H.S. Antioxidant activity in fruits and leaves of blackberry, raspberry, and strawberry varies with cultivar and developmental stage. J. Agric. Food Chem. 2000, 48, 140–146. [Google Scholar] [PubMed]
  13. Diamanti, J.; Capocasa, F.; Balducci, F.; Battino, M.; Hancock, J.; Mezzetti, B. Increasing Strawberry Fruit Sensorial and Nutritional Quality Using Wild and Cultivated Germplasm. PLoS ONE 2012, 7, e46470. [Google Scholar]
  14. Helsper, J.P.F.G.; De Vos, C.H.R.; Maas, F.M.; Jonker, H.H.; Van den Broeck, H.C.; Jordi, W.; Pot, C.S.; Keizer, L.C.P.; Schapendonk, A.H.C.M. Response of selected antioxidants and pigments in tissues of Rosa hybrida and Fuchsia hybrida to supplemental UV-A exposure. Physiol. Plant. 2003, 117, 171–187. [Google Scholar]
  15. Tulipani, S.; Mezzetti, B.; Capocasa, F.; Bompadre, S.; Beekwilder, J.; Ric De Vos, C.H.; Capanoglu, E.; Bovy, A.; Battino, M. Antioxidants phenolic compounds and nutritional quality of different strawberry genotypes. J. Agric. Food Chem. 2008, 56, 696–704. [Google Scholar] [CrossRef]
  16. Slinkard, K.; Singleton, V.L. Total phenol analysis: Automation and comparision with manual methods. Am. J. Enol. Vitic. 1977, 28, 49–55. [Google Scholar]
  17. Giusti, M.; Wrolstad, R.E. Characterization and Measurement of anthocyanins by UV-visible Spectroscopy. In Current Protocols in Food Analytical Chemistry, 1st ed.; Wrolstad, R.E., Ed.; John Wiley & Sons: New York, NY, USA, 2001; pp. F1.2.1–F1.2.13. [Google Scholar]
  18. Benzie, I.F.F.; Strain, J.J. The ferric reducing ability of plasma (FRAP) as a measure of ‘‘antioxidant power’’: The FRAP assay. Anal. Biochem. 1996, 239, 70–76. [Google Scholar] [CrossRef]
  19. Deighton, N.; Brennan, R.; Finn, C.; Davies, H.V. Antioxidant properties of domesticated and wild Rubus species. J. Sci. Food Agric. 2000, 80, 1307–1313. [Google Scholar]
  20. Zhong, C.F.; Mazzoni, L.; Balducci, F.; Di Vittori, L.; Capocasa, F.; Giampieri, F.; Mezzetti, B. Evaluation of vitamin C content in fruit and leaves of different strawberry genotypes. Acta Hortic. 2017, 1156, 371–378. [Google Scholar]
  21. Eason, J.R.; Ryan, D.; Page, B.; Watson, L.; Coupe, S.A. Harvested broccoli (Brassica oleracea) responds to high carbon dioxide and low oxygen atmosphere by inducing stress-response genes. Postharvest Biol. Technol. 2007, 43, 358–365. [Google Scholar]
  22. Jahangir, M.; Abdel-Farida, I.B.; Kima, H.K.; Choia, Y.H.; Verpoortea, R. Healthy and unhealthy plants: The effect of stress on the metabolism of Brassicaceae. Environ. Exp. Bot. 2009, 67, 23–33. [Google Scholar]
  23. Abu-Qaoud, H.; Shawarb, N.; Hussen, F.; Jaradat, N.; Shtaya, M. Comparison of qualitative, quantitative analysis and antioxidant potential between wild and cultivated Borago officinalis leaves from Palestine. Pak. J. Pharm. Sci. 2018, 31, 953–959. [Google Scholar] [PubMed]
  24. Kücükboyaci, N.; Güvenc, A.; Turan, N.N.; Aydin, A. Antioxidant activity and total phenolic content of aqueous extract from Raphanus raphanistrum L. Turk. J. Pharm. Sci. 2012, 9, 93–100. [Google Scholar]
  25. Jancic, D.; Todorovic, V.; Sircelj, H.; Dodevska, M.; Beljkas, B.; Znidarcic, D.; Sobajic, S. Biologically active compounds and antioxidant capacity of Cichorium intybus L. leaves from Montenegro. Ital. J. Food Sci. 2017, 29, 627–643. [Google Scholar]
  26. Heimler, D.; Vignolini, P.; Dini, M.G.; Vincieri, F.F.; Romani, A. Antiradical activity and polyphenol composition of local Brassicaceae edible varieties. Food Chem. 2006, 99, 464–469. [Google Scholar] [CrossRef]
  27. Olsen, H.; Grimmer, S.; Aaby, K.; Saha, S.; Borge, G.I.A. Antiproliferative Effects of Fresh and Thermal Processed Green and Red Cultivars of Curly Kale (Brassica oleracea L. convar. acephala var. sabellica). J. Agric. Food Chem. 2012, 60, 7375–7383. [Google Scholar]
  28. Becerra-Moreno, A.; Alanís-Garza, P.A.; Mora-Nieves, J.L.; Mora-Mora, J.P.; Jacobo-Velázquez, D.A. Kale: An excellent source of vitamin C, pro-vitamin A, lutein and glucosinolates. CyTA J. Food 2014, 12, 298–303. [Google Scholar]
  29. Lafarga, T.; Viñas, I.; Bobo, G.; Simó, J.; Aguiló-Aguayo, I. Effect of steaming and sous vide processing on the total phenolic content, vitamin C and antioxidant potential of the genus Brassica. Innov. Food Sci. Emerg. Technol. 2018, 47, 412–420. [Google Scholar] [CrossRef]
  30. Mezzetti, B.; Biondi, F.; Balducci, F.; Capocasa, F.; Mei, E.; Vagnoni, M.; Visciglio, M.; Mazzoni, L. Variation of Nutritional Quality Depending on Harvested Plant Portion of Broccoli and Black Cabbage. Appl. Sci. 2022, 12, 6668. [Google Scholar]
  31. Cartea, M.E.; Francisco, M.; Soengas, P.; Velasco, P. Phenolic Compounds in Brassica Vegetables. Molecules 2011, 16, 251–280. [Google Scholar]
  32. Conversa, G.; Bonasia, A.; Lazzizera, C.; Elia, A. Bio-physical, physiological, and nutritional aspects of ready-to-use cima di rapa (Brassica rapa L. subsp. sylvestris L. Janch. var. esculenta Hort.) as affected by conventional and organic growing systems and storage time. Sci. Hortic. 2016, 213, 76–86. [Google Scholar]
  33. Armesto, J.; Carballo, J.; Martínez, S. Physicochemical and phytochemical properties of two phenotypes of Galega kale (Brassica oleracea var. acephala cv. Galega). J. Food Biochem. 2015, 39, 439–448. [Google Scholar]
  34. Bahorun, T.; Luximon-Ramma, A.; Crozier, A.; Aruoma, O.I. Total phenol, flavonoid, proanthocyanidin and vitamin C levels and antioxidant activities of Mauritian vegetables. J. Sci. Food Agric. 2004, 84, 1553–1561. [Google Scholar] [CrossRef]
  35. Singh, J.; Upadhyay, A.K.; Prasad, K.; Bahadur, A.; Rai, M. Variability of carotenes. vitamin C. E and phenolics in Brassica vegetables. J. Food Compost. Anal. 2007, 20, 106–112. [Google Scholar]
  36. Kaur, C.; Kumar, K.; Anil, D.; Kapoor, H.C. Variations in antioxidant activity in broccoli (Brassica oleracea L.) cultivars. J. Food Biochem. 2007, 31, 621–638. [Google Scholar] [CrossRef]
  37. Nicoletto, C.; Santagata, S.; Pino, S.; Sambo, P. Antioxidant characterization of different italian broccoli landraces. Hortic. Bras. 2016, 34, 74–79. [Google Scholar] [CrossRef]
  38. Zhang, D.; Hamauzu, Y. Phenolics, ascorbic acid, carotenoids and antioxidant activity of broccoli and their changes during conventional and microwave cooking. Food Chem. 2004, 88, 503–509. [Google Scholar]
Figure 1. Vitamin C content in samples analyzed during the 1st year. Data are presented as means ± standard error.
Applsci 12 08783 g001
Figure 2. Vitamin C content in samples analyzed during the 2nd year. Data are presented as means ± standard error.
Applsci 12 08783 g002
Table 1. Plant material analyzed during two years of trials.
SpeciesVegetablesCultivation Year
Brassica rapa subsp. sylvestrisTurnip topII
Brassica oleracea L. var. acephala subvar. laciniata L.Black cabbageI-II
Brassica oleracea L. var. acephala subvar. sabellica L.Green Curly kale
Red Curly kale
Russian Curly kale
I-II
I-II
I
Brassica oleracea L. var. italicaBroccoliI-II
Brassica oleracea L. var. sabaudaSavoy CabbageI
Brassica oleracea L. convar. botrytis var. cymosa“Spigariello” broccoli
“Getti e foglie”broccoli
I-II
I-II
Beta vulgaris var. ciclaRed Beet
Green Beet
I
I
Cichorium intybus L.ChicoryI
Raphanus raphanistrum L. subsp. microcarpus (Lange)Radish-“Rapastrello”I
Borago officinalis L.BorageI
Table 2. Sensorial quality parameters of vegetables cultivated during 1st year (2016) of trial in Valdaso area.
Vegetables 1st Year-ValdasoSSC 1
(°Brix)
TA 2
(% Citric Acid)
pH
Red Beet5.93 ± 0.07 b0.10 ± 0.00 cd6.60 ± 0.06 b
Green Beet8.07 ± 0.59 a0.12 ± 0.01 bcd6.50 ± 0.15 bc
Borage4.33 ± 0.24 c0.09 ± 0.01 d6.93 ± 0.09 a
Broccoli9.52 ± 0.11 a0.15 ± 0.00 bc6.41 ± 0.03 bc
Savoy Cabbage8.93 ± 0.07 a0.11 ± 0.00 cd6.37 ± 0.03 bc
Chicory5.93 ± 0.07 b0.10 ± 0.00 cd6.00 ± 0.00 c
Getti e foglie9.33 ± 0.35 a0.19 ± 0.01 a6.13 ± 0.03 bc
Red Curly Kale8.33 ± 0.85 a0.13 ± 0.01 bcd6.43 ± 0.03 bc
Green Curly Kale9.13 ± 0.18 a0.13 ± 0.00 bcd6.33 ± 0.09 bc
Radish6.80 ± 0.12 b0.11 ± 0.01 cd6.07 ± 0.03 bc
Russian Kale9.27 ± 0.37 a0.13 ± 0.01 bcd6.23 ± 0.03 bc
Spigariello8.27 ± 0.44 a0.16 ± 0.03 ab6.37 ± 0.32 bc
1 SSC: Soluble Solid Content; 2 TA: Titratable Acidity. Data are presented as means ± standard error. Values with the same letter were not significantly different (p ≤ 0.05). n = 3.
Table 3. Sensorial quality parameters of vegetables cultivated during 2nd year (2017) of trial in Valdaso area.
Vegetables 2nd Year-ValdasoSSC 1
(°Brix)
TA 2
(% Citric Acid)
pH
Black Cabbage10.80 ± 0.20 b0.31 ± 0.07 ab6.37 ± 0.12 a
Turnip Top7.80 ± 0.12 d0.24 ± 0.02 b5.97 ± 0.03 b
Getti e foglie8.87 ± 0.13 c0.23 ± 0.02 b6.13 ± 0.03 ab
Red Curly Kale10.53 ± 0.18 b0.26 ± 0.01 b6.20 ± 0.12 ab
Green Curly Kale12.00 ± 0.46 a0.47 ± 0.10 a5.70 ± 0.06 c
Russian Kale11.60 ± 0.20 a0.39 ± 0.05 ab5.67 ± 0.03 c
Spigariello9.60 ± 0.35 c0.19 ± 0.01 b6.23 ± 0.03 ab
1 SSC: Soluble Solid Content; 2 TA: Titratable Acidity. Data are presented as means ± standard error. Values with the same letter were not significantly different (p ≤ 0.05). n = 3.
Table 4. Average of sensorial data collected during two years (2016/2017) of trials in Valdaso area.
Valdaso Vegetables Average 2016/2017SSC 1
(°Brix)
TA 2
(% Citric Acid)
pH
Getti e foglie9.10 ± 0.20 b0.21 ± 0.01 ab6.13 ± 0.02 ab
Red Curly Kale9.43 ± 0.63 b0.20 ± 0.03 ab6.32 ± 0.07 a
Green Curly Kale10.57 ± 0.68 a0.30 ± 0.09 a6.02 ± 0.15 ab
Russian Kale 10.43 ± 0.55 a0.26 ± 0.06 ab5.95 ± 0.13 b
Spigariello8.93 ± 0.39 b0.18 ± 0.01 b6.30 ± 0.15 a
1 SSC: Soluble Solid Content; 2 TA: Titratable Acidity. Data are presented as means ± standard error. Values with the same letter were not significantly different (p ≤ 0.05). n = 6.
Table 5. Average of sensorial data collected during the 2nd year of trials in different environments (Fucino vs. Valdaso area).
VegetablesAreasSSC 1
(°Brix)
TA 2
(% Citric Acid)
pH
Black CabbageFucino9.73 ± 0.28 cd0.30 ± 0.01 abc6.07 ± 0.03 ab
Valdaso10.80 ± 0.20 abc0.31 ± 0.07 abc6.37 ± 0.12 a
Turnip TopFucino4.23 ± 0.12 g0.13 ± 0.02 c6.03 ± 0.13 b
Valdaso7.80 ± 0.12 e0.24 ± 0.02 bc5.97 ± 0.03 bc
Getti e foglieFucino7.73 ± 0.50 e0.24 ± 0.01 bc5.93 ± 0.03 bc
Valdaso8.87 ± 0.13 de0.23 ± 0.02 bc6.13 ± 0.03 ab
Red Curly KaleFucino11.13 ± 0.72 ab0.30 ± 0.01 abc5.97 ± 0.03 bc
Valdaso10.53 ± 0.18 bc0.26 ± 0.01 bc6.20 ± 0.12 ab
Green Curly KaleFucino9.53 ± 0.48 cd0.38 ± 0.09 ab6.07 ± 0.03 ab
Valdaso12.00 ± 0.46 a0.47 ± 0.10 a5.70 ± 0.06 c
SpigarielloFucino6.07 ± 0.07 f0.23 ± 0.00 bc6.20 ± 0.00 ab
Valdaso9.60 ± 0.35 cd0.19 ± 0.01 bc6.23 ± 0.03 ab
Fucino-8.07 ± 0.59 B0.26 ± 0.02 N.S.6.04 ± 0.03 N.S.
Valdaso-9.93 ± 0.34 A0.28 ± 0.03 N.S.6.10 ± 0.06 N.S.
1 SSC: Soluble Solid Content; 2 TA: Titratable Acidity. Data are presented as means ± standard error. Values with the same letter were not significantly different (p ≤ 0.05). N.S: not significant. n = 3; N = 18.
Table 6. Phenolics, anthocyanins contents, and antioxidant capacity in the different type of vegetables analyzed during 1st year in Valdaso.
Vegetables 1°Year-ValdasoTAC 1
(mM Trolox/kg fw)
TPH 2
(mg GA/kg fw)
ACY 3
(mg CYA-3-GLU/kg fw)
Red Beet2.92 ± 0.14 e1111.04 ± 37.65 cd0.00 ± 0.00 e
Green Beet2.03 ± 0.04 e715.48 ± 24.83 e0.24 ± 0.11 e
Borage11.94 ± 0.19 a2239.61 ± 5.20 a3.61 ± 0.85 e
Broccolo8.34 ± 0.10 c1744.37 ± 29.71 b51.05 ± 0.71 b
Savoy Cabbage2.58 ± 0.16 e869.70 ± 60.70 de2.00 ± 0.14 e
Chicory10.30 ± 0.76 b2493.13 ± 151.72 a1.78 ± 0.33 e
Getti e foglie4.09 ± 0.04 d1125.49 ± 6.44 cd0.54 ± 0.24 e
Red Curly Kale10.51 ± 0.22 b2210.15 ± 11.94 a207.32 ± 1.16 a
Green Curly Kale4.86 ± 0.16 d1427.28 ± 50.51 c0.50 ± 0.12 e
Radish8.43 ± 0.08 c2349.92 ± 23.07 a33.29 ± 1.76 d
Russian Kale5.43 ± 0.20 d1824.30 ± 85.90 b43.03 ± 1.64 c
Spigariello5.05 ± 0.58 d1255.81 ± 95.06 c1.52 ± 0.31 e
1 TAC: Total Antioxidant Capacity; 2 TPH: Total Phenols Content; 3 ACY: Total Anthocyanins Content. Data are presented as means ± standard error. Values with the same letter were not significantly different (p ≤ 0.05). n = 12.
Table 7. Phenolics, anthocyanins contents and antioxidant capacity in the different type of vegetables analyzed during 2nd year in Valdaso.
Vegetables 2nd Year-ValdasoTAC 1
(mM Trolox/kg fw)
TPH 2
(mg GA/kg fw)
ACY 3
(mg CYA-3-GLU/kg fw)
Black Cabbage8.43 ± 0.24 d1597.99 ± 27.12 c10.36 ± 1.00 c
Turnip Top4.53 ± 0.09 e860.21 ± 26.16 d0.73 ± 0.29 c
Getti e foglie4.21 ± 0.08 e701.39 ± 10.07 e2.97 ± 0.57 c
Red Curly Kale11.97 ± 0.24 b1582.49 ± 27.73 c347.21 ± 5.89 a
Green Curly Kale19.36 ± 0.69 a2788.77 ± 27.51 a3.09 ± 1.18 c
Russian Kale 4.27 ± 0.14 e750.56 ± 27.10 e48.91 ± 7.55 b
Spigariello9.70 ± 0.13 c1706.96 ± 35.20 b5.23 ± 0.32 c
1 TAC: Total Antioxidant Capacity; 2 TPH: Total Phenols Content; 3 ACY: Total Anthocyanins Content. Data are presented as means ± standard error. Values with the same letter were not significantly different (p ≤ 0.05). n = 12.
Table 8. Phenolics, anthocyanins contents and antioxidant capacity in the different type of vegetables analyzed during the two years of trials in Valdaso.
Valdaso Vegetables Average 2016/2017TAC 1
(mM Trolox/kg fw)
TPH 2
(mg GA/kg fw)
ACY 3
(mg CYA-3-GLU/kg fw)
Getti e foglie4.18 ± 0.06 c807.41 ± 48.02 e2.36 ± 0.51 c
Red Curly Kale11.61 ± 0.24 a1739.41 ± 73.17 b312.24 ± 16.24 a
Green Curly Kale12.11 ± 1.55 a2108.02 ± 144.71 a1.79 ± 0.64 c
Russian Kale 4.85 ± 0.17 c1287.43 ± 120.30 d45.97 ± 3.83 b
Spigariello7.38 ± 0.57 b1481.38 ± 68.33 c3.37 ± 0.44 c
1 TAC: Total Antioxidant Capacity; 2 TPH: Total Phenols Content; 3 ACY: Total Anthocyanin Content. Data are presented as means ± standard error. Values with the same letter were not significantly different (p ≤ 0.05). n = 24.
Table 9. Effect of vegetable genotype x environment interaction on 2nd year Valdaso and Fucino samples.
VegetablesAreasTAC 1
(mM Trolox/kg fw)
TPH 2
(mg GA/kg fw)
ACY 3
(mg CYA-3-GLU/kg fw)
Black CabbageFucino4.92 ± 0.09 f961.11 ± 35.19 e3.92 ± 0.62 c
Valdaso8.43 ± 0.24 e1597.99 ± 27.12 d10.36 ± 1.00 c
Turnip TopFucino3.03 ± 0.19 h1038.06 ± 57.57 e1.60 ± 0.12 c
Valdaso4.53 ± 0.09 f860.21 ± 26.16 f0.73 ± 0.29 c
Getti e foglieFucino3.46 ± 0.08 gh705.41 ± 13.85 g3.54 ± 0.51 c
Valdaso4.21 ± 0.08 fg701.39 ± 10.07 g2.97 ± 0.57 c
Red Curly KaleFucino13.68 ± 0.38 b1966.52 ± 32.90 b437.29 ± 22.64 a
Valdaso11.97 ± 0.24 c1582.49 ± 27.73 d347.21 ± 5.89 b
Green Curly KaleFucino8.86 ± 0.33 e1559.07 ± 53.34 d0.00 ± 0.00 c
Valdaso19.36 ± 0.69 a2788.77 ± 27.51 a3.09 ± 1.18 c
SpigarielloFucino5.13 ± 0.06 f1002.40 ± 26.71 e3.92 ± 0.41 c
Valdaso9.70 ± 0.13 d1706.96 ± 35.20 c5.23 ± 0.32 c
Fucino-6.51 ± 0.45 B1205.43 ± 52.78 B75.05 ± 19.57 A
Valdaso-9.70 ± 0.62 A1539.63 ± 81.15 A61.60 ± 15.19 B
1 TAC: Total Antioxidant Capacity; 2 TPH: Total Phenols Content; 3 ACY: Total Anthocyanin Content. Data are presented as means ± standard error. Values with the same letter were not significantly different (p ≤ 0.05). n = 12; N = 72.
Publisher’s Note: MDPI stays neutral with regard to jurisdictional claims in published maps and institutional affiliations.

