1. Introduction
The magnetic materials world is vast, with applications spanning various industrial sectors [
1]. In general, this world is split into two main groups: soft and hard magnetic materials. Hard magnetic materials play a central role in magnetic flux generation without requiring an external source to produce it. Permanent magnets are hard magnetic materials. They are subdivided into families, the most common of which are hard ferrite, AlNiCo, SmCo, and NdFeB. There are various types of manufacturing processes, but sintered and bonded are the most popular ones [
2].
Magnetic cores are made with soft magnetic materials [
3,
4]. The great variety of materials depends on application types [
5,
6,
7,
8,
9]. Silicon–iron electrical steel is used in transformers, electrical motors and generators, reactors, lamp ballasts, instrumentation, and shielding. Amorphous and nanocrystalline alloys are the favored materials for special transformers [
10], power electronics, pulsed powers, and shielding. Instead, FeCo alloys are used in particular generators and power electronics. Soft magnetic compacted powder is used in electrical machines and, to top it off, soft ferrites are used in power transformers, electronic devices, chokes, and also pulsed power.
For inductive applications within power electronics and electrical machines, there is a requirement for the ability to rapidly switch the magnetization of the material with an external magnetic field. Thus, soft magnetic materials are primarily used within these applications due to their high magnetic permeabilities. Furthermore, with the introduction of wide-bandgap semiconductors, power conversion electronics and motor controllers, for example, can operate at higher frequencies. These components tend to reduce the size of the passive components, such as inductors and capacitors, and allow for higher efficiencies of electrical machines.
For this reason, the selection of magnetic materials depends heavily on the application one is considering. Additionally, the frequency range determines some limitations in the use of soft magnetic materials for inductance applications. In particular, for MHz frequency intervals, the uses are related to oscillators and electromagnetic interference (EMI) filters [
7]. However, the same EMI filters are also used for kHz ranges, where power electronics components find applications together with common-mode choke inductance. For low frequencies, audio applications and smoothing inductances represent the characteristic use of soft magnetic materials. Typical soft materials used at these frequency ranges are soft ferrites and amorphous and nanocrystalline alloys due to their respective permeability behavior and reduced losses.
Nevertheless, these materials present some drawbacks: brittleness [
11], low saturation for ferrites, non-constant permeability across a frequency range, and the manufacturing costs for amorphous and nanocrystalline alloys.
This work investigates the possibility of adopting soft magnetic materials suitable for use in high-frequency applications, particularly analyzing soft magnetic composites (SMCs) [
12]. SMC materials are commonly used in electrical machine magnetic cores; in some cases, they are also used in inductance applications [
13,
14]. A wide investigation into this specific adoption is still being carried out, possibly leading to promising solutions.
Different SMC materials are explored in this work, mainly considering the type of insulating layer for an inductance application. For a comprehensive inductance analysis, the magnetic permeability, the core power losses, and quality factor (Q) are examined for different frequency ranges [
15,
16] using data from two different instruments and methods which complement each other: an RLC meter and a large-cycle hysteresigraph.
2. Soft Magnetic Composite Materials
In the last three decades, powder metallurgy, together with other industrial environments, has involved innovative raw materials and products. This represented a starting point for the development of the brand-new concept of ferromagnetic materials (soft magnetic composites, or SMCs), presenting many advantages in sectors, such as those involving electrical machines [
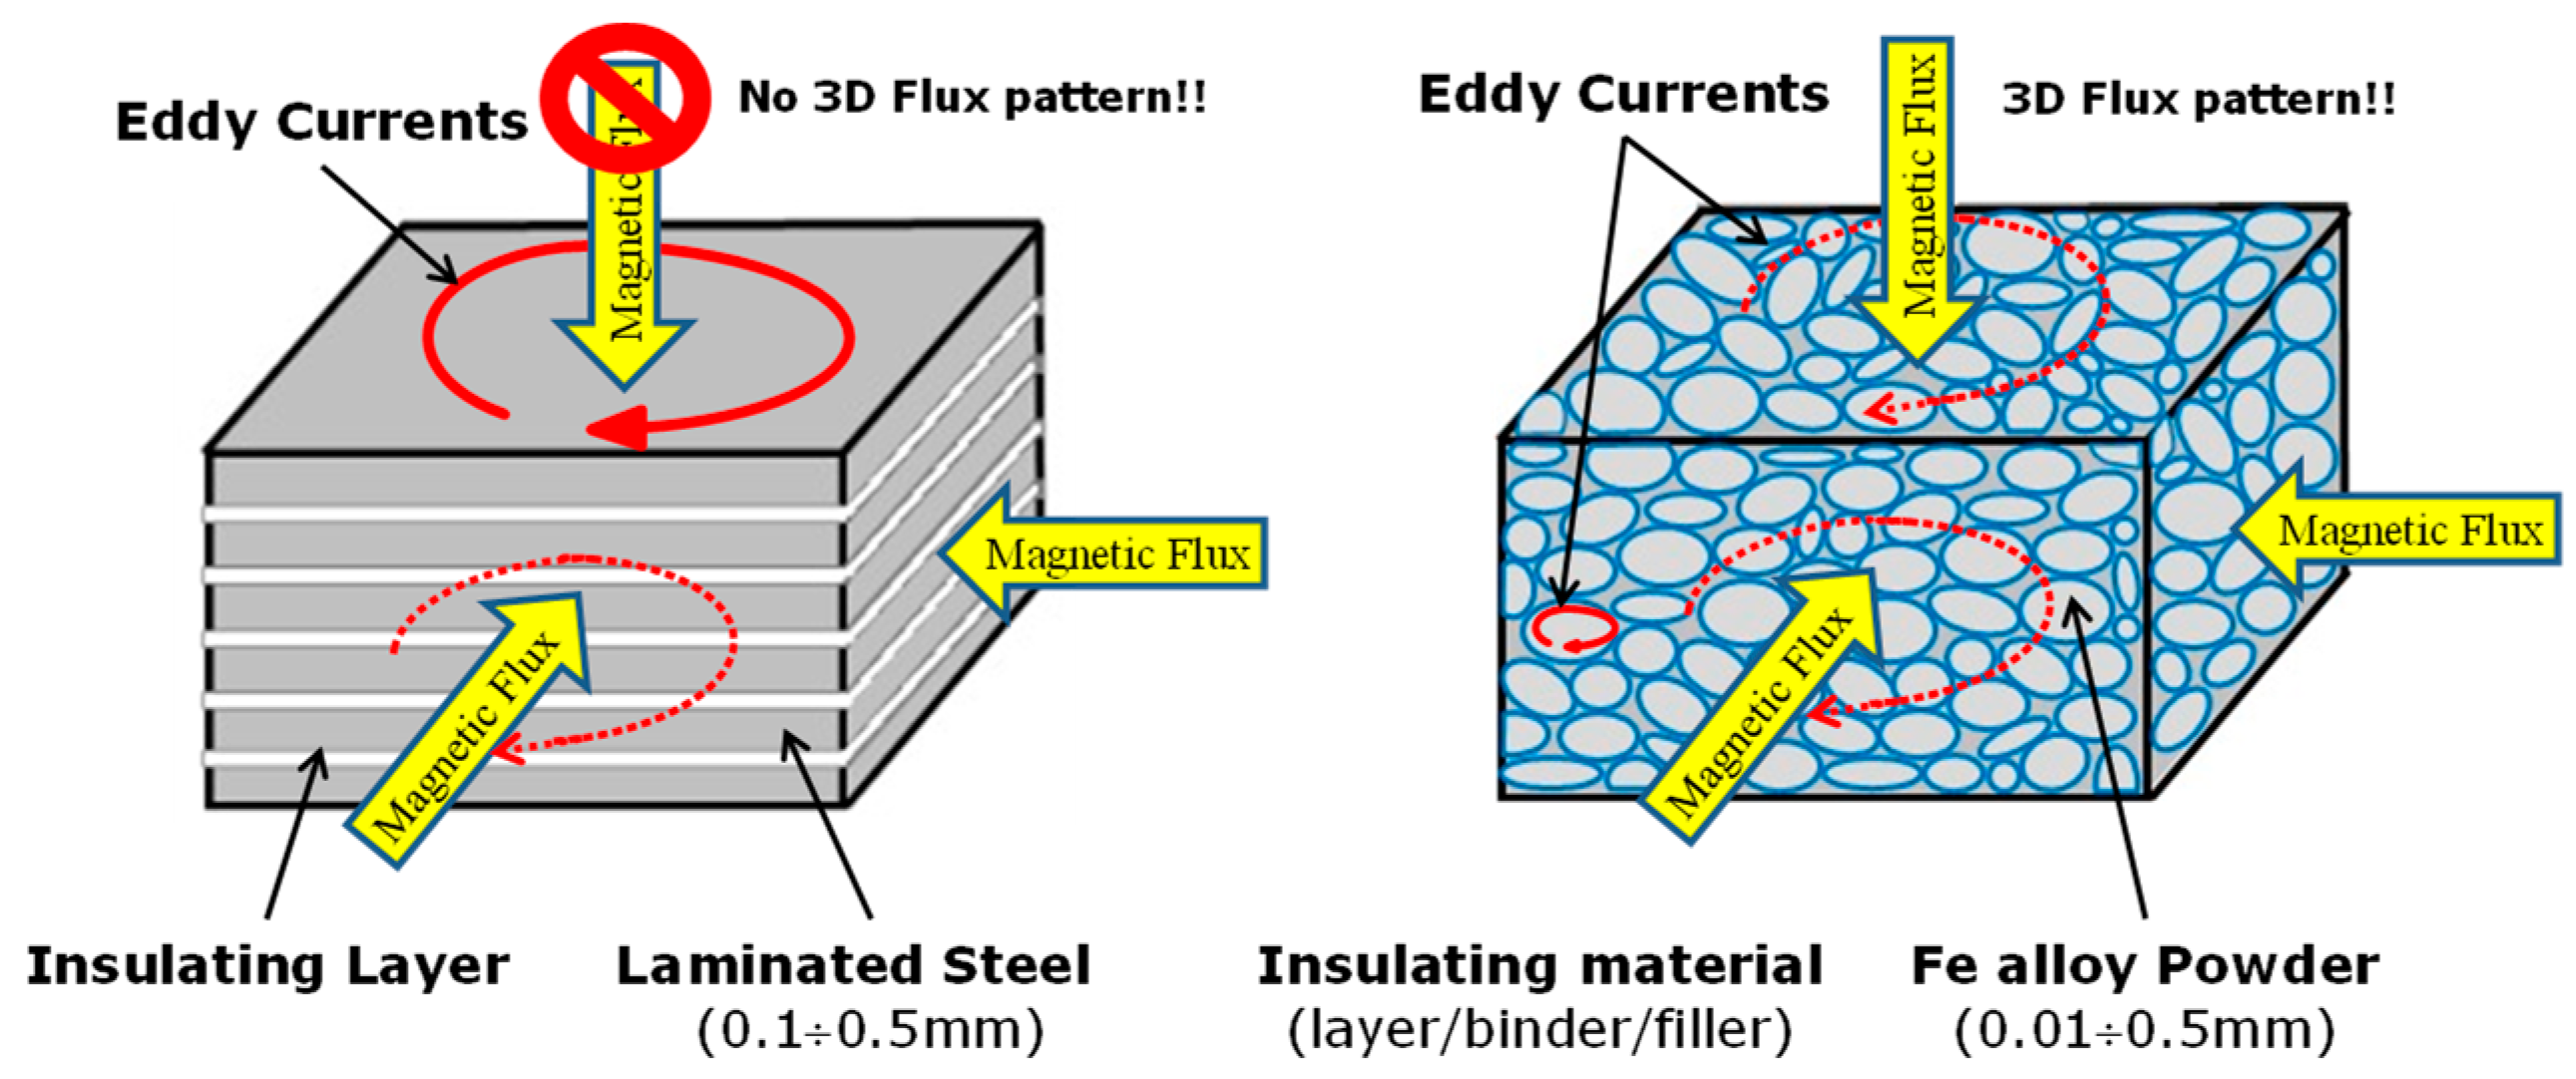
9]. The most evident advantage provided by SMC material concerns the possible directions of magnetic flux, as highlighted in
Figure 1. The magnetic flux path has the same behavior in all directions (3D) for SMCs. Moreover, the eddy currents are only restricted to particle dimensions.
SMC development started in the 1980s [
13]. This consisted of electrically insulated iron powder particles with consequent isotropic magnetic behavior; the insulating material acts as a binder for the metal powder, assuming a dominant role in research activity. Therefore, the coating process is crucial and may be prepared with different techniques [
17]. SMCs’ final magnetic and energetic properties depend on the volume ratio between the magnetic powder and insulating/binding material, so the insulating layer should be minimized around each ferromagnetic particle [
18,
19,
20]. On the other hand, the layer’s binding effect is inversely proportional to its thickness. Therefore, the research activities are oriented to optimize thinner and uniform binder layers, while maintaining good mechanical and dielectric properties.
As SMCs still represent a tradeoff between electrical, magnetic, and mechanical aspects, the choice of the preferred properties depending on the specific final application [
14,
21,
22] is a crucial point in the realization phase.
Materials for radio-frequency applications, such as EMI absorbers, are made of finer powders with a thick insulating layer, while an SMC for an electrical machine shows thicker powder grains and late saturating, with good large-cycle behavior and the thinnest coating layer.
Generally speaking, the insulating layer can be organic or inorganic, but hybrid solutions are also found sometimes [
17].
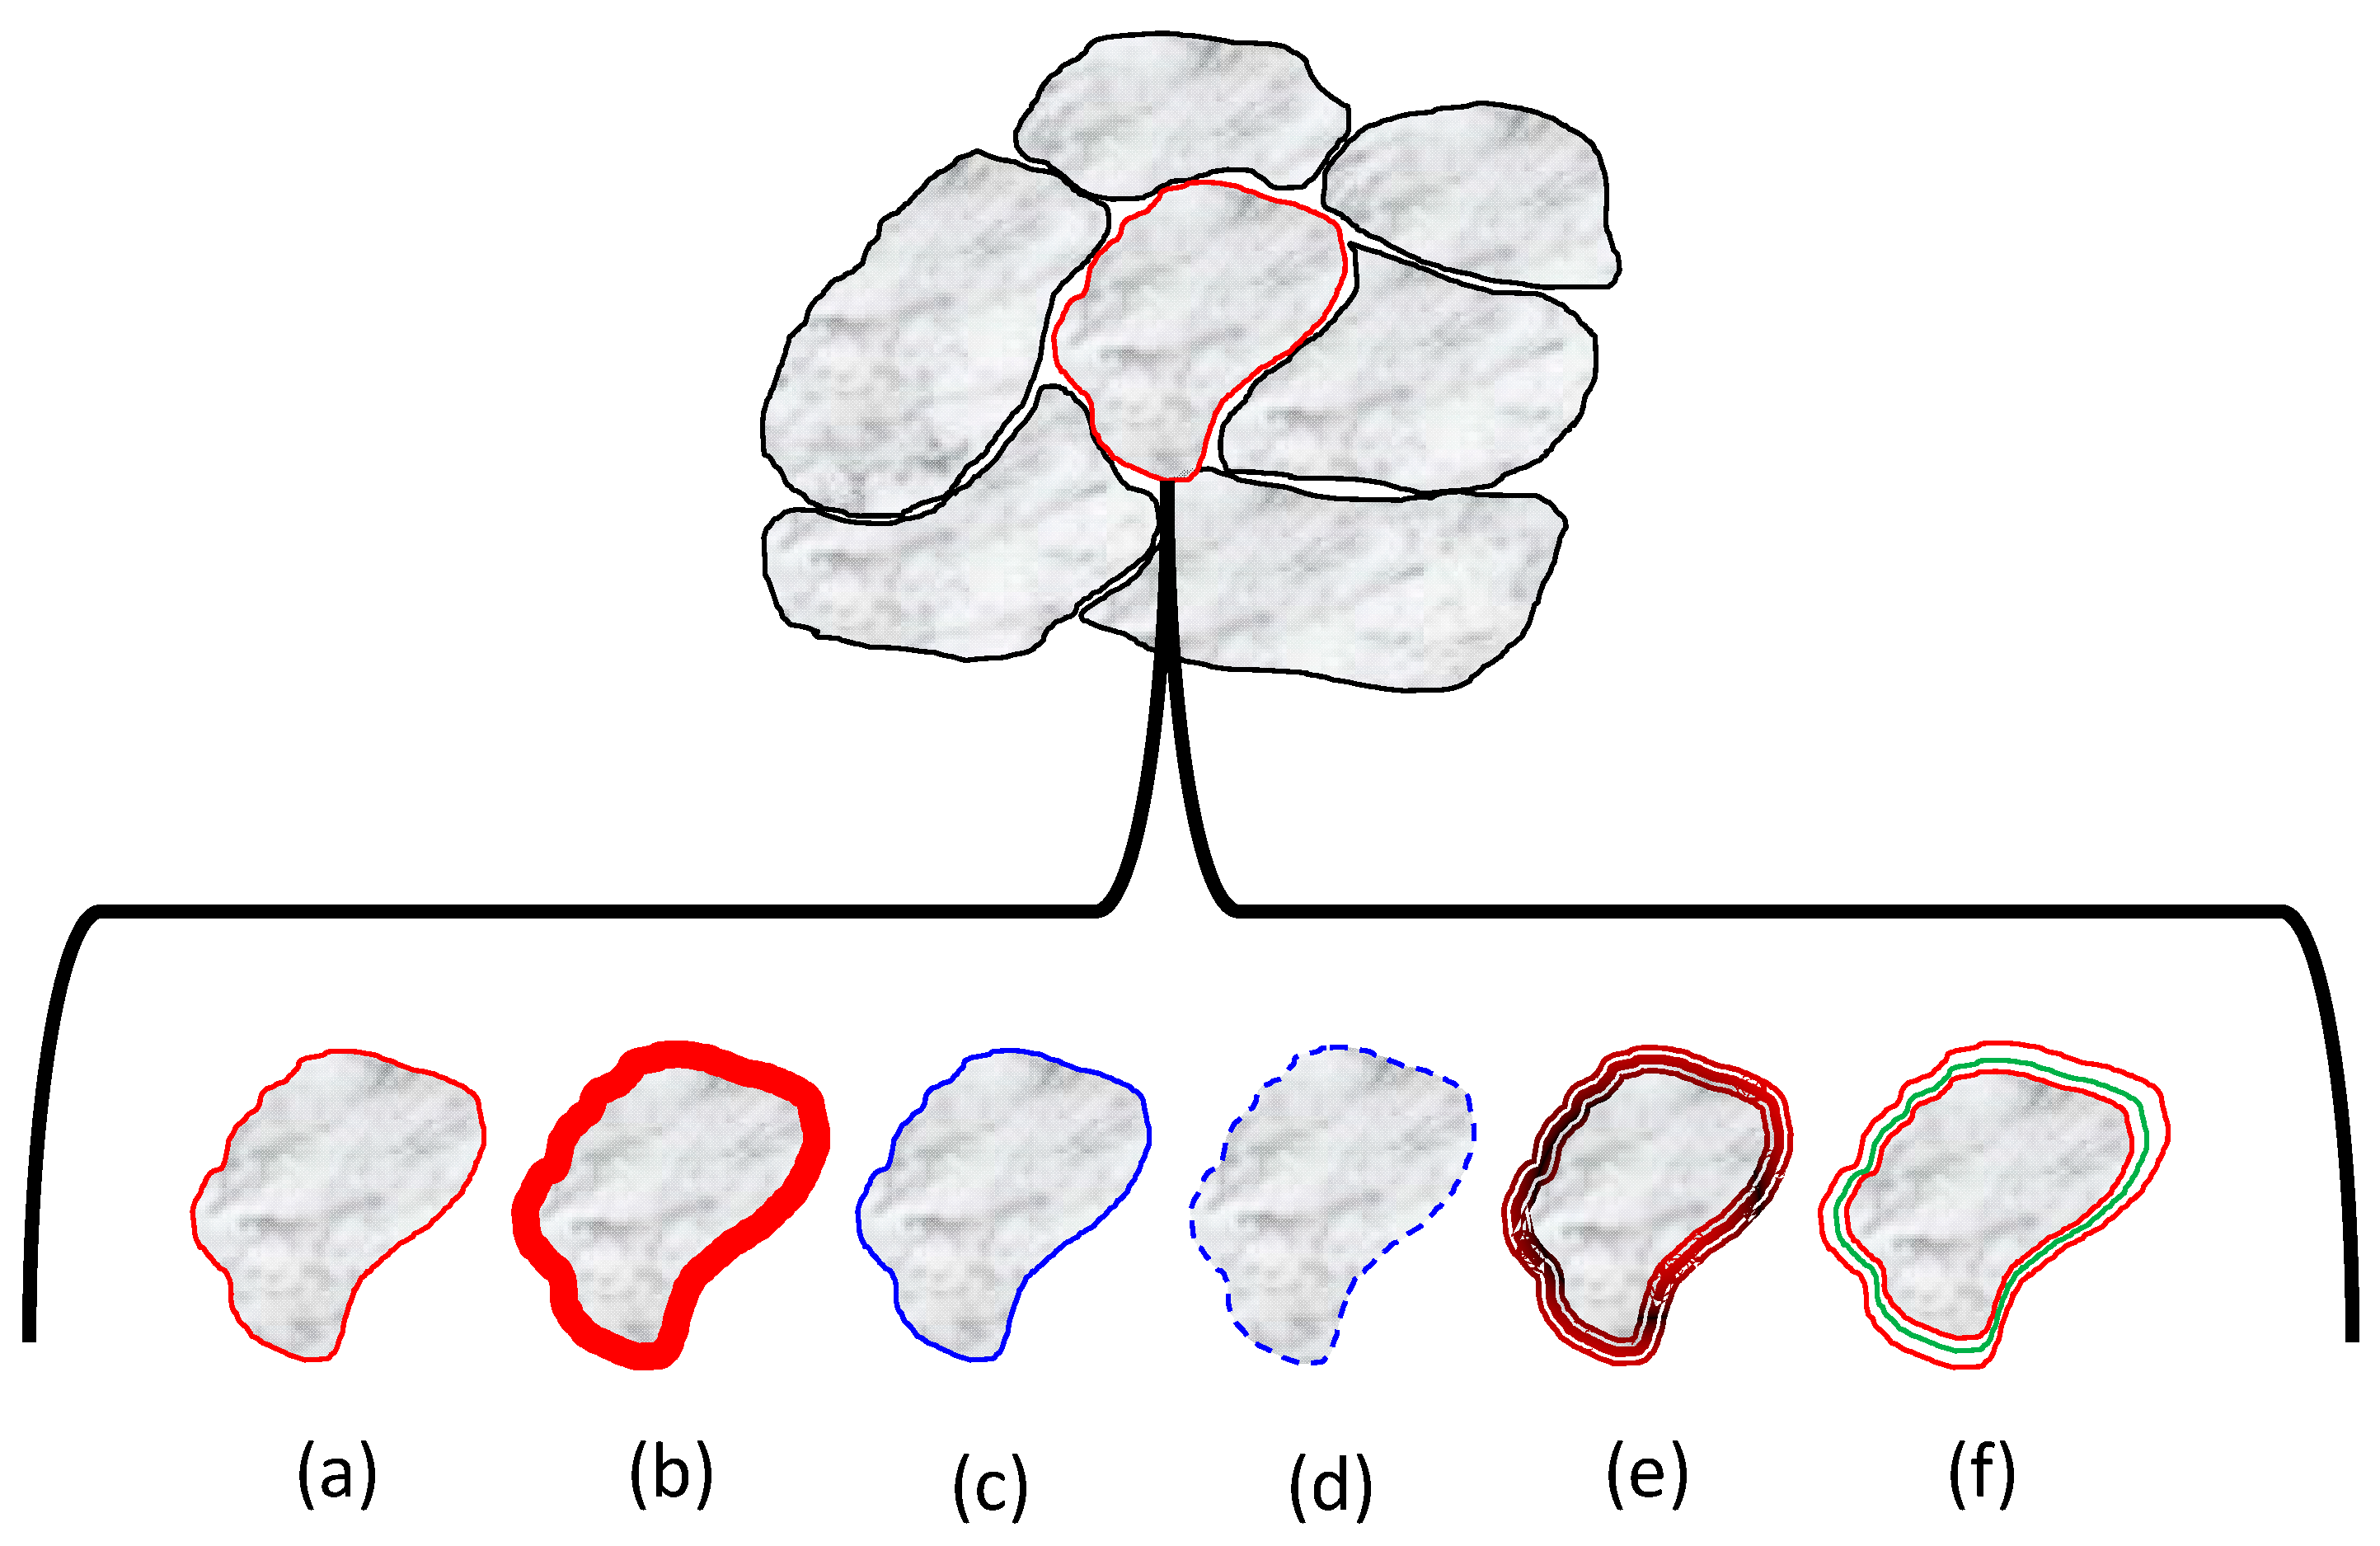
Figure 2 shows the ferromagnetic particles with different types of insulating coatings.
In the present work, some specific layers have been selected to explore—in the first approach—their application in inductance sectors. The coating weight percentage is maintained at a high rate to reach the abovementioned properties for medium–high frequency applications.
3. Method and Preparation of SMC Samples
As mentioned in the previous chapter, four different SMC materials were examined and produced for high-frequency testing. Two of the samples produced were composed of very pure iron powder and epoxy resin (organic binder), while the other two were made with inorganic coatings. One was based on ferrite nano-powders and another on phosphatized ferromagnetic powder. The latter was a typical commercial product.
The adopted water-atomized iron was a high-purity powder with a minimum content of oxygen and other elements. The epoxy resin used was a specific polymeric product used in automotive sectors and can be applied to 300 °C. The nano-ferrite powder is used as a dye in several industrial sectors; its particle dimensions are tens of nm.
Epoxy SMC 1-800 denotes the sample containing 1% in weight of epoxy and compacted at 800 MPa, while epoxy SMC 2-800 denotes the sample containing the same epoxy resin in 2 wt.%, pressed at the same hydraulic pressure level. Nano-ferrite SMC 1-800 refers to the 1 wt.% of the ferrite insulating layer. Phosphatized SMC-800 is a product available on the market; it is already adopted to produce SMC inductors.
The constant weight percentage content does not allow an easy comparison between different binders, since the binder density affects the final layer volume. However, both the nano-ferrite and the epoxy resin begin to reach insulation suitable for their use in inductor cores starting from around 1% of content by weight. It is possible that different effective binder volumes are compensated by other physical properties. As an example, resin is a dense liquid or gel that is well distributed, but highly deformable, while ferrite is a nano-sized solid powder that is discrete and hard to displace during the molding phase, but is less sensitive to deformations.
The samples of pure iron and all proposed binders were produced by mixing the two constituents by hand, followed by a mixing process in an industrial mixer for 30 min, as seen in
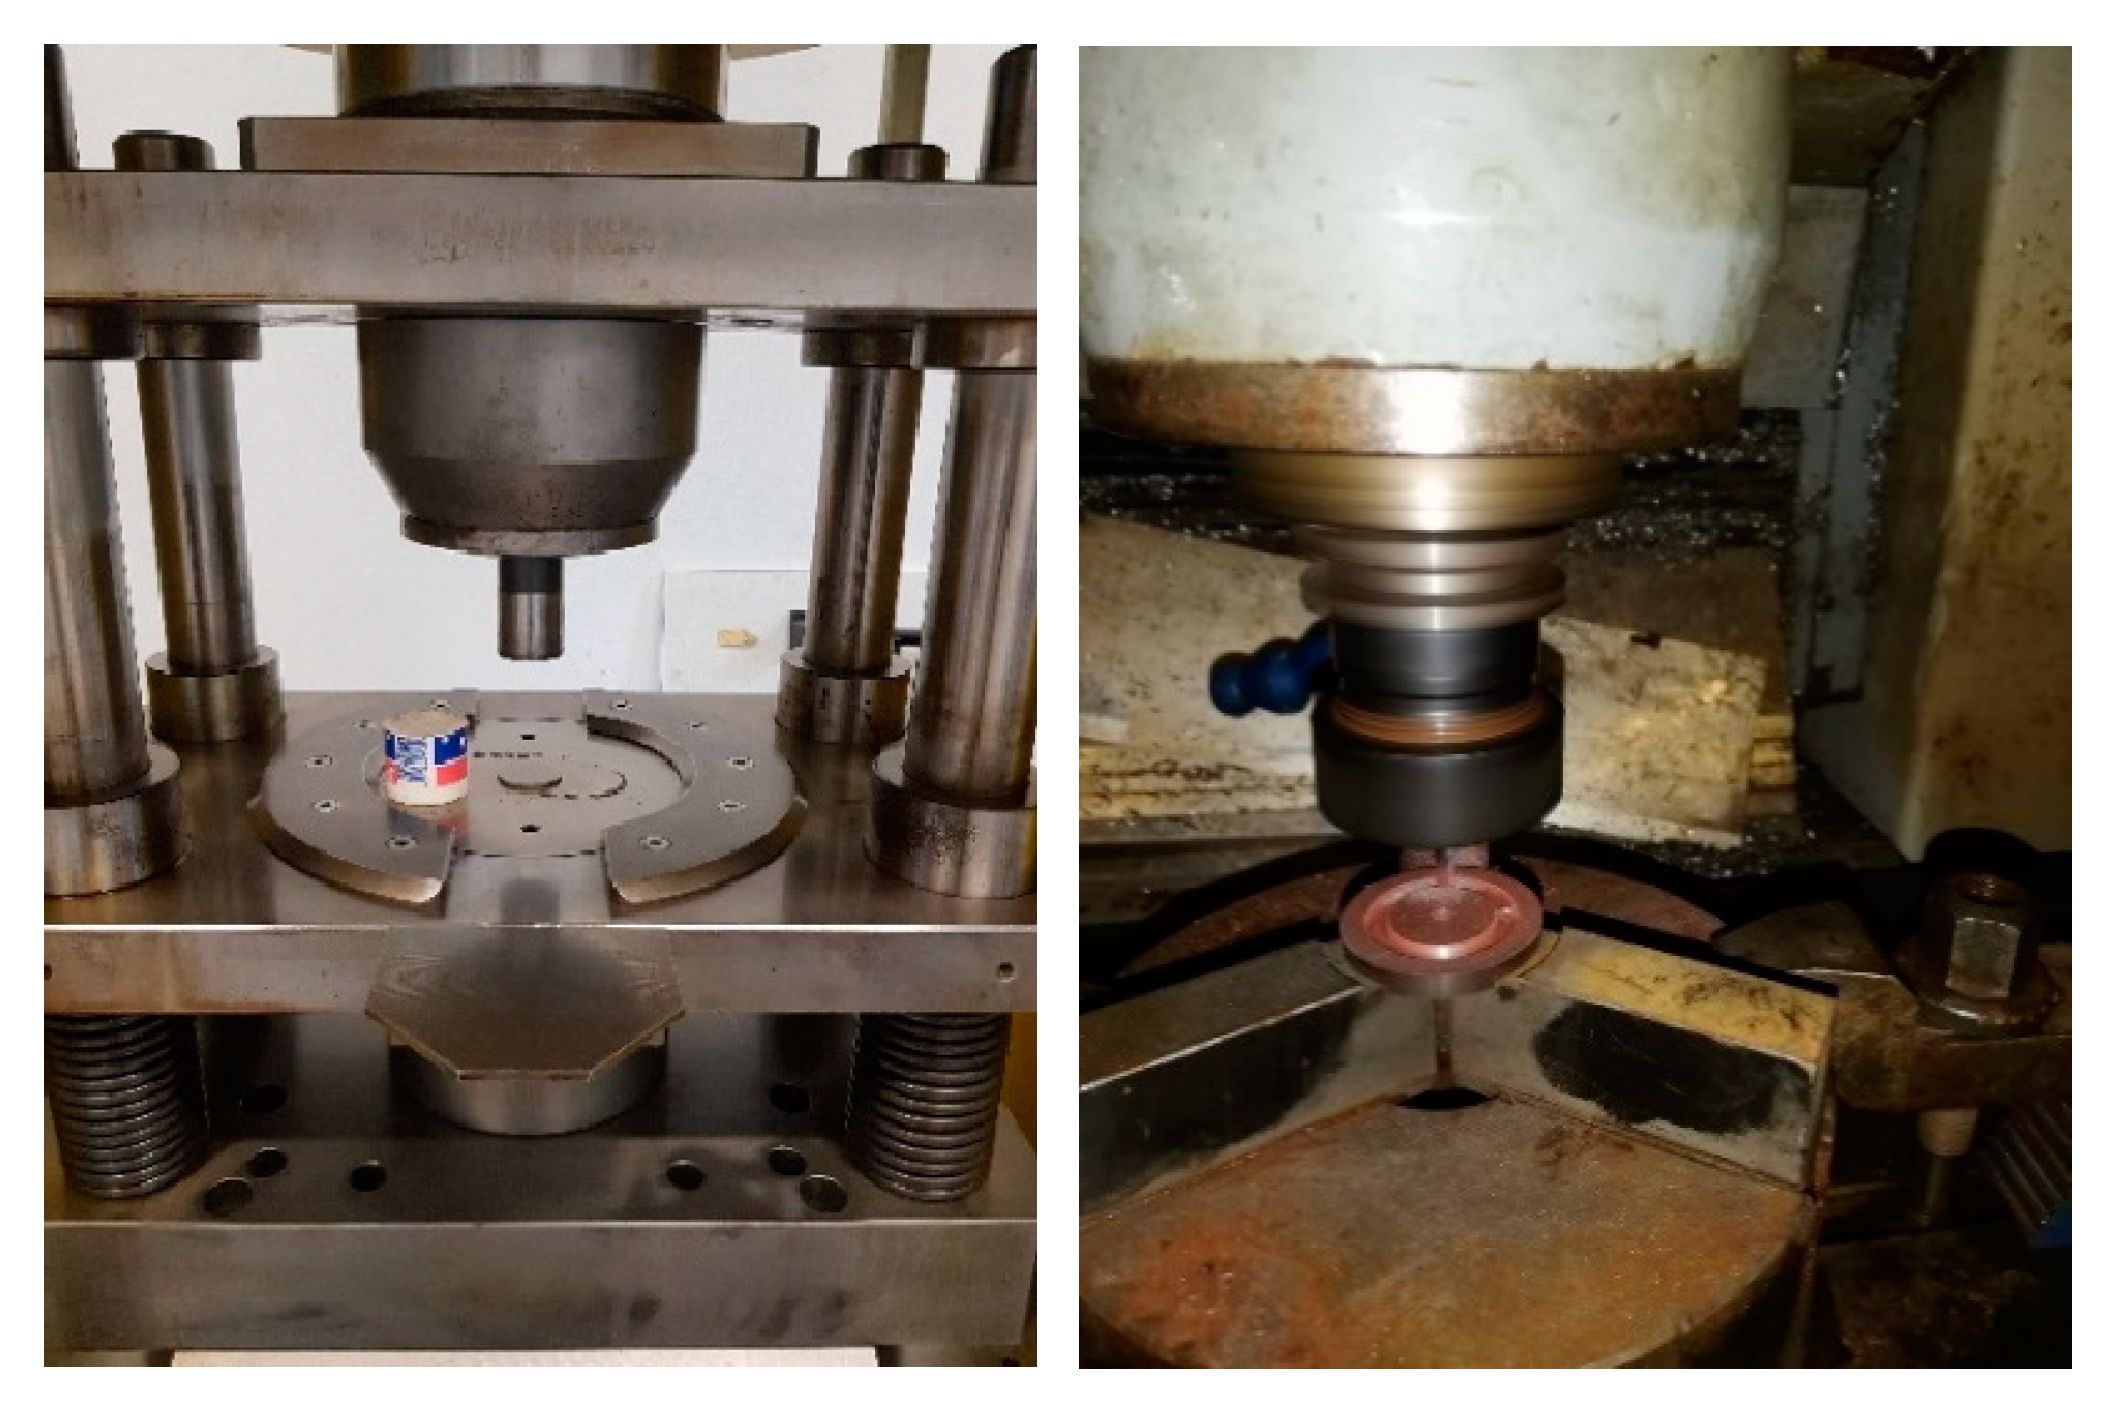
Figure 3. All the samples were then compacted into discs using a hydraulic press at 800 MPa, as shown in
Figure 4. The organic binder samples were then cured at 150 °C for six hours. Instead, the phosphatized SMC-800 was thermally treated at 530 °C in air, while the nano-ferrite SMC was left to be evaluated as a green sample. A milling process was then executed to remove the center material in order to produce the toroid geometry seen in
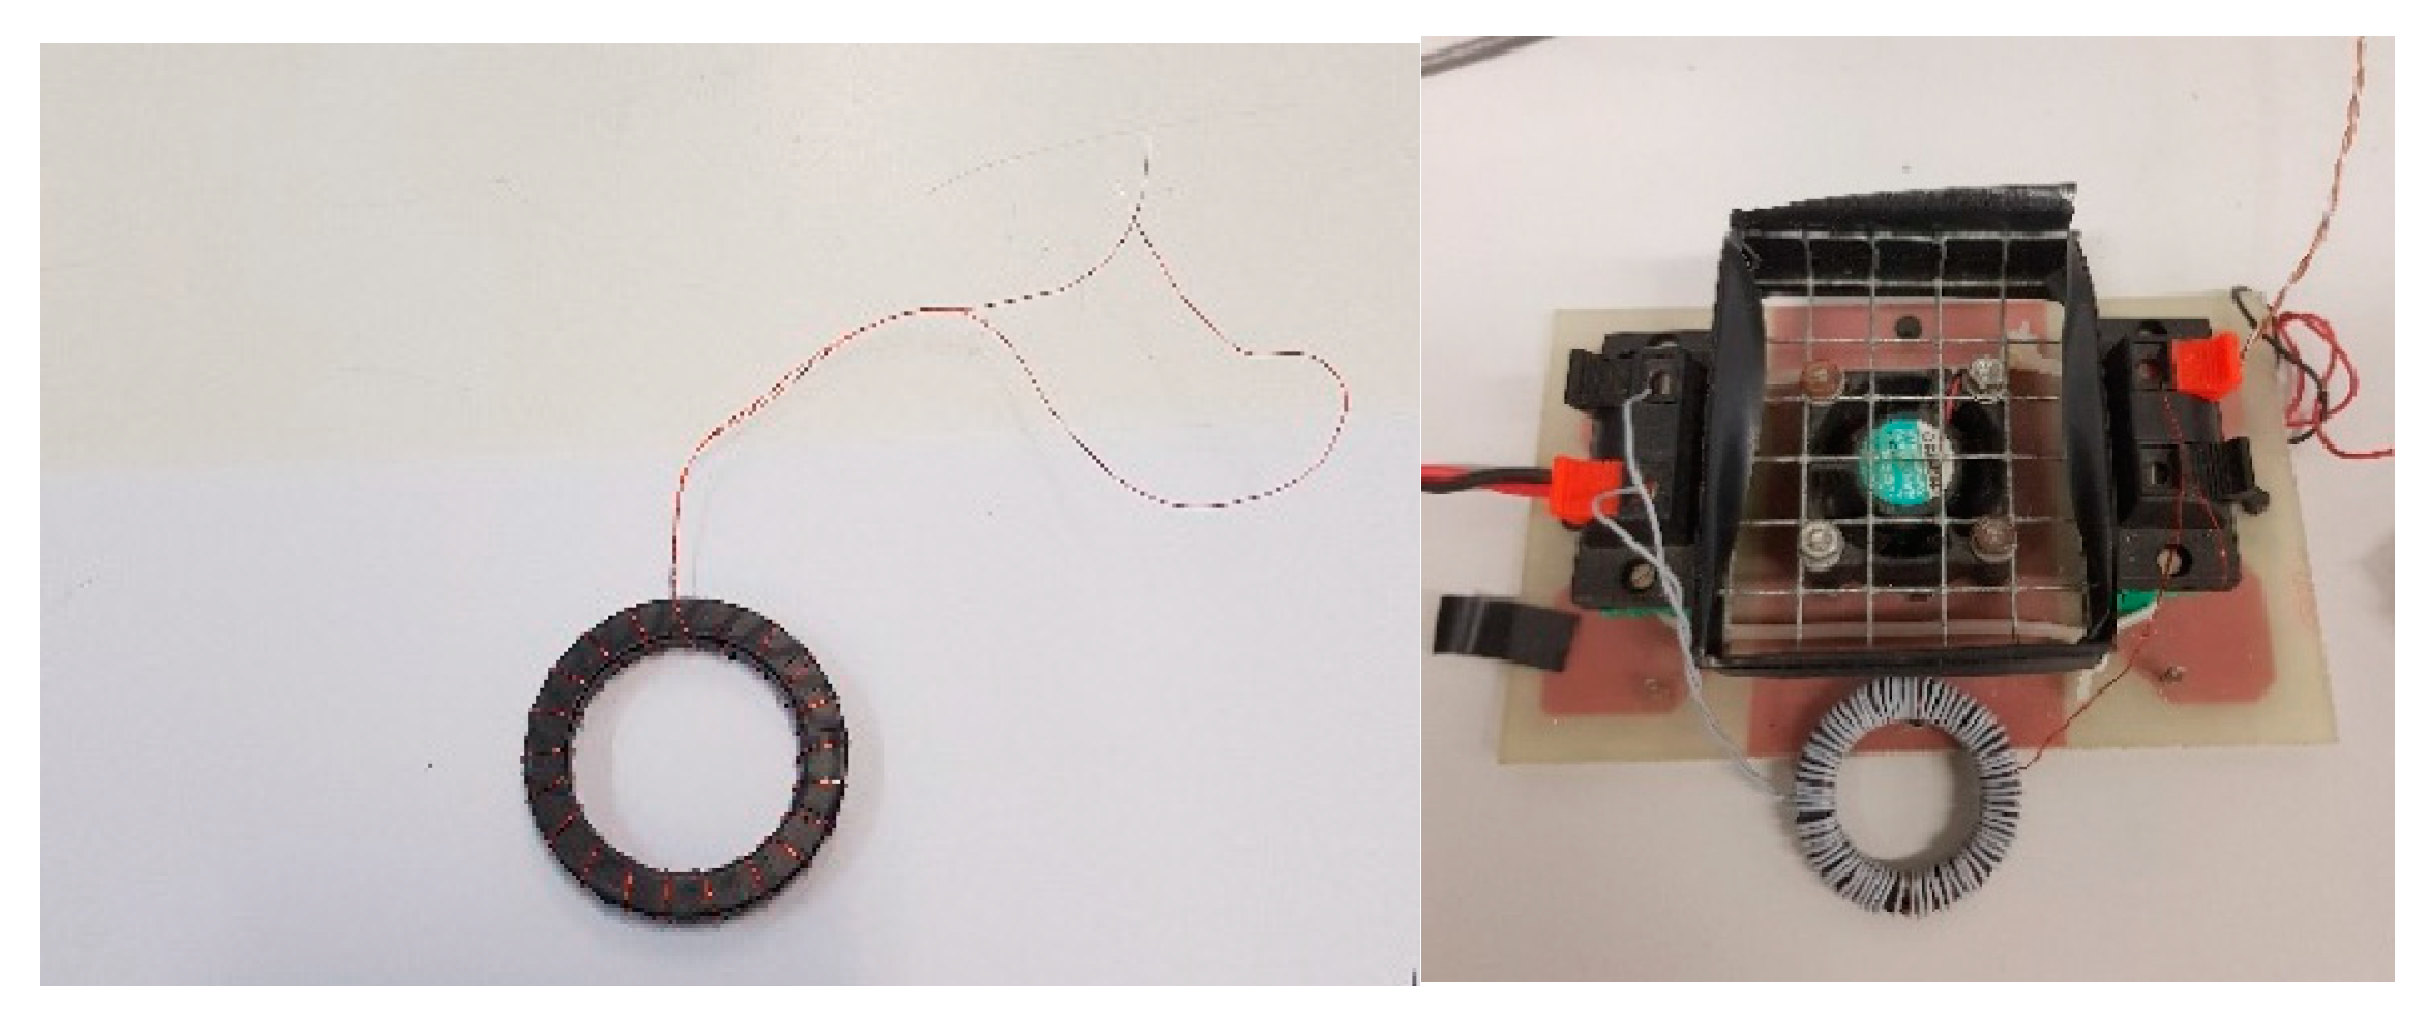
Figure 4. After machining, each discoidal sample was divided into two parts: the toroidal ring and the smaller central disk. Next, the toroidal rings were wound with one layer of electrical tape to protect the wire insulation of the secondary coils from accidental micro-cuts. With the secondary coils and ultimately with the primary coils, the windings are completed, as shown in
Figure 5.
The latter was well suited to obtain a further machined sample in the shape of a small rod. Finally, a further rod made of soft ferrite completed the sample set.
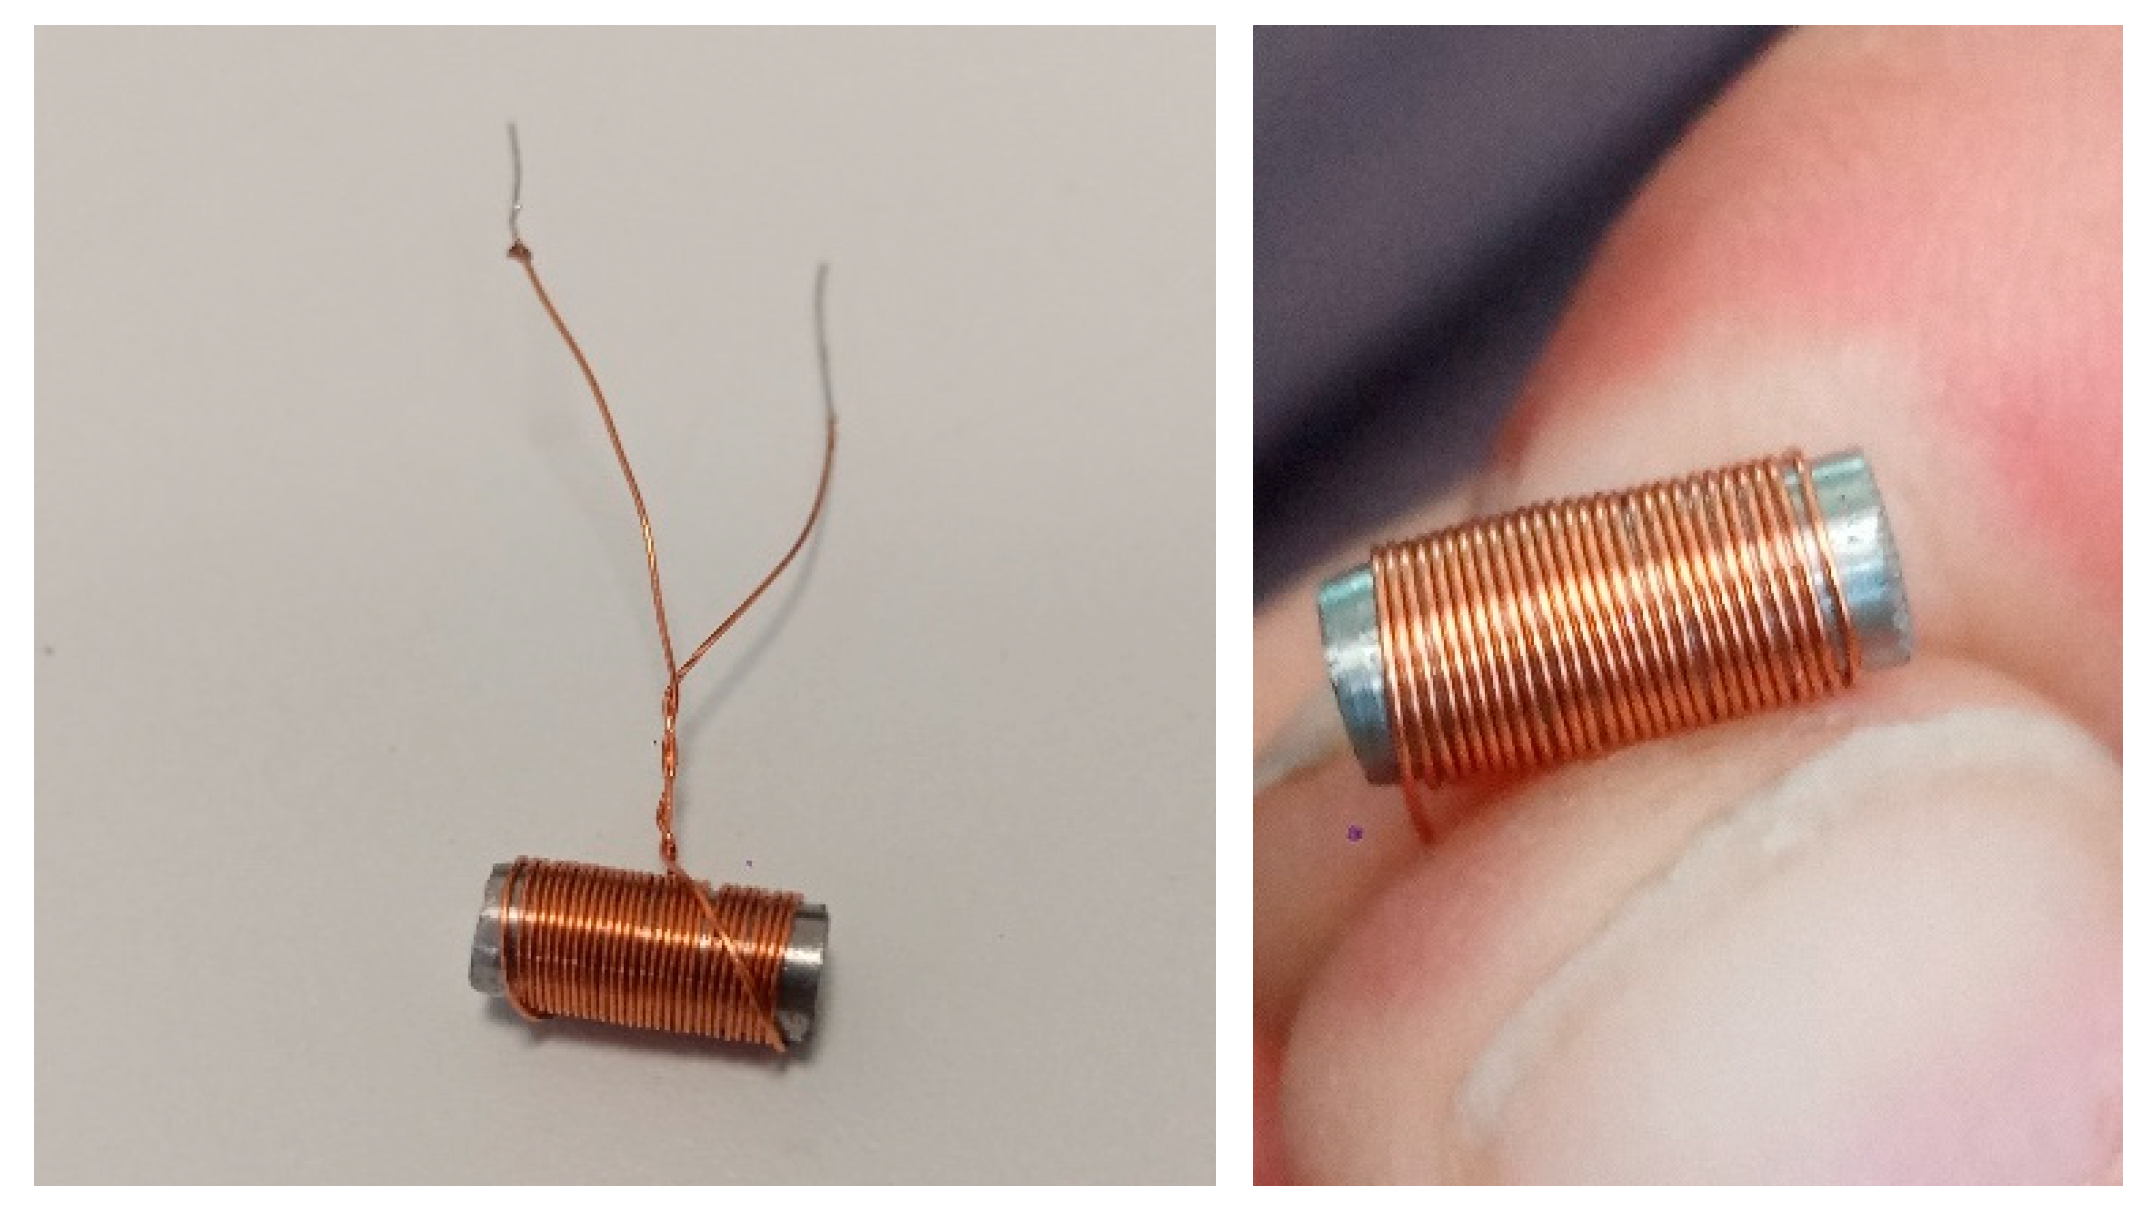
The SMC rods were machined at the final diameter (4.5 mm) and then brought to the same length (11.5 mm). Each rod guested a winding made of 29 coils with a 0.25 mm diameter enameled copper wire, as shown in
Figure 6.
Choosing the suitable materials to perform a comparison was a challenging task, which started from the considerations of the properties of a ring sample made from a part of a commercial SMC inductor.
After having analyzed the properties of the commercial SMC, other materials were designed and made in order to obtain two main characteristics: a high resistivity value (high-insulating material content, and a metal oxide added) and better magnetic and energetic behavior (good initial and maximum magnetic permeability, far saturation, and good energetic properties).
In summary, the chosen materials shared common properties:
Two of them contain the same weight percentage as the binder but different binder materials—see the above considerations on this constant weight ratio comparison.
Two of them contain the same binder material but in different percentages.
4. Experimental Results
Several parameters are considered to assess the performance of SMC inductors. Commonly, various permeability values (initial, complex and maximum magnetic permeability) are referred to as principal data. On the other hand, the parameter that is required to be considered is the quality factor
Q. This is a measure of the performance of an inductor and is useful information when considering a material’s implementation in high-frequency applications. It is represented through the following equation:
where
R and
L are resistance and inductance value, respectively, and
ω indicates the pulsation corresponding to the operating frequency. The factor’s representation is made through complex permeability [
23], where
μ′ and
μ″ are the real and imaginary parts, respectively, and obtain the
μr relative permeability, which is depicted mathematically as:
It helps to understand how energy is dissipated through a phase shift of
δ (loss angle) between magnetic polarization J (t) and magnetic field H (t), mainly, real permeability represents the inductive component, and the imaginary part describes the loss component. Within a low-frequency applied magnetic field H, the induced magnetic flux B would be in phase with this field; however, with increasing frequency, there is an observed delay between the two. Notably, the magnetic flux cannot stay in phase with the magnetic field due to a phenomenon called domain wall resonance, and this phase delay is expressed through
δ. The loss tangent is deducible to:
The relation of the quality factor, through the loss tangent, provides an indication of how much power is lost over how much is stored within the material.
4.1. Measurement Setup and Procedure
The first measurements, made on the toroidal samples through a soft material hysteresigraph, show that the three proposed materials agree with the initially expected properties. In fact, they show farer saturation, higher maximum and initial permeability, and lower specific losses at 1 T compared to commercial products. The permeability values, in some cases, are taken as a modulus (maximum relative permeability) or as real and imaginary projected components (initial relative permeability). Detailed information will be addressed in the data presentation and comments paragraph.
Nevertheless, the following measurements on the rod inductors led to different considerations, as reported in the data presentation and comments paragraph.
RLC Meter Measurement
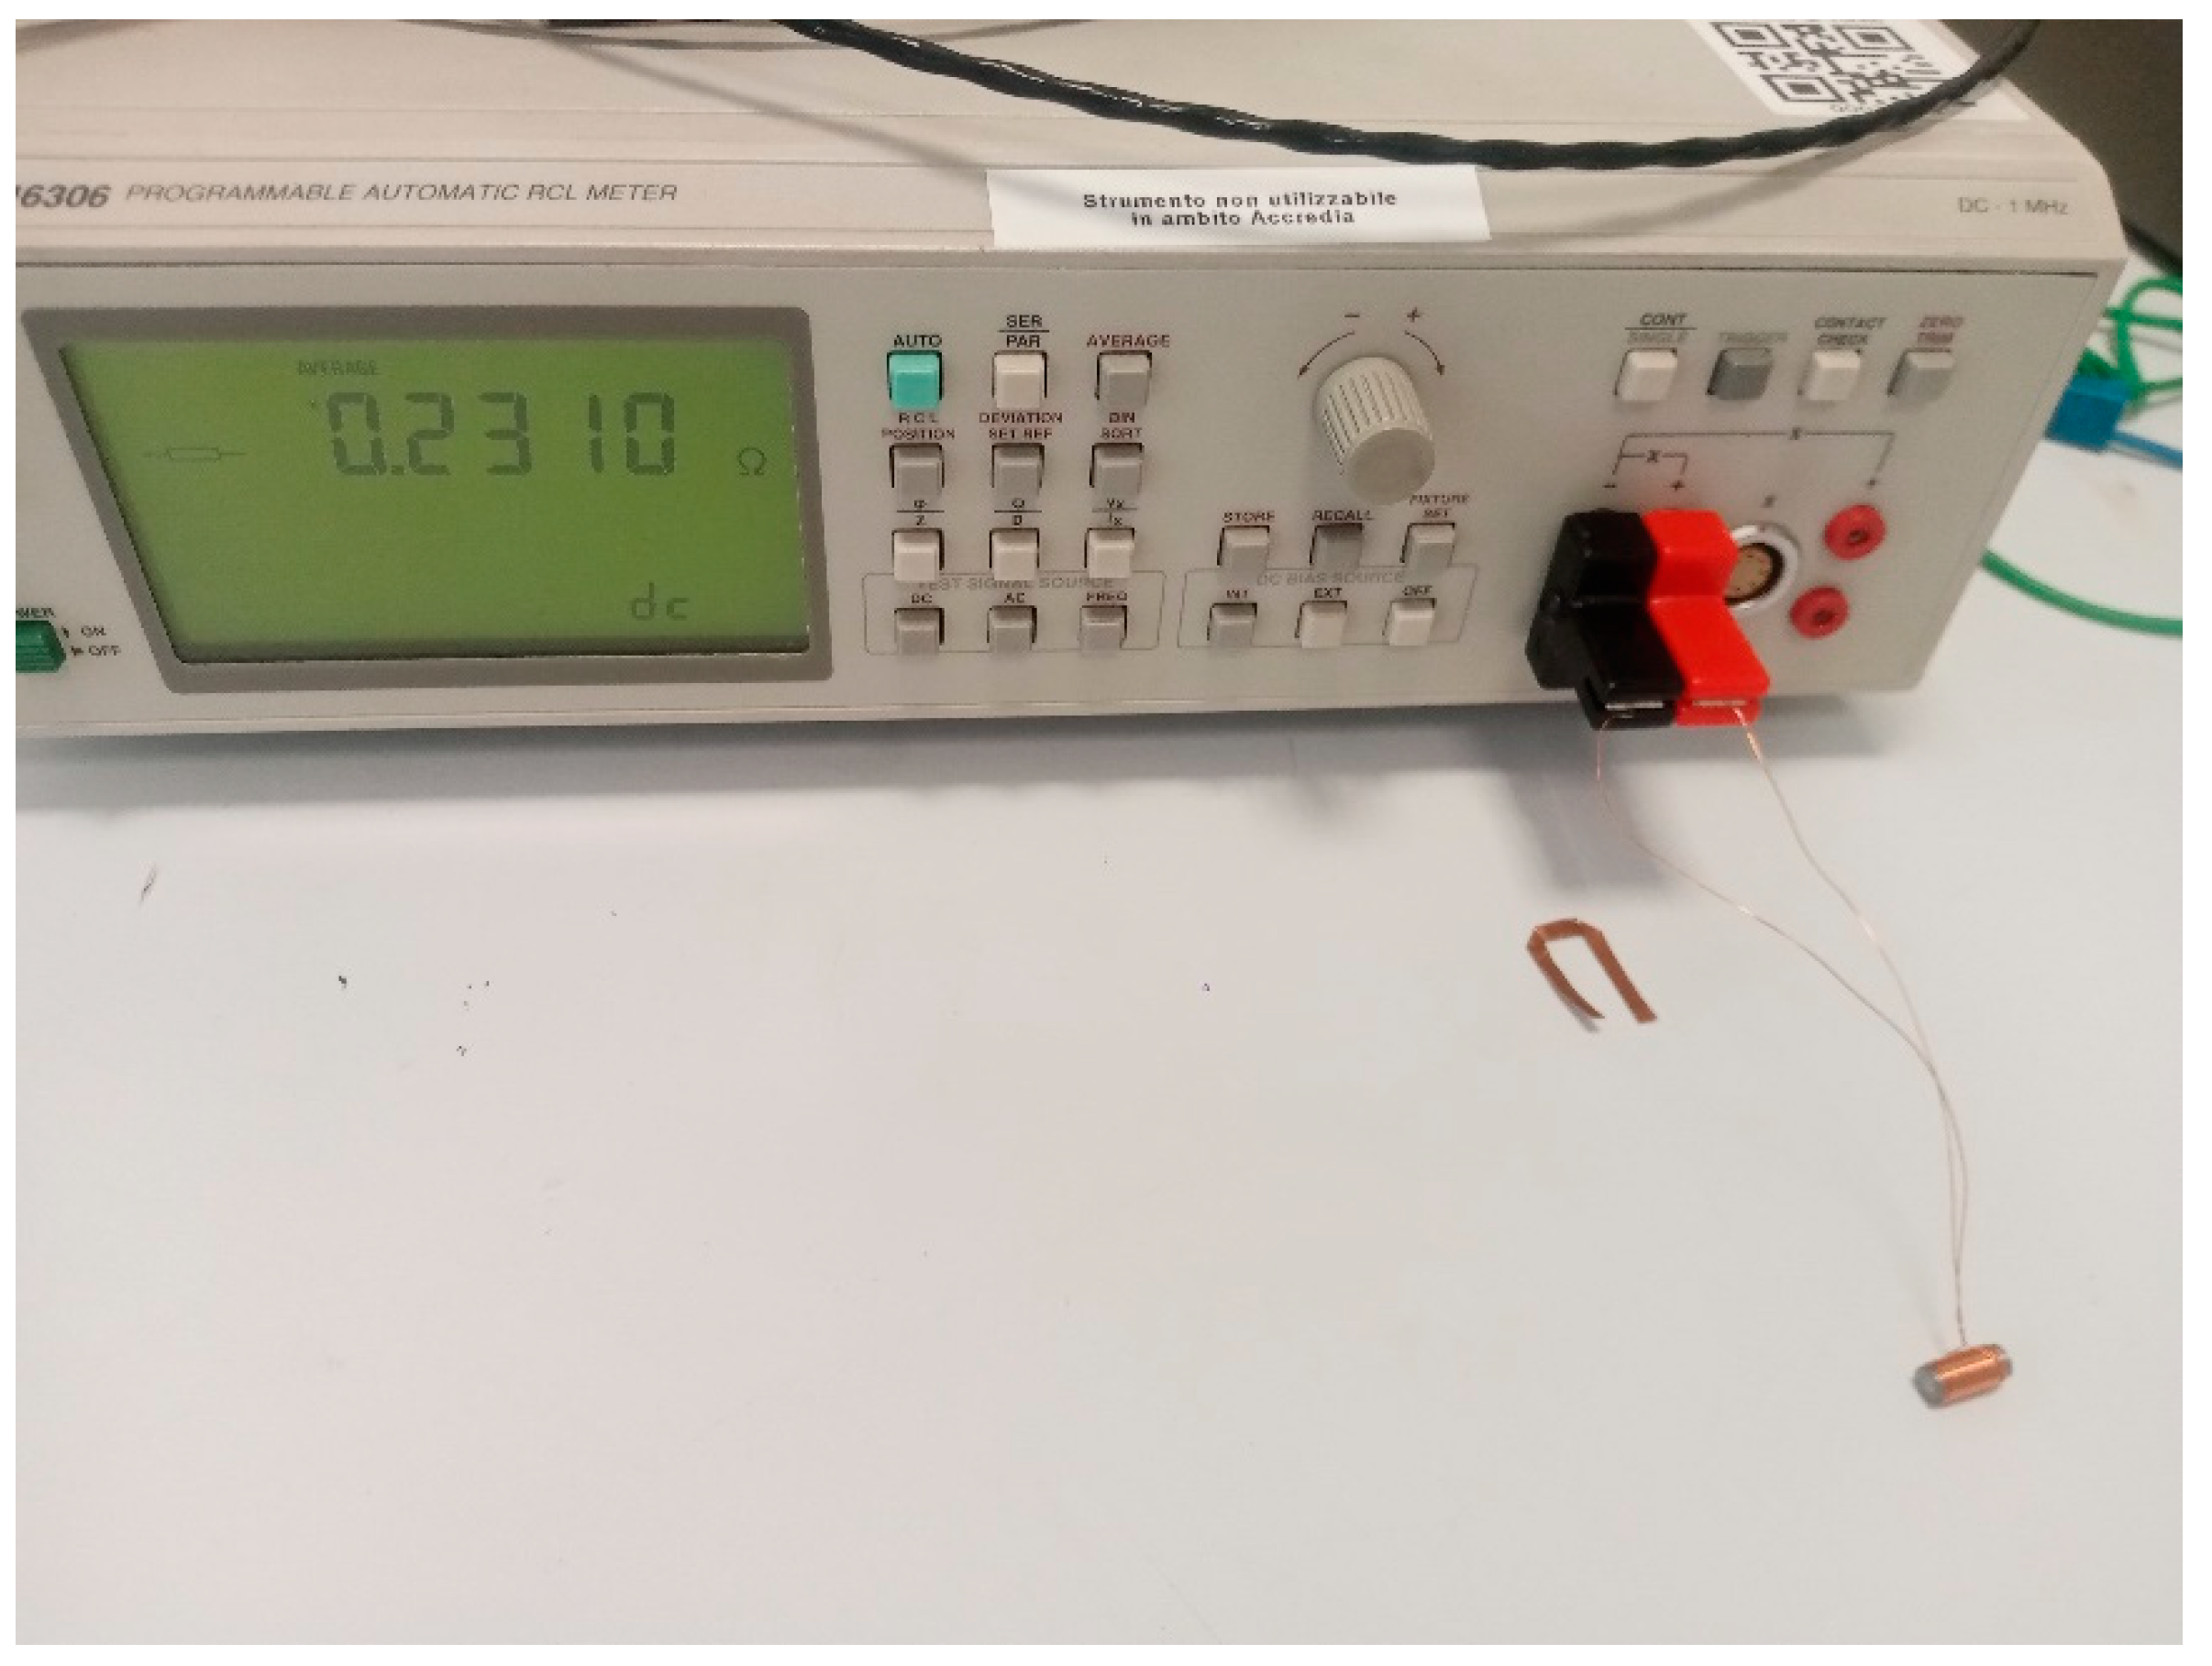
The obtained inductors, together with the ferrite one, were then measured by means of a fluke PM6306 RLC meter in the frequency range of 50 Hz–1 MHz and at a 20 mA excitation current. The inductance, resistance, and quality factor Q were directly acquired from the instrument. The DC resistance value was also recorded for every wound sample and then subtracted from the measured AC resistance values. This approach allowed us to neglect the series resistance due to the copper wire, precisely detecting only the iron losses. The final quality factor Q, obtained from the corrected resistance values, is related to the effective properties of the core materials, reflecting the proper ratio between the reactive and the dissipated energy.
4.2. Data Presentation and Comments
The results are presented considering two proposed measurement setups: toroidal samples and rod inductors. The main differences consist of the shape of the samples (toroids without air gaps, and rods with a large air gap) and the frequency interval of measurement: until 20 kHz for toroid samples, while the rod inductors are tested until 1 MHz. Finally, the SMC rod inductors are compared with one made with soft ferrite.
4.2.1. Toroid Results and Comments
The first analysis concerns comparing the typical data obtained using characterization at a low frequency [
24]. In fact, the tests were performed up to 1000 Hz. As previously mentioned, the specific iron losses and magnetic induction saturation of the selected materials show better values compared to the materials procured on the market. Such results are reported in
Table 1, where the best results show the toroid ring produced with 1 wt.% of the epoxy binder.
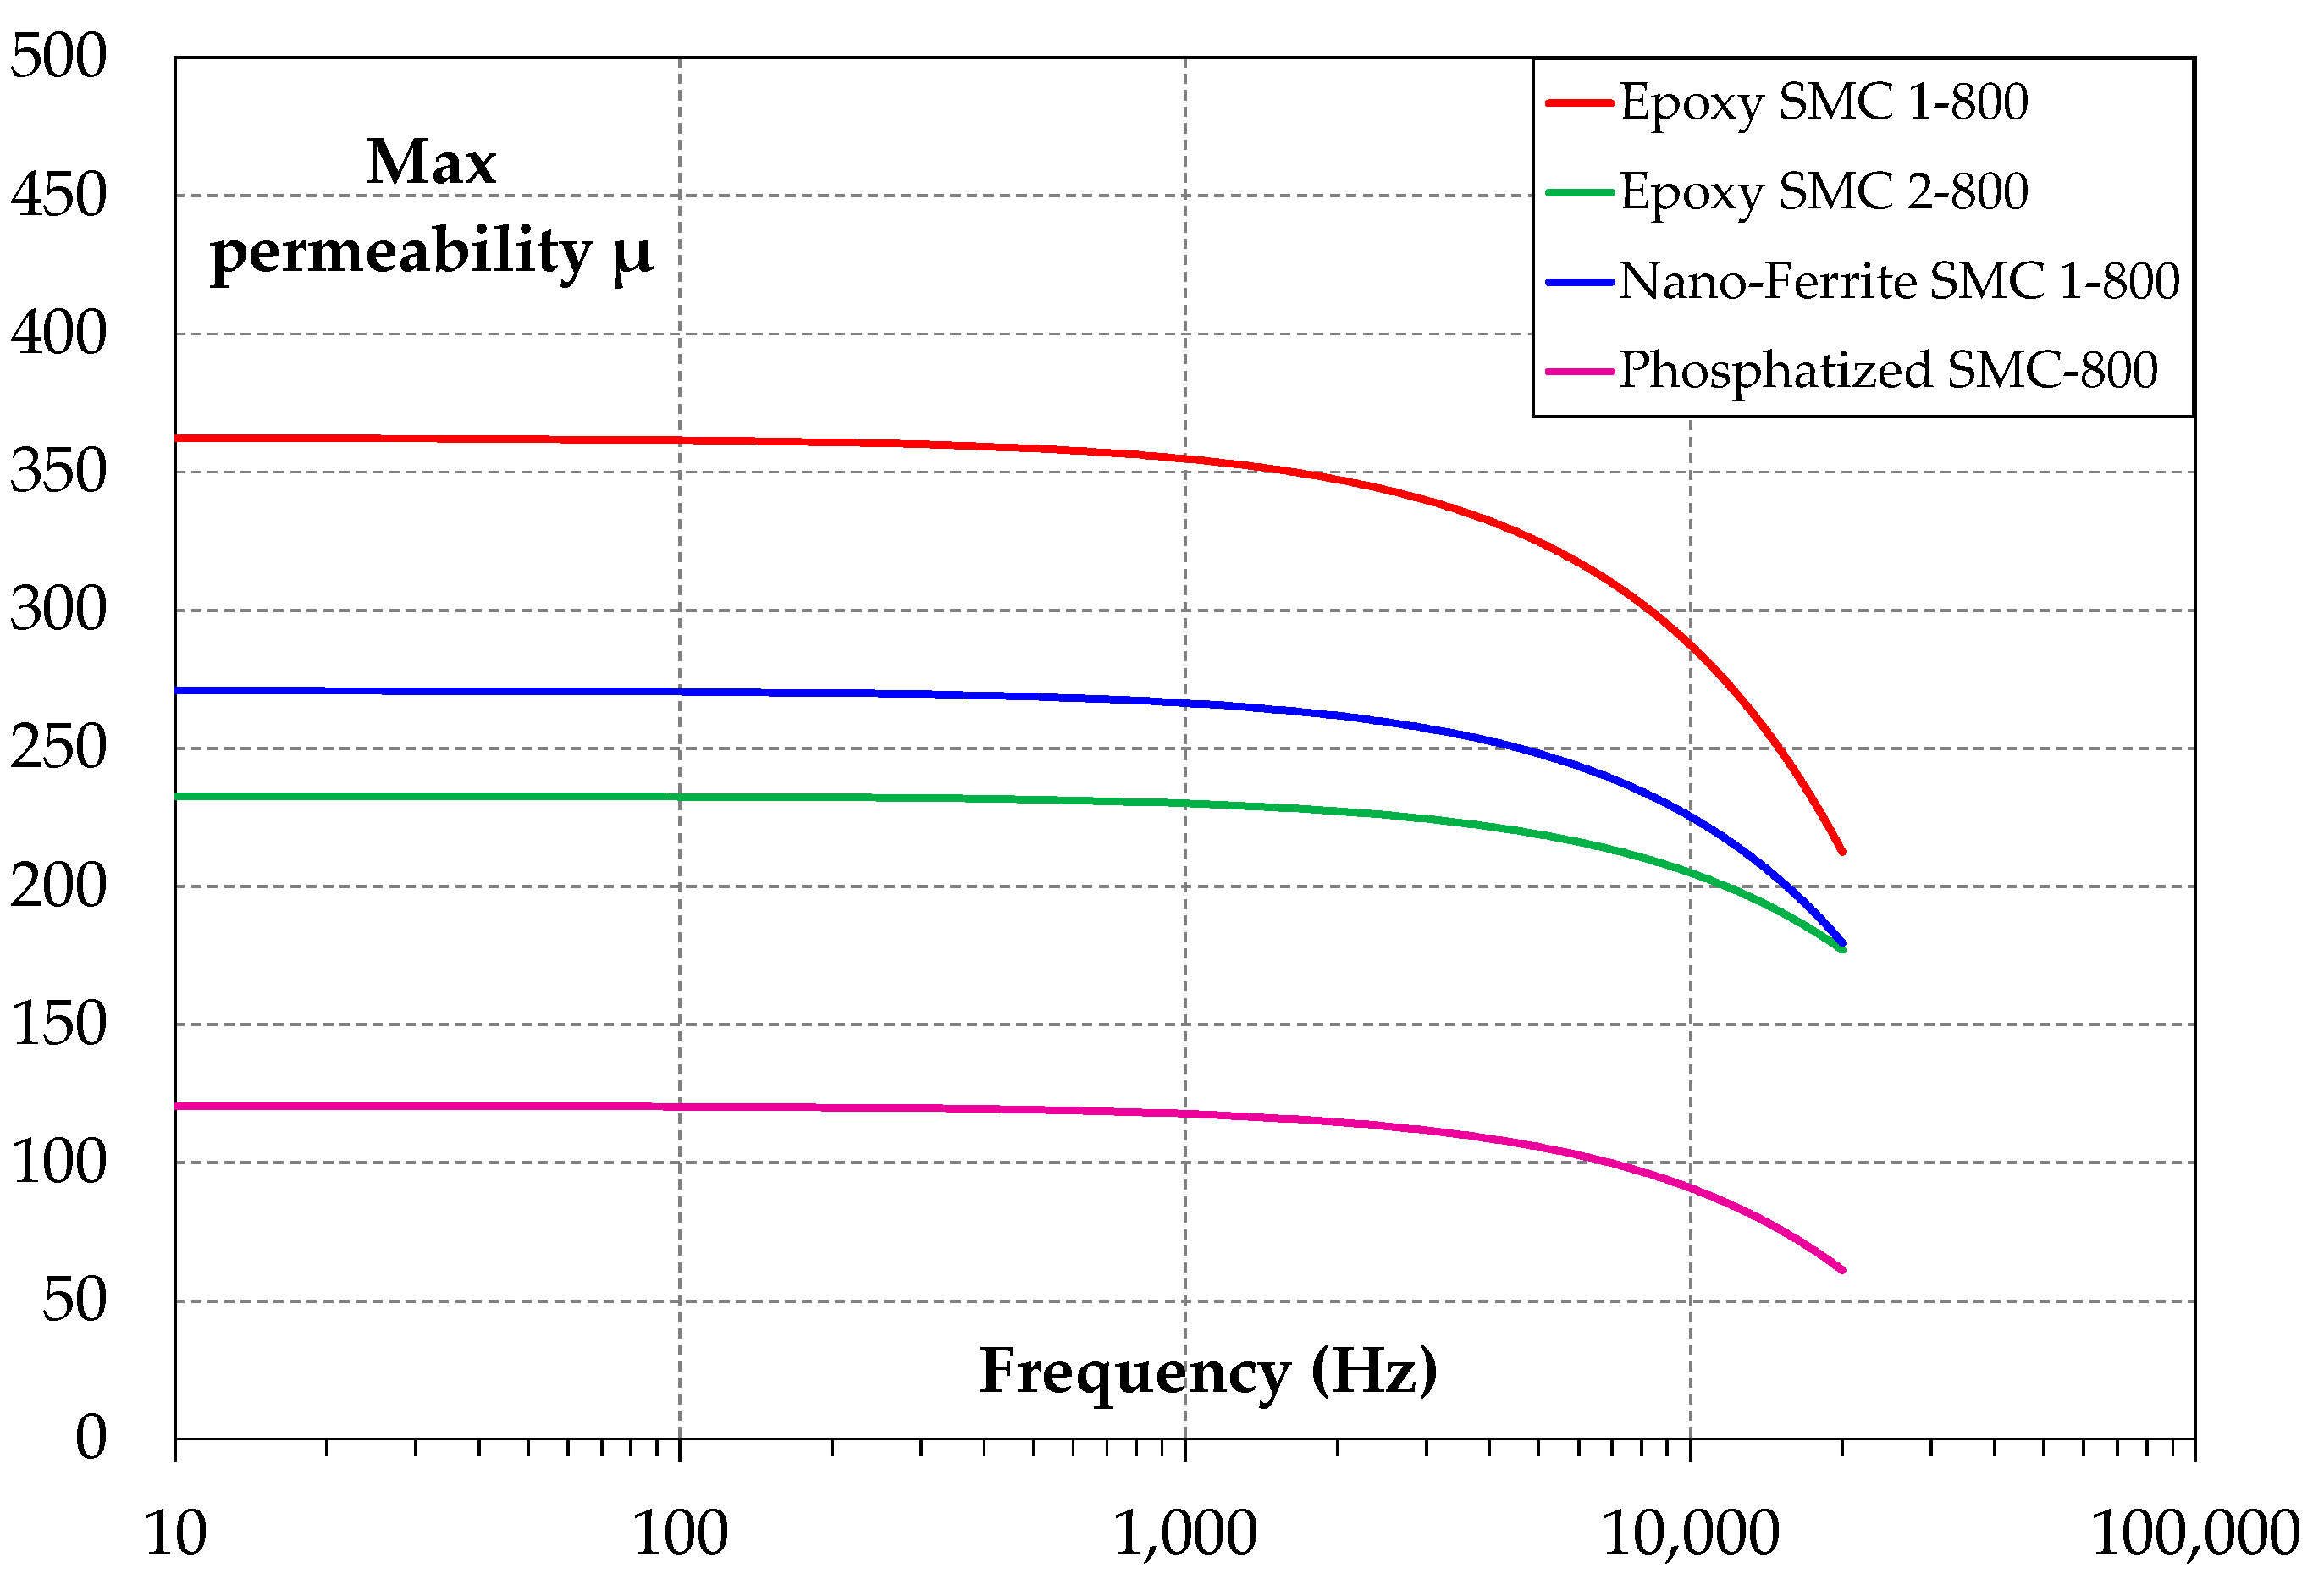
Similar considerations were implemented for maximum permeability, measured until 20 kHz.
Figure 7 shows the maximum permeabilities of the proposed toroid samples: epoxy SMC 1-800 displayed high values but decreased rapidly versus high-frequency values; on the other hand, epoxy SMC 2-800 showed a minor reduction in maximum permeability along the considered frequency interval.
Figure 8 provides information on the specific iron losses of produced SMC toroids. The measurement was conducted at 0.1 T because the supply system could not deliver the necessary power to obtain 1 T at a high frequency. On the other hand, tests for inductance applications are usually performed at low magnetic induction. Phosphatized SMC-800 showed higher losses than the other SMC materials, which had energetic behaviors very close to each other. However, epoxy SMC 1-800 has the lowest iron losses, but a possible crossover is possible for a frequency greater than 20 kHz.
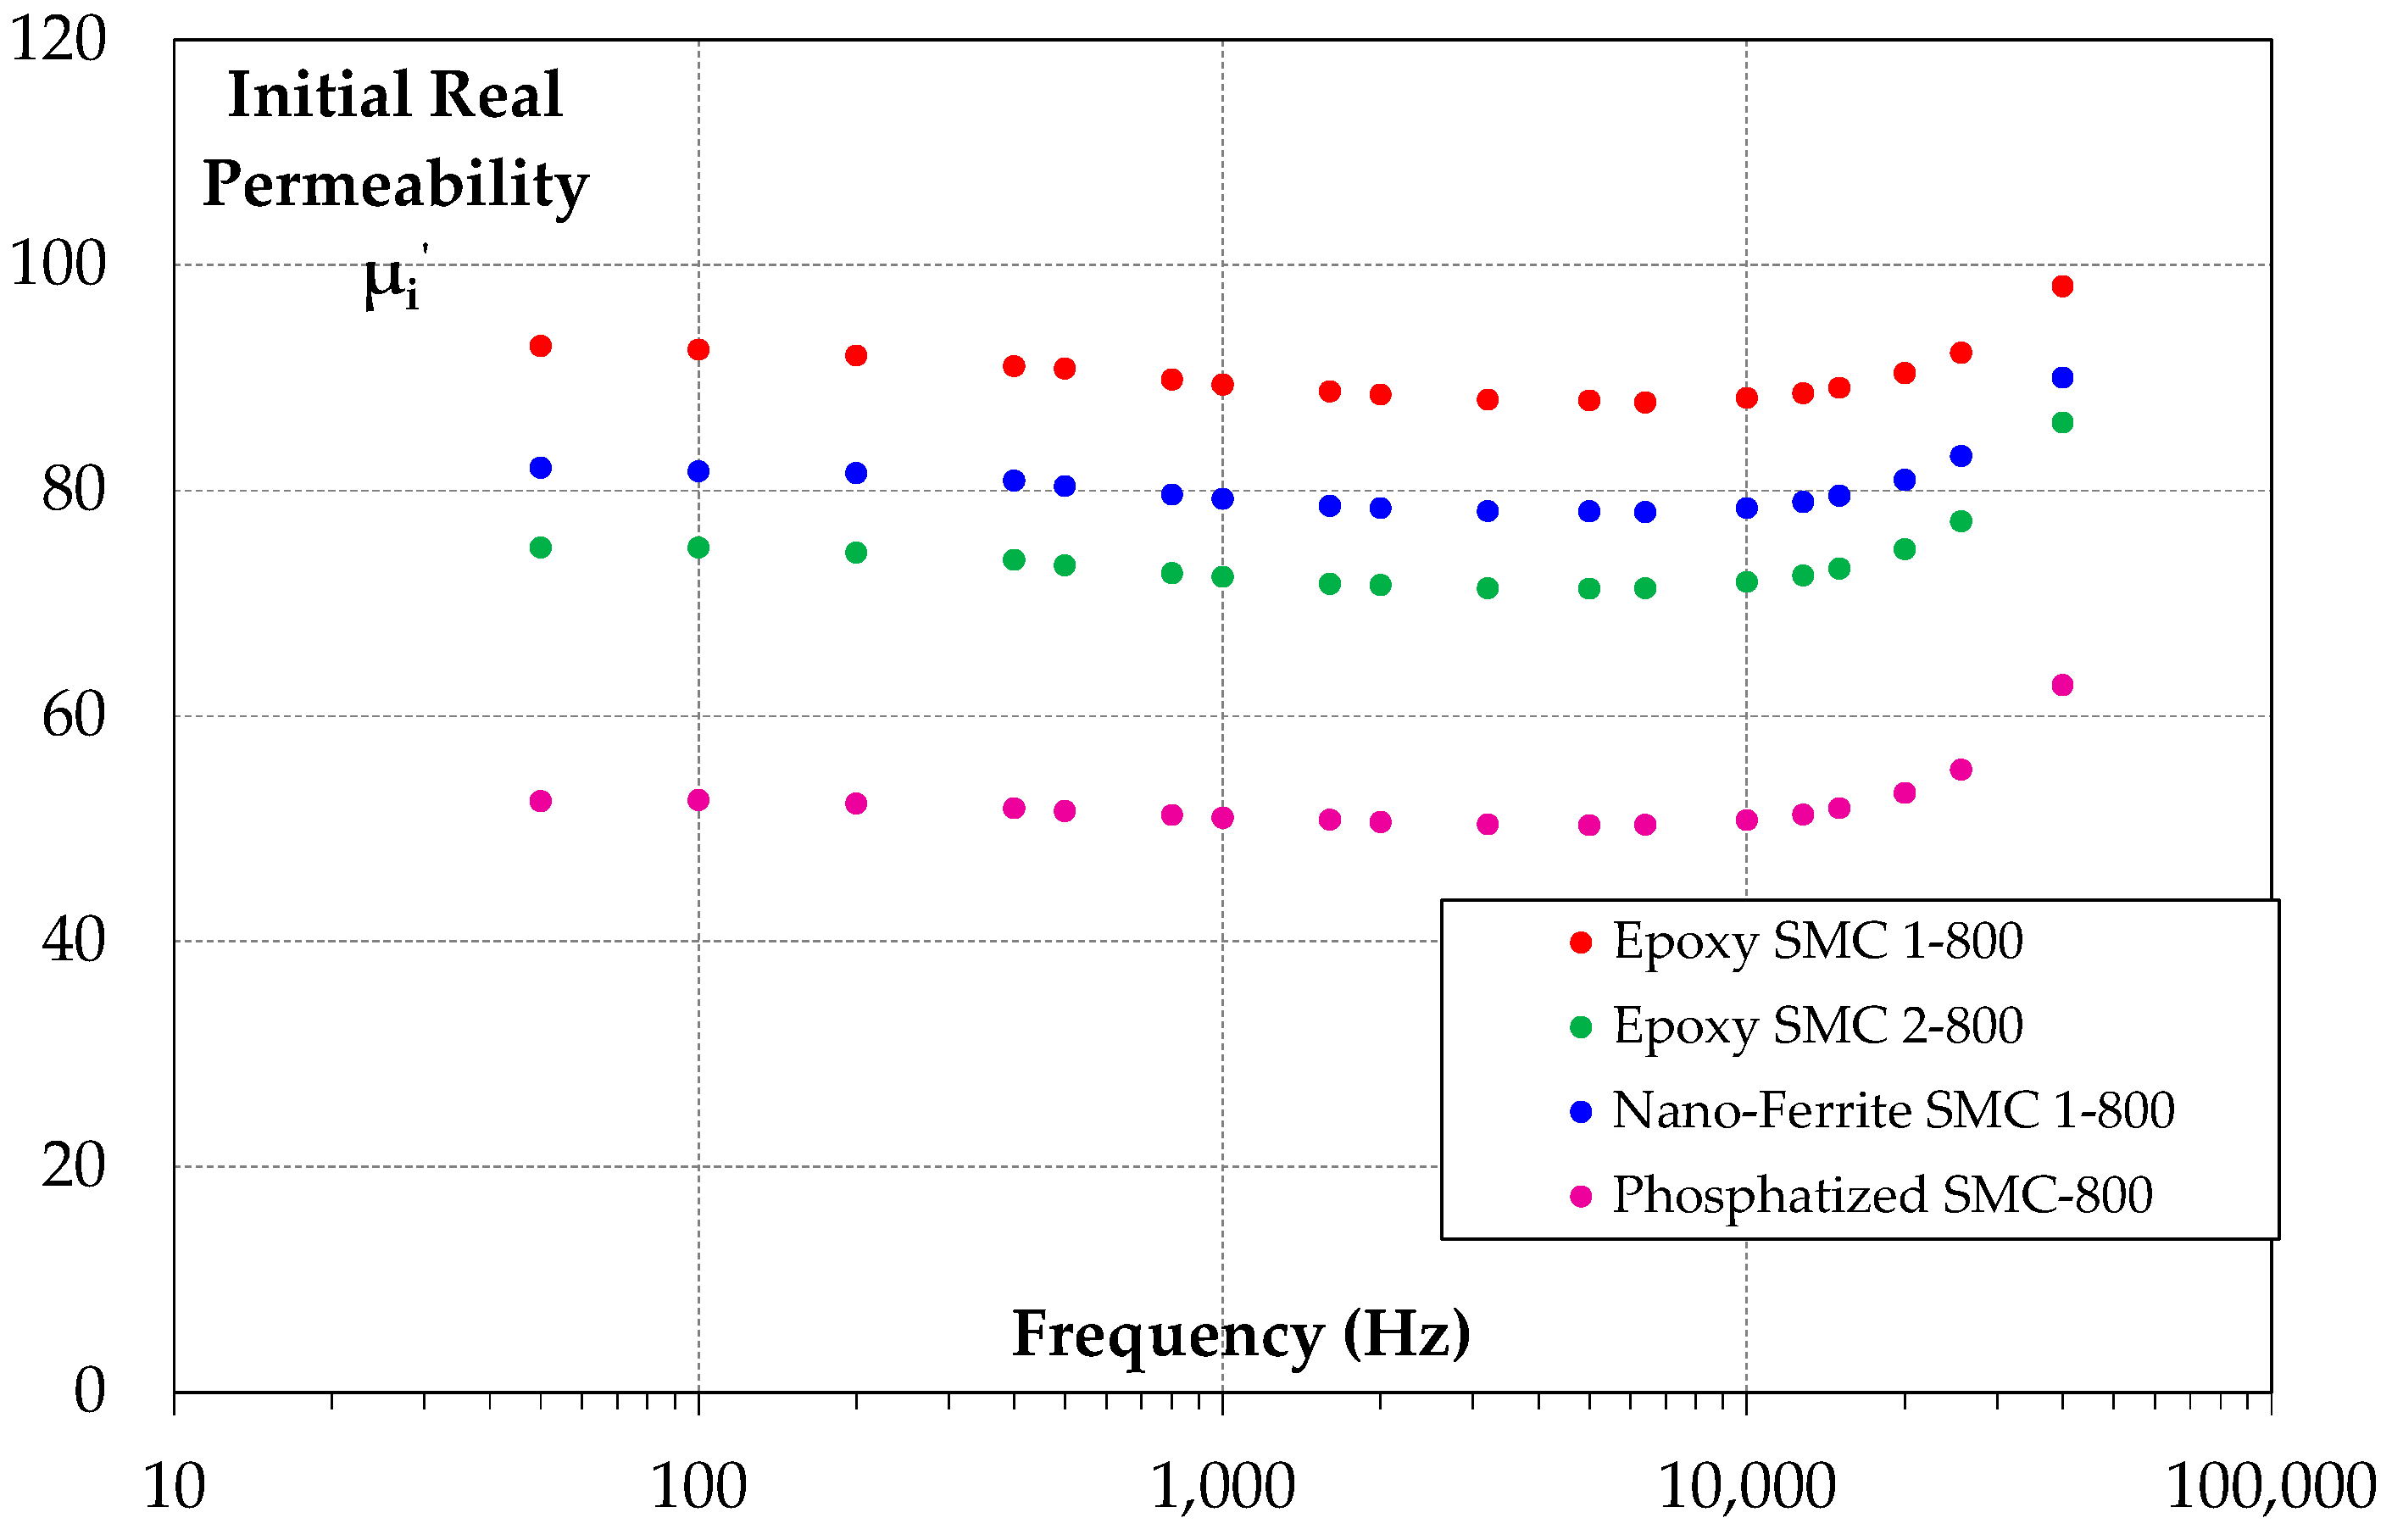
Some materials obtained favorable results for the initial magnetic permeability of the proposed SMC toroid samples, as shown in
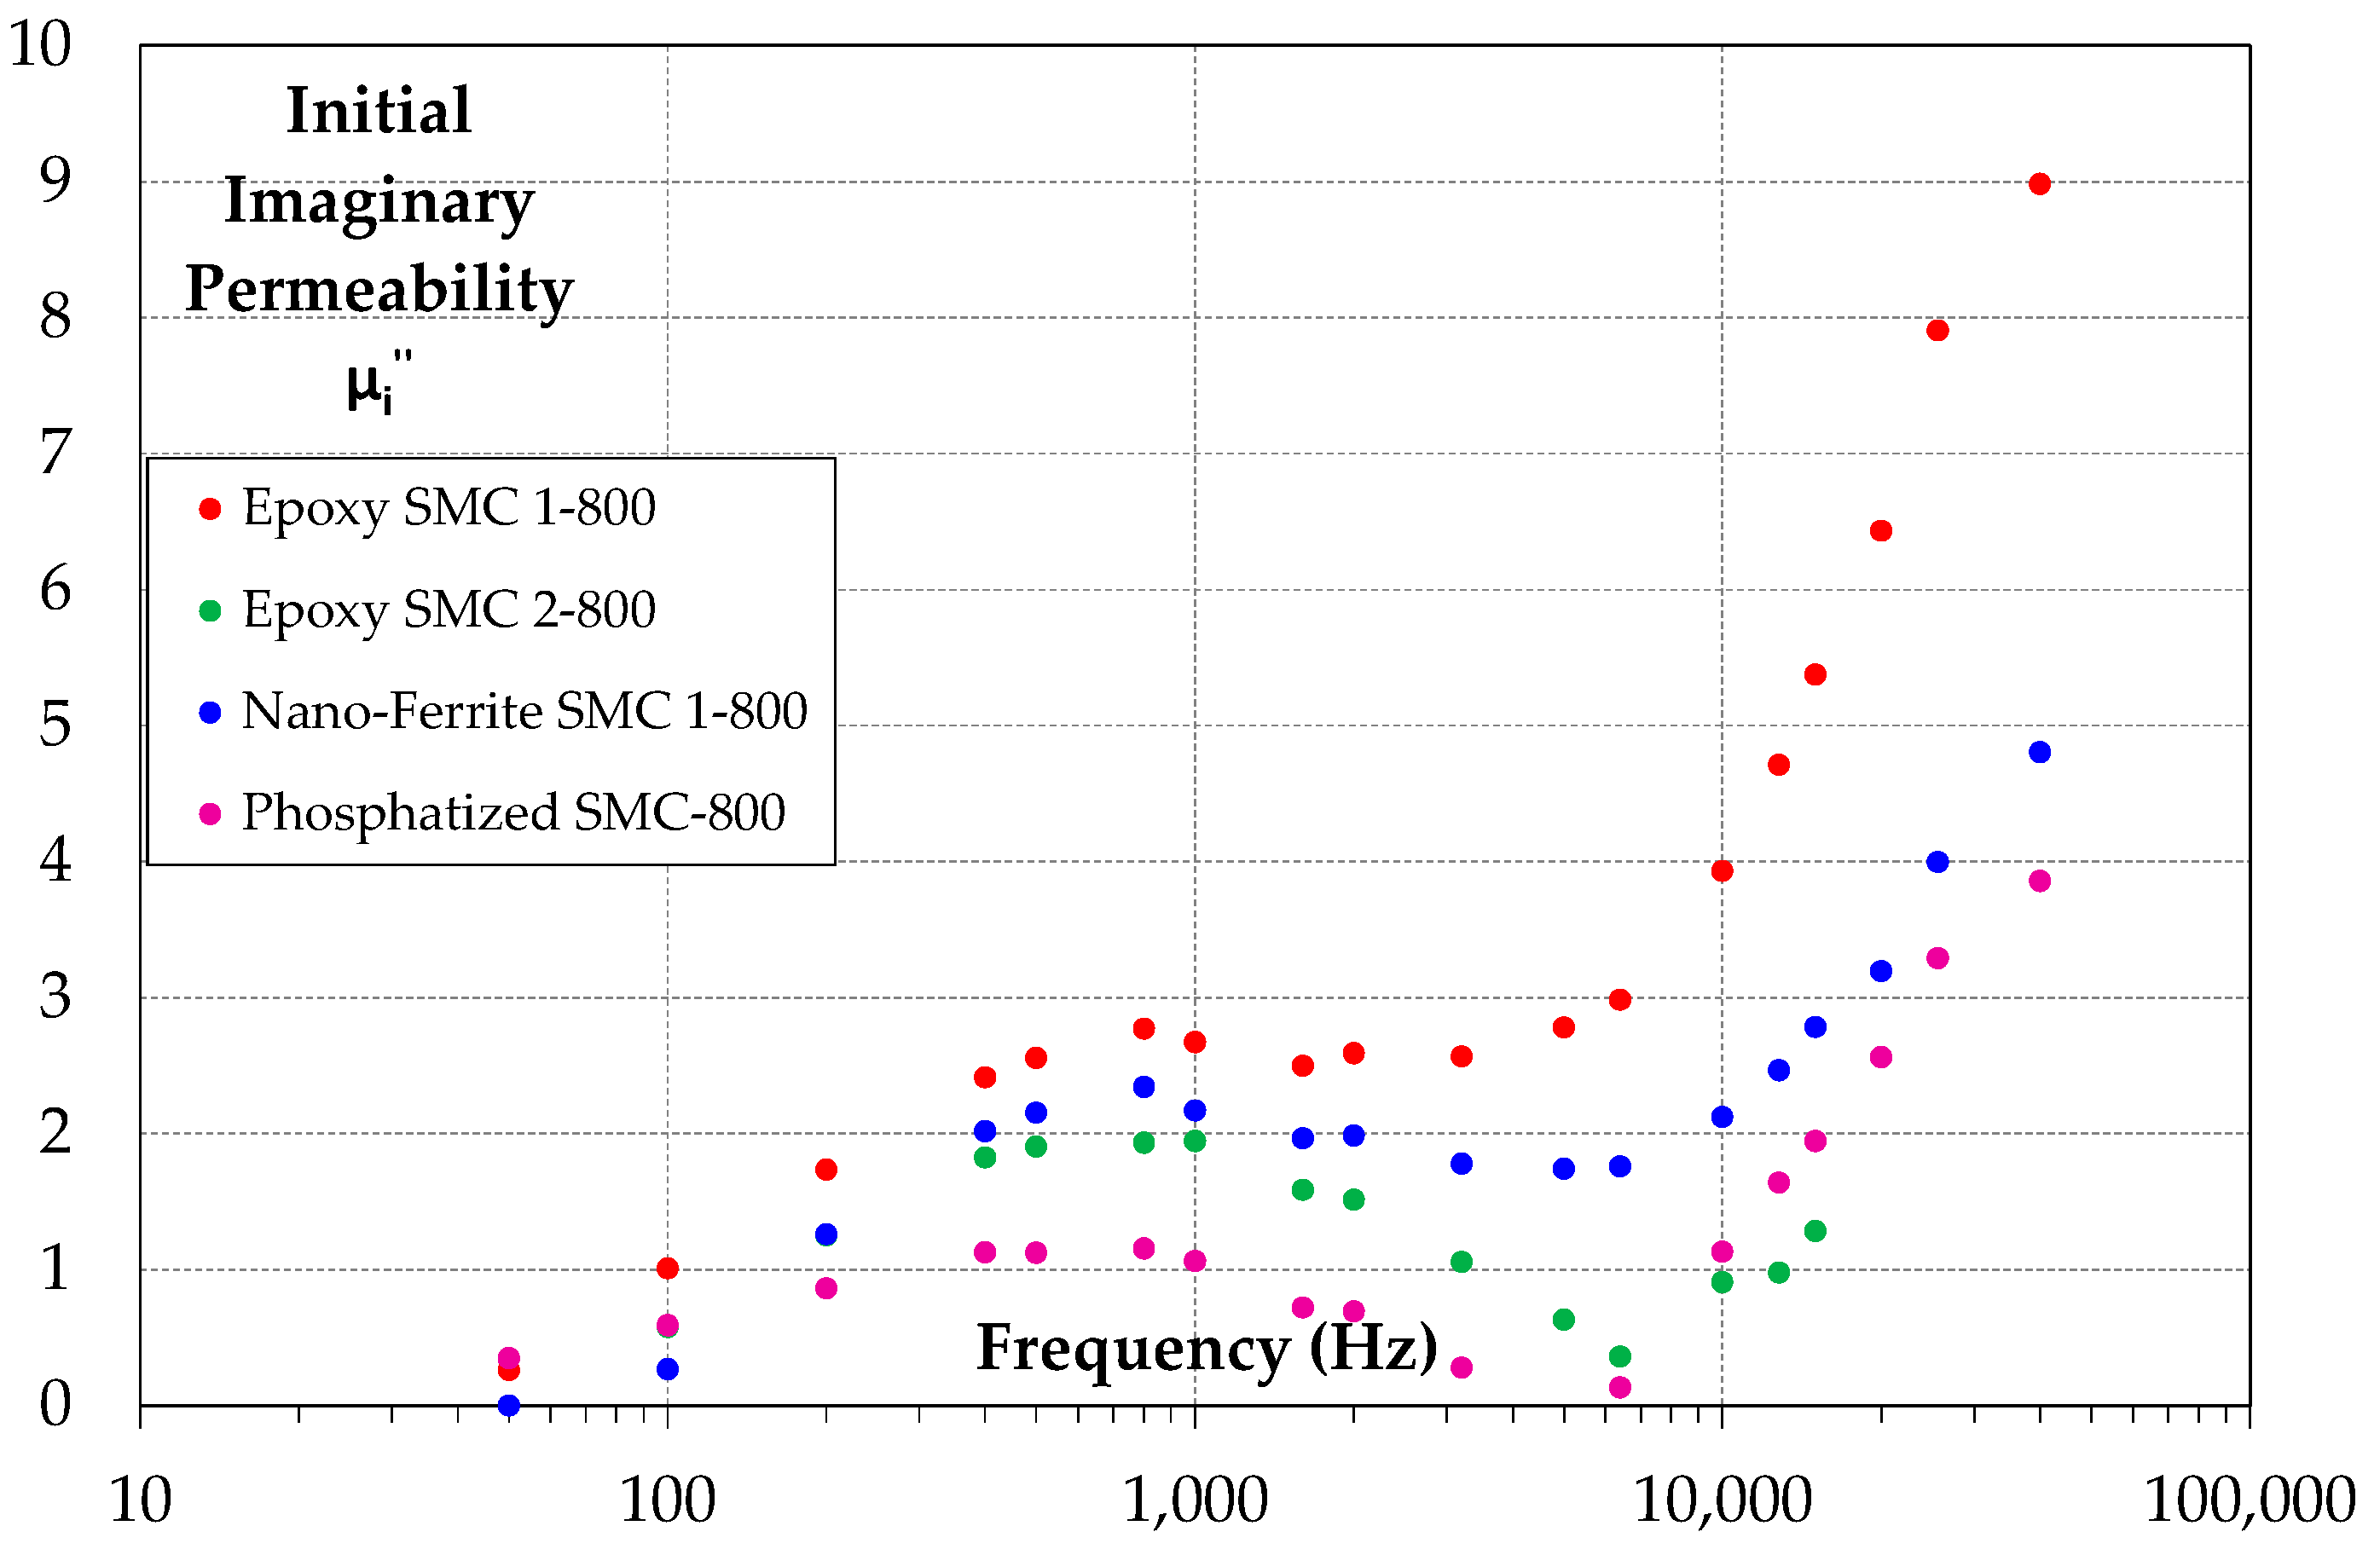
Figure 9, for the real part of the initial magnetic permeability. For example, epoxy SMC 1-800 showed values around 90, while commercial material was the lowest, exhibiting a good value of about 50. A high initial magnetic permeability is generally required for audio and telecommunication applications or instrument transformers where the magnetizing current is low. Commonly, the imaginary part of initial magnetic permeability is considered null; on the other hand,
Figure 10 demonstrates that some materials have considerable values, which turn into losses. The low values are obtained in the case of commercial and high-resin-content materials.
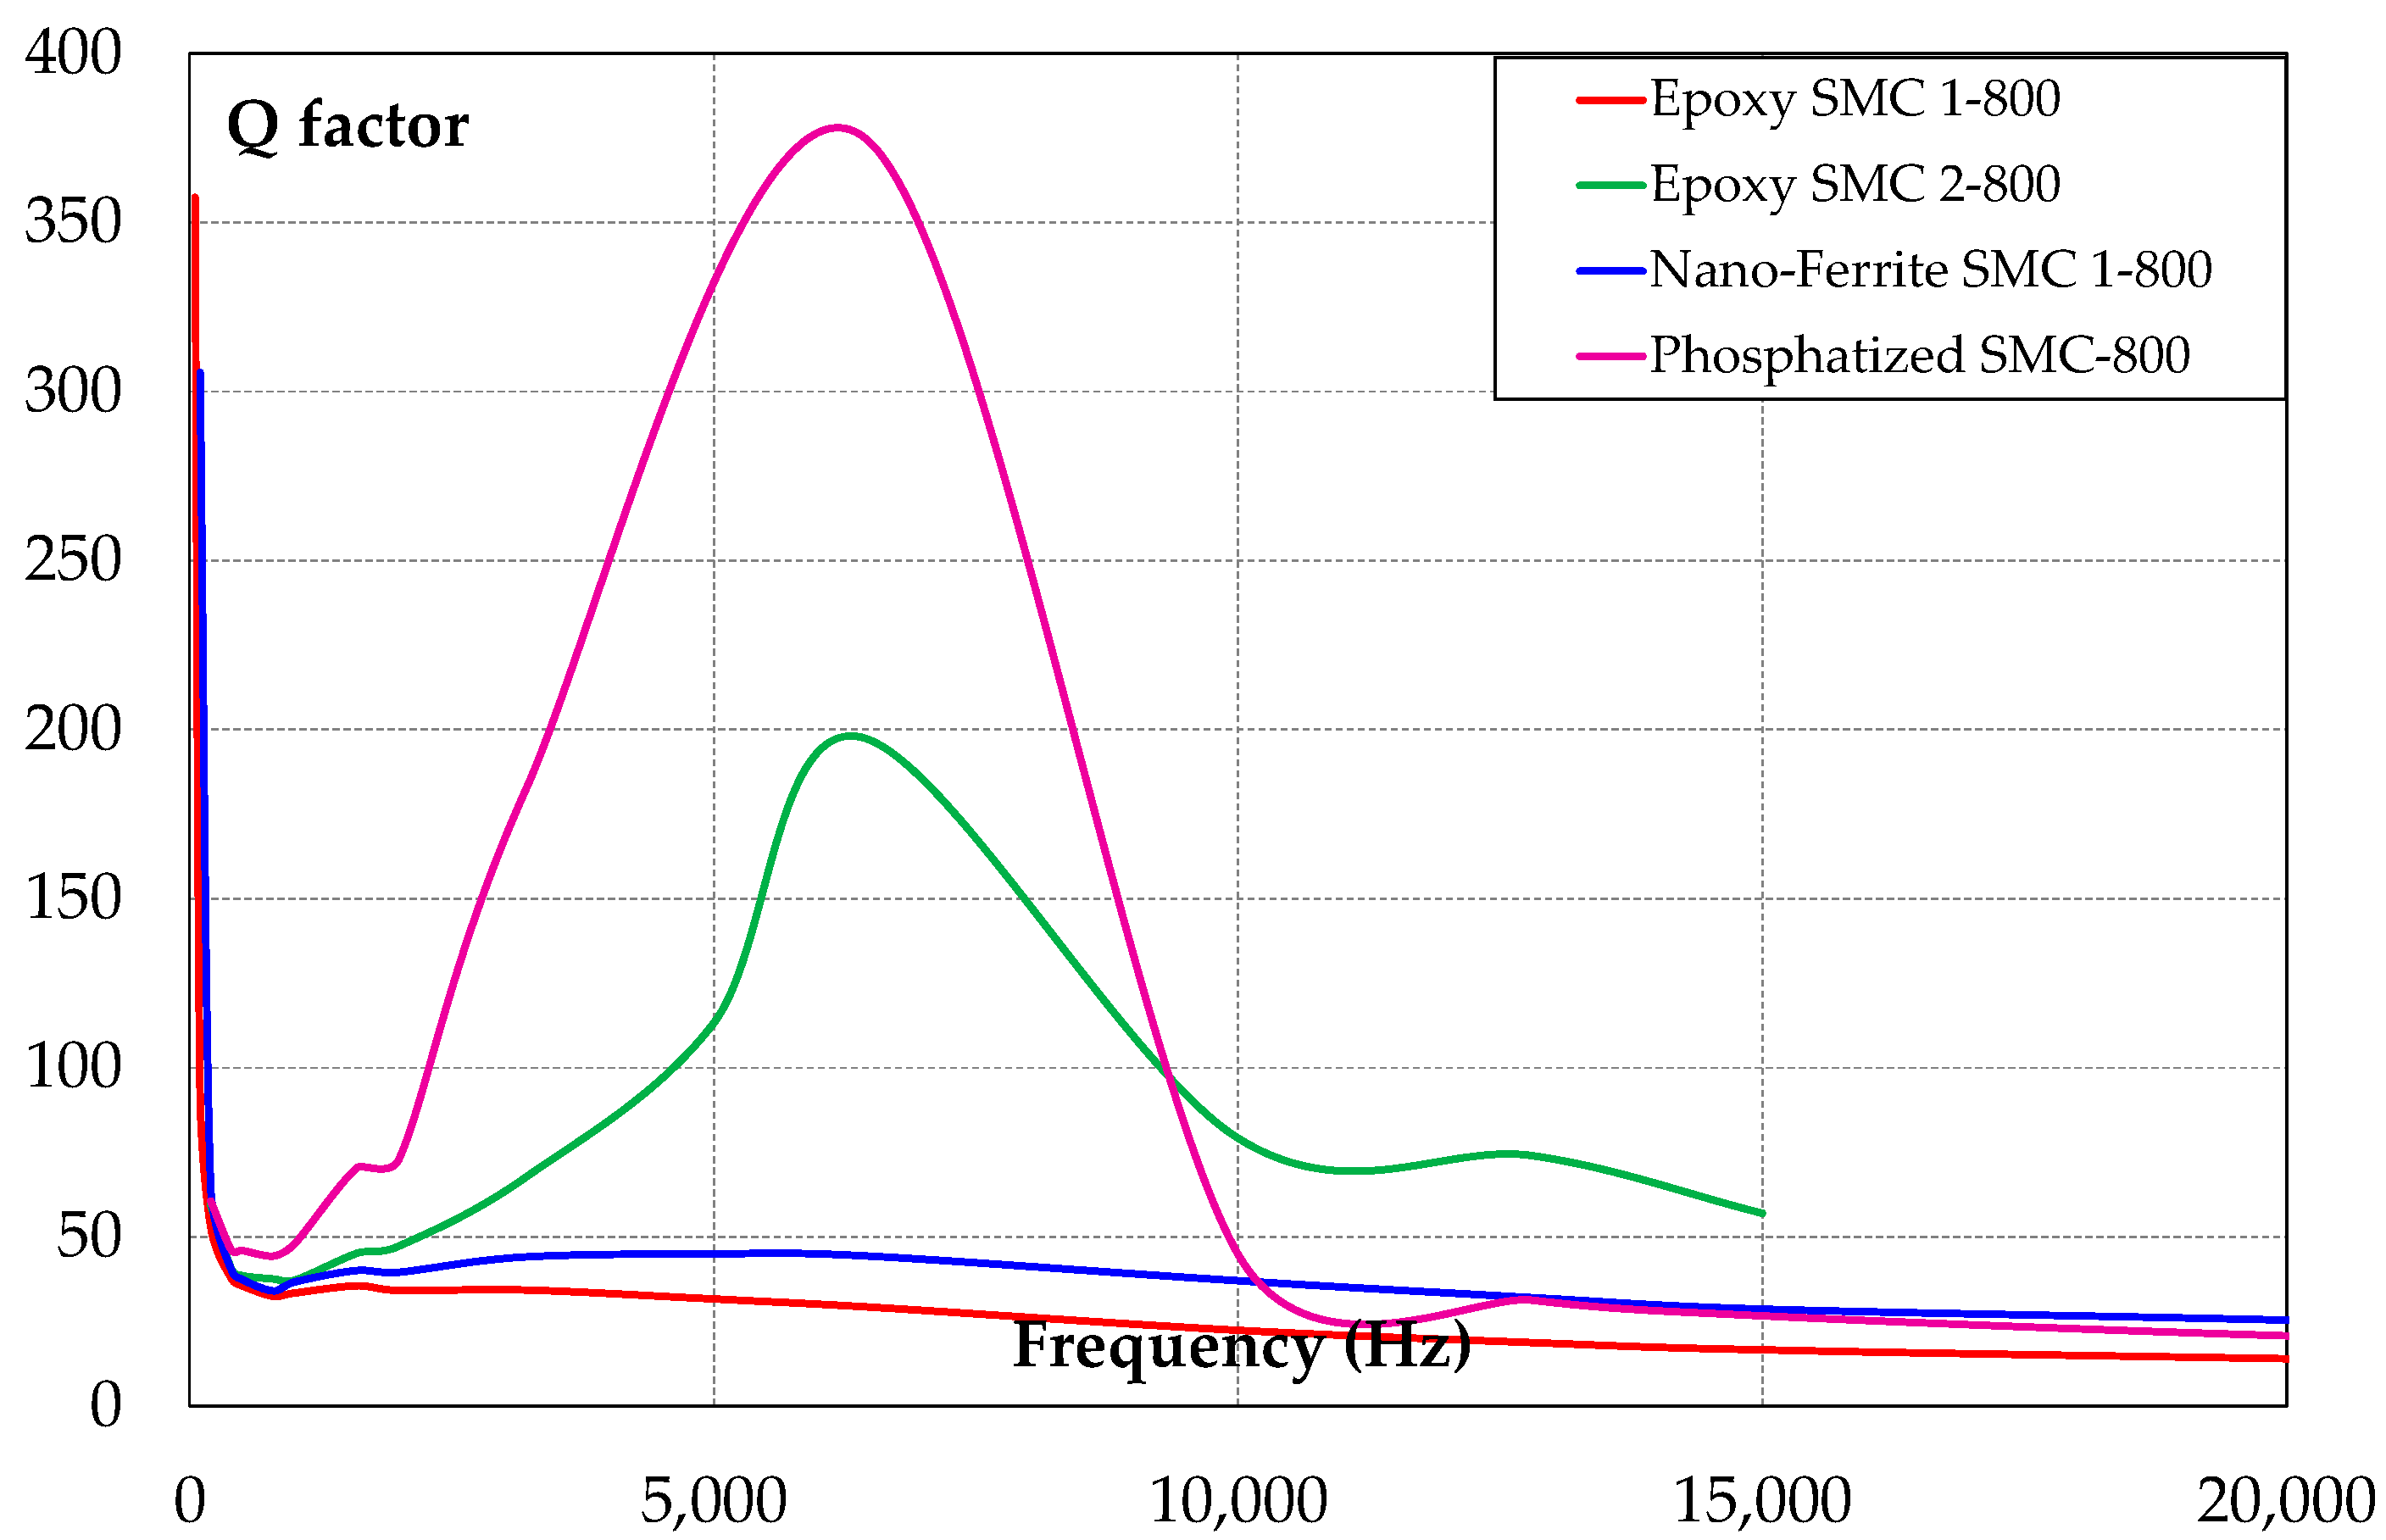
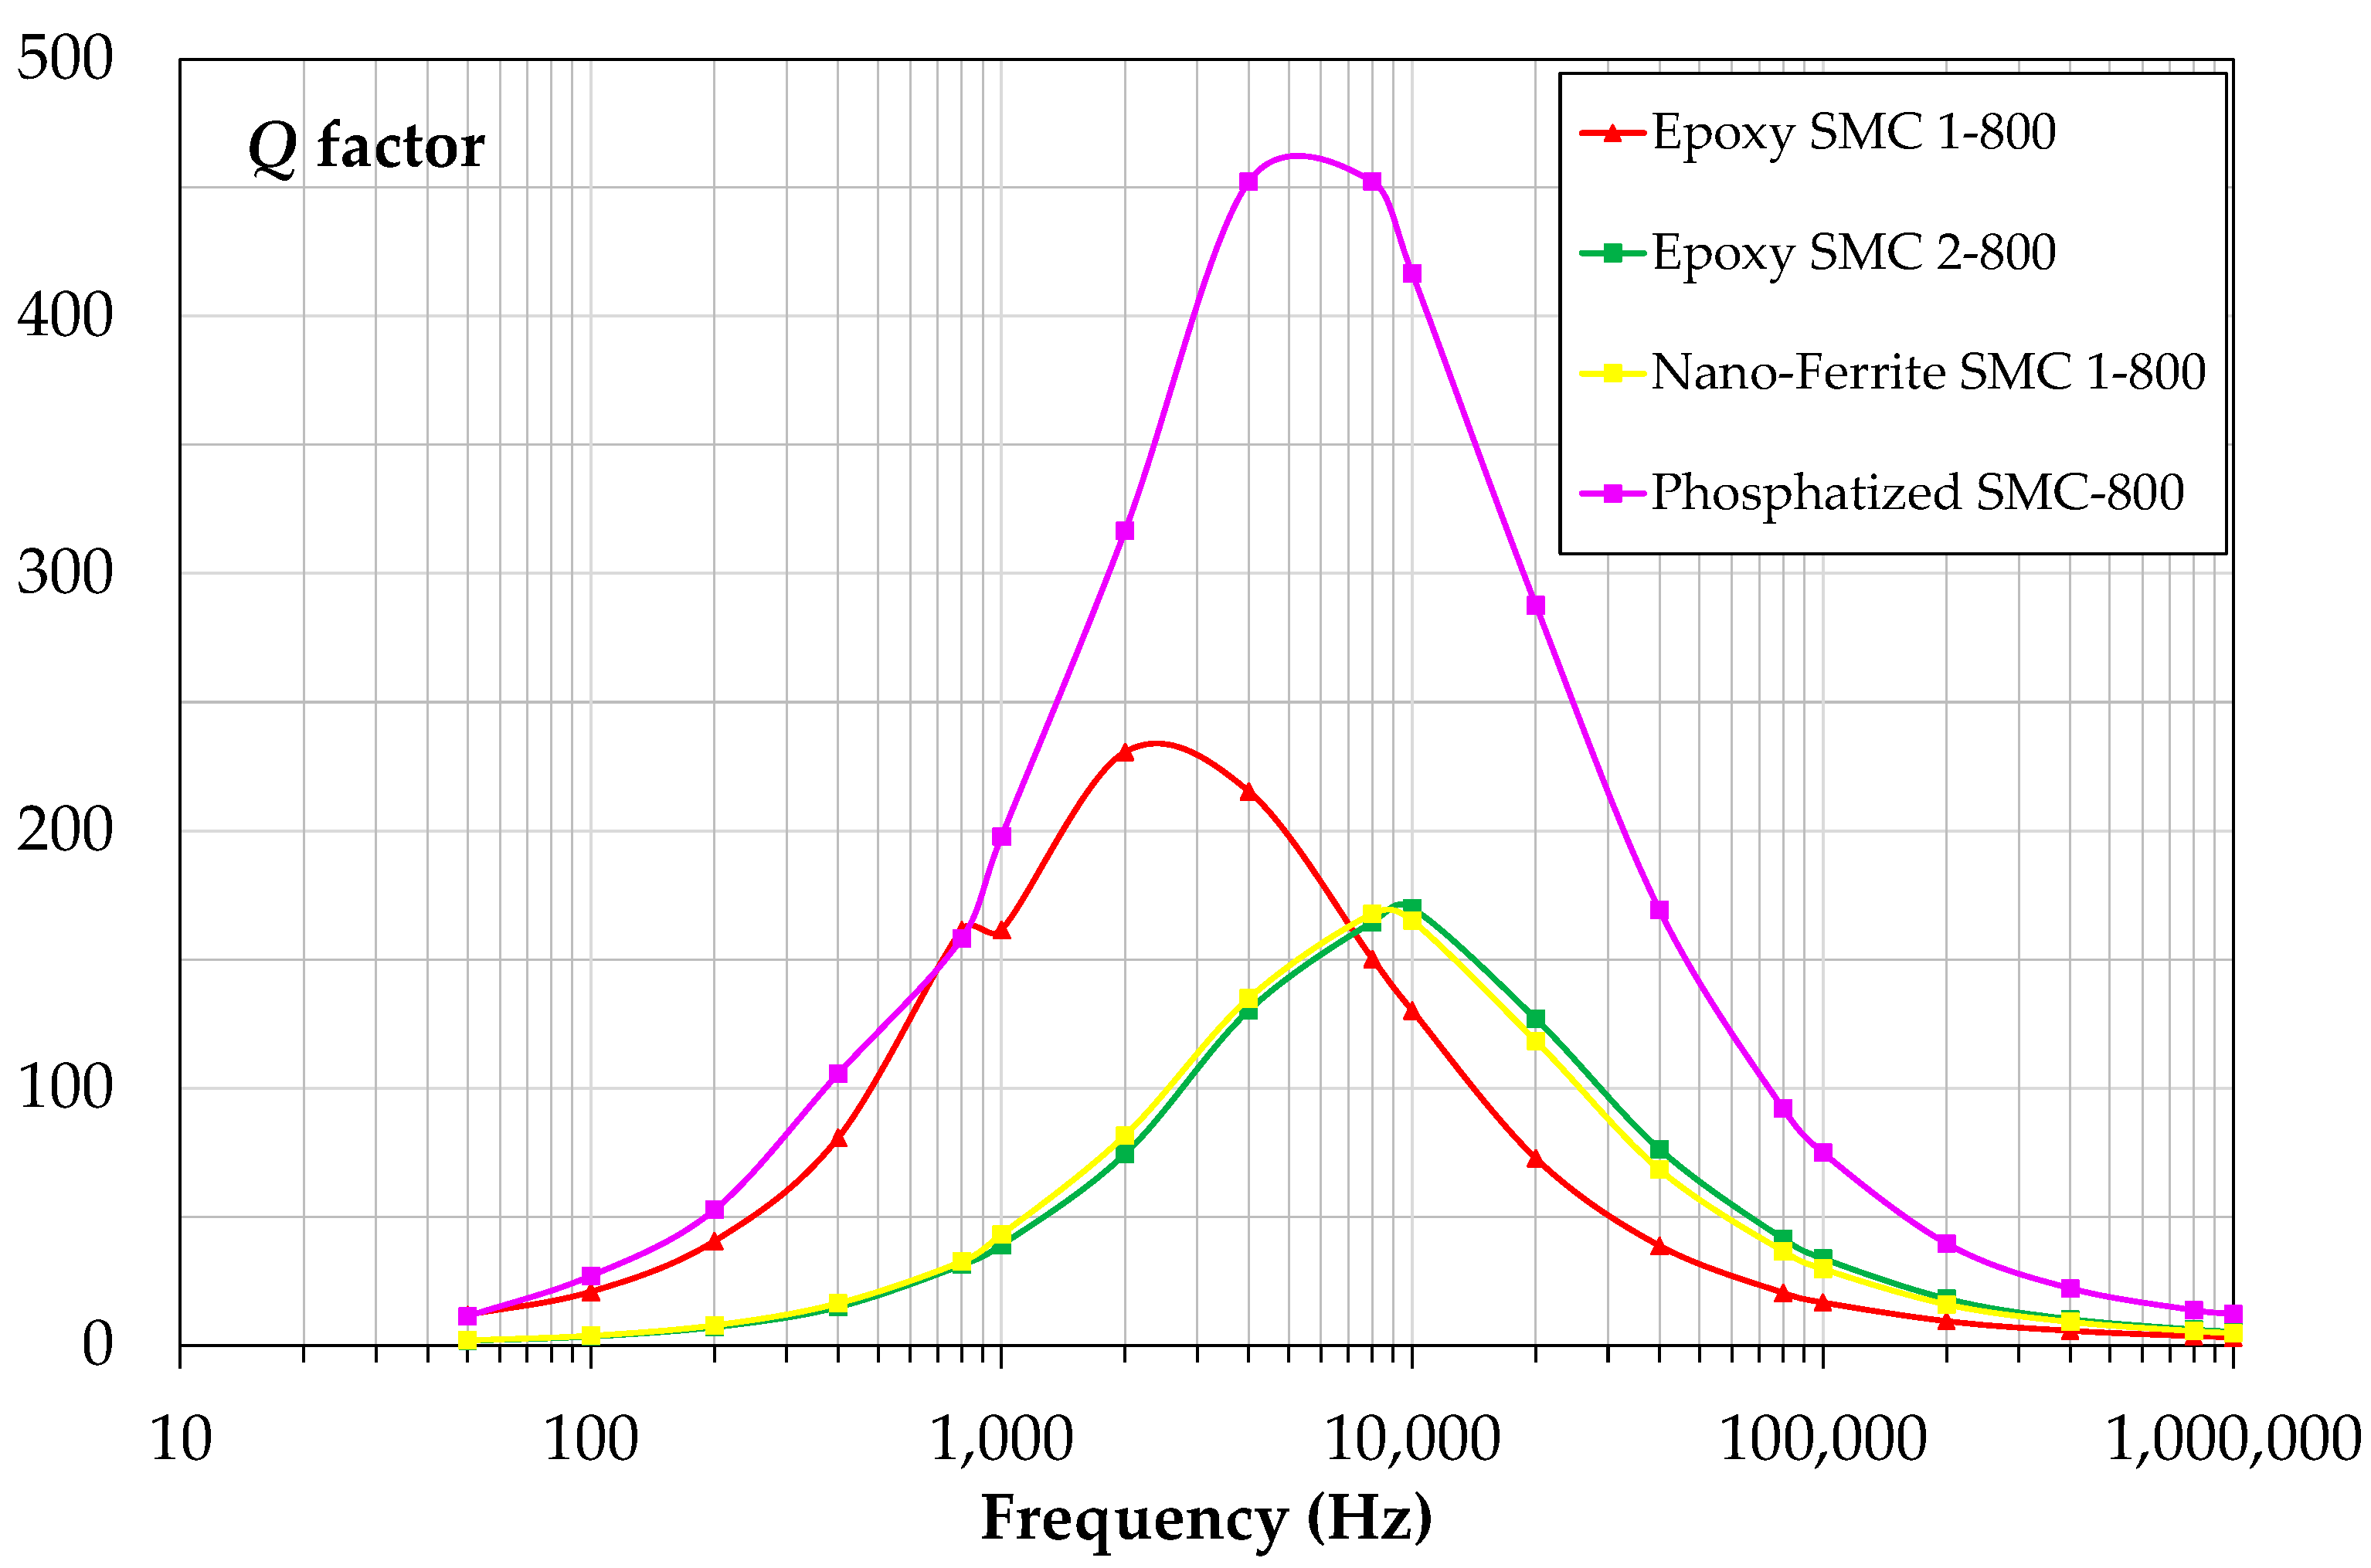
From this point of view, the inductor quality factor Q is calculated through Equation (1), and the results are reported in
Figure 11. Phosphatized SMC-800 showed the best Q factor at around 7000 Hz. On the other hand, epoxy SMC 2-800 had modest data in the same frequency range. Regarding epoxy SMC 1-800 and nano-ferrite SMC 1-800, the high Q factor was reached at around 100 Hz, suggesting the use of these materials for low-frequency applications. Therefore, an SMC inductor in the toroid shape can operate in frequency intervals up to 10 kHz. However, the reflection is very restricted because other SMC coating solutions can be adopted, and for a complete assessment, it is necessary to test SMC materials for inductors with a high air gap.
4.2.2. Rod Inductors’ Results and Comments
The rod inductors were measured using the RLC approach, as shown in
Figure 12. Some data had to be post-processed after the measurement, such as the resistance and Q factor. The inductance values are reported in
Figure 13. The reference material and soft ferrite had a high value with respect to the proposed SMC materials. The second value is represented by epoxy SMC 1-800, but after 100 kHz drastically reduced. The phosphatized SMC-800, after 100 kHz, maintained the second position up to 1 MHz.
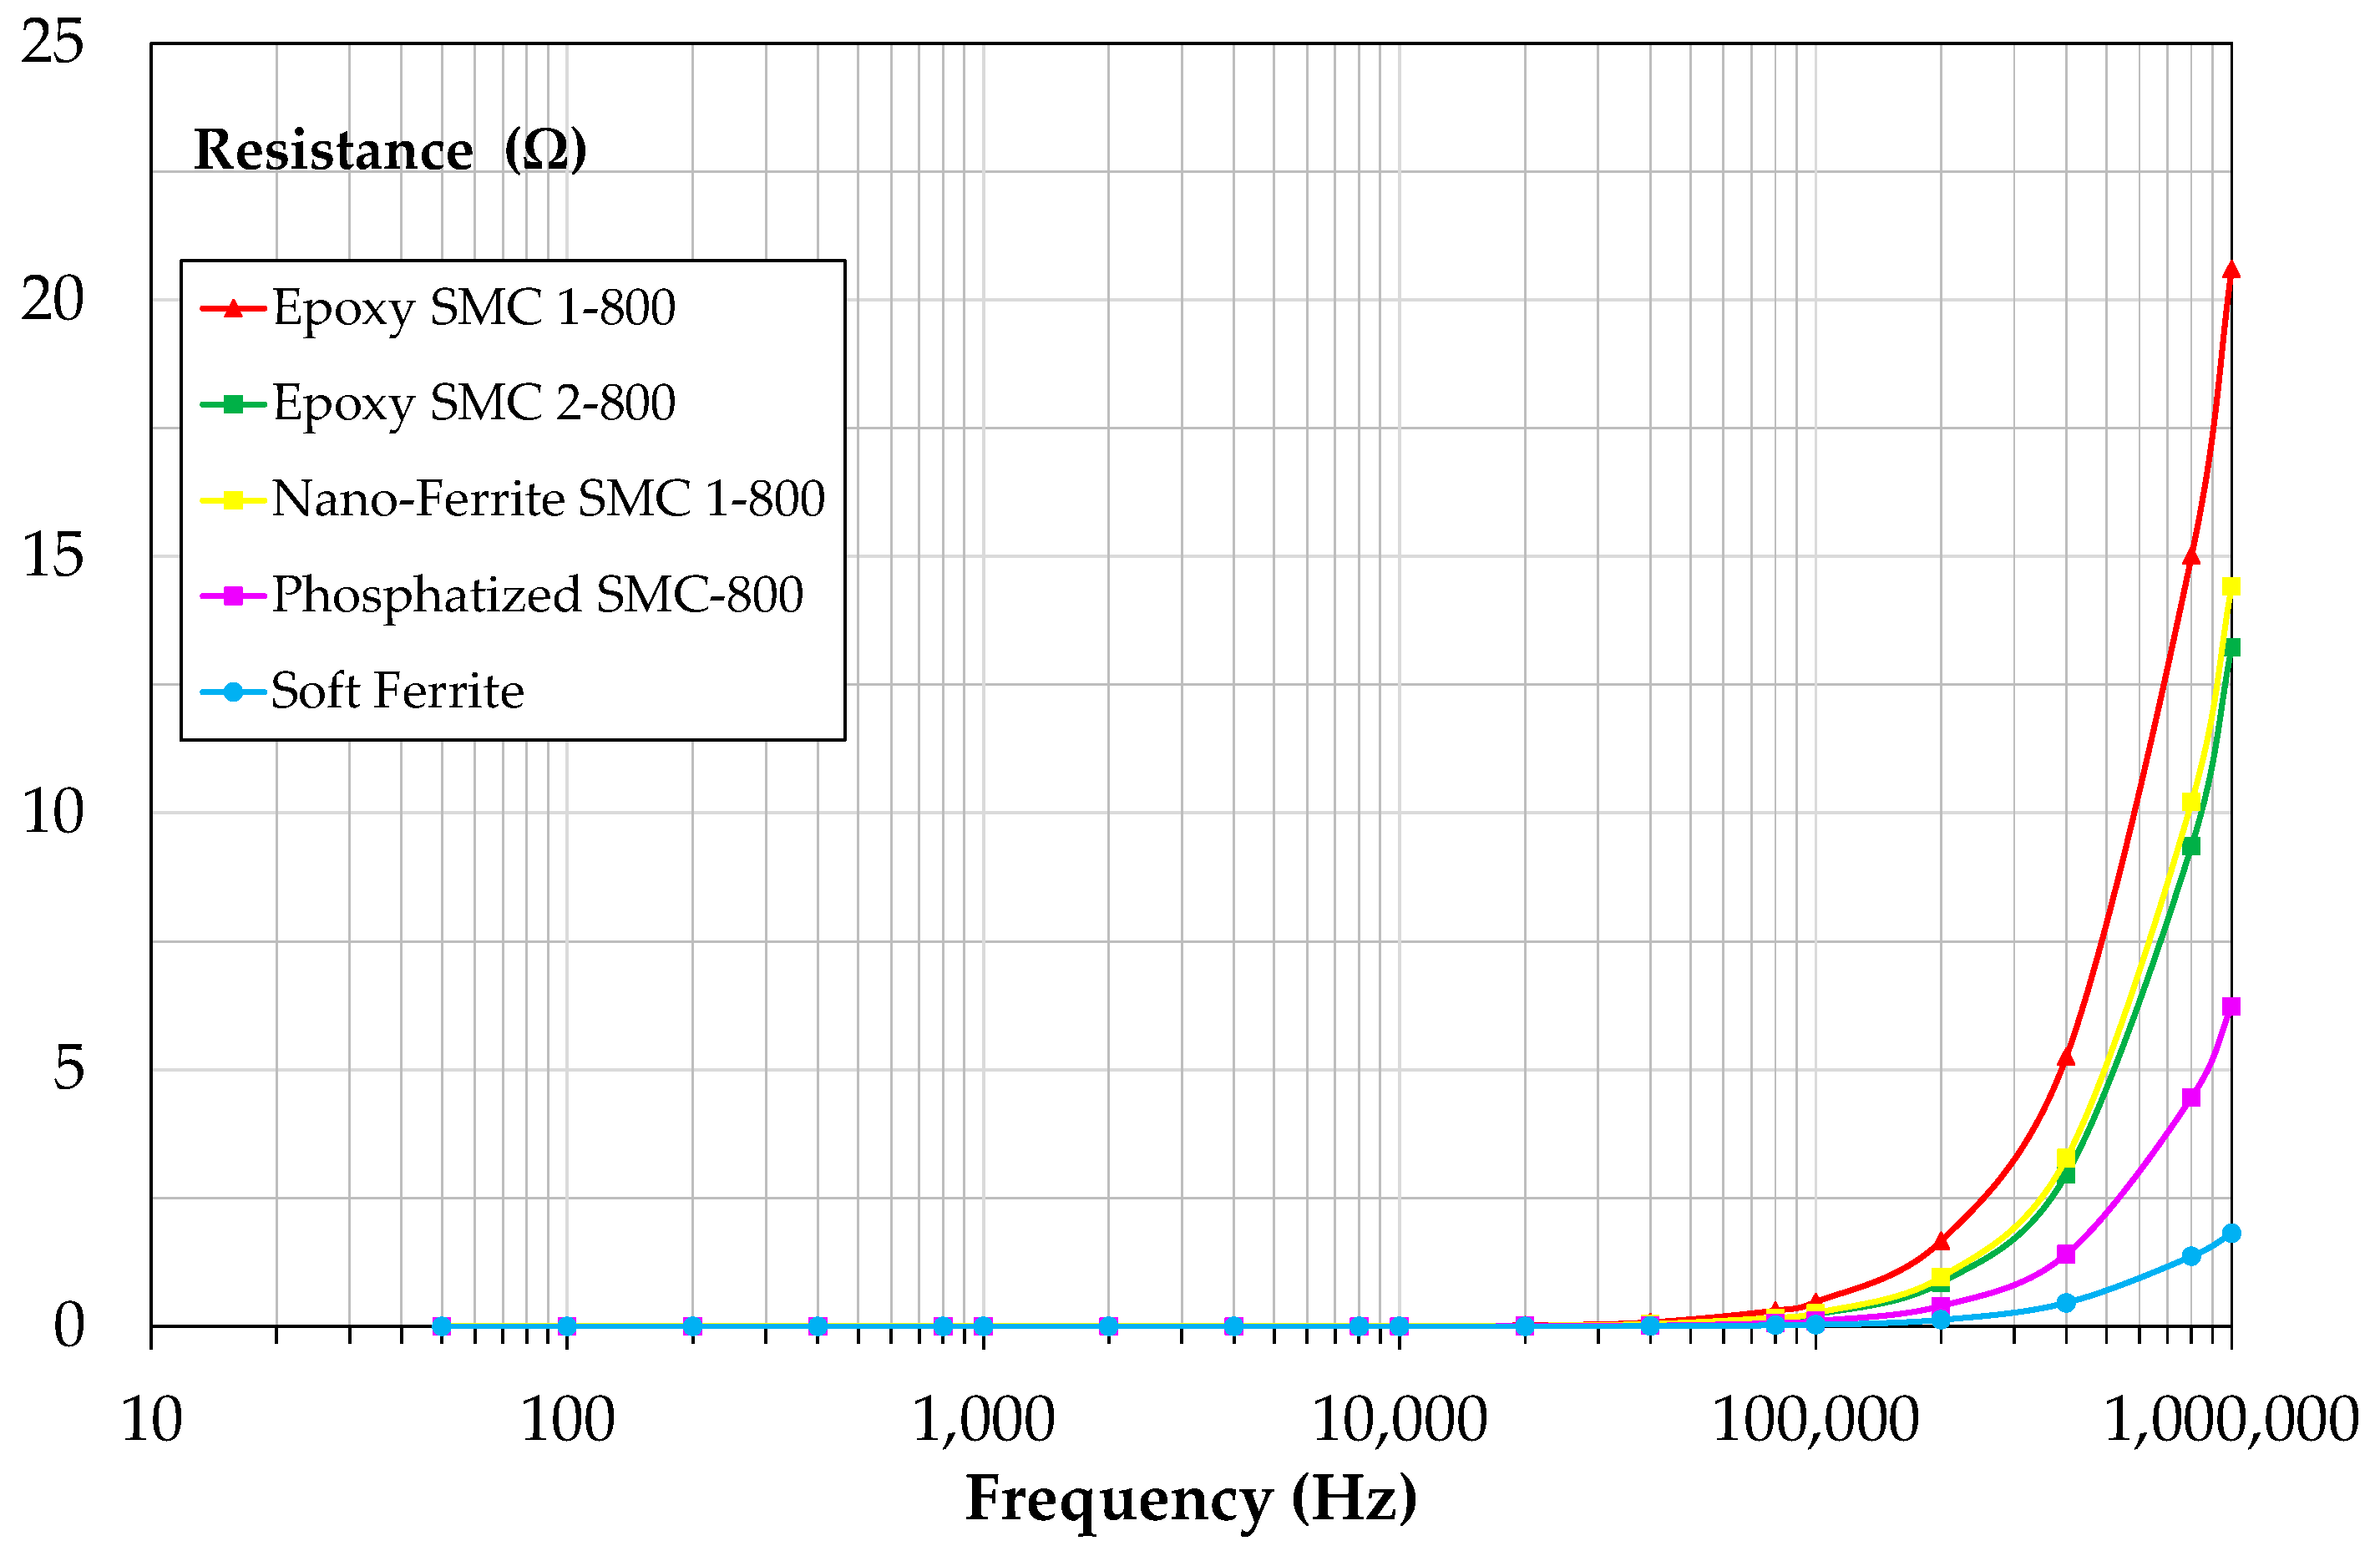
Figure 14 shows the resistance values of rod inductors: after soft ferrites, the minor losses are represented by the commercial product; instead, epoxy SMC 1-800 showed the most significant losses concerning all other considered samples.
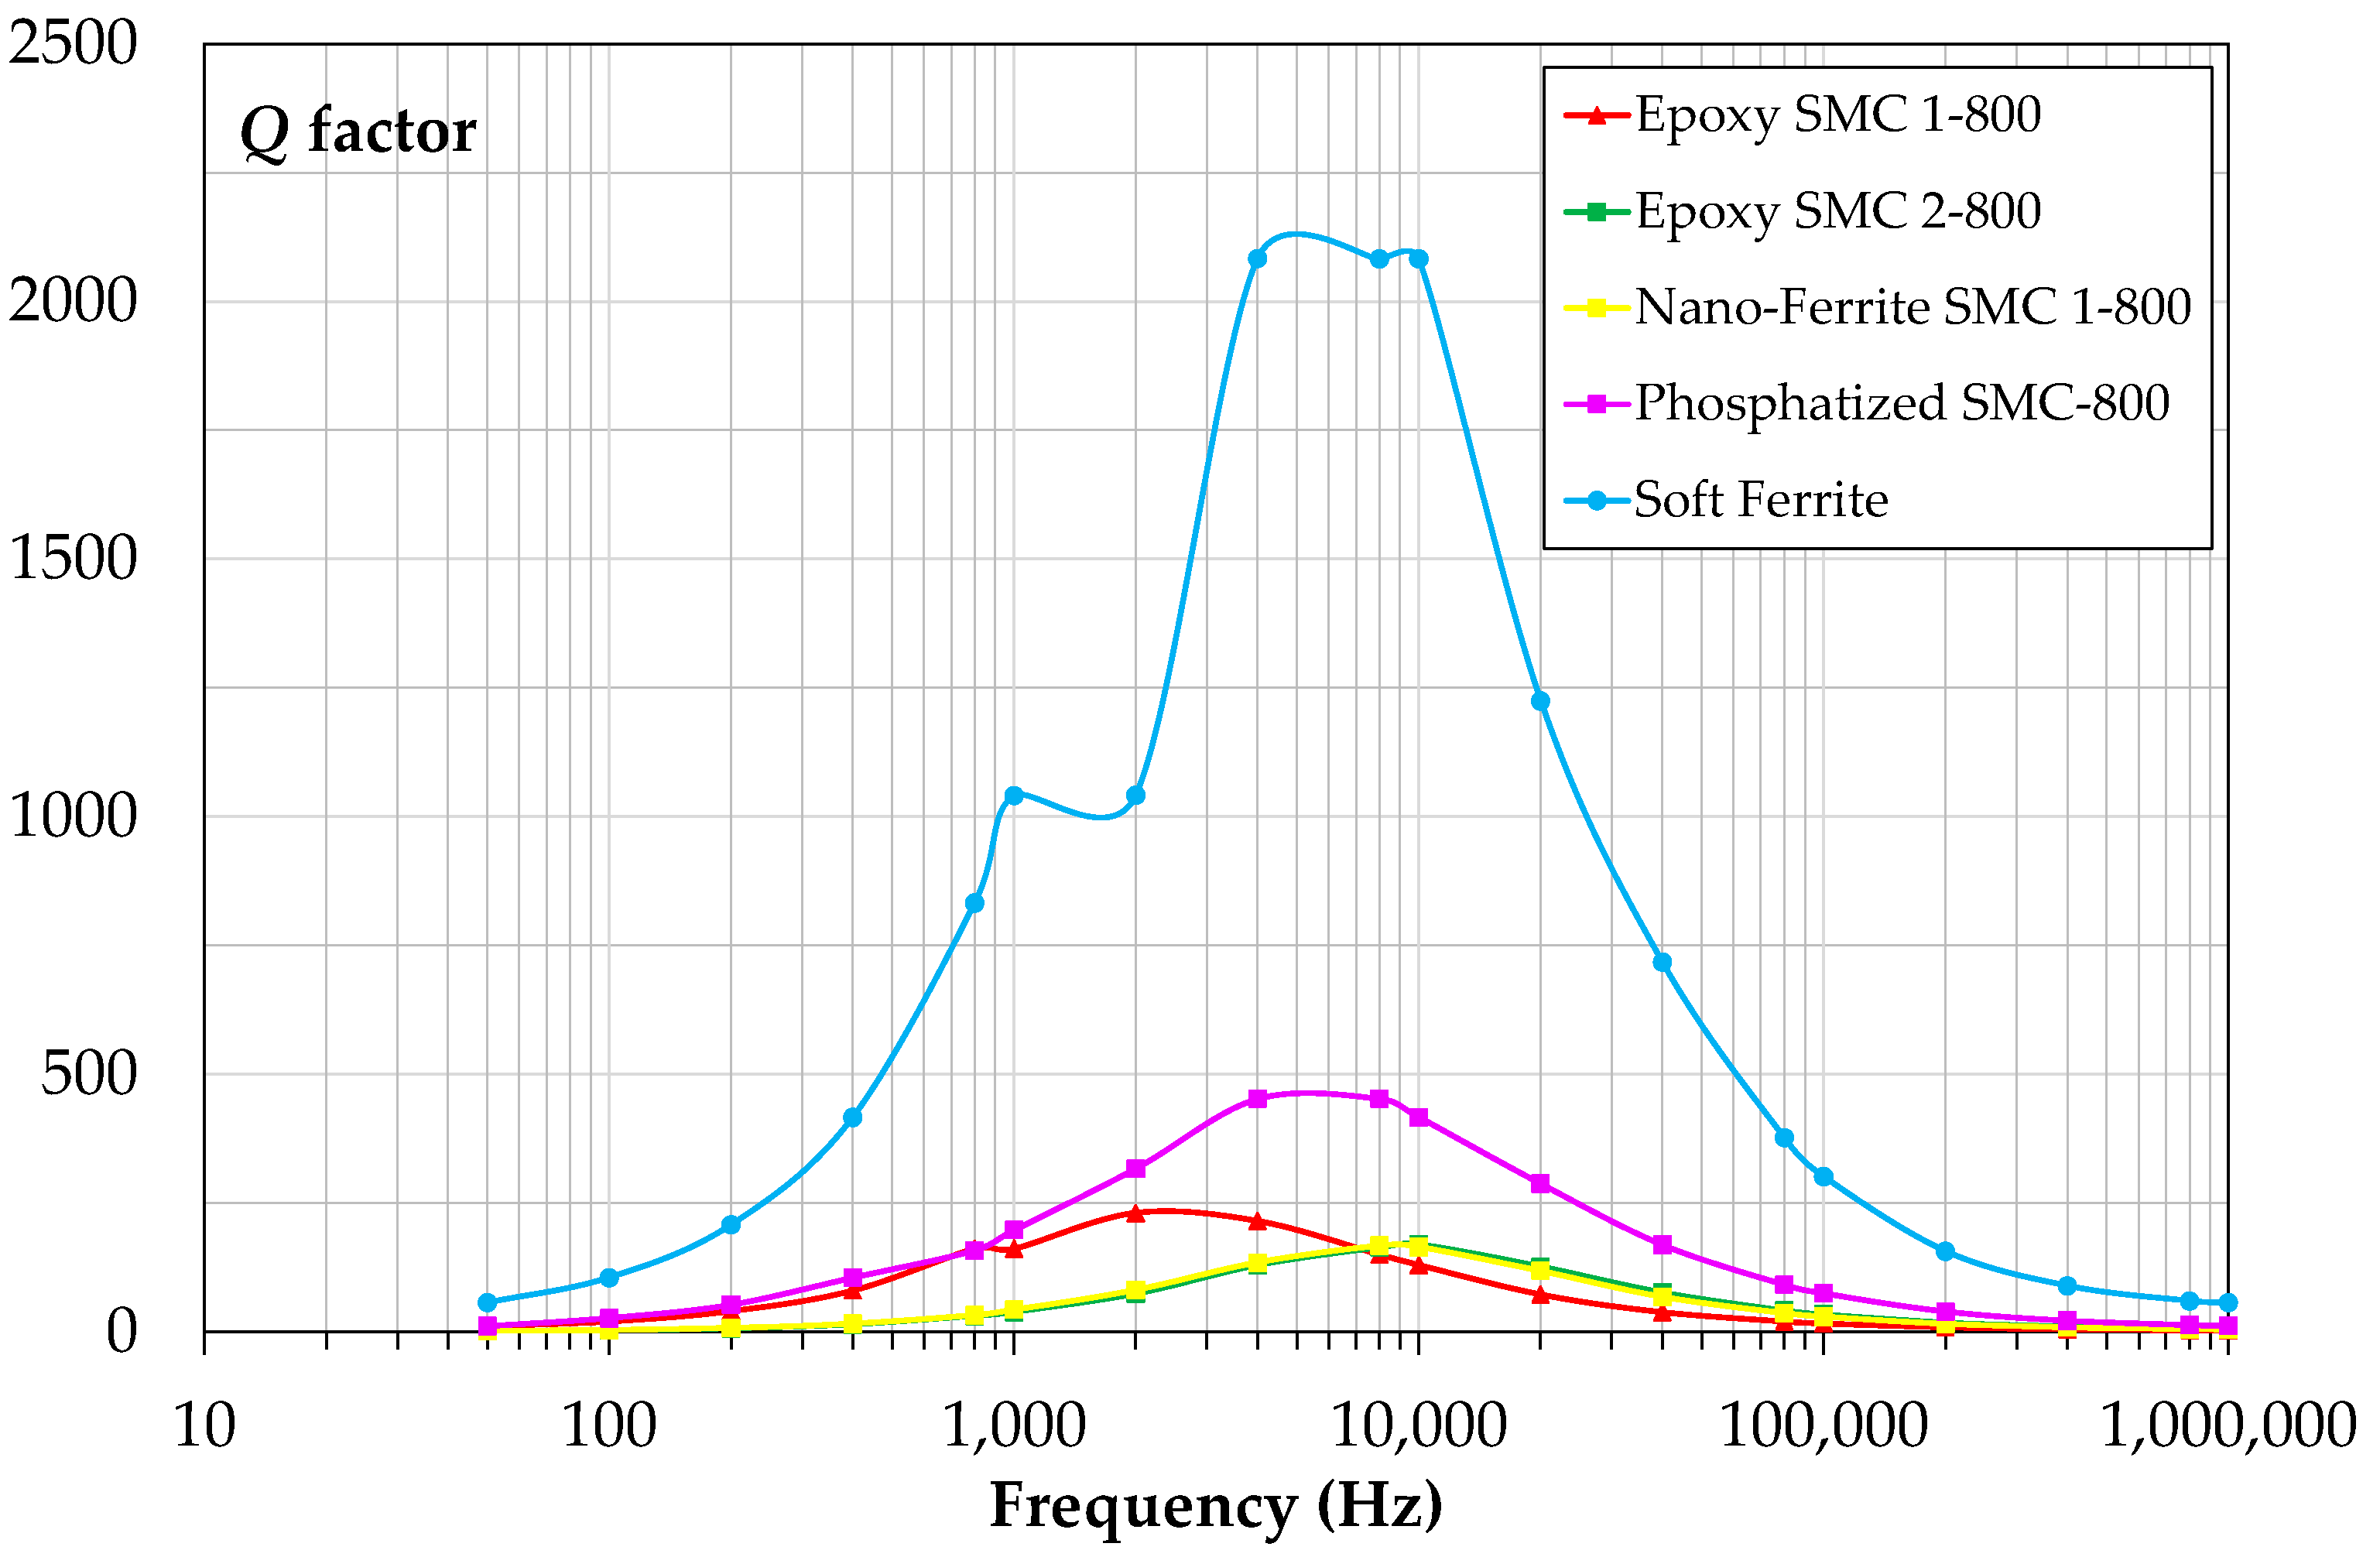
The corrected quality factor trends over frequency showed a different peak value and frequency for each material, as shown in
Figure 15. The differences were related to the balance between the (static) hysteresis losses and the rise in the dynamic (frequency dependent) losses.
Two materials (nano-ferrite SMC 1-800 and epoxy SMC 2-800) reported inductance values lower than the commercial one, even at the lowest frequencies. Epoxy SMC 1-800, having the best initial permeability, also showed the highest inductance value at low frequencies (100 Hz to 100 kHz). The 50 Hz data had to be excluded from the analyses for all samples since the too-low signal and the interference with the grid frequency did not allow a precise and repeatable reading. The commercial material reported the best (lowest) resistance values, with a maximum quality factor twice the value of epoxy SMC 1-800, as reported in
Figure 16. The proposed SMC inductors covered the different frequency ranges. Considering a Q factor value of 100 as the reference threshold, epoxy SMC 1-800 had a valuable interval from 500 Hz to 14 kHz. Nano-ferrite SMC 1-800 and epoxy SMC 2-800 resulted in the same frequency range from 2.5 kHz to 26 kHz for the nano-ferrite coating, and 28 kHz for the epoxy SMC with 2 wt.% of the binder. The phosphatized SMC-800 showed a large interval from 400 Hz to 75 kHz. The reference material started from 100 Hz up to 340 kHz. The proposed SMC materials could be adopted up to about 20 kHz, with the sole exception of the commercial one that reached 75 kHz.
The RLC measurements, once corrected by subtracting the DC resistance values, could lead to very good quality factor graphs with a clear, smooth, and symmetrical resonance peak. However, the work proved, in addition, that hysteresigraph measurements alone are not suitable to indicate the best inductor core material since they require being read together with RL measurements through a precision bridge.
A further analysis, which could lead to an inversion of the ranking, with the three designed materials again on top, could be an RLC measurement with DC current bias added. Unfortunately, the adopted fluke PM6306 had a limit on the injectable DC current (20 mA), so the attempts made by the authors in this direction did not show differences between the samples.
A new functionality could be added in the future to our hysteresigraph to allow the analysis of the impedance (just like other RLC meters), but with the possibility to change the injected DC current to more significant values (the power supply current limit is 22 A).
5. Conclusions
The use of SMC materials in the inductors sector remains a challenge. Although some materials are already available on the market, the solution panorama is vast. As demonstrated in this work, the insulating coating plays the primary role in both toroidal and rod inductors. The analysis proved that the high-insulating behavior of the layer/binder is important, and the binder content plays a secondary role. The organic layer has better properties at the same binder content than the inorganic nano-ferrite coating. It seems that the magnetic insulating coating penalizes the inductance value. The increased epoxy binder content reduces all magnetic properties, but the total iron losses are inferior to minor resin content. Such phenomenon is due to low eddy currents; on the other hand, the hysteresis losses increase with the binder content, which involves a reduction in the Q factor. However, an increment of the binder content shifts the Q factor peak towards high-frequency values. Therefore, the increment of the binder would be advisable, but a high reduction in magnetic properties and possible mechanical deformation necessitates a careful design.
The phosphatized SMC showed a good Q factor and operating interval for medium–high frequency applications. On the other hand, the initial magnetic permeability was the lowest where epoxy SMC 1-800 showed promising results and the probability of application in specific applications such as, for instance, instrument transformers. Additionally, the same material had a good Q factor at a low frequency and can be adopted in the audio sectors.
A comparison with soft ferrites is not achievable at the moment. Therefore, the only advantage concerns the mechanical aspects of producing complex shape inductance.
In this work, a preliminary analysis is made concerning the study of SMC coatings for inductance applications. Other coatings will be explored in the future, adopting new solutions: multifunctional and hybrid layers, resin filled with particular particles, granulometry effect, different inorganic layers, additive manufacturing, etc. The volume content will be included to paragon different types of SMC coatings. Moreover, a supply system will be implemented with the possibility of acquiring further experimental data. In addition, a detailed microstructural and compositional analysis (SEM-EDS investigation) will be performed.
Author Contributions
Conceptualization, E.P. and F.F.; methodology, E.P. and F.F.; software, F.F.; validation, E.P. and L.F.; formal analysis, E.P. and F.F.; investigation, E.P. and F.F.; resources, L.F.; data curation, E.P. and F.F.; writing—original draft preparation, E.P., F.F. and L.F.; writing—review and editing, E.P., F.F. and L.F.; visualization, E.P.; supervision, L.F. All authors have read and agreed to the published version of the manuscript.
Funding
This research received no external funding.
Institutional Review Board Statement
Not applicable.
Informed Consent Statement
Not applicable.
Data Availability Statement
Not applicable.
Acknowledgments
The part of research activities developed by Emir Pošković has been conducted through the Operative National Program (PON) for Research and Innovation 2014–2020, M.D. 1062 (10 August 2021), Action IV.6—“Research contracts on Green topics”.
Conflicts of Interest
The authors declare no conflict of interest.
References
- Tumanski, S. Magnetic Materials. In Handbook of Magnetic Measurements; CRC Press: Boca Raton, FL, USA, 2011. [Google Scholar] [CrossRef]
- Pošković, E.; Ferraris, L.; Carosio, F.; Franchini, F.; Bianchi, N. Overview on bonded magnets realization, characterization and adoption in prototypes. In Proceedings of the IECON 2019—45th Annual Conference of the IEEE Industrial Electronics Society, Lisbon, Portugal, 14–17 October 2019; pp. 1249–1254. [Google Scholar] [CrossRef]
- Fiorillo, F.; Bertotti, G.; Appino, C.; Pasquale, M. Soft Magnetic Materials. In Wiley Encyclopedia of Electrical and Electronics Engineering; John Wiley & Sons, Inc.: Hoboken, NJ, USA, 2016; pp. 1–42. [Google Scholar] [CrossRef]
- Silveyra, J.M.; Ferrara, E.; Huber, D.L.; Monson, T.C. Soft magnetic materials for a sustainable and electrified world. Science 2018, 26, eaao0195. [Google Scholar] [CrossRef] [PubMed]
- Krings, A.; Cossale, M.; Tenconi, A.; Soulard, J.; Cavagnino, A.; Boglietti, A. Magnetic materials used in electrical machines. IEEE Ind. Appl. Mag. 2017, 23, 21–28. [Google Scholar] [CrossRef]
- Krings, A.; Boglietti, A.; Cavagnino, A.; Sprague, S. Soft magnetic material status and trends in electric machines. IEEE Trans. Ind. Electron. 2017, 64, 2405–2414. [Google Scholar] [CrossRef]
- Kącki, M.; Rylko, M.S.; Hayes, J.G.; Sullivan, C.R. Magnetic material selection for EMI filters. In Proceedings of the 2017 IEEE Energy Conversion Congress and Exposition (ECCE), Cincinnati, OH, USA, 1–5 October 2017; pp. 2350–2356. [Google Scholar] [CrossRef]
- Leary, A.M.; Ohodnicki, P.R.; McHenry, M.E. Soft Magnetic Materials in High-Frequency, High-Power Conversion Applications. J. Miner. Met. Mater. Soc. 2012, 64, 772–781. [Google Scholar] [CrossRef]
- Schoppa, A.; Delarbre, P.; Schatz, A. Optimal use of soft magnetic powder composites (SMC) in electrical machines. In Proceedings of the MPIF PowderMet International Conference on Powder Metallurgy & Particulate Materials, Chicago, IL, USA, 24–27 June 2013; pp. 10-130–10-139. [Google Scholar]
- Zhang, Y.; Sharma, P.; Makino, A. Production and Properties of Soft Magnetic Cores Made From Fe-Rich FeSiBPCu Powders. IEEE Trans. Magn. 2015, 51, 2800104. [Google Scholar] [CrossRef]
- Actis Grande, M.; Ferraris, L.; Franchini, F.; Pošković, E. New SMC materials for small electrical machine with very good mechanical properties. IEEE Trans. Ind. Appl. 2018, 54, 195–203. [Google Scholar] [CrossRef]
- Shokrollahi, H.; Janghorban, K. Soft magnetic composite materials (SMCs). J. Mater. Process. Technol. 2007, 189, 1–12. [Google Scholar] [CrossRef]
- Périgo, E.A.; Weidenfeller, B.; Kollár, P.; Füzer, J. Past, present and future of soft magnetic composites. Appl. Phys. Rev. 2018, 5, 031301. [Google Scholar] [CrossRef]
- Schoppa, A.; Delarbre, P. Soft magnetic powder composites and potential applications in modern electric machines and devices. IEEE Trans. Magn. 2014, 50, 1613–1616. [Google Scholar] [CrossRef]
- De Wulf, M.; Anestiev, L.; Dupré, L.; Froyen, L.; Melkebeek, J. Magnetic properties and loss separation in iron powder soft magnetic composite materials. AIP J. Appl. Phys. 2002, 91, 7845. [Google Scholar] [CrossRef]
- Hanson, J.A.; Belk, A.J.; Lim, S.; Sullivan, C.R.; Perreault, J.D. Measurements and Performance Factor Comparisons of Magnetic Materials at High Frequency. IEEE Trans. Power Electron. 2016, 31, 7909–7925. [Google Scholar] [CrossRef]
- Pošković, E.; Franchini, F.; Ferraris, L.; Fracchia, E.; Bidulska, J.; Carosio, F.; Bidulsky, R.; Actis Grande, M. Recent Advances in Multi-Functional Coatings for Soft Magnetic Composites. Materials 2021, 14, 6844. [Google Scholar] [CrossRef] [PubMed]
- Dias, M.M.; Mozetic, H.J.; Barboza, J.S.; Martins, R.M.; Pelegrini, L.; Schaeffer, L. Influence of resin type and content on electrical and magnetic properties of soft magnetic composites (SMCs). Powder Technol. 2013, 237, 213–220. [Google Scholar] [CrossRef]
- Xie, D.-Z.; Lin, K.-H.; Lin, S.-T. Effects of processed parameters on the magnetic performance of a powder magnetic core. J. Magn. Magn. Mater. 2014, 353, 34–40. [Google Scholar] [CrossRef]
- Pošković, E.; Ferraris, L.; Franchini, F.; Actis Grande, M. The effect of particle size on the core losses of soft magnetic composites. AIP Adv. 2019, 9, 035224. [Google Scholar] [CrossRef]
- Vicenzi, B.; Boz, K.; Aboussouan, L. Powder metallurgy in aerospace-Fundamentals of PM processes and examples of applications. Acta Met. Slovaca 2020, 26, 144–160. [Google Scholar] [CrossRef]
- Takei, K.; Kitagawa, W.; Takeshita, T.; Fujimura, Y. Design and Analysis of Serial/Parallel Type of Electromagnetic Actuator. In Proceedings of the 2019 19th International Symposium on Electromagnetic Fields in Mechatronics, Electrical and Electronic Engineering (ISEF), Nancy, France, 29–31 August 2019; pp. 1–2. [Google Scholar] [CrossRef]
- Dobák, S.; Füzer, J.; Kollár, P.; Strečková, M.; Bureš, R.; Fáberová, M. A comprehensive complex permeability approach to soft magnetic bulk cores from pure or resin coated Fe and pulverized alloys at elevated temperatures. J. Alloys Compd. 2017, 695, 1998–2007. [Google Scholar] [CrossRef]
- Pošković, E.; Franchini, F.; Ferraris, L.; Carosio, F.; Actis Grande, M. Rapid Characterization Method for SMC Materials for a Preliminary Selection. Appl. Sci. 2021, 11, 12133. [Google Scholar] [CrossRef]
Figure 1.
The magnetic behavior difference between lamented steel and SMC materials: magnetic flux preferential directions and eddy-current paths.
Figure 1.
The magnetic behavior difference between lamented steel and SMC materials: magnetic flux preferential directions and eddy-current paths.
Figure 2.
Types of SMC insulating coatings: (a) organic layer, (b) thick organic layer, (c) inorganic layer, (d) phosphatized inorganic layer or similar techniques, (e) organic layer filled with nanoparticles, and (f) multilayers with the possible hybrid nature of coatings.
Figure 2.
Types of SMC insulating coatings: (a) organic layer, (b) thick organic layer, (c) inorganic layer, (d) phosphatized inorganic layer or similar techniques, (e) organic layer filled with nanoparticles, and (f) multilayers with the possible hybrid nature of coatings.
Figure 3.
Different steps of the mixing process, for instance, the epoxy coating procedure.
Figure 3.
Different steps of the mixing process, for instance, the epoxy coating procedure.
Figure 4.
The manufacturing process of the toroid: compacting and milling.
Figure 4.
The manufacturing process of the toroid: compacting and milling.
Figure 5.
Toroid sample preparation for the test: winding process and test setup.
Figure 5.
Toroid sample preparation for the test: winding process and test setup.
Figure 6.
Rod sample preparation for the test: winding process and size.
Figure 6.
Rod sample preparation for the test: winding process and size.
Figure 7.
The maximum magnetic permeability of proposed toroid samples in a frequency range of 20 kHz.
Figure 7.
The maximum magnetic permeability of proposed toroid samples in a frequency range of 20 kHz.
Figure 8.
The specific iron losses at 0.1 T of proposed toroid samples in a frequency range of 20 kHz.
Figure 8.
The specific iron losses at 0.1 T of proposed toroid samples in a frequency range of 20 kHz.
Figure 9.
The real part of the initial magnetic permeability of proposed toroid samples in a frequency range of 40 kHz.
Figure 9.
The real part of the initial magnetic permeability of proposed toroid samples in a frequency range of 40 kHz.
Figure 10.
The imaginary part of the initial magnetic permeability of proposed toroid samples in a frequency range of 40 kHz.
Figure 10.
The imaginary part of the initial magnetic permeability of proposed toroid samples in a frequency range of 40 kHz.
Figure 11.
The Q factor of the toroid samples of the proposed SMC materials.
Figure 11.
The Q factor of the toroid samples of the proposed SMC materials.
Figure 12.
RCL measurement setup: detection of the DC resistance value.
Figure 12.
RCL measurement setup: detection of the DC resistance value.
Figure 13.
Inductance values of produced SMC and soft ferrite rod inductors in a frequency range up to 1 MHz.
Figure 13.
Inductance values of produced SMC and soft ferrite rod inductors in a frequency range up to 1 MHz.
Figure 14.
Resistance values of produced SMC and soft ferrite rod inductors in a frequency range up to 1 MHz.
Figure 14.
Resistance values of produced SMC and soft ferrite rod inductors in a frequency range up to 1 MHz.
Figure 15.
The Q factor of the rod samples of proposed SMC materials compared to soft ferrite.
Figure 15.
The Q factor of the rod samples of proposed SMC materials compared to soft ferrite.
Figure 16.
The Q factor of the rod samples of proposed SMC materials.
Figure 16.
The Q factor of the rod samples of proposed SMC materials.
Table 1.
The specific iron losses at 1 T and magnetic induction at 5000 A/m for produced toroid rings.
Table 1.
The specific iron losses at 1 T and magnetic induction at 5000 A/m for produced toroid rings.
| | Frequency (Hz) | Epoxy SMC 1-800 | Epoxy SMC 2-800 | Nano-Ferrite SMC 1-800 | Phosphatized
SMC-800 |
|---|
| Specific Iron losses@1T (W/kg) | 50 | 8.8 | 10.2 | 9.1 | 17.4 |
| 200 | 40.3 | 49.3 | 42.9 | 88.8 |
| 400 | 92.4 | 117.6 | 100.9 | 223.5 |
| 1000 | 300 | 405 | 340 | 635 |
| B @5000 A/m (T) | 50 | 1.35 | 1.09 | 1.12 | 0.64 |
| 200 | 1.33 | 1.09 | 1.11 | 0.64 |
| 400 | 1.32 | 1.09 | 1.11 | 0.63 |
| 1000 | 1.32 | 1.06 | 1.10 | 0.62 |
| Publisher’s Note: MDPI stays neutral with regard to jurisdictional claims in published maps and institutional affiliations. |
© 2022 by the authors. Licensee MDPI, Basel, Switzerland. This article is an open access article distributed under the terms and conditions of the Creative Commons Attribution (CC BY) license (https://creativecommons.org/licenses/by/4.0/).


