Article

Segmentation of Liver Tumor in CT Scan Using ResU-Net

1
Department of Computer Science, University of Pisa, 56124 Pisa, Italy
2
Centre for Intelligent Signal and Imaging Research (CISIR), Department of Electrical and Electronic Engineering, Universiti Teknologi PETRONAS (UTP), Seri Iskandar 32610, Perak, Malaysia
3
Department of Telecommunications Engineering, NED University of Engineering & Technology, University Road, Karachi 75270, Pakistan
4
School of Information Technology, Skyline University College, University City Sharjah, Sharjah 1797, United Arab Emirates
5
Department of Computer Science, COMSATS University, Islamabad 45550, Pakistan
6
ImViA Laboratory, University of Bourgogne Franche-Comté, 21000 Dijon, France
7
Aerospace Engineering Department, King Fahd University of Petroleum & Minerals, Dhahran 31261, Saudi Arabia
*
Author to whom correspondence should be addressed.
Appl. Sci. 2022, 12(17), 8650; https://doi.org/10.3390/app12178650
Submission received: 16 May 2022 / Revised: 9 August 2022 / Accepted: 18 August 2022 / Published: 29 August 2022

Abstract

:
Segmentation of images is a common task within medical image analysis and a necessary component of medical image segmentation. The segmentation of the liver and liver tumors is an important but challenging stage in screening and diagnosing liver diseases. Although many automated techniques have been developed for liver and tumor segmentation; however, segmentation of the liver is still challenging due to the fuzzy & complex background of the liver position with other organs. As a result, creating a considerable automated liver and tumour division from CT scans is critical for identifying liver cancer. In this article, deeply dense-network ResU-Net architecture is implemented on CT scan using the 3D-IRCADb01 dataset. An essential feature of ResU-Net is the residual block and U-Net architecture, which extract additional information from the input data compared to the traditional U-Net network. Before being fed to the deep neural network, image pre-processing techniques are applied, including data augmentation, Hounsfield windowing unit, and histogram equalization. The ResU-Net network performance is evaluated using the dice similarity coefficient (DSC) metric. The ResU-Net system with residual connections outperformed state-of-the-art approaches for liver tumour identification, with a DSC value of 0.97% for organ recognition and 0.83% for segmentation methods.

1. Introduction

Malignant liver neoplasm is one of the most common types of human cancer and is responsible for the high death rate due to its late diagnosis. Liver disease had the sixth-highest occurrence of all cancers, and the fourth-highest mortality rate in the world, with around 841,000 new cases at a rate of 93 cases per million people and about 782,000 deaths at a rate of 85 cases per million people in 2020 [1]. As tumors can be detected in medical images, the focus of recent research has been shifted towards the segmentation of liver and tumor. It is evident from the fact that the number of studies based on segmentation of liver and tumor has doubled recently [2]. Although the windowed Hounsfield unit values may provide a range of values for the marking of different regions in medical images, identifying voxels that portray liver and lesion regions is challenging due to the low contrast between the liver and the neighbouring organs [3]. Owing to the different sizes, form, and locations of lesions, liver tumor segmentation becomes more complex and challenging in different patients [4]. Furthermore, the margins of some lesions are imprecise, such as hazy, making it hard to detect using edge-based segmentation algorithms. It warrants the need for an algorithm using artificial intelligence that may help medical physicians segment organs and malignancies. In addition, computed tomography (CT) has become one of the most commonly used imaging technologies for identifying and detecting liver tumors because of its excellent spatial precision and speedy laser power. In typical clinical operations, segmentation can be done manually by operators with sufficient competence, but it is time-consuming, and results from different operators are sometimes inconsistent. As a result, developing an automatic segmentation method is extremely difficult, because of the variable forms of tumours, the vast range of tumor intensities, and the uncertainty of tumor and adjacent normal hepatic tissues borders. Over the last few years, semantic segmentation of CT images has become a hot topic of study. Deep learning has significantly enhanced artificial intelligence performance in recent years. In medical imaging, deep learning methods, especially fully convolutional neural network, have surpassed their competitors significantly. In this article, we have implemented ResU-Net architecture for liver and liver tumor segmentation in CT Scan images. The training and testing of the ResU-Net are conducted with selected image pre-processing techniques, Housnfiled windowing unit, histogram equalization and data augmentation methods.
Our contribution to this work includes the implementation of U-Net architecture along with residual blocks. The ResU-Net architecture was trained using selected image pre-processing techniques, Hounsfield Windowing, methods for adjusting the brightness level of CT scan, data augmentation for increasing the number of images and their variations, and a method to tackle the issue of class imbalance. The weighted cross-entropy loss function was also used during network training to address the class imbalance issue. The proposed methodology has obtained better results for liver and liver tumor as assessed by DSC, accuracy, precision, specificity, VOE and RVD values.
The paper is outlined as follows. In Section 2, we have analysed state-of-the-artwork related to the liver and liver tumor segmentation. This section also includes a summary of our contribution. Next, Section 3 presents materials and methods, and Section 4 presents result and discussion. Lastly, Section 5 concludes the paper and suggests further work in this area.

2. Related Work

Over the past decade, researchers have used different machine learning strategies to separate liver and tumors. Li et al. [5] proposed an autonomous 3D liver segmentation approach that uses a total variation with the L1 norm (TV-L1) to detect an initial liver border, followed by a level set method that uses both local and global energy functions. A texture analysis method based on the grey level co-occurrence matrix (GLCM) is used for refined segmentation. Xu et al. [6] proposed a multi-atlas segmentation (MAS) based performance level estimation (SIMPLE) method for automatic segmentation of abdominal organs, including the liver. Song et al. [7] developed an adaptive FMM-based fully automatic liver segmentation algorithm. Self-adaptive parameter adjustment is used in the proposed adaptive FMM. In FMM, the arrival time is adjusted based on the intensity statistics of the potential liver region, which can be used to estimate the size of the liver region on the corresponding computed tomography (CT) slices. Maklad et al. [8] developed a semi-automated method for fragmenting the hepatic low-intensity tumor using CT images that utilized abdominal arterial channels in the entrance stage. Peng et al. [9] proposed a finite difference energy technique that incorporates brightness, region attractiveness, or surface smoothing.
Automatic and robust liver segmentation from CT volumes is challenging due to the low-intensity contrast between the liver and neighbouring organs. Deep neural networks are used extensively in present healthcare image segmentation frameworks [10,11].Tianfei Zhou et al. [12] introduced quality-aware memory network for interactive segmentation of 3D medical images. The memory-augmented network can quickly encode and retrieve segments from the past for segmentation of new slices. Elshaer et al. [13] used two trained deep CNN models to reduce the computational time of a large number of slices. After obtaining the liver segmentation with the first model, the second model was used to avoid the impact of image resampling by removing small missing lesions. Chen Li et al. [14] employed a convolutional neural network (CNN) that used image patches. Each pixel is considered as a patch of the image, with the pixel of interest at its center. It divides the patches into normal or tumor liver tissues. The patch is considered positive if it contains at least 50 percent or more tumor tissue. Hu et al. [15] merged a 2D DenseNet network that combined the extracted intra-slice features and the 3D counterpart for hierarchically aggregating volumetric contexts for liver and lesion segmentation. The liver tumour was segmented by Li et al. [16] using a cascading architecture in which soft and harsh focus techniques and long or short skip linkages were integrated. False positives were reduced by using a joint dice loss function. Jiang et al. [17] developed an edge system by incorporating spatial stream convolution into the U-Net network’s modules. Furthermore, current liver segment techniques are designed for segmenting diagnostic CT pictures and may not even be suitable for segmenting interventional CT images. In addition, CT scans frequently show low gentle brightness, roughness, and other abnormalities. Current tumor segmentation approaches have had mixed results in resolving these challenging problems. As a result, U-Net was used by Chen et al. [18] in conjunction with a recurrent neural block [19] to resolve the limitation of the state-of-the-art models and schemes. The U-Net will use the recurrent neural network to gain relevant data about the hepatic area, aiding in improved liver and hepatic segmentation methods. Hao Xiong et al. [20] implemented probabilistic graphical model for segmentation for fundus images and obtained accuracy of 0.99. Karthik et al. [21] implemented a Fully Convolutional Network (FCN) to better segment the brain MRI having a varying size and shape ischemic lesion and obtained the DSC score of 0.75. Manjunath et al. [22] implemented modified ResU-Net to segment livers and their tumors. The modified system obtained 96.35% DSC and 89.28% accuracy 99.71% and 99.72% for liver and tumour segmentation. Javaria Amin et al. [23] generated synthetic images utilizing a generative adversarial network (GAN). YOLOv3 detector and Resnet block localize the liver in the synthesized images. Moreover, DeeplabV3+ having Inceptionresnetv2 model as a base is implemented for better liver segmentation. Qiangguo Jin et al. [24] implemented a novel network called residual attention-aware U-Net (RA-U-Net) to segment 3D images of liver 3DIRCADb dataset. Moreover, Yodit Abebe Ayalew et al. [25] implemented U-Net to segment liver and liver tumor and obtained a DSC value of 0.96 and 0.74. Sultan Almotairi et al. [26] applied a semantic pixel-wise classification network called SegNet for tumor classification of the liver. The implemented network obtained an accuracy of 99.9% for liver tumor. The liver is an essential organ in the abdominal area, and overlapping the tumor region on the liver may cause trouble automatically segmenting the liver. Some surrounding tissues may also cause boundary problems for the automated liver segmentation task. The residual block in the segmentation model would provide efficient backpropagation gradient capability to train the deep learning model well and produce efficient segmentation results.
However, due to the heterogeneity and variation in shapes of the liver and its potential tumors, segmenting CT images remains challenging, and many efforts have been made to address it.

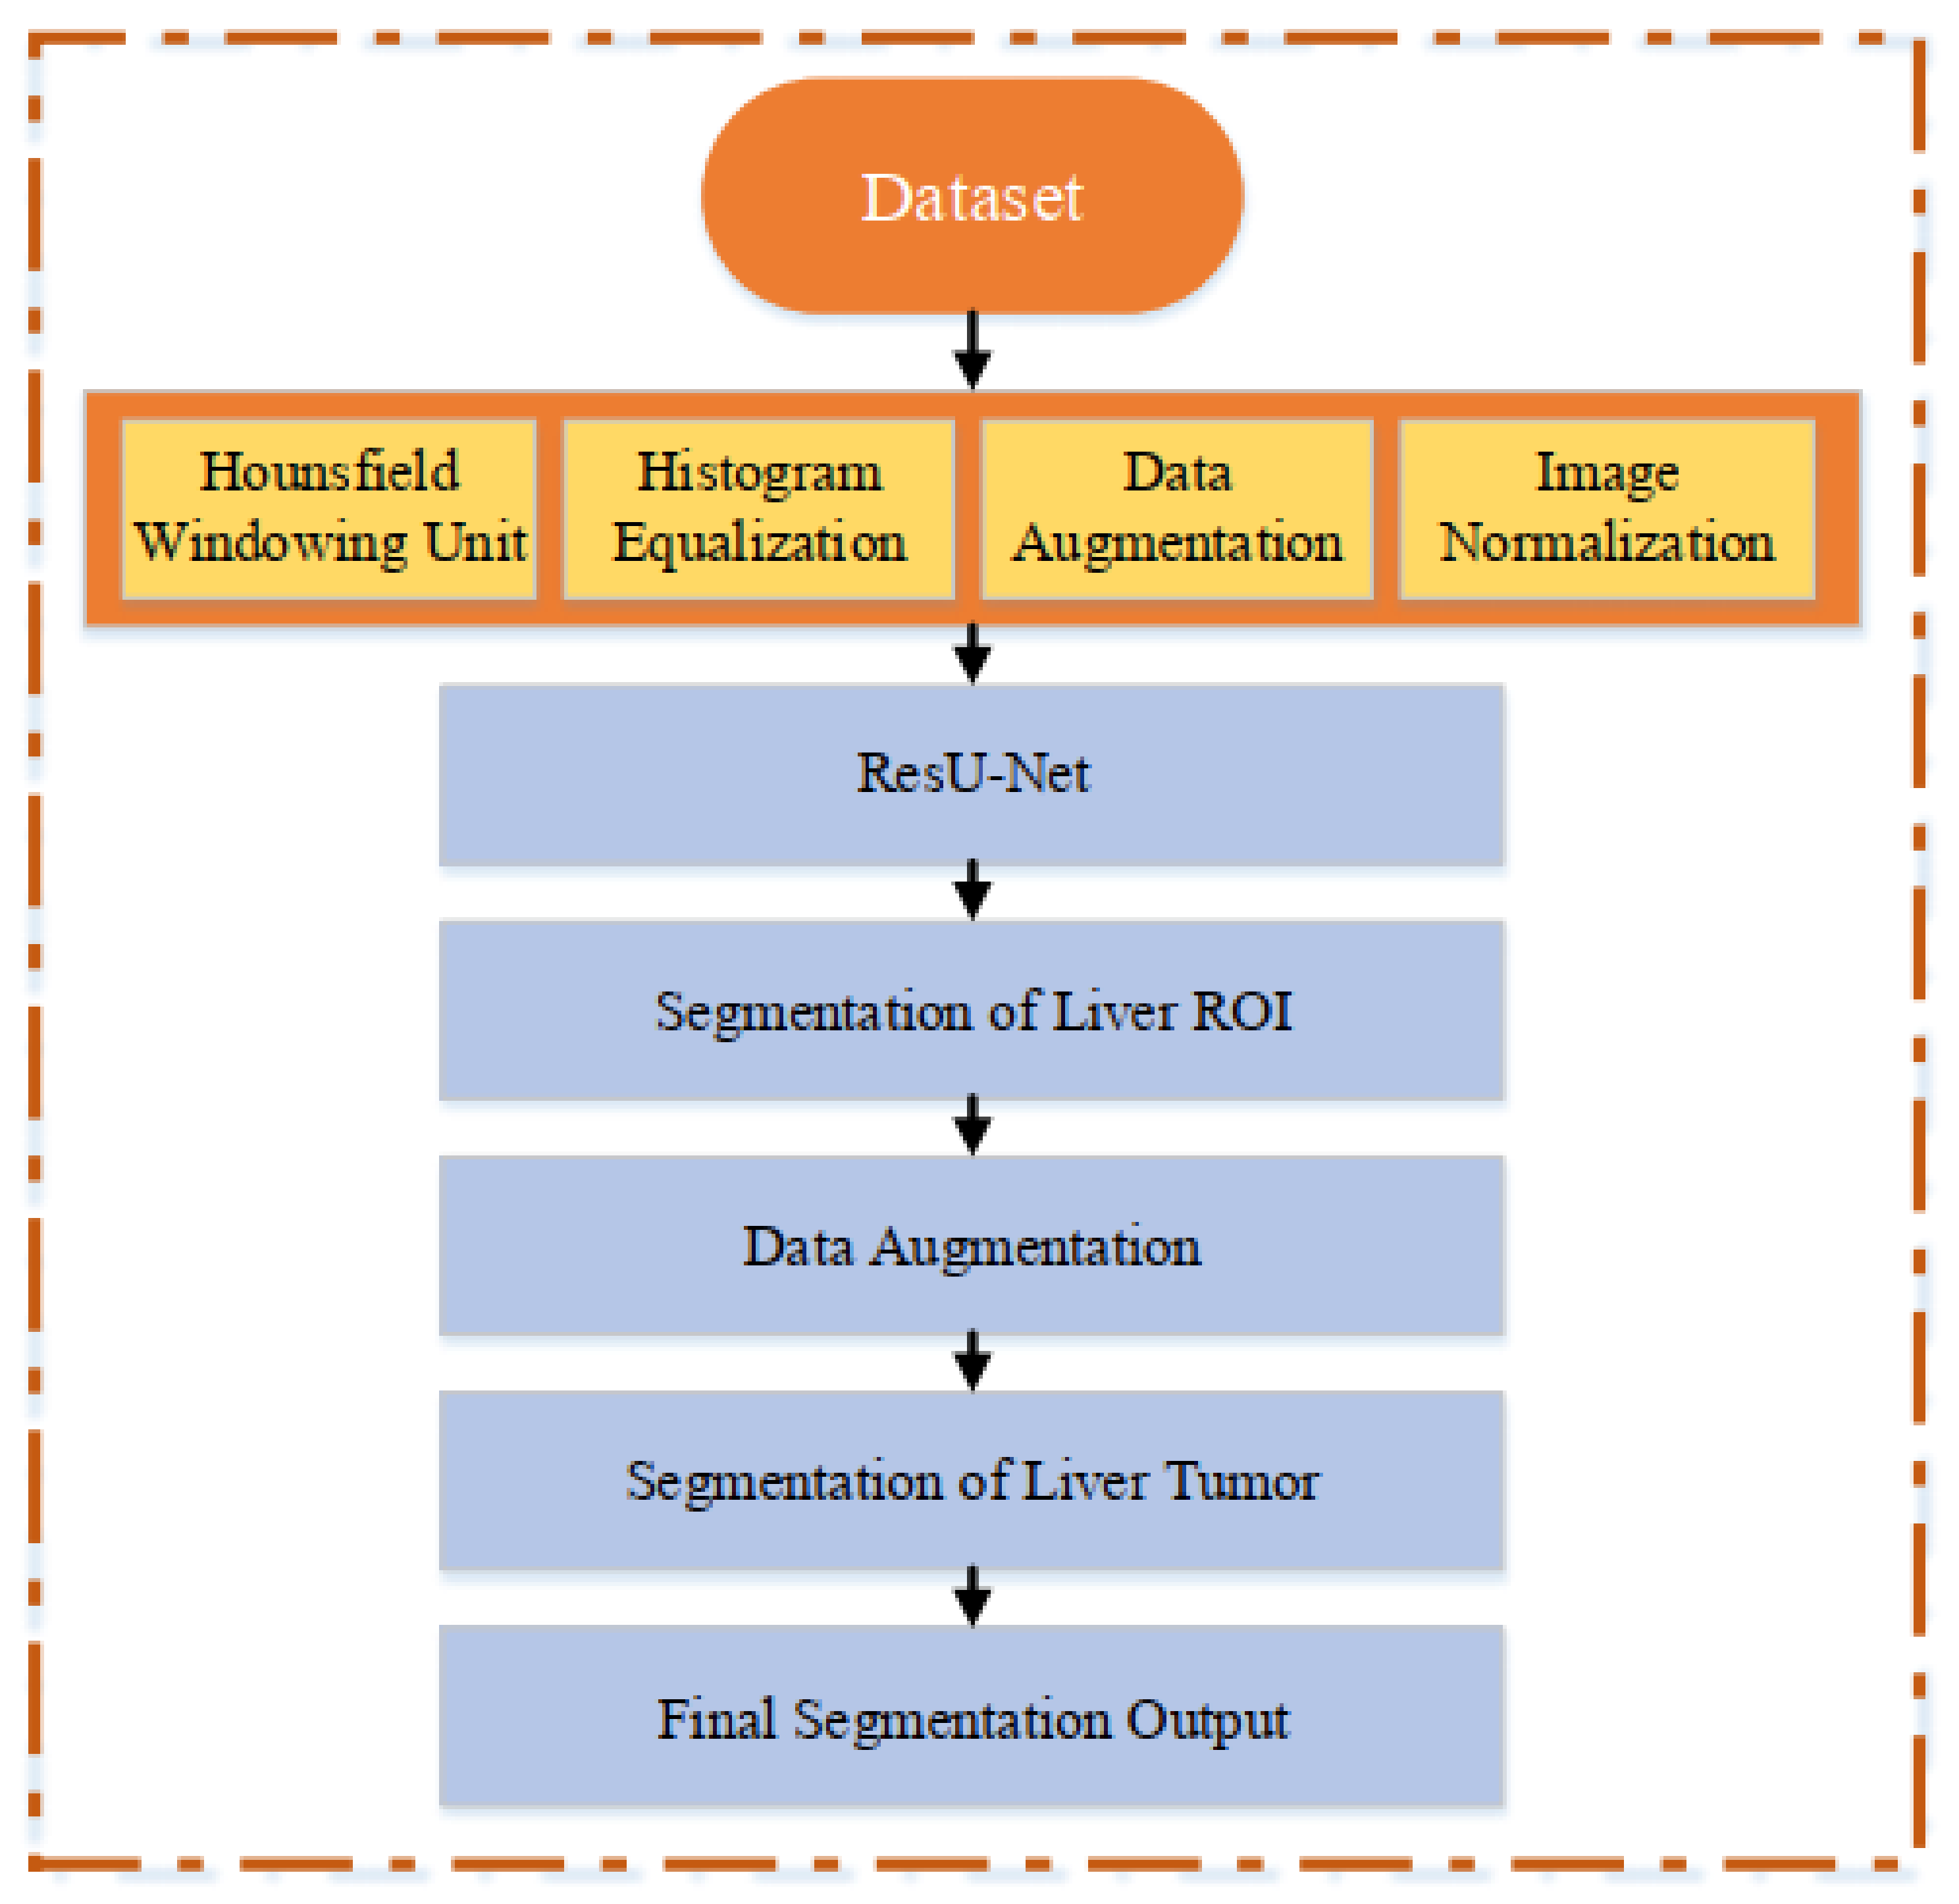
3. Material and Method

3.1. Liver CT Scan Dataset

The ResU-Net network is evaluated on the 3D-IRCADb01 dataset [27] publicly provided by the IRCAD Digestive Cancer Institute, which included 3D CT scans of 10 females and 10 males with liver cancer among 75 female and male cases. The 3D CT scan is in the shape of DICOM and is divided into 2D slices, and each has 2800 slices with masks for liver, tumor, bone, arteries, kidneys, and lungs. The general pipeline of the method utilized in this study for liver tumor segmentation as shown in Figure 1.

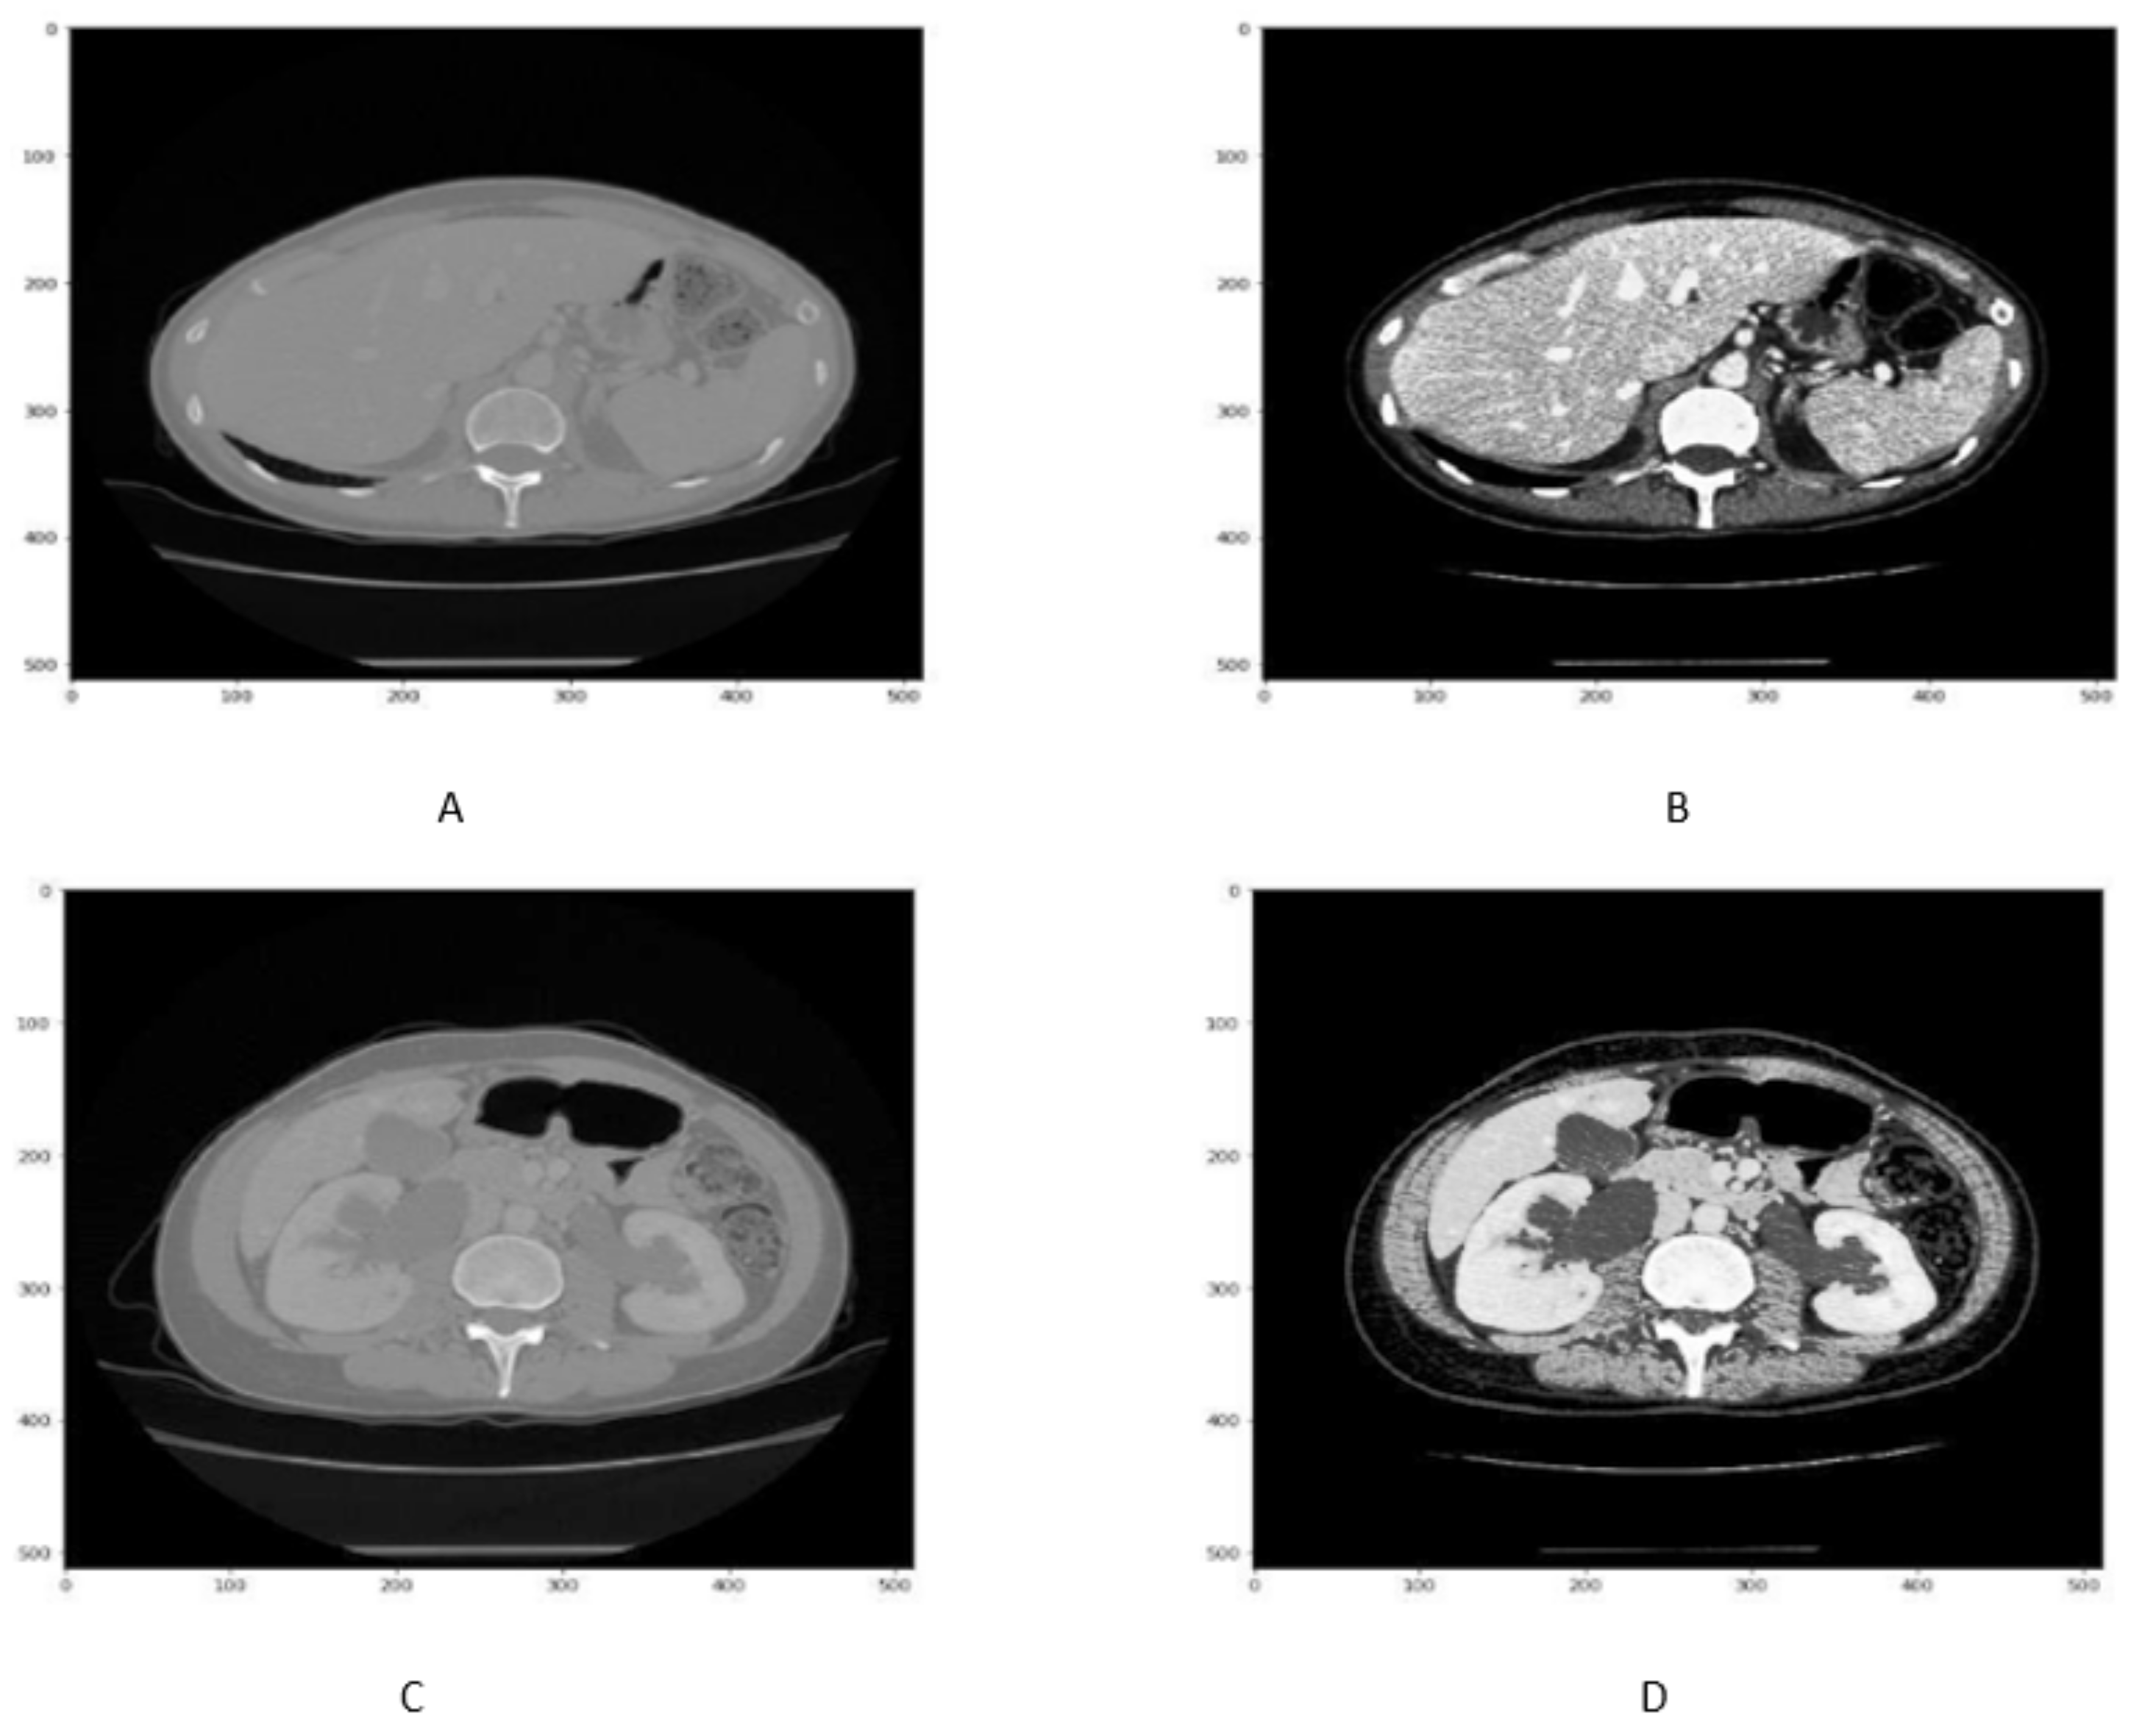
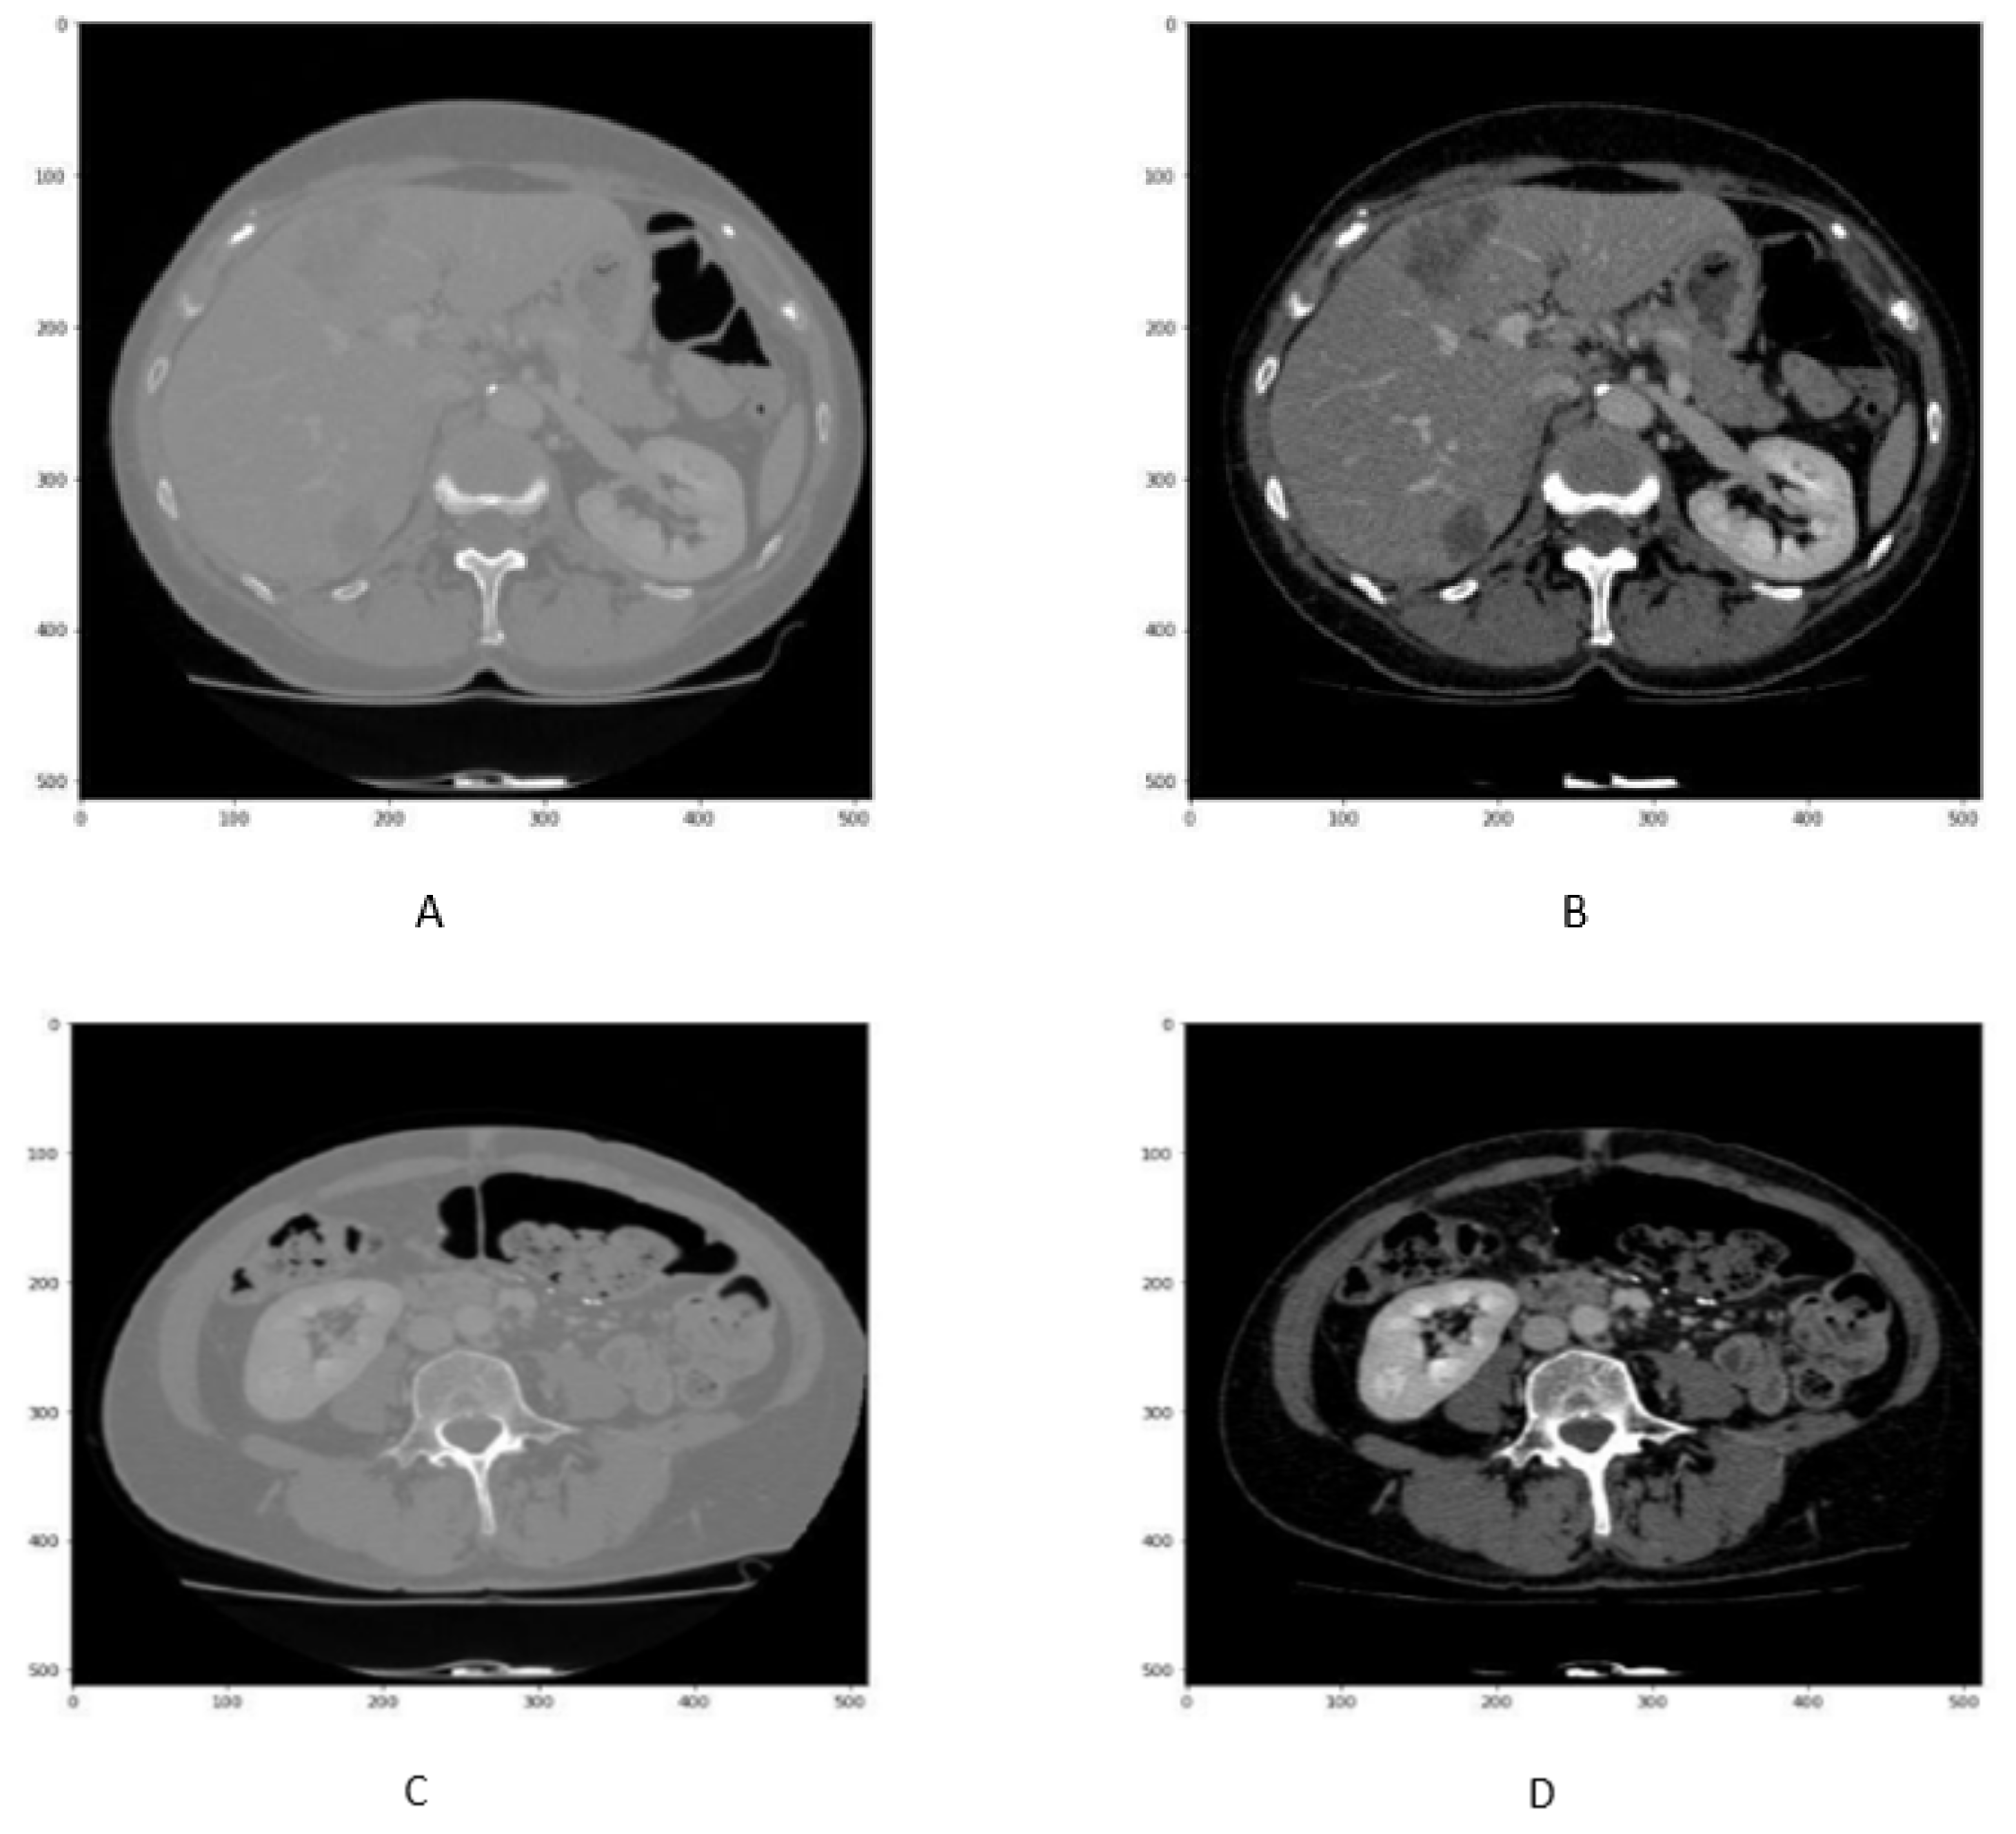
3.2. Image Pre-Processing

In order to distinguish the liver from neighbouring organs, pre-processing of each slice was performed as described in subsequent sub-sections.

3.2.1. Hounsfield Windowing ( H U )

In CT scans, the tissue density is measured in the Hounsfield unit ( H U ), which is defined as −1000 for air, zero for water and +1000 for bone, while the HU values for different organs and fluids lies in between this range as shown in Table 1. In order to observe specific tissues of interest, a windowing operation is usually performed in which the CT image greyscale component of an image is manipulated via the CT numbers. The brightness of the image is adjusted via the window level. The contrast is adjusted via the window width.
H U = 1000 × μ t i s s u e μ H 2 O μ H 2 O
The H U value assigned to each pixel is calculated by giving grayscale intensity to each value, with higher values indicating brighter pixels. Using Hounsfield Windowing, read the slides in DICOM format and set the range [−100, 400] [−100, 400] [28].
In order to enhance the visualization of the liver, HU windowing is performed at each slice where the HU range of −100 to 400 is selected, as shown in Figure 2. It shows that most organs are occluded in CT image slices without windowing operation, while the image and organs became clearer after HU windowing. Therefore, this HU windowing is performed over all slices before passing them to the next process.

3.2.2. Histogram Equalization

Although HU windowing provides good visualization of organs, it was still difficult to differentiate between the liver and adjacent tissues. Therefore, histogram equalization was applied to the image obtained after window processing and then normalized in the range of [0, 1] as shown in Figure 3. It can be seen that as compared with Figure 2A,B, the organs boundaries are more evident in Figure 3C,D after histogram equalization.

3.3. Data Augmentation

In the 3D IRCADb01 dataset, each scan has its own tumor mask that represents the location of the liver and tumor. However, the number of slices containing the tumor is not sufficient for the training process of deep learning. Therefore, data augmentation such as reflection or flip and rotation of combined slice and its mask was performed. Data augmentation will essentially increase the spatial variation of the images and improve the network accuracy [29]. The two data augmentation techniques used are as follows:

3.3.1. Reflection

Reflection is a data augmentation technique in which the image can be flipped across the x or y-axis to generate more samples for network training. In order to avoid the computational expense, the liver images along with its tumor masks are reflected as shown in Figure 4A–F.

3.3.2. Rotation

The rotation method of data augmentation involves rotating the image to a certain degree that can be considered a new image.Here, a 90 rotation of liver images along with its masks are performed as shown in Figure 5A–F.

3.4. Image Normalization

Image intensity normalisation is a technique for reducing inter-patient variability in the intensity distribution of images in a dataset [30]. It will also increase patient image comparability and result in improved segmentation findings. As a result, liver CT scan results are subjected to intensity normalisation.

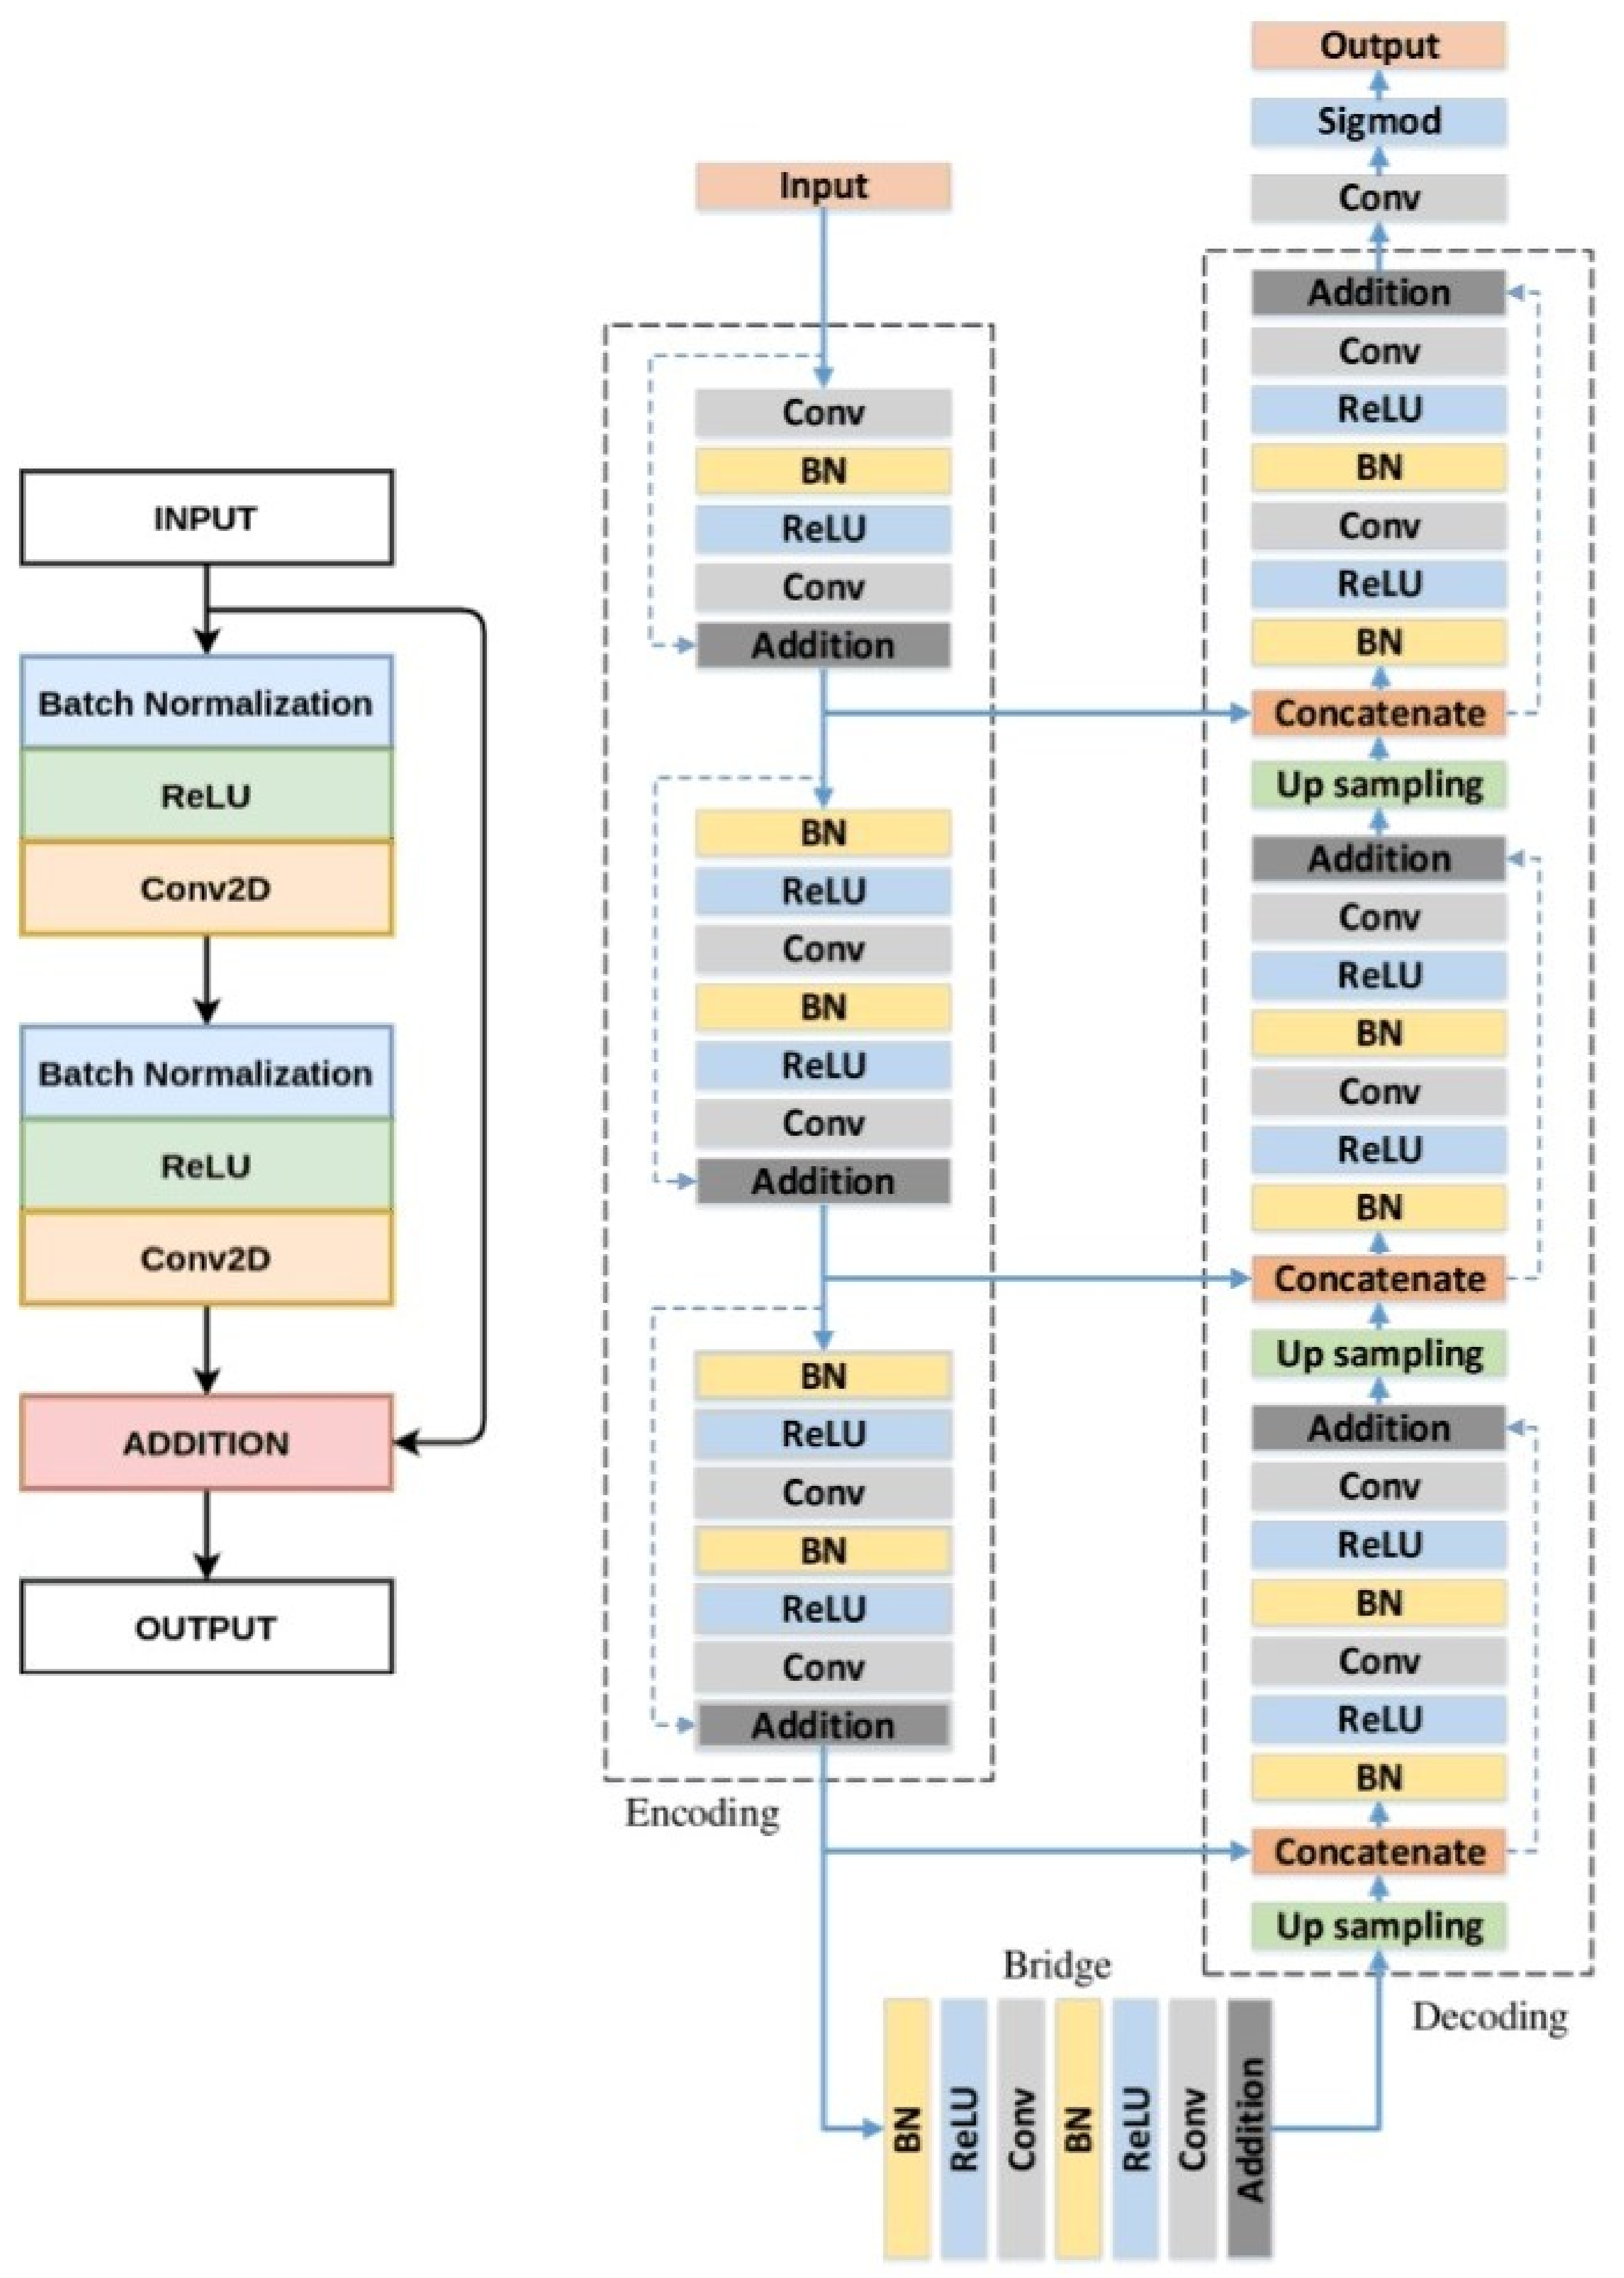
3.5. ResU-Net Architecture for Liver CT Scan Segmentation

A deep residual U-Net is called the ResU-NET, which is a semantic segmentation encoder-decoder architecture. ResU-Net integrates three-way coding into the encoder-decoder architecture. ResU-Net makes use of both the U-Net and Deep Residual Learning architectures. ResU-Net is a fully convolutional neural network with fewer parameters that aims to achieve excellent performance. It is an improvement over the existing U-Net architecture. The ResU-Net consists of an encoding network, decoding network and a bridge connecting these networks. Like U-Net, the ResU-Net has a gateway, an encoding connection, and a decoding system connecting these networks. The U-Net employs two 3 × 3 convolutions, each with a ReLU activation function. In the case of ResU-NET, these layers are substituted by a residual block that has been pre-activated, as shown in Figure 6. Similarly, the ResU-NET has an encoding network, a decoding network, and a bridge that connects these networks. The U-Net employs two 3 × 3 convolutions, each with a ReLU activation function. In the case of ResU-NET, these layers are substituted by a residual block that has already been activated.

3.6. Loss Function

In this work, the weighted cross-entropy (WCE) loss function is selected for the CNNs because it helps the network to better differentiate between the background and liver pixels and is especially handy when there is class imbalance. The WCE loss function penalizes each class based on the median frequency of each class, which is formulated as follows [31].
W C E = 1 n i = 1 n W c , i T i log P i + ( 1 T i ) log ( 1 P i ) ,
where the sum is run over all training images, n. The variable P i is the predicted segmentation class, T i is the target or the ground truth segmentation label and W c , i is the class weight calculated from Equation (2).

3.7. Evaluation Metric

Dice similarity coefficient, accuracy, precision, specificity,and volume overlap error values are used to evaluate the results of liver and tumor segmentation.

3.7.1. Dice Similarity Coefficient ( D S C )

The dice similarity coefficient (DSC), which evaluates the overlapped results from two independent regions [32,33], was used to examine the liver or liver tumor segmentation of CT scan images. If true positive T P is real positive, F P for false positive, and F N for negative result, the D S C can be represents as,
D S C = | 2 T P | | 2 T P | + | F P | + | F N | ,

3.7.2. Accuracy

It measures how many positive and negative observations are correctly classified.
A c c u r a c y = ( T P + T N ) / ( T P + T N + F P + F N )

3.7.3. Specificity

Specificity measures the rate of liver normal tissue.
A c c u r a c y = T N / ( T N + F P )

3.7.4. Precision

Precision predicts the the liver tumor tissue.
A c c u r a c y = T P / ( T P + F P )

3.7.5. Relative Volume Difference (RVD)

R V D represents the volume difference between the segmented image and the ground truth.
R V D ( A , B ) = | B | | A | / | B |

3.7.6. Volume Overlap Error ( V O E )

The V O E can be calculated by subtracting the Jaccard coefficient from the value of a unit based on the dissimilarities between the two volumes [34].
V O E = 100 ( 1 | 2 T P | | 2 T P | + | F P | + | F N | )
where |T| and |P| are the number of elements in the target and prediction sets, respectively.

4. Result and Discussion

4.1. Experimental Set-Up

The code for training and testing the ResU-Net model is developed on python 3.9.1, i7 @ 2.25 GHz 16 core CPU with Ubuntu 20.04 LTC and 18.04 LTS operating system. During the training, the network weight is updated by Adam optimizer [35] with a learning rate selected at 0.0001 and a minibatch size equal to 16. Training of ResU-Net is performed over NVIDIA Tesla T4 GPU Colab powered by Google using TensorFlow and Keras deep learning libraries. The proposed method was tested and validated over synthetic and real-world images.

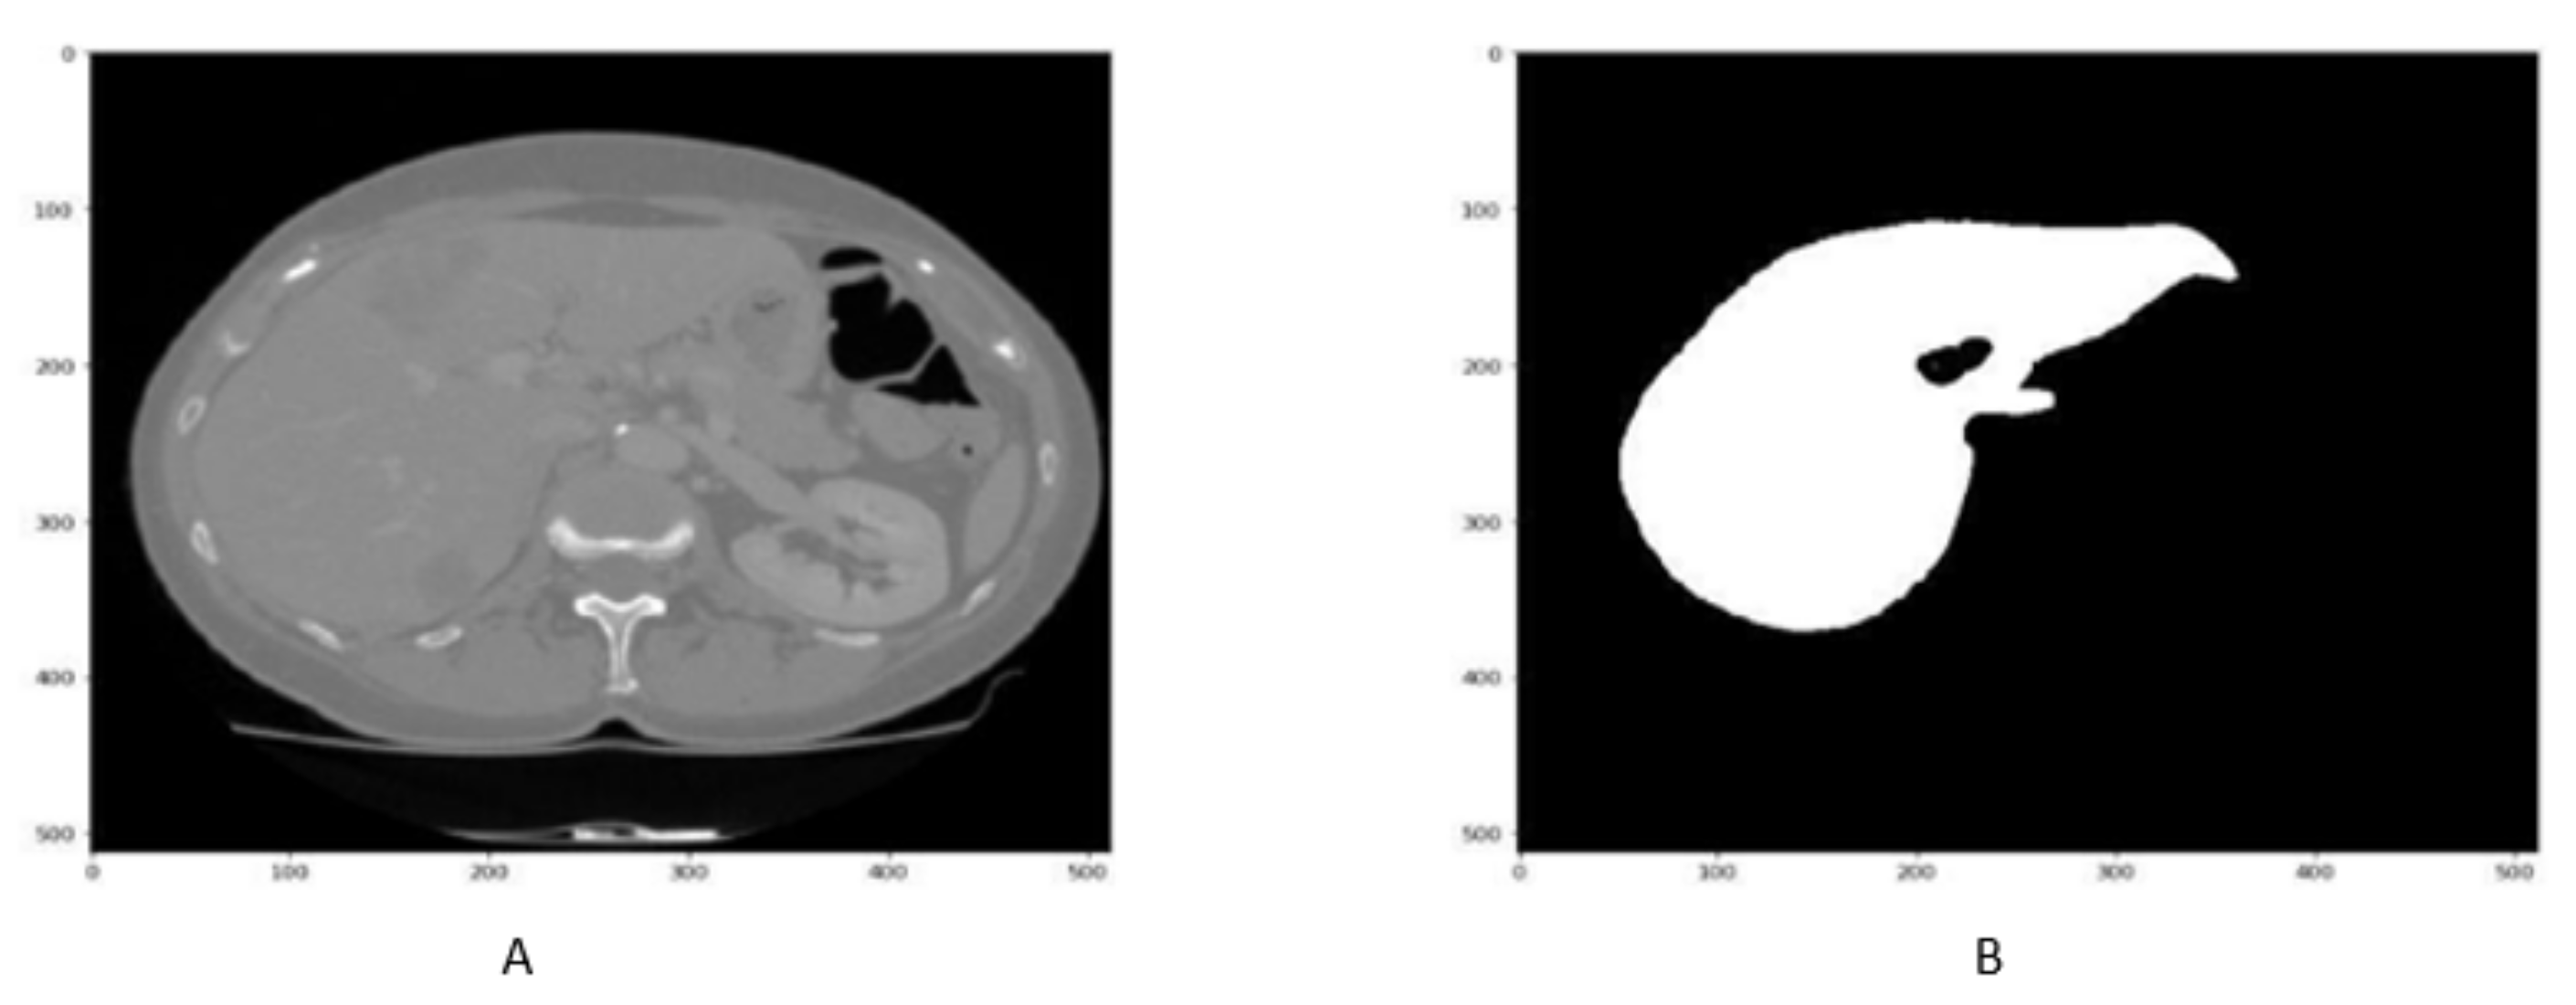
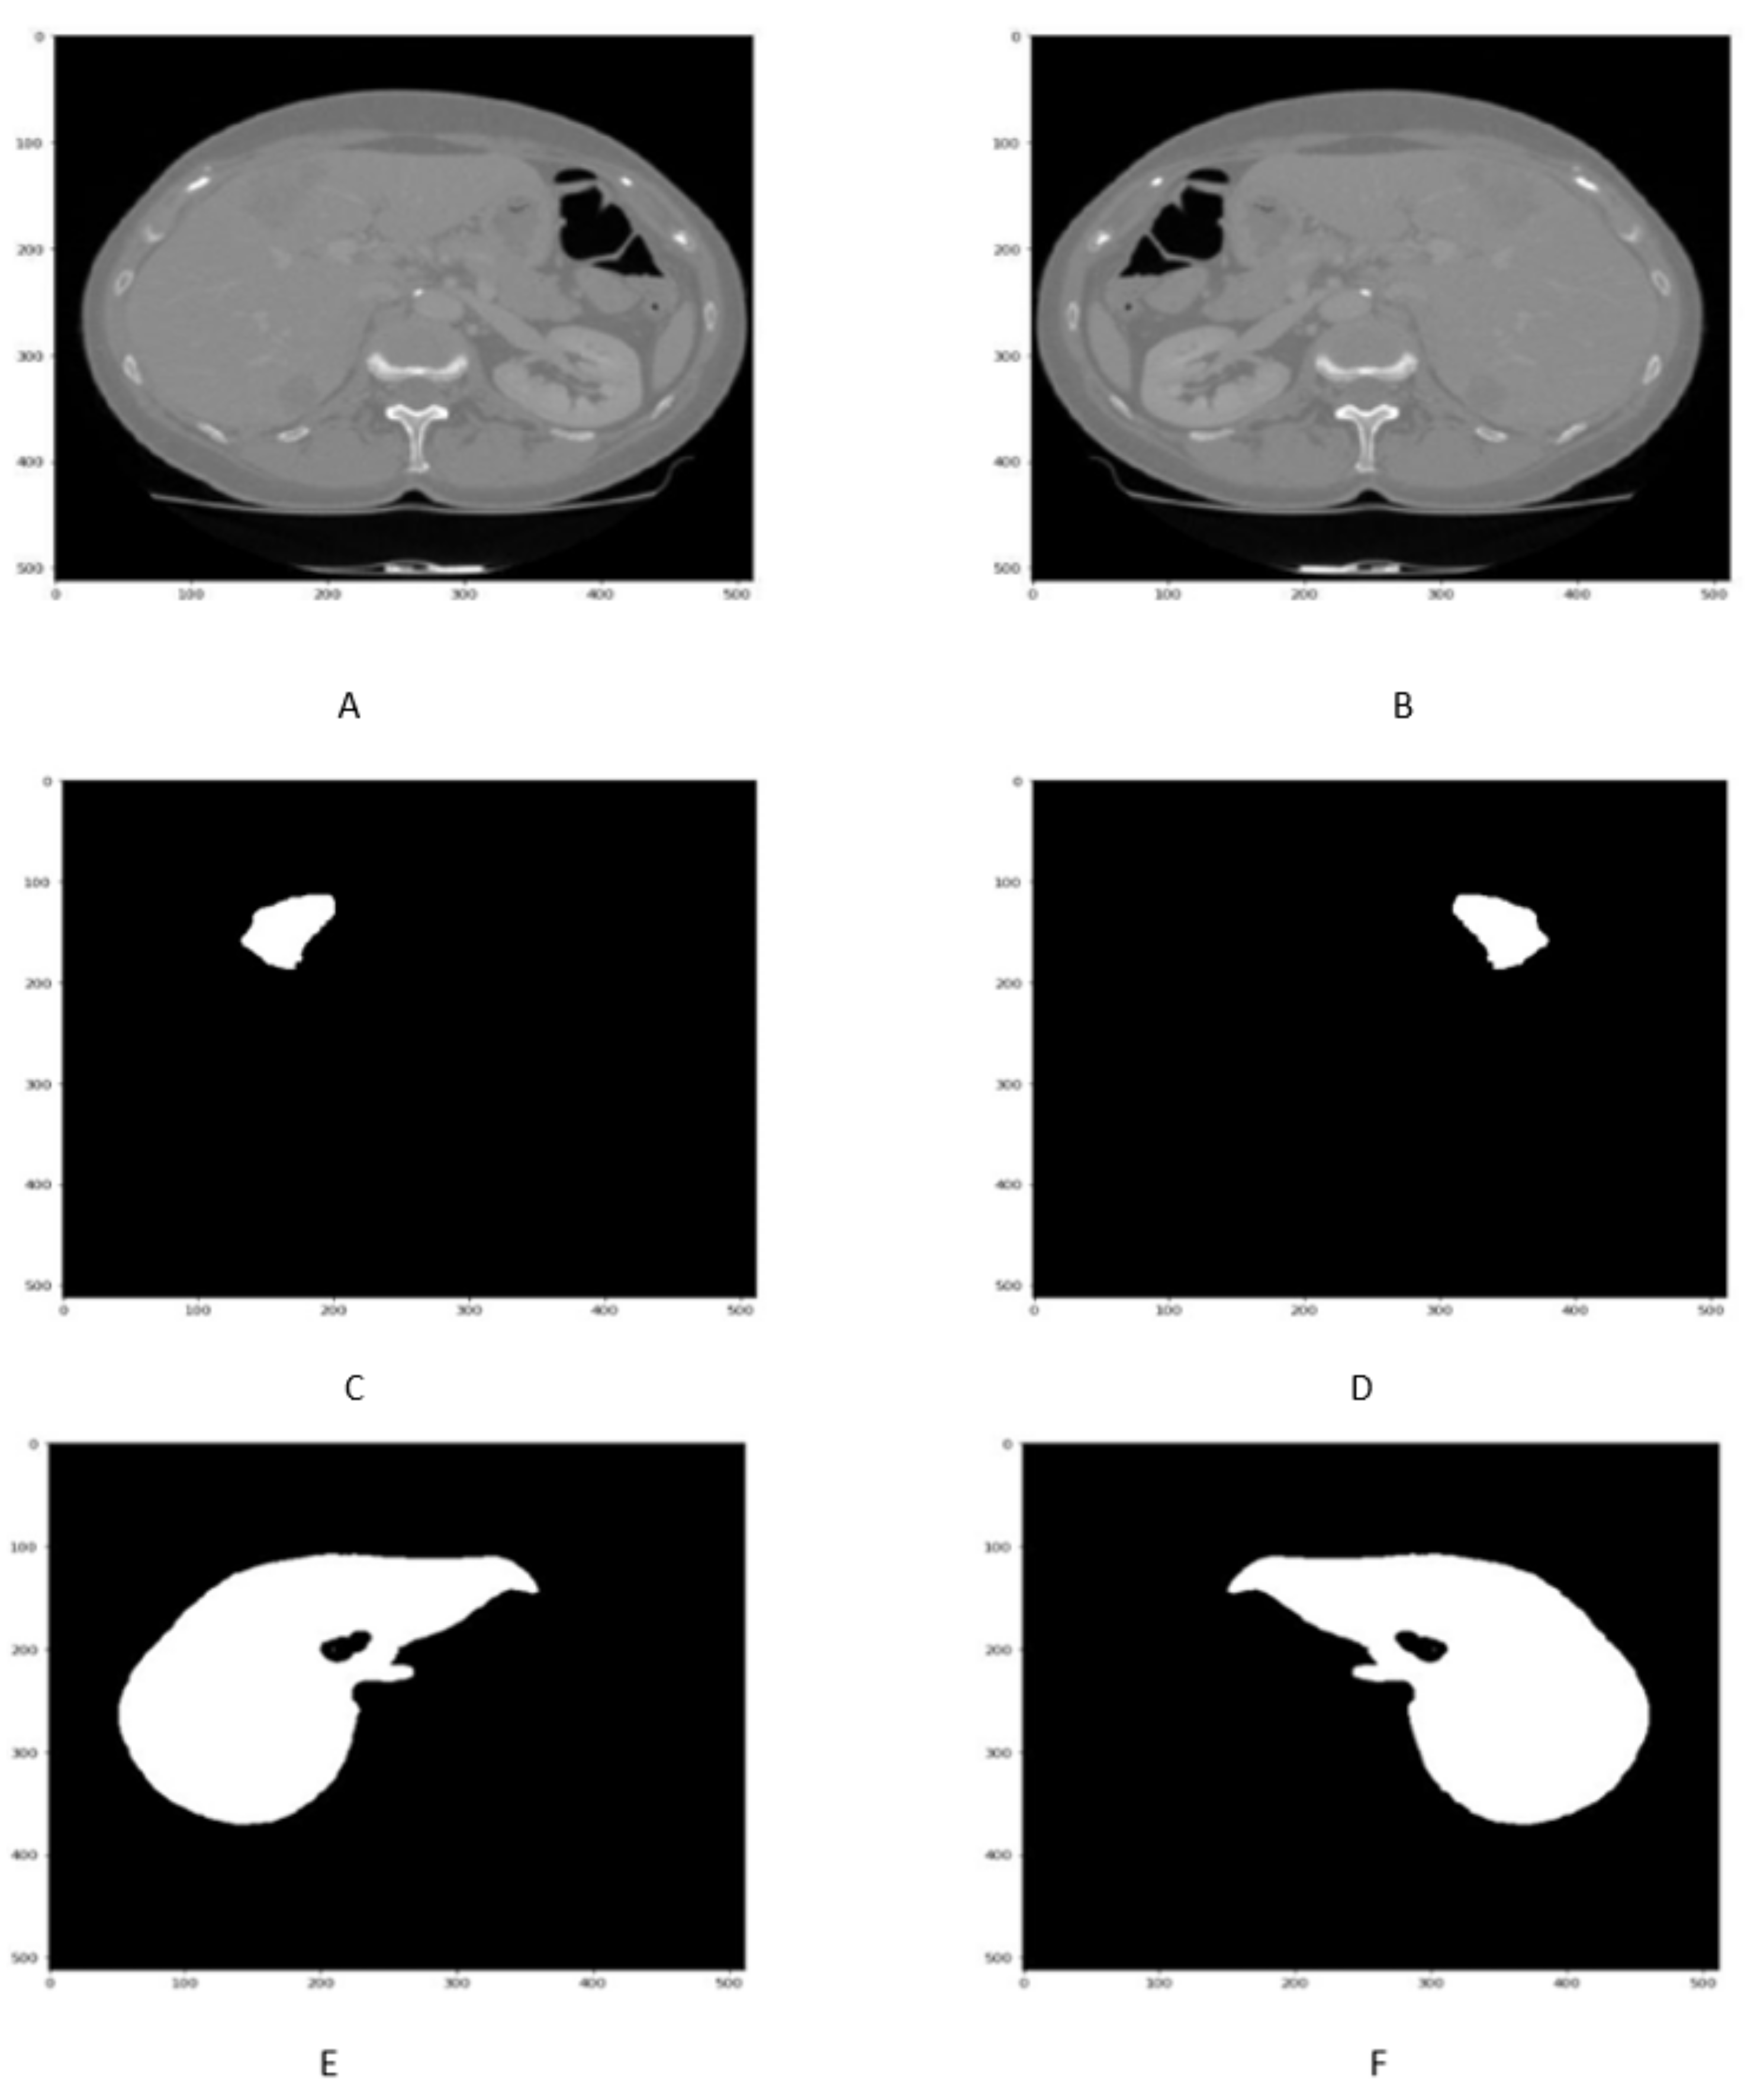
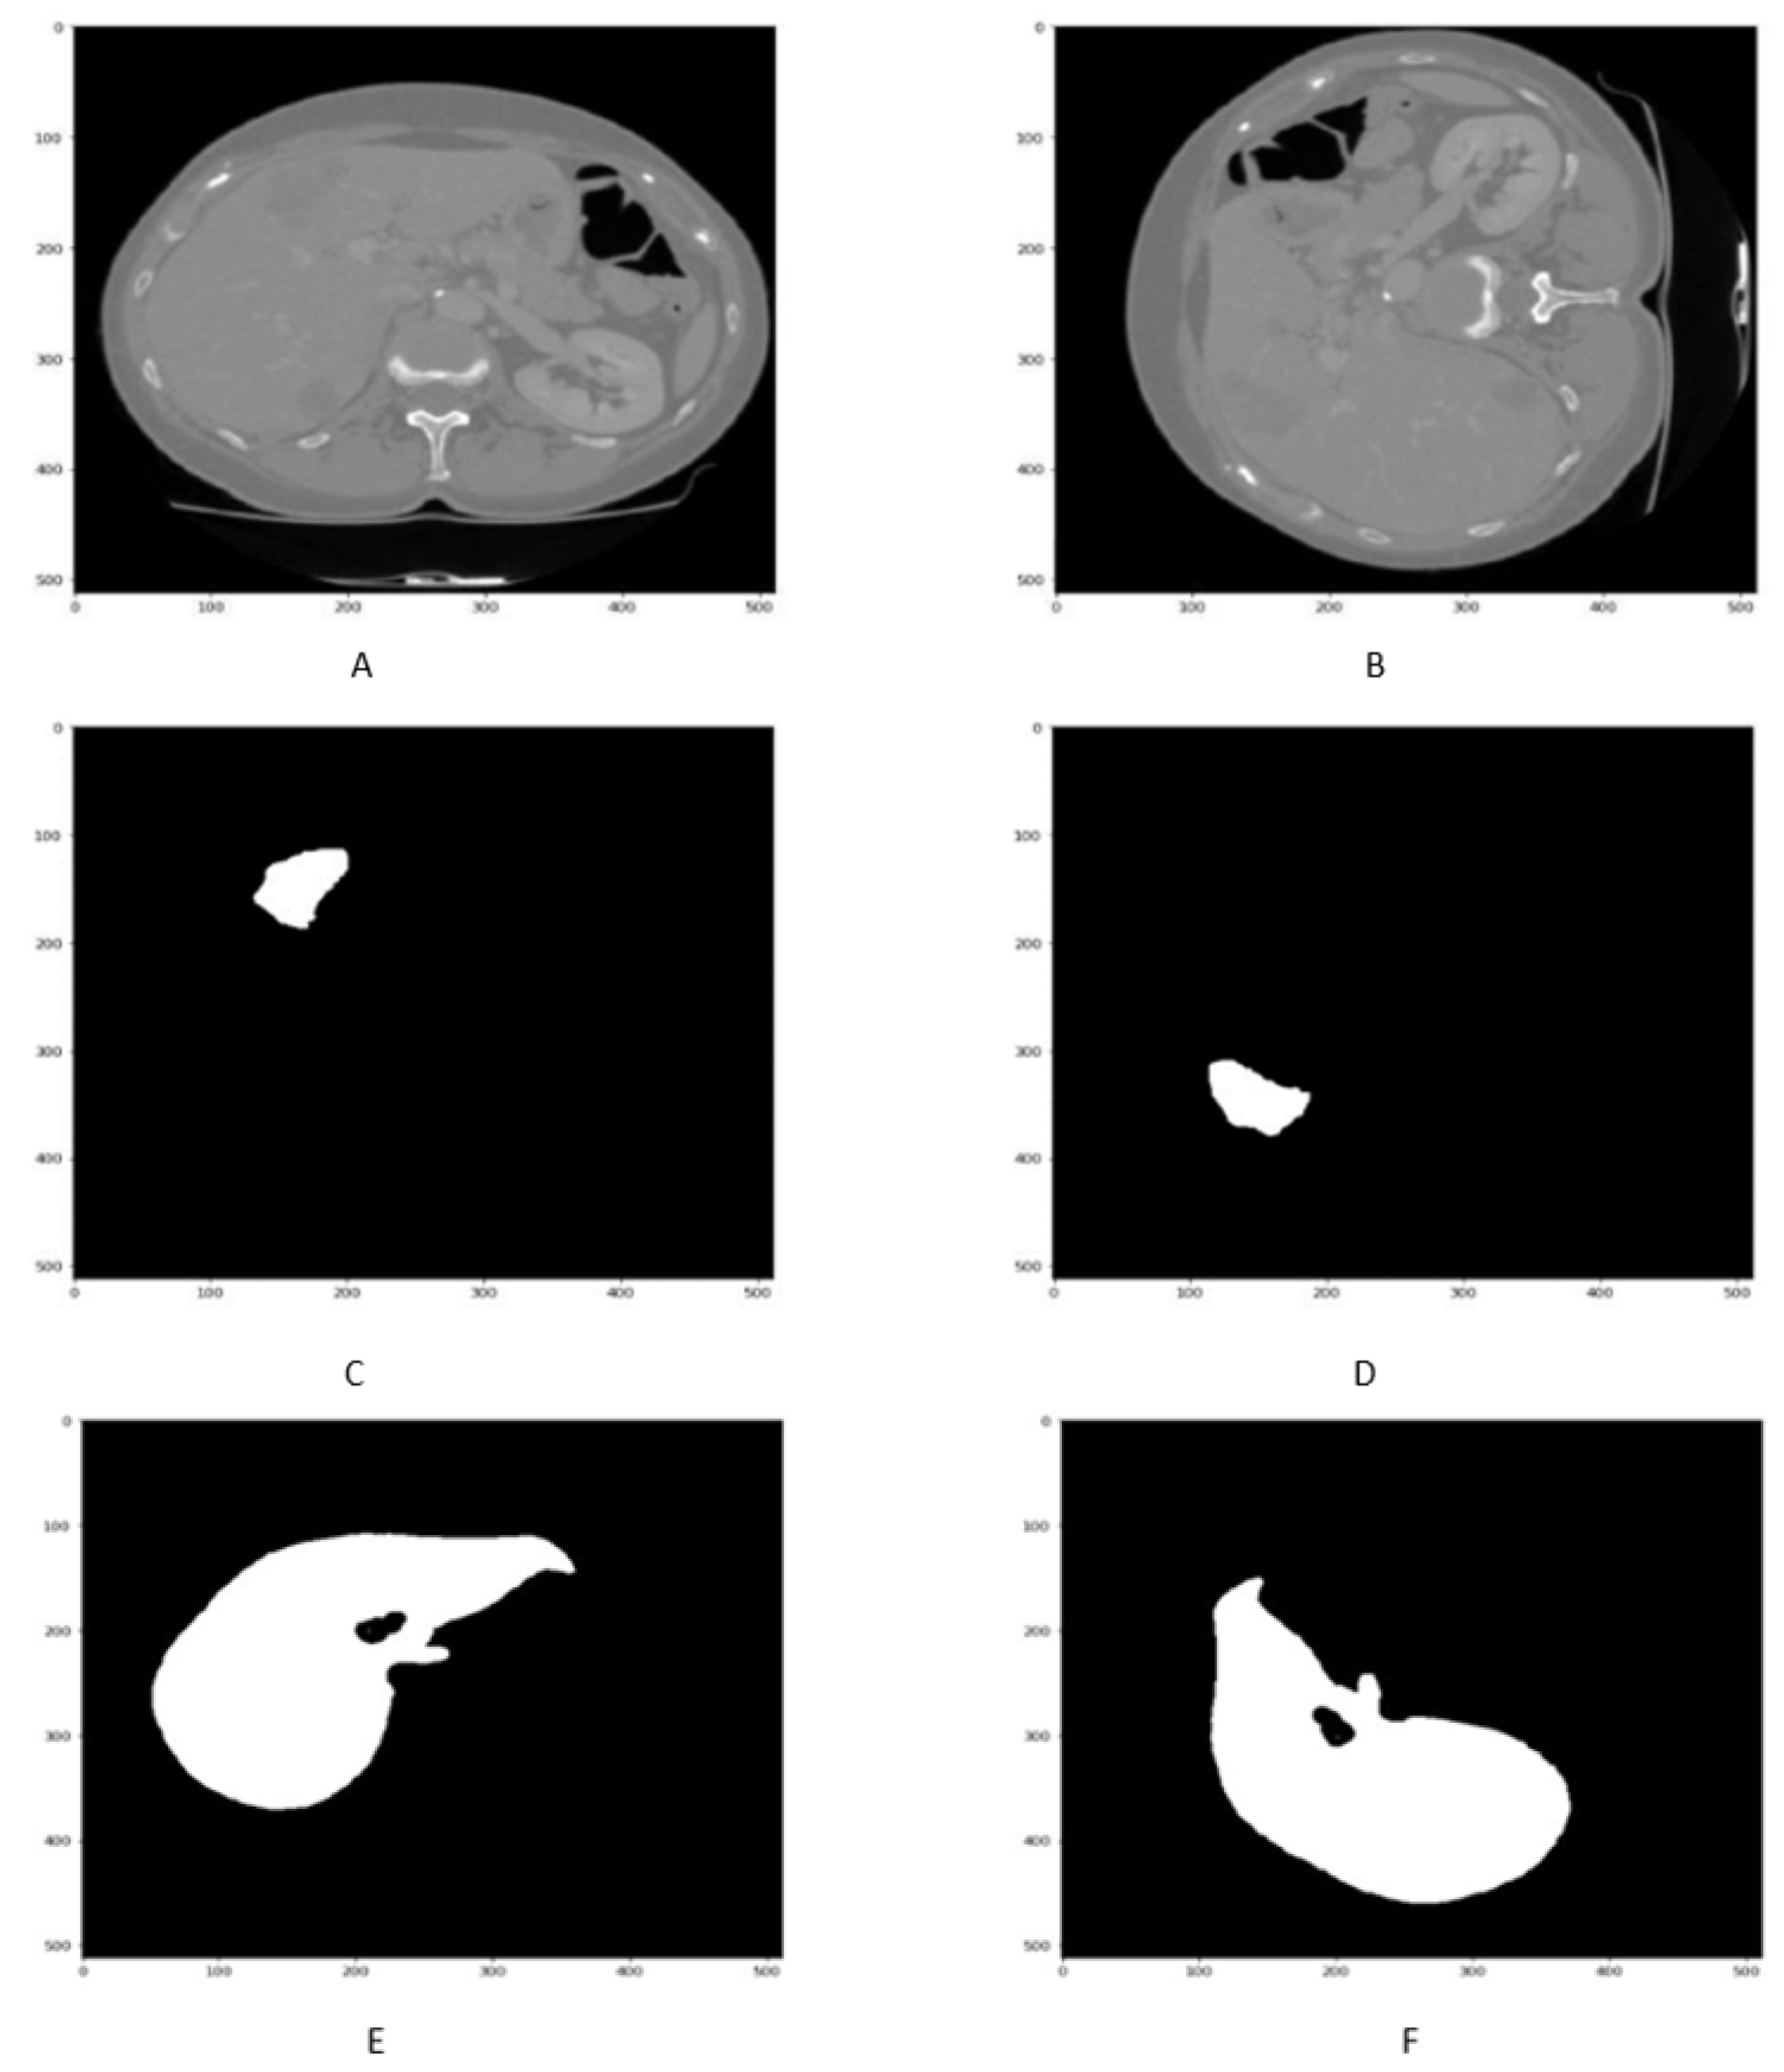
4.2. Liver Segmentation Results

The qualitative and quantitative result of liver CT scan segmentation is shown in Figure 7 and in Table 2. The proposed technique has been obtained regarding liver segmentation as assessed by DSC, accuracy, precision, specificity VOE, and RVD values. The Figure 7A,B and Table 2 highlight the better performance of proposed approach.

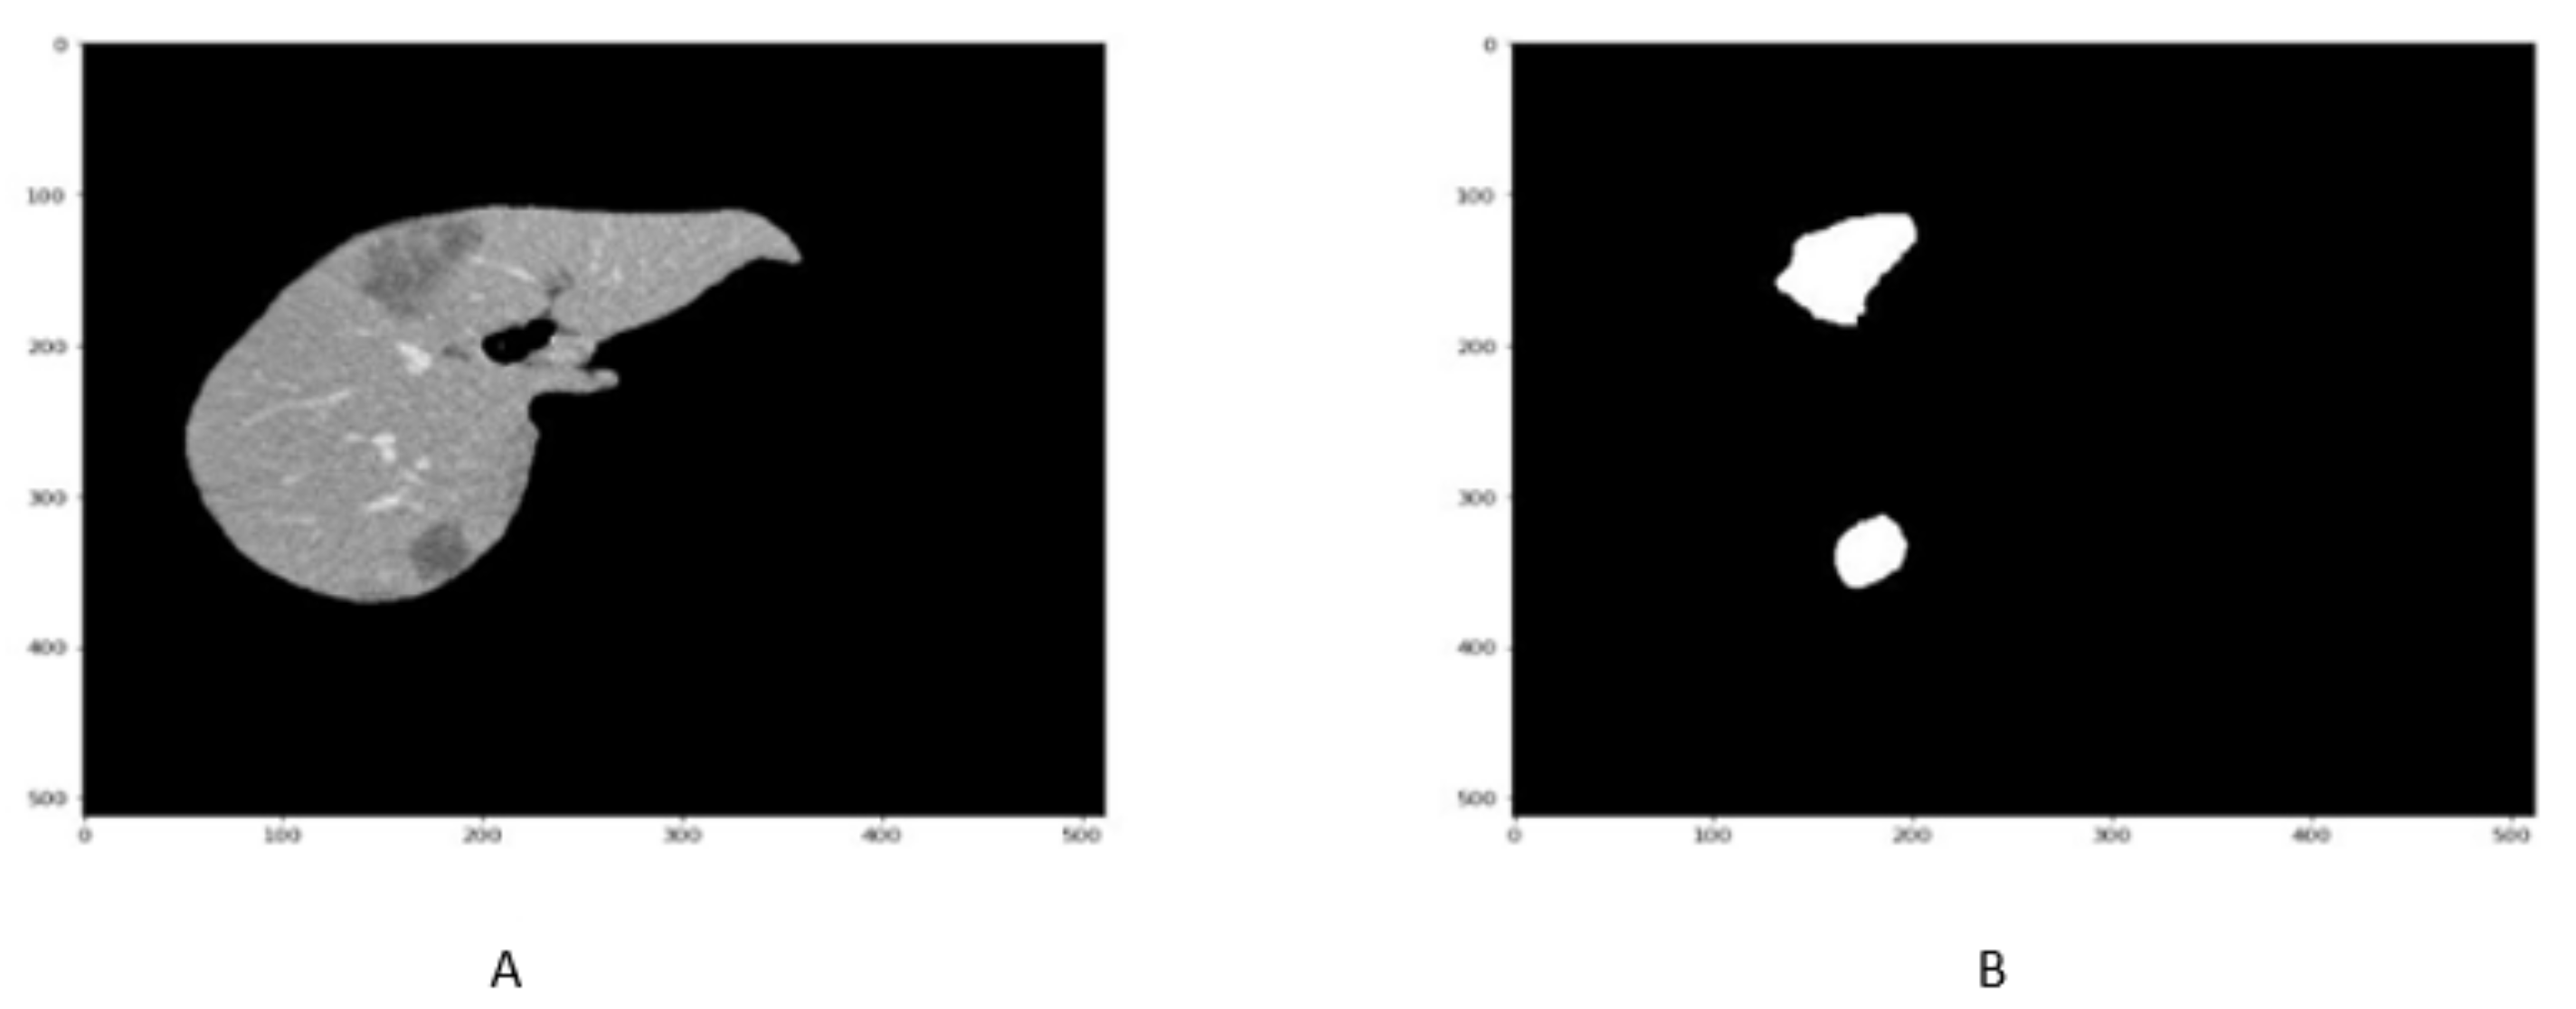
4.3. Tumor Segmentation Results

The qualitative and quantitative result of liver Tumor CT scan segmentation is shown in Figure 8 and in Table 3. The proposed technique has been obtained in terms of liver segmentation as assessed by DSC, accuracy, precision, specificity VOE, and RVD values. The Figure 8A,B and Table 3 highlight the better performance of proposed approach.

4.4. Comparative Analysis

This article segments liver and liver tumor CT scans using ResU-Net. The localization results demonstrate that the proposed method more accurately localized the very minute liver tumor. The Liver CT scan segmentation is quantitatively evaluated in terms of DSC, accuracy, precision, specificity, VOE, and RVD values averaged over all test images. Due to differences in the dataset, scan processes, and image quantities, performance-based evaluation of the ResU-Net network consisting of DSC, accuracy, precision, specificity VOE, and RVD scores for Liver and tumor detection with some other methods. To evaluate the method, we compare our results with other state-of-art methods. Table 4 and Table 5 show rough comparability with various state-of-art segmentation methods. The comparison results show that our method gives the best DSC, accuracy, precision, recall, specificity VOE, and RVD scores.

4.4.1. Segmentation of Liver

Table 4 highlight the overall comparison of our network with the state-of-art techniques. Christ et al. [31] utilized spiralled convolutionary neural networks and proposed a method for autonomously segmenting liver and tumors in CT and MRI abdomen scans (CFCNs). During training, the spiralled FCN will divide the hepatic as an ROI, then tumors inside the expected liver ROIs. For the hepatic and liver tumor, the spiralled FCN produced DSC values of 0.943 and 0.56, respectively. Rafiei at al. [36] developed a unique 3D to 2D fully convolutional network (3D-2D-FCN) to improve liver segment. The dice score for the 3D-2D-FCN system was 0.935. Moreover, Li et al. [14] applied CNN to liver segmentation and obtained a DSC score of 0.80. Qiangguo Jin et al. [24] implemented 3D hybrid residual attention-aware (RA-UNet) and obtained a DSC score of 0.971 for liver segmentation. Sultan Almotairi et al. [26] utilized the SegNet network for segmentation of Liver CT scan and obtained an accuracy of 0.988. Yodit Abebe Ayalew et al. [25] introduced a modified U-Net to segment the liver CT scan and obtained DSC scores of 0.961 for liver segmentation.

4.4.2. Segmentation of Liver Tumor

The tumor is separated from the segmented liver in our method. If no liver is in any slice of CT volume, then that slice will not account for the further procedure in tumor segmentation. The comparison of the proposed method with state-of-art techniques is highlighted in Table 5. Christ et al. [13] utilized FCN to segment liver and tumors in CT and MRI abdomen scans (CFCNs). The spiralled FCN produced VOE values of 0.823. The model proposed by Han et al. [37] operate in a 2.5D context, in which the deep learning model based on the DCNN technique yielded a DSC of 0.67. Wu et al. [38] suggested an automated technique for liver tumor delineation in CT volumes based on adaptive fuzzy C-means (FCM) and graph cuts, which resulted in a DSC of 0.83. Sun et al. [39] used a multi-channel convolutionary network (MC-FCN) to separate liver tumors from a CT scan and achieved a VOE of 15.6. Qiangguo Jin et al. [24] implemented 3D hybrid residual attention-aware (RA-UNet) and obtained DSC score of 0.59 for liver tumor segmentation. Yodit Abebe Ayalew et al. [25] introduced a modified U-Net to segment the liver CT scan and obtained DSC scores of 0.74 for liver tumor segmentation. Our method demonstrated high extension and generalization abilities in another tumor segmentation dataset and achieved competitive performance in the liver tumor challenge. The ResU-Net and recurrent neural block performed better segmentation of the hepatic and liver tumour. The U-Net network collects more data with recurrent neural blocks, allowing for a better liver CT scan segment than other state-of-the-art studies. The proposed model has great potential for application to other modalities of medical images. Additionally, it may assist surgeons in finding treatments for novel tumors.

5. Conclusions

In this work, we utilized the ResU-Net model to automatically segment the liver and its tumors into pixels from the liver CT scan images. The proposed technique is one of the best techniques that can be used in the segmentation of the liver and its tumors. It can also be used even though this technique can enhance the result for other research work related to tumors like lung and brain tumors, etc. Researchers are working on a performance-based study of various networks specifically employed for liver and tumours. A wide range of data sets can be counted and used extensively by testing and implementing this approach and enhancing the result time by time. The proposed ResU-Net network in this study outperforms state-of-the-art techniques in the liver and its tumor segmentation.

Future Work

The deep learning-based techniques can improve performance when using large numbers of liver datasets. Additionally, data preparation techniques such as the generative adversarial network (GAN) can be utilised to increase the size of liver images. Although the ResU-Net demonstrated promising results, the authors should try alternative deep learning-based networks in the future to see if they can increase performance further.

Author Contributions

M.W.S. and Z.K. devised the project, the main conceptual ideas, and the proof outline, as well as planned and supervised the work; M.W.S. and Z.K. contributed to data preprocessing, investigation, training, tested the algorithm, and wrote the original manuscript; N.M.S. worked on the manuscript to further improve the outline, technical details and result analysis. M.W.S., Z.K., N.M.S., K.P., S.S.A.A. and A.Q. contributed to the design and implementation of the research, to the analysis of the results; M.A.A.-K., D.M.K., A.Q. and S.S.A.A. reviewed the manuscript and provided valuable suggestions to further refine the manuscript. All authors have read and agreed to the published version of the manuscript.

Funding

This research is supported by YUTP-FRG funded by PRF under Grant YUTP 015LC0-235.

Institutional Review Board Statement

Not Applicable.

Informed Consent Statement

Not Applicable.

Data Availability Statement

The datasets used in this work are public and can be found at https://www.ircad.fr/research/data-sets/.

Acknowledgments

This work received funding from the YUTP-FRG by PRF under Grant number YUTP 015LC0-235.

Conflicts of Interest

The authors declare no conflict of interest.

References

  1. Torre, L.A.; Bray, F.; Siegel, R.L.; Ferlay, J.; Lortet-Tieulent, J.; Jemal, A. Global cancer statistics, 2012. CA A Cancer J. Clin. 2015, 65, 87–108. [Google Scholar] [CrossRef] [PubMed]
  2. Bray, F.; Ferlay, J.; Soerjomataram, I.; Siegel, R.L.; Torre, L.A.; Jemal, A. Global cancer statistics 2018: GLOBOCAN estimates of incidence and mortality worldwide for 36 cancers in 185 countries. CA A Cancer J. Clin. 2018, 68, 394–424. [Google Scholar] [CrossRef] [PubMed]
  3. Bilic, P.; Christ, P.F.; Vorontsov, E.; Chlebus, G.; Chen, H.; Dou, Q.; Fu, C.W.; Han, X.; Heng, P.A.; Hesser, J.; et al. The liver tumor segmentation benchmark (lits). arXiv 2019, arXiv:1901.04056. [Google Scholar]
  4. Lee, H.; Kim, M.; Do, S. Practical window setting optimization for medical image deep learning. arXiv 2018, arXiv:1812.00572. [Google Scholar]
  5. Li, D.; Liu, L.; Chen, J.; Li, H.; Yin, Y. A multistep liver segmentation strategy by combining level set based method with texture analysis for CT images. In Proceedings of the 2014 International Conference on Orange Technologies, Xi’an, China, 20–23 September 2014; IEEE: Piscataway, NJ, USA, 2014; pp. 109–112. [Google Scholar]
  6. Xu, Z.; Burke, R.P.; Lee, C.P.; Baucom, R.B.; Poulose, B.K.; Abramson, R.G.; Landman, B.A. Efficient multi-atlas abdominal segmentation on clinically acquired CT with SIMPLE context learning. Med. Image Anal. 2015, 24, 18–27. [Google Scholar] [CrossRef]
  7. Song, X.; Cheng, M.; Wang, B.; Huang, S.; Huang, X.; Yang, J. Adaptive fast marching method for automatic liver segmentation from CT images. Med. Phys. 2013, 40, 091917. [Google Scholar] [CrossRef]
  8. Maklad, A.S.; Matsuhiro, M.; Suzuki, H.; Kawata, Y.; Niki, N.; Satake, M.; Moriyama, N.; Utsunomiya, T.; Shimada, M. Blood vessel-based liver segmentation using the portal phase of an abdominal CT dataset. Med. Phys. 2013, 40, 113501. [Google Scholar] [CrossRef]
  9. Peng, J.; Dong, F.; Chen, Y.; Kong, D. A region-appearance-based adaptive variational model for 3D liver segmentation. Med. Phys. 2014, 41, 043502. [Google Scholar] [CrossRef]
  10. Krizhevsky, A.; Sutskever, I.; Hinton, G.E. Imagenet classification with deep convolutional neural networks. Adv. Neural Inf. Process. Syst. 2012, 25. [Google Scholar] [CrossRef]
  11. Khan, Z.; Yahya, N.; Alsaih, K.; Al-Hiyali, M.I.; Meriaudeau, F. Recent Automatic Segmentation Algorithms of MRI Prostate Regions: A Review. IEEE Access 2021, 9, 97878–97905. [Google Scholar] [CrossRef]
  12. Zhou, T.; Li, L.; Bredell, G.; Li, J.; Konukoglu, E. Quality-aware memory network for interactive volumetric image segmentation. In Proceedings of the International Conference on Medical Image Computing and Computer-Assisted Intervention, Strasbourg, France, 27 September–1 October 2021; Springer: Berlin/Heidelberg, Germany, 2021; pp. 560–570. [Google Scholar]
  13. Christ, P.F.; Ettlinger, F.; Grün, F.; Elshaera, M.E.A.; Lipkova, J.; Schlecht, S.; Ahmaddy, F.; Tatavarty, S.; Bickel, M.; Bilic, P.; et al. Automatic liver and tumor segmentation of CT and MRI volumes using cascaded fully convolutional neural networks. arXiv 2017, arXiv:1702.05970. [Google Scholar]
  14. Li, W.; Jia, F.; Hu, Q. Automatic segmentation of liver tumor in CT images with deep convolutional neural networks. J. Comput. Commun. 2015, 3, 146. [Google Scholar] [CrossRef]
  15. Hu, P.; Wu, F.; Peng, J.; Liang, P.; Kong, D. Automatic 3D liver segmentation based on deep learning and globally optimized surface evolution. Phys. Med. Biol. 2016, 61, 8676. [Google Scholar] [CrossRef] [PubMed]
  16. Li, X.; Chen, H.; Qi, X.; Dou, Q.; Fu, C.W.; Heng, P.A. H-DenseUNet: Hybrid densely connected UNet for liver and tumor segmentation from CT volumes. IEEE Trans. Med. Imaging 2018, 37, 2663–2674. [Google Scholar] [CrossRef]
  17. Jiang, H.; Shi, T.; Bai, Z.; Huang, L. Ahcnet: An application of attention mechanism and hybrid connection for liver tumor segmentation in ct volumes. IEEE Access 2019, 7, 24898–24909. [Google Scholar] [CrossRef]
  18. Chen, Y.; Wang, K.; Liao, X.; Qian, Y.; Wang, Q.; Yuan, Z.; Heng, P.A. Channel-Unet: A spatial channel-wise convolutional neural network for liver and tumors segmentation. Front. Genet. 2019, 10, 1110. [Google Scholar] [CrossRef]
  19. Ronneberger, O.; Fischer, P.; Brox, T. U-net: Convolutional networks for biomedical image segmentation. In Proceedings of the International Conference on Medical Image Computing and Computer-Assisted Intervention, Munich, Germany, 5–9 October 2015; Springer: Berlin/Heidelberg, Germany, 2015; pp. 234–241. [Google Scholar]
  20. Xiong, H.; Liu, S.; Sharan, R.V.; Coiera, E.; Berkovsky, S. Weak label based Bayesian U-Net for optic disc segmentation in fundus images. Artif. Intell. Med. 2022, 126, 102261. [Google Scholar] [CrossRef]
  21. Karthik, R.; Radhakrishnan, M.; Rajalakshmi, R.; Raymann, J. Delineation of ischemic lesion from brain MRI using attention gated fully convolutional network. Biomed. Eng. Lett. 2021, 11, 3–13. [Google Scholar] [CrossRef]
  22. Manjunath, R.; Kwadiki, K. Automatic liver and tumour segmentation from CT images using Deep learning algorithm. Results Control Optim. 2022, 6, 100087. [Google Scholar] [CrossRef]
  23. Amin, J.; Anjum, M.A.; Sharif, M.; Kadry, S.; Nadeem, A.; Ahmad, S.F. Liver Tumor Localization Based on YOLOv3 and 3D-Semantic Segmentation Using Deep Neural Networks. Diagnostics 2022, 12, 823. [Google Scholar] [CrossRef]
  24. Jin, Q.; Meng, Z.; Sun, C.; Cui, H.; Su, R. RA-UNet: A hybrid deep attention-aware network to extract liver and tumor in CT scans. Front. Bioeng. Biotechnol. 2020, 1471. [Google Scholar] [CrossRef]
  25. Ayalew, Y.A.; Fante, K.A.; Mohammed, M.A. Modified U-Net for liver cancer segmentation from computed tomography images with a new class balancing method. BMC Biomed. Eng. 2021, 3, 4. [Google Scholar] [CrossRef]
  26. Almotairi, S.; Kareem, G.; Aouf, M.; Almutairi, B.; Salem, M.A.M. Liver tumor segmentation in CT scans using modified SegNet. Sensors 2020, 20, 1516. [Google Scholar] [CrossRef] [Green Version]
  27. Soler, L.; Hostettler, A.; Agnus, V.; Charnoz, A.; Fasquel, J.; Moreau, J.; Osswald, A.; Bouhadjar, M.; Marescaux, J. 3D Image Reconstruction for Comparison of Algorithm Database: A Patient-Specific Anatomical and Medical Image Database; IRCAD: Strasbourg, France, 2010. [Google Scholar]
  28. Goshtasby, A.; Satter, M. An adaptive window mechanism for image smoothing. Comput. Vis. Image Underst. 2008, 111, 155–169. [Google Scholar] [CrossRef]
  29. Khalifa, N.E.; Loey, M.; Mirjalili, S. A comprehensive survey of recent trends in deep learning for digital images augmentation. Artif. Intell. Rev. 2021, 55, 2351–2377. [Google Scholar] [CrossRef]
  30. Zhou, X.Y.; Yang, G.Z. Normalization in training U-Net for 2-D biomedical semantic segmentation. IEEE Robot. Autom. Lett. 2019, 4, 1792–1799. [Google Scholar] [CrossRef]
  31. Christ, P.F.; Elshaer, M.E.A.; Ettlinger, F.; Tatavarty, S.; Bickel, M.; Bilic, P.; Rempfler, M.; Armbruster, M.; Hofmann, F.; D’Anastasi, M.; et al. Automatic liver and lesion segmentation in CT using cascaded fully convolutional neural networks and 3D conditional random fields. In Proceedings of the International Conference on Medical Image Computing and Computer-Assisted Intervention, Athens, Greece, 17–21 October 2016; Springer: Berlin/Heidelberg, Germany, 2016; pp. 415–423. [Google Scholar]
  32. Litjens, G.; Toth, R.; van de Ven, W.; Hoeks, C.; Kerkstra, S.; van Ginneken, B.; Vincent, G.; Guillard, G.; Birbeck, N.; Zhang, J.; et al. Evaluation of prostate segmentation algorithms for MRI: The PROMISE12 challenge. Med. Image Anal. 2014, 18, 359–373. [Google Scholar] [CrossRef]
  33. Khan, Z.; Yahya, N.; Alsaih, K.; Meriaudeau, F. Zonal segmentation of prostate T2W-MRI using atrous convolutional neural network. In Proceedings of the 2019 IEEE Student Conference on Research and Development (SCOReD), , Bandar Seri Iskandar, Malaysia, 15–17 October 2019; IEEE: Piscataway, NJ, USA, 2019; pp. 95–99. [Google Scholar]
  34. Crum, W.R.; Camara, O.; Hill, D.L. Generalized overlap measures for evaluation and validation in medical image analysis. IEEE Trans. Med. Imaging 2006, 25, 1451–1461. [Google Scholar] [CrossRef]
  35. Kingma, D.P.; Ba, J. Adam: A method for stochastic optimization. arXiv 2014, arXiv:1412.6980. [Google Scholar]
  36. Rafiei, S.; Nasr-Esfahani, E.; Najarian, K.; Karimi, N.; Samavi, S.; Soroushmehr, S.R. Liver segmentation in CT images using three dimensional to two dimensional fully convolutional network. In Proceedings of the 2018 25th IEEE International Conference on Image Processing (ICIP), Athens, Greece, 7–10 October 2018; IEEE: Piscataway, NJ, USA, 2018; pp. 2067–2071. [Google Scholar]
  37. Han, X. Automatic liver lesion segmentation using a deep convolutional neural network method. arXiv 2017, arXiv:1704.07239. [Google Scholar]
  38. Wu, W.; Wu, S.; Zhou, Z.; Zhang, R.; Zhang, Y. 3D liver tumor segmentation in CT images using improved fuzzy C-means and graph cuts. BioMed Res. Int. 2017, 2017, 5207685. [Google Scholar] [CrossRef] [PubMed]
  39. Sun, C.; Guo, S.; Zhang, H.; Li, J.; Chen, M.; Ma, S.; Jin, L.; Liu, X.; Li, X.; Qian, X. Automatic segmentation of liver tumors from multiphase contrast-enhanced CT images based on FCNs. Artif. Intell. Med. 2017, 83, 58–66. [Google Scholar] [CrossRef] [PubMed]
Figure 1. Overview of workflow of liver tumor segmentation.
Applsci 12 08650 g001
Figure 2. Figure represents the HU windoing results in (A,B), While Figures (C,D) shows the HU windowing results not having Liver.
Applsci 12 08650 g002
Figure 3. Figure shows that the CT slice (A,B) before histogram equalization, While CT slice (C,D) after histogram equalization.
Applsci 12 08650 g003
Figure 4. Figure shows that the Liver scan tumor mask before 90 in (A,C,E) While liver scan and tumor mask in (B,D,F) after reflection.
Applsci 12 08650 g004
Figure 5. Figure shows that the liver slice and its masks before 90 in (A,C,E) rotation, While liver scan and its masks mask in (B,D,F) after rotation.
Applsci 12 08650 g005
Figure 6. Illustration of ResU-Net architecture.
Applsci 12 08650 g006
Figure 7. Figure shows that the samples of Liver segmentation in (A,B).
Applsci 12 08650 g007
Figure 8. Figure shows that the samples of Liver Tumor segmentation in (A,B).
Applsci 12 08650 g008
Table 1. Hounsfield unit values define for body organ.
HU Value for Body Organ
Bone1000
Liver40 to 60
White Matter46
Grey Matter43
Blood40
Muscle10 to 40
Kidney30
Cerebrospinal15
Water0
Fat−50 to −100
Air−1000
Table 2. ResU-Net model results on liver segmentation.
S.NoEvaluation MetricsResU-Net Network
1DSC0.9781
2Accuracy0.991
3Precision0.982
4Specificity0.961
5VOE0.13
6RVD0.018
Table 3. ResU-Net model results on liver tumor segmentation.
S.NoEvaluation MetricsResU-Net Network
1DSC0.893
2Accuracy0.97
3Precision0.950
4Specificity0.957
5VOE13.15
6RVD7.23
Table 4. Result comparison of ResU-Net based liver segmentation with state-of-art techniques.
ApproachDSCAccuracyPrecisionSpecificityVOERVD
Christ et al. [31]0.94---10.7−1.4
Rafiei et al. [36]0.935---56.47-
Li et al. [14]0.80-0.826-29.04-
Qiangguo Jin et al. [24]0.971---0.0740.002
Sultan Almotairi et al.  [26]-0.988----
Yodit Abebe Ayalew et al. [25]0.9610.993---
Proposed ResU-Net0.97810.9910.9820.96180.130.018
Table 5. Result comparison of ResU-Net based liver tumor segmentation with state-of-art techniques.
ApproachDSCAccuracyPrecisionSpecificityVOERVD
Christ et al. [13]0.823-----
Sun et al. [39]----15.65.8
Wu et al. [38]0.83---29.04−2.20
Qiangguo Jin et al.  [24]0.595---0.380−0.152
Han et al. [37]0.67----0.40
Yodit Abebe Ayalew et al. [25]0.740.995---
Proposed ResU-Net0.8930.970.9500.95713.157.23
Publisher’s Note: MDPI stays neutral with regard to jurisdictional claims in published maps and institutional affiliations.

