1. Introduction
Aquaculture is a major source of marine aquatic products in China and plays an important role in the national economy. However, with the increasing number of aquaculture activities, the problem of unreasonable distribution of cages has become increasingly prominent. The irrational layout and excessive aquaculture densities of aquaculture cages can lead to deterioration of water quality and the breeding of harmful pathogens, thereby damaging the marine ecological environment and the sustainable development of the aquaculture industry.
1.1. Related Work and Motivation
In harbour areas, unplanned high-density farming not only reduces production efficiency but also leads to the deterioration of the marine ecological environment. Therefore, it is important to use remote sensing images to macro-regulate the distribution of cages in the sea [
1]. At present, in the field of mariculture research, most of the studies do not partition the statistics for cages, but the density of marine organisms such as fish bodies cultured in cages. Wu, Leiming et al. [
2] studied the effect of different culture densities in cages on the growth performance, digestive enzyme activity and non-specific immunity of broad-bodied golden leech for broad-bodied golden leech culture. Nong Guangcai [
3] and Dai Yangxin [
4] studied the effect of different culture densities on the growth of tilapia. However, it is not only the culture density of organisms in cages that can affect the normal growth of fish but also the excessive density of cages in the sea area. Therefore, we need to regulate the distribution of culture cages at a macro level to ensure that their distribution is reasonable.
In the field of remote sensing image segmentation, Chen Yansheng et al. [
5] proposed an autonomous improved convolutional neural network mU-ResPlus based on U-Net to address the practical problems of fragmented distribution of small crops and a small amount of data. mU-ResPlus firstly reduced the number of layers of the U-Net network, then used multiple deconvolutions to fuse the features of shallow and deep layers of the image, and introduced the residual blocks to achieve the refinement of the network segmentation effect. The experimental results show that the accuracy and Kappa coefficient of mU-ResPlus are 87.4% and 0.747, respectively, which have high application prospects in the research of small crop image segmentation. Yang Xiaoyu et al. [
6] proposed a remote sensing image segmentation network MAE-Net combining multi-scale attention and edge supervision, and the experimental results show that MAE-Net could segment buildings completely from remote sensing images with complex and diverse backgrounds and large-scale changes, and the segmentation accuracy is high. Zhang Bin et al. [
7] improved the DenseASPP network to address the problems of large differences in target scales and blurred boundaries in the semantic segmentation of remote sensing images. The channel attention model and spatial attention model are introduced to give more weight to the key features in the network; the group convolution is used in the sampling of convolution with holes, and the pruning strategy is adopted in the training to discard the connections with lower weights to achieve the sparse network, which effectively overcomes the problem of excessive memory occupation of DenseASPP. Capturing remote dependencies by null convolution or increasing the number of channels would lead to a dimensionality explosion due to the expansion of the model. Yu Chuang et al. [
8,
9,
10] separately used mask R-CNN, Segnet, and U-Net to segment the remote sensing cage images. The above proposed semantic segmentation networks for remote sensing images all use convolutional neural networks, which can effectively extract local information, but lack the ability to extract remote features from global information.
Recently, Transformer-based models have shown prominence in various fields such as natural language processing and computer vision. In computer vision, Vision Transformers [
11] (ViTs) have demonstrated optimal performance in various benchmark tests. Specifically, the self-attention module allows for modelling the interaction between token embedding via pairs of remote messages in ViT-based models, leading to more efficient local and global contextual representations. However, it only uses the self-attention mechanism, resulting in much higher image recognition rates than the models based on CNN. End-to-end object detection (DETR) with the Transformer [
12] first involves using the Transformer in advanced vision, which adds location information to complement image features and feeds them into the Transformer structure to obtain predicted class labels and bounding boxes. However, there is still low detection of small targets and weak local information acquisition. In this paper, image features are extracted using the Swin Transformer [
13] as the backbone network. The Swin Transformer constructs a hierarchical Transformer and performs self-attention calculations within non-overlapping window regions. Rather than performing self-attention computation on the entire set of patch markers, it uses window partitioning as an attention mechanism to apply constraints on the position and allows communication between windows by using a shift configuration. Through the ensemble learning strategy, the feature extraction capabilities of different deep learning network frameworks in different pixel size datasets are integrated to give full play to the advantages of each model. In this way, it can improve the generalization ability of the model, and then improve the overall prediction accuracy.
1.2. Our Contributions
(1) By introducing the method of deep learning, the precise segmentation of the aquaculture cages in a specific aquaculture sea area can be achieved, so as to realize the efficient statistics of the cage culture density and reduce the cost of manual statistics.
(2) To address the problem of lack of mariculture cage dataset, we construct a remote sensing cage image dataset and expand the data of the training set to effectively improve the training effect of the model.
(3) An ensemble learning strategy is used to fuse the feature extraction capabilities of different deep learning network frameworks on different pixel size datasets, thereby improving the generalization capability of the model and the overall prediction accuracy.
1.3. Paper Organization
The rest of this article is organized as follows.
Section 2 introduces the network model, details of the segmentation scheme and the statistical method of breeding density.
Section 3 introduces the experimental results. In
Section 4, we analyze and discuss the experimental results.
Section 5 makes a conclusion and proposes future work.
2. Materials and Methods
2.1. Network Model
This subsection first introduces the basic concepts of semantic segmentation networks and ensemble learning. Subsequently, the basic concepts and working principles of the Swin Transformer are introduced.
2.1.1. Semantic Segmentation Network
Image segmentation entails dividing an image into specific regions with unique properties and extracting targets of interest, which is a key step in the transition from image processing to image analysis. Typically, segmentation can be divided into semantic segmentation, instance segmentation and panoramic segmentation according to its purpose. The technique used in this paper is semantic segmentation, which is the classification and labelling of each pixel point in an image. As the segmentation result in
Figure 1 shows, the cages in the image are labelled. The main task of this paper is to mark the breeding cages in the remote sensing images and calculate the breeding density of the cages through the statistics of the pixel points of the cages through semantic segmentation.
2.1.2. Ensemble Learning
Ensemble learning is a machine learning method that uses a series of base learners and uses some rules to integrate the individual results to achieve better performance than a single learner. The generalization ability of an ensemble approach is usually much stronger than that of a single learner, which makes it very attractive. In practice, two necessary conditions should be met for a good ensemble: accuracy and diversity [
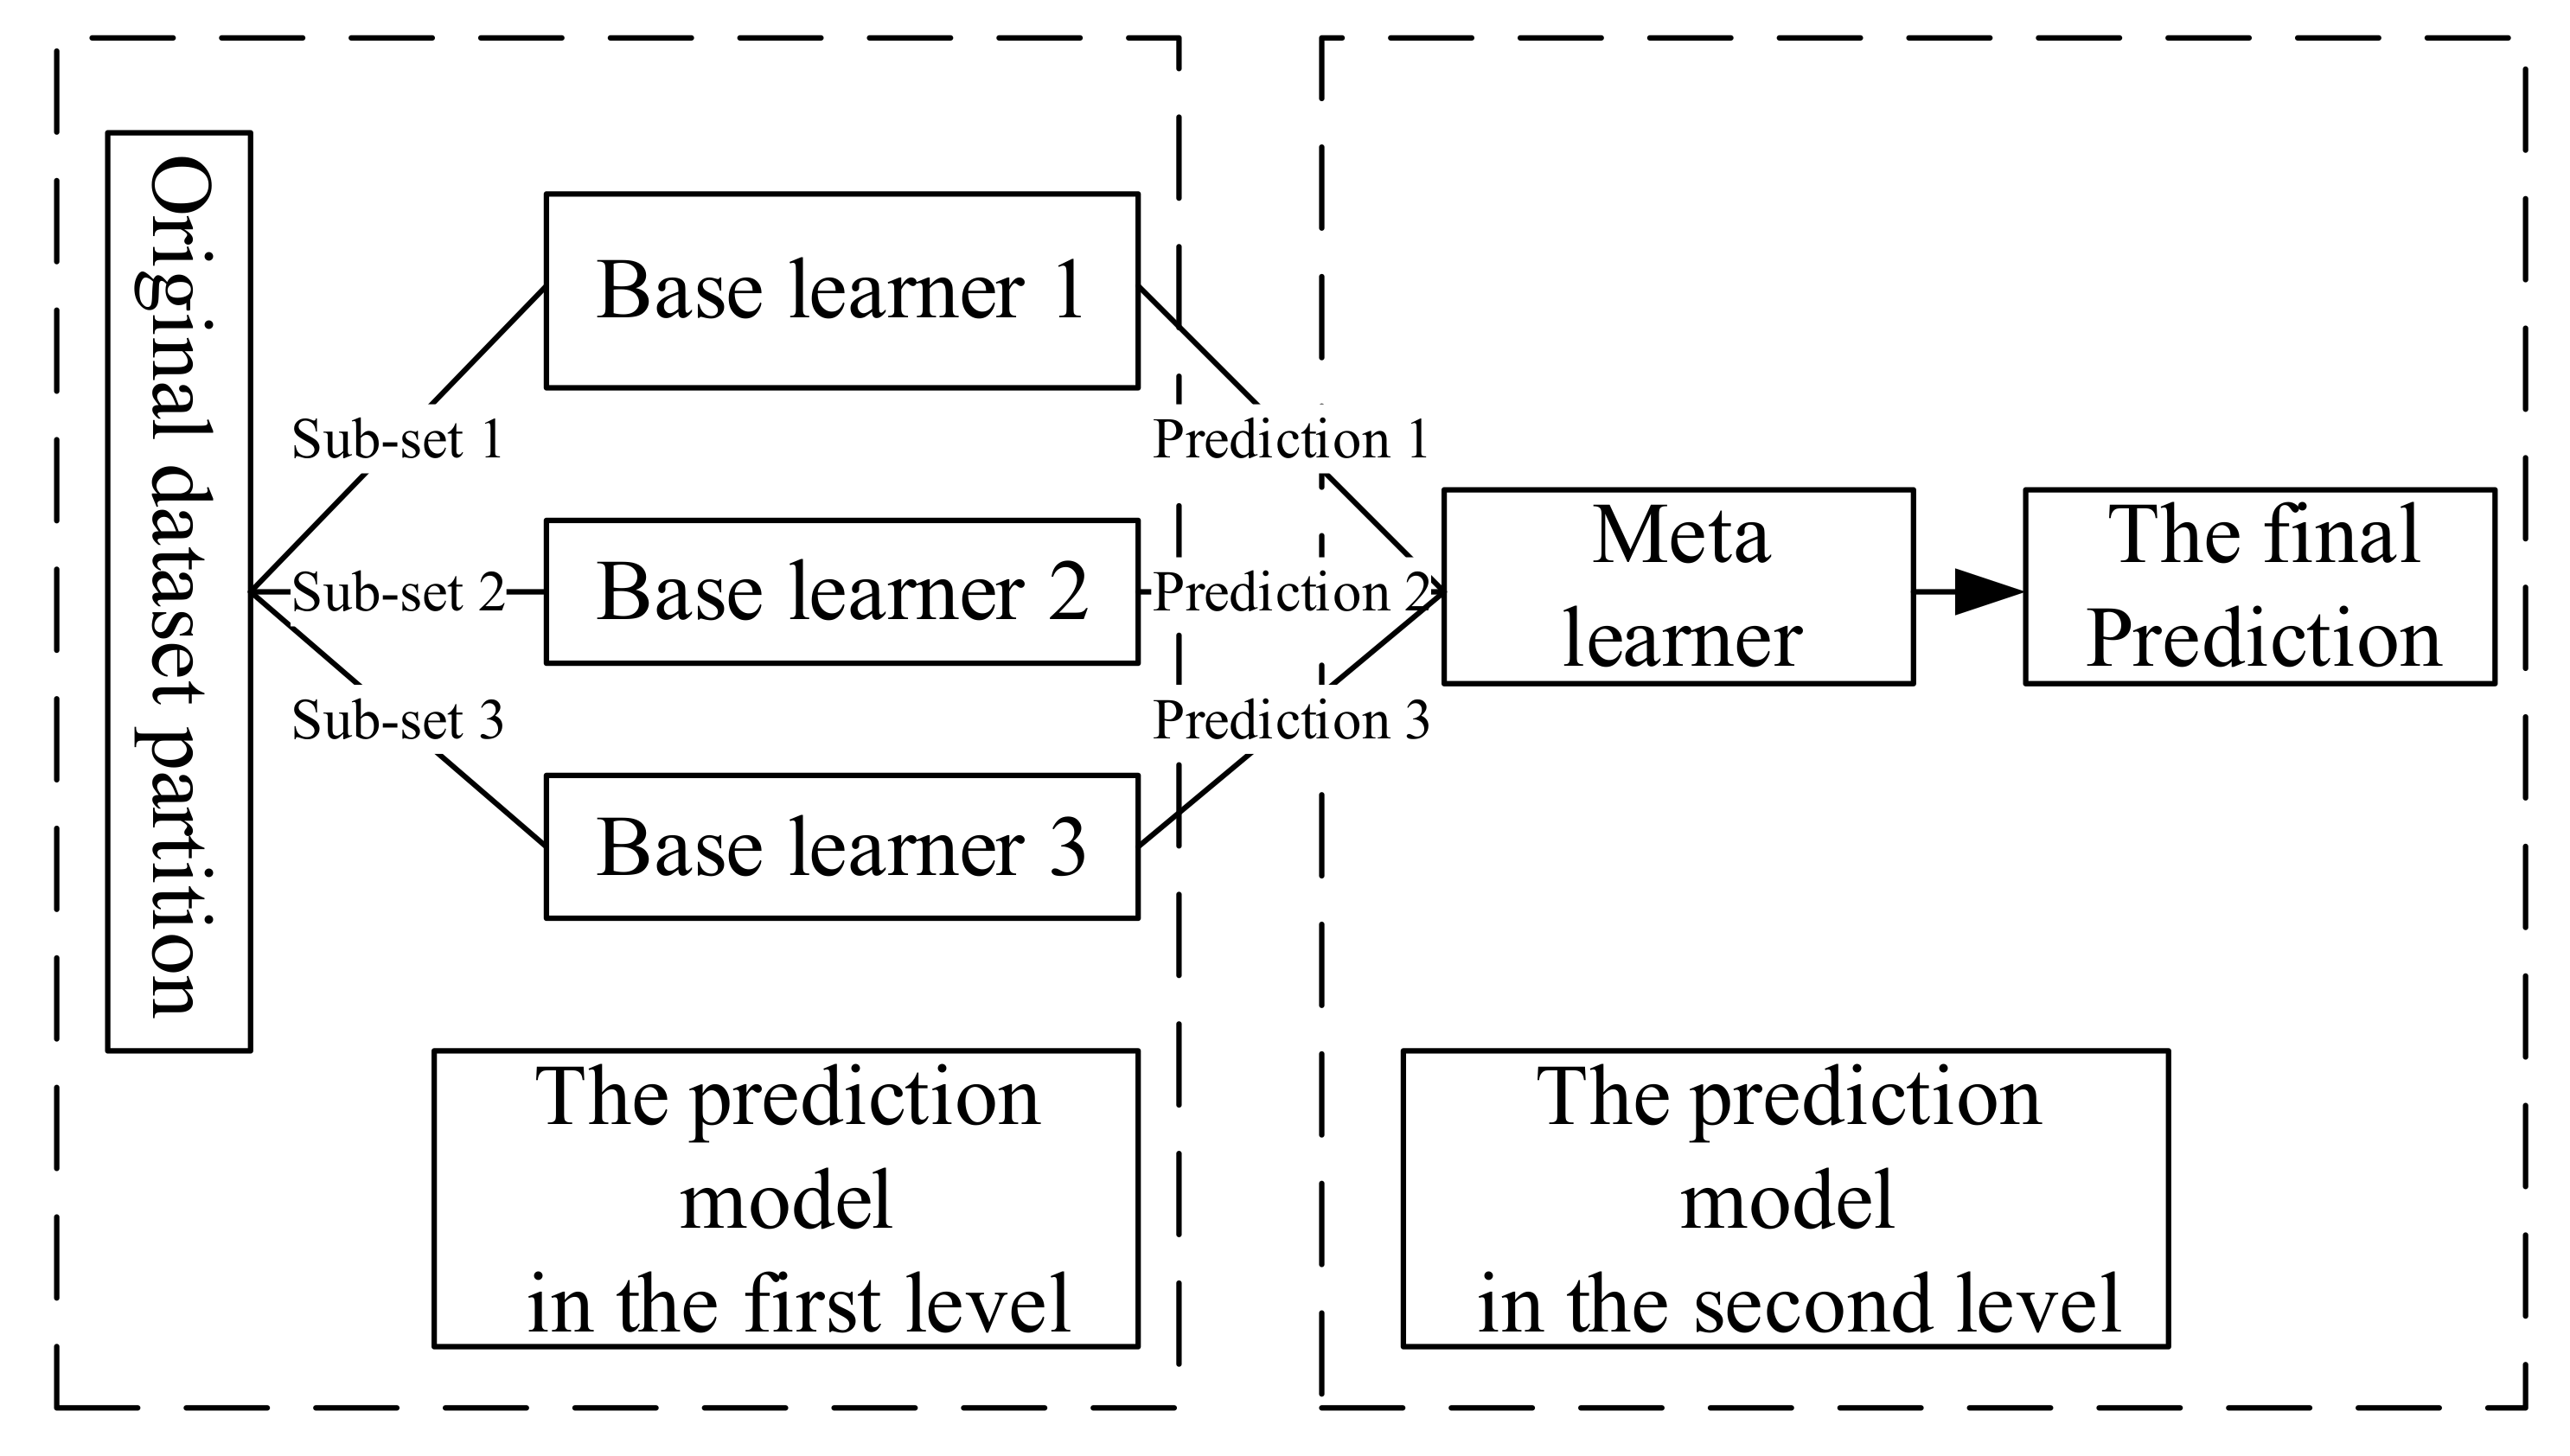
14]. The base learners should be more accurate than random guesses, and each base learner should have its own knowledge of the problem and a different error pattern from the other base learners. This paper adopts the ensemble learning method based on stacking. The stacking [
15] ensemble learning framework first divides the original data set into several sub-datasets, which are input to each basic learner of the first-level prediction model, and each basic learner outputs its own prediction result. Then, the output of the first level is used as the input of the second level, the meta-learner of the second-level prediction model is trained, and the final prediction result is output by the model in the second level. The stacking learning framework generalizes the outputs of multiple models to improve the overall prediction accuracy, as shown in
Figure 2.
2.1.3. Swin Transformer
The Swin Transformer is a new network framework based on Transformer, which introduces the hierarchical construction method commonly used in convolutional neural networks (CNN) to build a hierarchical Transformer. Meanwhile, it solves the problem of scale and resolution of Transformer migration from the field of natural language processing (NLP) to computer vision (CV) by introducing the idea of the locality domain. It alternates the local attention module and the global attention module to reduce the attention computation.
Firstly, the image is fed into the Patch Partition module for chunking, i.e., one patch for every
adjacent pixels, so that each patch has
pixels. Then it is flattened in the channel direction. If the input is a three-channel RGB image, each pixel has three values R, G and B, so there are a total of
pixels after spreading. Thus, the image shape changes from
to
after Patch Partition. A linear embedding layer then linearly transforms the channel data for each pixel from 48 to
C, i.e., the image shape changes from
to
. A number of Swin Transformer blocks are applied to the embedded tokens and together with the linear embedding layer above form “Stage 1”. To obtain a hierarchical representation, the output of “Stage 1” is then sent by patch merging, where
neighbouring patches are merged together. The resolution is also reduced by a factor of 2, the number of tokens is reduced by a factor of 4, and a linear layer is applied to change the dimensionality from
4C to
2C. As shown in
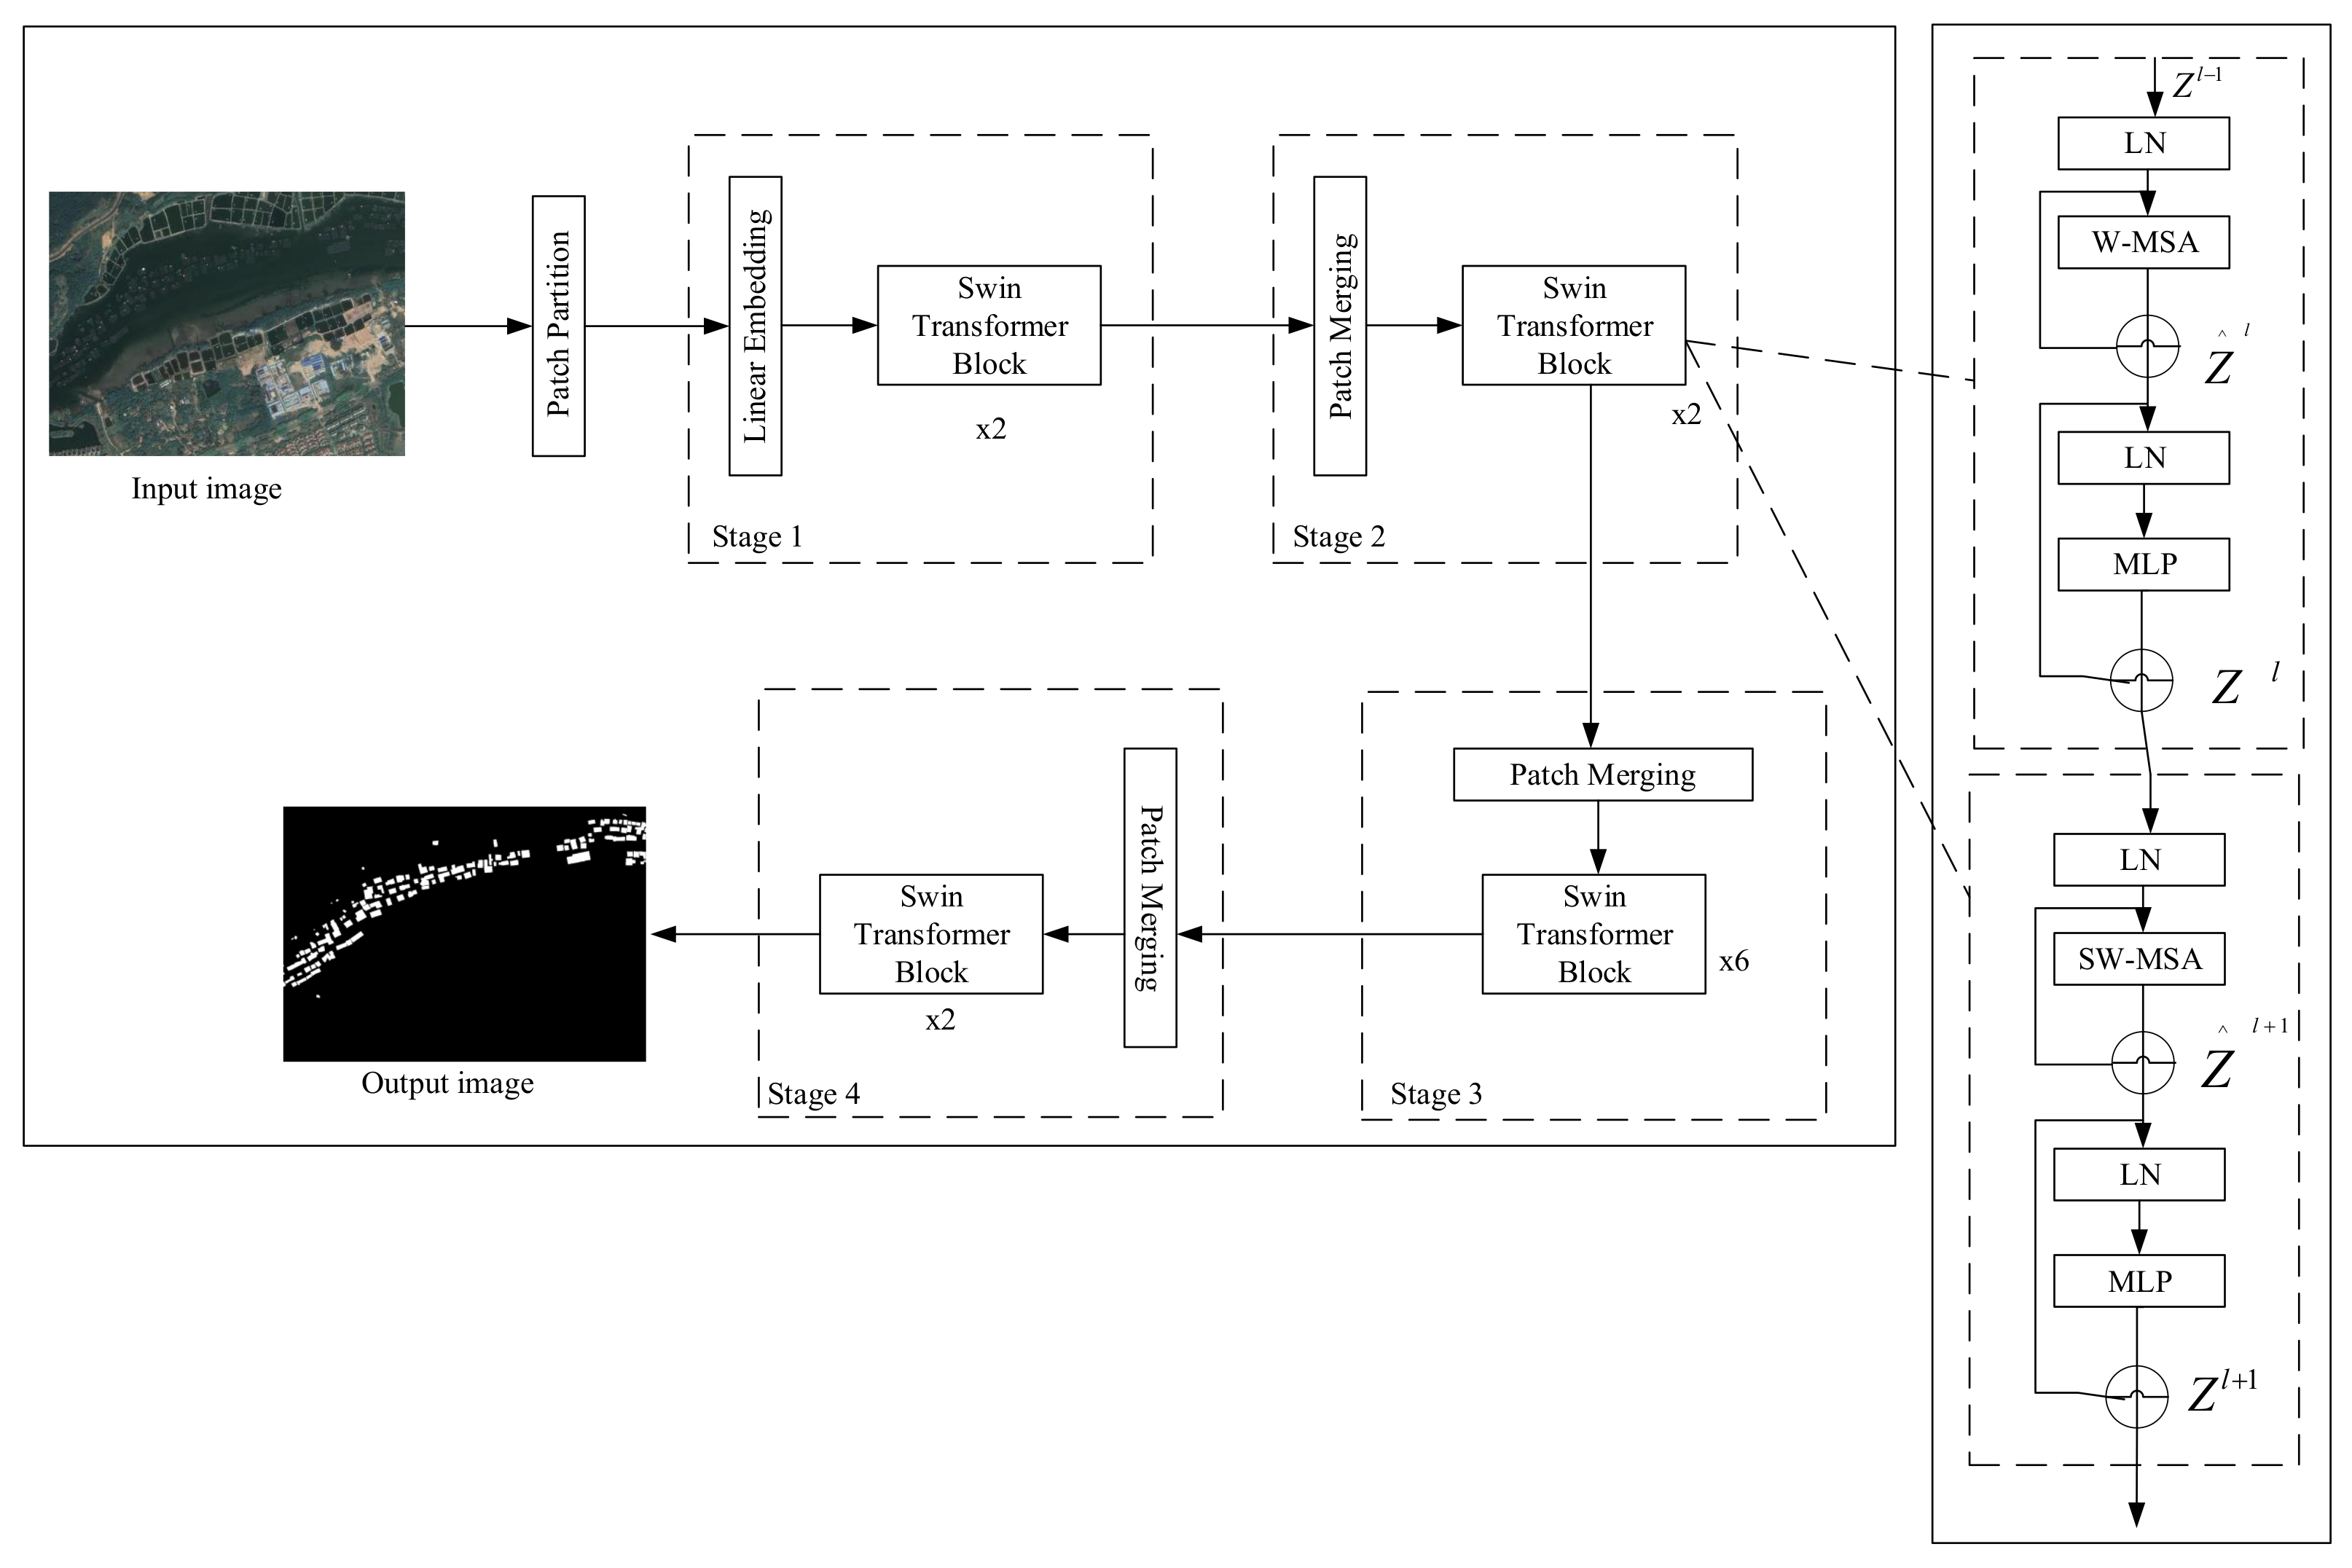
Figure 3, multiple Swin Transformer blocks are joined together to form three identical stages through the patch merging layer. In addition, the output resolution is
and
.
The Swin Transformer is constructed by replacing the standard Multiple Self-Attention (MSA) module in the Transformer block with a shift window-based module, leaving the other layers unchanged. As shown in
Figure 3, a Swin Transformer block consists of a shift-window based MSA module and a two-layer MLP, which is connected nonlinearly via GELU. A LayerNorm (LN) layer is applied before each MSA module and each MLP, and a residual is applied after each module to connect them, as shown in Equation (
1).
2.2. The Proposed Segmentation Method
In this subsection, we first give the cropping rules for the dataset. Then a detailed description of the proposed segmentation method is given, and the overall implementation scheme is presented.
2.2.1. Training Set Cropping Rule
As the resolution of remote sensing images is too large to be directly input into the neural network for training, the original remote sensing images need to be cut into the required size for training by cropping. The segmentation scheme in this paper crops the training samples into and sizes respectively. In order to verify the robustness of the network structure, this paper uses a controlled ratio of positive and negative samples for cropping.
2.2.2. Test Set Cropping Rule
As the model is trained on a training set of
and
resolution, the test set needs to be cropped to the corresponding size and then input to the model for segmentation, and then the small pieces of the segmented images are combined in order to achieve accurate segmentation of the original remote sensing image. If the test set is directly cropped, the resolution size of the image is often not exactly cropped into integer blocks. Therefore, in order to ensure that the remote sensing image can be segmented in its entirety, we use a method similar to the voting mechanism [
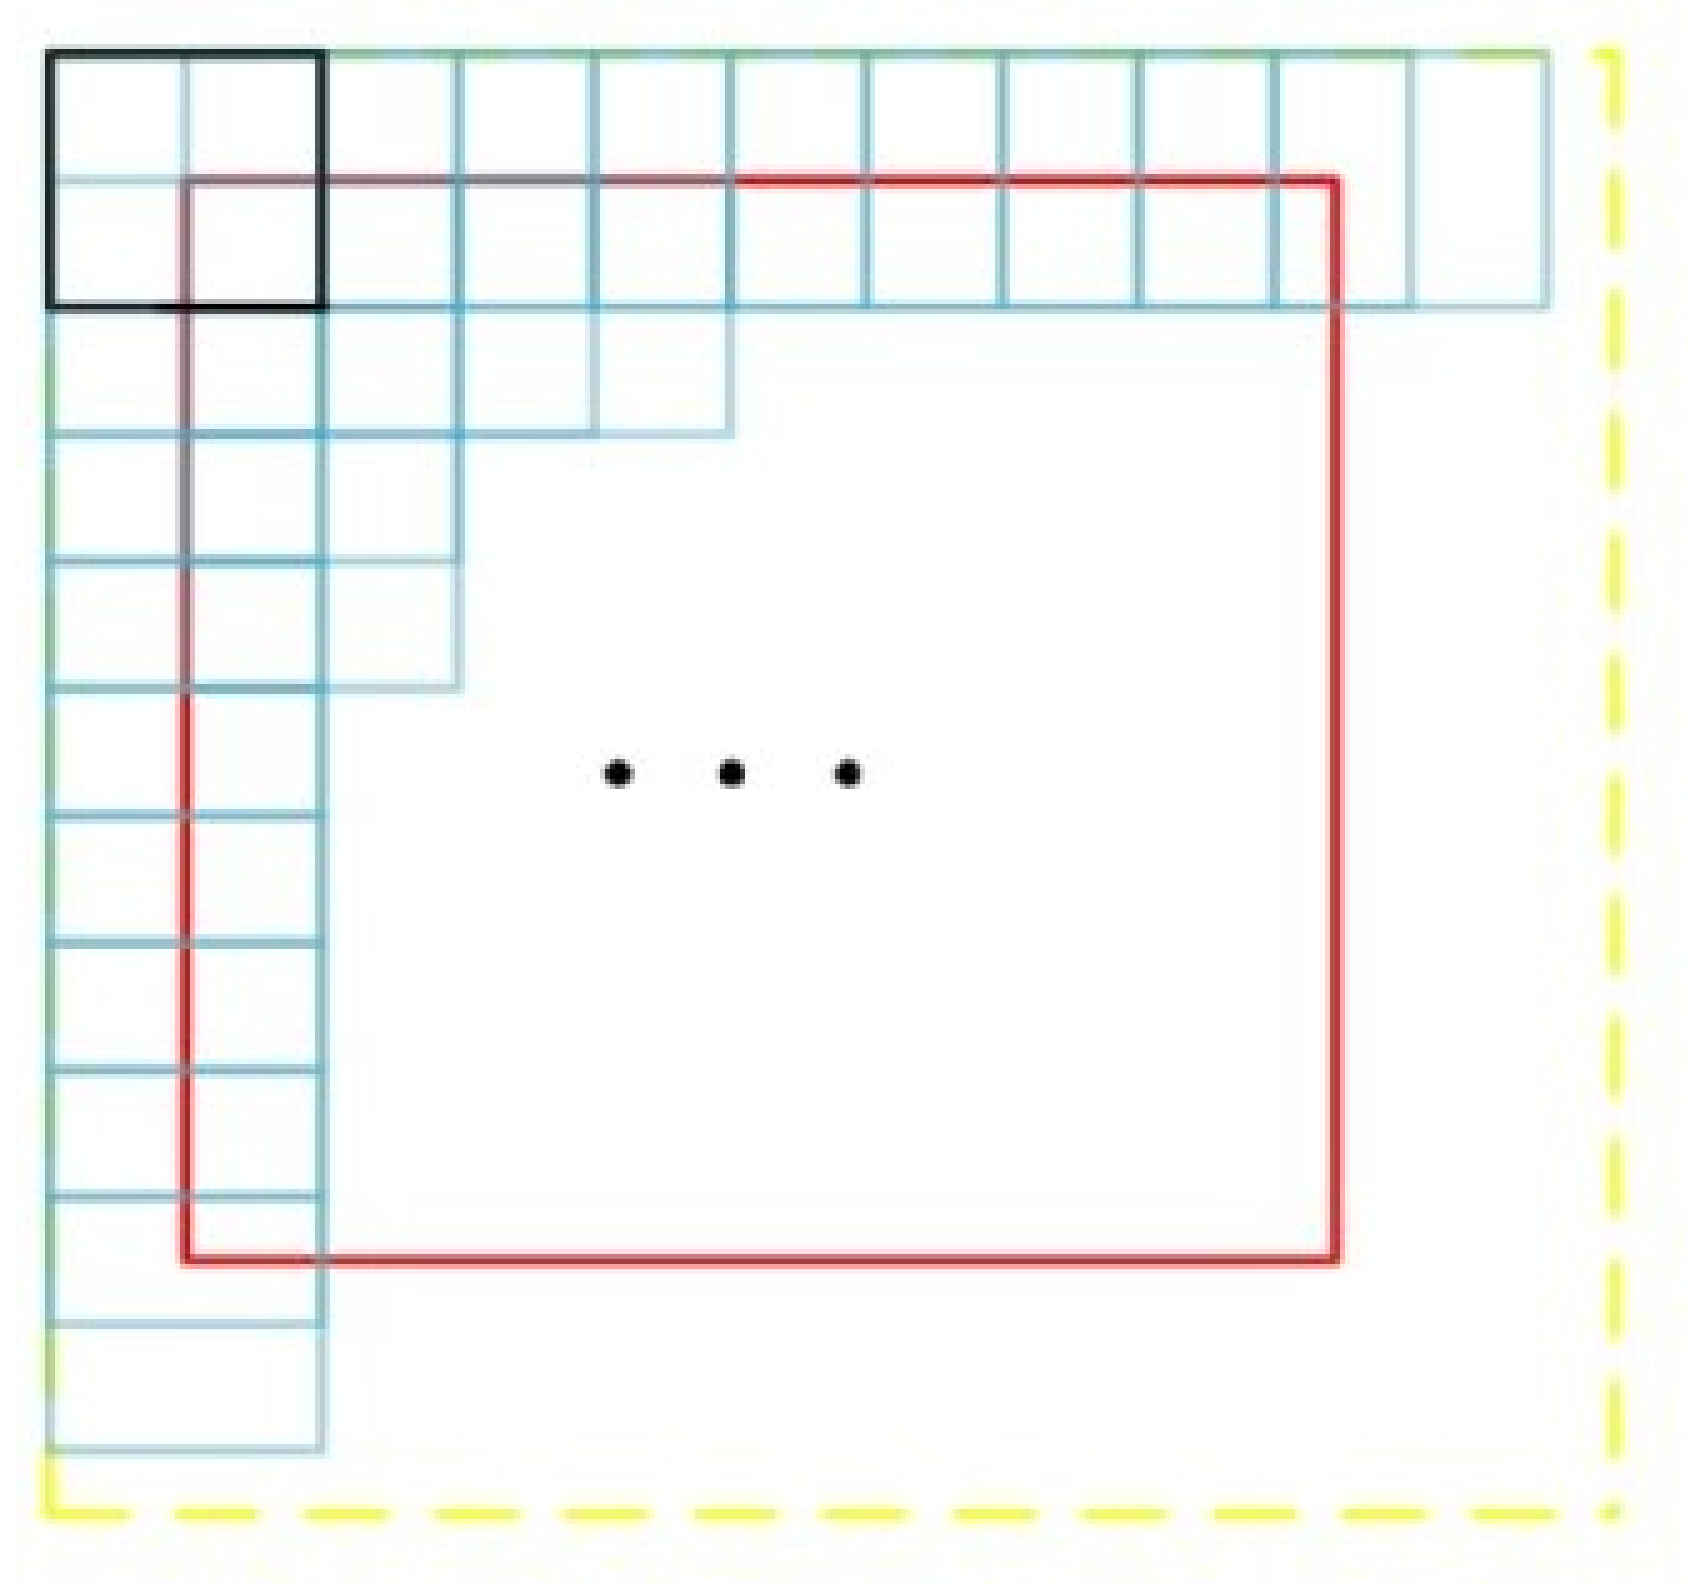
16] to fill the original remote sensing image. When cropping by rule for large resolution remote sensing images, the move step is half the length of the resolution edge of the cut image. Additionally, to ensure that each part of the remote sensing image can be segmented four times, the left and top sides of the remote sensing image are filled with blanks of half the resolution edge length of the cut image, and the right and bottom sides of the remote sensing image are filled with blanks of the resolution edge length of the cut image. The schematic diagram is shown in
Figure 4, where the red box represents the remote sensing image and the outer yellow represents the filled image. The black box is the initial position and the sequential cropping is performed at one-half the size of the resolution edge of the cut image, and all parts within the red box will have been segmented four times. Semantic segmentation is performed on each pixel point in the image, and the predicted output is a probability value between 0 and 1 [
17,
18]. As each pixel point in the remote sensing image is computed four times, the sum of the four times is averaged to better represent the true class of the point and thus achieve a more accurate segmentation.
2.2.3. Proposed Method and Introduction of the Overall Scheme
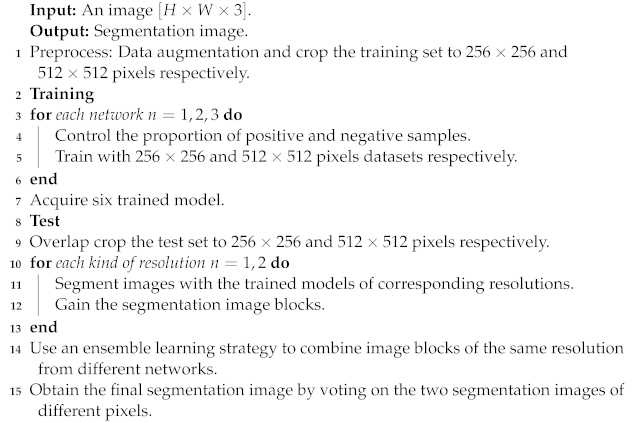
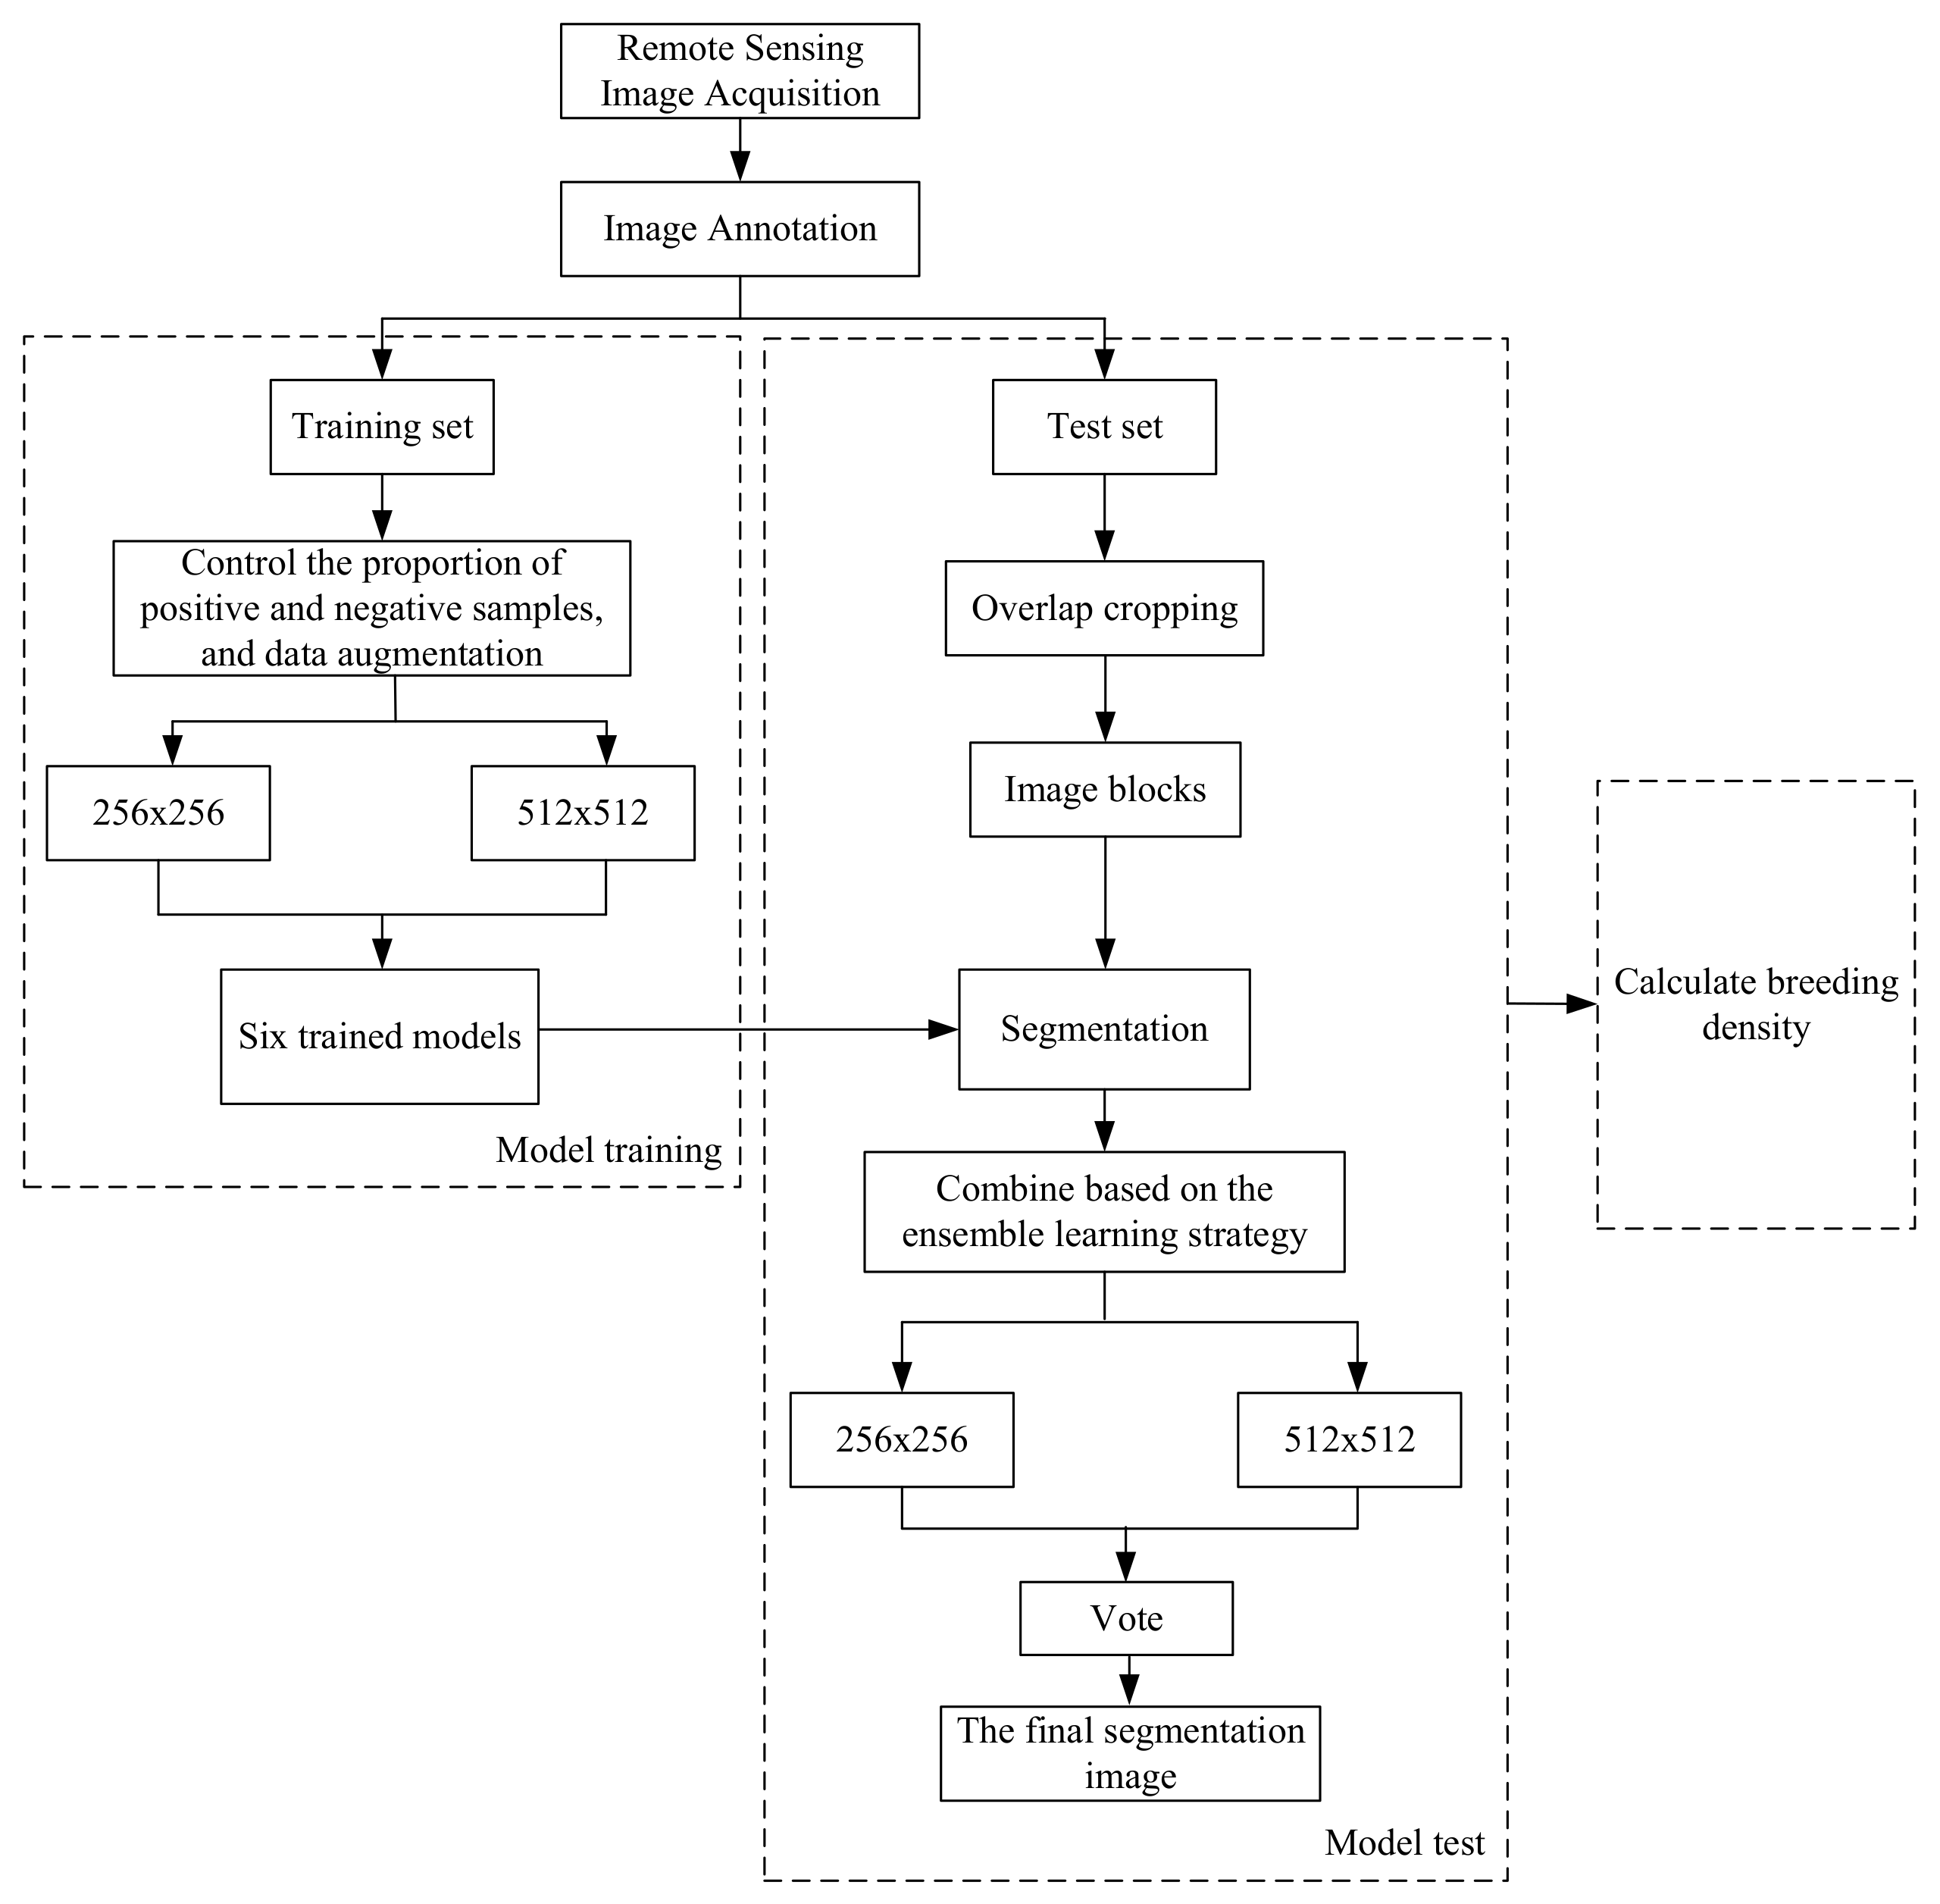
For remote sensing image segmentation of mariculture cage, we propose a segmentation method based on the Swin Transformer and ensemble learning strategy. The proposed method description based on the ensemble learning strategy is shown in Algorithm 1, and the overall technical scheme based on this method is shown in
Figure 5, which is different from the traditional machine learning segmentation method. Firstly, multiple remote sensing images of mariculture cage are collected by Google Maps and annotated, and then the datasets are divided into a training set and a test set, and the training set is cropped to
and
pixels and expanded to obtain two training sets with different resolutions [
19,
20], respectively. The Swin Transformer, Attention U-Net and Mask Rcnn networks are used to train the two training sets and generate six trained models. The test sets are then cropped to
and
size respectively according to the rules and input to the trained models of corresponding resolutions for segmentation. Then, the output images are stitched according to the rules [
21]. Next, images of the same resolution from different networks are combined by an ensemble learning strategy, and then the final segmentation image is obtained by voting on the two segmentation images of different resolutions. Finally, the estimation of aquaculture density is performed based on the segmentation results. This work is presented in
Section 2.3.
| Algorithm 1: Description of the ensemble learning algorithm for segmentation |
![Applsci 12 08234 i001]() |
2.3. Introduction to the Statistical Method of Breeding Density
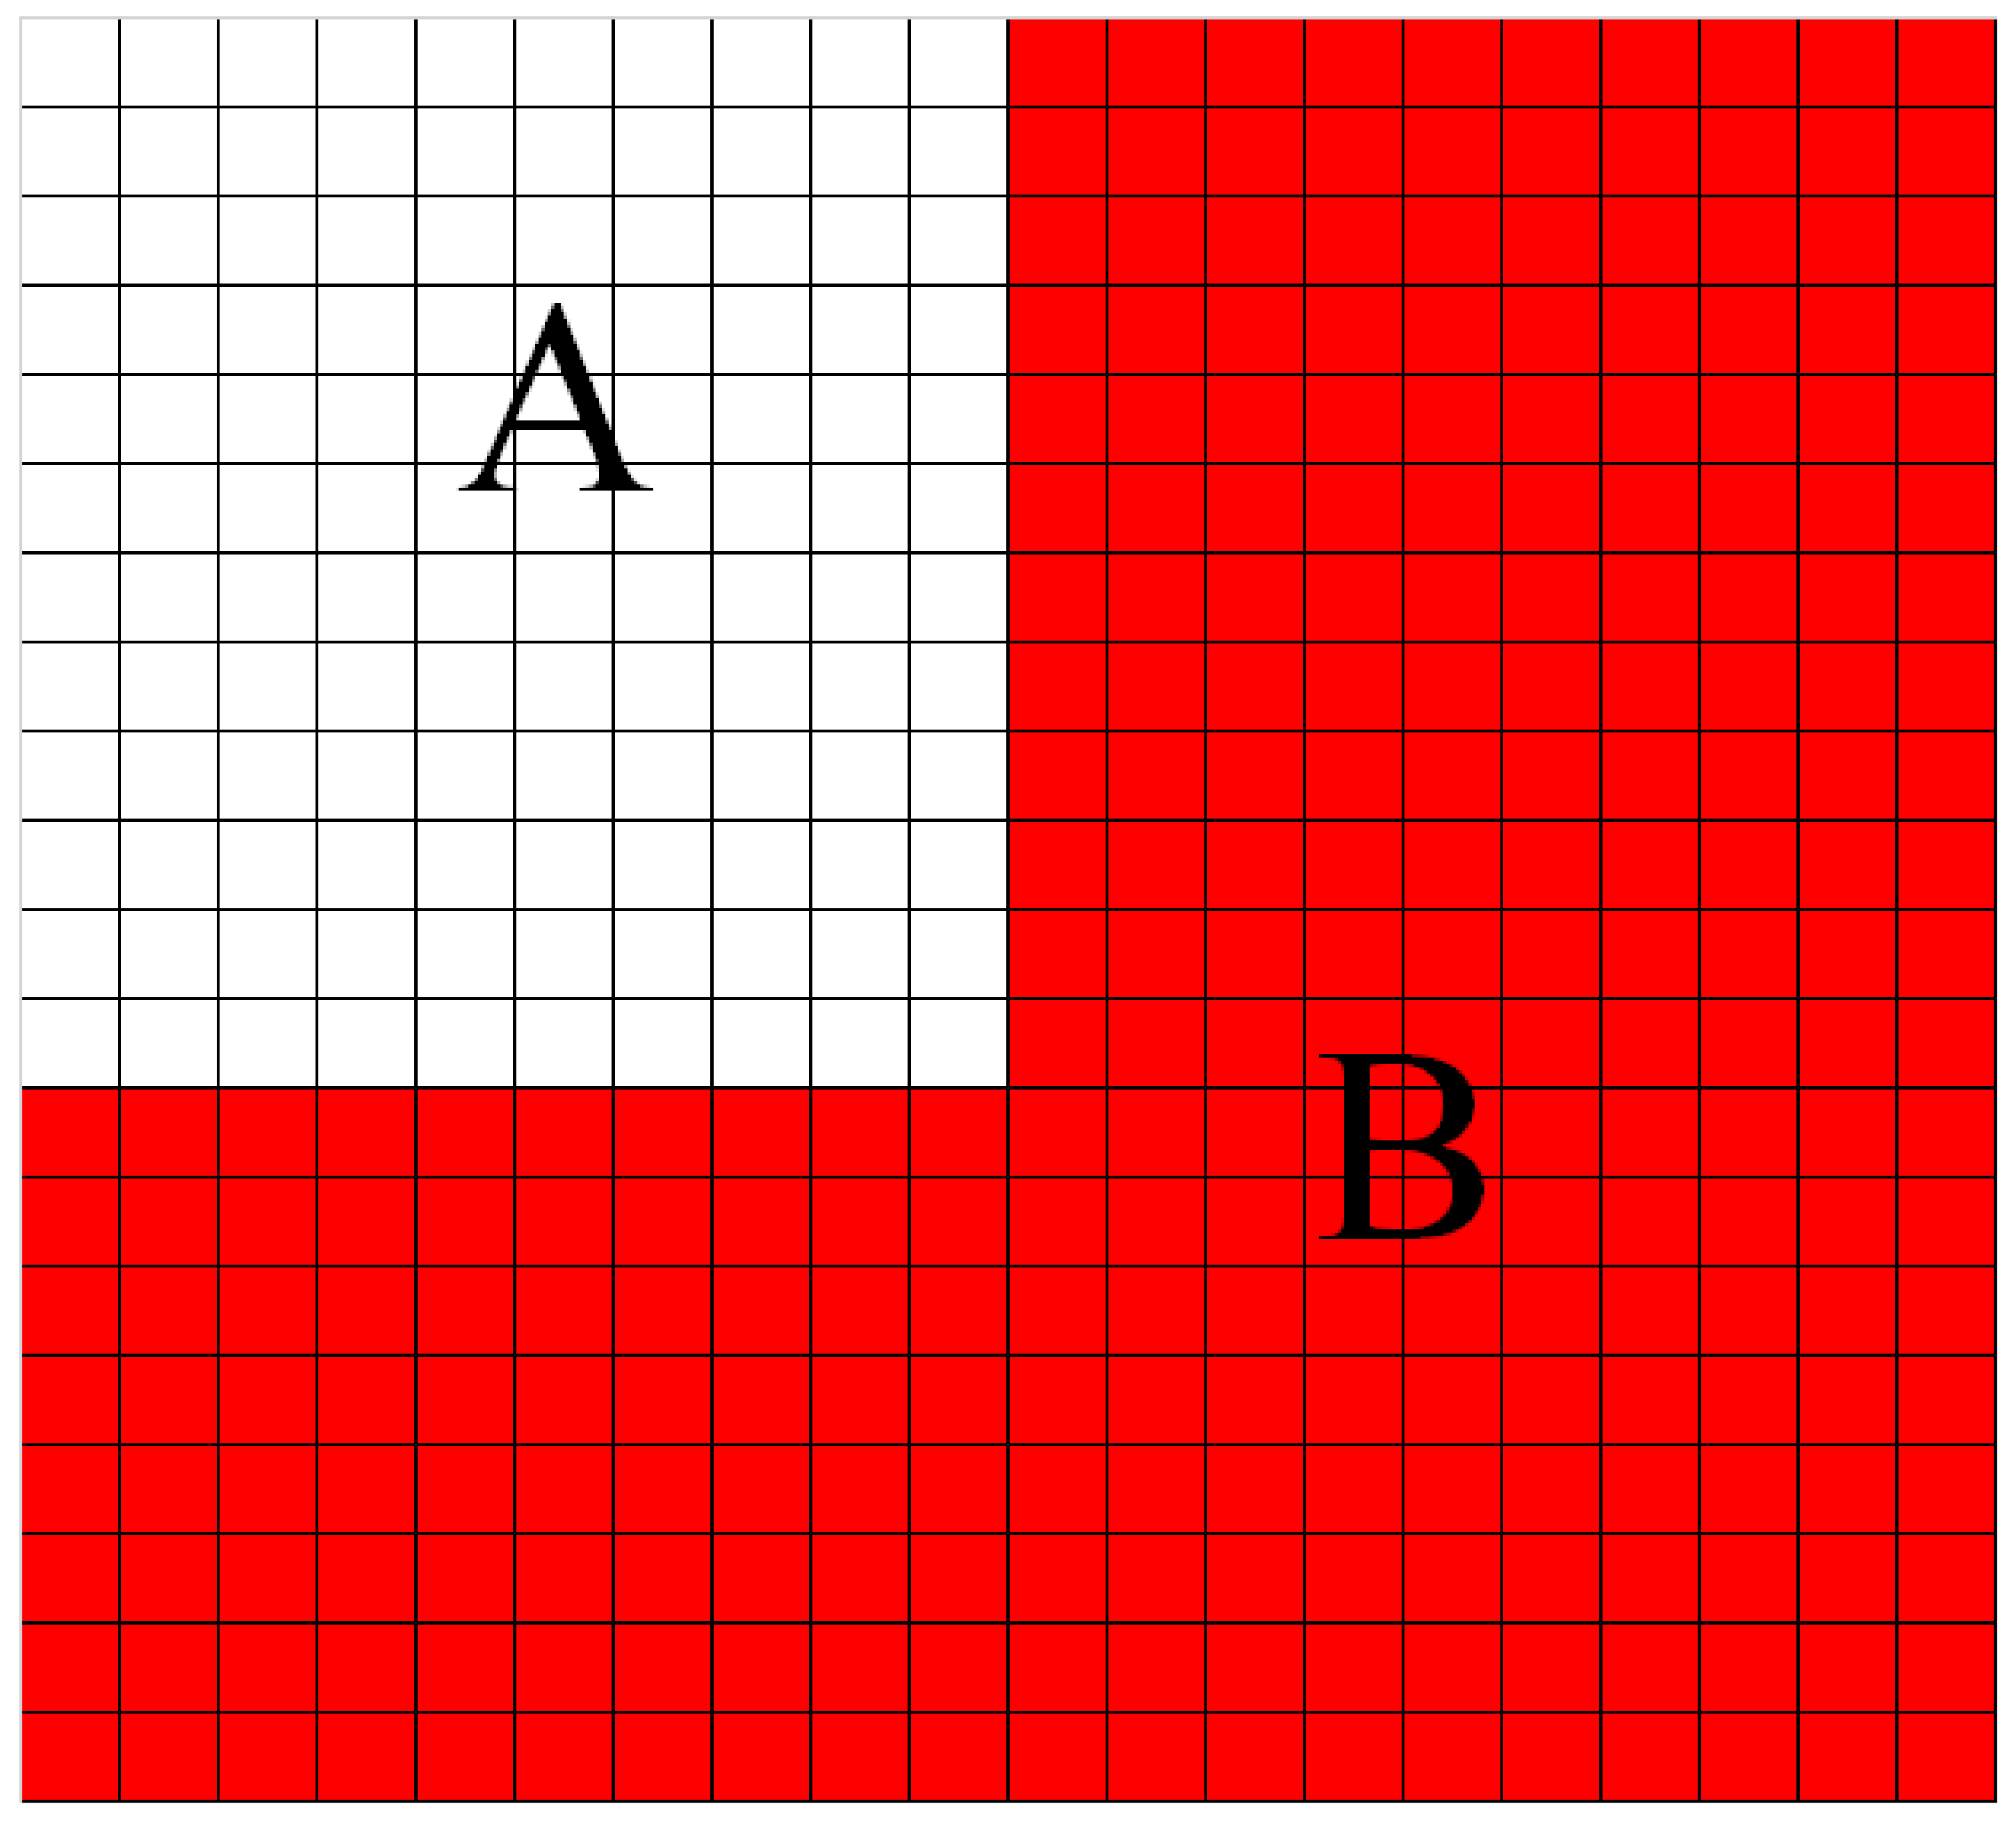
Since the semantic segmentation used in this paper is to detect and segment the image at the pixel level, this paper adopts the method of traversing each point in the image. If the point belongs to the mask area, the sum of the segmentation pixels is increased by one, as shown in
Figure 6.
Each square in the figure represents a pixel, A represents the pixel area occupied by the detection frame, and B represents the pixel area occupied by the detected object mask. During the test, all the pixels in A are traversed. When a pixel area is in the A-B area, it is judged as False; when a pixel is in the B area, it is judged as True, and the total number of pixels required is determined. The point value is incremented by one. In the experiment, the number of pixels occupied by each tile is calculated (as in Equation (
2)), and then the total number of pixels is obtained by summing the pixels of each tile (as in Equation (
3)). The total number of points and the total number of pixels in the picture are used to calculate the cage breeding density (as in Equation (
4)).
In Equations (
2)–(
4),
P represents the number of pixels in the mask area in a single tile,
k represents the number of objects segmented in the tile and
represents the number of pixels occupied by the mask segmented object in the tile
represents the total number of pixels in the identified cages, m and n represent the times of dividing the high-resolution image into rows and columns respectively,
represents the total number of pixels in the image, and
represents the cage breeding density.
3. Results
3.1. Dataset Acquisition
We construct a remote sensing cage image dataset consisting of 53 images, with the training set consisting of 50 images and the test set consisting of 3 images. Through data expansion, we generate 160,000 images for the training set of pixels and 40,000 images for the training set of pixels. The three test set images include a dense distribution of cages, a sparse distribution of cages and a uniform distribution of cages.
3.2. Experimental Settings
3.2.1. Experimental Environment and Parameter Settings
In this paper, the experimental environment is ubuntu20, the GPU is Nvidia GeForce RTX 3080, Pytorch and python3.6. For the annotation of the dataset, the labelme [
22] annotation software is used to obtain mask images, and then they are converted into black and white binary maps in uint8 format as label images [
23]. The Swin Transformer is available in four different sizes, namely Swin Tiny (Swin-T), Swin Small (Swin-S), Swin Base (Swin-B) and Swin Large (Swin-L). Given the performance limitations of the system, we choose Swin-T, using pretrained weights on the Ade20K dataset, which has over 25,000,000 images and 150 categories. The embedding dimension of the first stage is set to
, the window size is set to 7, and the number of blocks and heads in each stage is set to {2, 2, 6, 2} and {3, 6, 12, 24}, respectively. We used AdamW as the optimisation function with a learning rate of
[
24].
3.2.2. Data Augmentation
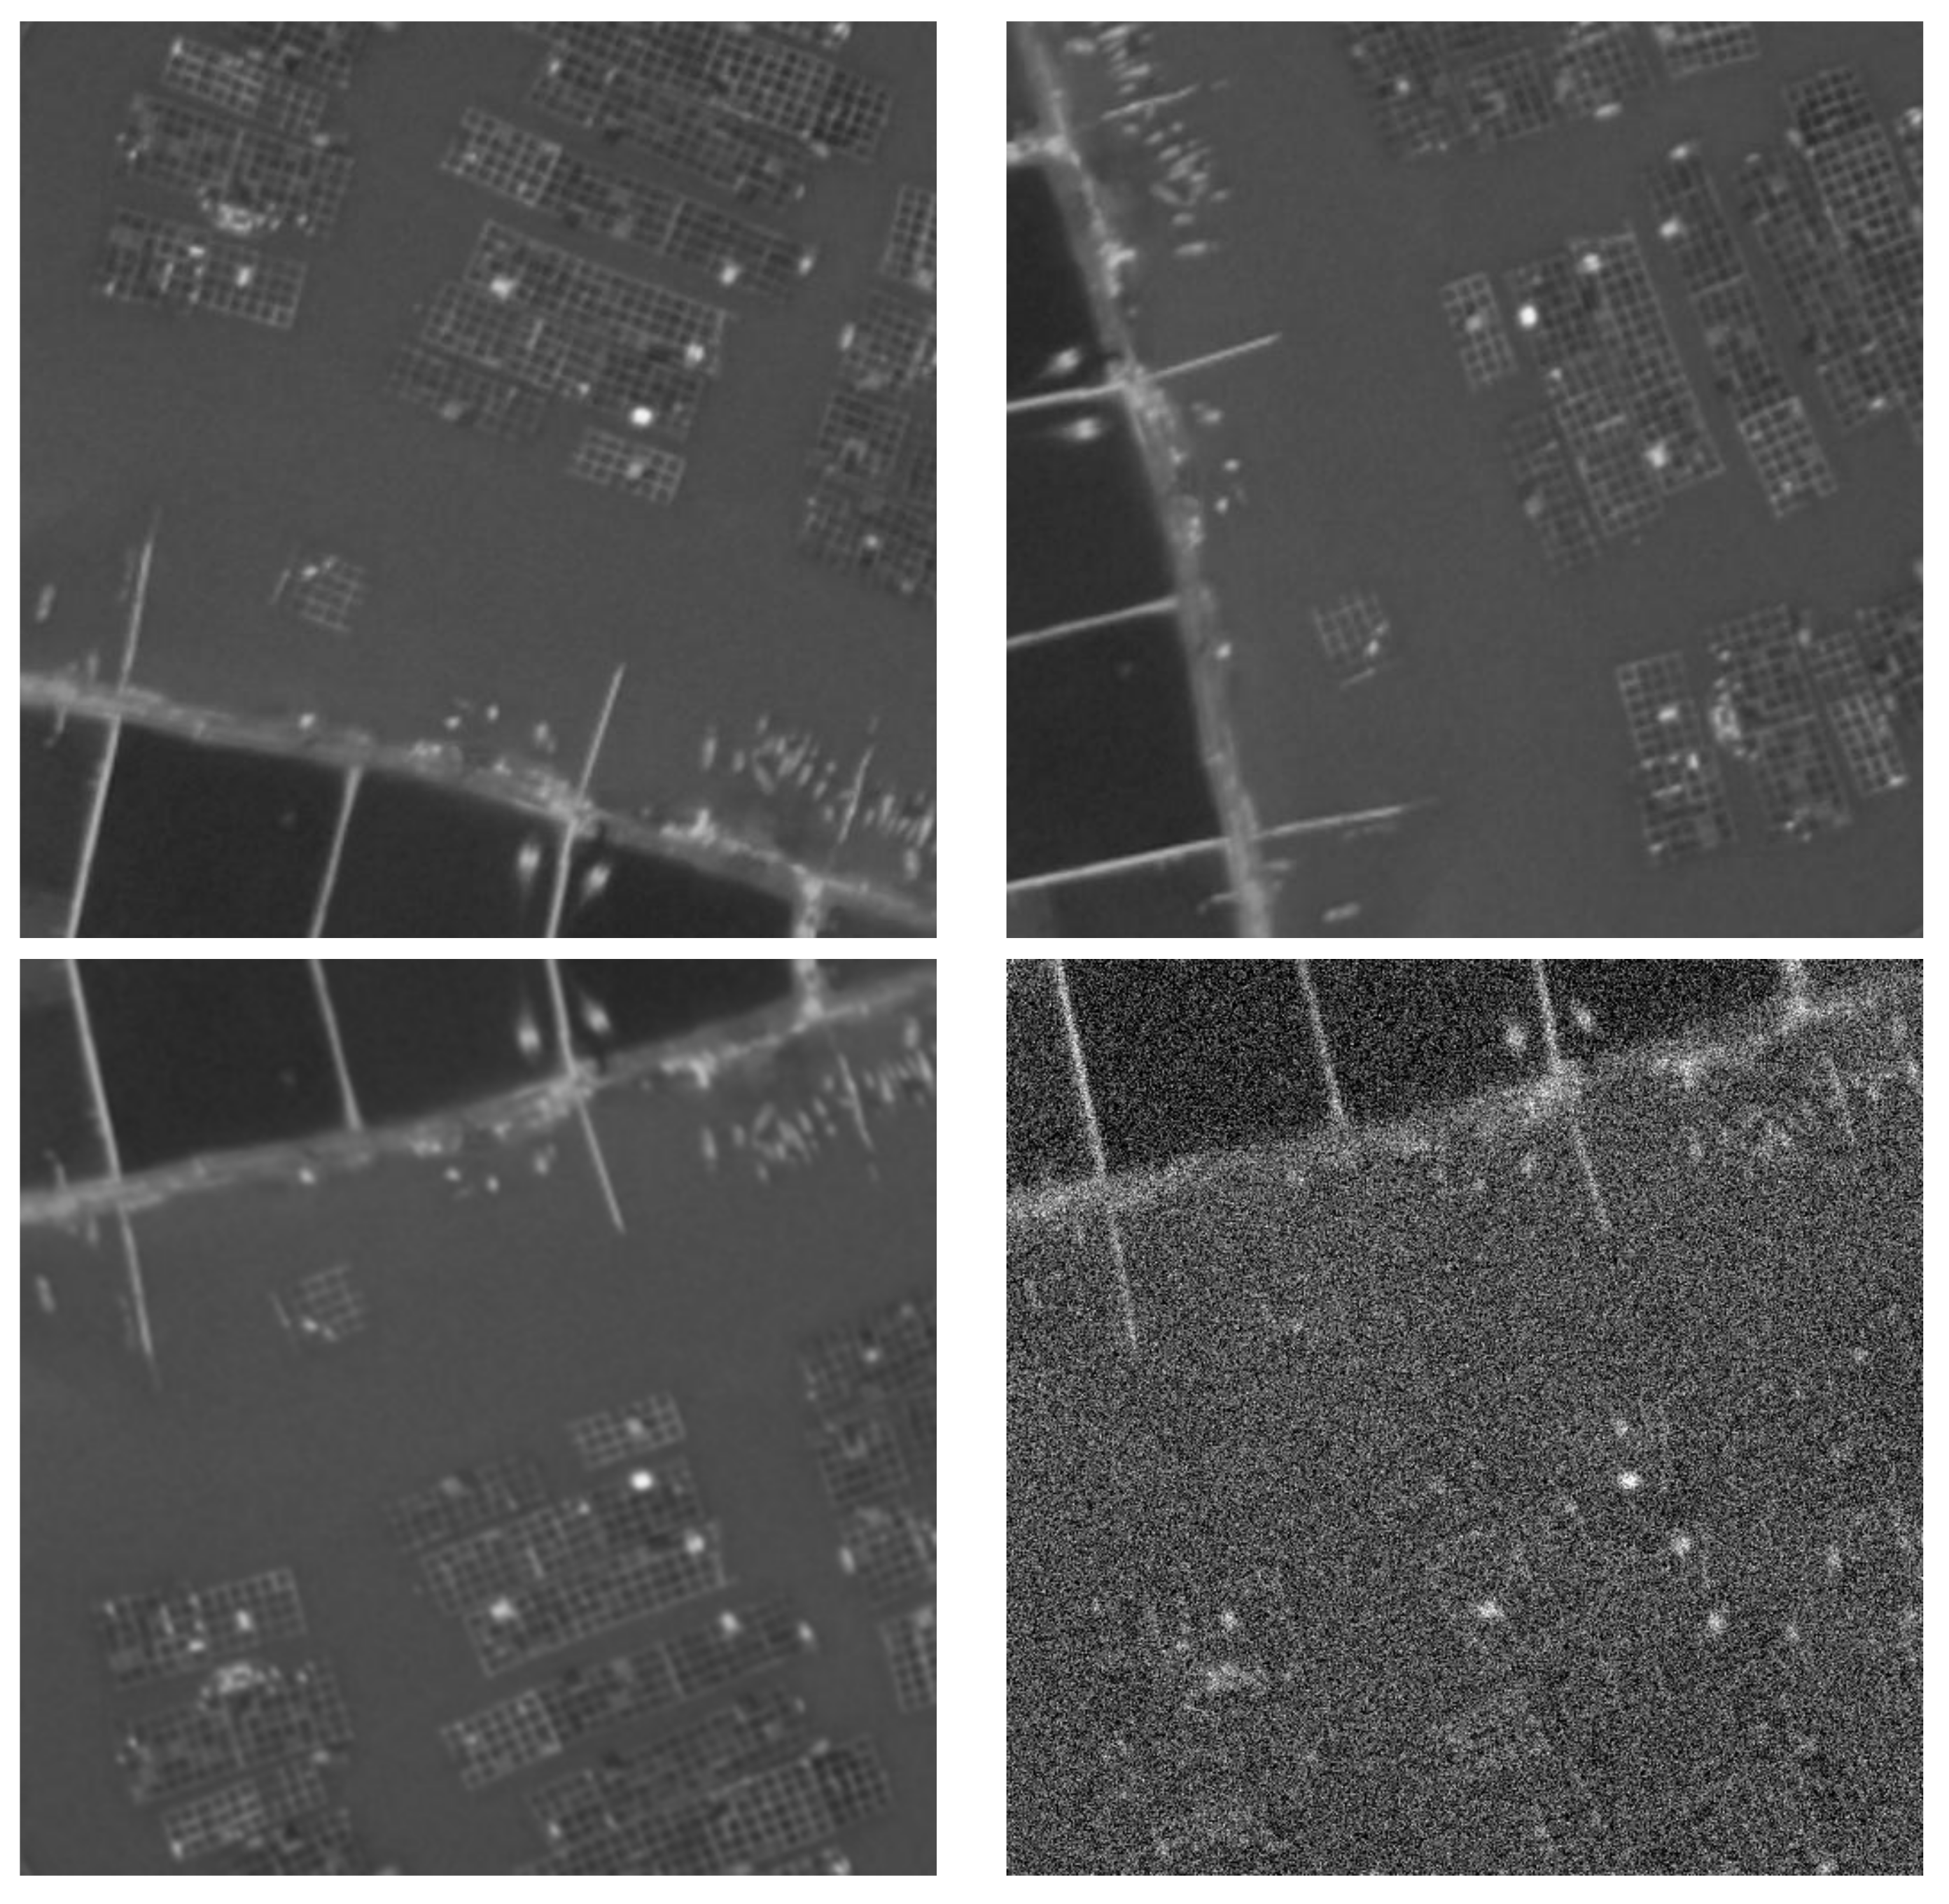
On the one hand, due to the high resolution of remote sensing images, they cannot be directly input into deep learning neural networks for training. On the other hand, deep learning requires a large dataset for training to achieve better results, and the number of remote sensing cage images is small. Therefore, we perform data augmentation operations on the training set. Take building a training set of
pixels as an example. First, the original high-resolution image and the label image are simultaneously randomly cropped to a size of
pixels. Then, perform data augmentation operations on the cropped image, such as random rotation transformation, blur transformation, flip transformation, and adding Gaussian noise. Finally, the augmented data is extended to the training set. The random rotation and flip transformations model the difference in the cage’s position. Blur transforms and Gaussian noise better simulates various environments. Finally, by looping, the desired number of different training samples can be obtained. As shown in
Figure 7, it shows the effect of performing data augmentation.
3.3. Evaluation Metric
For the binary classification problem, A is referred to as a positive example (Positive), B is referred to as a negative example (Negative), and the classifier predicts correctly is noted as True and predicts incorrectly as False. From these four basic combinations, the four base elements of the confusion matrix are formed as TP (True Positive), FN (False Negative), TN (True Negative) and FP (False Positive), as shown in
Table 1.
In semantic segmentation experiments, the commonly used experimental metrics are mIoU [
25] and pixel accuracy (PA). Where IoU represents the ratio of the intersection to the merge between the predicted outcome of each category and the True label, as shown in Equation (
5). For the binary classification problem, mIoU is the sum and then the average of IoU, which can be expressed as Equation (
6). Pixel accuracy represents the ratio of the number of pixels correctly predicted for a category to the total number of pixels, as shown in Equation (
7).
3.4. Quantitative Experiments
In order to verify the effectiveness of the algorithm based on ensemble learning, the experiments compare the algorithm in this paper with several current algorithms with better performance, the comparison algorithms include U-Net [
26], Mask-RCNN [
27], SOLOv2 [
28], UCTransNet [
29], Attention U-Net [
30] and the Swin Transformer. Evaluation metrics included mIoU and pixel accuracy. To ensure the validity of the experimental comparisons, the same experimental environment is used for all experimental methods.The experimental results are shown as
Table 2 and
Table 3.
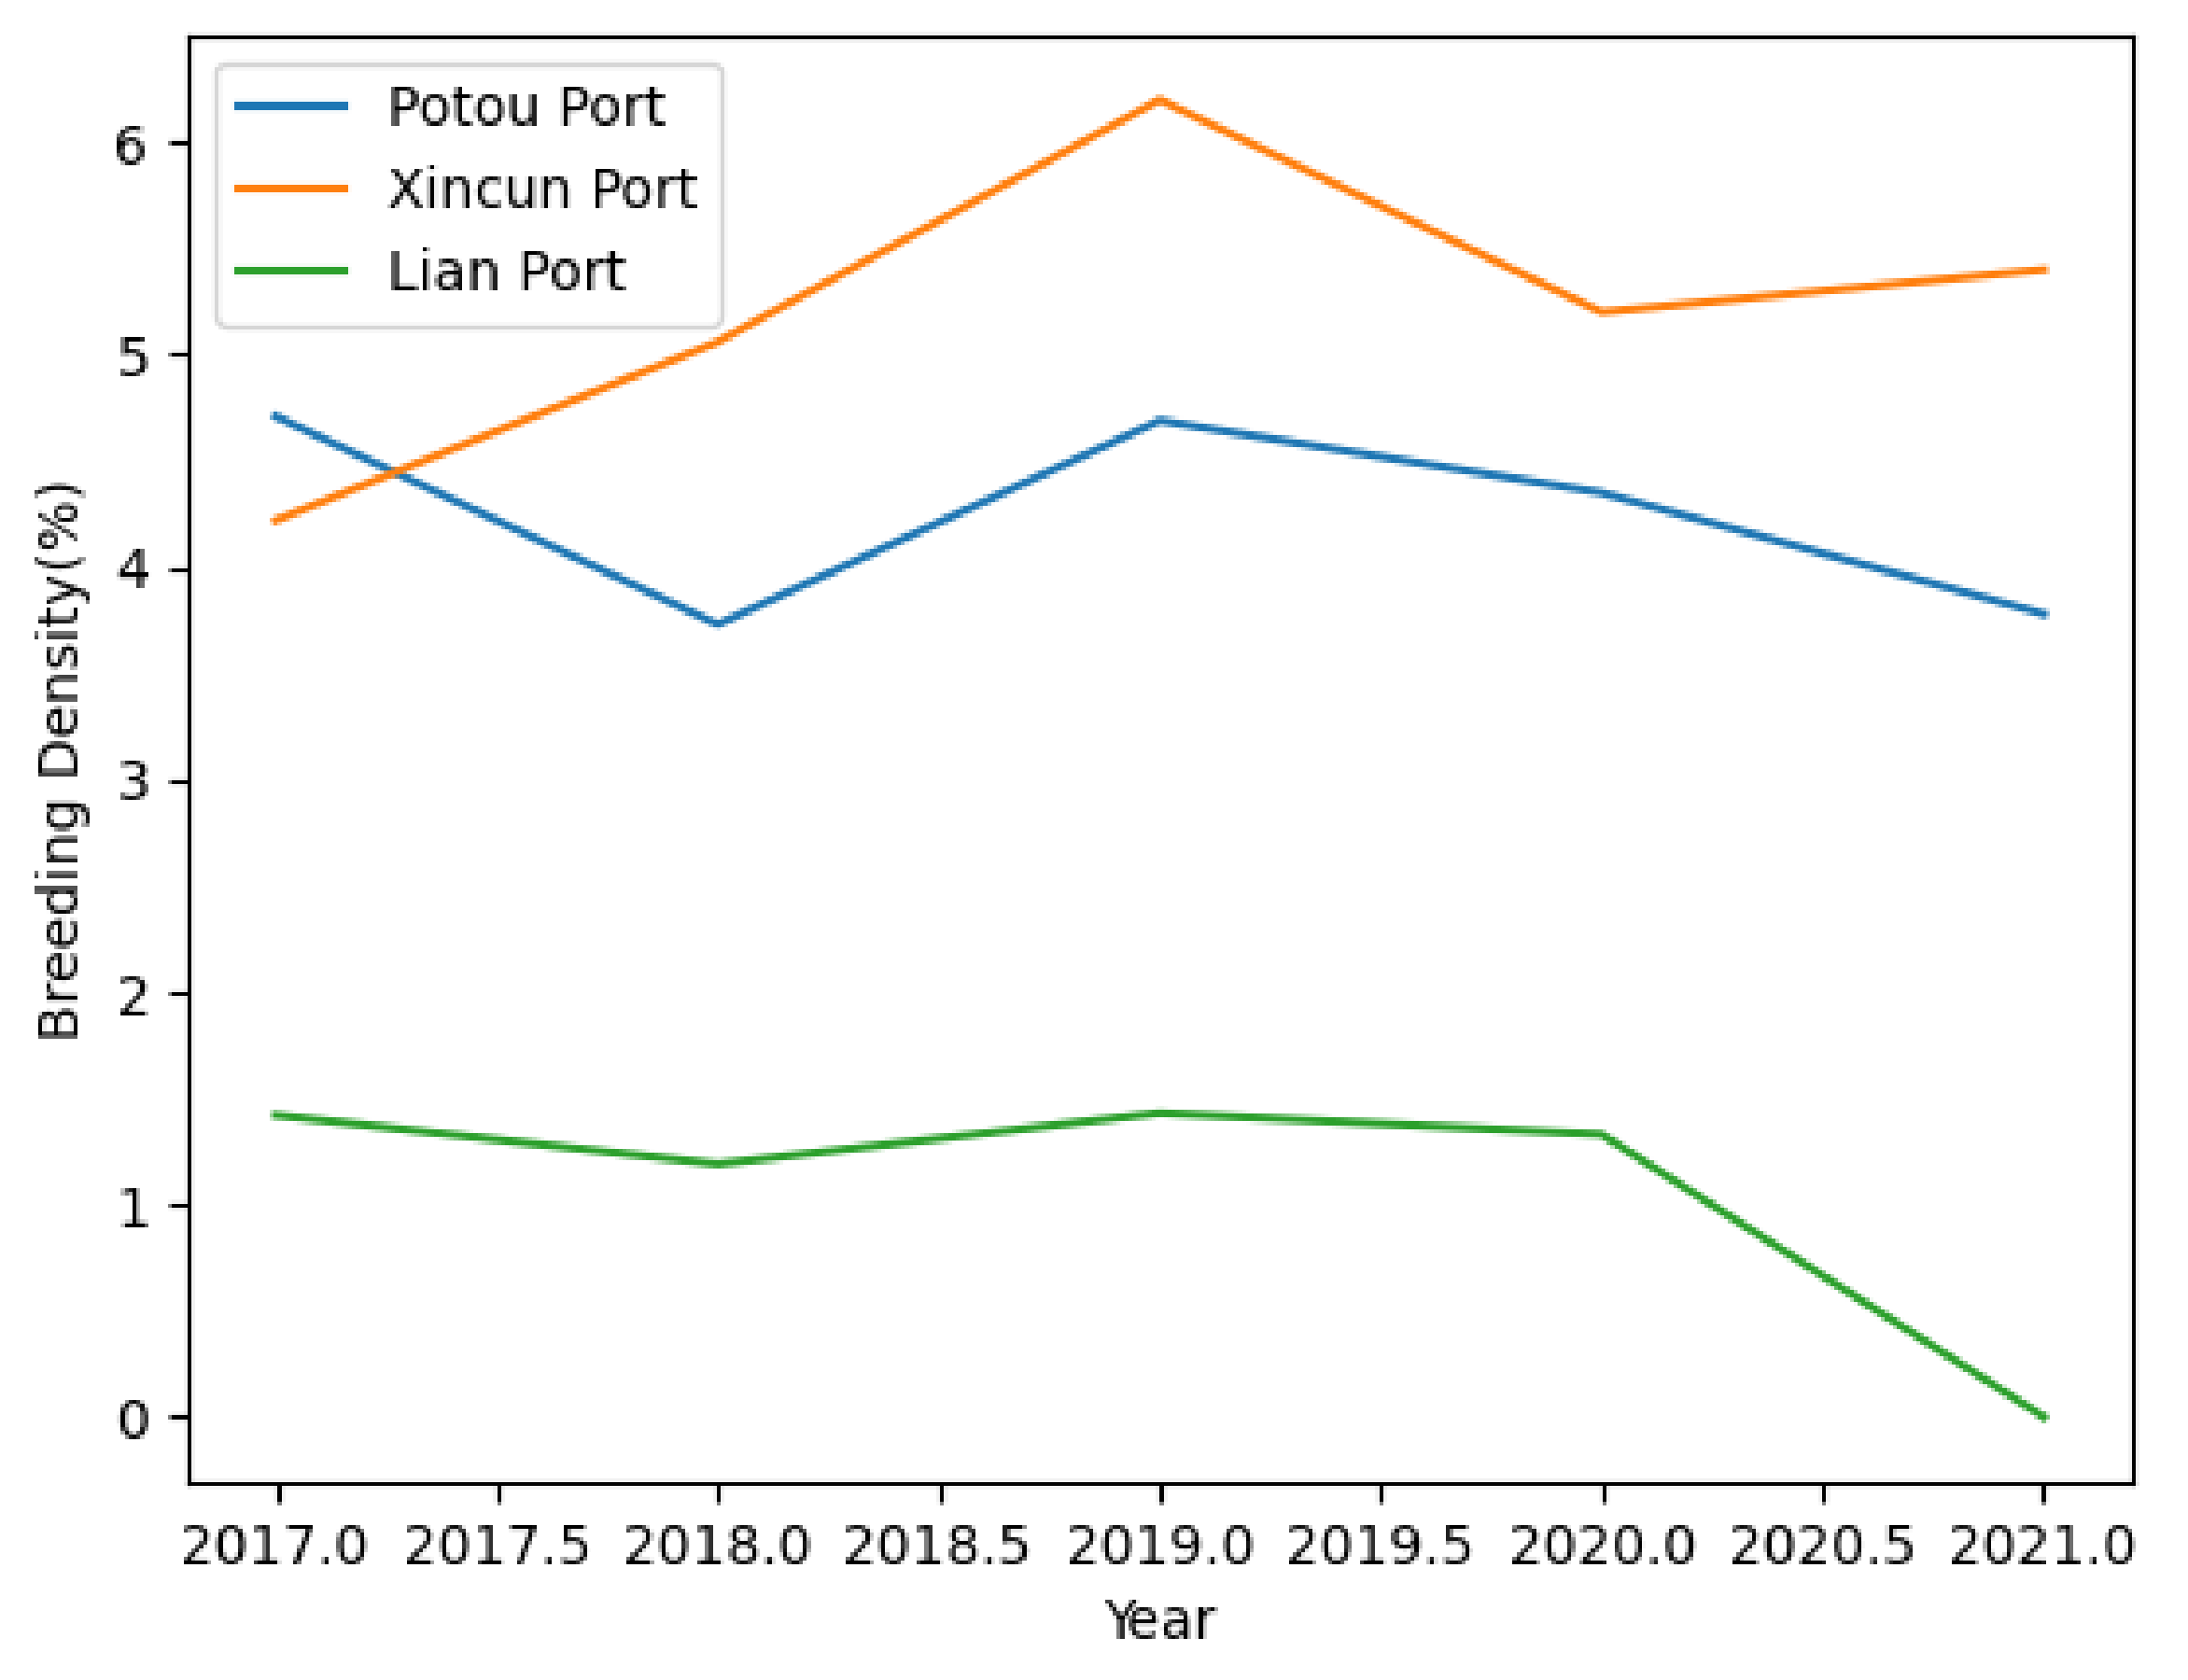
Meanwhile, this paper makes statistics on the cage breeding density of Xincun Port, Potou Port and Li’an Port from 2017 to 2021, and makes a vertical comparison of the cage breeding density of different ports at the same time, and a horizontal comparison of the breeding density of the same port at different times. The experimental result is shown in
Figure 8.
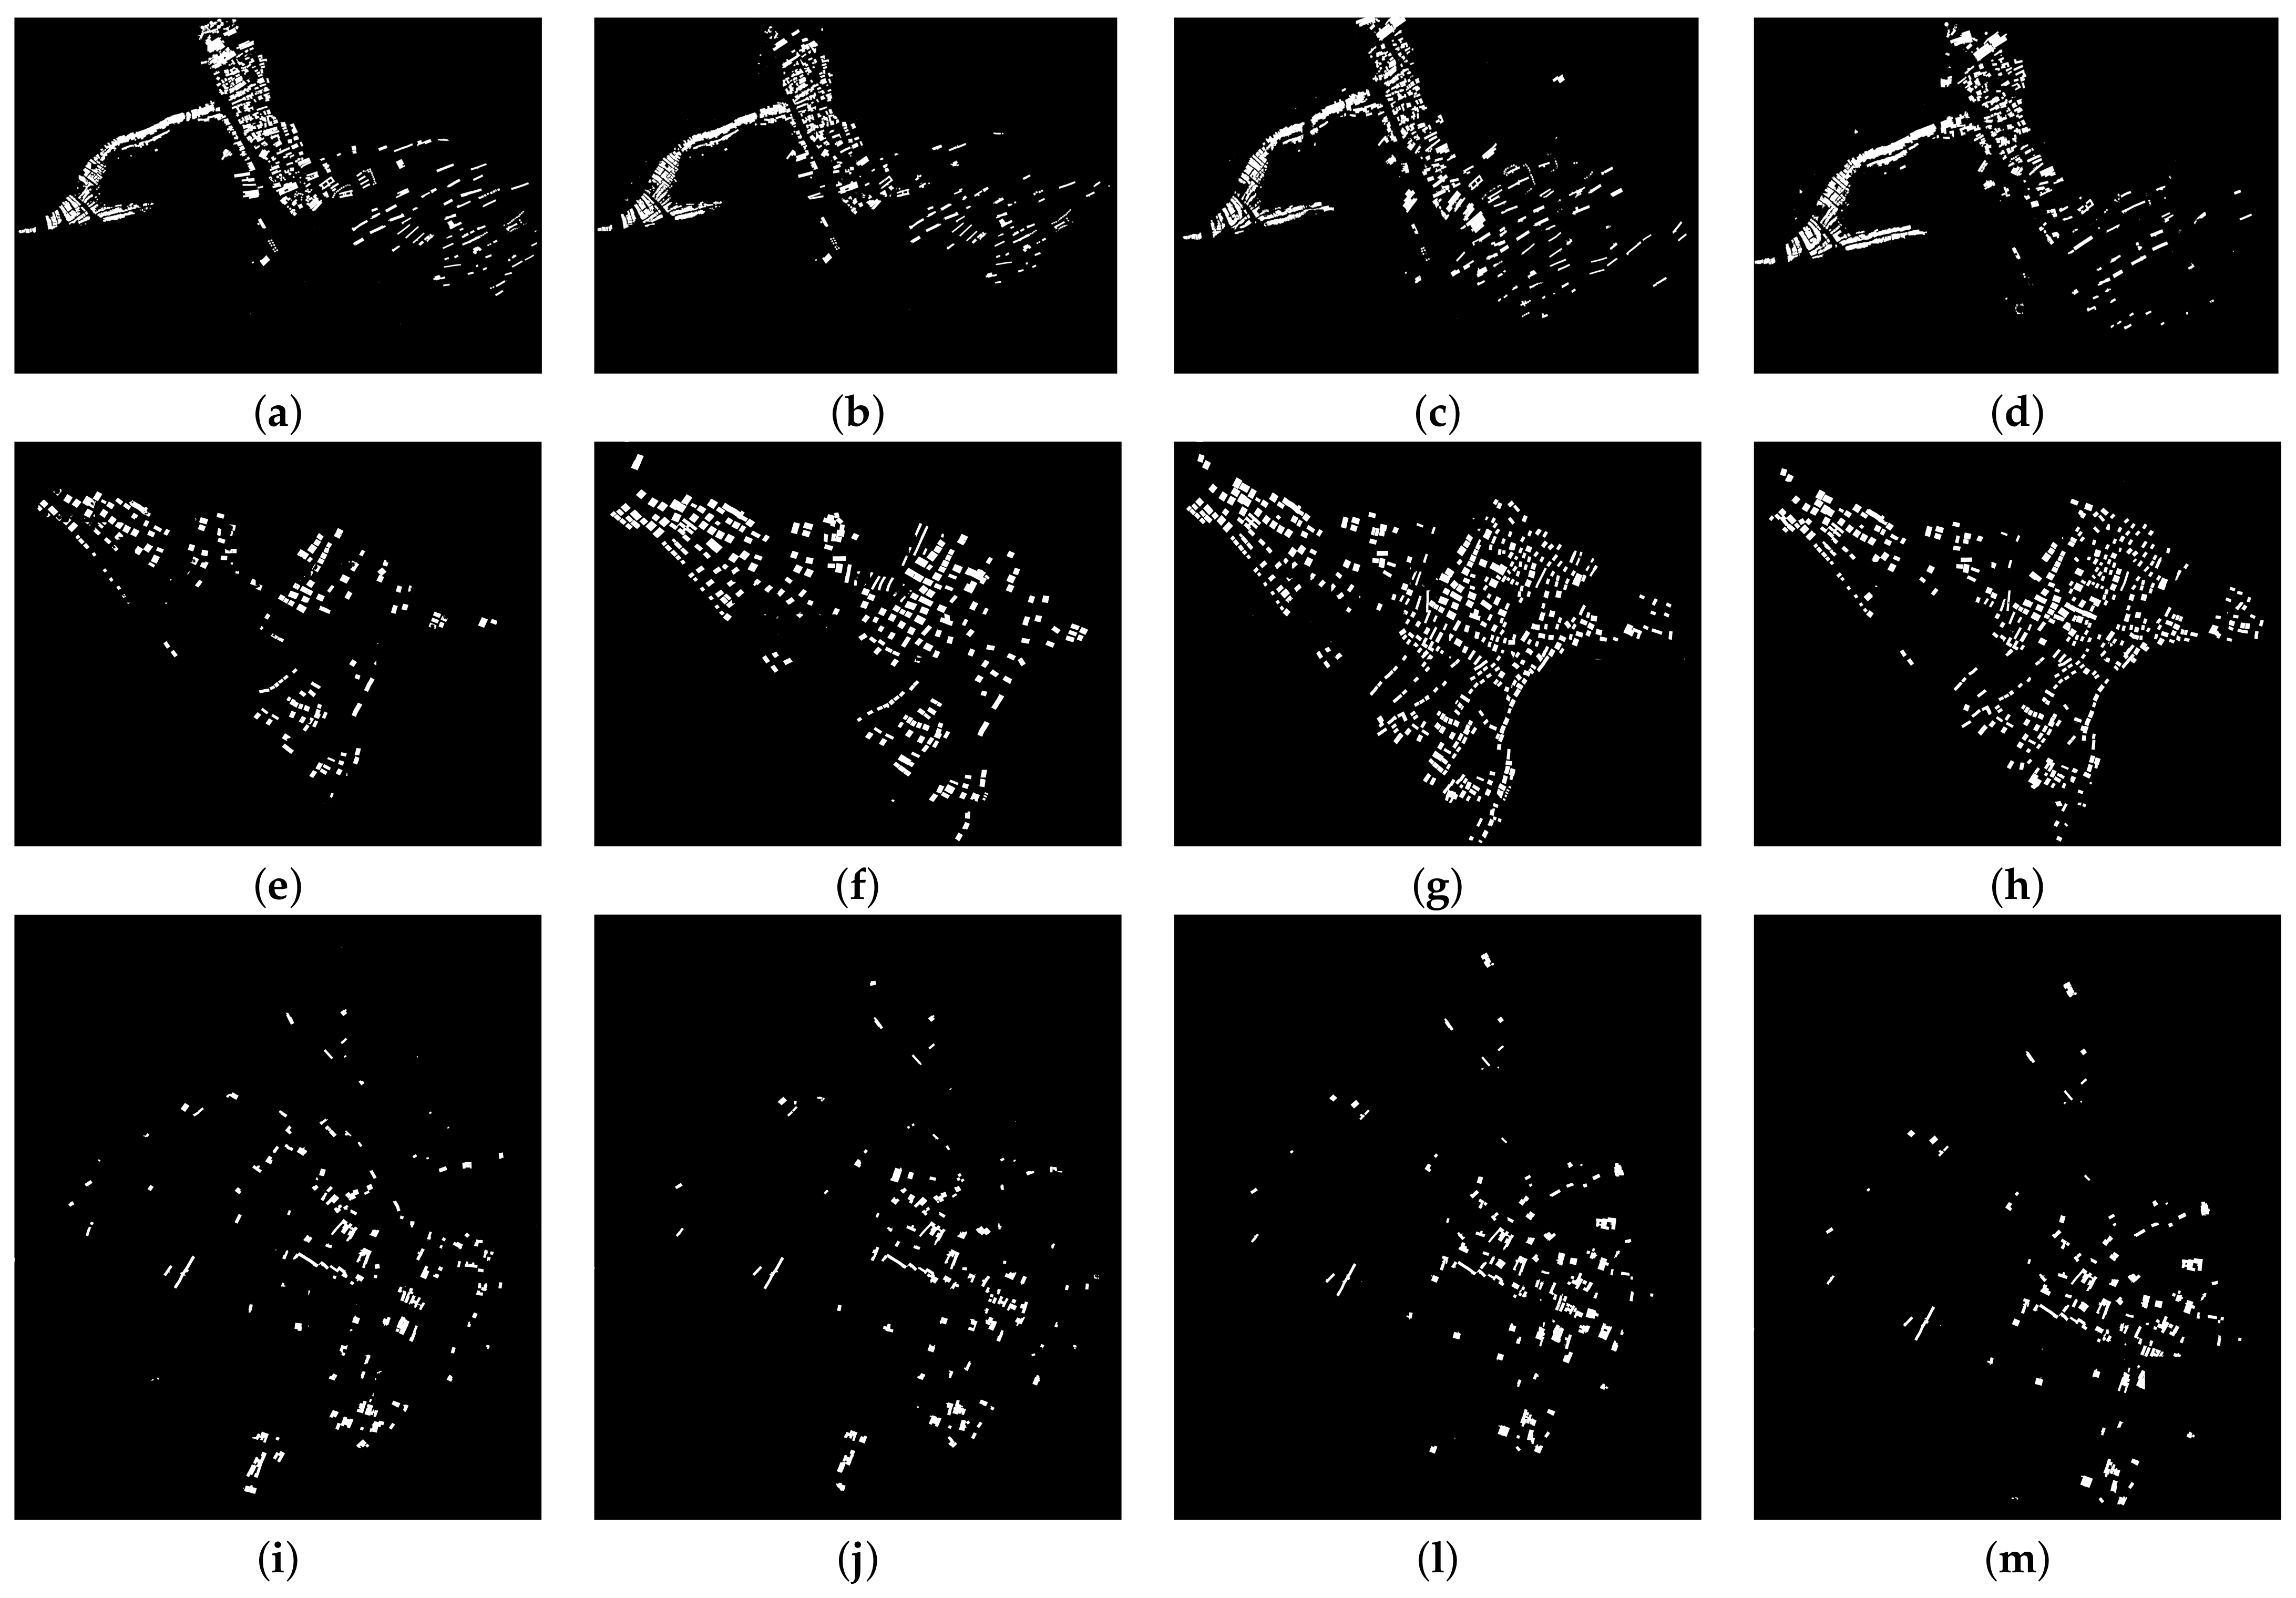
3.5. Qualitative Experiments
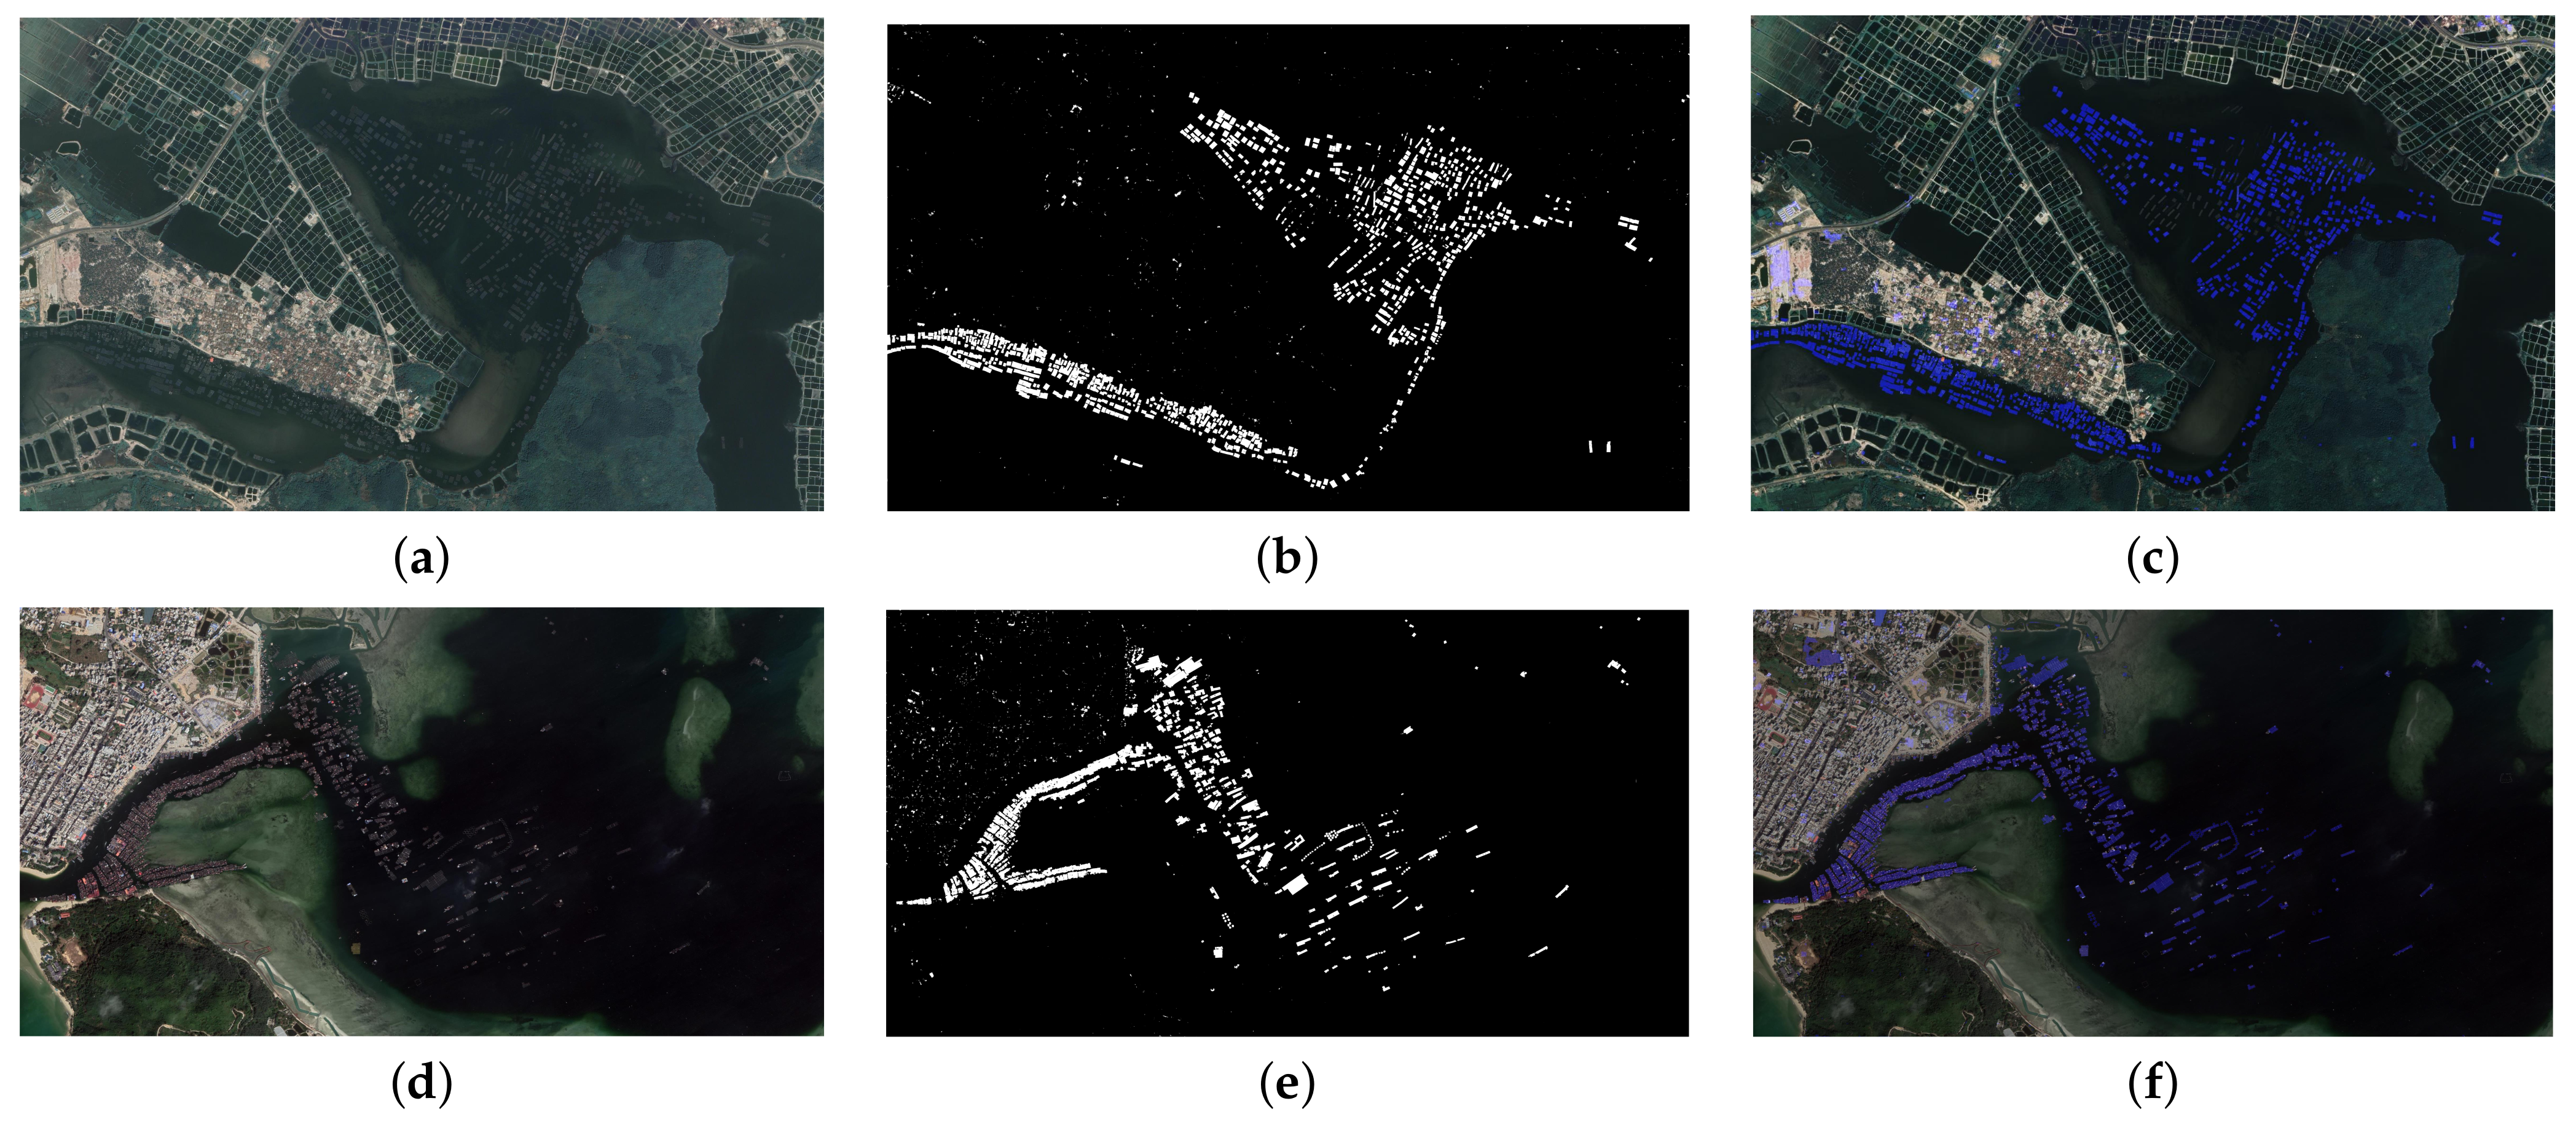
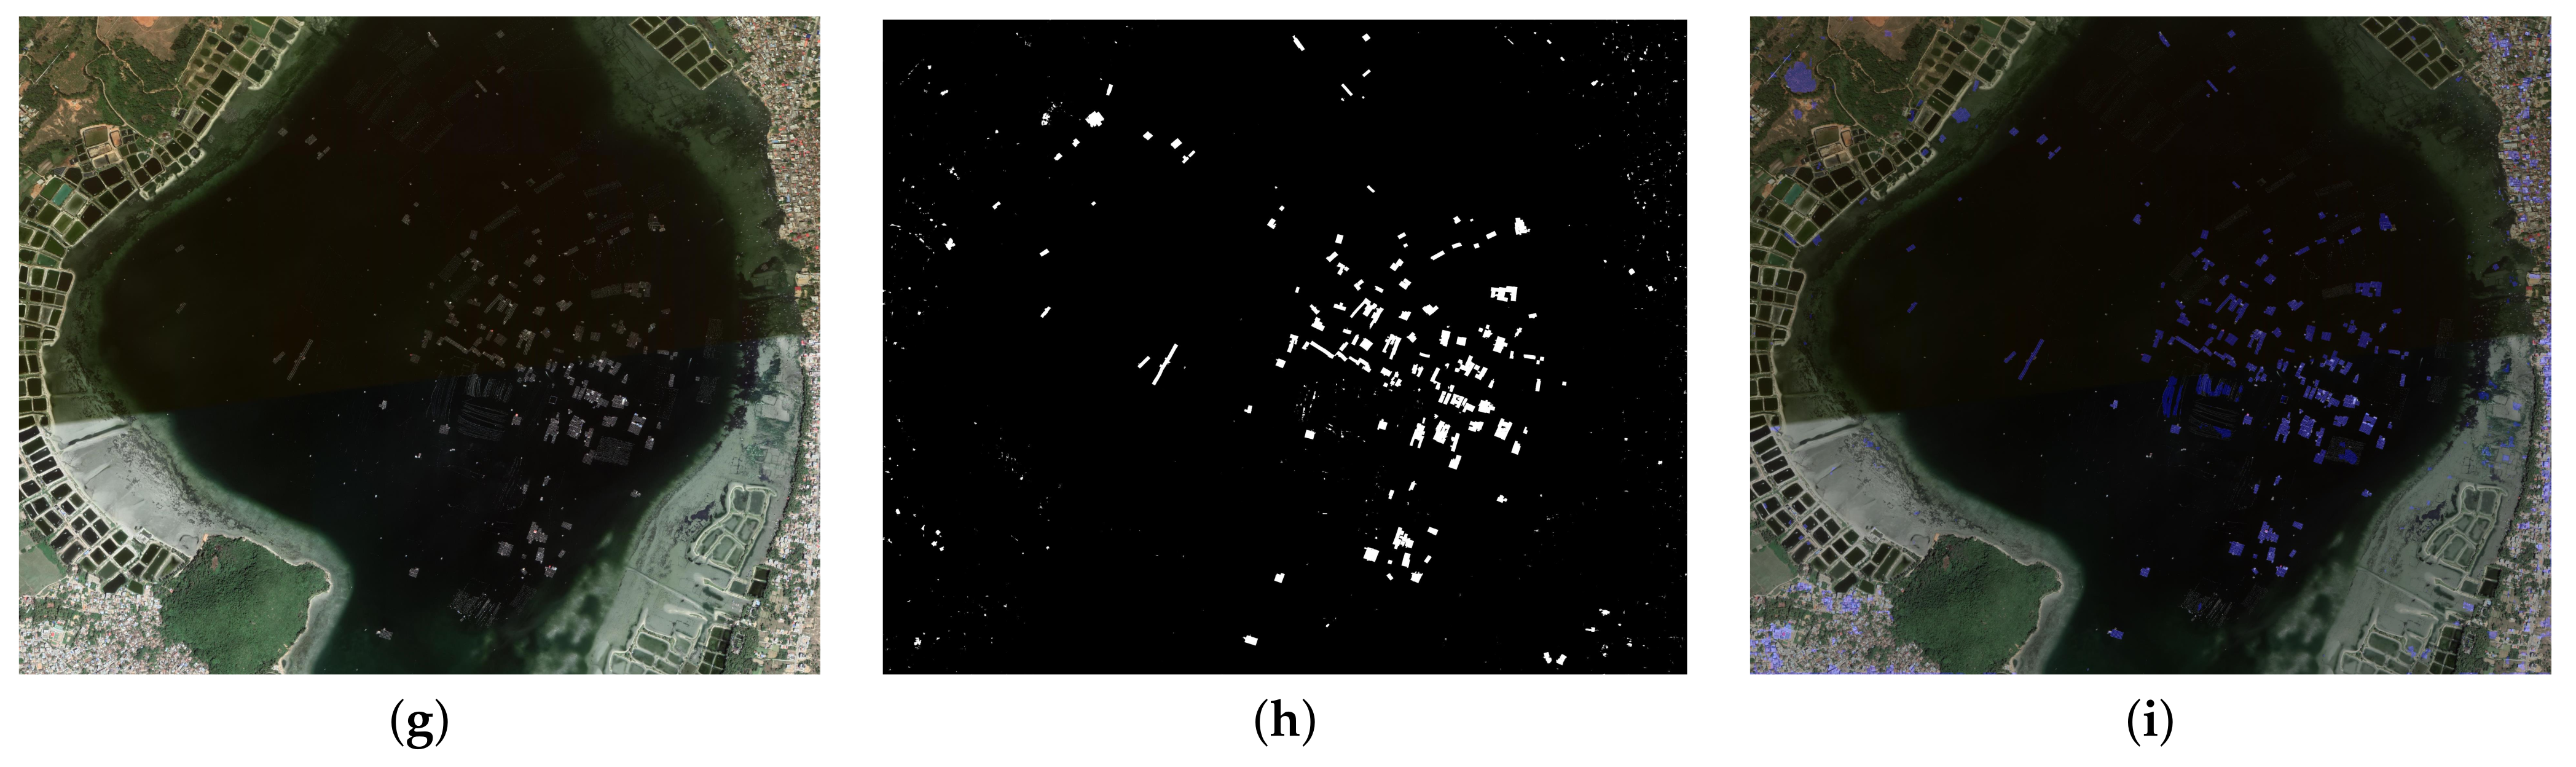
The final test results of the proposed Swin Transformer and ensemble learning strategy-based segmentation scheme are shown in
Figure 9. The breeding situation of different ports in different time periods is shown in
Figure 10. Because there were no culture cages in Li’an Port in 2021, we do not show them.
4. Discussion
The results in
Table 2 and
Table 3 show that the segmentation scheme combined with the ensemble learning strategy outperforms other existing algorithms in terms of mIoU and pixel accuracy compared to segmentation using only the Swin Transformer algorithm. It can also be seen from
Table 2 and
Table 3 that the segmentation network proposed in this paper is less accurate for small targets than large targets. On the one hand, there may be fewer images containing small targets in the dataset, which leads to the model being biased towards larger targets during training; on the other hand, the area of small targets is so small that there are fewer anchors containing them, which also means that the probability of small targets being detected becomes smaller. It can be seen from
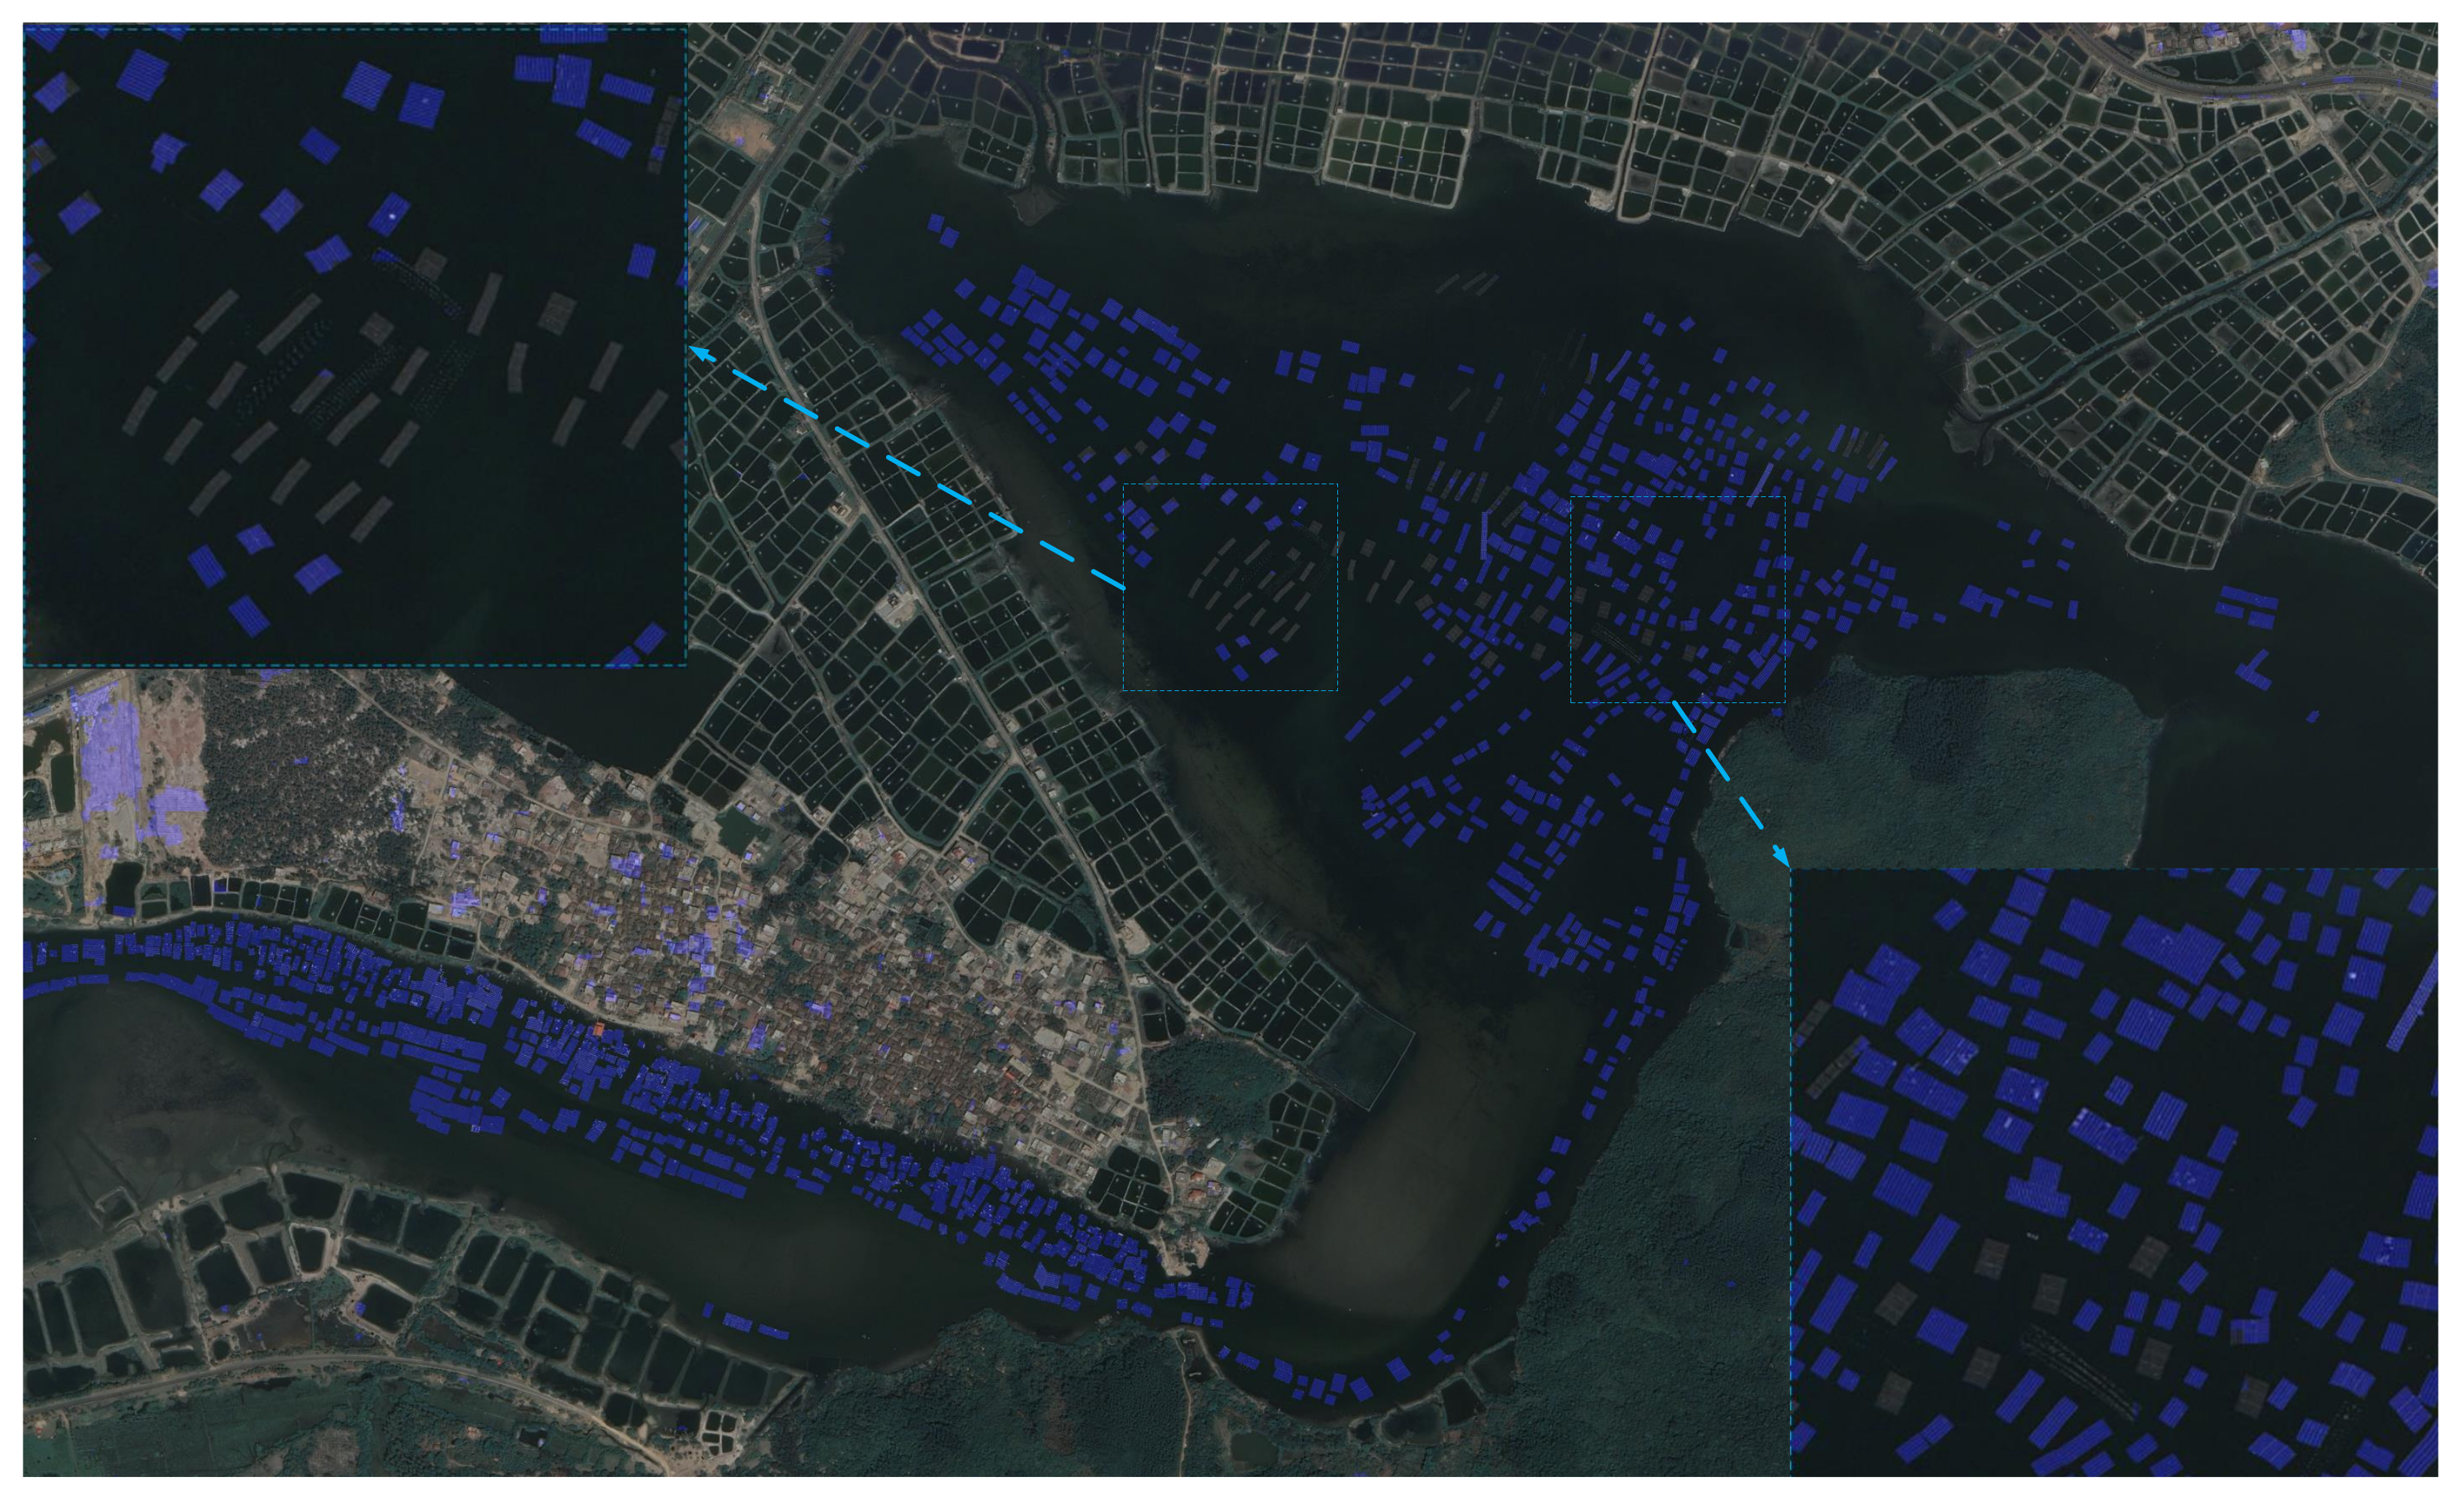
Figure 9 that the segmentation scheme proposed in this paper has a good segmentation effect, but there are still some cages that have not been segmented in the segmentation result graph, as shown in
Figure 11. The image block on the corner of the image is an enlarged view of the corresponding area. First, the farming cages in this part have similar characteristics to the abandoned cages, and there is no obvious farming mouth; otherwise, the cages in this area are built in a different way, which does not appear in the training set, resulting in the model not learning the features.
Considering that the scale of aquaculture varies in different seasons and harsh weather may result in unclear remote sensing images, the experimental pictures are selected from the conditions of the peak season of aquaculture and good weather. The result in
Figure 8 shows that the breeding density of each port reached the maximum in 2019, and then gradually decreased, and even Li’an Port will no longer carry out cage culture in 2021. The breeding density of Potou Port also surpassed that of Xincun Port in 2018, ranking first among the three ports. The breeding density of Li’an Port has always remained the lowest. Through efficient statistics on the breeding density of cages in different ports, effective macro-control can be achieved to prevent the unreasonable layout of breeding cages.
Using deep learning technology to count the distribution density of cages, on the one hand, can greatly improve the success rate of nursery and adult fish breeding, and reduce the possibility of ecological pollution; on the other hand, the introduction of deep learning technology is conducive to the establishment of a new modern smart breeding model. In large-scale and high-density aquaculture with cluster effect, efficient and scientific data analysis can reduce the input of human and material resources. At the same time, it can also reduce the loss caused by human subjective judgment errors and lag, thereby improving the economic benefits of aquaculture. From the perspective of maintaining the ecosystem, the introduction of deep learning technology is conducive to the rational and scientific layout of the marine aquaculture industry, promotes the establishment of green and healthy styles of marine aquaculture, and protects the ecological environment in harbour areas. This innovative style plays a significant role in promoting the development of environment-friendly aquaculture, reducing the use of drugs, reducing the breeding of pathogens and realizing pollution-free aquaculture, and can provide strong technical support for the sustainable development of marine aquaculture.
5. Conclusions
In aquaculture, the normal growth of fish is closely related to the density of mariculture. Therefore, in order to solve the density statistics of mariculture cages, this paper adopts the Swin Transformer neural network algorithm, an accurate segmentation scheme for remote sensing images of cages based on the Swin Transformer and ensemble learning strategy. In order to verify the effectiveness of the scheme proposed in this paper, comprehensive comparison experiments are conducted on U-Net, Mask-RCNN, SOLOv2, UCTransNet, Attention U-Net and Swin Transformer in the experiments. The experimental results show that the segmentation scheme proposed in this paper can produce optimal segmentation results with mIoU reaching 82.34%.
Although the scheme proposed in this paper has produced a good segmentation effect on the remote sensing images of cages, there are still shortcomings. On the one hand, for the problem that some of the cages cannot be segmented, future attempts can be made to incorporate temporal features and spatial features. On the other hand, the scheme proposed in this paper is not effective in segmenting small targets, and future attempts can be made to combine image pyramids and multi-scale sliding window methods to improve the segmentation accuracy of mariculture cages. At the same time, the seasonality of aquaculture and how to extract high-definition remote sensing images in harsh environments can also be studied in the future.
Author Contributions
Conceptualization, Z.H., W.W. and L.X.; methodology, L.X. and C.Z.; software, L.X. and C.Z.; validation, Z.H., L.X. and C.Z.; formal analysis, Z.H., L.X. and C.Z.; investigation, Z.H. and W.W.; resources, Z.H.; data curation, L.X. and C.Z.; writing—original draft preparation, L.X. and C.Z.; writing—review and editing, Z.H.; visualization, L.X.; supervision, Z.H.; project administration, Z.H. and W.W.; funding acquisition, Z.H. All authors have read and agreed to the published version of the manuscript.
Funding
This research was funded by the Hainan Province Science and Technology Special Fund (Grant No. ZDYF2022SHFZ039), the Natural Science Foundation of Hainan Province (Grant No. 620RC564) and the National Natural Science Foundation of China (Grant No. 61963012 and Grant No. 62161010).
Institutional Review Board Statement
Not applicable.
Informed Consent Statement
Not applicable.
Data Availability Statement
Conflicts of Interest
The authors declare no conflict of interest.
References
- Luo, L.; Shu, T.; Wen, Y.M. The impact of aquaculture on offshore ecological environment. Aquat. Sci. 2002, 10, 28–30. [Google Scholar] [CrossRef]
- Wu, L.M.; Kou, X.M.; Han, G.M.; Wang, S.H.; Zhang, J.H.; Tang, H.J.; Xu, R.; Bi, J.H. Effects of different culture densities on growth performance, digestive enzyme activity and non-specific immunity of the broad-bodied golden leech. Chin. Mater. Medica 2021, 1823–1826. [Google Scholar] [CrossRef]
- Nong, G.C.; Zhao, G.L.; Zhao, S.L.; Gong, D.R.; Gao, Z.N.; Xia, W.M.; Nong, F.M.; Li, X.H. Experiments on tilapia net tank culture at different densities. Aquaculture 2020, 41, 43–45. [Google Scholar]
- Dai, Y.X.; Feng, X.Y.; Dai, Y.L.; Huang, H. The suitable density of tilapia culture. Zhejiang Agric. Sci. 2020, 61, 1446–1449. [Google Scholar]
- Chen, Y.S.; Zhao, L.N.; Wu, Y.J.; Tian, C.Z.; Zhu, G.L. Research on improving U-Net for remote sensing image segmentation of small crops. Sci. Technol. Innov. 2021, 11–14. [Google Scholar]
- Yang, X.Y.; Wang, X.L. A remote sensing image building segmentation model combining multi-scale attention and edge supervision. Adv. Lasers Optoelectron. 2021, 1–21. Available online: http://kns.cnki.net/kcms/detail/31.1690.TN.20211125.1323.002.html (accessed on 26 November 2021).
- Zhang, B.; Zhang, X.J.; Zhao, B.C.; Zhang, J.X.; Li, Z.J. Application of an improved DenseAspp net in remote sensing image segmentation. Comput. Appl. Softw. 2021, 38, 46–52. [Google Scholar]
- Yu, C.; Hu, Z.; Li, R.; Xia, X.; Zhao, Y.; Fan, X.; Bai, Y. Segmentation and density statistics of mariculture cages from remote sensing images using mask R-CNN. Inf. Process. Agric. 2021, 9, 417–430. [Google Scholar] [CrossRef]
- Yu, C.; Liu, Y.; Xia, X.; Hu, Z.; Fu, S. Precise segmentation of remote sensing cage images based on SegNet and voting mechanism. Appl. Eng. Agric. 2022, 38, 573–581. [Google Scholar]
- Yu, C.; Liu, Y.; Hu, Z.; Xia, X. Accurate segmentation of remote sensing cages based on U-Net and voting mechanism. Proc. SPIE 2022, 12166, 727–732. [Google Scholar]
- Dosovitskiy, A.; Beyer, L.; Kolesnikov, A.; Weissenborn, D.; Zhai, X.; Unterthiner, T.; Dehghani, M.; Minderer, M.; Heigold, G.; Gelly, S.; et al. An image is worth 16 × 16 words: Transformers for image recognition at scale. arXiv 2020, arXiv:2010.11929. [Google Scholar]
- Carion, N.; Massa, F.; Synnaeve, G.; Usunier, N.; Kirillov, A.; Zagoruyko, S. End-to-end object detection with transformers. In Proceedings of the European Conference on Computer Vision, Glasgow, UK, 23–28 August 2020; Springer: Cham, Switzerland, 2020; pp. 213–229. [Google Scholar]
- Liu, Z.; Lin, Y.; Cao, Y.; Hu, H.; Wei, Y.; Zhang, Z.; Lin, S.; Guo, B. Swin transformer: Hierarchical vision transformer using shifted windows. In Proceedings of the 2021 IEEE/CVF International Conference on Computer Vision (ICCV), Montreal, BC, Canada, 11–17 October 2021; pp. 9992–10002. [Google Scholar]
- Windeatt, T.; Ardeshir, G. Decision tree simplification for classifier ensembles. Int. J. Pattern Recognit. Artif. Intell. 2004, 18, 749–776. [Google Scholar] [CrossRef]
- Wolpert, D.H. Stacked generalization. Neural Netw. 1992, 5, 241–259. [Google Scholar] [CrossRef]
- Luo, M.; Chang, S.; Yang, L.; Feng, Z. Cartridge Case Image Mosaic Based on SIFT and Voting Mechanism. In Proceedings of the 2009 International Conference on Information Engineering and Computer Science, Wuhan, China, 19–20 December 2009; pp. 1–4. [Google Scholar]
- Long, J.; Shelhamer, E.; Darrell, T. Fully convolutional networks for semantic segmentation. In Proceedings of the IEEE Conference on Computer Vision and Pattern Recognition, Boston, MA, USA, 7–12 June 2015; pp. 3431–3440. [Google Scholar]
- Badrinarayanan, V.; Kendall, A.; Cipolla, R. Segnet: A deep convolutional encoder-decoder architecture for image segmentation. IEEE Trans. Pattern Anal. Mach. Intell. 2017, 39, 2481–2495. [Google Scholar] [CrossRef] [PubMed]
- Xu, Y.; Zhang, Y.; Wang, H.; Liu, X. Underwater image classification using deep convolutional neural networks and data augmentation. In Proceedings of the 2017 IEEE International Conference on SIGNAL Processing, Communications and Computing (ICSPCC), Xiamen, China, 22–25 October 2017; pp. 1–5. [Google Scholar]
- Mansourifar, H.; Chen, L.; Shi, W. Virtual big data for GAN based data augmentation. In Proceedings of the 2019 IEEE International Conference on Big Data (Big Data), Los Angeles, CA, USA, 9–12 December 2019; pp. 1478–1487. [Google Scholar]
- Jiang, H.; Wen, J. Remote sensing image segmentation based on human visual system region-split and graph cut. In Applied Mechanics and Materials; Trans Tech Publications Ltd.: Wollerau, Switzerland, 2011; Volume 55, pp. 115–118. [Google Scholar]
- Torralba, A.; Russell, B.C.; Yuen, J. Labelme: Online image annotation and applications. Proc. IEEE 2010, 98, 1467–1484. [Google Scholar] [CrossRef]
- Sharma, S.; Khanna, P. Roi segmentation using local binary image. In Proceedings of the 2013 IEEE International Conference on Control System, Computing and Engineering, Penang, Malaysia, 9 November–1 December 2013; pp. 136–141. [Google Scholar]
- Xu, X.; Feng, Z.; Cao, C.; Li, M.; Wu, J.; Wu, Z.; Shang, Y.; Ye, S. An Improved Swin Transformer-Based Model for Remote Sensing Object Detection and Instance Segmentation. Remote Sens. 2021, 13, 4779. [Google Scholar] [CrossRef]
- Tang, Z.; Pan, B.; Liu, E.; Xu, X.; Shi, T.; Shi, Z. SRDA-Net: Super-Resolution Domain Adaptation Networks for Semantic Segmentation. arXiv 2020, arXiv:2005.06382. [Google Scholar]
- Ronneberger, O.; Fischer, P.; Brox, T. U-net: Convolutional networks for biomedical image segmentation. In Proceedings of the International Conference on Medical Image Computing and Computer-Assisted Intervention, Lima, Peru, 4–8 October 2020; Springer: Cham, Switzerland, 2015; pp. 234–241. [Google Scholar]
- He, K.; Gkioxari, G.; Dollár, P.; Girshick, R. Mask r-cnn. In Proceedings of the IEEE International Conference on Computer Vision, Venice, Italy, 22–29 October 2017; pp. 2961–2969. [Google Scholar]
- Wang, X.; Zhang, R.; Kong, T.; Li, L.; Shen, C. Solov2: Dynamic, faster and stronger. arXiv 2020, arXiv:2003.10152. [Google Scholar]
- Wang, H.; Cao, P.; Wang, J.; Zaiane, O.R. UCTransNet: Rethinking the skip connections in U-Net from a channel-wise perspective with transformer. arXiv 2021, arXiv:2109.04335. [Google Scholar] [CrossRef]
- Oktay, O.; Schlemper, J.; Folgoc, L.L.; Lee, M.; Heinrich, M.; Misawa, K.; Mori, K.; McDonagh, S.; Hammerla, N.Y.; Kainz, B.; et al. Attention u-net: Learning where to look for the pancreas. arXiv 2018, arXiv:1804.03999. [Google Scholar]
| Publisher’s Note: MDPI stays neutral with regard to jurisdictional claims in published maps and institutional affiliations. |
© 2022 by the authors. Licensee MDPI, Basel, Switzerland. This article is an open access article distributed under the terms and conditions of the Creative Commons Attribution (CC BY) license (https://creativecommons.org/licenses/by/4.0/).


