1. Introduction
High-resolution spectroscopy in the near- and mid-infrared wavelength ranges plays an essential role in astronomy and chemical gas detection. However, in ground-based observations, systematic studies of infrared spectroscopy are hindered by solid atmospheric extinction, which limits the observed wavelength range, and the extensive thermal background, which reduces sensitivity in most cases. Thus, high-resolution spectroscopy from space in this wavelength range has significant gain but some issues, in particular, the required size and weight of the instrument. In recent years, the echelle grating spectrometer has been applied due to its broader spectral bandwidth and resolution higher than that of other instruments. The echelle spectrometer is used for detection in chemical, metallurgical, and other industrial production types, as well as in fields such as medicine, agriculture, and food hygiene. A classic echelle spectrometer uses an echelle grating as its primary dispersion element and a prism or other grating as the second dispersive element. These two dispersive elements operate in cross directions, resulting in a two-dimensional image on the detection plane [
1]. Although cross-dispersion enables spectrometers to achieve a wide wavelength range and high resolution in a compact space, the resulting optical structure becomes quite complex; in addition, many researchers have suggested using cylindrical lenses or annular mirrors as compensation devices to correct for astigmatism, further increasing the system’s complexity. Additionally, increasing the surface area of the optical element will reduce the light transmission efficiency of the optical system. Echelle spectrometers, with echelle gratings as dispersive elements, have the advantages of high resolution, high dispersion rate, high diffraction frequency, full-spectrum transient direct reading, and low detection limit. However, because the grating works in an advanced state, the spectral order overlap phenomenon occurs as a result. In general, a secondary dispersion element must be applied to eliminate interference between spectral orders. Therefore, suitable auxiliary dispersive components have also become an important part of echelle spectrometer design. To achieve broadband spectral detection, such as for missile tail flames, the choice of a spectrometer is critical. Traditional Fourier transform spectrometers are the typical instrument of choice in infrared field applications due to their potential for high resolution, high signal-to-noise ratios, and broad spectral coverage. However, considering the working environment factors, their performance is limited; specifically, component movement may cause interference, thereby affecting the device’s resolution, while the signal-to-noise ratio is often low when mounted on an airborne platform. If a typical plane grating spectrometer is chosen, achieving high resolution requires a large-area grating, increasing the instrument’s overall volume. With the development of two-dimensional detector technology and grating manufacturing technology, immersion gratings have increasingly become an area of interest for the development of light, compact, high-resolution spectrometers [
2,
3,
4,
5]. Moreover, the airborne echelle spectrometer enables the detection of chemical elements released by nuclear radiation during nuclear material production, storage, and use. Therefore, the development of a mid-band infrared immersion grating spectrometer is described in this paper.
In this work, we present the optical structure of an immersion echelle spectrometer with a wide wavelength range from 3.7 to 4.8 μm. The structure features a simplified design with an immersion grating used as a dispersive element in contrast to the traditional grating used in imaging spectrometers. An off-axis parabolic mirror is used as a collimating mirror, an off-axis three-mirror optical system is used as the converging mirror, and a concave grating is used as an additional dispersive element for aberration correction to achieve a high-dispersion, broad, free spectrum. The three-mirror anastigmatic system structure improves the device’s optical transmittance. In this study, the relationship between the proposed device’s imaging performance and optical parameters is analyzed, and a detailed design for the spectrometer is provided based on the parameter constraints for each element. This technique is also suitable for application to other conditions.
2. Dispersers and Methods
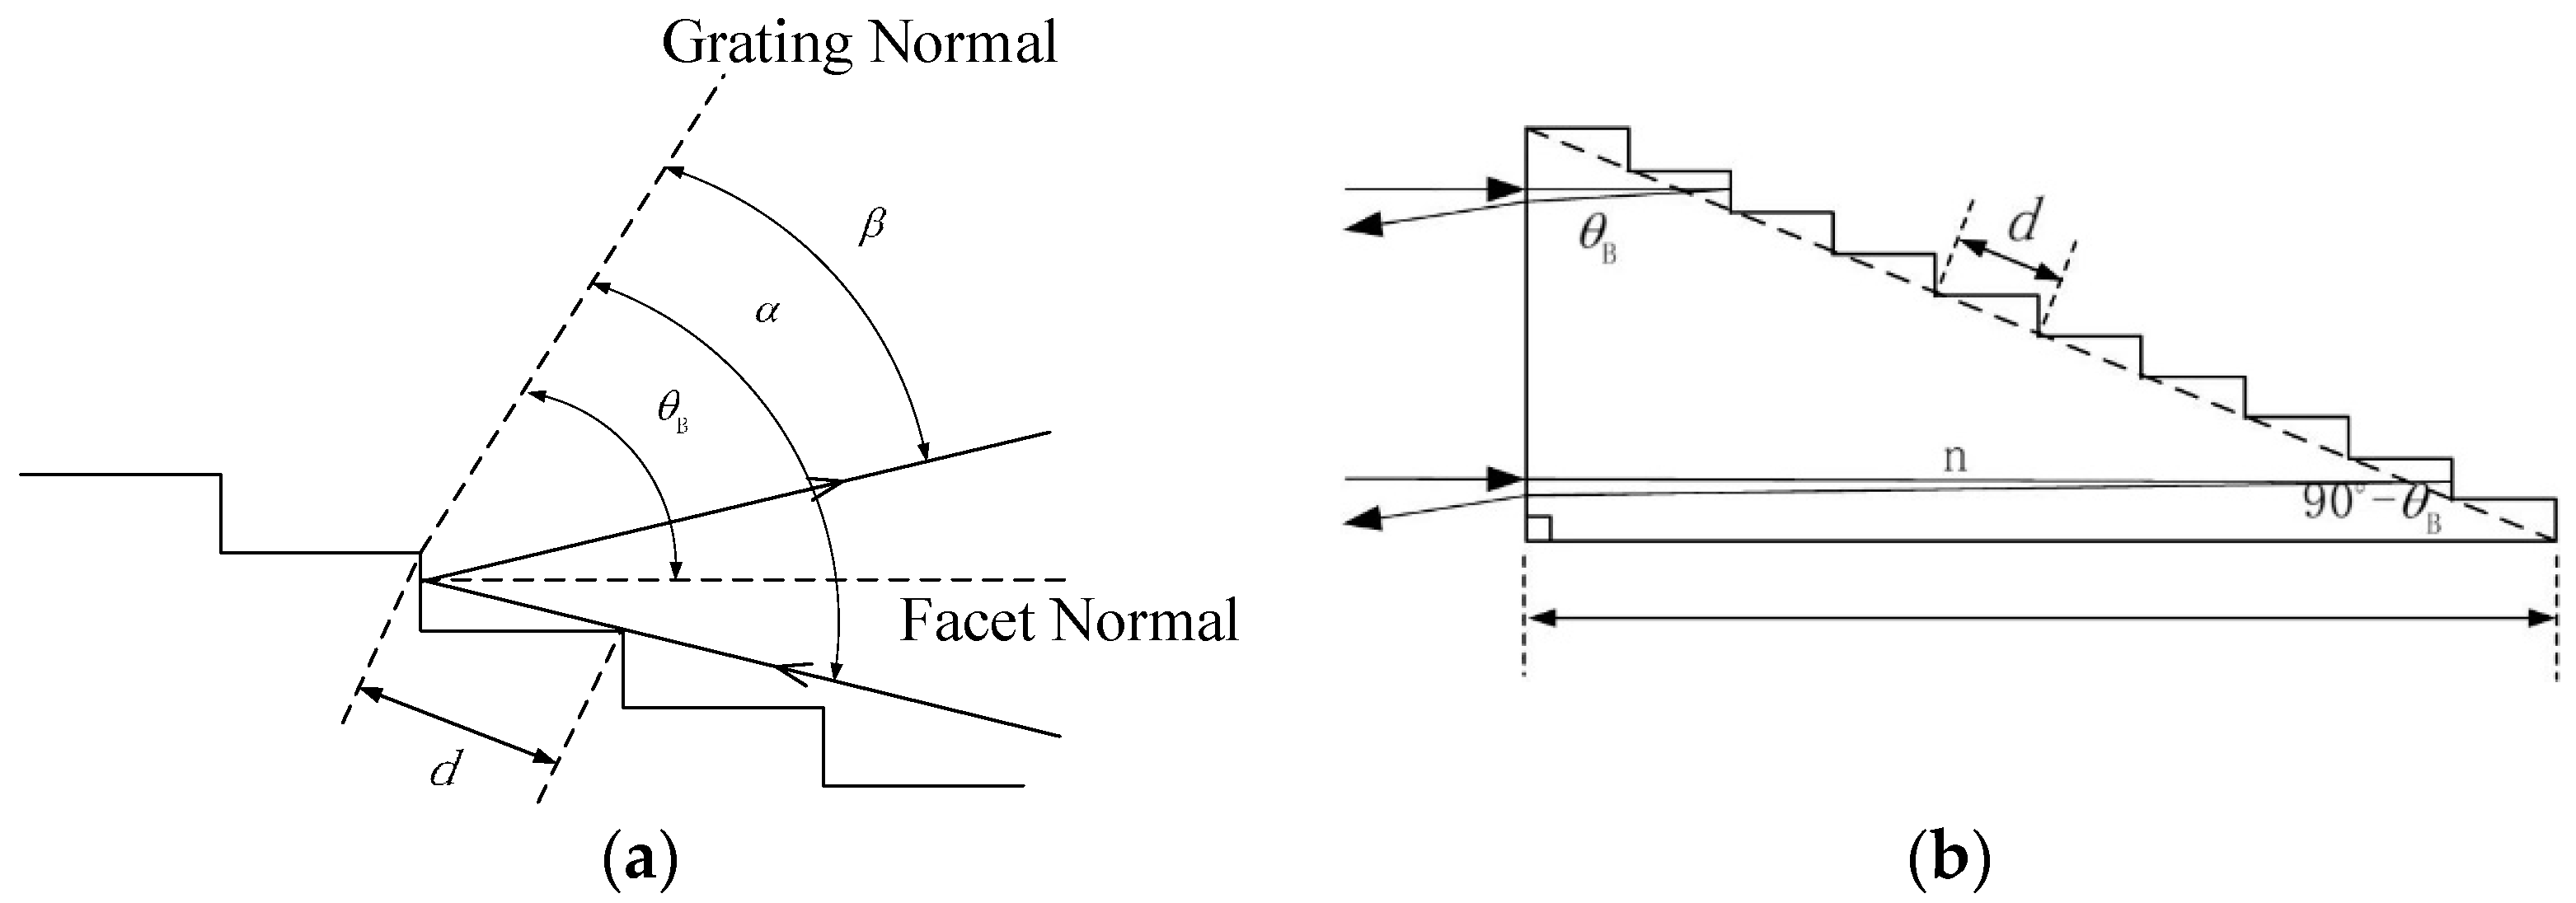
An immersion grating is a plane diffraction grating combined with a prism (i.e., immersion medium) diffractive element, where the diffractive surface is immersed in a material with a high refractive index (
n > 2); relative to a non-immersion grating of the same face size, the immersion grating’s resolution can be increased n times [
6,
7]. The maximum spectral resolution of the immersion grating at wavelength
λ is shown in
Figure 1.
The immersion grating equation is given in Equation (1). In this equation, m represents the diffraction order,
λ represents the wavelength,
n represents the refractive index of the light propagation medium,
d represents the groove spacing, and
α and
β represent the incident angle and diffraction angle, respectively. For gratings operating under Littrow conditions, the diffraction corresponds to the following equation [
8]:
The maximum spectral resolution, R, of an immersion grating at wavelength
λ is given by:
L is the length of the bottom edge of the immersion grating.
These equations demonstrate that immersion gratings can achieve improved spectral resolution by a factor of
n and reduce the dispersive power of the additional dispersive element by a factor of
n compared to those of a reflective echelle grating of the same aperture. In the infrared band, optical materials with a high refractive index (
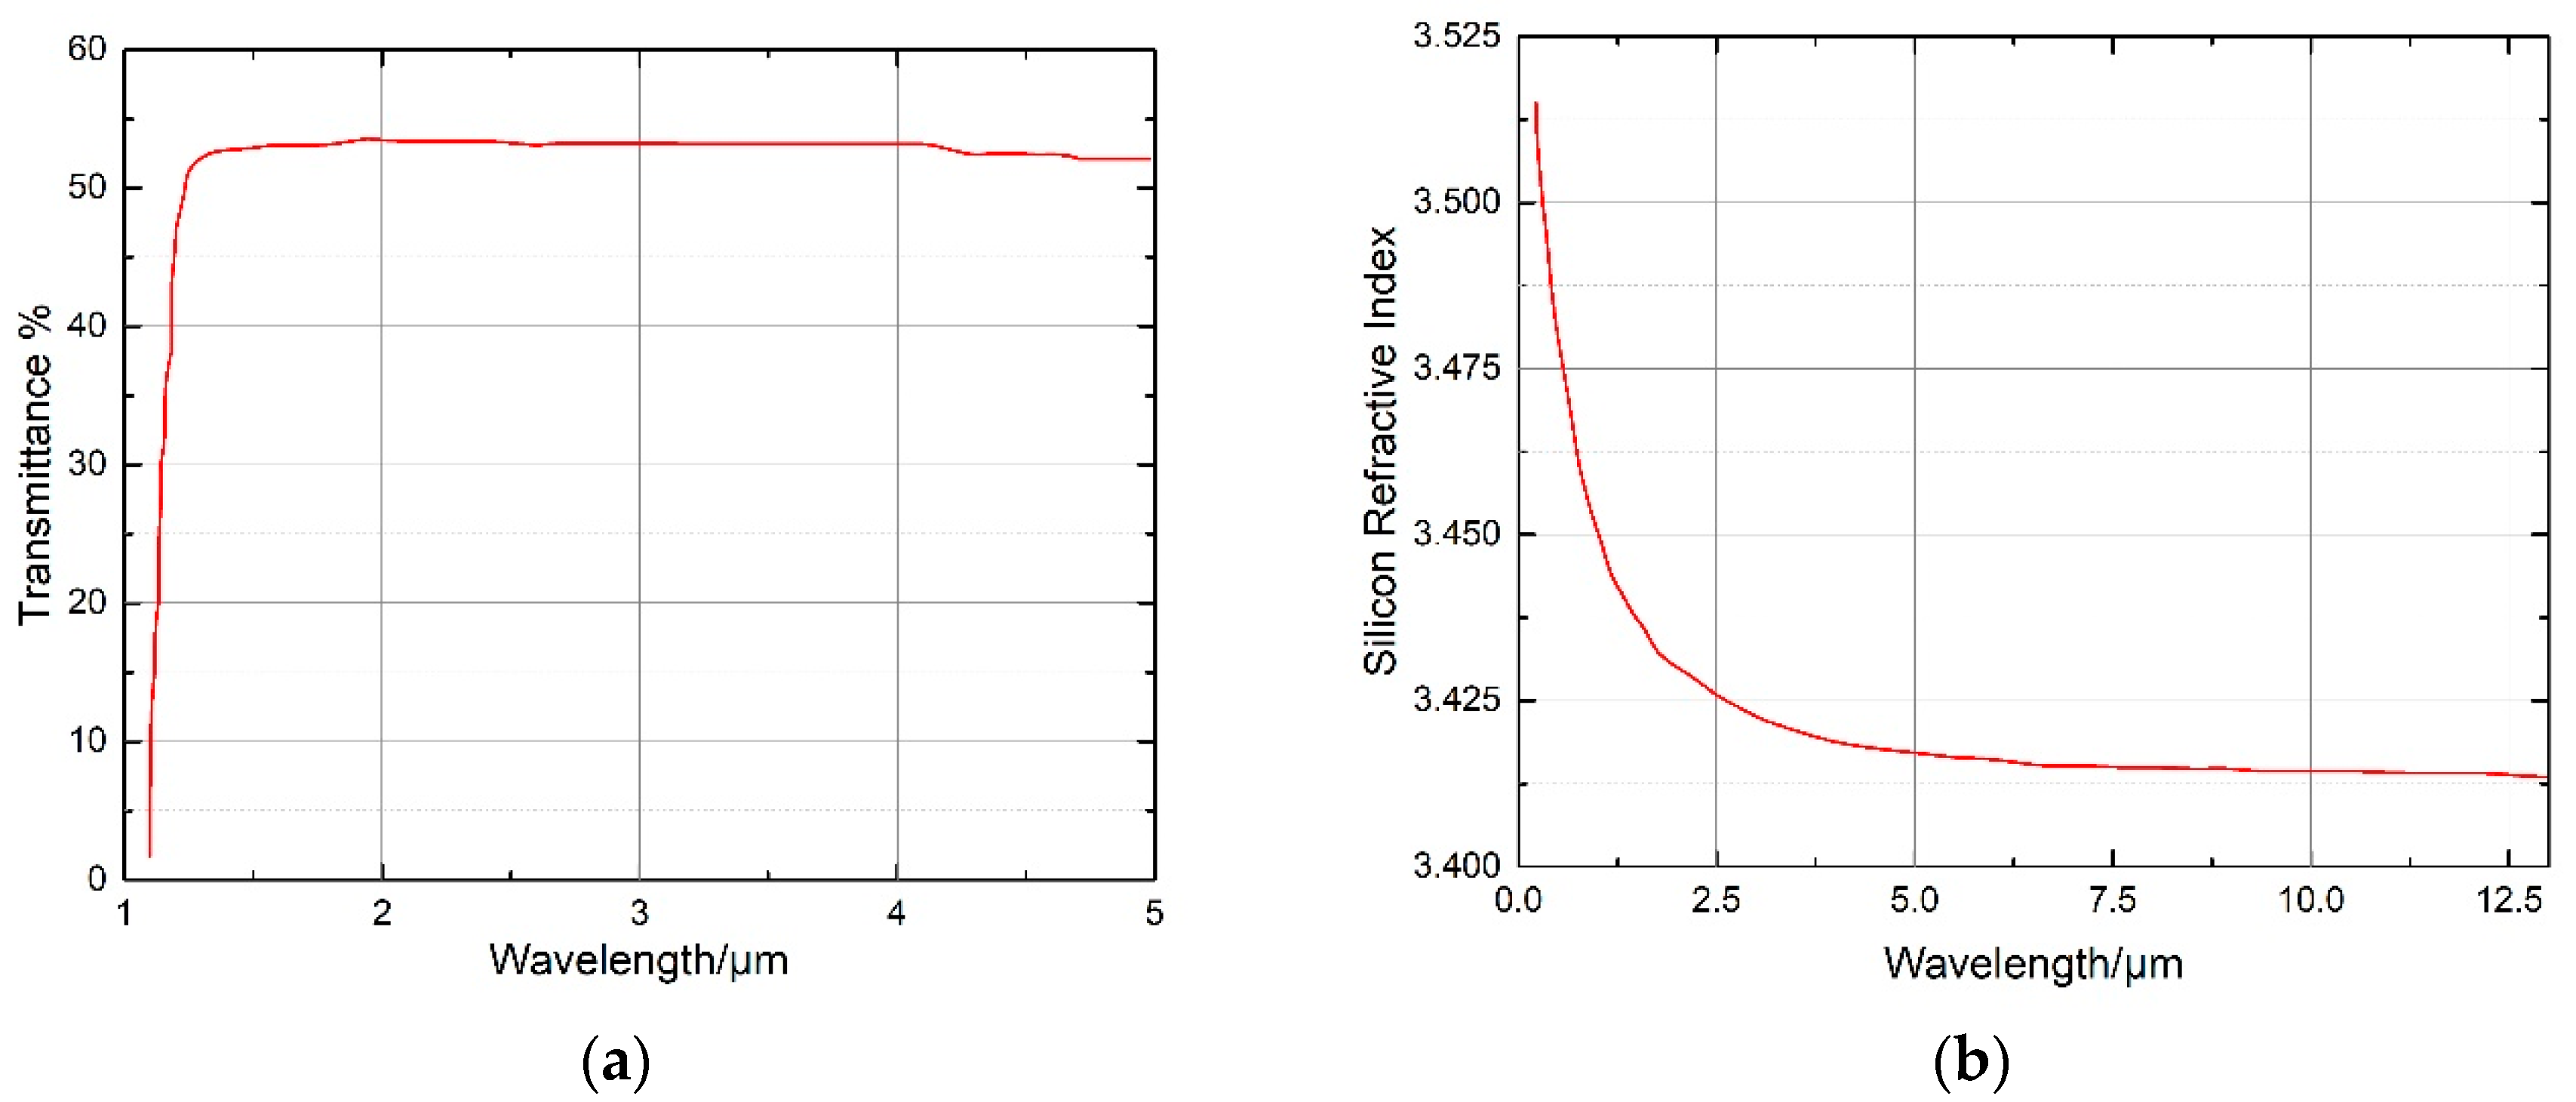
n > 2) can be used for immersion gratings, which are primarily semiconductors with high refractive indexes. Due to the absorption of light inside the material, the greater the required volume, the greater the immersion, and the transmittance of the material will drop significantly. Studies by Lawrence Laboratory LLNL and Canon have shown infrared materials that can be applied to immersion gratings and have been successfully applied to both space-borne and ground-based high-spectral-resolution grating spectrometers. In terms of the commonly used materials shown in
Table 1, single-crystal silicon is easy to process in mid-wave infrared and has relatively mature processing technology, thus, this study uses single-crystal silicon as a prism material [
9]. As shown in
Figure 2, the refractive index of Si decreases as the wavelength increases. However, changes in the refractive index are usually ignored or assumed to be constant for most optical applications due to the narrow range of operation. More detailed information on the optical properties of single-crystal silicon can be found in references [
10,
11].
Accordingly, the dispersion of an immersion grating comprises two components: the refractive index and the diffraction angle. According to Equation (1), the angular dispersion of an immersion grating can be calculated as:
Here, represents the focal length of the imaging system and γ is the angle between the chief ray and the plane perpendicular to the groove.
To avoid interaction between the incident light and the diffracted light, gratings can be employed slightly “out of plane”, in which the incident and diffracted ray paths do not intersect but are separated by an angle
γ (where
γ < 10 degrees) [
12]. Equation (1) assumes that the diffraction occurs within a plane oriented perpendicular to the grating grooves (see
Figure 3).
Considering the out-of-plane scenario, a more complete version of the grating equation is given by:
where 1/
d is the groove spacing (line mm
−1) and
γ is the out-of-plane angle of incidence (degrees).
Based on the diffraction equation of the grating, the angular dispersion, and the linear dispersion, the central wavelength corresponding to each diffraction order is calculated as:
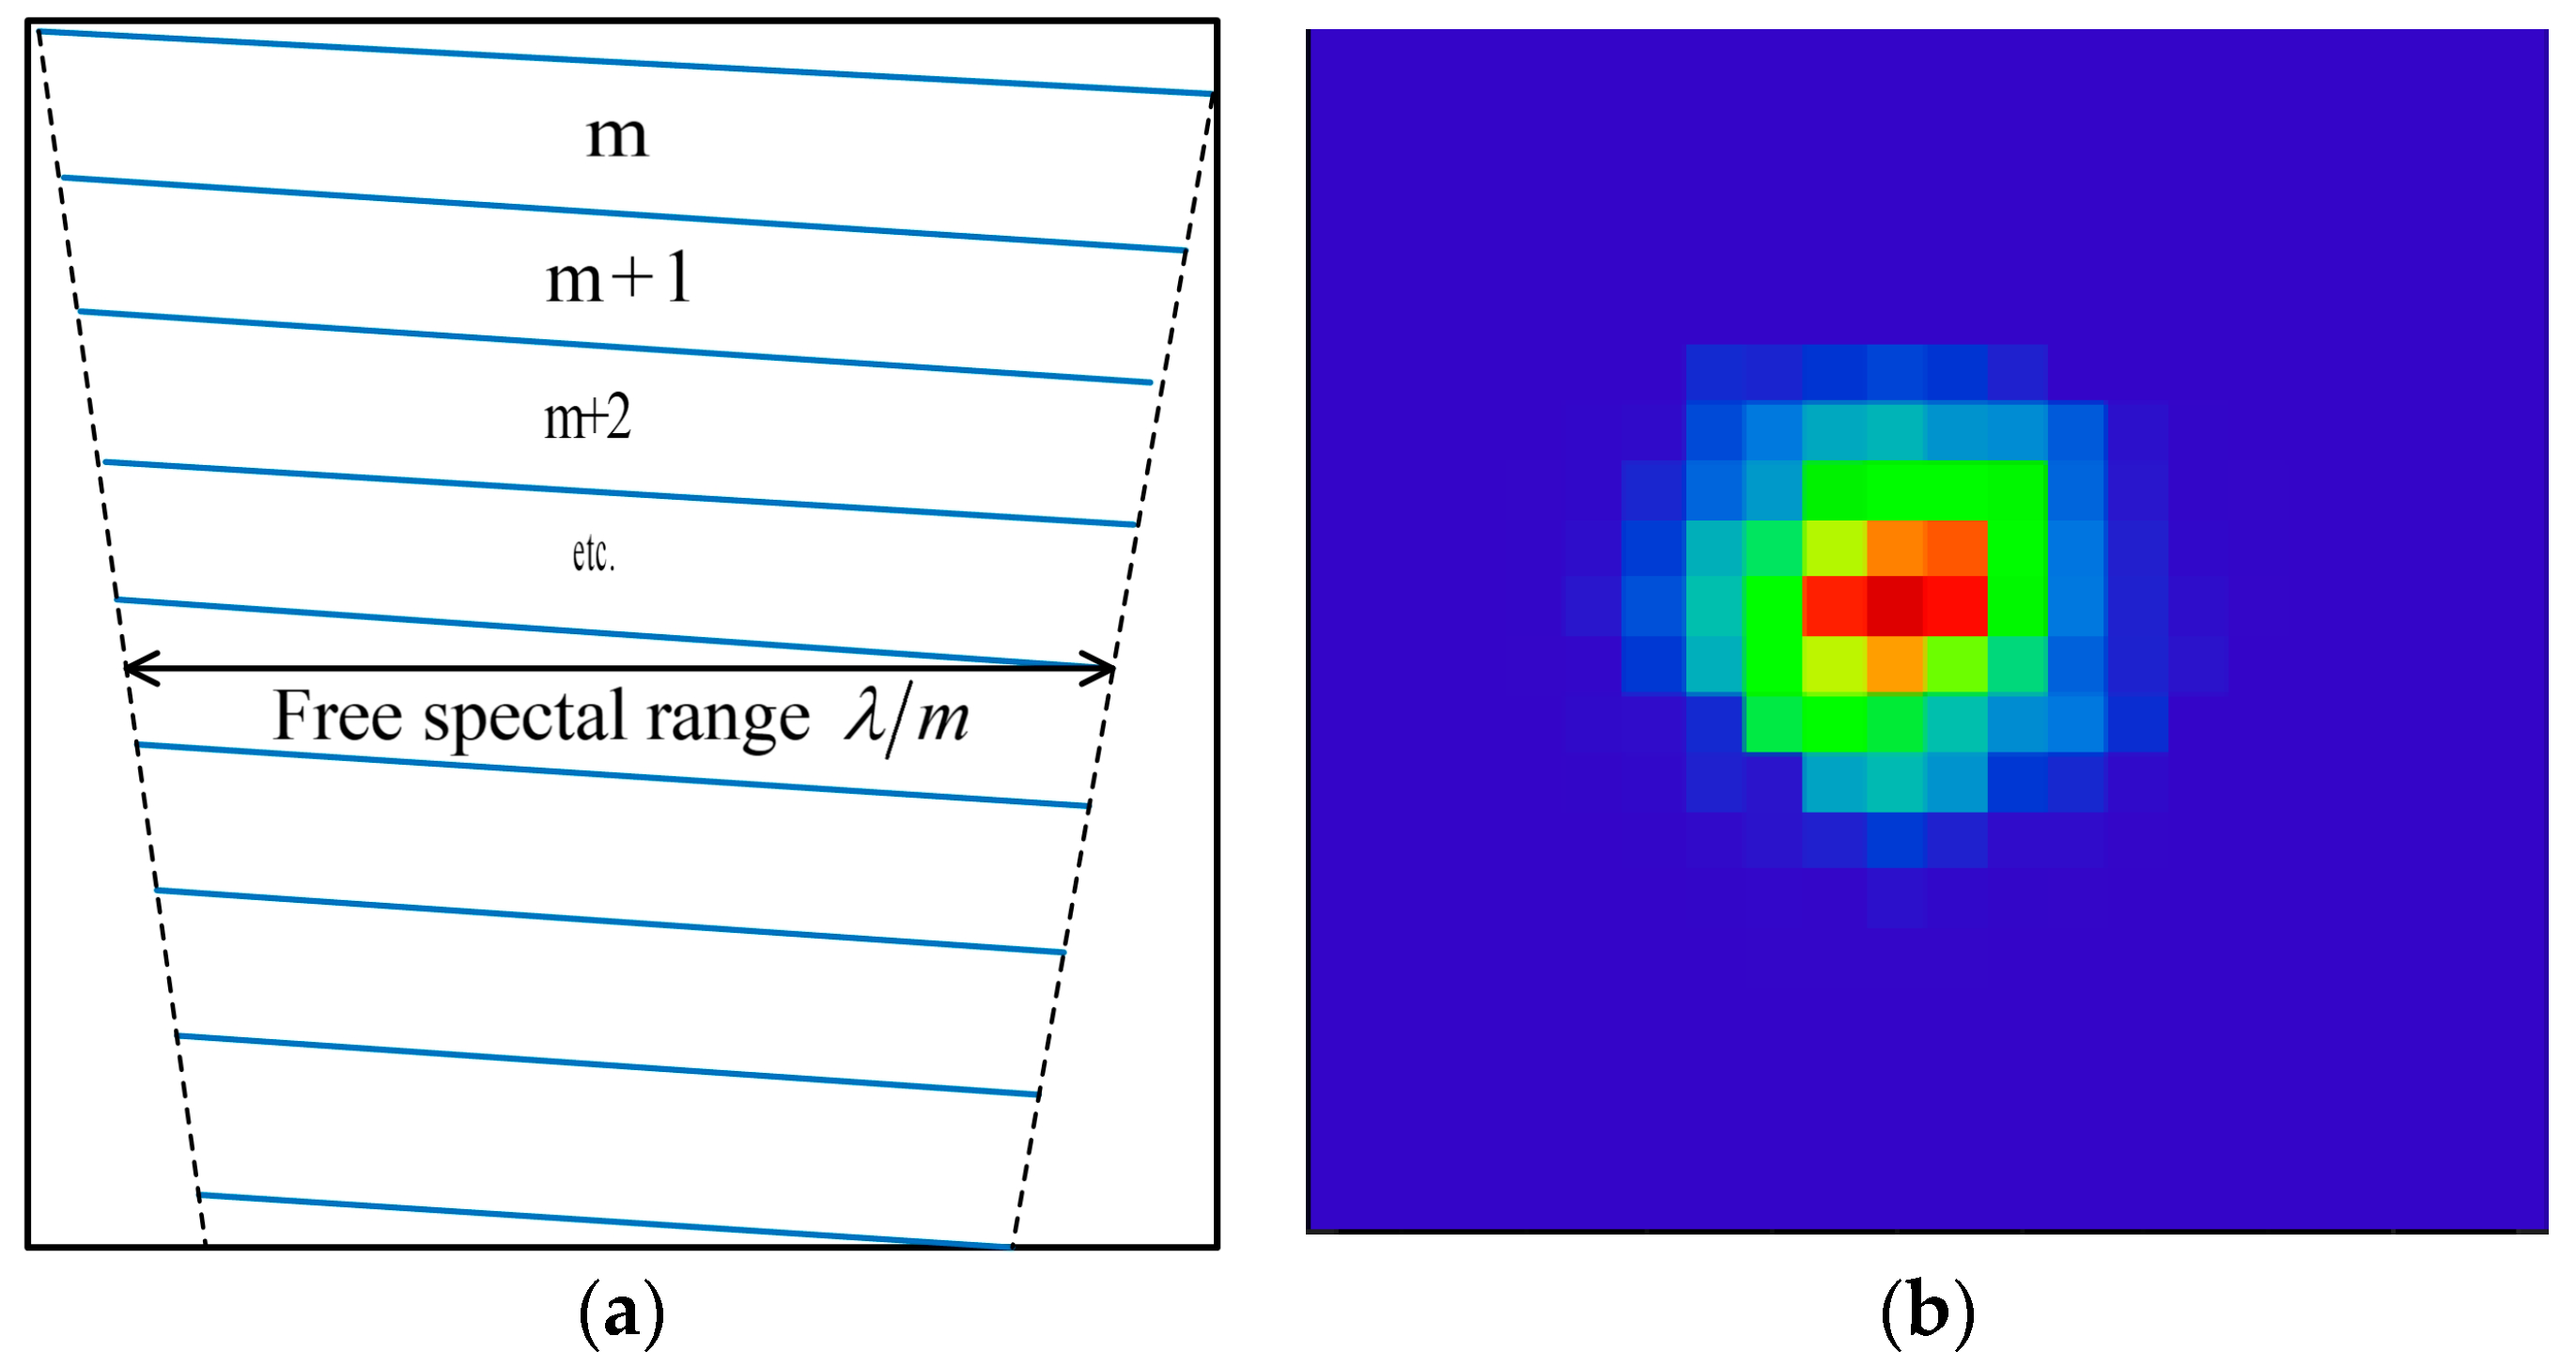
Although the various diffraction orders of a grating overlap, for a given order, there is a subset of wavelengths that do not overlap the same wavelengths in a neighboring order. For each order, this set of wavelengths is known as the free spectral range. Equivalently, it can be defined as the change in wavelength between adjacent orders for a given angle of diffraction:
To make the free spectrum corresponding to each order, based on the constraint relationship between the detector and the grating dispersion, the following equation can be obtained, where the dispersion direction of the middle step is parallel to the shorter side of the detector:
where
H is the size of the main dispersion direction of the detector.
As shown in
Figure 4, at 4 μm and R = 40,000, the resolvable spectral width is 0.05 cm
−1. If there are 320 pixels in a row (320 × 256 array) and sampling theory requires two pixels per resolvable spectral element width, then the row will cover 50 cm
−1. Thus, the spacing between echelle orders should be 16 cm
–1. For an immersed germanium echelle with groove spacing d and blaze angle
θ, the order spacing is 1/2nd(sin
θ). Taking
n = 4 and a 63.4° blaze angle, the corresponding groove spacing is 88.08 μm.
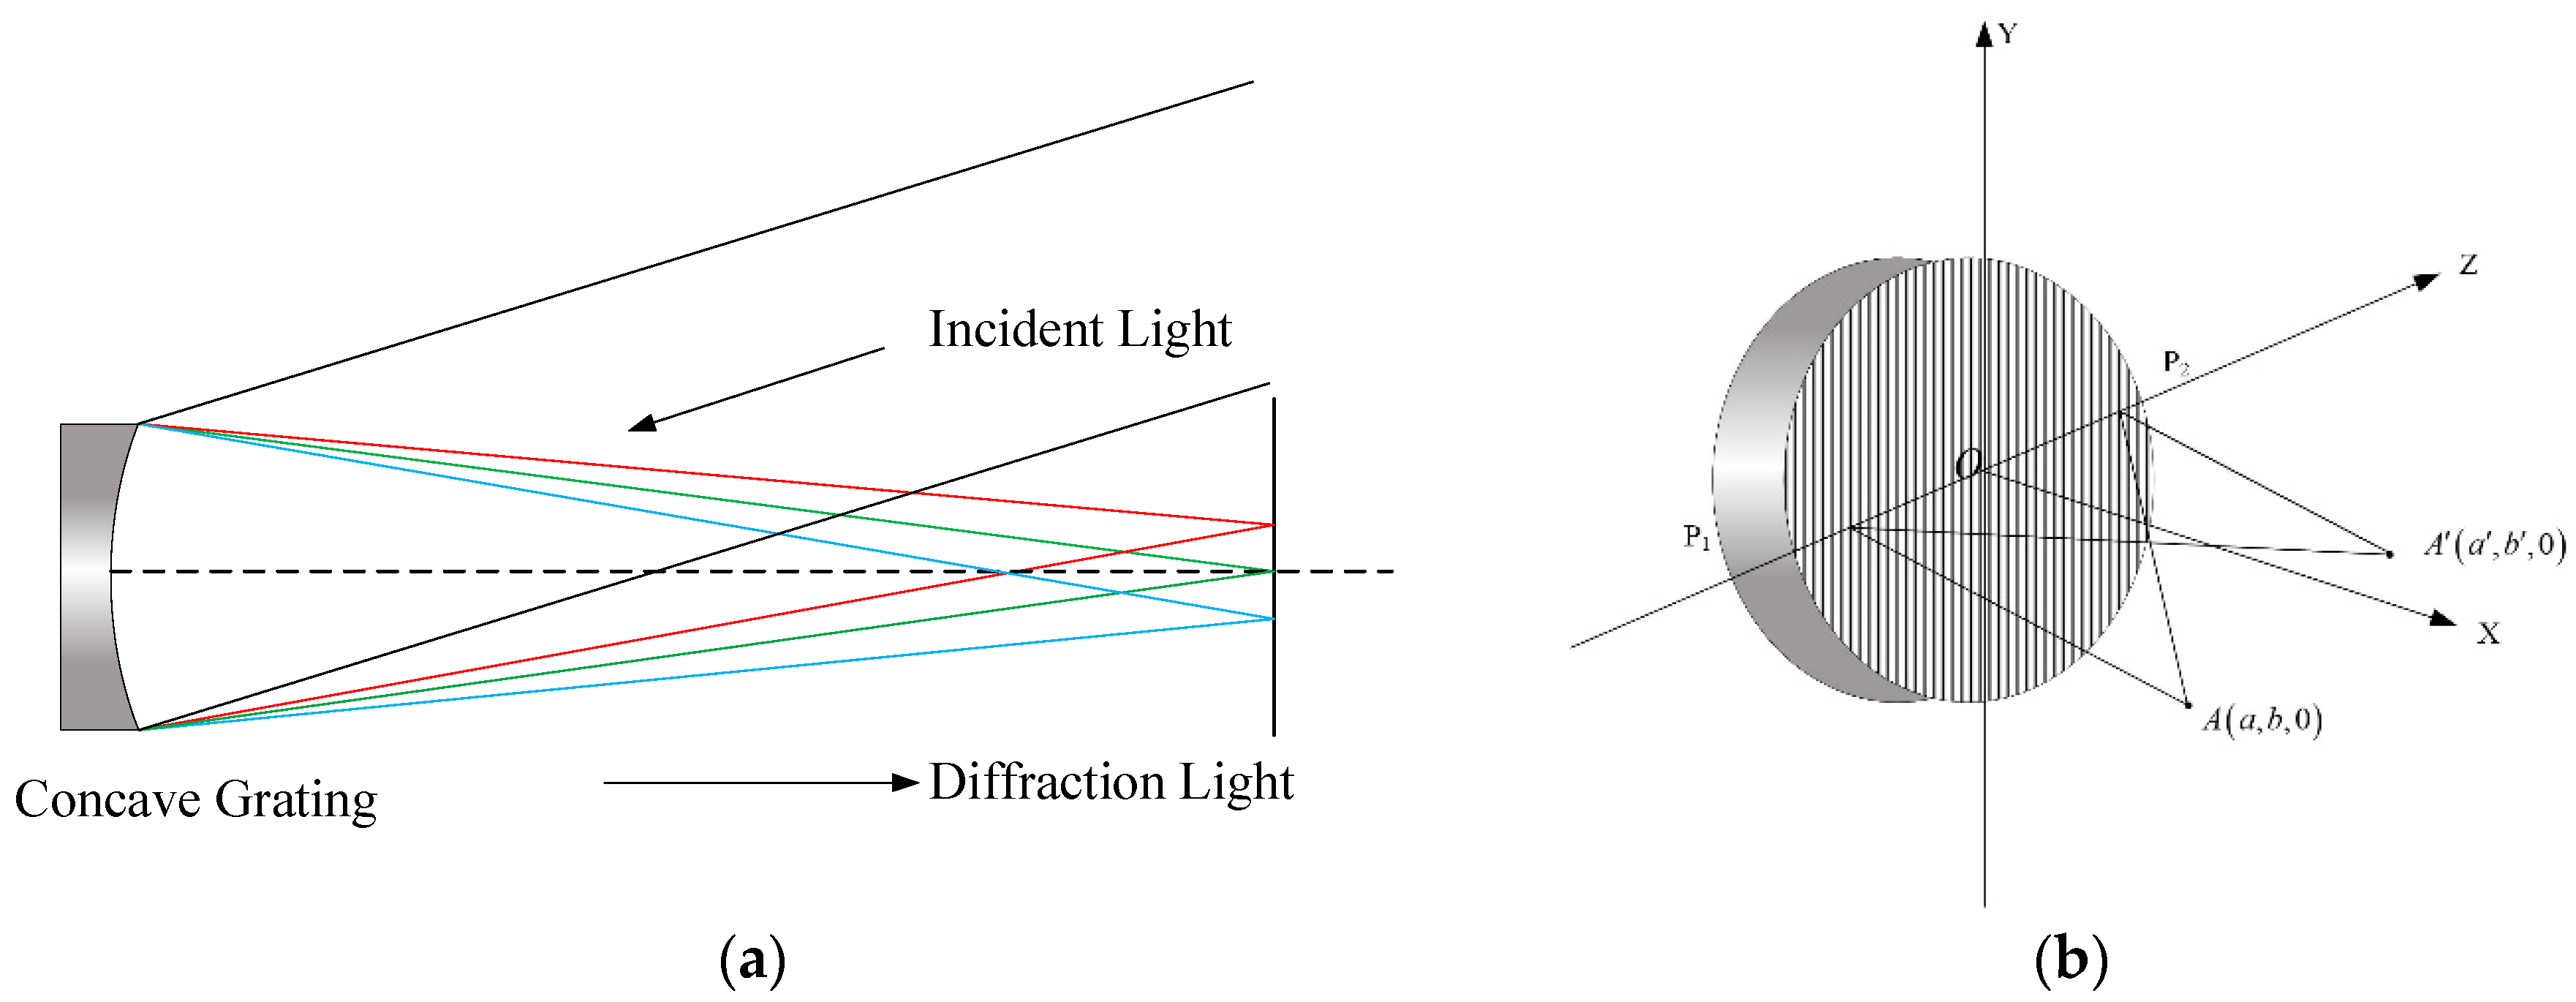
In echelle grating spectrometers, most low-dispersion elements use prisms, but gratings can also be used. However, in the infrared band, if prisms continue to be used, then larger sizes are required. Accordingly, concave gratings are being developed that can achieve convergence and improve imaging performance. In this paper, the concave grating was used in a Wadsworth imaging system, such that the concave grating was illuminated with a collimated beam, as shown in
Figure 5. The spectral astigmatism in and near the grating normal direction is greatly reduced, where O is the center of the grating (i.e., the origin of the coordinate system), the X-axis is along the normal to point O, and the Z-axis is along the dispersion direction.
is the object point,
P1 and
P2 are the intersection points of the light emitted by it and the grating surface, and
is the image point, such as
,
. Accordingly:
For a concave grating surface, the ratio of the sag depth to its length and width is very small. Accordingly, it is assumed that
. For a more detailed derivation process, refer to [
13]:
As shown in Equations (10) and (11), the optical path difference function when the light emitted from object point
is focused on the image point
is given by:
is the curvature radius of the concave grating on the sagittal plane. For the concave grating,
, i.e., only the horizontal plane and the radial plane thin beams are considered, thus,
:
When the optical path difference is zero, the concave grating focusing conditions are given by:
The system should satisfy the condition of parallel light illuminating the concave grating, Thus,
in the Wadsworth imaging system:
The second and higher order aberration formulas for concave surfaces can be expressed as:
The Wadsworth system meets the following conditions:
When , all other aberration coefficients are zero except the coefficient.
3. Optical Design Method
Typical plane grating spectrometer structures, such as Littrow [
14], Ebert–Fastie, Chupp–Grantz, and Czerny–Turner [
15], are unsuitable for the design of this work; accordingly, this paper follows the principle of ensuring that the overall resolution of the instrument is not affected by design but also that the volume is controlled and stray light of the entire system is kept to a minimum. To improve and simplify the optical structure of the echelle spectrometer, a quasi-Littrow structure [
16] and a three-mirror anastigmatic (TMA) structure were used for cross design [
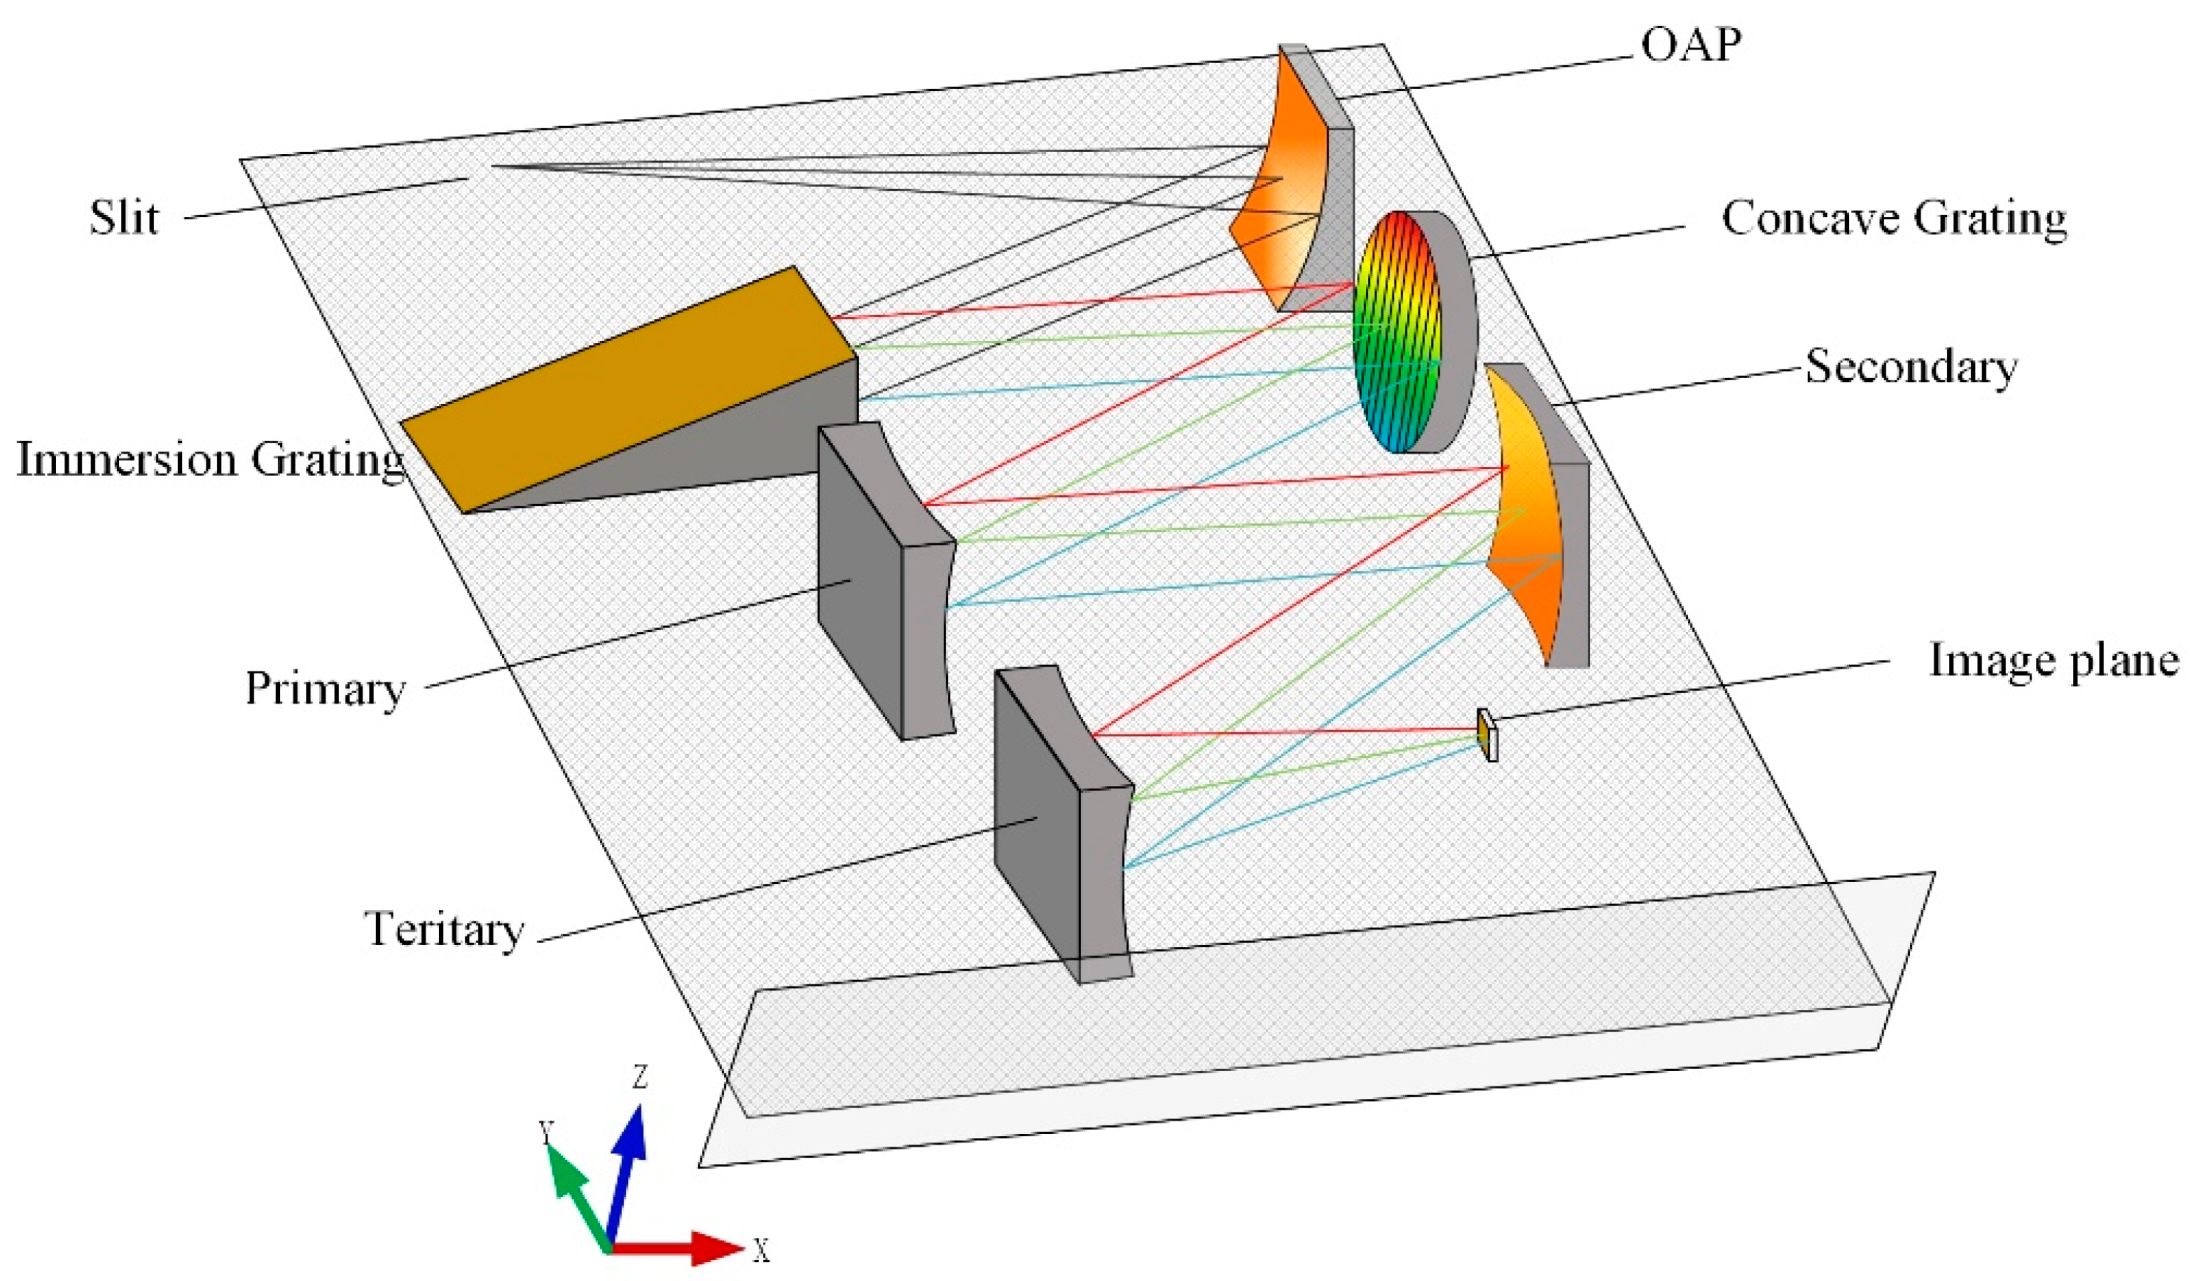
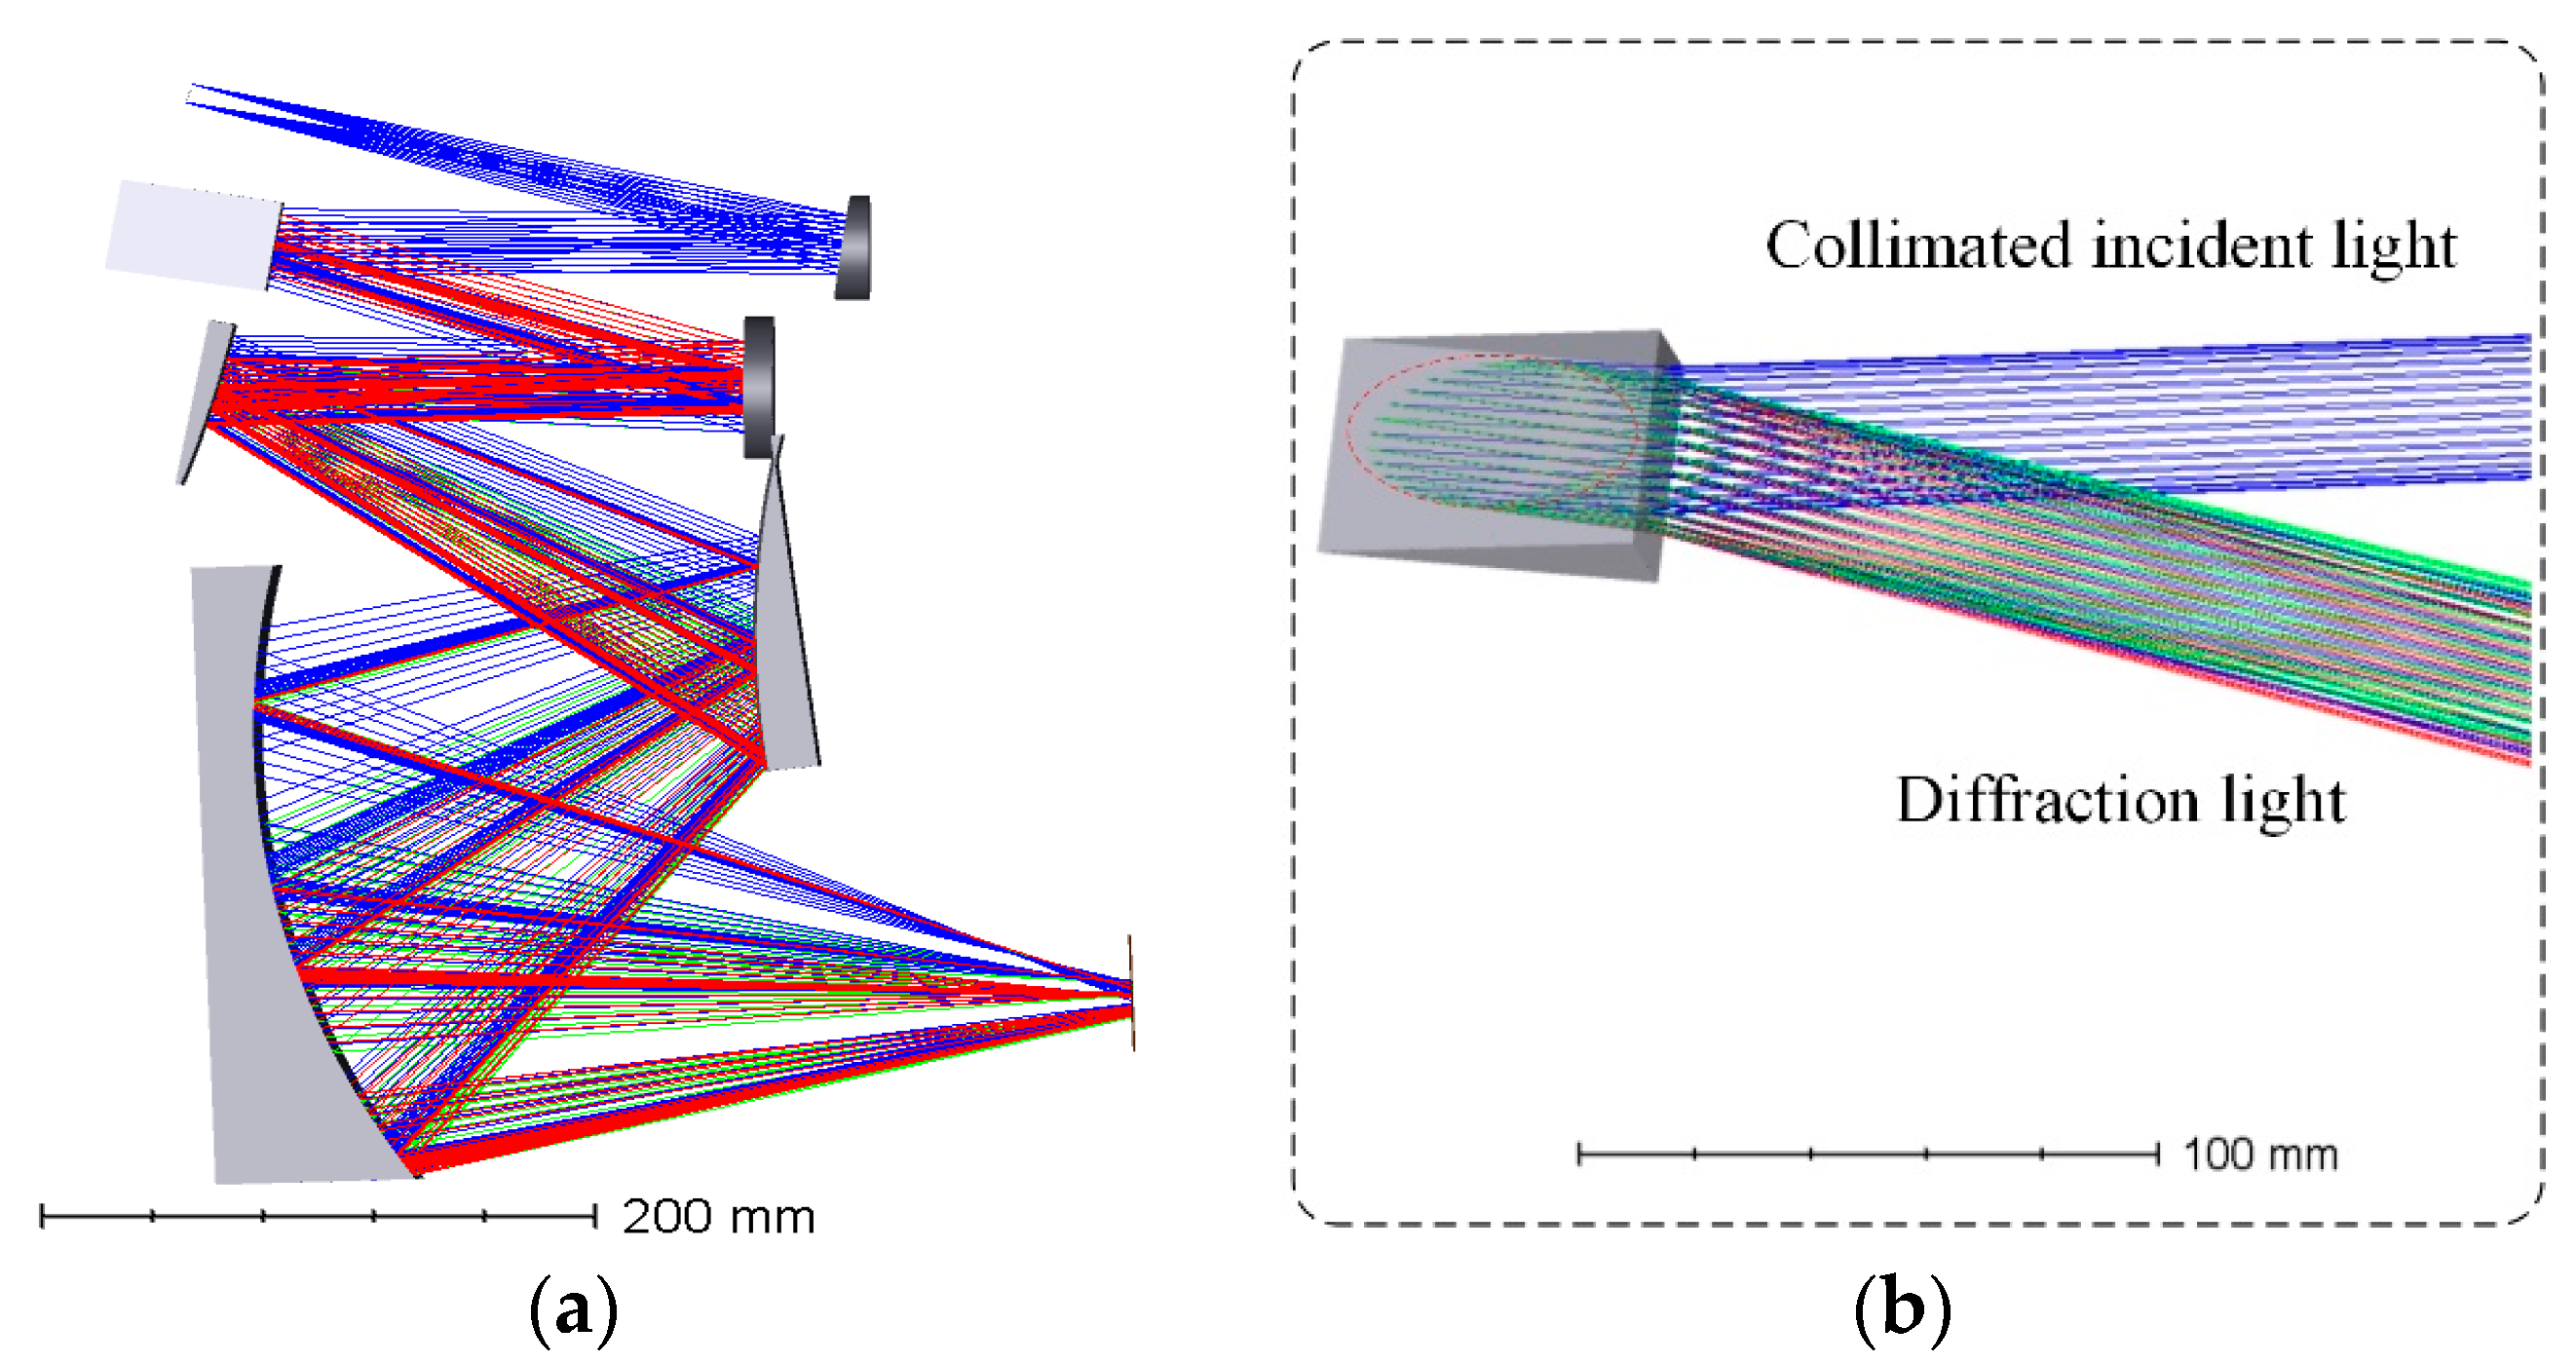
17]. The Immersion Echelle Spectrometer with Three-Mirror Anastigmatic (IESTMA) system is shown in
Figure 6. The light enters incident through a pinhole, which is located at the telescope focal plane, and is reflected by the off-axis parabolic mirror (OAP) before entering the immersion grating, where the angle between the chief ray and the plane perpendicular to the groove (
γ angle) is 4°. The dispersed light is separated into orders by the concave grating (first order used). The cross-dispersed spectra are focused on the detector by the TMA camera system. The detector covers a wavelength range from 3.7 to 4.8 μm in a single exposure. By using the concave grating as the cross-dispersion element, the difficulties caused by using prisms for infrared immersion echelle grating spectrometers are resolved; the beam can be focused to a certain extent through the concave grating, and the beam aperture is also reduced relative to the use of prisms or plane gratings. In addition, an off-axis three-mirror anti-astigmatism optical system is used to replace the imaging system composed of refractive elements, which fundamentally reduces the aberration of the optical system. The proposed IESTMA solution also offers the possibility of developing compact immersion spectrometers.
The design of the off-axis three-mirror reflective system is based on an initial structure of a coaxial three-mirror system as shown in
Figure 7. To achieve the off-axis three-reflection optical system design, a coaxial three-reflection mirror structure must first be found that meets the requirements of the initial structure of the system; the center of the system can then be found using aperture off-axis or field of view off-axis methods. The system structure variables can then be further optimized to achieve the desired results. As the system does not form a real image in the center, the traditional method of determining the initial structural parameters is discussed below, including the value ranges of various structural parameter types. First, assuming that the object is infinitely distant, the entrance pupil is located on the primary mirror
, and
and
are the secondary mirror and tertiary mirror, respectively. On this basis, the following equations can be derived:
The blocking ratio of the secondary mirror to the primary mirror:
The blocking ratio of the third mirror to the second mirror:
The magnification of the secondary mirror:
The magnification of the tertiary mirror:
For reflective systems, these are the following definitions:
The parameter
represents the interval between the primary mirror and the secondary mirror,
represents the interval between the secondary mirror and the tertiary mirror, and
is the back focal length. Logically,
and
, as follows:
where
is the system focal length.
Parameters
r1,
r2, and
r3 are defined as the radius of curvature values for the primary, secondary, and tertiary mirrors, respectively; Accordingly, we obtain the following expression:
From the given parameters , and and the system focal length , the curvature radius and distance of the three mirrors can be obtained from the formulas above.
According to the constraint relationship between the echelle grating and each element of the spectrometer, a parameter calculation was performed, with the relationships between the parameters obtained as
Table 2 [
18,
19].
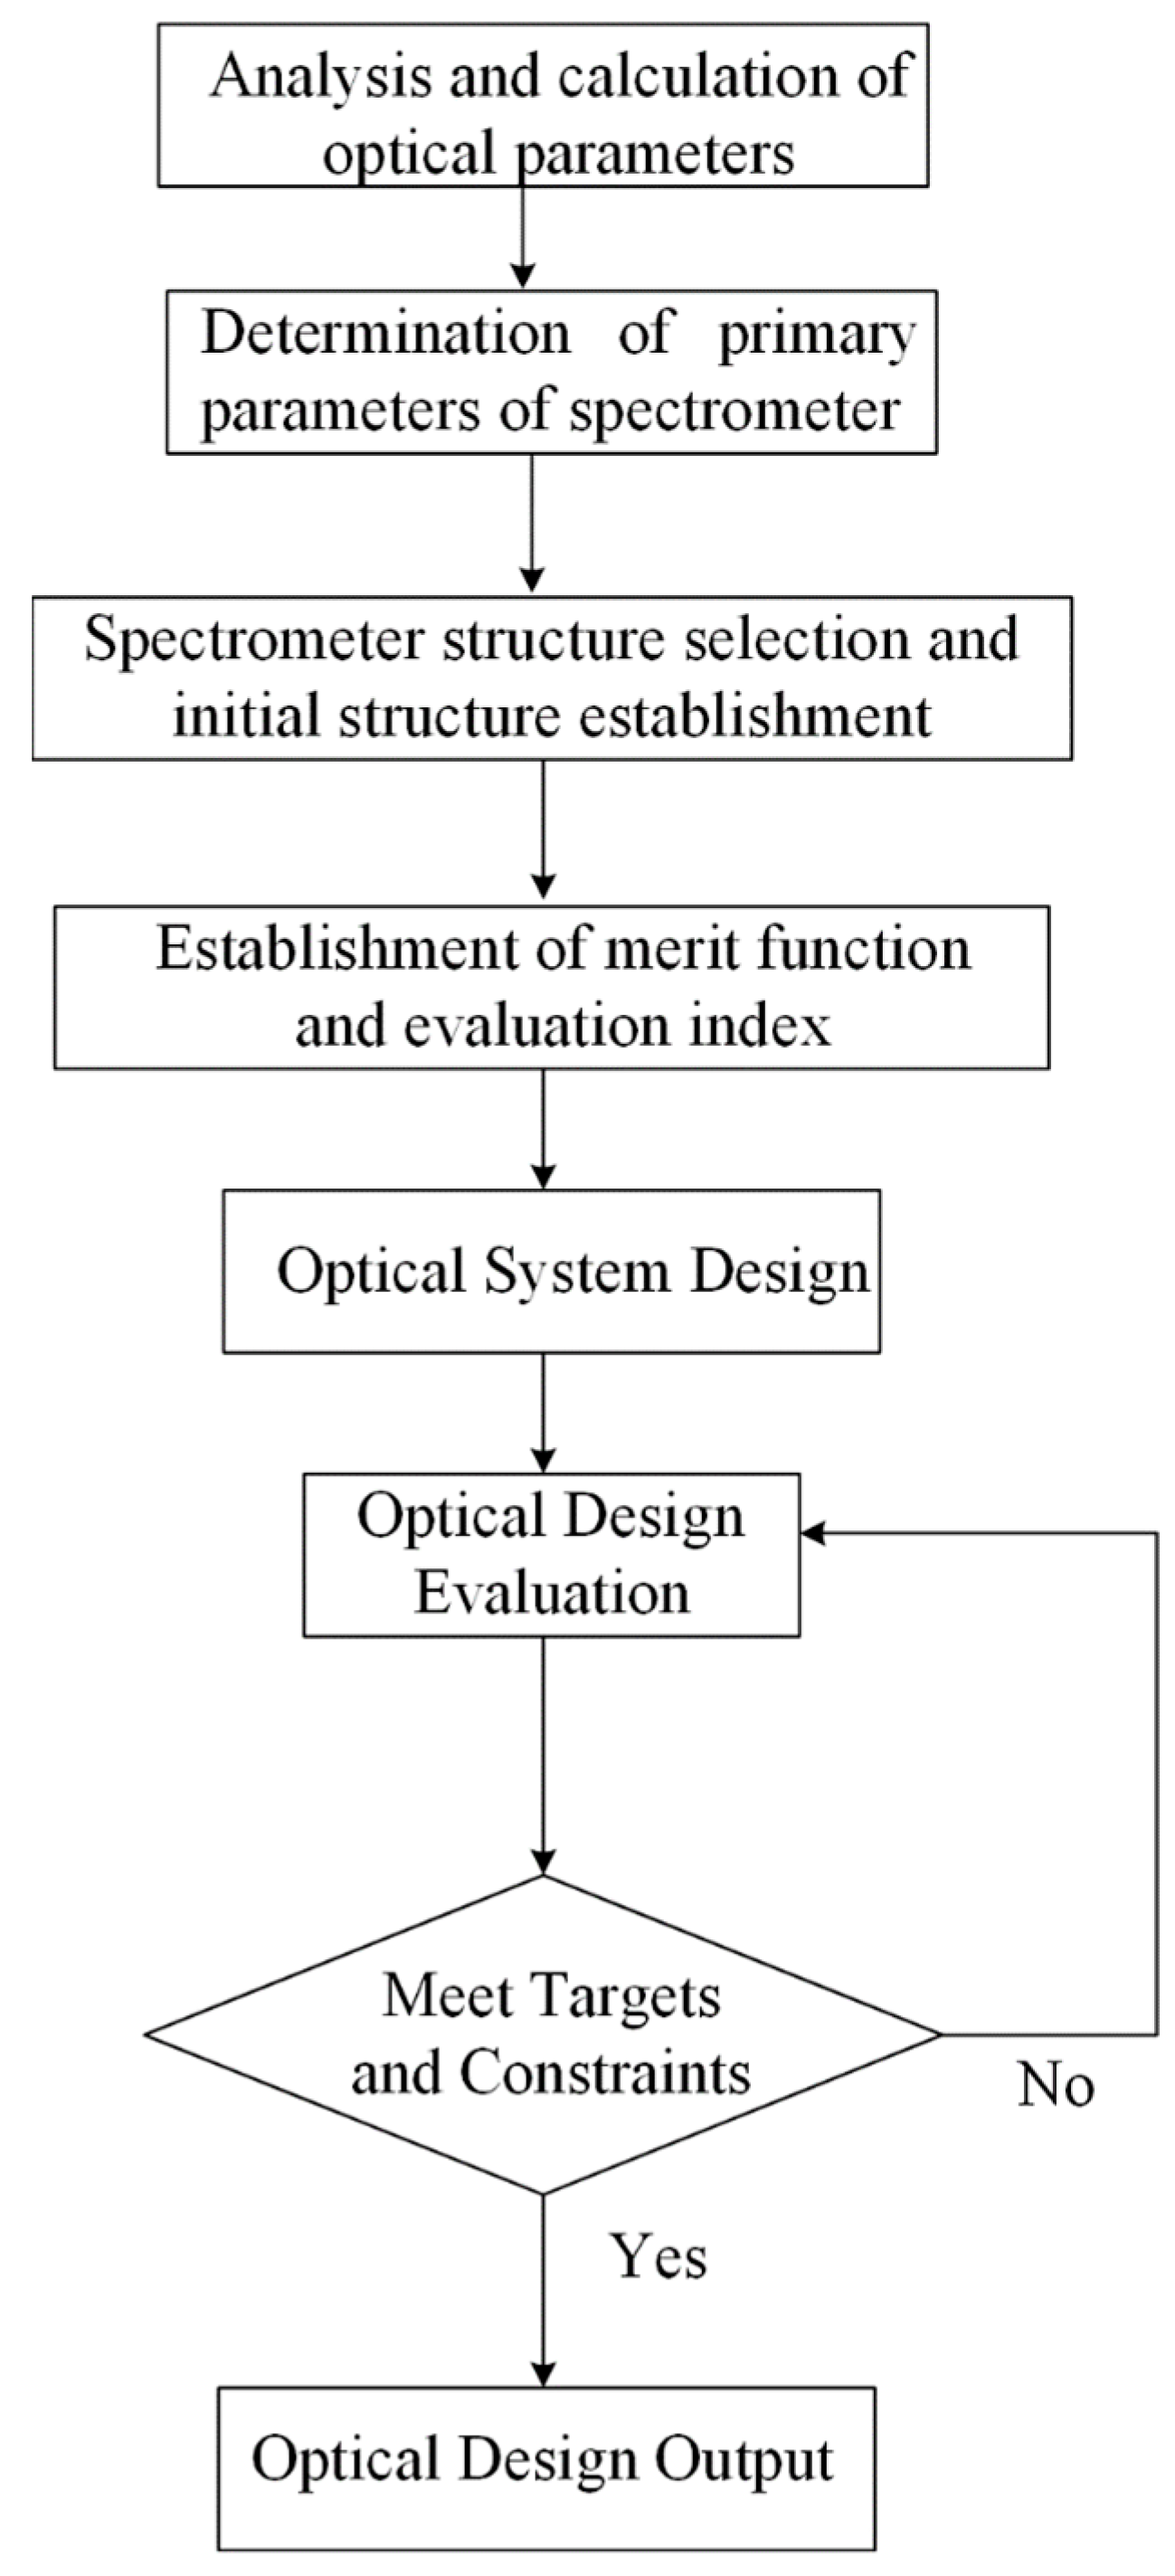
Figure 8 shows the spectrometer design process and optimization cycle.
4. Results and Discussion
The working band range of the echelle grating spectrometer was mid-infrared. Based on the constraints between the components, a spectrometer optical system combining an immersion grating and concave grating was designed. In this design, an OAP mirror was selected as the collimation system instead of a lens; accordingly, the beam could be collimated with a relatively large aperture angle without unnecessary aberration. The off-axis angle was 15°; the light was collimated after incidence on the main dispersion element, an immersed echelle grating with a groove spacing of 12.36 line/mm, an area of 70 mm × 35 mm, a blaze angle of
θB = 63.5° (R = 2), and an auxiliary dispersion element composed of a concave grating with a typical radius of curvature of 0.5, 0.75, or 1 m, according to the size of the detector image plane and the focusing system. The off-axis three-mirror optical system was used as the condensing mirror to achieve aberration correction with high dispersion and a wide free spectrum, realize focal length compensation and high-quality imaging optimization across the whole band, and achieve relatively uniform imaging. In terms of the numerical spectral order separation of the number of scribe lines of the concave grating, to optimize the matching between the order separation and the detector, we modeled and analyzed the cross-dispersion in Zemax Optic Studio 19.4, sourced from Ansys Corporation;and tested different scribe lines of the concave grating. The grating order separation increased with increasing wavelength, as shown in
Figure 9. We selected a concave mode grating of 75 lines/mm at an 8.8° angle of incidence; this parameter selection was ideal as the two gratings dispersed the incoming light from the immersion grating in the ~3.7–4.8µm wavelength range for a total of 36 orders (120 to 155). The software simulated the immersion grating working under the Littrow configurations, and the structure included multiple configurations. The ellipse dotted line represents the actual grating diffraction area.
The optical performance of the optimally designed echelle spectrometer was analyzed from three aspects: a spot diagram, a point spread function, and an energy distribution curve. The two characteristic wavelengths at the edge of the spectral range and the central wavelength were selected for image quality evaluation. The echellogram in the left panel of
Figure 10 shows the free spectral range of 36 orders on the 320 × 256 pixel detector. To analyze the optical properties of the spectrometer throughout the entire wavelength range of ~3.7–4.8µm, multiple structures were established for the optical system, and multiple diffraction orders were selected for simulation. The diffraction orders corresponding to the two ends of the range were 155 (3.7 µm) and 120 (4.8 µm).
The point spread function (PSF) is based on wave optics. Based on the deformed wavefront at the exit pupil of the optical system, the three-dimensional spatial energy distribution of the imaging beam on the image plane was determined, i.e., the light energy concentration on the spot was identified. The PSF represents the product of the Fourier transform of the pupil function and the conjugate of the Fourier transform of the pupil function, and, if the constant and high-order terms are removed, the pupil function represents the wave aberration. The right panel in
Figure 10 shows that the diffraction pole was achieved in the entire working band range (Strehl ratio > 0.99). When the Strehl ratio is 0.80 or greater, the image is deemed to be equivalent in quality to a diffraction-limited image.
Diffraction encircled energy is the ratio of the energy in the PSF collected by a single circular or square detector to the total amount of energy reaching the image plane from that object point. This is a popular metric for system engineers who commonly want a certain amount of collected energy to fall on a single pixel. This metric is widely used for systems with point images, especially those which need high signal-to-noise ratios. For encircled energy specifications of 50–60%, the criterion is near-linear. However, the specification is more often 80% (or, even worse, 90%) energy within a near-diffraction-limited diameter. At these levels, this criterion is highly nonlinear and strongly dependent on the aberration content of the image, making it a poor criterion, especially for tolerancing. The diffraction energy concentration curve represents the energy concentration of the image spot after a point on the object’s surface passes through the optical system. From
Figure 11, 80% of the energy was concentrated within 30 µm, and 70% of the energy of the imaging points of the other two characteristic wavelengths was concentrated within 30 µm.
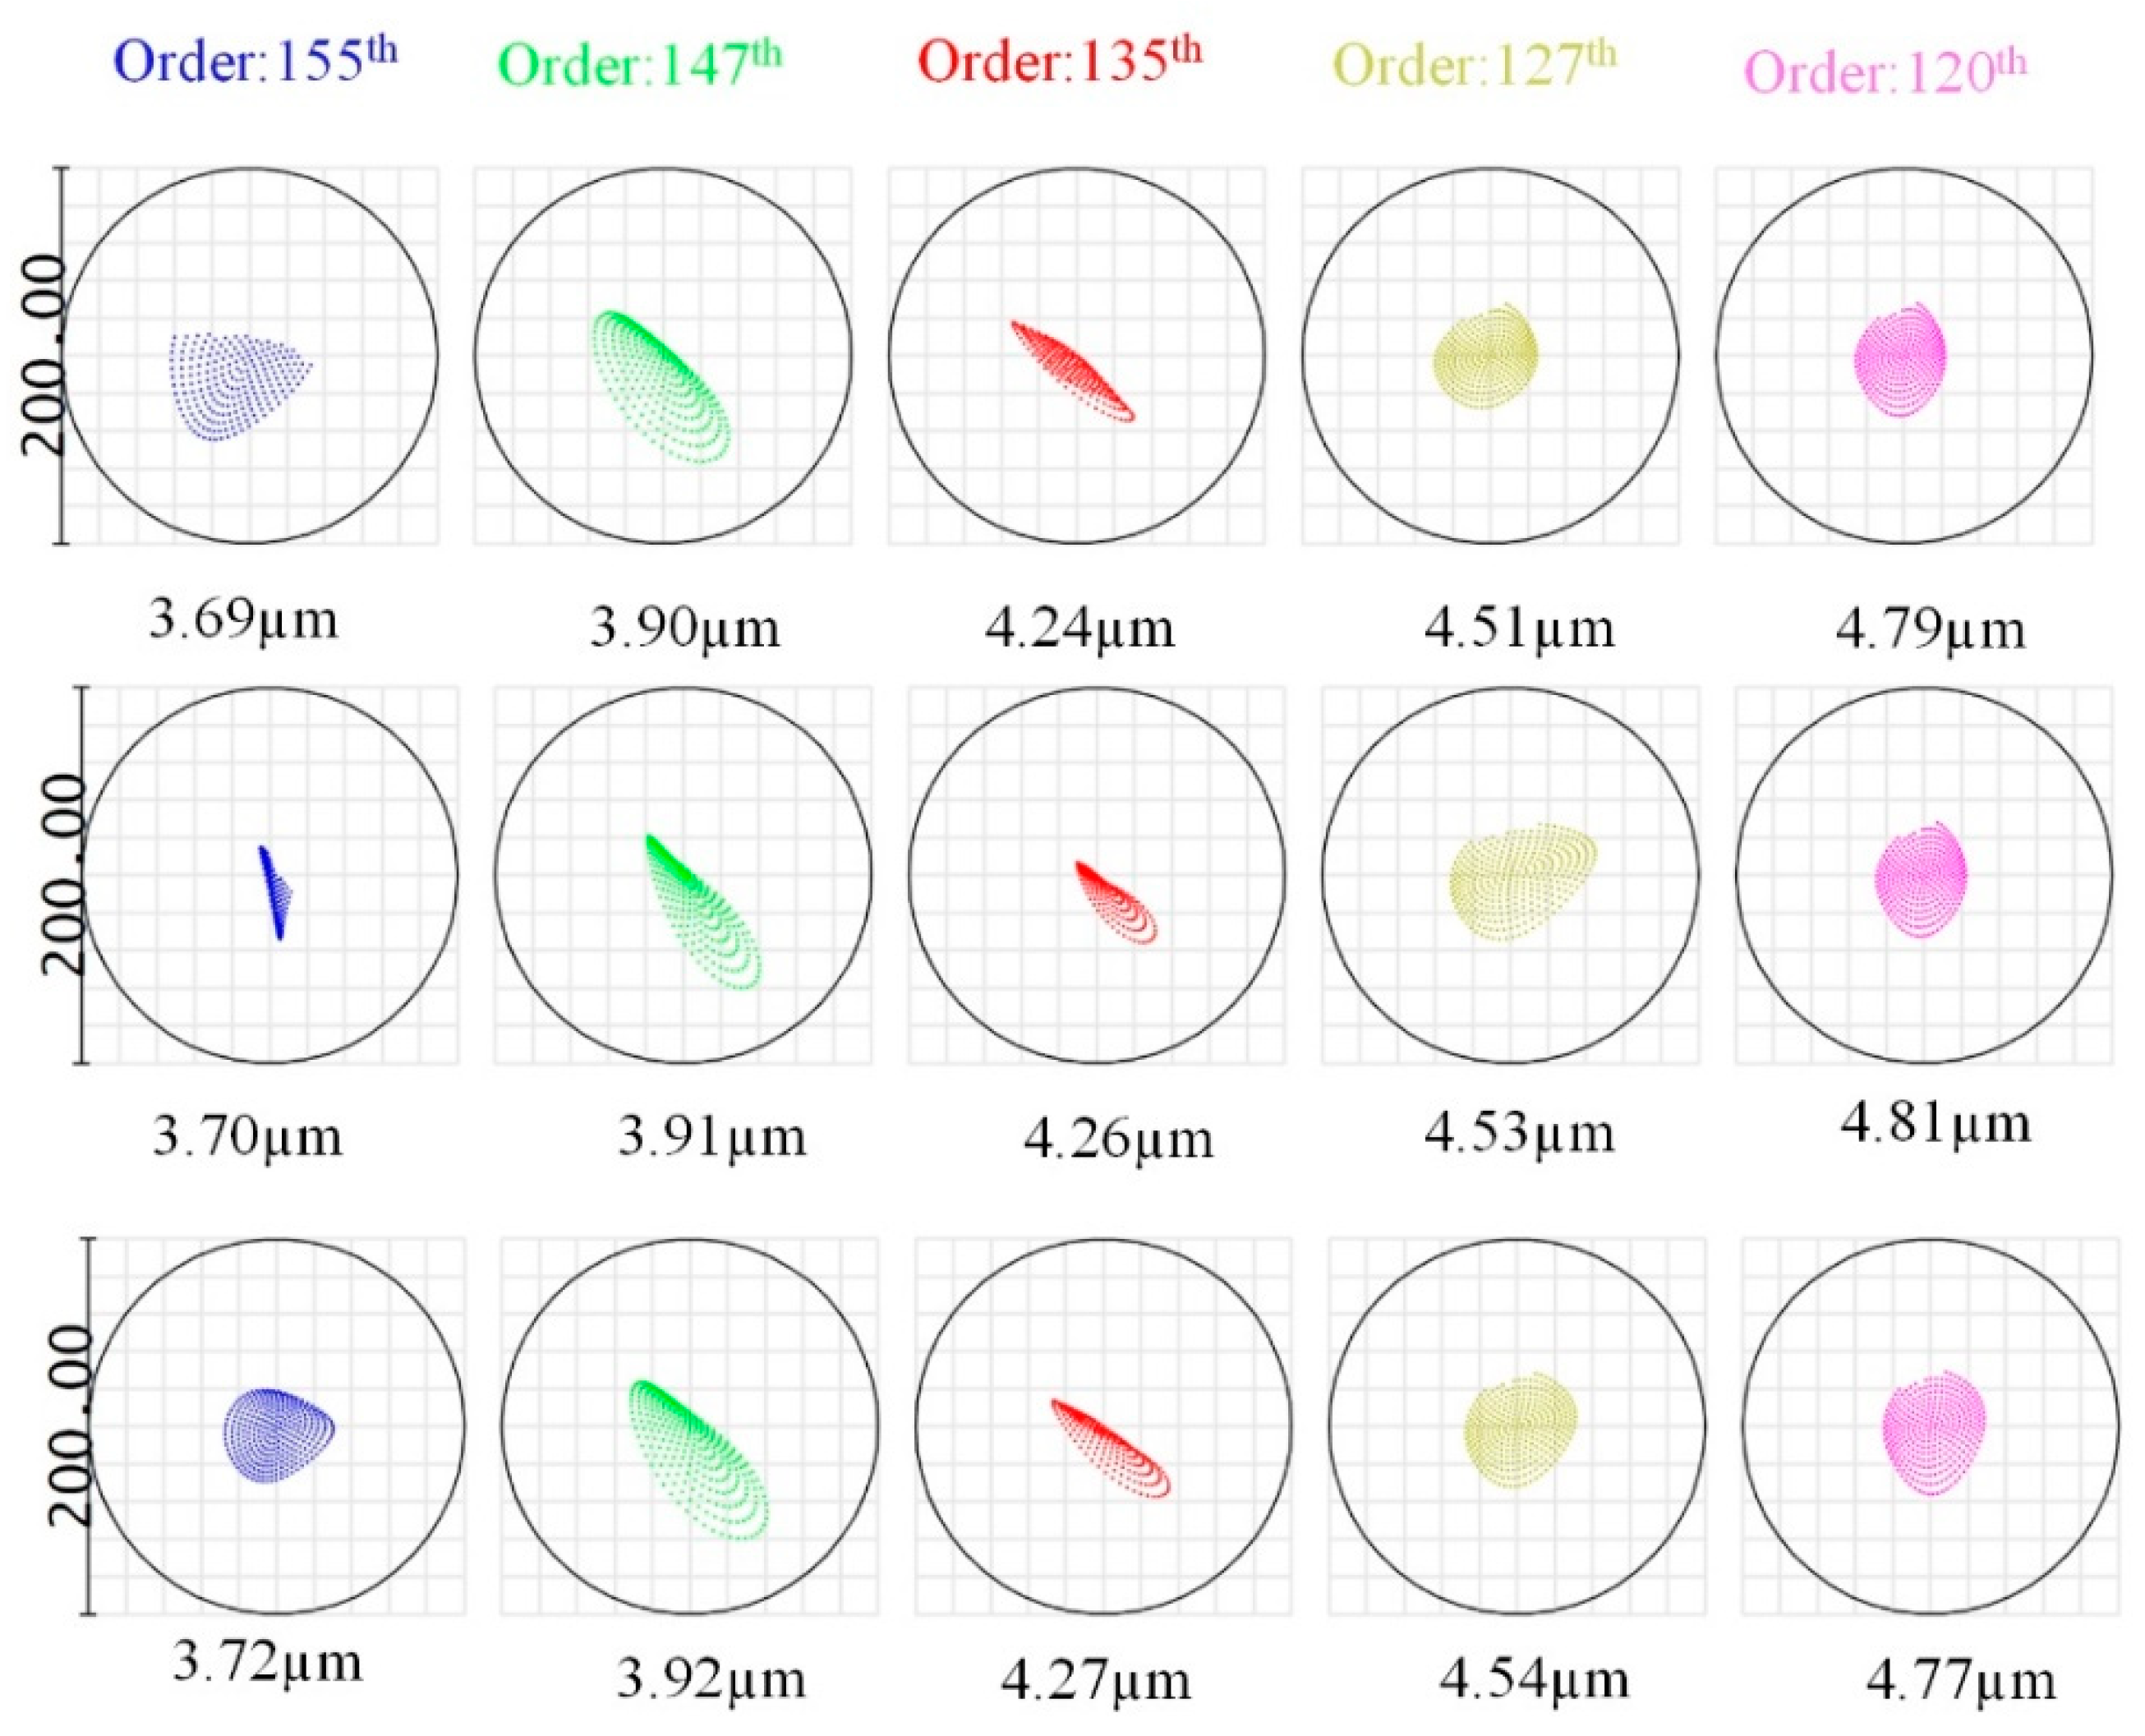
The evaluation of aberration is generally described using a spot diagram, which is a two-dimensional distribution of spots on the image plane. By analyzing the distribution of each intersection point of the image spot, the energy distribution can be estimated to evaluate the imaging quality of the system. The root mean square diameter (root mean square, RMS) is an important parameter, which is the diameter of the diffused spot with 68% energy concentration. The RMS spot sizes for three wavelengths and five configurations in
Figure 12 were below 30 μm, showing that optical aberrations did not significantly degrade the spectral resolution.


