1. Introduction
Nowadays we are working with growing and more complex databases, we have more and more information, and the data and information to be processed and analyzed are very diverse, comprehensive and heterogeneous. Large databases and the available information must be systematized and sorted; thus, the most appropriate solution, option or method is to break the data down into homogeneous groups. The essence of this is that the elements of each group are similar, close to each other, but different from the elements of the other groups [
1]. With the help of homogeneous groups, we will be able to evaluate and analyze each group better and more correctly, and finally the evaluation of the entire database will give a more realistic picture.
In the case of financial analysis, it is very important to process large databases correctly and to evaluate the results. Evaluating the financial performance of companies requires comparing very different companies in terms of size and performance based on the processing and analysis of the multi-annual reports of these companies.
The average values of a database, containing variable and significantly different data, cannot be representative, thus cluster analysis is the best solution for database analysis.
There are many techniques and different methods for homogeneous grouping. Clustering methods are presented by Madhulatha [
2], who offers great insight into clustering algorithms and their applicability, characteristics and limitations. The most commonly used methods are K-Mean and K-Medoid algorithms [
3].
The K-Mean method uses the group mean (centroid) for grouping the data. The limitation of this method is that very different, distinct values can distort the results. For the definition of reference points, the K-Medoid method uses some representative values (called medoids) instead of mean values [
4]. The K-Medoid method is considered less sensitive to outliers in comparison with K-Mean clustering [
5].
Prior to grouping the databases, identifying and eliminating the outliers is recommended for more accurate results. Due to the negative effects of the outliers on the results, it is necessary to eliminate them [
6]. More ways to identify the outliers are recognized such as the distance-based method, density-based method and graph methods [
7].
Hypotheses and Purpose of the Paper
From the very beginning of the present research, in the phase of creating the database, but also further on, when the first calculations were made, many research questions appeared based on which the research hypotheses were formulated. The hypotheses of this research are:
For large databases, any type of analysis (social, financial, economic, statistical, etc.) should start firstly with an examination of the variability of the data (how different or similar the elements in the database are). If the elements of the database differ greatly from each other, the formation of homogeneous groups is necessary for effective and correct analysis.
The selection and determination of the indicators or characteristics based on which the groups will be formed are very important, as they can influence the obtained results. These indicators or characteristics must reflect the aim of the research.
The method chosen for the formation of groups influences the obtained results. The different sizes and contents of groups may influence the results.
Based on these assumptions, the purpose of this paper is to perform a comparative analysis between the results of two well-known and frequently used clustering methods (K-Mean and K-Medoid) in the field of financial performance. The processing of databases with large and variable data is possible and recommended only with homogeneous group resolution, based on cluster analysis. The chosen method and grouping procedure will directly influence the results. Cluster analysis is frequently used in all scientific fields such as pharmacy, medicine, energy, economy, biological issues, etc. Our research presents the differences between the results obtained by using two well-known clustering methods for the evaluation of financial performance taking into account three main financial ratios (Return on Sales—ROS, Return on Assets—ROA and Return on Equity—ROE).
This study answers the question of whether it is worthwhile to process databases with large and variable data using cluster analysis with K-Mean or with K-Medoid in the field of financial performance. Moreover, it compares the results obtained using these two clustering methods.
2. Brief Literature Review
There is a great deal of literature dealing with the processing of databases containing large and varied elements and the breakdown of data into homogeneous groups. Clustering methods are used in many fields such as biology, disease classification, archeology, image segmentation, social classifications and market segmentation, as well as database analysis in many fields [
8], e.g., entrepreneurship [
9], transportation [
10], medical research [
11], engineering [
12] and industrial clusters performance [
13].
In the field of economics and finance, large and complex data and databases are needed more and more. As a result, there is a growing need for the processing of economic and financial data. From the vast amount of information available to decision makers, only the information most valuable and useful to them must be selected. In the case of economic–financial analyses, the literature describes a large number of grouping methods used in various fields: risk analysis [
14], financial risk analysis [
15,
16], selection of financial ratios [
17], economic fraud activities [
18], real estate portfolio analysis [
19], financial performance analysis [
20].
Cai et al. [
21] provided great insight into clustering methods, underling their advantages and disadvantages for financial datasets. They demonstrated that density-based clustering does not suit financial datasets, whereas K-Mean gives the best number of clusters to help understand financial data classification.
Group disaggregation methods are also very suitable for grouping companies, as demonstrated by Serban et al. [
22]. These authors applied clustering methods to 106 enterprises based on economic indicators (Economic Value Added, Net Income, Current Sales, Equity and Stock Price).
Kaur et al. [
23] defined clustering “as a process of grouping data objects into disjoint clusters so that the data in each cluster are similar, yet different to the other clusters” (p. 42). There are several methods and techniques by which these clusters are created, such as K-Mean and K-Medoid. According to Kaur et al. [
23], the K-Mean method is a simple and easy-to-use method. Each cluster is composed based on average values, and the values/elements attached to a cluster are the closest to this average. However, the same authors [
23] also pointed out two major disadvantages of the method: sensitivity to extreme values and the lack of knowledge of the number of clusters. Medellu and Nugraha [
24] described K-Means as a method that groups the values from a database into certain groups so that the level of similarity of the data within a group is as high as possible, whereas when compared to the other groups it is as small as possible. The level of similarity is determined based on the distance between the values of each element in the group and the group mean. The authors emphasized the simplicity of the method [
24].
The K-Mean clustering method was analyzed by Ikotun et al. [
25] in terms of advantages, improvements of the classic method, strengths and weaknesses of the existing implementation of hybrid K-means based on nature-inspired metaheuristic algorithms and identifying recent trends. The same authors presented different algorithms and optimizations which can be useful for the research community [
25].
The K-Mean grouping method was used by Hernant et al. [
26] to compare supermarkets based on various financial indicators. Kramaric et al. [
27] also used the K-Mean clustering method to compare insurance companies based on the ROE financial indicator. The K-Mean cluster analysis and principal component analysis were applied to classify EU-25 countries and provide a comparative view of the interplay between digital entrepreneurship and sustainable development variables [
28]. This method is considered the most popular clustering technique for partitioning a given dataset into a set of k-groups (clusters) [
29].
Compared to K-Mean, the K-Medoid method works with representative values for each cluster. Instead of averages, the K-Medoid method selects representative values which are the central values in the cluster. The elements/values in the database are associated with those clusters whose medoids are most similar. Kaur et al. [
23] defined the medoid as “the object of a cluster, whose average dissimilarity to all the objects in the cluster is minimal i.e., it is a most centrally located point in the given data set” (p. 43). The working method is the following: from the multitude of data, a certain number of medoids are chosen at random, around which the groups are formed with the elements that are most similar to the representative values. Once these clusters are formed, new medoids are chosen that better represent the formed group. It continues until no medoid changes its position [
30]. This method overcomes perhaps the biggest disadvantage of the K-Mean method, i.e., the sensitivity to extreme values. It is therefore based on the representative/central values of the groups called medoids [
24].
The two most popular clustering methods, K-Medoid and K-Mean, were analyzed by Arora et al. [
31] and, as a result, they affirmed that the runtime is better for the K-Medoid method than for K-Mean, and also that K-Medoid is non-sensitive to outliers. Contrary to these results, Velmurugan [
32] also compared K-Medoid and K-Mean clustering algorithms and the experimental results showed that the K-Mean algorithm yields the best results compared with the K-Medoid algorithm. Moreover, Dsouza et al. [
33] highlighted the positive and negative aspects of these two methods, concluding that K-Medoid is better in all aspects such as execution time, being non-sensitive to outliers and reduction of noise, but with the limitation that the complexity is greater as compared to K-Means.
Summarizing the opinions in the literature, the advantages and disadvantages of the K-Mean and K-Medoid methods are illustrated in
Table 1.
In both methods, the definition of the cluster number gets a lot of weight. There are several methods and procedures for this; the most frequently applied methods are the cluster elbow method and the silhouette method [
29,
34,
35]. Another technique that can solve the problem of detecting the number of clusters is using VAT (Visual Assessment of Tendency) for clustering [
36] and hierarchical cluster analysis. Kodinariya et al. [
37] described the different cluster number determination methods applied to the K-Mean clustering algorithm in detail. Of the abovementioned methods, the Elbow method is considered to be the oldest and most commonly used. This is a visual method, the essence of which is to increase the number of groups by 1 to 1, starting with two. For each step we can see the variance, and when the graph shows a fracture (elbow) we can stop, as we have the optimal cluster number; the figure may show the break point (Elbow criterion: that is the elbow of this curve) where a “jump” occurs in the degree of heterogeneity [
38].
3. Materials and Methods
3.1. Data and Sample
The database used for this study includes two complete databases, one for Hajdu-Bihar County in Hungary and one for Cluj County, Romania. Those databases include complete financial statements (balance sheet and income statement) for a period of five consecutive years for all active companies operating under the business activity code 4711—Retail sale in non-specialized stores with predominant sale of products food, beverages and tobacco. The financial statements were taken from the OPTEN database (a service providing complete information about economic entities) for Hungary, and for Romania they were received directly from the General Regional Directorate of Public Finances Cluj. Thus, the database includes 246 companies from Hungary and 1020 companies from Romania. In the study conducted on the financial performance of these companies, for the analysis we worked only with relative indicators because:
- -
the database includes all companies in this field of activity, from the smallest companies to large enterprises (in terms of turnover, value of assets, number of employees, etc.), so the absolute values would not have been representative and comparable.
- -
the financial statements were prepared in two different currencies (Hungarian forint and Romanian lei), so, by using the relative indicators, the results could be compared.
From the two databases, during the analysis and even in the first phase of data processing, the companies that recorded no revenue/sales (for the entire period analyzed, which means that they had no activity) were eliminated. There are many companies that no longer have activity, but have not officially closed their business and still submit financial statements. For these companies, financial performance is not relevant (zero). Therefore, the companies with incomplete data and/or those with zero net sales were eliminated from the analysis. Thus, only 690 Romanian companies and 211 Hungarian companies were taken into account for the statistical analysis (see
Table 2).
3.2. Financial Performance Variables
Starting from the fact that we have analyzed the financial performance of companies which are very different in terms of size, sales and number of employees, we only worked with relative indicators for group breakdown. To evaluate the financial performance, we chose to analyze only relative financial ratios. So, as grouping criteria we chose the most common profitability ratios: ROS—Return on Sales (for evaluating cost management), ROA—Return on Assets (for assets efficiency) and ROE—Return on Equity (for efficiency of invested resources) [
39,
40]. These were used to evaluate the financial performance of the companies. These three ratios are calculated based on the formulas included in
Table 3. All analyzed variables are numerical (percent).
Herciu et al. [
40] considered that the ROA indicator, which reflects the profitability of using assets, should be at least 5% in every case. Regarding ROE, which is the most important indicator for investors and which reflects how effectively a company’s management uses investors’ money, most professional investors are looking for investments that have a return over 15% [
40].
Hatem [
41] conducted an international comparison of companies from three countries using ROS, ROA, ROE and other indicators. The average values determined in his study for ROS, ROA and ROE in three European countries (Italy, Sweden and Switzerland) for three activity sectors (manufacturing, construction and other services, and professional activities) are illustrated in
Table 3. Nguyen et al. [
42] analyzed the profitability of 58 listed companies in Vietnam, also based on ROS, ROA and ROE financial indicators, and the mean values for those companies were 90% for ROS, 1.50% for ROA and 3.94% for ROE.
For the top 10 retailers in the word, Deloitte [
43] synthesized and analyzed performance indicators, of which, for ROA, the following values were recorded: Walmart Inc.—6.4%, Amazon.com Inc.—5.1%, Costco Wholesale Corporation—8.2%, The Kroger Co.—3.3%, Walgreens Boots Alliance, Inc.—5.9%, The Home Depot, Inc.—21.9%, Tesco PLC—1.9%.
For Romanian listed companies, Popa et al. [
44] studied the ROA and ROE indicators and arrived at the following values: a mean of 2% for ROA, minimum 147%, maximum 29%; and a mean of 8% for ROE, minimum −1.201%, maximum 1.013%.
As shown above, the ROS, ROA and ROE values are very different, but in all cases the first requirement for these indicators is that they should be all positive, and it is recommended that they be over 5% for ROS and ROA, and at least 10% and increasing in value for ROE (
Table 3).
Furthermore, there are many studies and economic–financial analyses which mainly use these three indicators to evaluate the financial performance of companies in various economic activities: in general, for listed firms [
45,
46,
47], non-financial listed companies [
34,
48], transport and warehouses firms [
39], agriculture [
49,
50], cosmetics industry [
51], food and beverage [
52], automotive industry [
53] and other industries [
54,
55].
Popa et al. [
44] also selected ROA and ROE indicators (in addition to six others) to build a composite financial index to determine the financial performance of listed companies. Pelloneova [
56] used ROE (in determining EVA), ROA and ROS financial indicators to compare the financial performance of selected companies included in different clusters in the Czech and Slovak Republics. Due to the differences between the companies, Afrimayani and Devianto [
57] (in terms of stock prices) and de Lima et al. [
58] (in terms of financial performance) used the clustering method and ROA and ROE financial indicators to compare the financial performance of listed companies.
3.3. Statistical Methods
The starting point for the statistical analysis was the calculation of some basic statistical indicators, such as mean, standard deviation, minimum, maximum, skewness and kurtosis. These were chosen to examine the homogeneity of the database values. The results justified the need for group breakdown; the elements of the database were heterogeneous, showing large differences from each other. Following the formation of clusters, homogeneous groups were obtained. For homogeneous grouping, a cluster analysis with two widely used non-hierarchical grouping methods was used, namely the K-Mean and K-Medoid methods.
The clustering procedures can be hierarchical (tree-like structure) or non-hierarchical. The hierarchical method forms clusters gradually, and consequently this method has very high process cost because all objects are compared before every clustering step [
59]. In the case of a big database, it can lead to a significantly high execution time. The algorithms of the K-Mean or K-Medoid methods (which are non-hierarchical methods) “generally change centers until all points are related to centers” [
59] (p. 7). When compared with hierarchical classification, non-hierarchical classification is characterized by low cost in terms of calculation time [
59]. Besides the execution time, in the case of larger samples the interpretation and use of the results of hierarchical cluster analysis are significantly more complicated. Therefore, it is advisable to use the K-Means method [
60] or the K-Medoid method.
Taking into account the above aspects, and bearing the main purpose of this study in mind, we focused only on the two non-hierarchical methods to compare the results of the K-Mean and K-Medoid methods in evaluating financial performance in the case of two large databases containing data related to three main financial indicators (ROS, ROA, ROE) for five years of active retail food companies from one Hungarian and one Romanian county. The grouping of companies was based on the ROS (Return on Sales), ROA (Return on Assets) and ROE (Return on Equity) ratios, in both cases. We worked with predefined group numbers which were determined using the Elbow method (described in the previous section). Additionally, in order to find out the number of clusters, for both databases we applied hierarchical cluster analysis. Ward’s method and the squared Euclidian distance were employed. Finally, in the case of the Hungarian database, we chose five clusters, while in the case of the Romanian database we decided on fifteen clusters.
In the final step, we compared the specific data obtained with the K-Mean and K-Medoid clustering methods separately for each database, based on the five-year average values of the groups.
The statistical analysis of the databases and the editing of the graphs and diagrams were performed using Microsoft Excel spreadsheets, IBM SPSS Statistics 26.0 (IBM, Armonk, NY, USA) and R statistical software (version R, 3.5.0, R Core Team/R Foundation for Statistical Computing, Vienna, Austria).
4. Research Results
4.1. Descriptive Statistical Results
As shown in the previous section (
Table 2), based on the descriptive analysis (mean, minimum—maximum values, standard deviation), the statistical results clearly show that the elements are heterogeneous, with a very large range of data for all financial indicators. Thus, in the case of the Hungarian database (N = 211), as well as in the case of the Romanian database (N = 690), very high differences between minimum and maximum values are noticed for all three financial indicators (ROS, ROA and ROE).
Therefore, before beginning the grouping process, outliers were identified. An “outlier” is defined by Hodge and Austin [
61] as “one that appears to deviate markedly from other members of the sample in which it occurs” (p. 85). According to Hawkings [
62], “outliers deviate significantly from the expectations”.
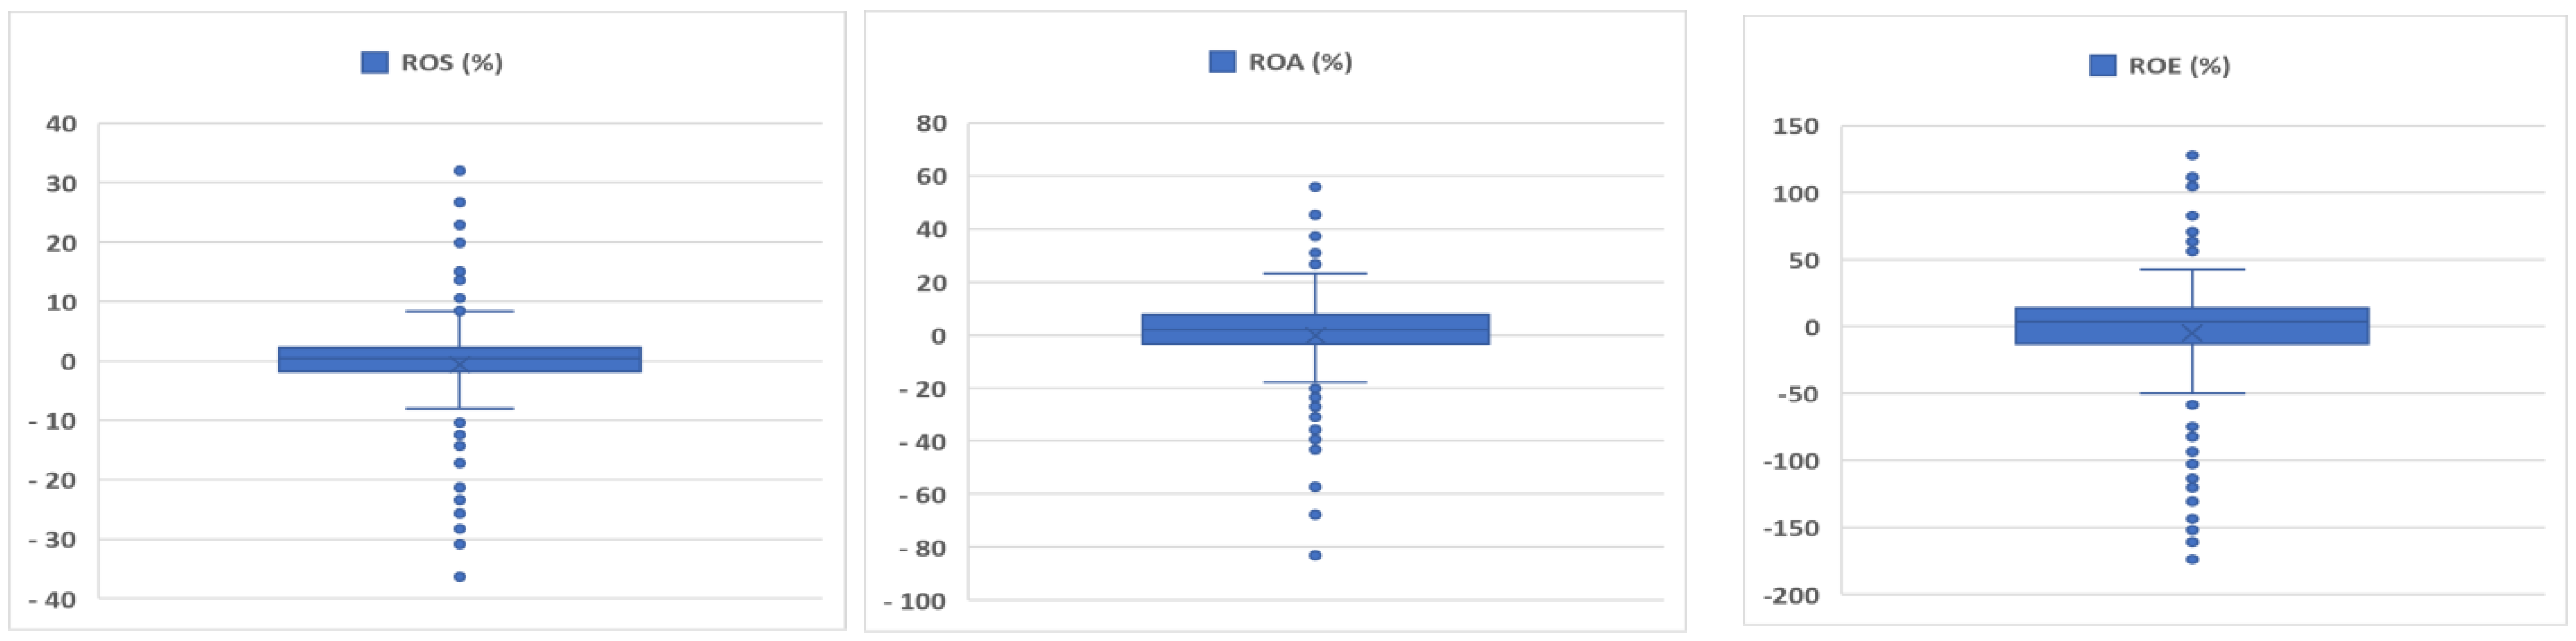
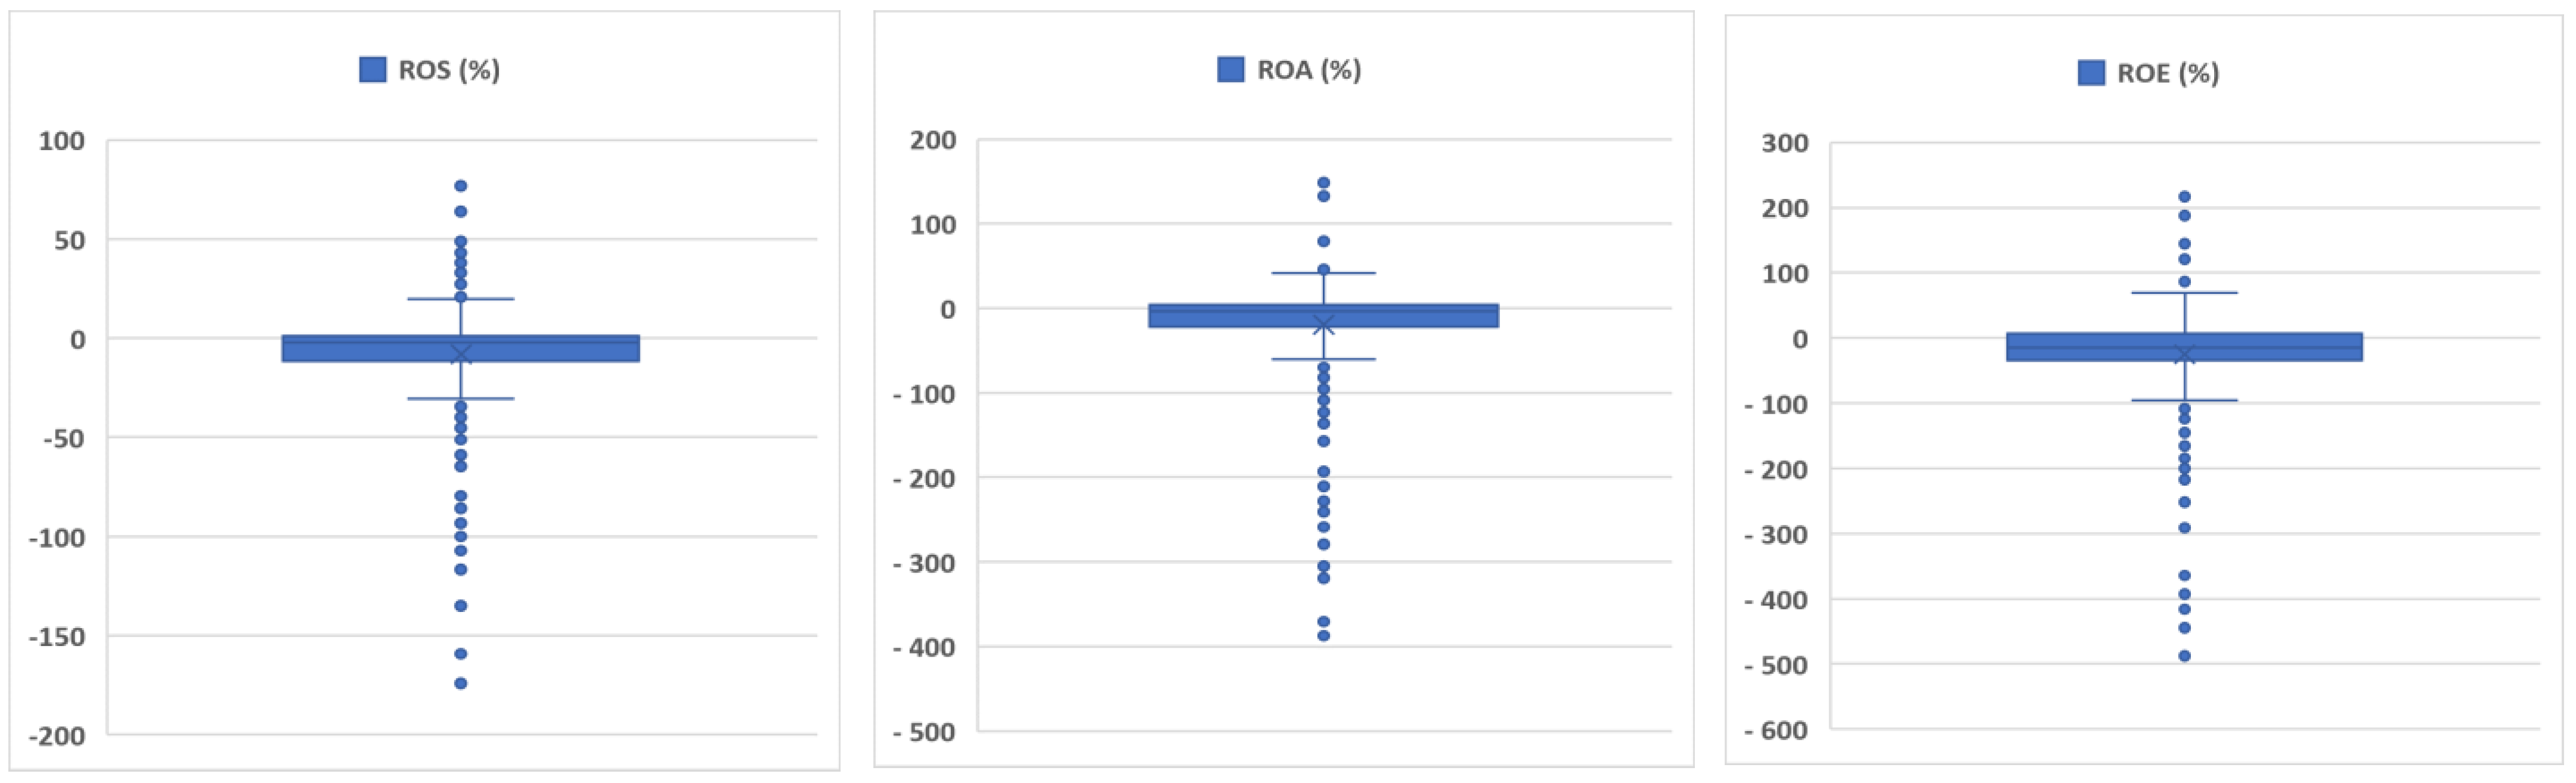
Extreme values were identified step by step using the BoxPlot chart, separately for each database and separately for each indicator (ROS, ROA, ROE). Many authors describe the BoxPlot diagram method as a possible (visually) method to detect outliers [
61,
63,
64,
65]. The BoxPlot chart helped us visually identify values that are outside the “normal” “value clouds”, values that can distort and tilt the group average.
Based on several boxplot charts, and eliminating the outliers step by step, we have reached the following minimum and maximum values for the three financial indicators (ROS, ROA, ROE) separately for the Romanian and the Hungarian companies (see
Table 4 and
Table 5,
Figure 1 and
Figure 2). For the Hungarian companies, the minimum and maximum values are as follows: for ROS, −36.36% and +32.00%; for ROA, −83.17% and +55.85%; and for ROE, −173.88% and +127.87%. The values of the financial indicators in the case of the Romanian companies are: −174.19% and +63.97% (for ROS); −370.43% and +148.75% (for ROA); and −487.92% and +216.63% (for ROE).
The distribution of the mean values for ROS (Return on Sales), ROA (Return on Assets) and ROE (Return on Equity) without outliers is shown in
Figure 1 and
Figure 2.
In the end, the numbers of the remaining companies in the two databases were as follows: the Romanian database contained 640, while the Hungarian database contained 190 companies.
The kurtosis and skewness indicators (
Table 4 and
Table 5) also support what the previous indicators have shown: the companies are very different from the normal distribution. Examining the values of these statistical indicators, we can definitely conclude that the companies differ greatly from the normal distribution for both countries. These results confirmed our initial assumption that the differences between the individuals (companies) in the database are significant, so homogeneous grouping is required.
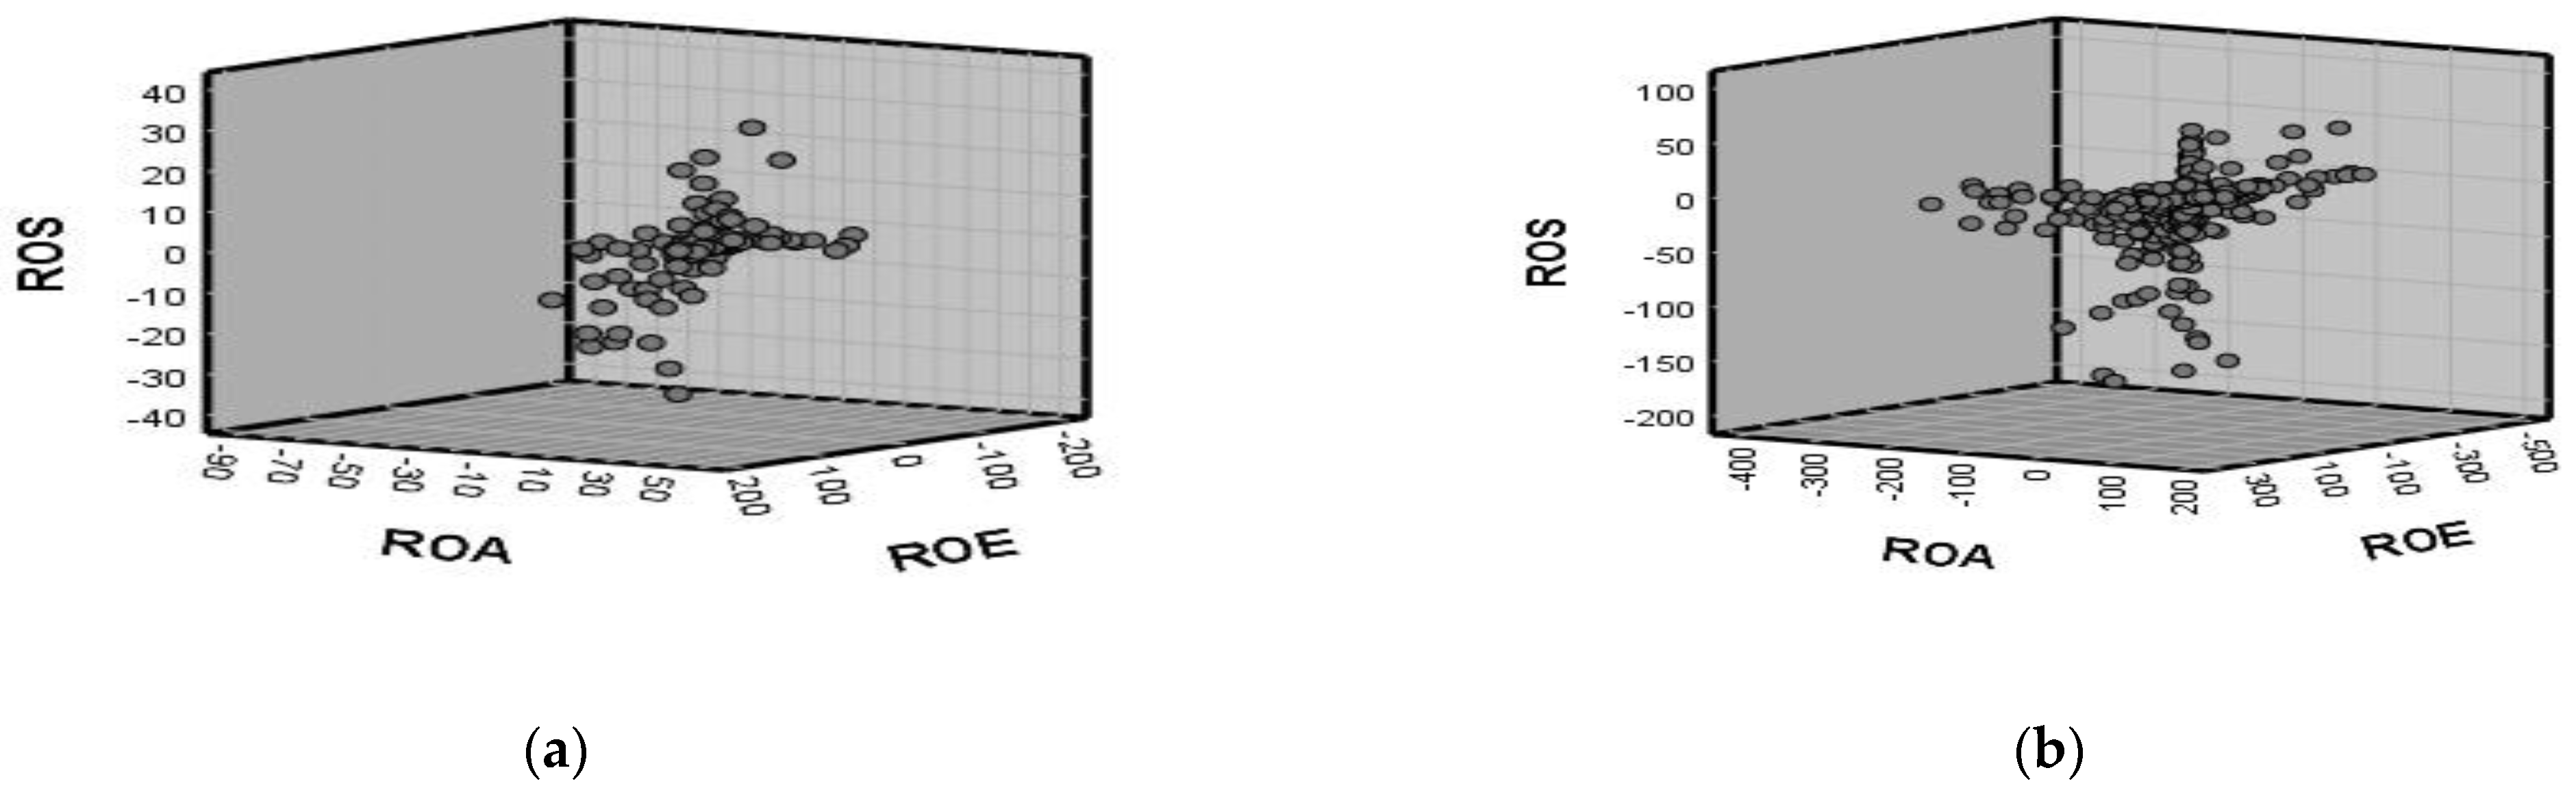
The results of the correlation analysis (
Table 4) highlighted that, in the case of Hungarian companies, ROS was positively correlated with both the ROA (r = 0.668) and ROE (r = 0.395). The same positive correlation (but of a lower intensity) was seen between all three indicators in the case of Romanian companies (
Table 5), confirming that the level of cost management, the efficiency of assets and the efficiency of invested resources are interlinked (
Figure 3).
4.2. Cluster Analysis Results: An Overall Picture
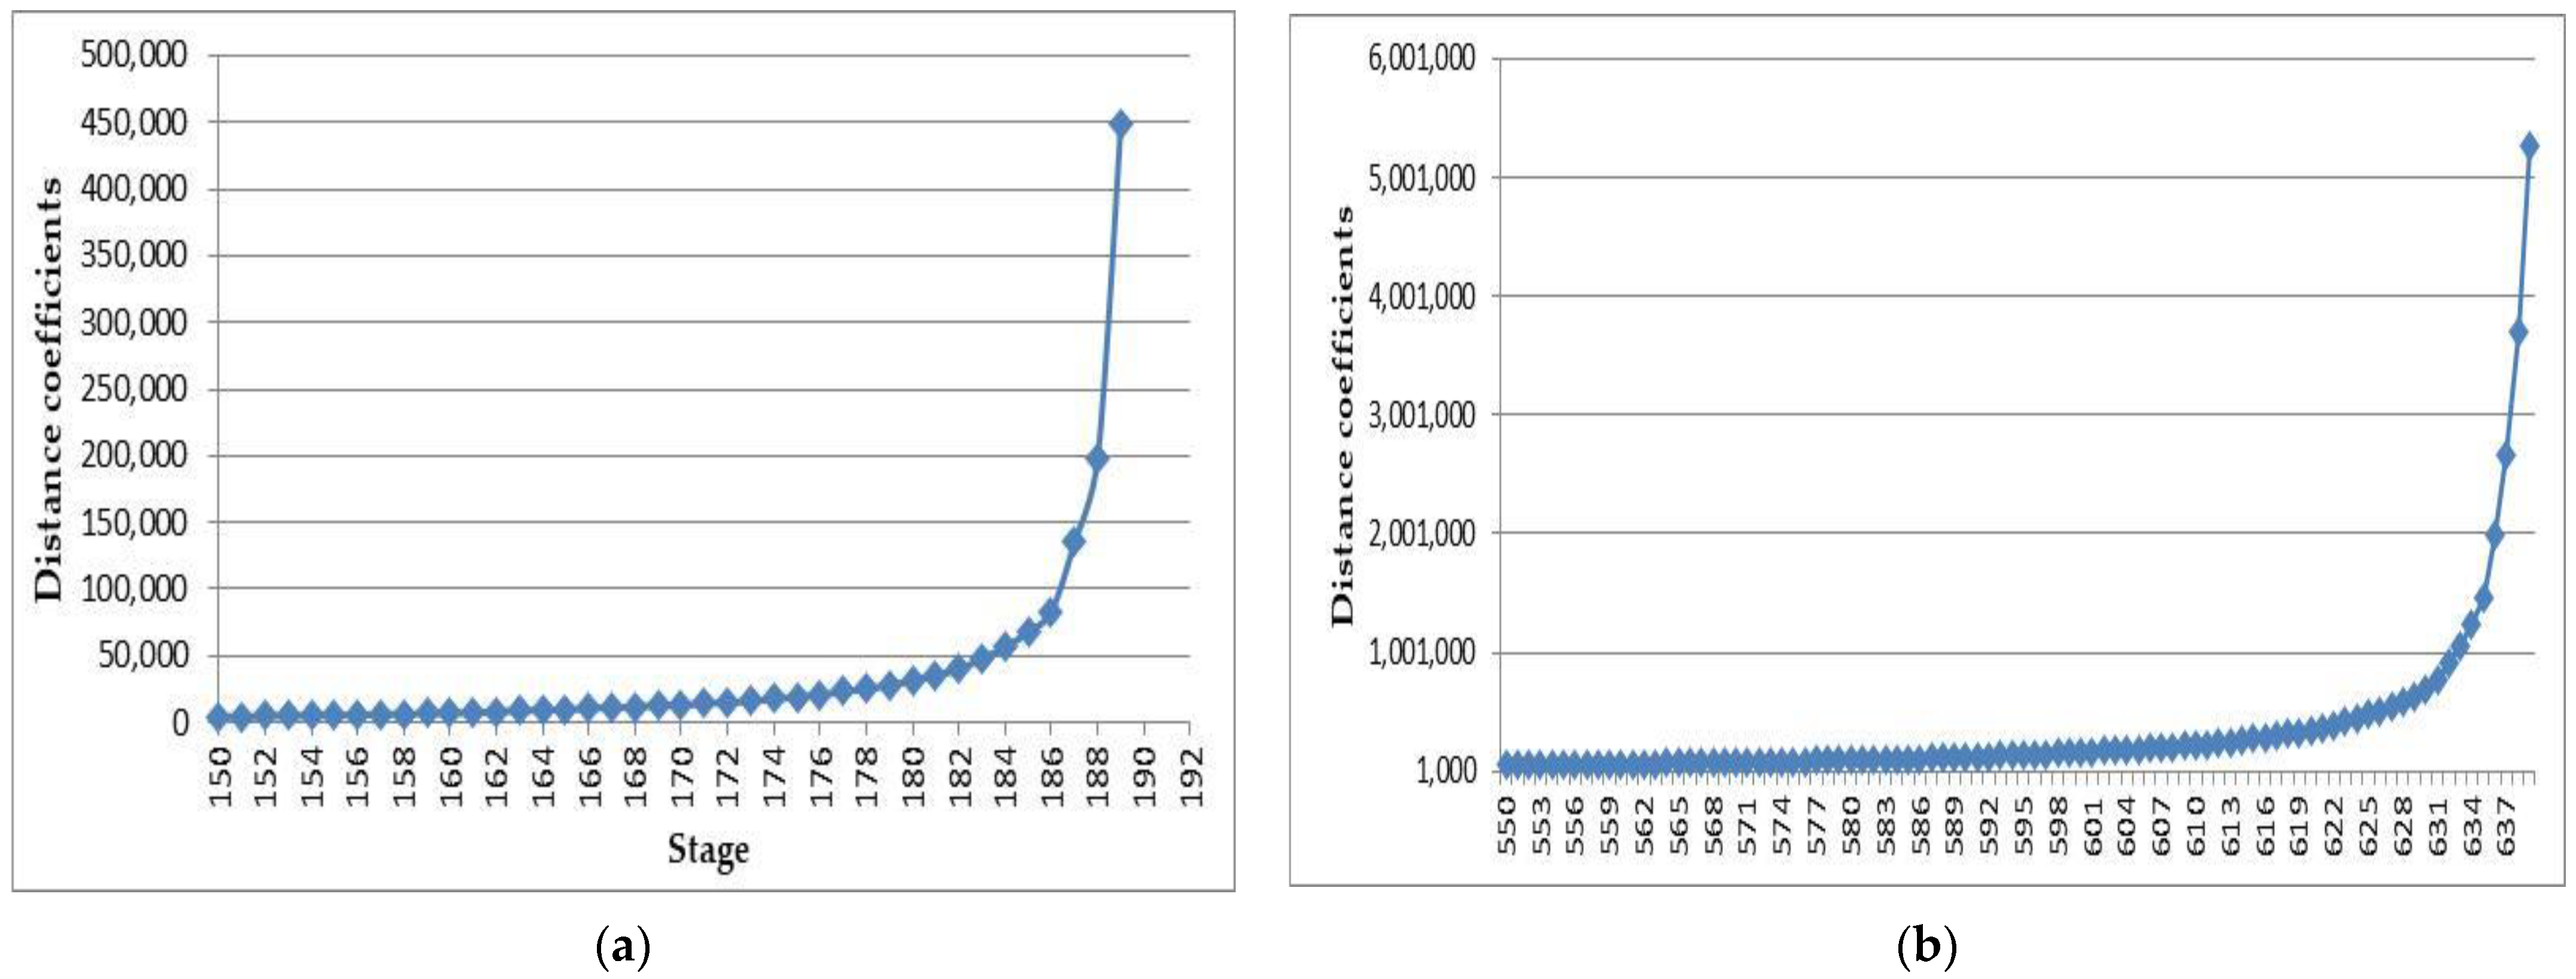
The
Figure 4a,b show the results of the Elbow method used to determine the cluster numbers (plotting of cluster numbers can show the break point—Elbow criterion, which represents the optimal cluster number). As a result, five clusters were used for Hungarian companies and fifteen for Romanian companies.
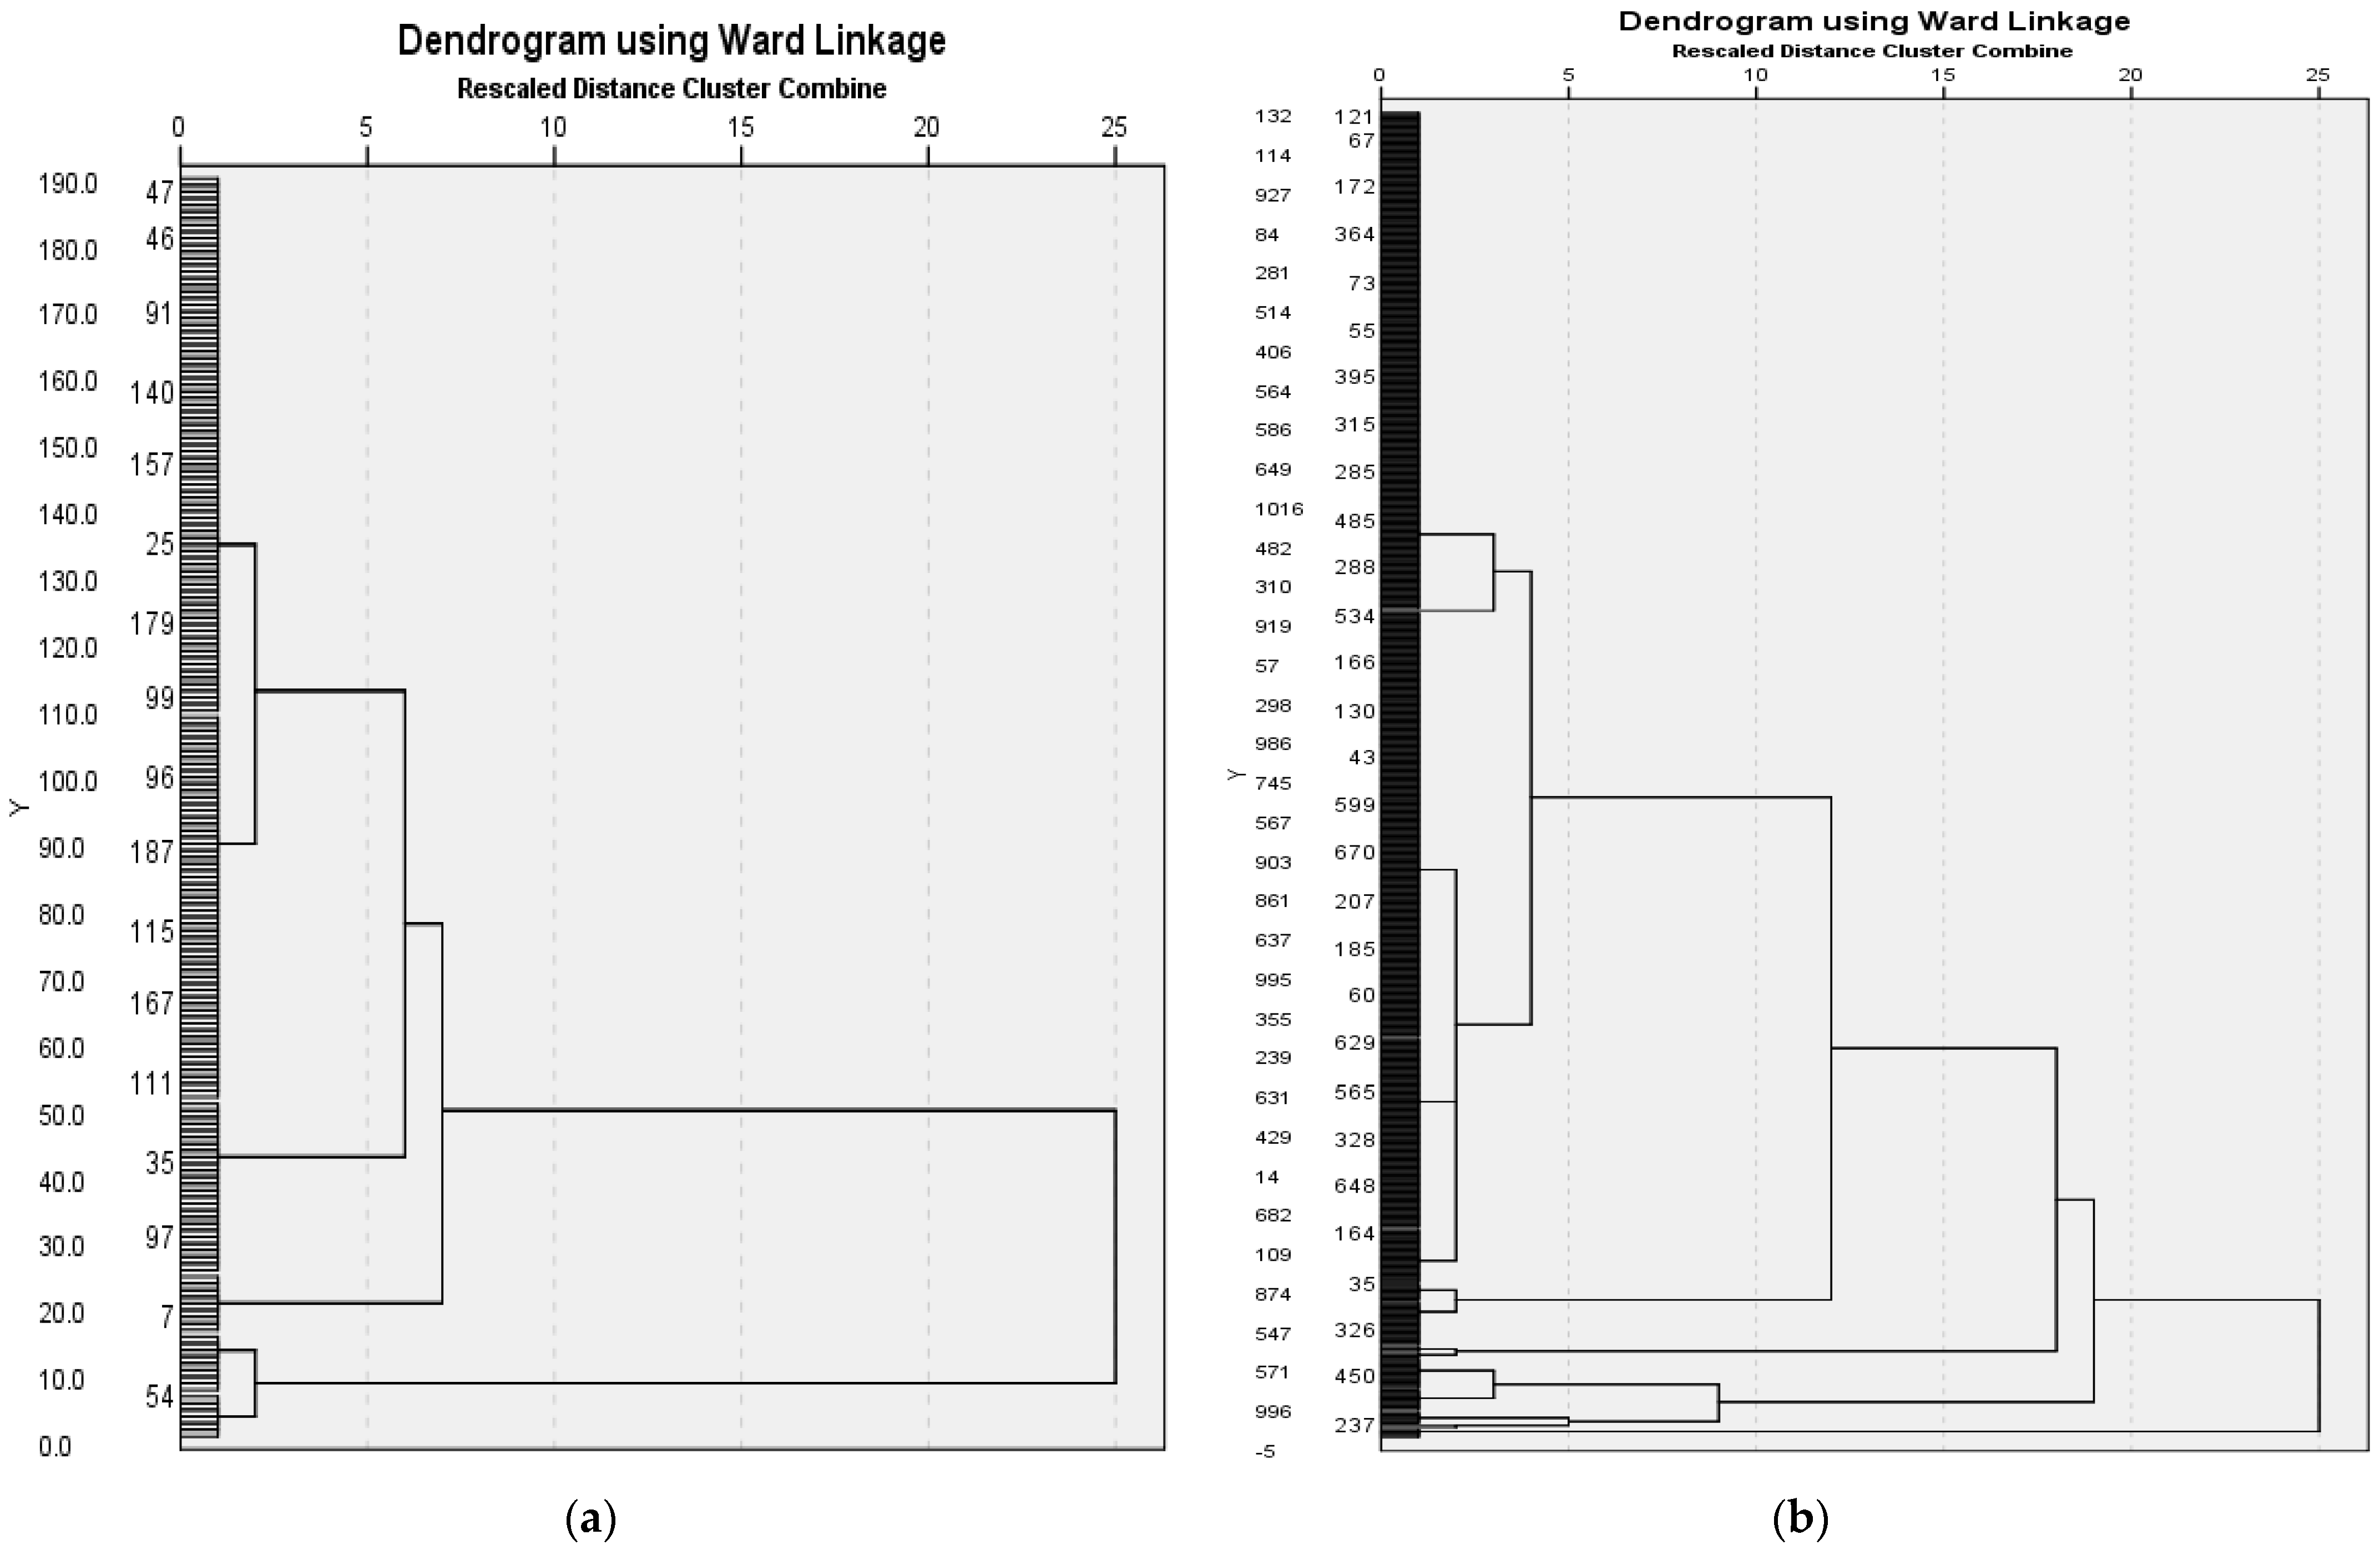
Furthermore, the dendrograms (see
Figure 5a,b), obtained using hierarchical cluster analysis (Ward’s method and squared Euclidian distance), have confirmed the number of clusters, five in the case of Hungarian companies, and fifteen in the case of Romanian companies.
In the next step, the structure of the clusters was based on both the K-Mean and the K-Medoid method. We have worked with the same number of clusters in the case of the K-Mean method as well as the K-Medoid method mainly due to the aim of this study, i.e., to perform a comparative analysis of the financial performance of companies based on the results of the two methods, focusing on the difference between them.
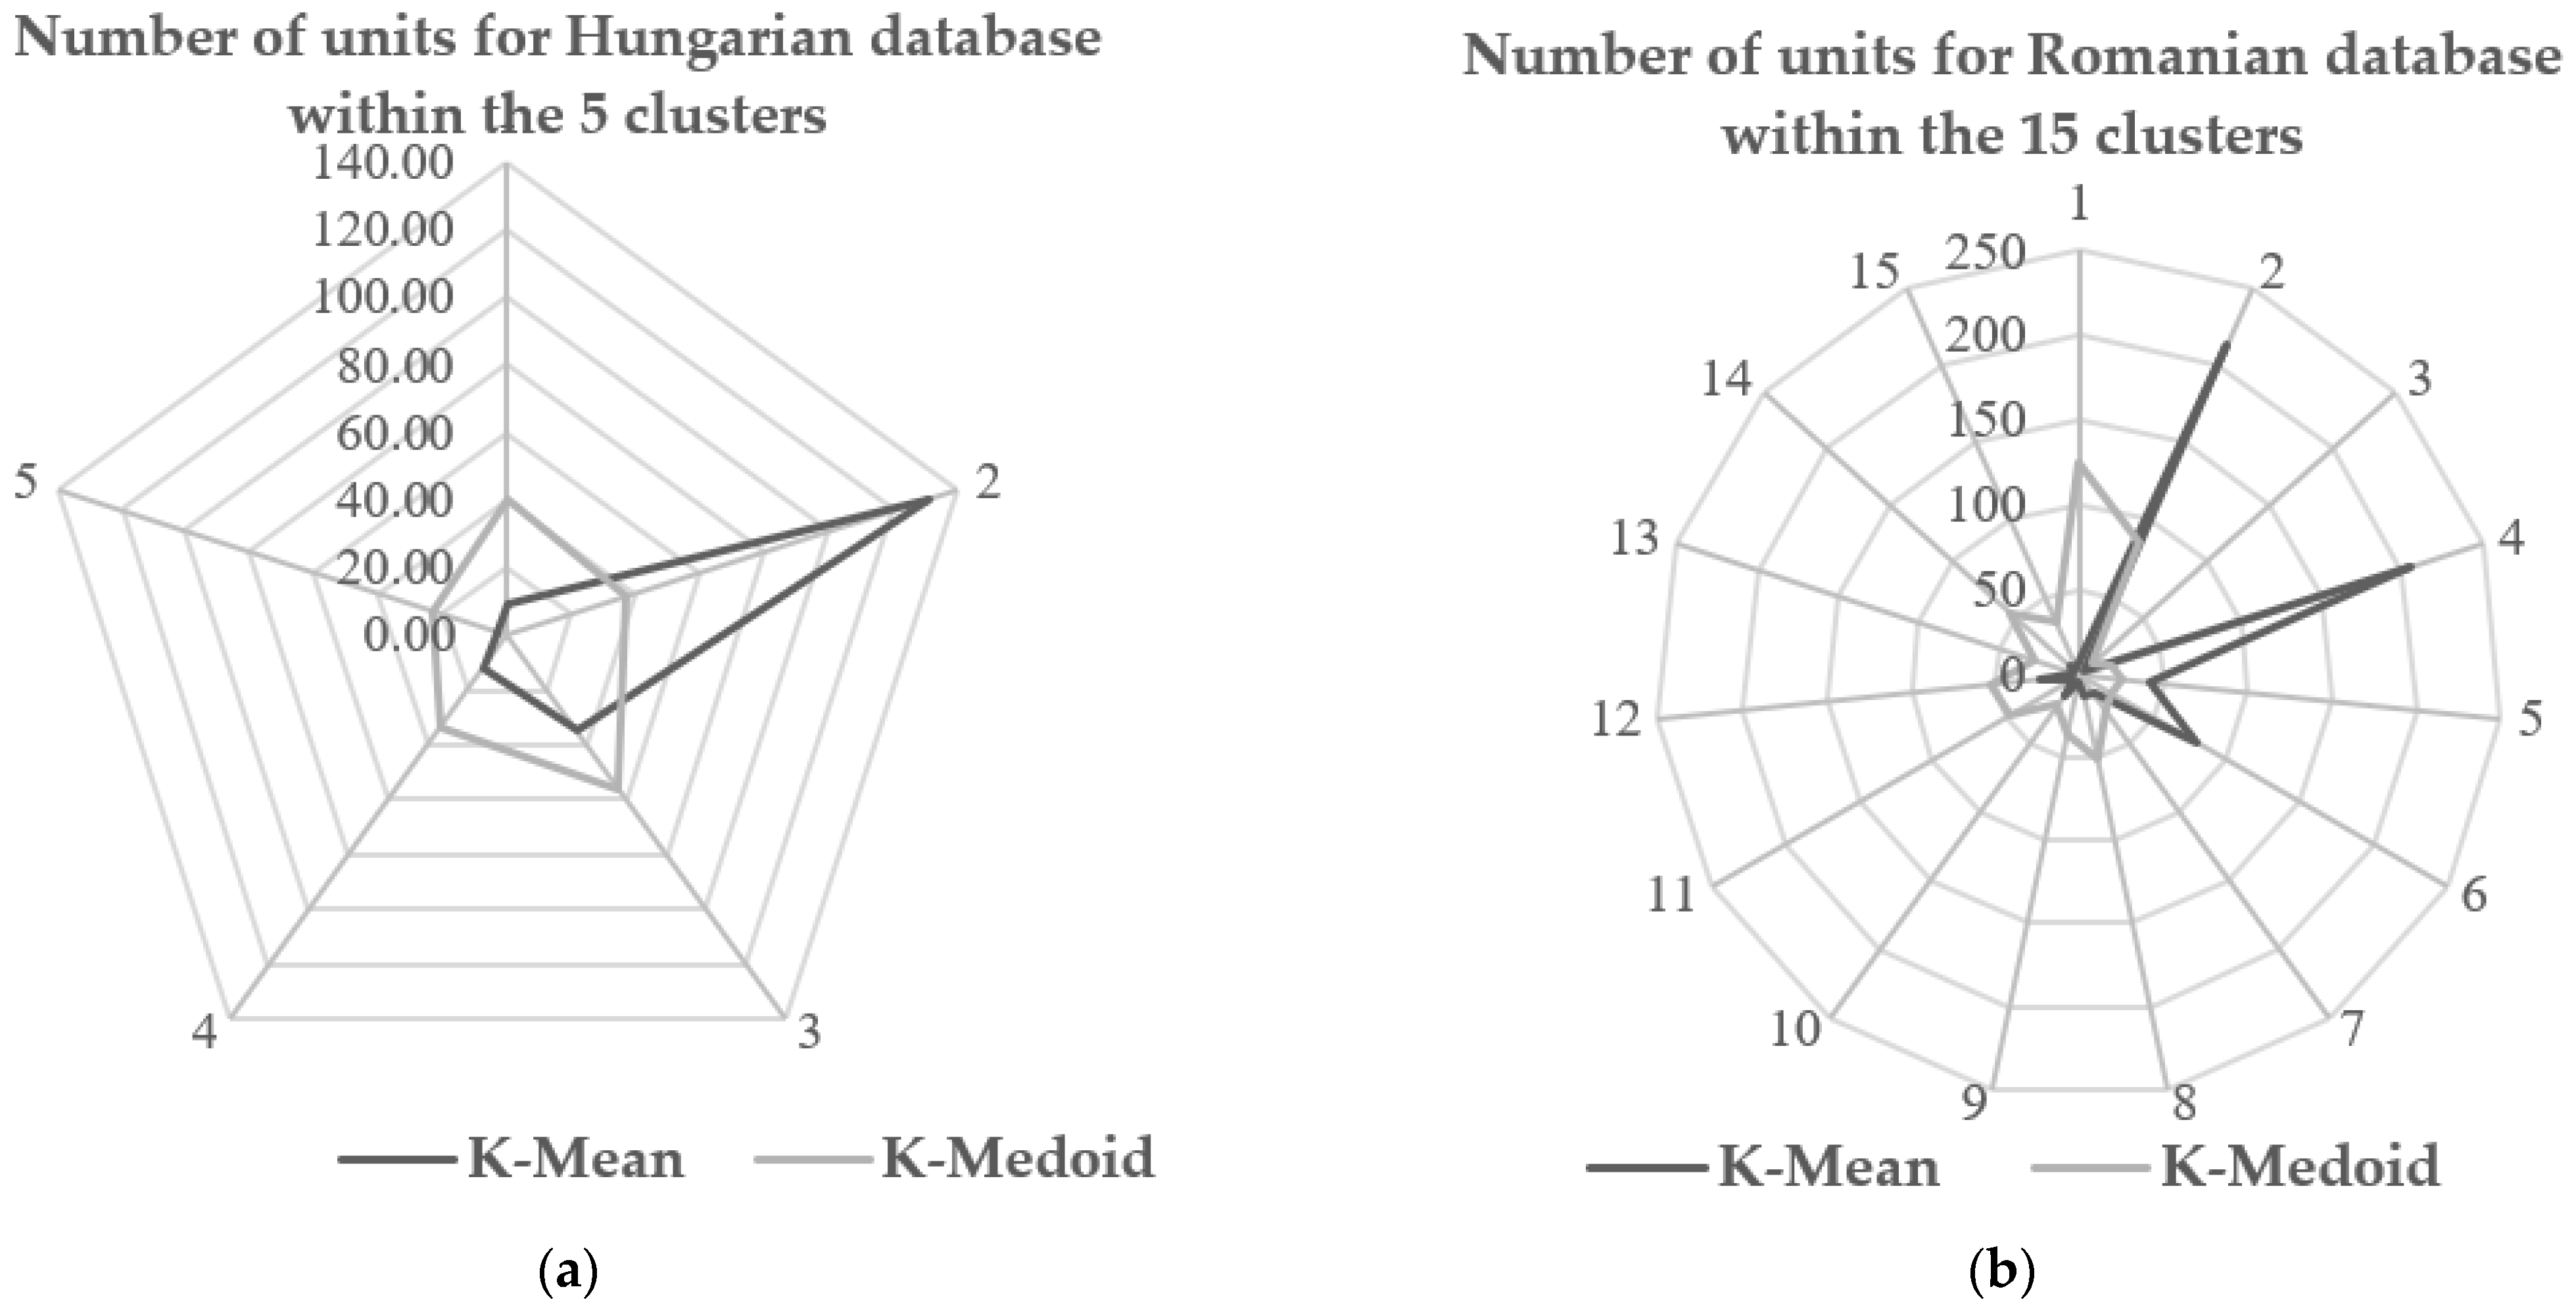
We can see quite a big difference in the number of companies included in the K-Mean and K-Medoid groups, as shown in
Figure 6a,b. As can be seen, the K-Mean method has a much more varied number of companies within the group, and the K-Medoid has a more even distribution of companies, both for Hungarian (the database with fewer units) and Romanian companies (the bigger database).
The results obtained using the K-Mean method for the Hungarian companies highlighted that the number of companies included in cluster no. 5 (3 companies) is only 1.58% of the total companies (190 companies), while the number of companies included in cluster no. 2 (131 companies), which contains more enterprises, is 68.95% of the total companies (190 companies). In contrast, the numbers of companies in the groups obtained by the group breakdown using the K-Medoid method is much more balanced: the group with the fewest companies included contained 12.11% (cluster no. 5 with 23 companies) of total companies (190 companies) and the group with the most companies included contained 29.47% (cluster no. 2 with 56 companies) of the total companies (190).
The results are similar for the Romanian companies, too: the K-Mean method has a much more varied number of companies within the group, compared to the K-Medoid method which has a more even distribution of companies. The number of Romanian companies included in the database was much higher (640 companies) and the differences between them were also larger, so we worked with 15 clusters. Grouping the companies with the K-Mean method, we obtained 5 clusters (clusters no. 3, 9, 11, 13, 15) with less than 1% of the companies included in these groups (which means less than 7 companies) from the total companies (640), and two clusters (clusters no. 2 and 4) with 32% (205 companies) and 33% (214 companies) of the companies included from the total.
4.3. Comparative Analysis of Financial Performance Results: K-Mean vs. K-Medoid
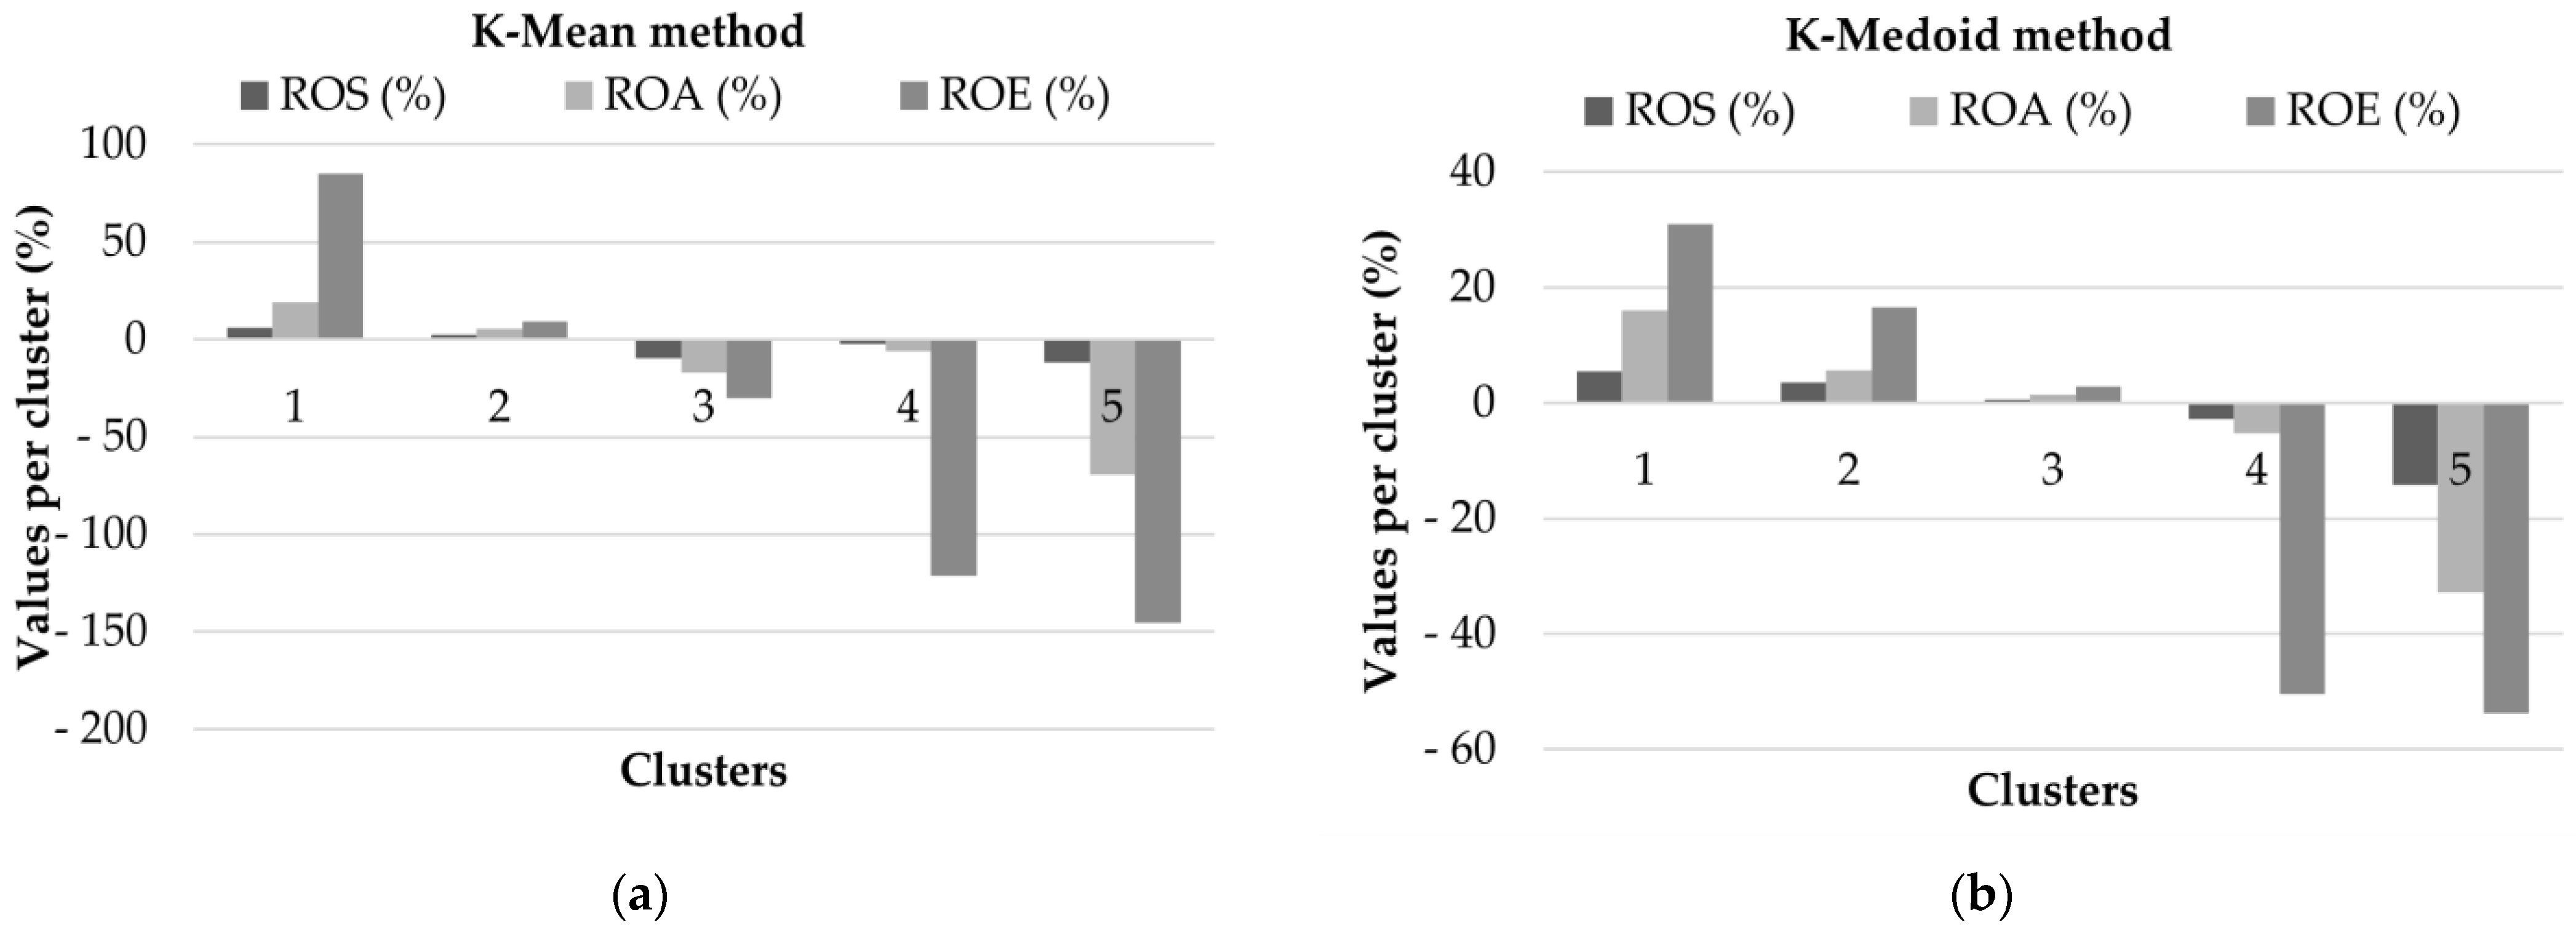
The average values of ROS (Return on Sales), ROA (Return on Assets) and ROE (Return on Equity) for the five groups of the Hungarian database (190 companies) are shown in
Table 6.
Also, the differences between the results obtained from the K-Mean and K-Medoid clustering methods are clearly illustrated in
Figure 7. Thus, the results obtained based on the K-Mean method better reflect the “fluctuating” values: for each of the three ratios, the highest and lowest values are higher than the values obtained based on the K-Medoid method (ROE: 85.26% vs. 30.95% and −145.06% vs. −53.73%).
Evaluating the financial results, it can be seen that there are two (K-Mean) and three (K-Medoid) groups with ROS, ROA and ROE financial ratios in the positive interval; this means that 73% of the companies grouped based on the K-Mean method and 70% of the companies grouped by the K-Medoid method have positive financial ratios. The fact that the indicators (about 70% of companies) have a positive value is the main requirement for these indicators and, obviously, the higher they are, the better the financial performance is. If compared with the existing values in the specialized literature, these positive values fall within the “normal/existing” values, but the problem appears in the case of clusters (companies) that register negative values.
The most visible differences are in case of the ROE indicator for all five clusters.
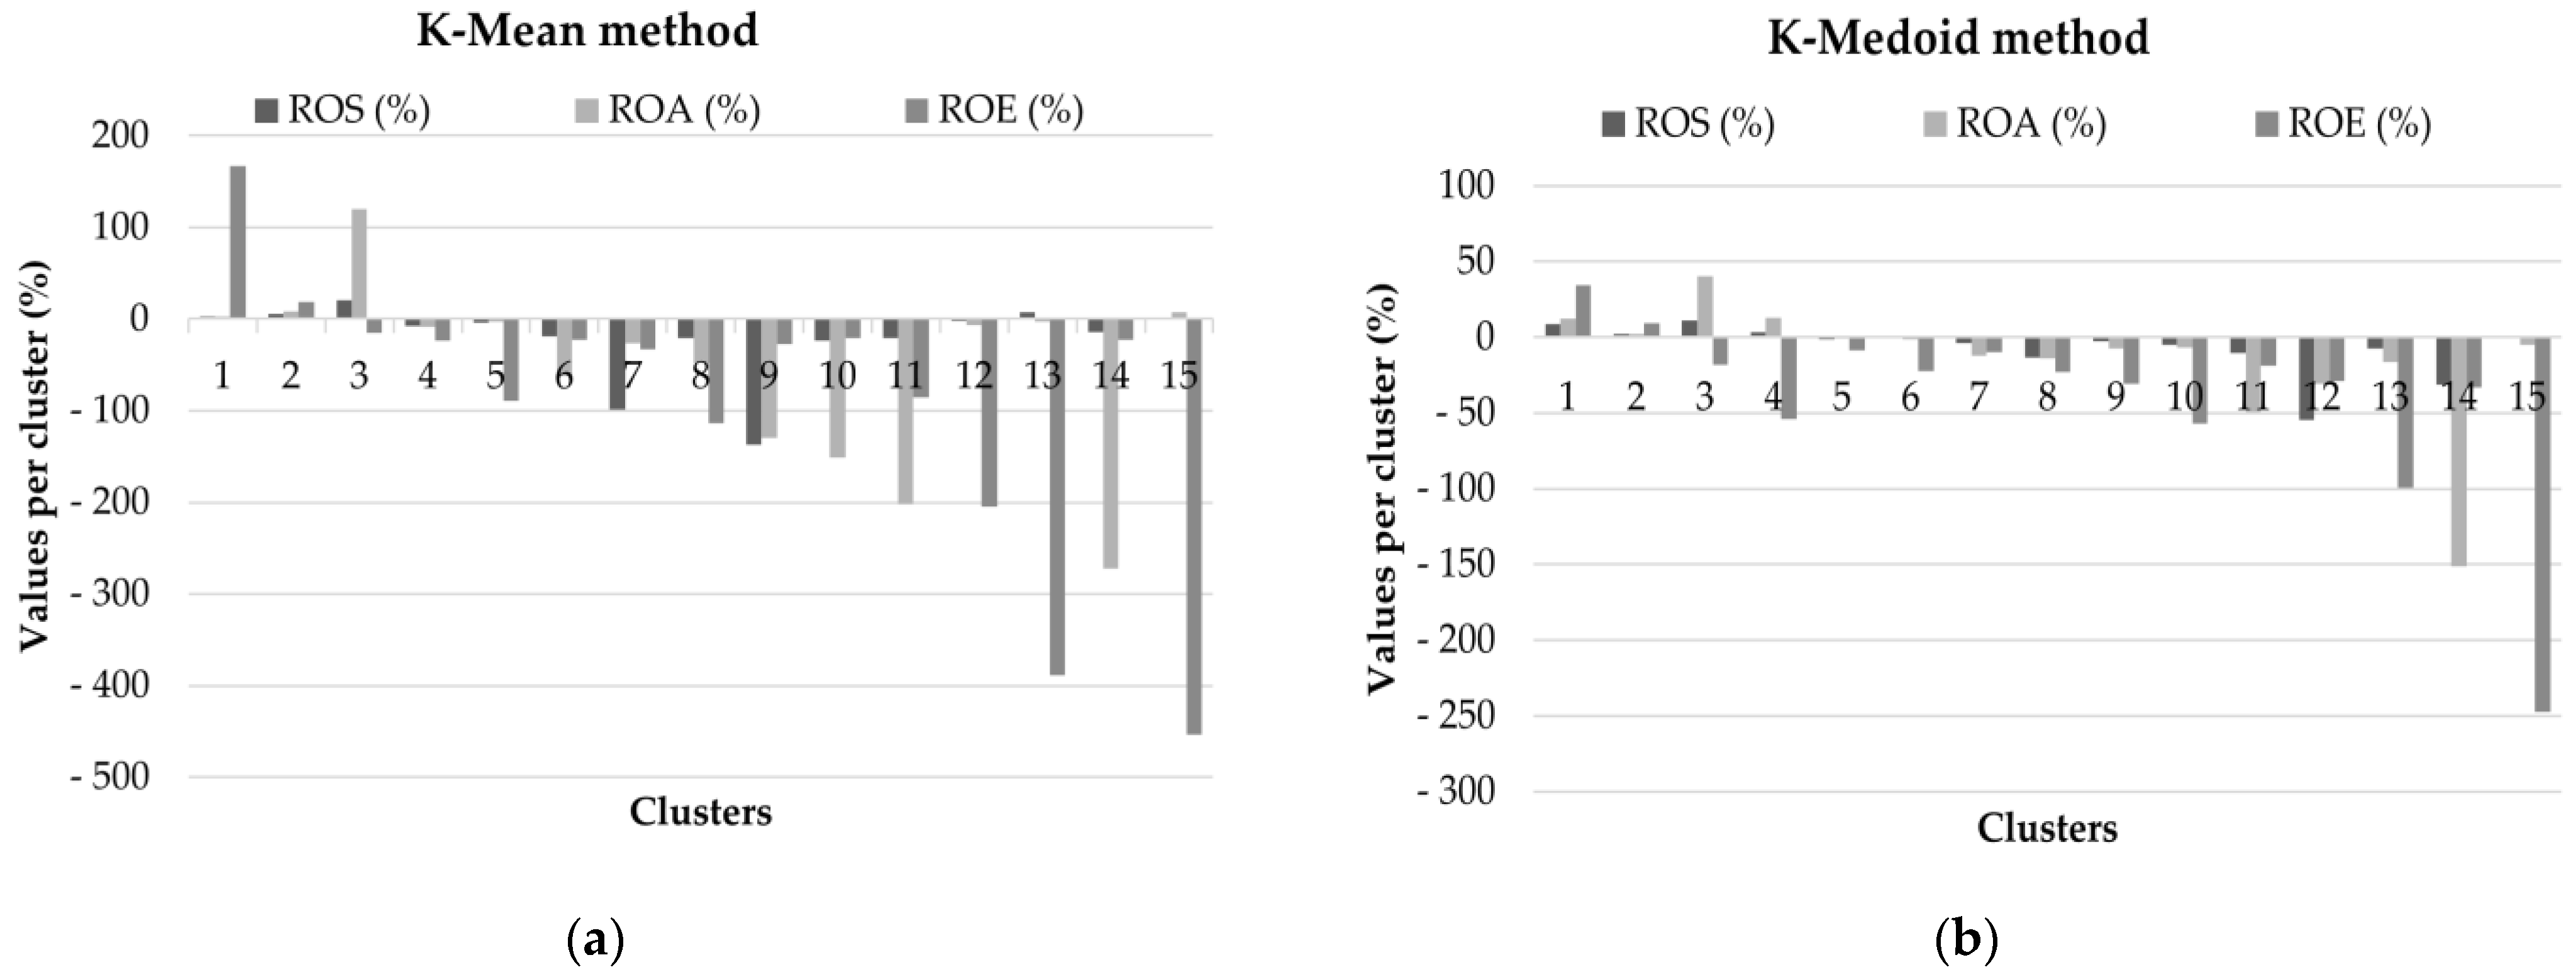
The number of Romanian companies included in the database and the differences between them were also larger, so we worked with fifteen clusters. The results are shown in
Table 7 and
Figure 8.
The characteristics of the Hungarian database are also present here: the results obtained with the K-Mean method better reflect values that differ significantly from the average, while the K-Medoid method compensates the fluctuations. The range of values for the groups obtained with the K-Mean method is much larger than in the case of the groups obtained with the K-Medoid method.
The financial performance of Romanian companies is much weaker than that of Hungarian companies, with a lot of negative results (negative net profit), directly affecting ROS, ROA and ROE values. Thus, positive financial ratios were obtained by three groups containing about 35% of the analyzed companies in the case of the K-Mean grouping method, and by four groups containing 37.5% of the total companies when using the K-Medoid grouping method. Most companies recorded negative values for the three indicators, which means that the net result is negative, i.e., the activity is not profitable. This phenomenon is repeated every year, a fact which leads to a negative value for the equity of the enterprises. Although there is a legal provision in Romania regarding the increase of equity in case of consecutive losses [
66], it seems that this legal provision is not applied by companies.
We grouped financial performance in three categories, namely
Good (all three financial indicators—ROS, ROA and ROE—are above +5% or more),
Acceptable or Weak (the financial ratios are all positive but close to zero) and
Negative (all three financial indicators are below zero, i.e., they all have negative values). In this regard, the assessment of the financial performance of Hungarian and Romanian commercial enterprises is included in
Table 8 (the proportion of enterprises in different categories).
As shown in the previous table, the results for financial performance do differ: for Hungarian companies, when applying the K-Mean method, 68.95% of companies have an acceptable financial performance, while in the case of K-Medoid only 29.47%; for Romanian companies 1.56% of companies have an acceptable financial performance when applying the K-Mean method and 17.81% in the case of K-Medoid.
5. Discussion and Conclusions
The fundamental research hypothesis of this paper was as follows: in the case of large databases with variable quantitative data, cluster analysis is necessary in order to obtain accurate results and the clustering method chosen can yield different results.
Therefore, this study has pointed out that the results obtained using the two grouping methods (K-Mean and K-Medoid) are different. These findings are in line with other research papers [
23,
24,
31,
33] that have highlighted the advantages and disadvantages of the two methods. Moreover, our analysis identified significant differences between the results of these non-hierarchical clustering methods in terms of intra-group numbers: they are more uniform in case of the K-Medoid method than in case of the K-Mean method. Furthermore, this study emphasizes that the K-Medoid method is less sensitive to extremes and that it has better distribution within the group, with more balanced values. In the case of the K-Mean method, the grouping procedure is more sensitive and the range between the values of the units in the group is larger; at the same time, it gives a more detailed picture of the phenomenon under investigation.
Based on these results and the hypotheses assumed at the beginning of the research, we can state the following:
Processing the financial statements of the companies included in the database, we analyzed the most common statistical indicators (average, dispersion, deviation, standard deviation, kurtosis, skewness) for the financial performance indicators (ROS, ROA and ROE). The results have shown clearly that the companies are heterogeneous with a very large range of data for all indicators. An analysis of the standard deviation values was used to show the variability of the data and the differences between the individual data. These results confirmed our first hypothesis that the database contains highly variable elements.
The results of the descriptive statistical indicators confirmed our assumptions that we cannot examine the financial performance of the companies in the database based only on the average values of the financial indicators. Therefore, it is necessary to group the sample population into several homogeneous groups based on certain key indicators. The average values cannot be representative.
In order to achieve homogenous clusters, the key indicators were selected in accordance with the objectives of the research. Therefore, we selected the three main indicators having the most comprehensive characteristics of financial performance, which are the most accepted in the literature, too (ROS, ROA and ROE). The selection and determination of the indicators or characteristics based on which the groups will be formed are very important, as they can influence the obtained results. These indicators or characteristics must reflect the aim of the research. Of course, selecting other indicators can lead to a different group composition.
The results of the two applied grouping methods (K-Mean and K-Medoid) supported our main assumption that the chosen and applied method leads to different results. Thus, the results obtained with the K-Mean method better reflect values that differ significantly from the average (they better reflect the “fluctuating” values), while the K-Medoid method compensates the fluctuations. This characteristic manifested itself in both cases, both for companies in Hungary and for companies in Romania.
The focus of the research was not on the difference between the two “countries” but on the analysis of two “different databases”. As we have shown, the study identified significant differences both in the number of elements of the two databases and in the homogeneity of the databases. Therefore, there is a need for grouping the similar elements of a database. For smaller, more homogeneous, and larger, heterogeneous databases, the two grouping methods (K-Mean and K-Medoid) lead to different results. In terms of procedure, the two databases could be merged, but the authors aimed to demonstrate that even for different data (smaller, larger, more homogeneous, or less homogeneous), there is a significant difference between the results of the two procedures.
All the hypotheses presented at the beginning were successfully supported by empirical data.
It is indisputable that the two different grouping methods applied to the same database give different results. For financial ratios, these methods led to different performance evaluations of food retail companies. In the case of a large number of elements in databases from a statistical point of view, taking into account that the K-Medoid method is less sensitive to extreme and fluctuating values, this method has created balanced numbers of the units within the groups (each group has more than 10% of the total database). For K-Mean, it was not uncommon to have “only a few units groups”, which means 1%, 2% or 3% of the total database (this also supports the sensitivity of the K-Mean method for outliers).
Even though outliers were eliminated from the database, there are still several swinging values in the database which are not statistically representative values. The essence of cluster analysis is to find the common features of the sample population. From this perspective, the authors recommend the K-Medoid method for statistical analysis of large databases, while the K-Mean clustering method is recommended for the evaluation of more detailed analyses that also focus on fluctuating values.
Moreover, our findings regarding the financial performance of food retail businesses prove that their performance is unfavorable and even very weak. Especially in the case of Romanian companies, there are a lot of enterprises that achieve negative results, which produce losses not only in a given year, but year after year. In such circumstances, the question arises of how these businesses will manage to survive in the future and possibly develop even in the current difficult circumstances.
The expansion of hypermarkets and supermarkets, globalization and the online market have pushed “traditional” food retailers into a difficult situation characterized by low long-term investments in these businesses, accumulated losses from previous years and very low levels of profit margins applied. Taking all these into account, the level of financial performance of “traditional” food retailers is very low. It is worth mentioning that in this industry there is a significant number of companies (approx. 28% of total active companies in Romania) and a large number of employees (almost 1 million employees) [
67].
Such challenges need to be managed by “traditional” retail businesses in order to survive and even to gain competitive advantages over their main competitors. In contrast to large shopping centers, the “traditional” shops are much more customer-centered, have a more familiar atmosphere and geographical location benefits, offering local products to consumers, and provide more direct relationships [
52]. As regards pricing policy, they cannot compete with modern chain stores, but they can offer higher quality and local products. Furthermore, an important way to improve “traditional” retail businesses is to stimulate consumers to buy local and traditional products, to focus on the shorter supply chains, and to consume organic products as much as possible. This strategy is quite well adopted in Hungary due to the fact that local products and the consumption of food products originating in Hungary are constantly promoted in the media. Also, these products carry a certain label/emblem so that consumers can identify local and national products on store shelves more easily.
In order to improve the financial performance of companies grouped in clusters based on the K-Medoid method (which is the clustering method recommended based on our results), the authors propose the following specific measures for company management:
For companies included in the clusters with negative values for all three financial indicators (in the case of Hungary, clusters 4 and 5 which contain 57 companies, representing 30% of the total companies from the Hungarian database; in the case of Romania, clusters 5 to 15, containing 400 companies, which represent 62.5% of the total companies from the Romanian database), our recommendation is an injection of capital from the owners, primarily to regain the financial stability of the company. Also, these companies should adopt strategies for attracting customers which can lead to positive results in the future (e.g., modernizing locations thus attracting customers, loyalty programs, offering quality and local products, which can support a higher commercial margin). These measures should also be aligned with efforts made by the authorities to require companies, and their owners, to protect a company’s equity [
66], using different measures (e.g., capital injection) in the case of longer-term and significant negative equity. It is worth mentioning that the very high level of negative equity is primarily the result of the annual accumulation of negative after-tax profit. Furthermore, taxation in Romania (in the case of small businesses) should be improved taking into consideration that the current form of taxation is not effective due to the fact that the tax paid by companies is calculated based on the result (profit), but not on revenue–sales, and that companies strive to achieve a minimal or even negative result in order to avoid taxation [
68]. It is possible that this will have long-term positive effects on equity.
For companies whose financial indicators are close to zero, or where ROE is negative (cluster 3 from Hungary, containing 56 companies, which represents 29.47% of the total companies from the database, and clusters 3 and 4 from Romania, including 29 companies, which represent 4.53% of the total companies from the Romanian database), capital injection can be the solution that provides immediate “oxygen” and can restore the financial balance of a company.
In the case of companies with positive and also good financial results (clusters 1 and 2 from Hungary, which contain 77 companies, representing 40.52% of the total Hungarian companies from the database, and clusters 1 and 2, which include 211 Romanian companies, representing 32.96% of the total Romanian companies from the database), keeping and/or achieving even better financial performance in the future requires some specific measures, such as: long-term investments, very good inventory management, larger and varied product offerings, faster service, engagement in local social and cultural life (e.g., participation at local fairs), tastings, product presentations, promotions and continuous market research in order to retain customers [
69].
The originality of the paper consists in the fact that the databases on which the study was based represent 100% complete databases for the chosen “sample”, i.e., they include all the active companies within the chosen field of activity from the two regions. A unique comparison was made in terms of the financial performance of retailers in non-specialist shops with predominant sales of food, beverage and tobacco from two different countries. The study has shown that the method chosen (in this case K-Mean or K-Medoid) for grouping companies in the database can lead to different results in terms of assessing financial performance.
Limitations and Future Research
It should be noted that this study, like any other study, has certain limitations and can be continued and improved upon in certain directions, and also presents original elements, undisputed by other specialists.
As limitations of the study, we can mention the number of financial indicators used in the research (only the most common financial indicators were chosen: ROS, ROA, ROE); the analysis period (the financial statements of the companies on which the analysis was performed comprised only five consecutive years); that only the trade sector was chosen as the field of activity of analyzed companies (the companies in the database are only companies whose main activity is retail trade in non-specialized stores with a predominant sale of food, beverages and tobacco); and that large supermarkets and hypermarkets (which have the same field of activity) have their registered office usually in the capitals of the countries where they operate and thus do not appear in these databases (the chosen regions of the two countries do not include the capitals of the countries).
Bearing these limitations of the study in mind, the research can be extended in the future in the following directions: extending the analysis period by at least another 5 years, thus reaching an analysis period of 10 years, which may be more representative; choosing several areas of activity besides trade (e.g., production, services); using several methods and techniques, in terms of descriptive data analysis, factorial analysis, the formation of homogeneous groups and analysis of financial performance (performance appraisal criteria); and constructing a composite index to characterize financial performance (including ROS, ROA and ROE alongside other indicators of liquidity, solvency, financial balance indicators, trade margin, turnover rate, etc.).


