Article

Evacuation Management System for Major Disasters

GIDAI Group, Departamento de Transportes y Tecnología de Proyectos y Procesos, Universidad de Cantabria, Avda. Los Castros, 39005 Santander, Spain
*
Author to whom correspondence should be addressed.
Appl. Sci. 2022, 12(15), 7876; https://doi.org/10.3390/app12157876
Submission received: 11 July 2022 / Revised: 3 August 2022 / Accepted: 4 August 2022 / Published: 5 August 2022

Abstract

:
Predicting and understanding mass evacuations are important factors in disaster management and response. Current modelling approaches are useful for planning but lack of real-time capabilities to help informed decisions as the disaster event evolves. To address this challenge, a real-time Evacuation Management System (EMS) is proposed here, following a stochastic approach and combining classical models of low complexity but high reliability. The EMS computes optimal assembly points and shelters and the related network of evacuation routes using GIS-based traffic, pedestrian and routing models including damaged assets or impassable areas. To test the proper operation performances of the EMS, we conducted a case study for the Gran Canaria wildfire (August 2019—Spain).

1. Introduction

Climate-related disasters have increased ten-fold since 1960 according to IFRC World Disasters Report [1] and ETR Report [2]. According to these reports, in total 9924 disasters have occurred worldwide between 1990 and 2019, increasing the frequency from 39 incidents in 1960 to 396 in 2019, causing, on average, 103,000 deaths per year and decreasing by 42% over the last three decades. This is due to increased predictive capabilities, technological advances, emergency preparedness and response systems where first responder organizations and public authorities play a critical role in preventing and mitigating such unexpected events. They must often make decisions by relying on static procedures, their own experience and intuition since they do not count on the necessary tools (e.g., Situational Awareness Platforms) based on technologies such as Artificial Intelligence (AI), Geographic Information Systems (GIS) and the predictive capabilities of simulation models.
One of the most challenging safety strategies is the evacuation. It involves critical decisions such as whether or not, when, and how to evacuate the population of a given threatened area. Predicting the effects of different evacuation strategies can be crucial information when dealing with an actual disaster. During the last few years, several approaches have been proposed for this endeavour through the characterization of disasters [3,4,5], their evolution [6,7], the management and study of traffic under unusual or critical conditions [8,9,10,11], and mass evacuations [12,13,14,15,16].
In relation to mass evacuations, a very recent and promising solution is the WUI-NITY platform [17]. This tool, which specializes in wildfires, integrates a semi-empirical wildfire model FARSITE and two macroscopic models (traffic and pedestrian) to provide dynamic vulnerability maps as the main output. The selected models were deliberately chosen as empirical/macroscopic models to demonstrate the applicability of the WUI-NITY platform for real-time applications as it needed limited computational resources to run such models.
The main idea behind real-time applications is that the user (decision-maker) can acquire feedback from the model during the previous stages, or even during the event, in order to prevent and identify threats and be able to respond effectively [18]. He/she should also have the possibility to explore the evacuation performance ahead of time including the impact of different responses, resources, and incident scenarios. This requires inputs from the situation to the model, which should run significantly faster than real-time. One of the main problems in developing such models is that they are likely to be less sophisticated and produce limited information due to time constraints. The challenge is to obtain a compromise between run times and providing enough detail in the models (consistent level of granularity) to allow sufficient accuracy. The real-time decision-support systems also require processing the outputs quickly enough (immediate results), and the information provided should be easy to interpret and with a high confidence level [19].
To address this challenge, this paper introduces an EMS, which is a GIS-based evacuation decision-support system developed within the ASSISTANCE project (https://assistance-project.eu/, accessed on 28 July 2022) that has received funding from the European Union’s H2020 research and innovation programme under grant agreement No 832576. The EMS is integrated by different modules following well-studied, traditional approaches in conjunction with a global stochastic approach in order to predict adaptative mass evacuation strategies including features such as assembly points, shelter locations, routing, and pedestrian and vehicular evacuation. Therefore, the main strength of this system lies in the ability to simulate comprehensive evacuation processes in the case of a major disaster by considering simple models that are not usually considered in mass evacuations, which are sufficiently accurate to be able to operate in real time in response stages and to obtain reliable results, unlike classical models that increase the accuracy of the results but require a higher computational load and simulation times, and can only be applied in the planning phases.
These evacuation processes to manage the transit of the displaced population from households or assembly points to shelters using a particular routing evacuation approach is widely studied [9], but in our particular case, after analysing different historical large-scale disasters, we conclude that, in almost all cases, at some stage of the process, this ends up becoming a guided mixed evacuation from assembly points to shelters, in most cases partially assisted. Therefore, disaster relief shelters to provide private and secure short-term stay places for the displaced population have to be modelled. These shelters are not arbitrary selected, but are chosen via three criteria: (1) shelter purpose [20], which in our case will only consider a short-term stay (emergency or temporary shelters), (2) specific facilities and equipment considering applicability, accessibility and safety characteristics [21,22] and (3) spatial location ensuring coverage, familiarity and crowding conditions [23].
Referring to the evacuation routes and the associated pedestrian and vehicular evacuation simulation modules, proposals usually follow different approaches [9], allowing the management of traffic interactions, the enhancement of route flows, and the estimation of the time of the vehicular evacuation stage. Here, we opted for a dynamic traffic-modelling approach for the implementation of the routing and vehicular evacuation considering a discretized Cell Transmission Model (CTM), assuming a relationship between flow and density; see “Conceptual Model” section. For the pedestrian modelling, there are many different approaches [24,25], but a stochastic flow-based approach similar to the previously proposed methodologies [26,27] was followed.

2. Mathematical Model

The particular characteristics of disasters and the factors that shape evacuation evolution have to be considered in order to create appropriate models. In fact, disasters have common attributes that can be mathematically redefined to better understand the proposed models.
  • A disaster is denoted as D i = E i ,   A i where i is the number of active hazards at the same time.
  • E i = e 1 ,   e 2 ,   ,   e j ,   j   . is the set of active evacuations taking place during the disaster D i .
  • A i = a 1 ,   a 2 ,   ,   a k ,   k is the set of damaged assets or impassable areas resulting from the disaster D i .
  • Elements contained in E i and A i are also defined as a set of geographical coordinates e j , a k = ϕ 1 ,   θ 1 ,   ϕ 2 ,   θ 2 ,   ,   ϕ l ,   θ l where l   is the number or coordinates used to define the evacuation/damaged area.
A real-time stochastic approach was used to predict mass evacuations involving two stages: (1) pedestrians respond (or not) and move on foot towards vehicles and (2) the use vehicles (private and/or public vehicles) through the road network. A staged contraflow evacuation strategy was selected as appropriate based on the study conducted by Kaisar et al. [28]. The staged methodology divides the evacuation area into small zones that are sequentially evacuated according to the proximity of the hazard. The contraflow methodology optimizes traffic flow by simultaneously making use of lanes in the same direction (higher speeds and less congestion).

2.1. Evacuation Routing

A route refers to the way taken in getting from a starting point to a destination. Therefore, three main factors are needed to compute the evacuation routes.
Assembly points are the starting points (origins) where pedestrians board the vehicles. To represent assembly points, a hexagonal tiling is used to discretise the evacuation area. Assembly points are the centre of each hexagon C i = C ϕ ,   C θ (Figure 1). The hexagonal cells ensure two fundamental properties: (1) every evacuee in the evacuation area is located at a maximum distance r (circumradius) from any assembly point; (2) the evacuation capacity of the assembly point does not exceed the expected population load in each hexagonal cell. To determine the optimal assembly locations, the external service OpenRouteService (ORS) (https://openrouteservice.org/, accessed on 25 July 2022) can be used as well, in the case of managed evacuation. This service contains a database of places and points of interest that are classified so that they can be filtered according to the intended use.
Destination shelters are defined by geographical coordinates. Shelters refer to places giving emergency/temporary protection to people that fulfil three criteria: shelter purpose, facilities and spatial location. Three principles are required to address the spatial location:
  •   e j E i     S i j = s 1 ,   s 2 ,   ,   s m where S i j . represents all feasible shelters for which the distance to an e j geographical boundary ranges in d ,   d + μ , where d + μ is the maximum distance.
  • S i j is a systematic uniform random (UR) generated on the circumference with radius d , ensuring properly distributed locations.
α 0   UR 0 ,   2 π
α l = α 0 + l T
T = 2 π / m
where m is the total number of shelters (Figure 2).
  • S i j ^ S i j |     s m S i j ,     l n E l A l ,   d D i s t s m , l n d + μ , where the function D i s t s m ,   l n is the minimum distance between a shelter geographical location s m and the damaged asset or alternative evacuation l n geographical boundary (Figure 2).
These principles ensure that the presence of shelters is uniformly distributed within a safe distance. The geographical locations of shelters are slightly modified using ORS to well-known points of interest (Pois) nearby the optimal location (e.g., schools, sport centres, etc.) to fulfil sheltering purposes and facility requirements (e.g., safe location, people capacity). It is true that this adjustment requires precise knowledge of the locations of the different facilities and their current state, as a facility may be damaged during the disaster or may not be equipped with the necessary elements for the reception and accommodation of evacuees. In critical scenarios where none of the locations proposed in this distribution coincides with a possible shelter because it does not exist, it is necessary to deploy a temporary shelter system.
Evacuation routes are achieved using a dedicated routing service from assembly points to destination shelters avoiding A i damaged assets, yielding to an OD matrix of routes. The optimal routes are filtered by prioritizing those with better characteristics (number of lanes, maximum speed limit, route overlapping) and reducing them as much as possible while ensuring two conditions: (1) at least one route starts from every assembly point; (2) the distribution of evacuees is uniform for shelters defined as destinations (Figure 3). The set of routes for a given evacuation e j can be defined as R i = r 1 , r 2 , ,   r n where a particular route is defined by the geographical coordinates r i = ϕ 1 ,   θ 1 , ϕ 2 ,   θ 2 , , ϕ l ,   θ l where the first and last coordinates correspond to both the assembly point and the destination shelter.

2.2. Evacuation Time Estimation

Once the evacuation routes are generated, the next step is simulating the evacuation process (pedestrian + vehicular). As mentioned in the introduction section, the challenge consists of performing real-time simulations while maintaining granularity and accuracy in the models. To address this, we used Monte Carlo simulations to generate representative and significant samples within a short period of time. These real-time simulations also help to explore the results of a current or an expected evacuation strategy, e.g., detecting in advance the potential conflicts between routes (e.g., congestions) and whether the distribution of shelters and assembly points is appropriate.
Pedestrian model calculates the movement times of individuals from their starting locations (e.g., households) to the assembly points. Each pedestrian ( p ) is modelled using three random variables: (1) initial geographic location ( l p ), (2) pre-evacuation time ( t p r e p ) and (3) walking speed ( v p ). These variables are assigned according to the distributions (Table 1) that have been widely studied in the literature [29,30,31].
Hence the movement time for each pedestrian t r p is calculated as follows:
t r p = t p r e p + min i D i s t l p , C i v p
where the function D i s t l p , C i is the distance between the starting location of the evacuee and the assembly point C i . The default population distribution is taken from WorldPop (https://www.worldpop.org/, accessed on 25 July 2022), which contains project data that use both the integration of census data and aerial imagery via satellite in which people counts and density are provided with a resolution of 100 m2.
Vehicular model calculates for each route R i the traffic density, average speed and number of evacuated people as a function of time. This model uses the pedestrian movement times, vehicles occupancy, boarding time and vehicle expected distribution as random inputs to simulate, via cellular automata, the current traffic status of the routes and the simulated vehicles they contain by following a microscopic modelling approach [32]. The calculated routes by the previous model are split into road sections with common characteristics. Road sections are produced by solving the graph problem, erasing duplicated instances that are used by more than one route at the same time, and calculating the vehicle interactions emanating from different routes that converge in the same road section and the distribution of vehicles when a road section is divided (Figure 4).
The interaction between vehicles in the same road section is produced by three factors: (1) traffic density k (current), k c (critical) and k j (jam); (2) average speed u ,   u c and u j ; and (3) route maximum density k m a x . These variables follow a particular function that was previously studied in [33].
u = u c u c u j ln min k , k m a x k c ln k j k c
Bearing in mind this relationship, two important constraints have to be addressed. First, the lane-changing problem in our particular case is solved using a random factor to increase or decrease the vehicle’s current speed, allowing passing between vehicles when the road conditions are favourable. Second, the gap acceptance is another factor to restrict the number of vehicles in a stretch by solving the intersection problems when the road capacity is exceeded. This problem was solved by considering a queue of vehicles with time priority until it exceeds the road capacity moment in which the current status of other vehicles in the queue is preserved, thereby emulating a traffic jam. Although this approach is quite simple, it allows the fundamental interaction dynamics to be captured when managing an evacuation in the vehicular phase, and can be used in a stochastic way by performing multiple iterations that contemplate many of the possible scenarios within the evacuation process. At the same time, the advantage is that its simplicity means that it does not require a large computational load, which allows simulations to be carried out in real time.

3. EMS Platform

The EMS was developed using the Microsoft .NET Framework 4.6.1 where models and algorithms are represented in several classes. A set of libraries (ESRI ArcGIS, RestSharp and BruTile) were also used for the Graphical User Interface and other components that are focused on the interaction with external service interfaces. The EMS architecture follows a client–server approach with the GUI on the client side and other modules operating on the server side, providing an API REST interface that is able to integrate data from external services, which provides damage asset identification and also integrates the provided results into other legacy systems (Figure 5). The EMS comprises the following components:
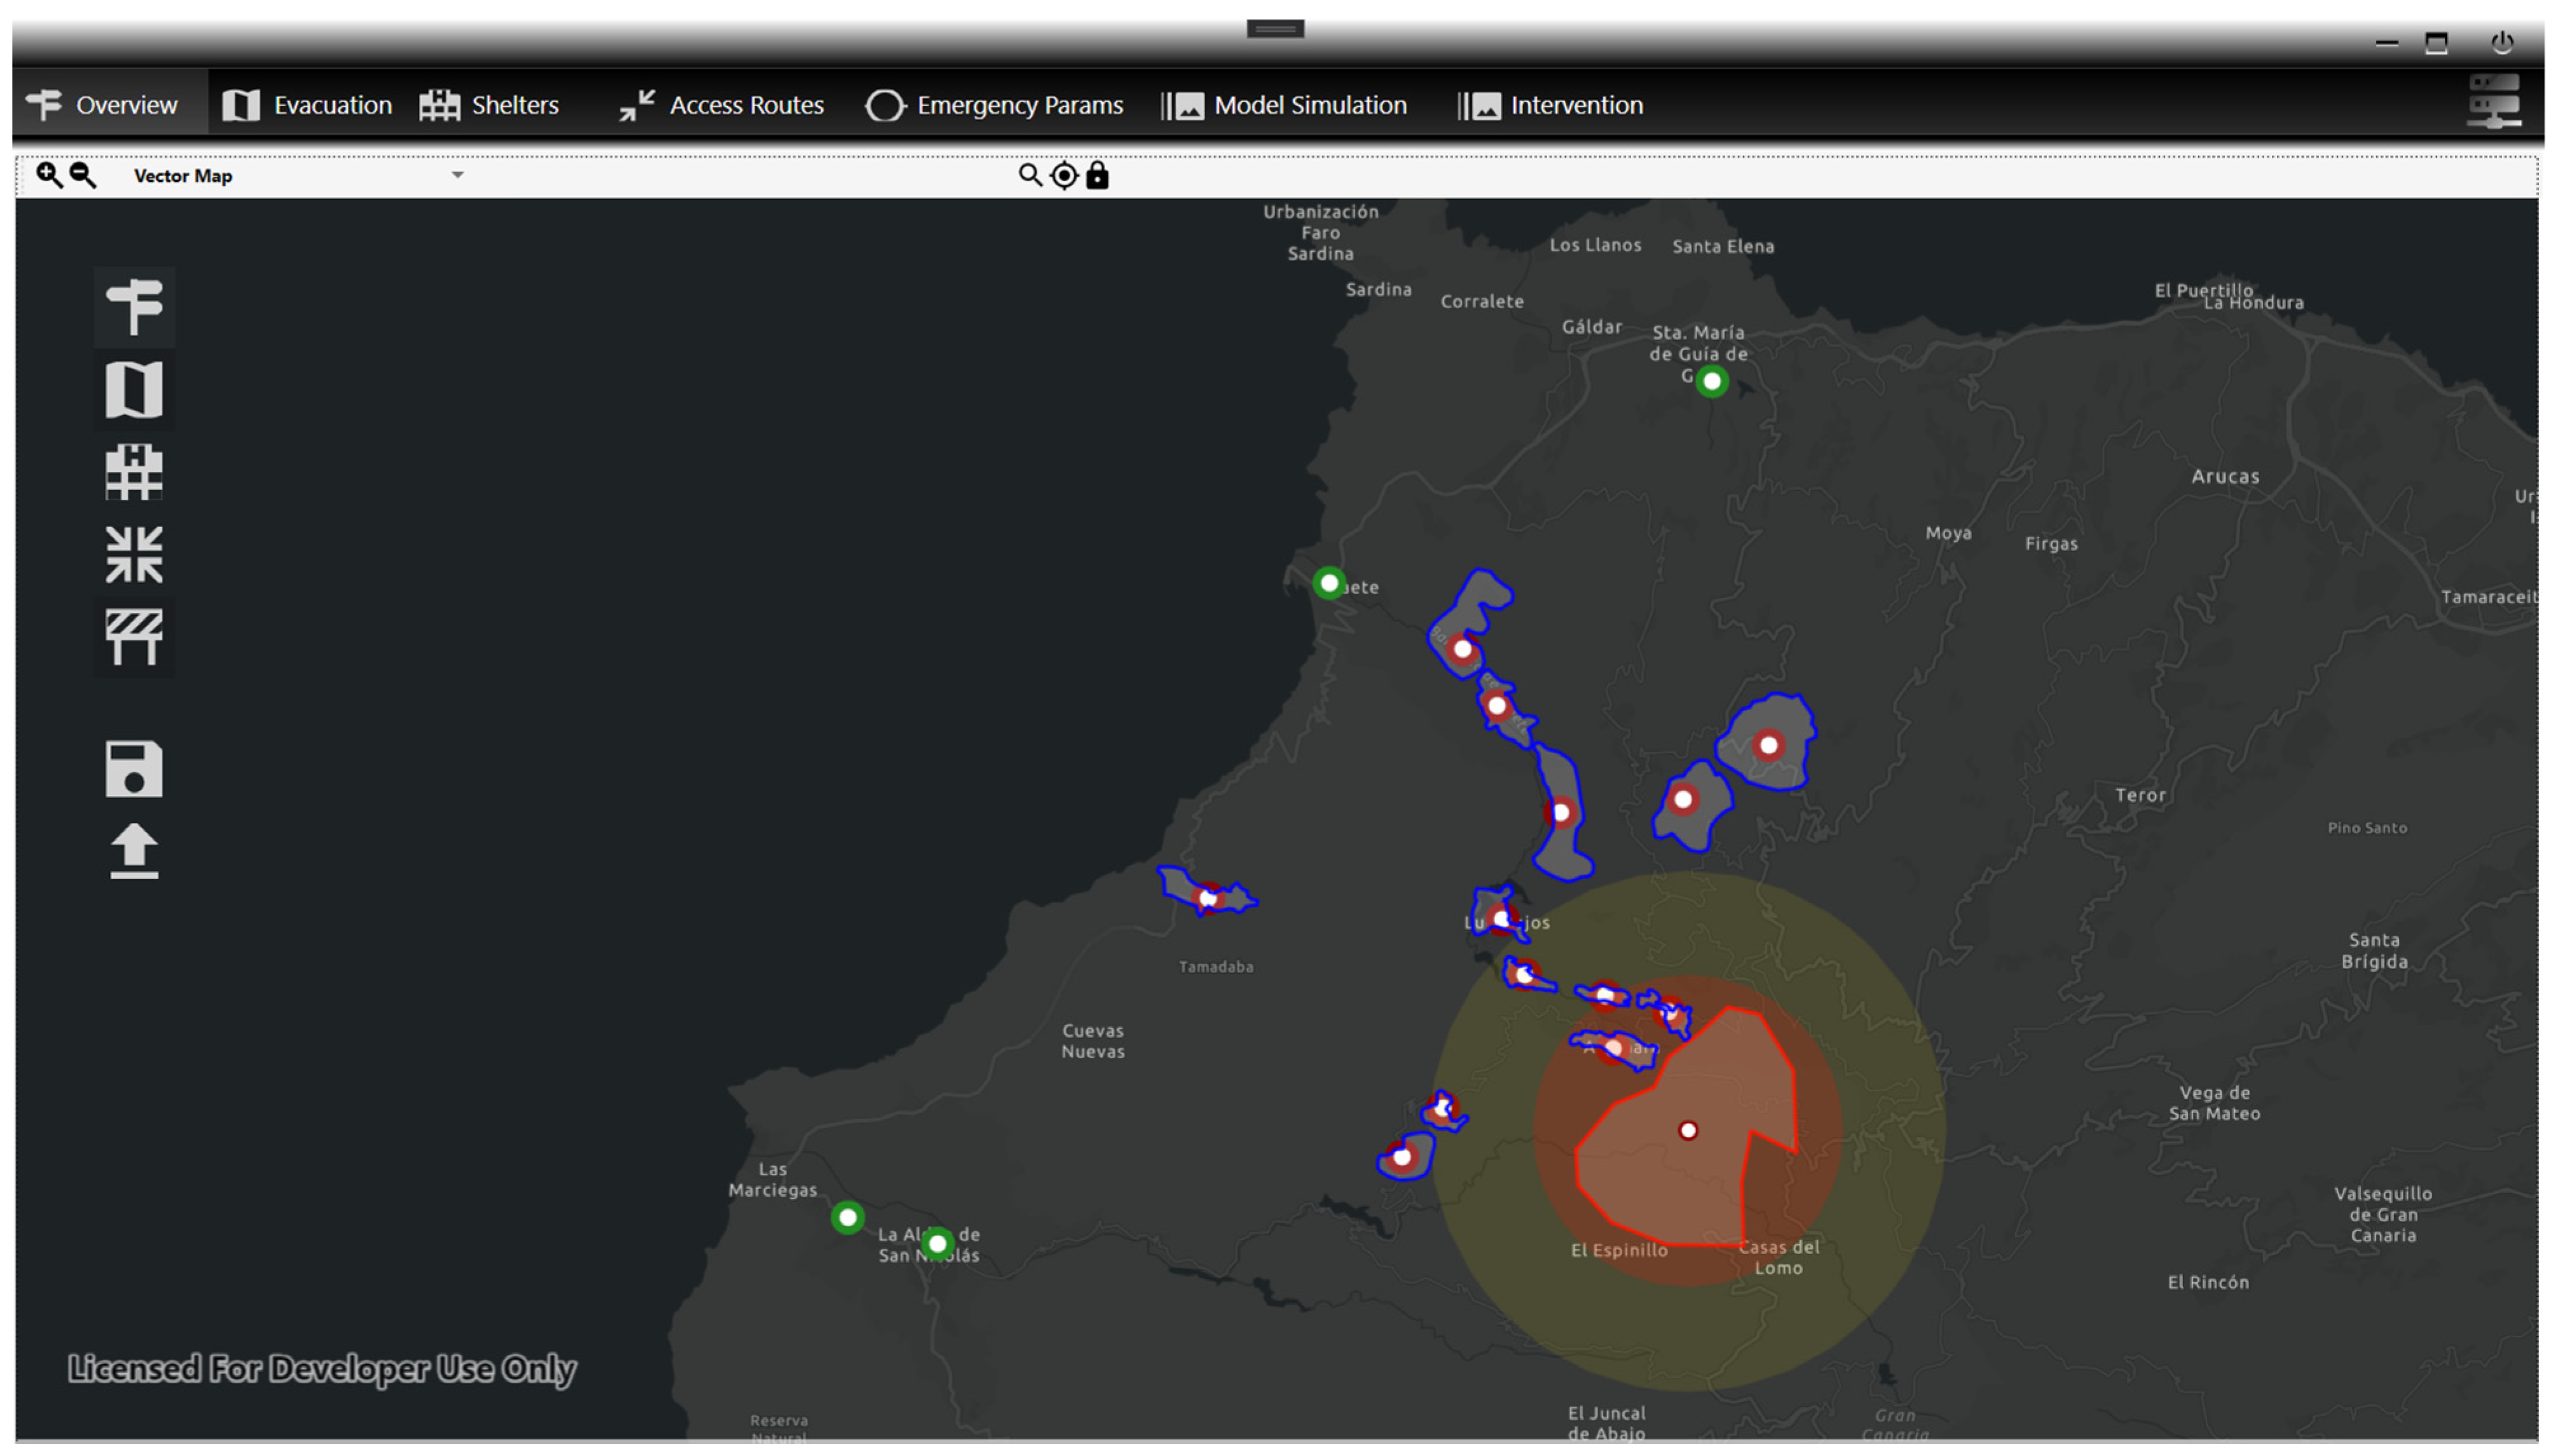
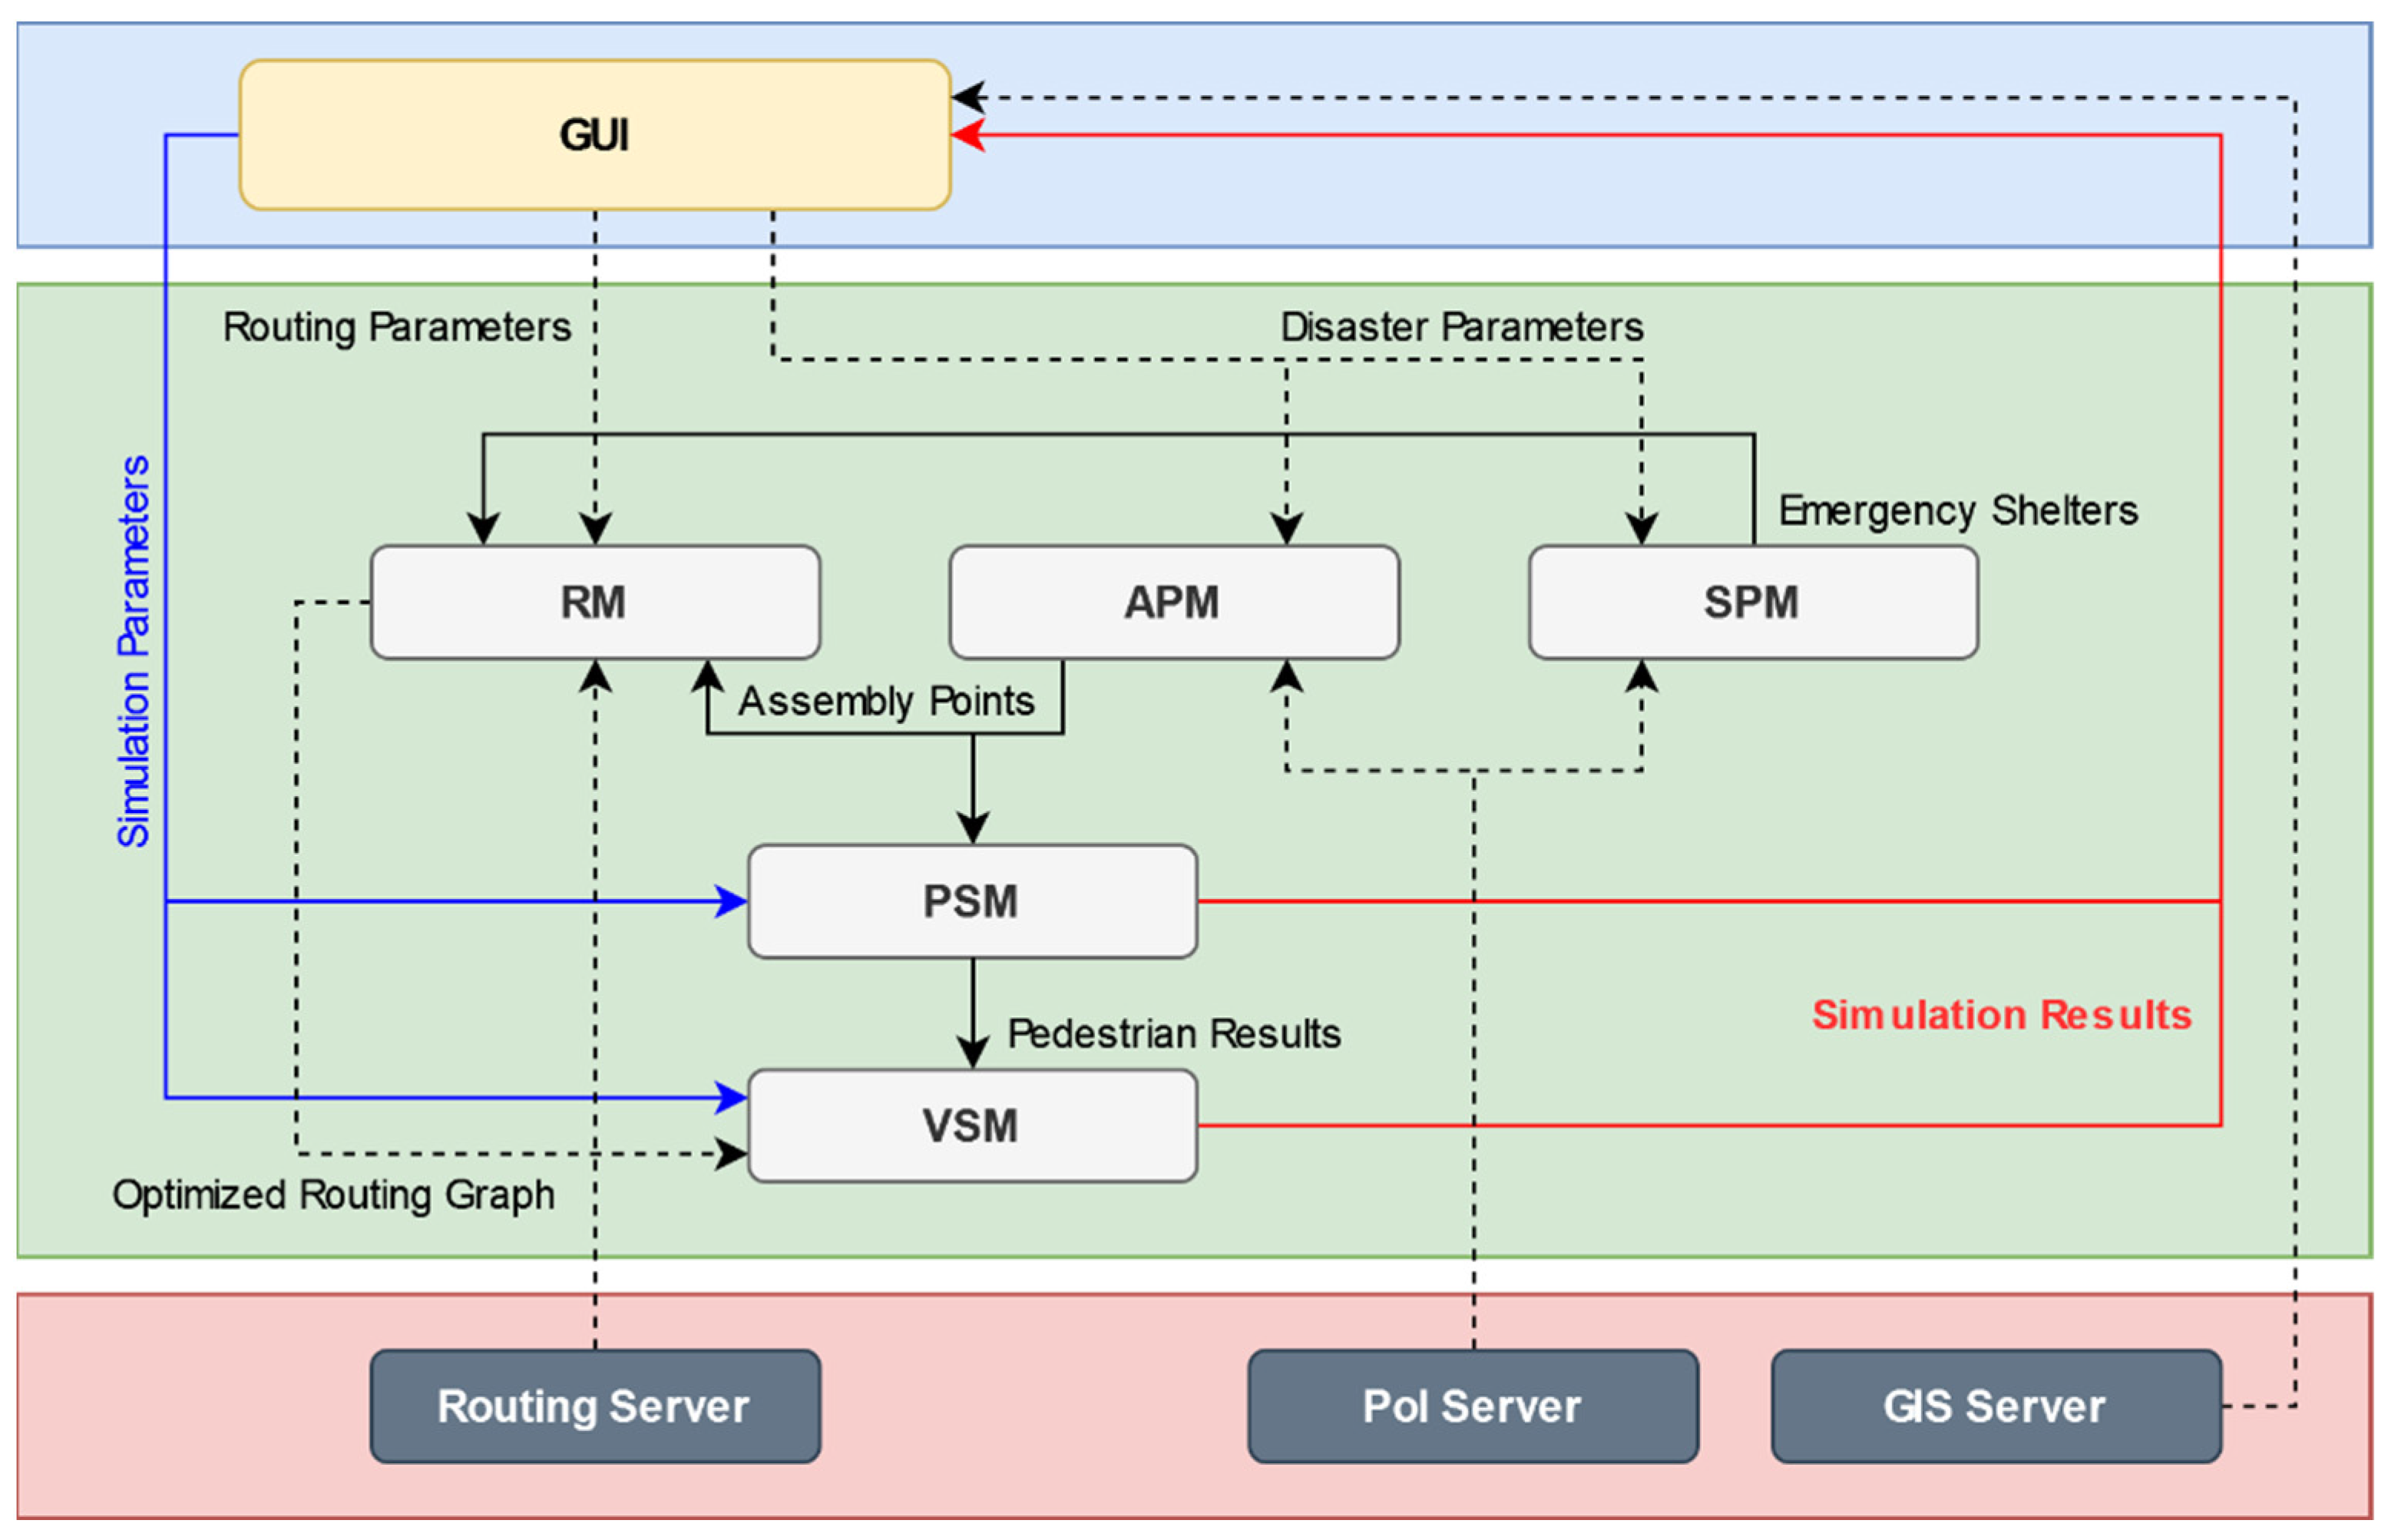
  • Graphical User Interface (GUI): It allows the user/operator to manage the active evacuations via the Geographical Information System (GIS), providing an intuitive and visual interface that shows the real-time status of the evacuation process. The user/operator can modify/update the situation and re-simulate the evacuation to explore alternative strategies.
  • Assembly Points Model (APM): This model processes the GIS information of the selected evacuation area (e.g., neighbourhood, urban area, village, town, etc.) and generates a set of assembly points by considering the population distribution, the points of interest/reference within the evacuation area, and the distances pedestrians are likely to cover by foot [23].
  • Shelter Points Model (SPM): This model takes active evacuations as the input, damaged assets, and the spatiotemporal evolution of the hazard (e.g., toxic plumes) to provide a set of feasible shelters located at the required distance, far from dangerous areas. It should be noted that the user/operator can assign other shelters as destination points of the evacuation.
  • Routing Model (RM): This model uses a local dedicated service to provide a routing plan by ensuring a uniform allocation of evacuees in the shelters. In addition, this model deals with the likely interactions between routes (i.e., road section used by more than a route or distribution of vehicles in an intersection).
  • Pedestrian Simulation Model (PSM): This model simulates both the decision to respond and the movement on foot of pedestrians at the local/individual level. The main output is the number of individuals entering the vehicular model over time at a given assembly point.
  • Vehicular Simulation Model (VSM): This model simulates the vehicular stage in the evacuation process in order to obtain estimated route parameters (i.e., traffic density or average speed) and the number of vehicles/individuals evacuated to a given shelter over time.

4. Case Study

This section describes a case study where the EMS was applied to test the following requirements:
Req. 1: The system proposes reasonable and realistic assembly points and shelters, and the routing algorithm provides optimal routes for evacuation purposes.
Req. 2: The pedestrian and vehicular evacuation models provide reliable predictions modelling vehicular and pedestrian behaviours and interactions.
Req. 3: The system operates successfully for multiple evacuation areas and large-scale evacuations at the same time.

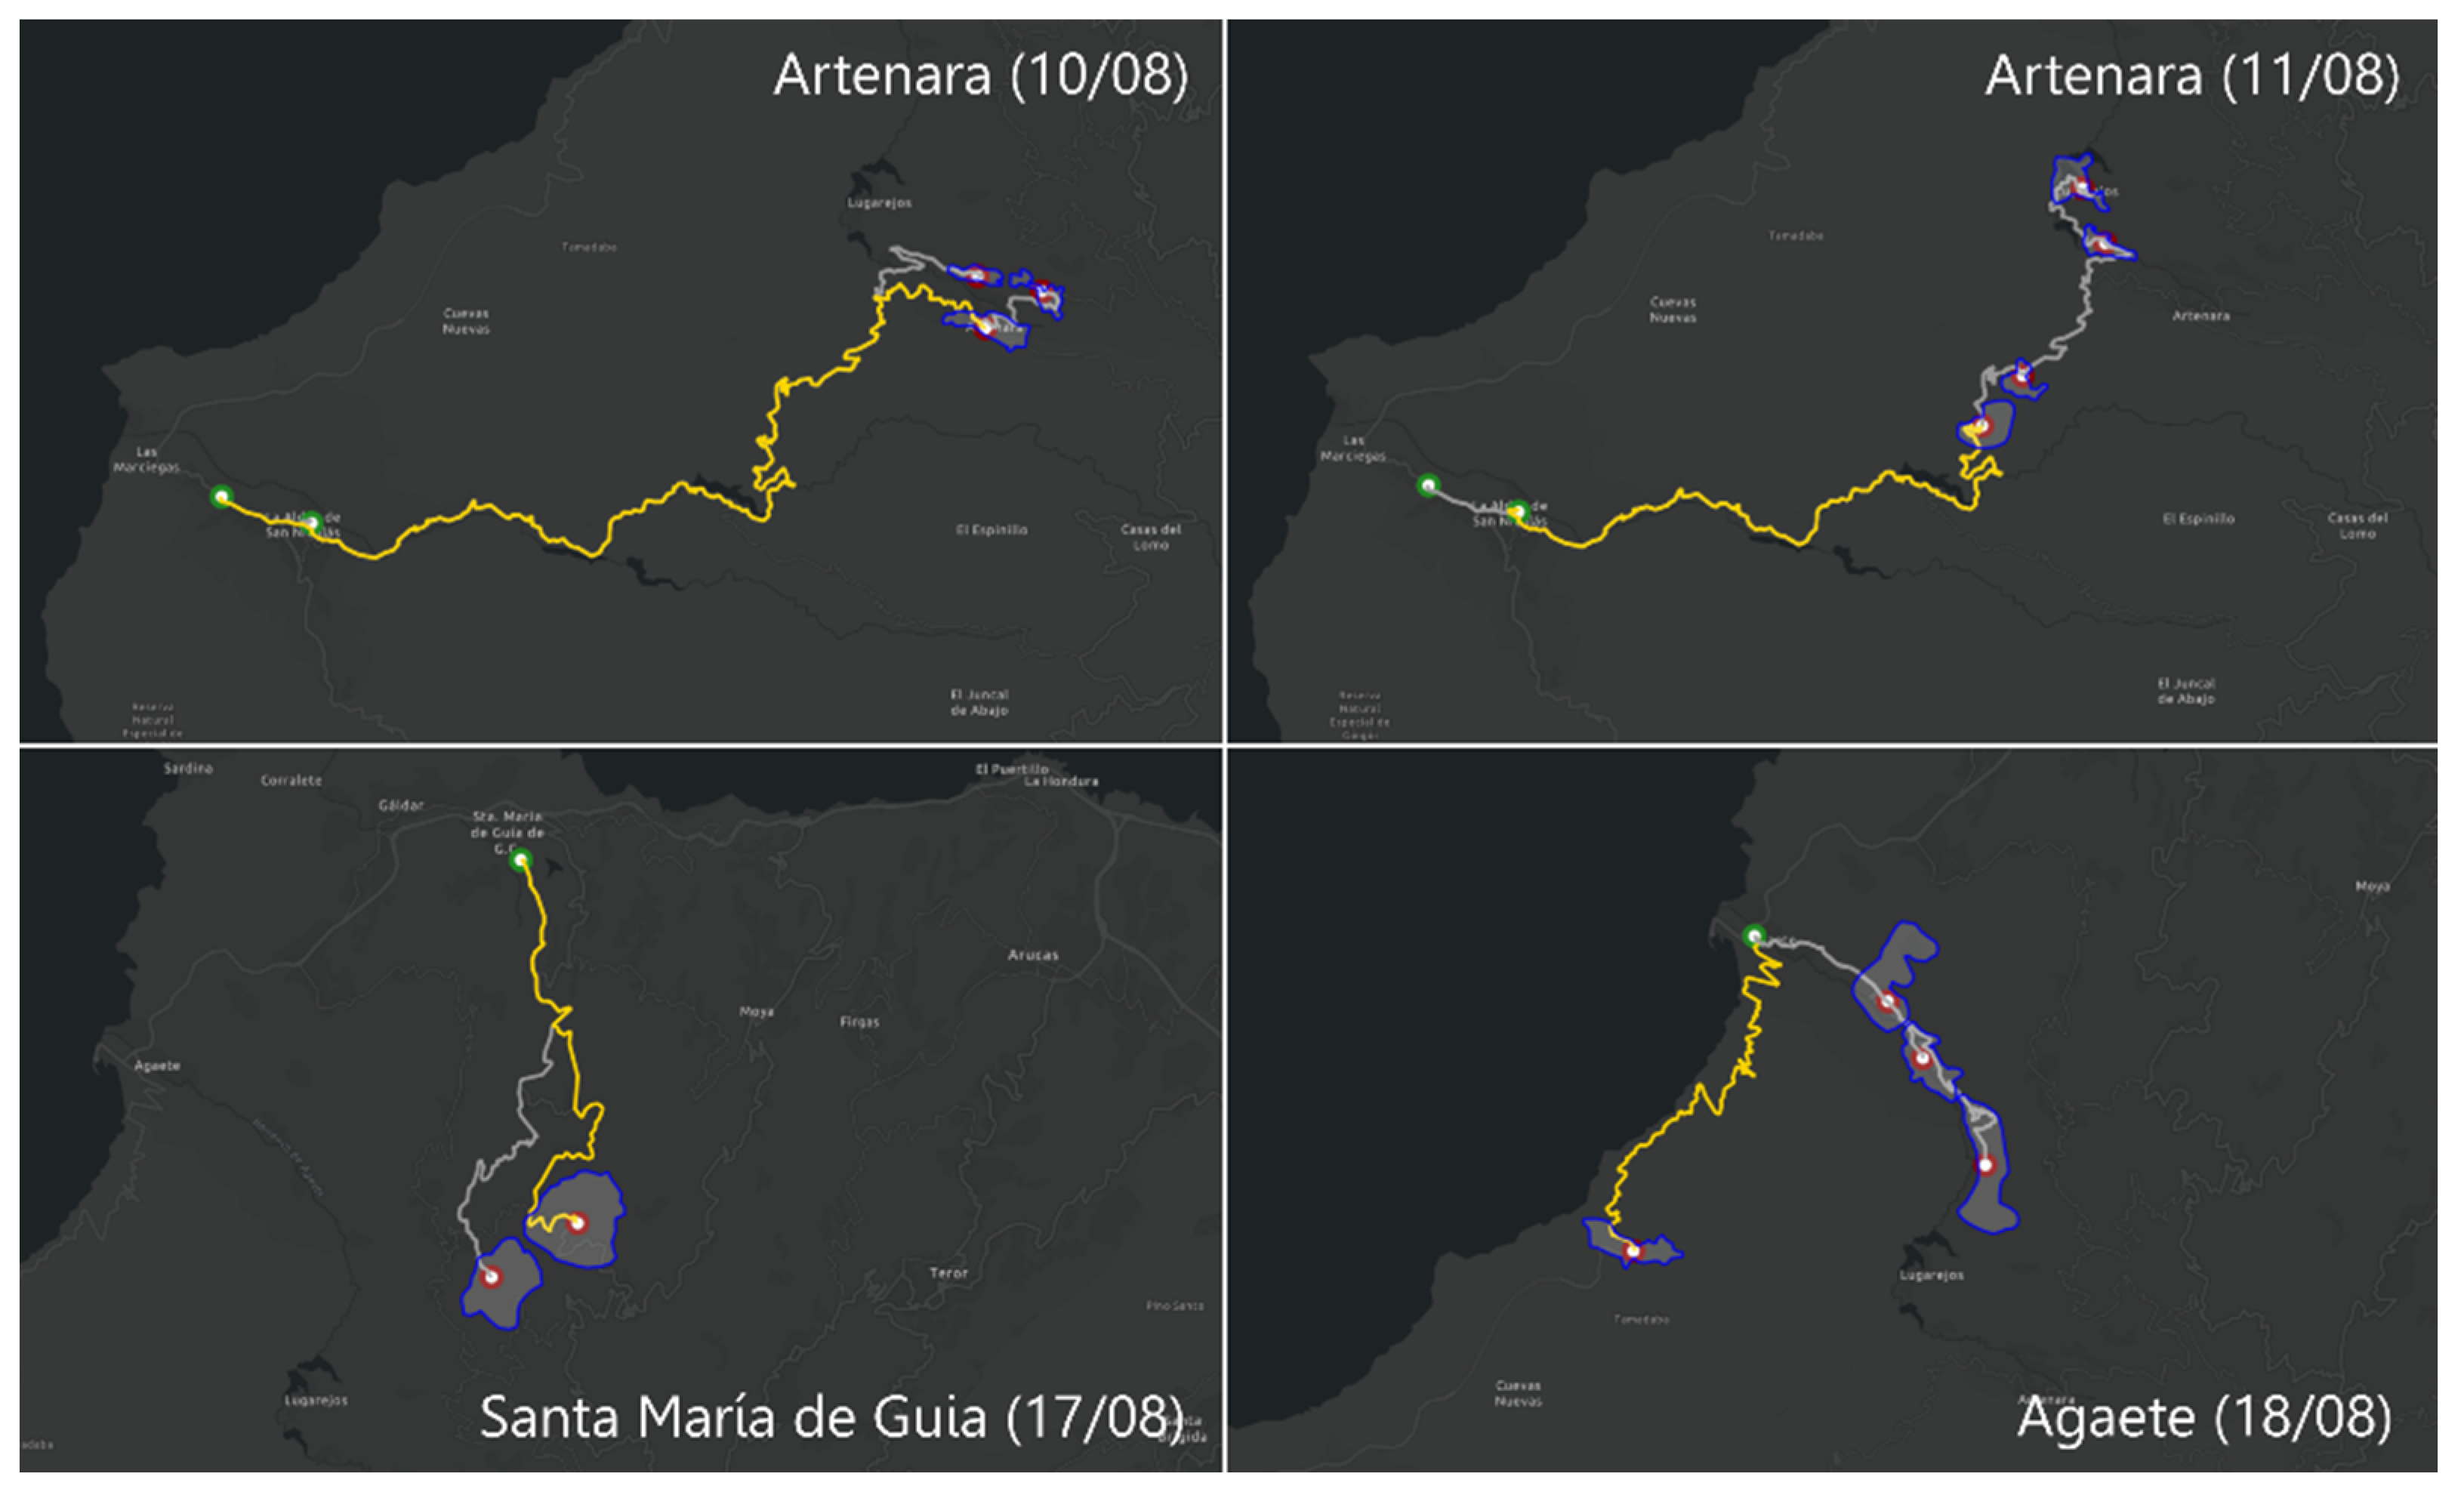
4.1. Gran Canaria Wildland-Urban Interface Evacuation
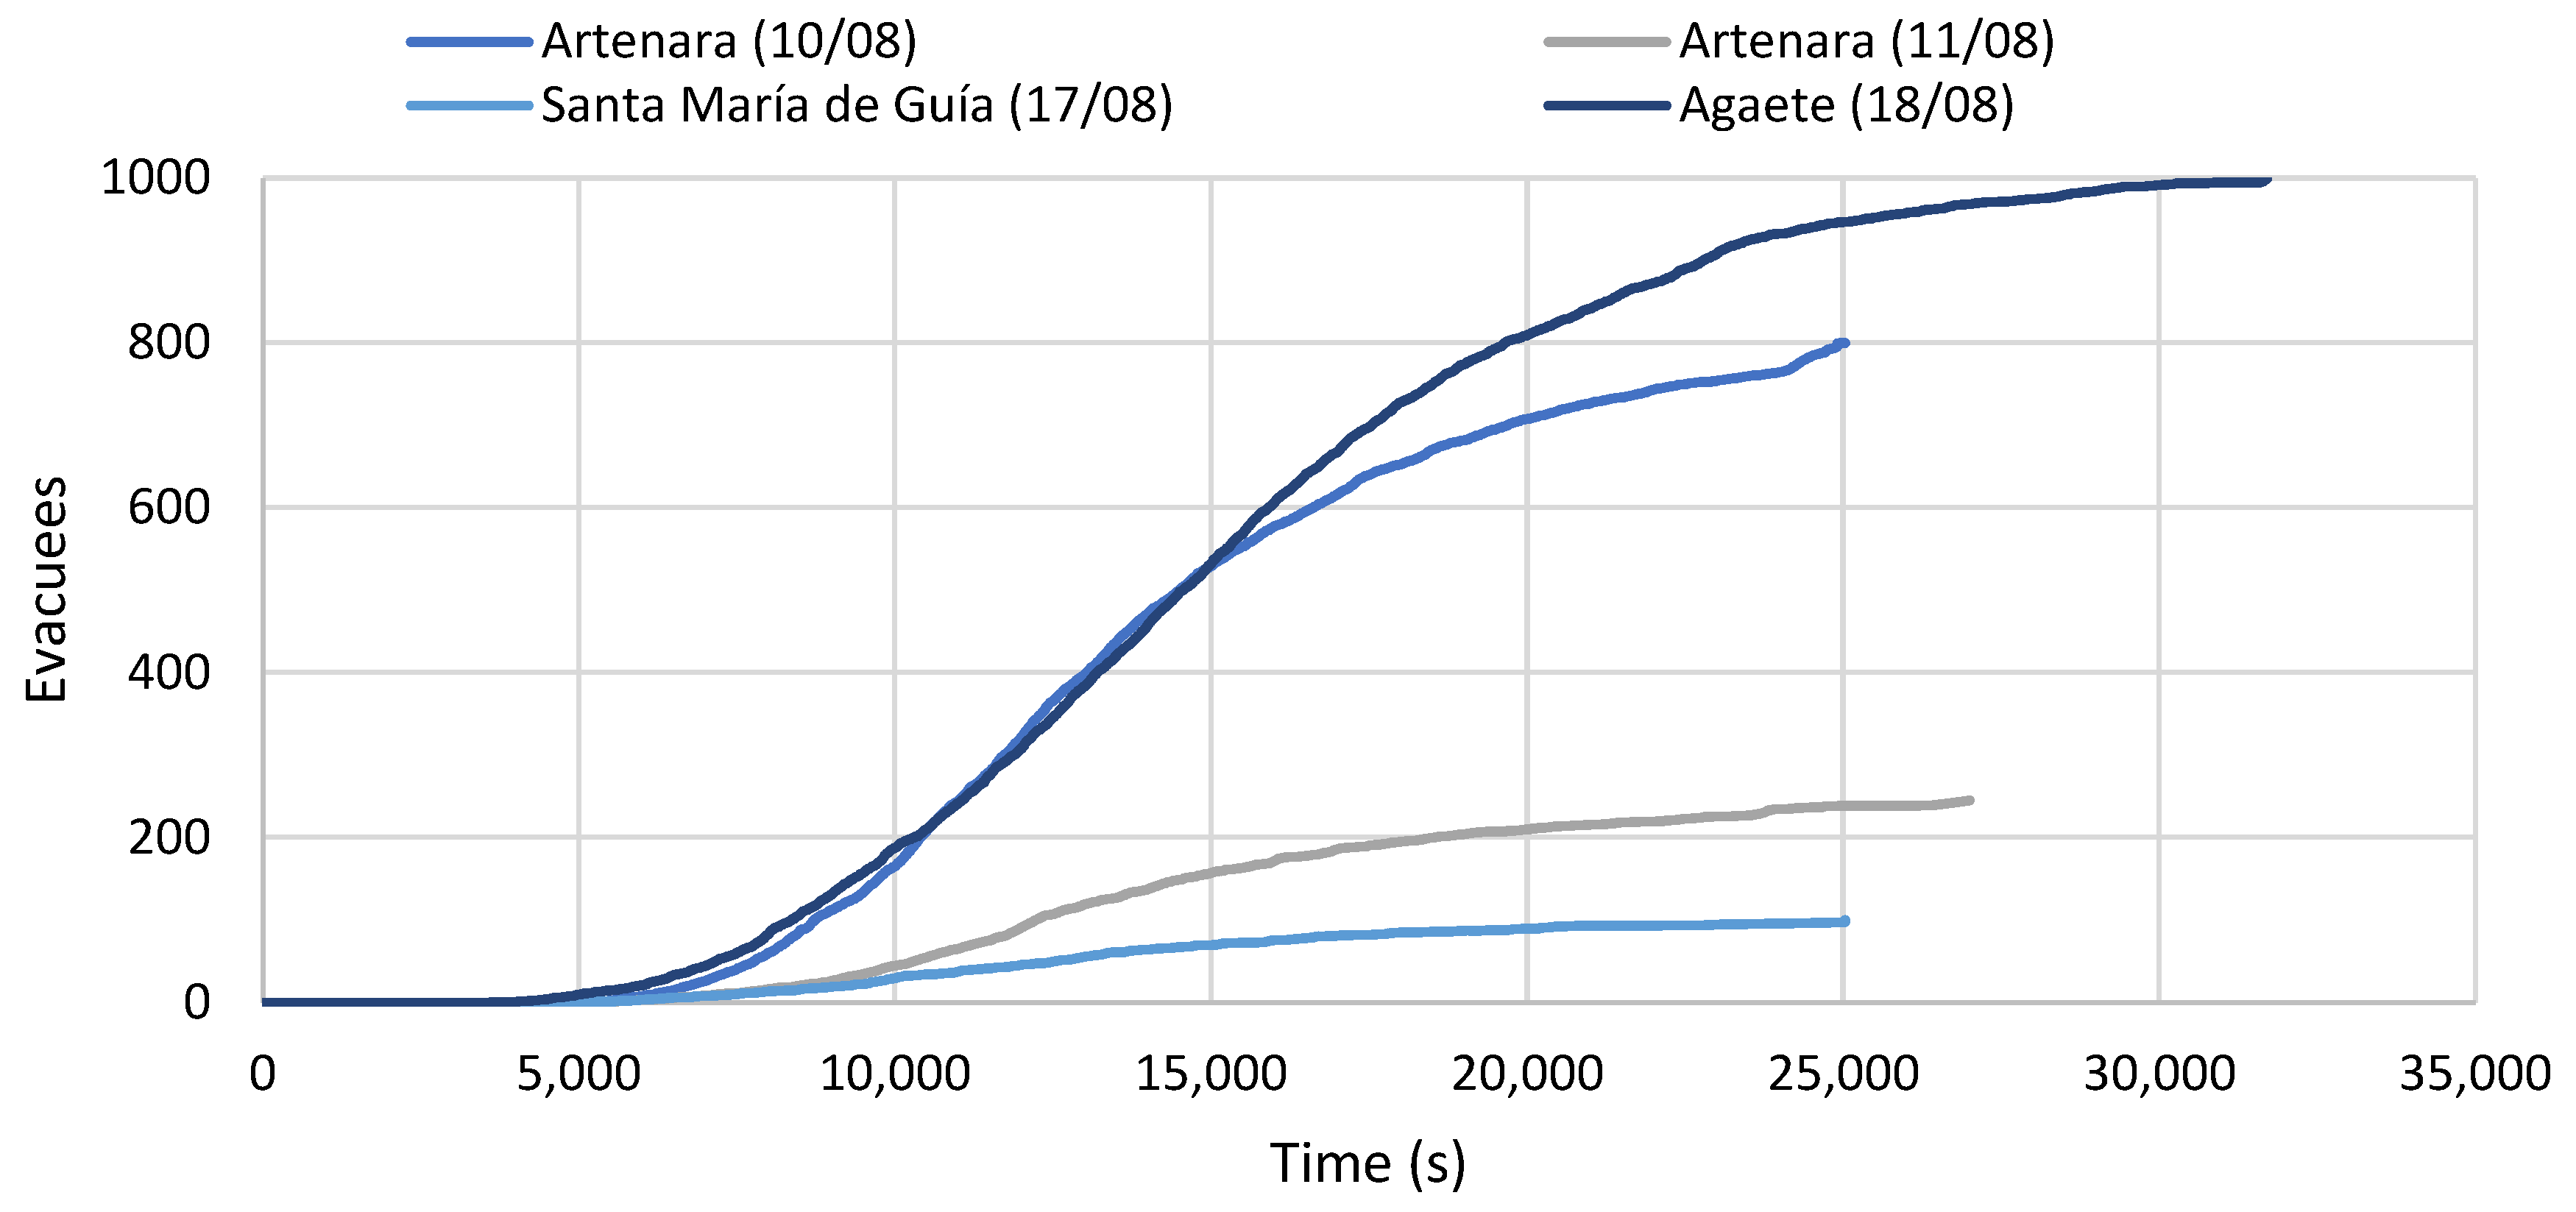
The Gran Canaria wildfire (August 2019—Spain) was used as an example of application for the EMS. The first forest fire started in Artenara and two more wildfires broke out around the towns of Cazadores and Valleseco spreading over 6000 hectares in the western part of the island, reaching several villages and the Tamadaba Natural Park (Figure 6). In total, 700 firefighters and 16 aircrafts were deployed and the disaster lasted 15 days until the fire was declared to be completely extinguished [34].
The wildfire forced the evacuation of 9000 residents from eight different municipalities [35]. In our particular case study, we only considered the three most populated municipalities involving 13 urban areas and 4 sequential evacuations (Table 2). The evacuation strategy carried out for these municipalities was mixed (pedestrian and vehicular evacuation) with the assistance of first responders. For each of these evacuations, a shelter location was defined to accommodate the displaced population from each municipality.
Unfortunately, the information of the evacuation times was not registered. To test the performance of the EMS in terms of simulation times, the four use cases belonging to the Gran Canaria case study were used. The number of routes, assembly points, shelters, number of evacuees and the number of interactions between road sections vary, allowing the identification of the critical variables that affect the performance of the system.

4.2. Results

All of the requirements tested were satisfactorily verified. Firstly, the third requirement was achieved as the EMS was able to simultaneously manage the evacuation of the 13 reported urban areas (Figure 6 and Figure 7). Similarly, in the second requirement, the shelters and meeting points complied with the requirements proposed in the conceptual model, although they differed slightly from the reality of the use case that was used due to the random nature of the calculations, and an example of a particular urban area is shown in Figure 7. This is because the expert judgement or field decisions made by first responders may be influenced by additional information beyond the suitability of the shelter or its location.
The verification of the first requirement was completely satisfactory as it was able to calculate the independent evacuation routes, avoiding damaged assets and impassable burned areas for each of the cases where it was applied; see Figure 7. Finally, the correct estimation of the evacuation times for both pedestrian and vehicular evacuation was also verified with satisfactory results, representing the behaviours captured in the previously detailed models; see Figure 8. These curves show that at the beginning of all the evacuations there is a pre-evacuation period where the evacuees are carrying out actions of decision, packing or family grouping. These behaviours do not disagree with similar studies [36]. The curves also represent that a large number of evacuees are continuously arriving, indicating a possible mass departure or traffic jams, and that only a few reach the last one, represented by the last flat parts of the curve.
Furthermore, as can be seen in Table 3, the performance results reveal certain guidelines to be considered when using the system. The main one is that it must be understood that the most important effect on the simulation time is exhibited by the number of evacuees to be simulated and the number of interactions between road sections within the stochastic process, which, as can be seen in the results, have a linear influence. The results also reveal that the number of routes does not have a significant influence on the simulation times, and it can only be seen that the greater the number of routes per assembly point, the more evacuees that are distributed along the different routes, and the more the simulation time decreases. The main reason for the notable increase in simulation times is due to the fact that the vehicular model is critical, which, being agent-based, is completely dependent on the number of interactions between agents on the same road section, and as the number of agents and interactions increases, the number of calculations to solve their interactions increases, so simulation times are longer. It should be clarified with regard to the “Agaete” performance results shown in Table 3 that the simulation time is so short because more than half of the evacuees in this evacuation came from “El Risco” with a direct route to the shelter, so there would be no interaction between routes, significantly reducing the number of agents interacting on the remaining routes.

5. Discussion & Conclusions

Almost all regions, local governments, first responders and international organisations are prepared for the most common disasters through emergency response, response and resilience plans. In designing these plans, there are a multitude of tools and expert studies that allow the deployment of both temporary and permanent shelters, assembly points and evacuation and intervention strategies [37]. However, the problem arises when the disaster occurs, and the planning phase transitions to the response phase. At that point, the initial static plans are used as far as the actual situation allows, and that is where the intuition and experience of the first responders comes into play. Therefore, it is crucial that real-time decision-support systems can assist in these decisions, reducing workloads and stressful situations. However, these decision-support systems require a trade-off between performance and simulation times in the event of a disaster [38].
Hence, in this paper an Evacuation Management System was presented and tested with a use case. Related to this purpose, the exploration and understanding of major disasters was carried out to develop models according to the evolution of the disasters. The proposed system integrates different traditional, well-known models to address a full evacuation strategy based on a mixed evacuation approach, thereby reducing the computational load by applying a stochastic methodology that is able to operate in real time. The system was applied to a particular case study (Gran Canaria wildfire) involving multiple simultaneous evacuations and a main damaged area. This case study was used to verify the proper operation of the system, testing all the individual models.
The presented system is significant in at least three major respects. First, the system is supported by ultrafast evacuation calculations and real-time decision support to provide optimal evacuation strategies, in contrast to the models designed for planning [17,39] that require a greater computational load. Second, the system allows comprehensive planning of mass evacuations, including evacuation routes that avoid damaged assets, optimal locations of shelters and assembly points, and relevant decision-making information related to intervention times. This approach departs from the traditional thought where pedestrian evacuation, sheltering strategies or vehicle modelling of unusual or critical situations is analysed in isolation [40]. Third, the underlying models that are used by the system were validated both within this development through the use case and previously by other studies as seen in the introduction, thus giving an acceptable credibility to the results provided by the tool.
Nevertheless, readers should keep in mind the practical limitations of the proposed system. This system is limited by the selected evacuation strategy, as the hypothesis does not allow the provision of only vehicular or pedestrian evacuations. This system also has purely technical limitations as it relies on external services that maintain updated information to a greater or lesser extent (e.g., road status information, mapping, or Pois definition), which has a direct impact on the models. This impact can be seen, for example, in the suggestion of shelter locations where outdated data may mean that a facility may not be eligible for sheltering purposes because it is damaged or does not fulfil the appropriate requirements. This is why this tool is considered a decision-support system and always requires an operator to ultimately make sense of and accept the proposed results based on different sources of information [38].

Author Contributions

Conceptualization, D.A., A.C. and J.G.-V.; methodology, J.G.-V. and A.C.; software, J.G.-V.; validation, A.B. and J.G.-V.; formal analysis, J.G.-V.; investigation, J.G.-V. and A.C.; resources, A.B. and J.G.-V.; data curation, A.B. and J.G.-V.; writing—original draft preparation, J.G.-V.; writing—review and editing, J.G.-V., A.C., D.A. and A.B.; visualization, J.G.-V.; supervision, D.A.; project administration, D.A.; funding acquisition, D.A. All authors have read and agreed to the published version of the manuscript.

Funding

This research and APC was funded by the European Union’s H2020 research and innovation programme under grant agreement No. 832576 (ASSISTANCE project).

Data Availability Statement

No new data were created or analyzed in this study. Data sharing is not applicable to this article.

Acknowledgments

EMS has been developed within the ASSISTANCE project (https://assistance-project.eu/, accessed on 28 July 2022) which has received funding from the European Union’s H2020 research and innovation programme under grant agreement No 832576.

Conflicts of Interest

The authors declare no conflict of interest.

References

  1. IFRC. World Disasters Report 2020; IFRC: New Delhi, India, 2020. [Google Scholar]
  2. ETR. Ecological Threat Register Report of 2020; Institute for Economics & Peace: Sydney, Australia, 2020. [Google Scholar]
  3. Alexander, D. Natural Disasters; Routledge: London, UK, 2018. [Google Scholar]
  4. Bryant, E. Natural Hazards; Routledge: London, UK, 2004. [Google Scholar]
  5. Montz, B.E.; Tobin, G.A.; Hagelman, R.R. Natural Hazards: Explanation and Integration; Guilford Publications: New York, NY, USA, 2017. [Google Scholar]
  6. Liu, Q.; Qin, Y.; Li, G.; Liu, Z.; Cheng, D.; Zhao, Y. Real-time simulation of large-scale floods. IOP Conf. Ser. Earth Environ. Sci. 2016, 39, 012050. [Google Scholar] [CrossRef] [Green Version]
  7. Huang, Q.; Razi, A.; Afghah, F.; Fule, P. Wildfire spread modeling with aerial image processing. In Proceedings of the 2020 IEEE 21st International Symposium on “A World of Wireless, Mobile and Multimedia Networks” (WoWMoM), Virtual Conference, August 31–3 September 2020; pp. 335–340. [Google Scholar]
  8. Gude, V.; Corns, S.; Dagli, C.; Long, S. Agent Based Modeling for Flood Inundation Mapping and Rerouting. Procedia Comput. Sci. 2020, 168, 170–176. [Google Scholar] [CrossRef]
  9. Bayram, V. Optimization models for large scale network evacuation planning and management: A literature review. Surv. Oper. Res. Manag. Sci. 2016, 21, 63–84. [Google Scholar] [CrossRef]
  10. Hardy, M.; Wunderlich, K. Evacuation Management Operations (EMO) Modeling Assessment; Research and Innovative Technology Administration, ITS Joint Program Office: Washington, DC, USA, 2007. [Google Scholar]
  11. Moriarty, K.D.; Ni, D.; Collura, J. Modeling traffic flow under emergency evacuation situations: Current practice and future directions. In Proceedings of the Transportation Research Board 2007 Annual Meeting, Washington, DC, USA, 21–25 January 2007. [Google Scholar]
  12. Ronchi, E.; Gwynne, S.M.; Rein, G.; Wadhwani, R.; Intini, P.; Bergstedt, A. e-Sanctuary: Open Multi-Physics Framework for Modelling Wildfire Urban Evacuation; Fire Protection Research Foundation Quincy: Quincy, MA, USA, 2017. [Google Scholar]
  13. Hardy, M.; Wunderlich, K.; Bunch, J. Structuring Modeling and Simulation Analysis for Evacuation Planning and Operations; Intelligent Transportation Systems Joint Program Office: Washington, DC, USA, 2009. [Google Scholar]
  14. Bergstedt, A. A review of traffic models for wildland-urban interface wildfire evacuation. In LUTVDG/TVBB; Lund University: Lund, Sweden, 2018. [Google Scholar]
  15. Rossetti, M.D.; Ni, Q. Simulating large-scale evacuation scenarios in commercial shopping districts-methodologies and case study. In Proceedings of the 2010 Winter Simulation Conference, Baltimore, MD, USA, 5–8 December 2010; pp. 3494–3505. [Google Scholar]
  16. Zhan, F.B.; Chen, X. Agent-based modeling and evacuation planning. In Geospatial Technologies and Homeland Security; Springer: Berlin/Heidelberg, Germany, 2008; pp. 189–208. [Google Scholar]
  17. Ronchi, E.; Wahlqvist, J.; Gwynne, S.; Kinateder, M.; Benichou, N.; Ma, C.; Rein, G.; Mitchell, H.; Kimball, A. WUI-NITY: A Platform for the Simulation of Wildland-Urban Interface Fire Evacuation; Fire Protection Research Foundation: Quincy, MA, USA, 2020; p. 80. [Google Scholar]
  18. Zhou, L.; Wu, X.; Xu, Z.; Fujita, H. Emergency decision making for natural disasters: An overview. Int. J. Disaster Risk Reduct. 2018, 27, 567–576. [Google Scholar] [CrossRef]
  19. Wallace, W.A.; de Balogh, F. Decision support systems for disaster management. Public Adm. Rev. 1985, 45, 134–146. [Google Scholar] [CrossRef]
  20. Bashawri, A.; Garrity, S.; Moodley, K. An overview of the design of disaster relief shelters. Procedia Econ. Financ. 2014, 18, 924–931. [Google Scholar] [CrossRef] [Green Version]
  21. Shelter-Centre. Transitional Shelter Guidelines; International Organization for Migration: New York, NY, USA, 2012. [Google Scholar]
  22. Huang, Y.; Yin, Z.; Chu, H. Suitability Assessment of Emergency Shelters Based on GIS: A Case Study in Urban Function Optimization Area of Shanghai. IOP Conf. Ser. Earth Environ. Sci. 2019, 234, 1–7. [Google Scholar] [CrossRef]
  23. Boonmee, C.; Arimura, M.; Asada, T. Facility location optimization model for emergency humanitarian logistics. Int. J. Disaster Risk Reduct. 2017, 24, 485–498. [Google Scholar] [CrossRef]
  24. Dong, H.; Zhou, M.; Wang, Q.; Yang, X.; Wang, F.-Y. State-of-the-art pedestrian and evacuation dynamics. IEEE Trans. Intell. Transp. Syst. 2019, 21, 1849–1866. [Google Scholar] [CrossRef]
  25. Kouskoulis, G.; Antoniou, C. Systematic review of pedestrian simulation models with a focus on emergency situations. Transp. Res. Rec. 2017, 2604, 111–119. [Google Scholar] [CrossRef]
  26. Capote, J.A.; Alvear, D.; Abreu, O.; Cuesta, A.; Alonso, V. A stochastic approach for simulating human behaviour during evacuation process in passenger trains. Fire Technol. 2012, 48, 911–925. [Google Scholar] [CrossRef]
  27. Alvear, D.; Abreu, O.; Cuesta, A.; Alonso, V. A new method for assessing the application of deterministic or stochastic modelling approach in evacuation scenarios. Fire Saf. J. 2014, 65, 11–18. [Google Scholar] [CrossRef]
  28. Kaisar, E.; Parr, S. Traffic Simulation Modeling for an Urban Chemical Disaster: Emergency Evacuation Development and Case Study. Lat. Am. Caribb. J. Eng. Educ. 2012, 6, 10–17. [Google Scholar]
  29. Chandra, S.; Bharti, A.K. Speed distribution curves for pedestrians during walking and crossing. Procedia-Soc. Behav. Sci. 2013, 104, 660–667. [Google Scholar] [CrossRef] [Green Version]
  30. Purser, D.A.; Bensilum, M. Quantification of behaviour for engineering design standards and escape time calculations. Saf. Sci. 2001, 38, 157–182. [Google Scholar] [CrossRef]
  31. Lovreglio, R.; Kuligowski, E.; Gwynne, S.; Boyce, K. A pre-evacuation database for use in egress simulations. Fire Saf. J. 2019, 105, 107–128. [Google Scholar] [CrossRef]
  32. Azlan, N.N.N.; Rohani, M.M. Overview of application of traffic simulation model. MATEC Web Conf. 2018, 150, 03006. [Google Scholar] [CrossRef] [Green Version]
  33. Notley, S.O.; Bourne, N.; Taylor, N.B. Speed, Flow and Density of Motorway Traffic; Transport Research Laboratory: Wokingham, UK, 2009. [Google Scholar]
  34. EUMETSAT. Gran Canaria Wildfires. Available online: https://www.eumetsat.int/gran-canaria-wildfires (accessed on 17 August 2019).
  35. BBC. Gran Canaria: 9000 Flee ‘Unprecedented’ Wildfires on Holiday Island. Available online: https://www.bbc.com/news/world-europe-49388823 (accessed on 17 August 2019).
  36. Chen, J.; Yu, J.; Wen, J.; Zhang, C.; Yin, Z.; Wu, J.; Yao, S. Pre-evacuation time estimation based emergency evacuation simulation in urban residential communities. Int. J. Environ. Res. Public Health 2019, 16, 4599. [Google Scholar] [CrossRef] [PubMed] [Green Version]
  37. UN/ECLAC. Handbook for Disaster Assessment; United Nations: Santiago de Chile, Chile, 2014. [Google Scholar]
  38. Turban, E. Decision Support and Expert Systems Management Support Systems; Prentice-Hall, Inc.: Hillsdale, NJ, USA, 1995. [Google Scholar]
  39. Battegazzorre, E.; Bottino, A.; Domaneschi, M.; Cimellaro, G.P. IdealCity: A hybrid approach to seismic evacuation modeling. Adv. Eng. Softw. 2021, 153, 102956. [Google Scholar] [CrossRef]
  40. Amideo, A.E.; Scaparra, M.P.; Kotiadis, K. Optimising shelter location and evacuation routing operations: The critical issues. Eur. J. Oper. Res. 2019, 279, 279–295. [Google Scholar] [CrossRef]
Figure 1. Hexagonal tiling (black) over evacuation area (red).
Applsci 12 07876 g001
Figure 2. Uniform spatial distribution of shelters avoiding damaged assets and alternative evacuations. Risk areas to avoid are represented by red polygons, areas to evacuate in blue and green areas are assumed safe.
Applsci 12 07876 g002
Figure 3. Evacuation route representation from evacuation areas (blue polygons) avoiding damaged areas (red polygons).
Applsci 12 07876 g003
Figure 4. Vehicular model flow chart.
Applsci 12 07876 g004
Figure 5. Functional architecture of the Evacuation Management Module, where the presentation, application and data tiers are presented in blue, green and red respectively.
Applsci 12 07876 g005
Figure 6. Gran Canaria wildfire intervention map. Red and green dots represent assembly points and emergency shelters locations respectively. Blue area depicts the evacuated areas and red area the wildfire boundary.
Applsci 12 07876 g006
Figure 7. Gran Canaria wildfire use case evacuations. Evacuation areas are presented in blue where red and green dots represent the assembly points and shelters respectively. The yellow lines represent the selected evacuation route.
Applsci 12 07876 g007
Figure 8. Simulation of evacuation processes for the four use cases. Each curve represents the total arrival time to the shelters of the different evacuees considering their entire evacuation process (pre-movement, pedestrian and vehicular movement times).
Applsci 12 07876 g008
Table 1. Pedestrian parameters estimation.
VarDistributionDetails
l p Uniform. ϕ = u 1 ϕ m a x ϕ m i n        [Lng]
θ = u 2 θ m a x θ m i n        [Lat]
L 2 E v a c .   P o l y g o n
l p = ϕ , θ L 2
v p Normal. r = 2 L n U 1   S i n 2 π U 2
v p = µ v + σ v r
t p r e p Log-Normal r = 2 L n U 1   S i n 2 π U 2
t p r e = e µ p r e + σ p r e r
U 1 U R 0 , 1 ,            U 2 U R 0 , 1
Table 2. Use case evacuation details.
MunicipalityEvacuation Start DateUrban AreaEvacueesShelter LocationShelter Building
Agaete18 August 2019El Risco1000AgaeteAlberto Álamo sports centre
El Valle Norte
El Valle Centro
El Valle Sur
Artenara10 August 2019Artenara800La Aldea de San NicolásRest home
Las Cuevas
Las Arbejas
11 August 2019Acusa Verde245Hostel
Coruña
Candelaria
Lugarejos
Santa María de Guía17 August 2019Barranco del Pinar100Santa María de GuíaMiguel Santiago school residence
Marente
Table 3. System performance analysis running on an eight-core laptop.
EvacuationEvacueesRoutes/Interaction Road SectionsSimulation Time
Artenara
10/08
8006/142 min, 51 s
Artenara
11/08
2458/213 min, 51 s
Santa María de Guia
17/08
1002/40 min, 4 s
Agaete
18/08
10004/110 min, 9 s
Publisher’s Note: MDPI stays neutral with regard to jurisdictional claims in published maps and institutional affiliations.

