1. Introduction
The recognition and evaluation of human facial expressions are among the most evolutionary essential processes. Apart from that, this particular type of visual stimuli is characterized by a broad spectrum of attributes, rendering them a complex system of features for human perceptual processing. Recent studies emphasized that our ability to detect and process human faces arises from the interplay between inherited predisposition and acquired experience-based skills [
1], both modulating our perception. Interestingly enough, three-month-old children do not show differential neural responses to fearful and neutral faces, regardless of gaze direction, which reflects the gradual development of discrimination abilities in the field of facial perception [
2]. Consequently, the function of the human brain during facial processing is currently seen as a dynamic Bayesian-based system that percepts and processes sensory inputs and integrates them with previously formed templates.
Brain studies in humans have also shown that facial processing is modulated by the affective salience of faces, especially those with expressions of fear; however, other social cues are involved as well. Even though traditional models suggest facial expression and identity are processed in distinctive areas, the current findings highlight that emotion processing can have a strong influence on facial recognition and memory mechanisms [
3].
When it comes to EEG data evaluation, several techniques of analysis are traditionally used to reveal distinctive aspects of neural oscillation. Among them, the power spectral density (PSD) algorithm highlights an increase or decrease in the power of the particular oscillation range that accompanies evoked response to a broad range of stimulus types, reflecting cortical activation processes [
4,
5]. Withal coherence allows for bringing up dynamic interactions between functional brain areas on the basis of distant signal synchronization processes while executing a specific task [
6].
However, putting together the complete picture of induced neurodynamics requires not only oscillatory power and emergence synchronicity evaluation, but also the assessment of the temporal stability of the effective neural associations. That is why the study of the potential applications of nonlinear EEG analysis methods taking into account the nonstationarity of EEG time series is relevant and can also provide clues for investigating subtle mechanisms on the basis of the long-range fractal scaling properties of the signal.
Various scaling methods exist to quantify the fractal scaling properties of biomedical time series; the most commonly used method so far is detrended fluctuation analysis (DFA) [
7]. Nevertheless, recent developments in scaling analysis techniques suggest that the DFA methodology possesses some crucial drawbacks that lead to the inaccurate estimation of the scaling properties of a signal [
8]. A novel method of scaling analysis, detrended moving average (DMA) [
9] analysis, was introduced, and its theoretical foundation was developed [
10,
11,
12]. DMA has huge potential for identifying the long- and short-term correlations of the time series, and does not have all the drawbacks of DFA.
The DFA and DMA methods were both used in various applications in regard to EEG analysis, such as emotional specification from musical stimuli [
13], the quantifying depth of anaesthesia [
14,
15], analyzing human sleep [
16], and assessing human emotions [
17]. However, in most of the cases, the nonlinear properties of EEG signals are described in a standalone manner or used as one of the features in training the machine-learning algorithms. So far, there has been no research jointly describing the relation between conventional measures in neurophysiology with the fractal scaling features of the EEG time series.
In this work, we aimed to combine the widely used methods of EEG data evaluation such as PSD and coherence with a detrending moving average algorithm fitted to highlight long-range spatiotemporal correlations within EEG data in order to display different neurophysiological aspects of visual perception. Thus, comparing the results provided by widely used methods of EEG data analysis with the results provided by the DMA algorithm, a mathematical apparatus that is new in the field of electrophysiological research was carried out. The data used for the analysis consisted of EEG-based short-term variations of neural oscillations corresponding to the perception of neutral facial expressions, which were primed by the faces of either positive or negative emotional valence.
2. Materials and Methods
2.1. Subjects and Data Collection
The study included data collected from 48 volunteers who were the students of Taras Shevchenko National University of Kyiv (29 females) aged 18–24 (Mean age = 21, SD = 1.76). The experimental design was approved by the Institutional Ethics Committee of the Educational and Scientific Center Institute of Biology and Medicine, Taras Shevchenko National University of Kyiv. Each of the participants received and filled out a written informed consent in accordance with the Declaration of Helsinki (Helsinki, Finland, June 1964), the Convention for the protection of Human Rights and Dignity of the Human Being with regard to the Application of Biology and Medicine: Convention on Human Rights and Biomedicine (Oviedo, 4 April 1997), and the Declaration of the Principles on Tolerance (28th session of the General Conference of UNESCO, Paris, 16 November 1995). The list of major exclusion criteria consisted of addictive behaviors, mentions of mental or neurological cases in the patient’s clinical history, the use of psychiatric medications, untreated vision impairments, and color blindness.
Both the image demonstration and EEG recordings were performed using the Neurocom electroencephalographic complex in conformity with a purposely designed template. The data acquisition was performed using 19 active recording channels applied to the scalp according to the international “10–20%” system.
2.2. Experiment Design
The stimulation material was organized into four 3 min long image sequences (2 emotional and 2 neutral), and each separate stimulus was demonstrated for 5 s. With the view to perform emotional priming, the image series were displayed as follows: each emotional array preceded a neutral one; the series with positive facial expressions was shown first to avoid emotional trace overlap. The experimental paradigm implied the following:
EEG recording while the subjects rest with closed and open eyes;
EEG recording during emotional stimuli perception (positive and negative facial expressions);
EEG recording during neutral stimuli perception, modulated by positive images (n1) and negative images (n2).
Stimuli were taken from the International Affective Pictures System (IAPS) [
18] according to the average values of their emotional valence. Thus, the parameters of the stimuli were as follows:
neutral faces (M = 4.22, SD = 1.64 to M = 5.84, SD = 1.62);
positive faces (M = 6.94, SD = 1.42 to M = 8.03, SD = 1.13);
negative faces (M = 1.82, SD = 1.64 to M = 3.91, SD = 1.62).
The EEG data were subdivided into a range of sub-bands, allowing for evaluating the induced responses generated by the human cortex. Therefore, the decisive list of the EEG spectral ranges included the following constituents:
3.5–5.8 Hz ();
5.9–7.4 Hz ();
7.5–9.4 Hz ();
9.5–10.7 Hz ();
10.8–13.5 Hz ();
13.6–25 Hz ();
25.1–40 Hz ().
All the analytical techniques mentioned in this study were individually applied to each EEG sub-band.
2.3. Estimation of Power Spectral Density
Power spectral density (PSD) analysis is a widely used frequency-based method of EEG power distribution study [
19]. In this work, PSD was calculated from EEG data during the processing of various visual stimuli. First, fast Fourier transform was computed and then squared to obtain the PSD estimate. The mean normalized PSD for every EEG channel in the frequency ranges mentioned above was determined by adding power values in a specific frequency range selected for further analysis. Lastly, the value of total powers in every range was divided by the total spectral power of the corresponding EEG channel.
2.4. Detrended Moving Average Analysis
The detrending moving average (DMA) method is used to estimate the scaling exponent of long-range correlated series [
10], including EEG during cognitive workload [
20]. The DMA algorithm is widely applied to evaluate the long- and short-term correlations of random time series, both one- and high-dimensional, in time and spatial domains [
21].
DMA analysis consists of the following steps: First, the time series of each EEG channel are filtered using a 4-th order Butterworth band-pass filter with a pass band corresponding to the required frequency range described in the experiment design. The values of the cutoff frequencies were chosen directly from specified EEG bands:
[3.5, 5.8],
[5.9, 7.4],
[7.5, 9.4],
[9.5, 10.7],
[10.8, 13.5],
[13.6, 25],
[25.1, 40] Hz. As the second step, the Hilbert transform was applied to each filtered signal to obtain the analytic signal, and then the envelope was estimated as the absolute value of the analytic signal [
22].
Afterwards, we integrated the transformed signal as follows:
In the next step, we calculated the fluctuation function
of the integrated series:
where
represents the
m-th order Savitzky–Golay smoothing filter [
23] for
, and
s is window length of the Savitzky–Golay filter. In our approach, we used the fourth Savitzky–Golay filter that corresponded to the centered DMA [
24].
A linear relationship on a double-logarithmic plot of against scales s indicates the power-law scaling range. In this scaling range, fluctuations can be characterized by a scaling exponent . Scaling exponent was derived from the slope of the linear part of the relation between against scales , where the linear part was empirically chosen to fit the aim of the research for all the subjects with different types of stimulus. As a result, the values of scaling exponents were obtained for all channels in the defined frequency bands. Depending on its value, the meaning of the scaling exponent is interpreted as follows:
—long-range anticorrelated signal;
—uncorrelated signal;
—long-range correlated signal;
2.5. Coherence Analysis
Coherence analysis is generally recognized as a standard metric for EEG data analysis. The coherence of EEG activity in different brain regions is used to measure the synchronicity of oscillations in two distinctive areas of the neocortex (namely, functional connectivity) for different functional states and processes [
25], and emotions [
26]. In the present study, coherence is used to indicate statistically significant similarity of neural source activity in a particular frequency range in two distinct cortical regions.
In this work, the coherence was calculated according to the following pipeline. The pairs of different EEG channels were chosen for every frequency sub-band, and the coherence was calculated [
27] using the entire recordings. The validity of the coherence coefficient between pairs of electrodes was addressed by conducting surrogate data analysis [
28]. The phase randomization technique was applied to obtain the surrogate of the EEG signal. For one of the EEG signals, the Fourier Transform was acquired, and then the random number from range
… +
was added to the phase of each harmonic component. Afterwards, the inverse Fourier transform was performed, and the coherence was calculated between one initial EEG signal and the surrogate EEG. Each pair of electrodes underwent 100 iterations of the procedure. The
t-test (
p < 0.05) was performed to define coherence coefficients, which differed significantly from the surrogate data. If the coefficient was significantly different, it was chosen for further analysis; otherwise, it was neglected. As a result, we obtained the valid EEG coherence values between the electrode pairs for every frequency range and pair of experiments.
2.6. Statistical Tests
The Wilcoxon and Mann–Whitney tests were used to perform statistical tests of significance for the PSD, DMA, and coherence parameters of EEG. These tests were selected to identify the channels, and frequency ranges were the median values of the analyzed parameters were different for the two experimental sets of EEG data (n1, n2). Through the Wilcoxon signed-rank test, two generalized n1/n2 trials without gender splitting were tested. The Mann–Whitney rank test was used to test female/male groups for the same set of trials.
Likewise, statistical tests were undertaken for DMA scaling exponents. If the median value of the scaling exponent for the n1 EEG signal was statistically distinct from that of the n2 one in a given channel, the significance was obtained for that channel. As all of the frequency bands chosen for this study were generated from the same EEG recording, it may be concluded that all of the frequency bands were evaluated together. Thus, the
p-value correction was performed to eliminate the multiple-comparisons problem. To address this issue,
p-values were corrected using the Holm–Sidak correction [
29].
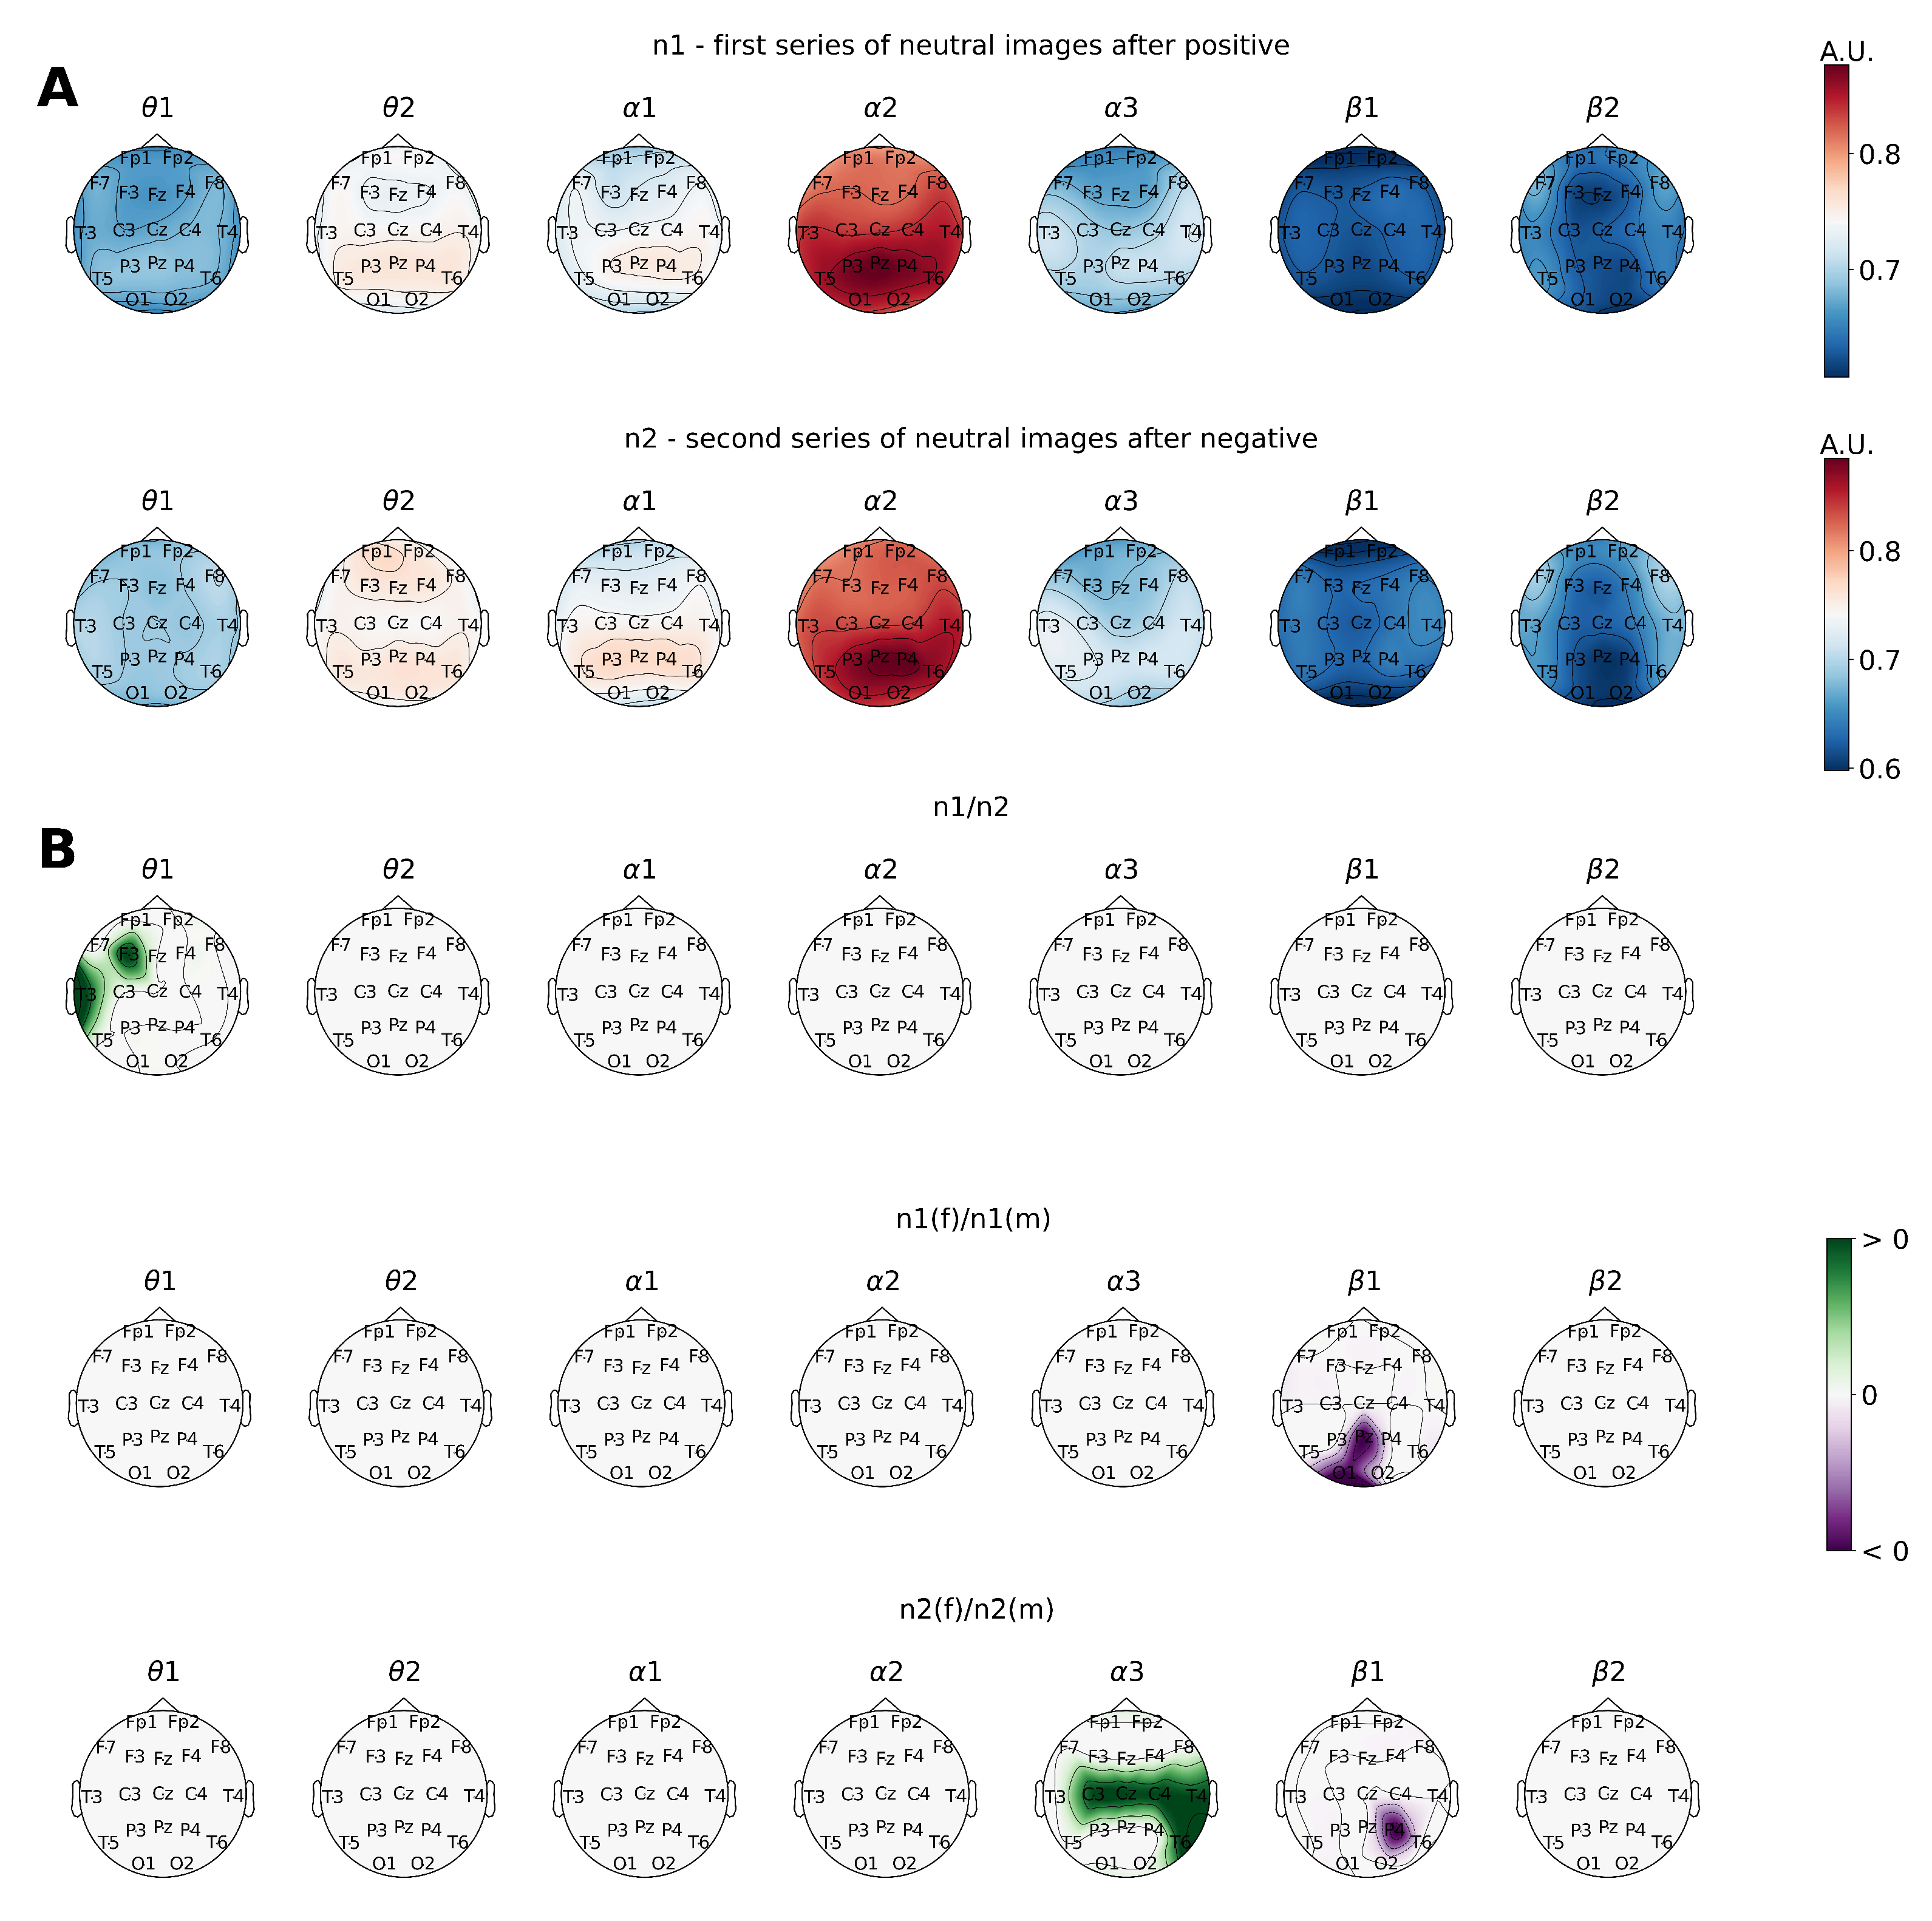
The schematic head figures with EEG channels were used to visualize the obtained results. On these figures, “>0” was assigned to the associated EEG channel if the difference between medians of the PSD and scaling exponents was larger than 0, “<0” was assigned if the difference was less than 0, and “0” was assigned if there were no significant differences between medians. All values associated with a particular color on the heat map facilitated result perception.
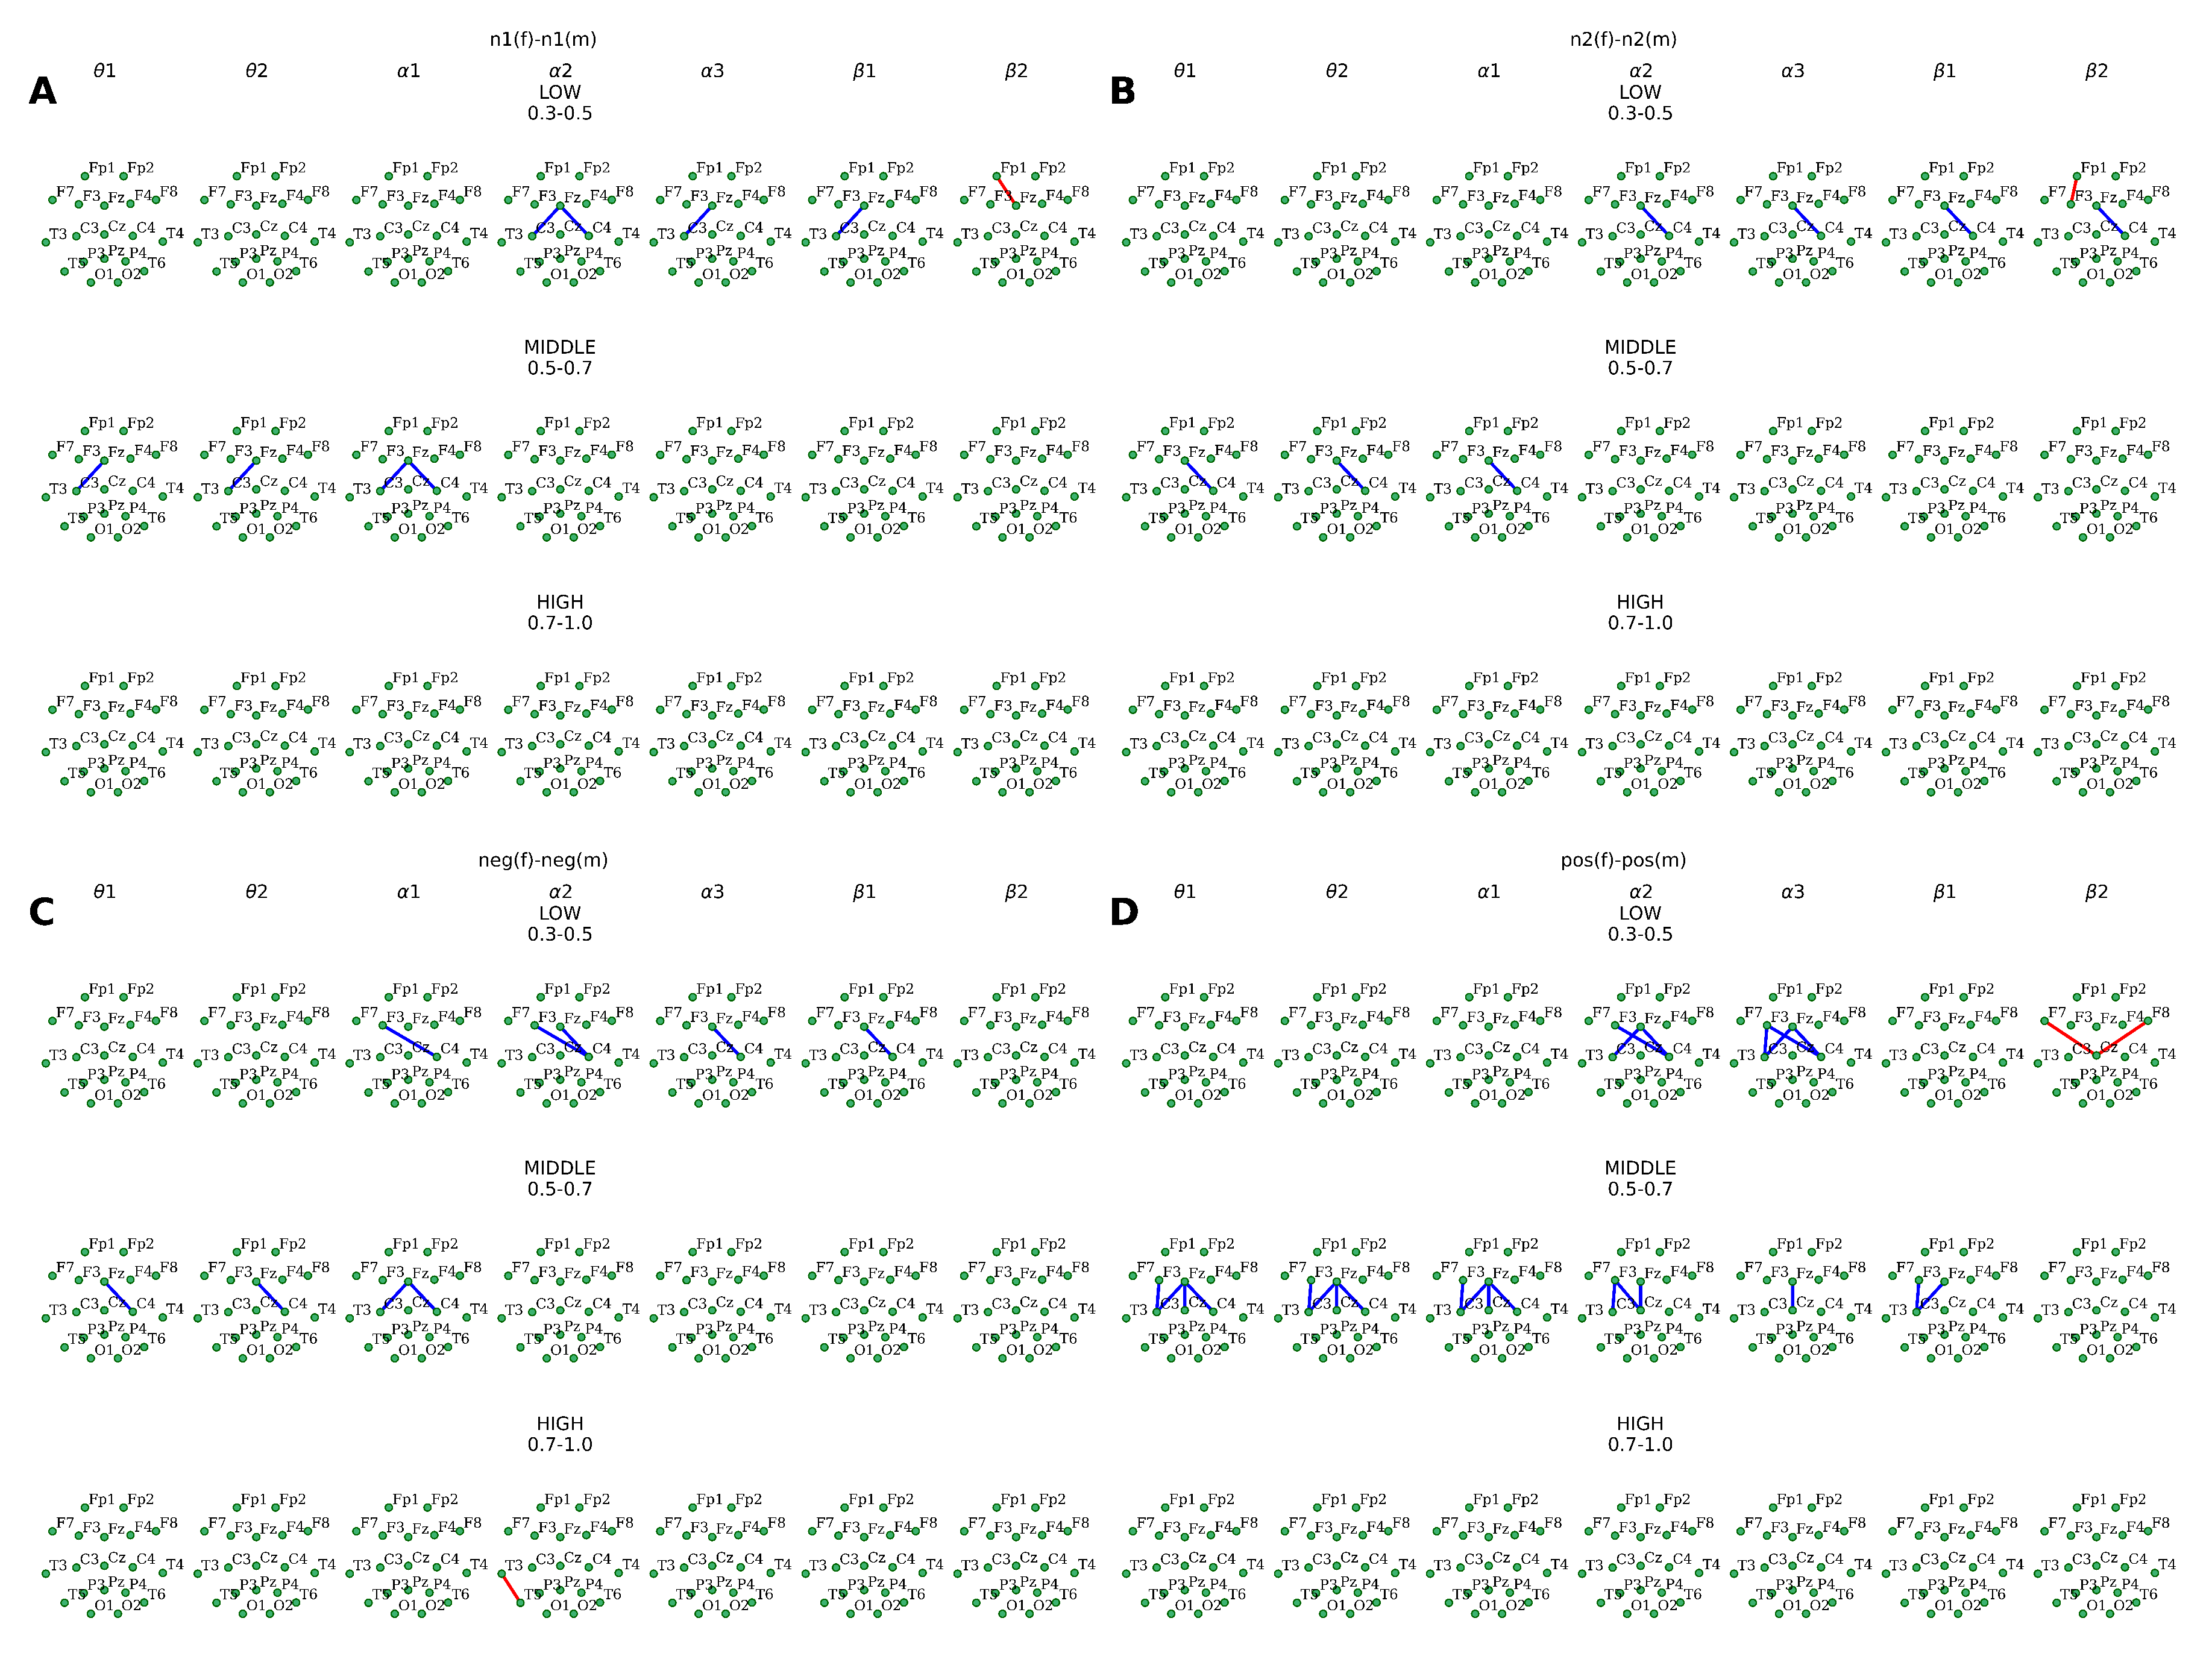
For coherence analysis, the same type of statistical analysis was applied. The visualization of the coherence statistical test was performed in the following manner: if the difference between medians was larger than zero, the red line connected two electrodes labels of the EEG channel; if the difference was less than zero, a blue line was assigned; and if the differences were not significant, no visual changes were applied to the head figure. The Wilcoxon test was used in situations where experiments were compared without gender division, but the Mann–Whitney test was used when gender division was present.
3. Results
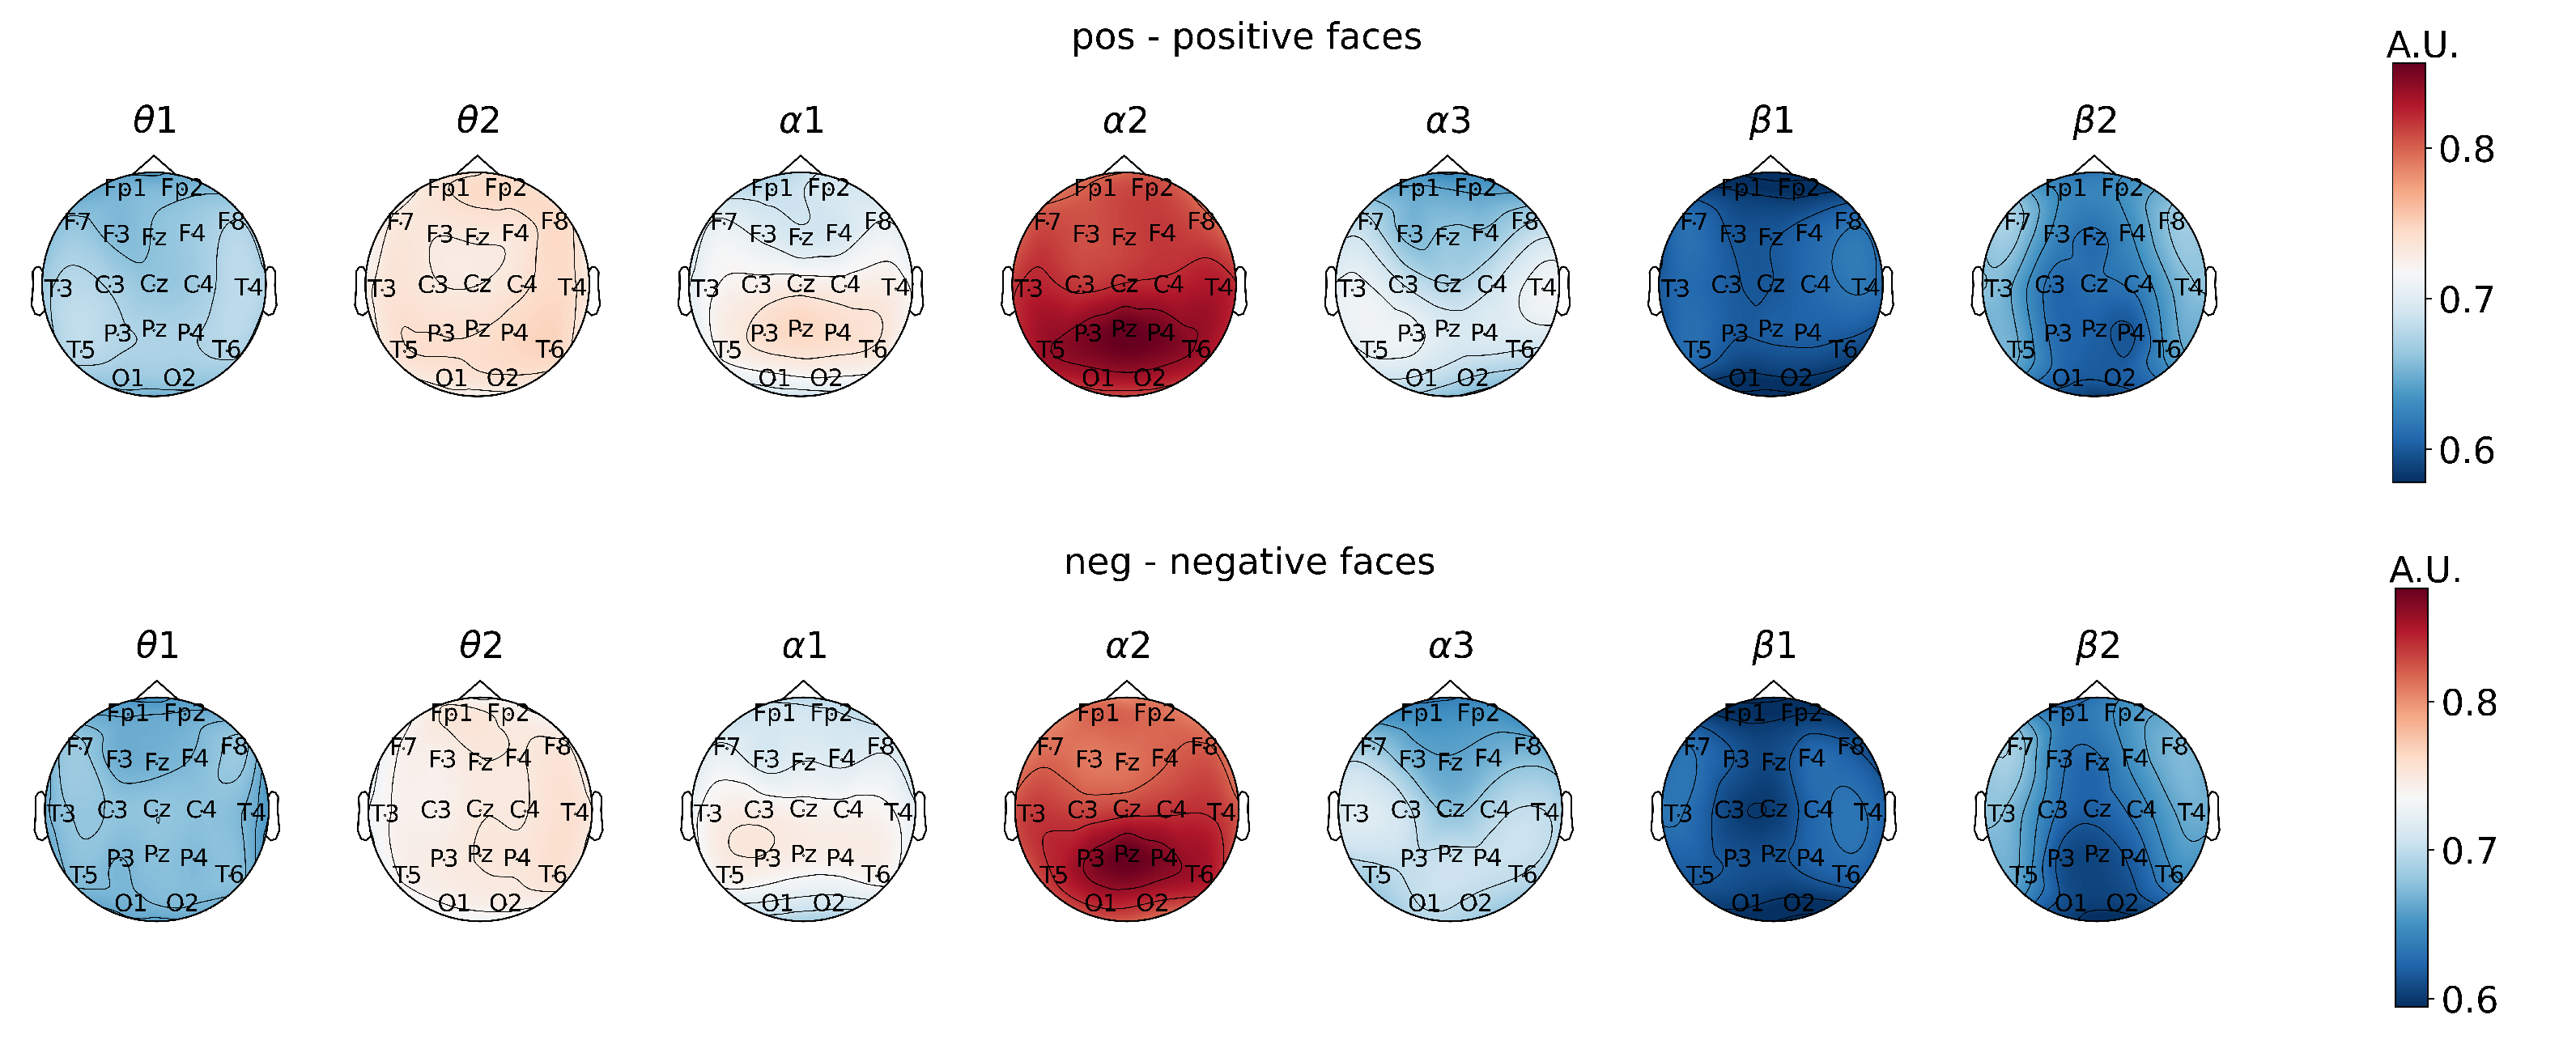
To visualize the results, topographical head heat maps were used. The color bar represents the main features of signals obtained by normalization between the minimal and maximal values.
Therefore, the topographical plots represent the statistically significant differences in PSD values that are induced by distinctive types of visual stimulation. These data were also reflected within the head maps.
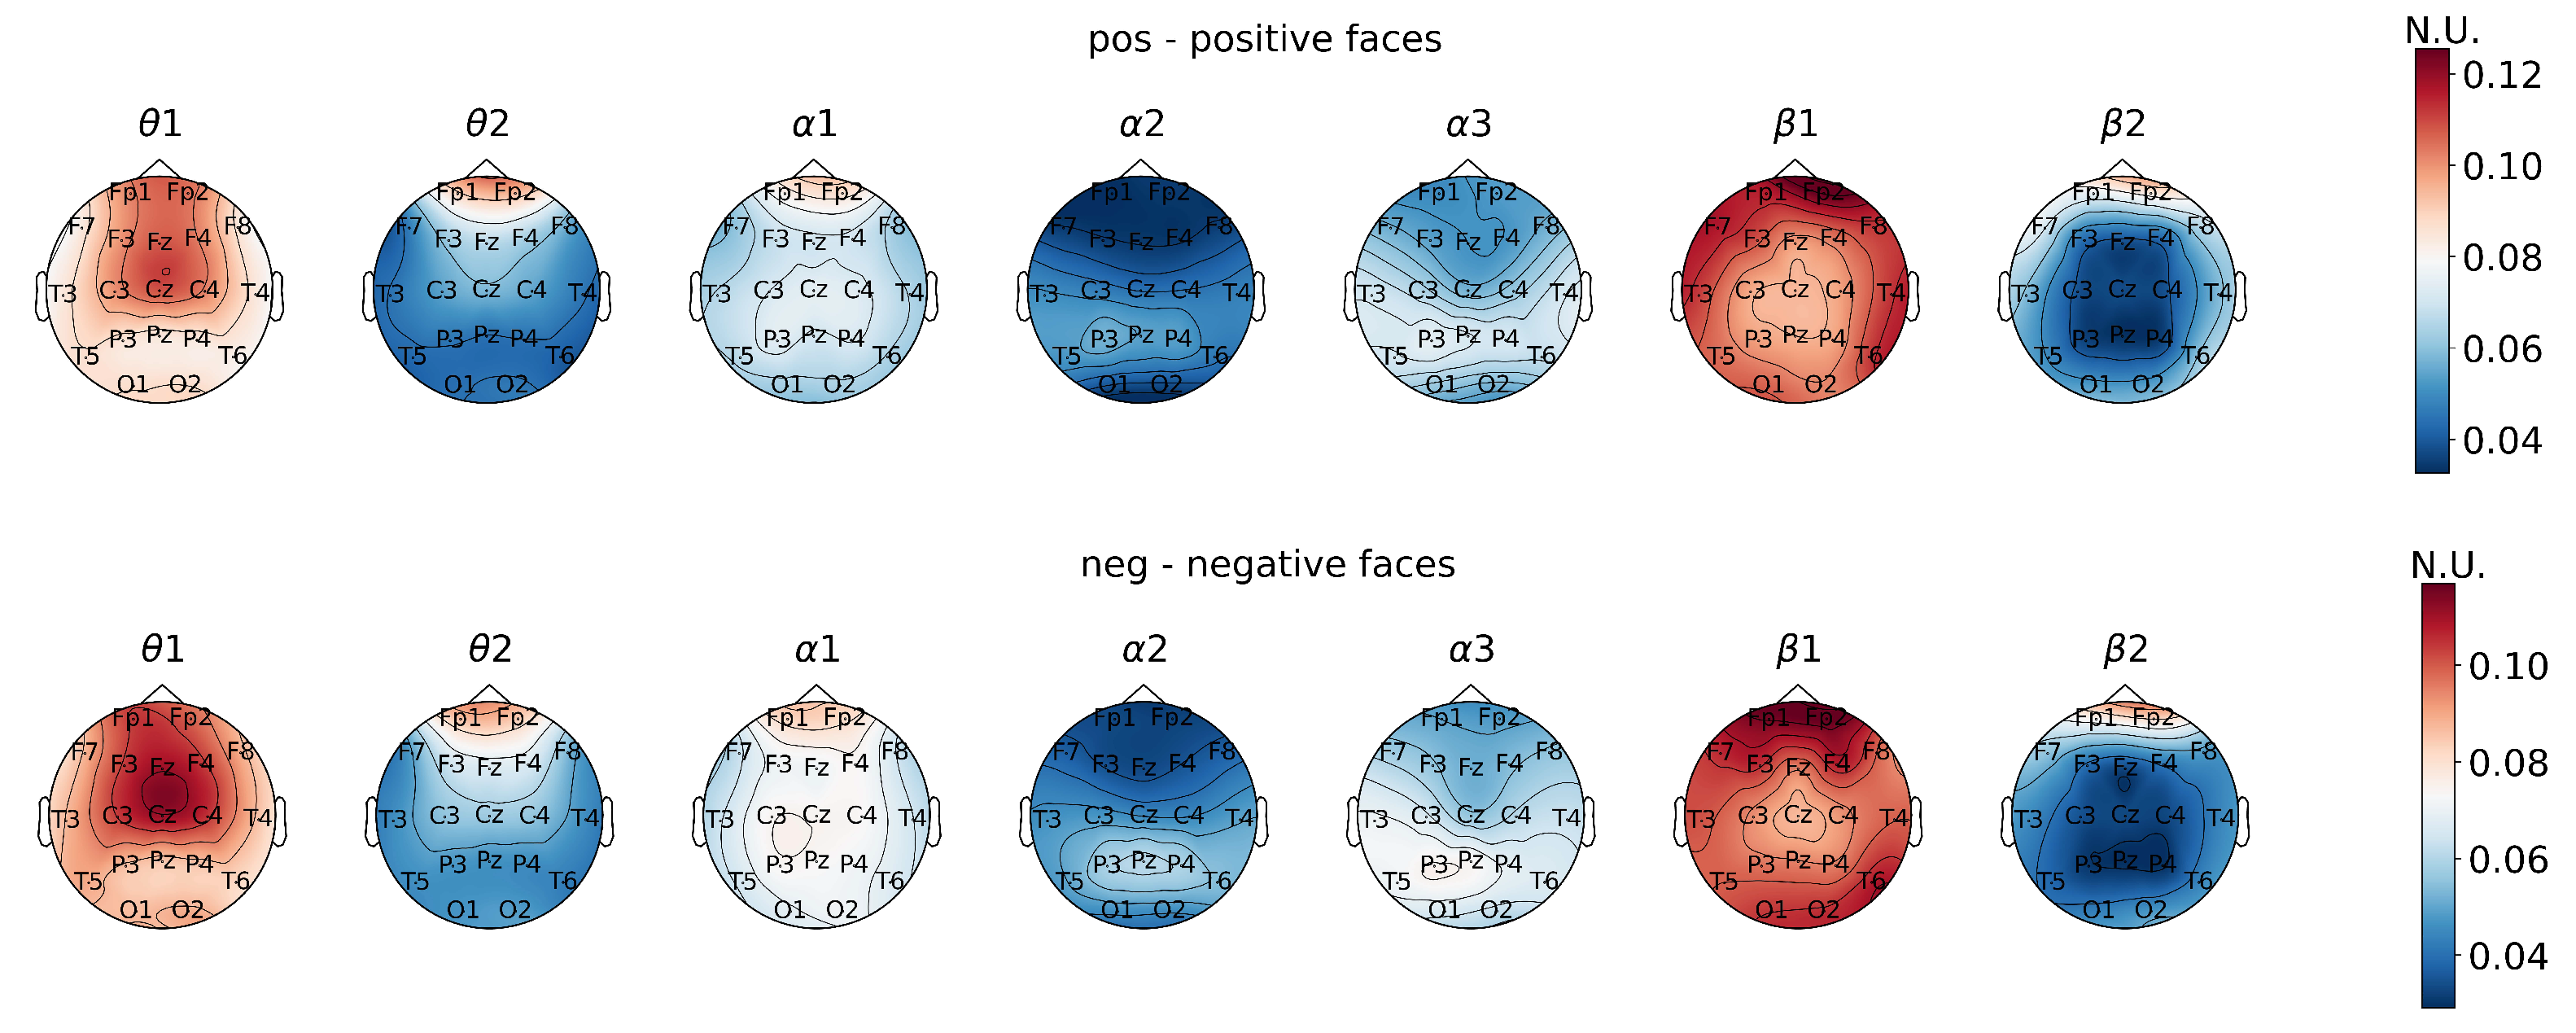
First, the analysis of power spectral density values reflected the neurodynamics related to the visual stimulus perception and processing when subjects were presented with emotional stimuli (
Figure 1).
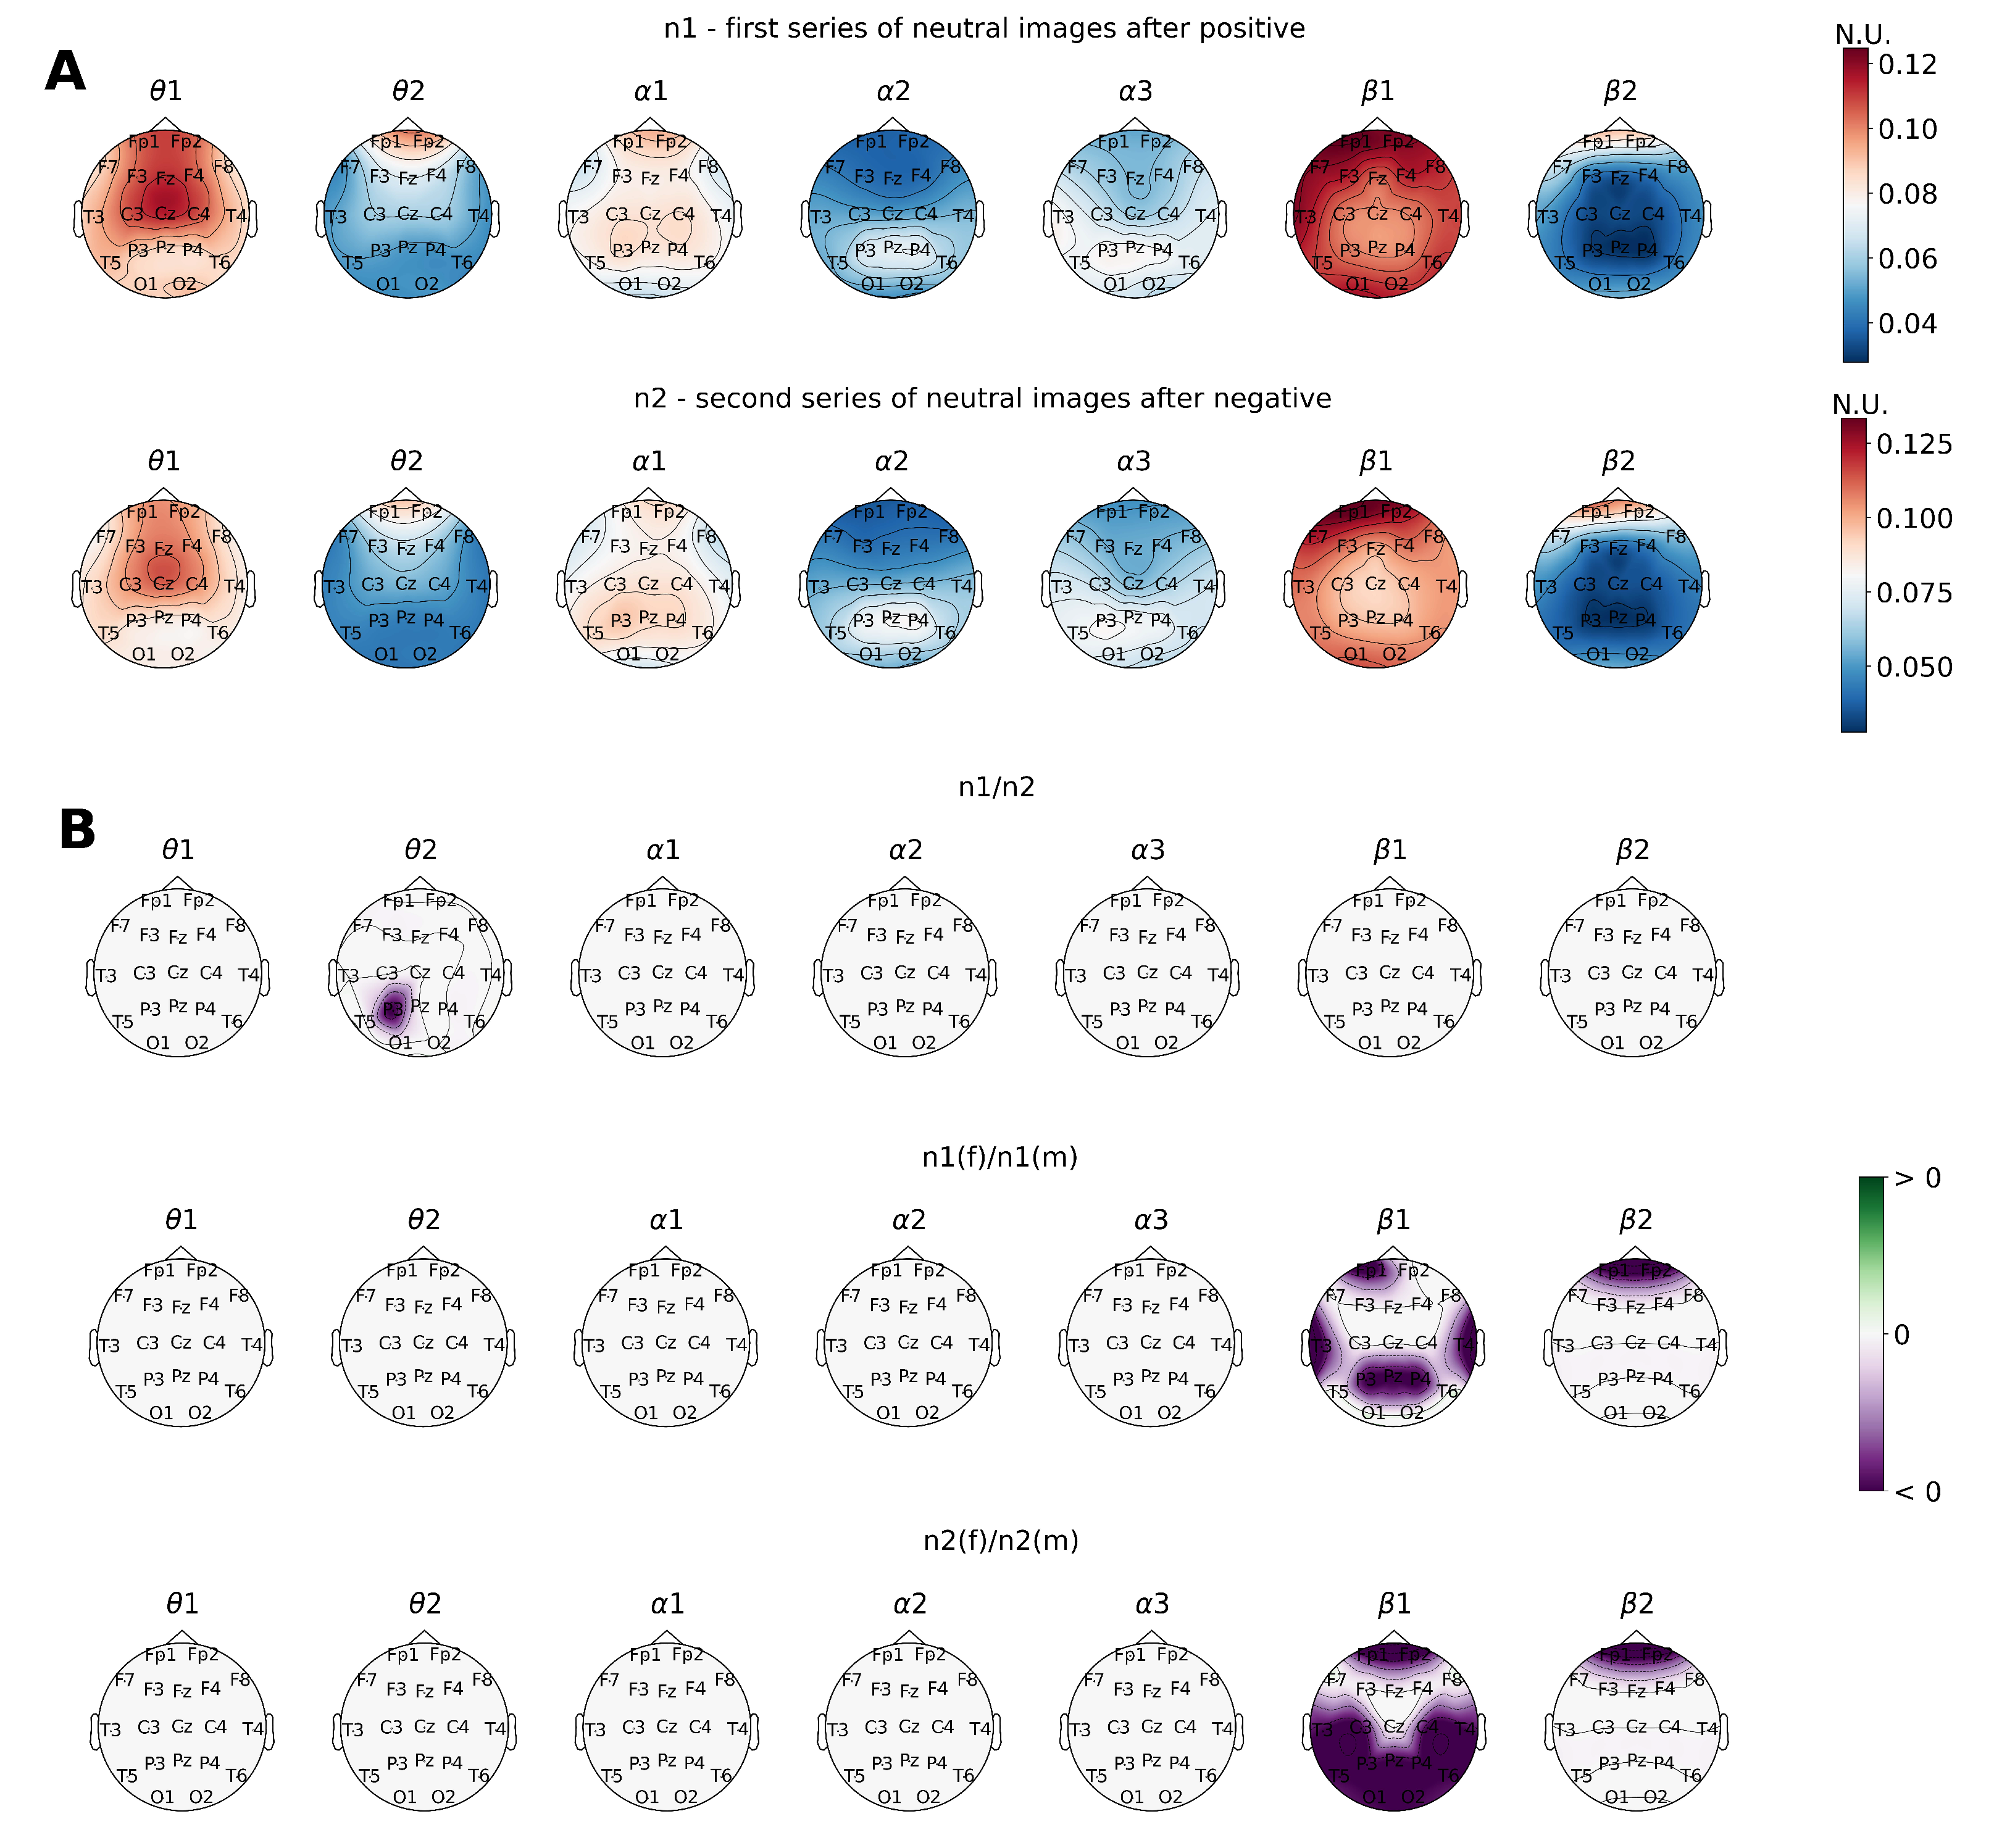
A comparison of the EEG data recorded during the demonstration of the first and second series of neutral images revealed the development of a well-defined focus of activation in the left anterior parietal cortical area within the
sub-band when the subjects were processing neutral faces preceded by negative images (
Figure 2).
At the same time, the comparative analysis between male and female subject groups highlighted some of the gender-specific differences in information processing that were primarily visible within the EEG band. Thus, enhanced activation processes were located within the prefrontal and frontal cortical areas in the sub-band. Apart from that, men also tended to have generally increased activation distributed among the majority of cortical regions in the sub-band.
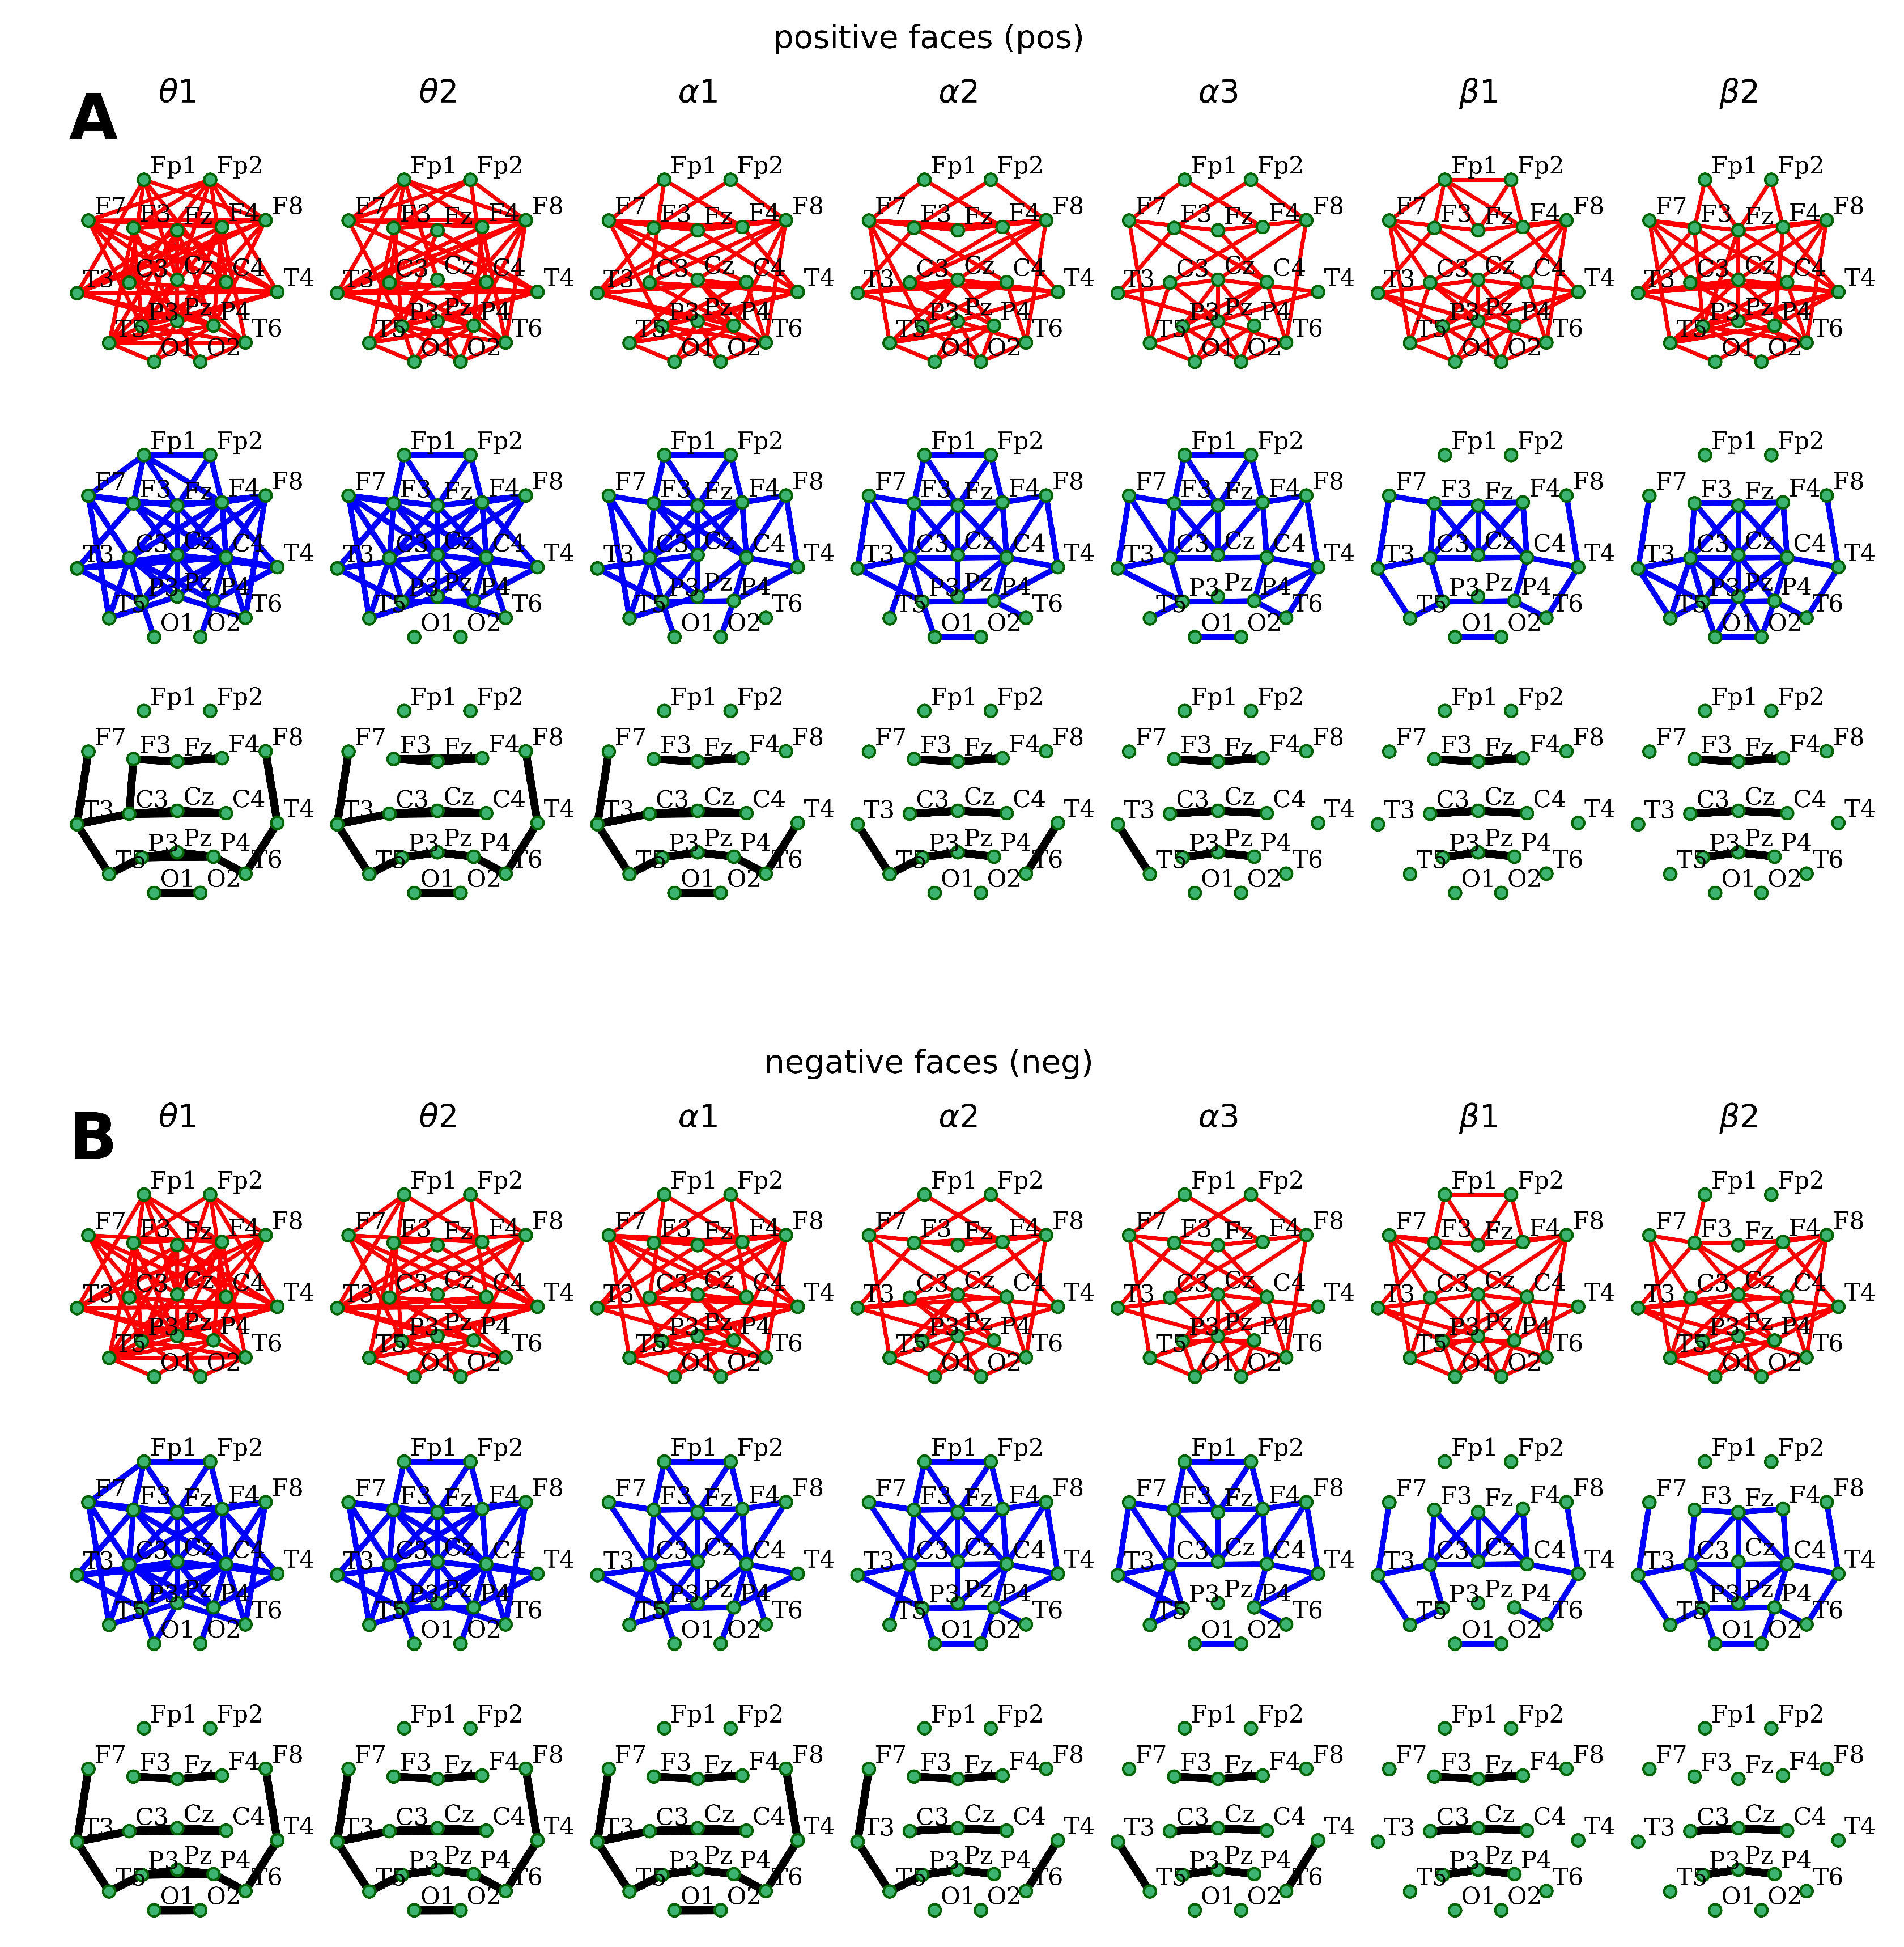
The analysis of coherence alterations in the paradigm of our study showed the expected generalized multiple connections within low and medium values (0.3–0.7) (
Figure 3). The maximal number of connections was observed in the
,
,
, and
EEG sub-bands in the case of positive stimulus perception. Exposure to visual stimuli with negative emotional coloring was accompanied by a less pronounced generalization of distant EEG synchronization (a smaller number of functional connections in the neocortex), with the maximum represented in the
,
, and
EEG bands. (
Figure 3). Lastly, no dominant foci of connections were revealed in either positive or negative emotional stimuli.
Regarding the high values of coherence coefficients
, it can be concluded that, during exposureto both emotional series, there was a central-right-sided association observed in the frontal, central, and parietal–posterior temporal zones within all EEG bands (
Figure 3) In addition, there was a distant bilateral connection formed in the temporal and occipital regions within the
,
, and
sub-bands.
Moreover, coherence topography appeared to be similar in the two emotional series. However, positive facial perception induced an additional left-hemispheric posterior–frontal–temporal association (
F7–
T3–
T5) in the
,
, and
sub-bands alongside a symmetrical network of connections in the right hemisphere (
F8–
T4–
T6) in the
-band. The perception of negative stimuli was accompanied by the chain of distant connections described above, complemented by frontotemporal relations in the right hemisphere within the
sub-band, and posterior temporal connections in the
and
bands of oscillations. Lastly, the left hemisphere’s rear frontal and temporal cortical areas were interconnected within
EEG sub-bands (
Figure 3).
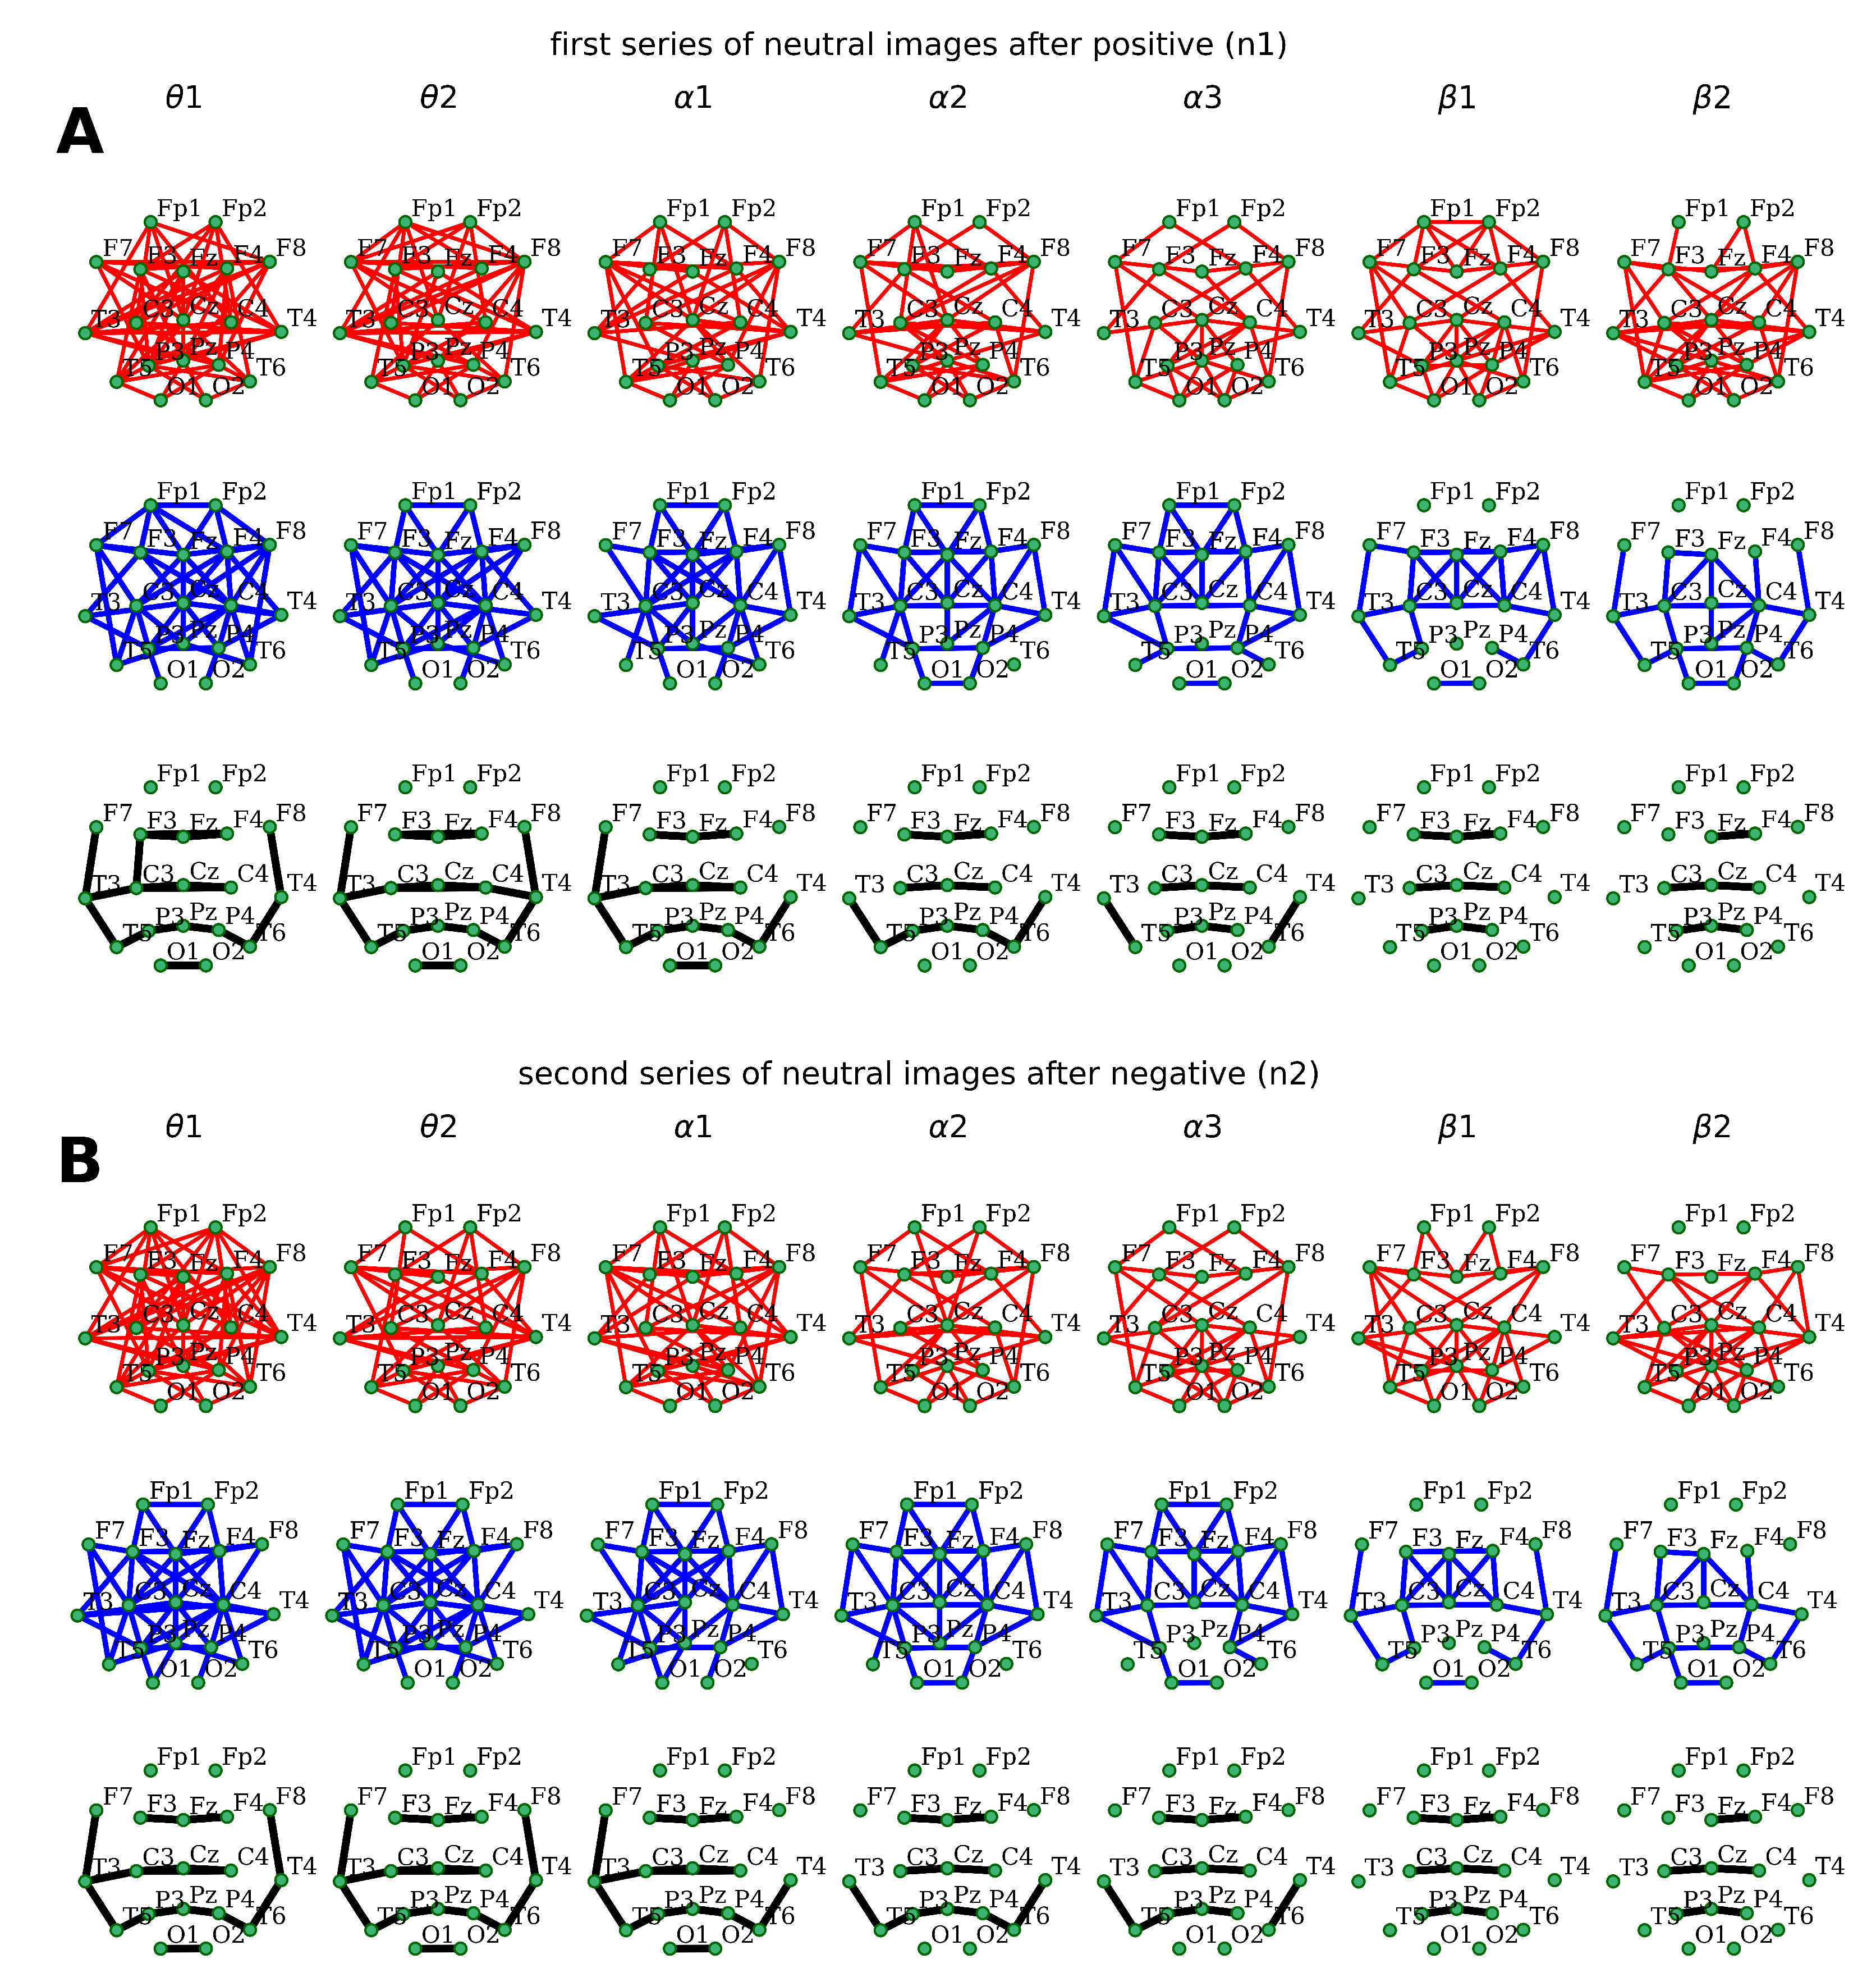
Likewise, the topography of distant coherent connections distribution
during both neutral emotion-primed series perception appeared to be generally similar to the one observed in the case of emotional stimulus processing. Moreover, the composition of connections was almost identical for the groups of low-, middle-, and high-coherence levels (
Figure 4).
Nonetheless, several differences were observed for the group with high coherence levels
. The perception of neutral faces modulated by negative stimuli, compared to the series of positive-primed ones, was characterized by the absence of the left hemispheric connection within frontocentral (
F3–
C3) cortical areas in the
sub-band and the right hemispheric temporocentral (
C4–
T4) relation in
(
Figure 4). In addition, there was an interaction between the left posterior-temporal and parietal regions (
T5–
P3) observed in the
EEG sub-band during the perception of neutral stimuli preceded by negative ones (
Figure 4). Otherwise, no significant differences were revealed in the topography of distant EEG-synchronization distribution.
Furthermore, the analysis of the topographical distribution of distant connections in our study from the gender perspective showed a general decrease in connection strength
throughout the consequent stages of the experiment. Moreover, in almost all cases, changes in coherence levels were mainly located in the orbitofrontal cortex and precentral areas cortical areas
within the right hemisphere in almost all EEG ranges (
Figure 5). At the same time, a differential effect of the presented facial valence on the topography and the number of distant connections were observed. For instance, the second series of neutral faces processing was characterized by fewer coherent connections than the first neutral series was. On the other hand, the demonstration of emotional faces was associated with increased functional connections, especially when the subjects were presented with positive stimuli. In addition, enhanced coherence levels were observed in the female group within the
sub-band during all types of experimental stimulation. For instance, positive stimuli elicited the emergence of symmetrical connections between the left central
and posterior frontal areas
, while the presentation of negative faces resulted in left hemispheric temporal association (
T3–
T5)
. In the case of neutral stimulus processing, connections within the left frontal area
1–
(in n1 series) and
1–
F3 (in n2 series) were observed
. Lastly, the values of the coherence coefficient were generally higher
for bands of low-frequency EEG oscillations
, and lower
for high-frequency oscillations
(
Figure 5).
At the average DMA analysis level, no statistically significant differences were obtained for the trials with emotional stimuli (
Figure 6).
Interestingly, the DMA algorithm results marked the tendencies mentioned above on the intergroup level from a slightly different perspective. In this case, the male group showed an occipitoparietal activation region within the EEG sub-band while processing neutral images preceded by both positive and negative emotional stimuli. This fact once again stands for the general activation of the cognitive beta network. At the same time, the female group was characterized by an extensive network of connections among the temporal, central, and frontal regions in the sub-band when neutral faces were presented after the negative ones.
At the general level, DMA analysis displayed areas of statically significant connections in the left temporal and frontal cortex when subjects were exposed to neutral facial expressions after the positive series (
Figure 7).
4. Discussion
Regarding the PSD results, the involvement of left parietal cortical regions might represent the effect of negative emotional priming on association and verbalization-related neurodynamics, while a positive background enhances memorization [
30]. The prefrontofrontal locus of activation in
might highlight the increase in emotional regulation, internal attention, and verbalization in the male group [
31]. In comparison, the generalized enhanced activation within the
sub-band in the male group can be seen as evidence of expanded spatial-attention-related processes in the visual domain.
In general, obtained results correspond to current accumulated data. They indicate a greater reactivity of the high-frequency part of the EEG spectral parameters, especially in response to the negative modality of demonstrated faces. Apart from that, emphasis was placed on the high significance of the theta EEG oscillations in the anterior cortical areas alongside high-frequency bands in the temporal, parietal and occipital regions (presumably including the fusiform gyrus), which play a crucial role in the mechanisms of facial perception and processing [
32,
33,
34].
Unlike the PSD algorithm, the use of coherence analysis, being indicative of the oscillatory processes synchronicity in different cortical areas, allowed for identifying even subtler information exchange in the brain under the conditions of our examination. Thus, it was possible to show the functional correlation of the topographically distinct cortical regions during the perception of emotional faces. However, in contrast to the available data in the literature [
33], we observed coherence alterations in almost all EEG bands, generally over all cortical regions, especially in the middle range of coherence coefficient values, which seems entirely consistent, taking into account modern concepts regarding the complex nature of mechanisms underlying the perception of human faces, especially with a different emotional modality. The introduction of a separate analytical technique for the functional connectivity assessment at high coherence levels
allowed for identifying an area with a changing rate of excitability depending on emotional modality. We observed the formation of a correlation hub in the prefrontal region (including the temporal and parietal areas, which are seen as the projections of the amygdala and cingular cortex). This finding highlights the role of this cerebral region in terms of sensory signal processing, cognitive behavioral strategy setting, decision making, and, more importantly, the actualization of attention processes. It turned out that increased reactivity to negative facial expressions also radiates its effect on the perception of neutral faces in the case of emotional priming.
The introduction of the gender parameter into the analysis also allowed for showing the locus of distant coherence changes at the group level. It was revealed that gender differences appear to be manifested in all experimental sessions. In this instance, the main hub of interest included coherent coupling between the prefrontal and anterior parietal regions in the left hemisphere, and these functional associations were less prominent in the female group. In addition, the general decrease in coherent connections during the perception of positive images is much more topographically expressed, indicating a more activating component of negative perception. The observation that image perception is accompanied by changes in functional association mainly in the left hemisphere may be due to the fact cortical areas of this hemisphere are involved in the categorical (semantic) analysis of information, which is a necessary stage of perception.
Notably, the only EEG range where coherence coefficient levels were significantly high in the female group was the
sub-band. Within this oscillatory range, we detected a functional association between the anterior temporal and posterior frontal regions of both hemispheres, and the vertex, which might indicate the activation of working memory mechanisms during perceptual task execution [
35].
The tendencies brought up by the DMA-based analysis corresponded to the PSD results. The activation region within the temporofrontal area in the left hemisphere might reflect the remaining positive experience trail alongside the intensification of inner attention mechanisms [
36] and working memory activation traces against the background of positive emotional experience. The occipitoparietal area of coherent coupling in the male group might support the general activation of the cognitive beta network (neocortical mechanisms). At the same time, the pronounced pattern of coherent associations in the female group within the
sub-band might represent not only the specific activation of working memory mechanisms, but also the lack of the downstream control and suppressive function of attention upon emotions and mental imagery and semantic activations [
37,
38]. Lastly, generally enhanced levels of the DMA coefficient were observed in the central parietal cortical area and supposedly the fusiform gyrus, which are known for their role in facial perception and recognition [
32,
33].
Lastly, in the framework of this work, we proceeded from notions of the physiological and functional heterogeneity of the brain’s rhythmic activity. In the context of this paradigm, all EEG bands can be divided into sub-bands, which allows for studying the mechanisms of cognitive functioning more subtly. For instance, strong evidence exists that the
EEG band has a heterogeneous physical and functional structure. However, at present, most authors analyze the range as a whole (4–7.5 Hz), focusing separately on changes in its individual sub-bands depending on the current functional state of the brain [
39,
40].
At the same time, there are several studies in which the
band of oscillations is primordially divided into two sub-bands associated with the activation of the emotion- and memory-related mechanisms, respectively [
41,
42,
43].
In the context of this work, we expected to highlight the prognostic significance of dividing the
range into two sub-bands under the conditions of using various types of EEG analysis. Our results show the legitimacy of separating the theta range into at least two subranges (
Figure 2,
Figure 3,
Figure 4,
Figure 5,
Figure 6 and
Figure 7) that indicate different cognitive response mechanisms.
The same opinion ambiguity is seen when it comes to
band analysis. We built our study on the research evidence, which suggests functional variety in the
EEG band. Therefore,
—(8–9 Hz) is considered to play an inherent role as a correlate of memory processes;
—(10–11 Hz) is connected to the attention phenomenon; and
—(12–13 Hz) is associated with the processes of inner speech and logical thinking [
44,
45,
46,
47].
The study of brain dynamics, taking into account frequency sub-bands, can provide nontrivial information about neural networks functioning during mental and cognitive activation, especially when using modern nonlinear analytical algorithms.


 ,
, 