Article

IFD: An Intelligent Fast Detection for Real-Time Image Information in Industrial IoT

1
School of Electronic Information Engineering, Shanghai DianJi University, 300 Shuihua Road, Pudong, Shanghai 201306, China
2
Department of Computer Science, Georgia State University, Atlanta, GA 30302, USA
*
Authors to whom correspondence should be addressed.
Appl. Sci. 2022, 12(15), 7847; https://doi.org/10.3390/app12157847
Submission received: 5 July 2022 / Revised: 31 July 2022 / Accepted: 1 August 2022 / Published: 4 August 2022
(This article belongs to the Section Computing and Artificial Intelligence)

Abstract

:
The processing of images by a convolutional neural network will lead to the loss of image information. Downsampling operation within the network is the main reason for the loss. To cut back the loss and reach an acceptable detection speed, this paper proposes an Intelligent Fast Detection for Real-time Image Information in Industrial IoT (IFD). IFD adopts the improved YOLO-Tiny framework and integrates the VaryBlock module. Firstly, we elect a tiny version of YOLO as the backbone and integrate the VaryBlock module into the network structure. Secondly, WGAN is applied to expand the training dataset of small objects. Finally, we use the unsupervised learning algorithm k-means++ to obtain the best-preset boundary box to improve the accuracy of the classification results. IFD optimizes the loss and detection accuracy of image information while meeting the detection speed. The MS-COCO dataset and RGB images in the TUM dataset are used for training and evaluating our model. The upgraded network’s average accuracy is around 8% higher than the YOLO-Tiny series network, according to the experimental data. The increased network’s detection speed in our hardware settings is at least 65 frames per second.

1. Introduction

The Internet of Things (IoT) is a large network comprising devices connected to it [1]. IoT is expected to embed various technologies into human daily life, such as using Edge computing, Fog computing and Cloud computing for data processing [2,3]. The IoT trend has created a sub-segment of the IoT market known as the Industrial Internet of Things (IIoT) [4,5], and computer vision has been applied in the IIoT to coordinate industrial production [6], such as the application of target recognition in remote sensing images [7], intelligent remote monitoring of production line [8], etc. IoT uses various sensors to generate and collect data [9]. Due to the inherent problems of sensors and/or environmental conditions, sensors may be unreliable [10]. Therefore, the IoT data have the characteristics of massive, complex, not stuck, and deep learning is suitable for processing this type of data [11,12]. Object detection is one of the most important and widely discussed topics in computer and machine vision [13,14]. In addition, object detection is the first step to extract the most informative pixels from the video sequence captured by the vision sensor of the Internet of Things [15]. With the development of machine vision, object detection technology based on deep learning, characterized by a simple and efficient network structure, has surpassed the traditional algorithm, greatly improves accuracy and efficiency, and gradually has become the mainstream algorithm at present. The type of objects that can be detected by the detection method is determined by the picture dataset in which the CNN was trained. Object detection will serve as a foundation for further picture and video operations, such as finding the object’s location in the image, determining the object’s analogy, and so on.
The CNN-based method has an edge in detecting objects in photos, owing to CNN’s ability to extract a large amount of semantic information from images. Single-class object detection, multi-class or universal object detection, static image object detection, video object detection, and so on are all examples of object detection. Object detection is divided into three stages: categorization, detection, and segmentation. The range, amount, scale modification, and external setting environment disturbance, however, make the object detection task difficult [16,17,18]. Many researchers have dedicated themselves to this field of research in order to overcome these challenges, and they have had a number of triumphs.
However, the present deep learning-based object detection algorithm is not friendly to small objects. The most important reason is that the capacity of extracted image features of little objects in an image is significantly smaller than that of massive items in the method of feature extraction, causing the CNN to pay more attention to the large objects in the image. In CNN, the loss of image information is mainly caused by downsampling. The explanations for substantial information loss are stated as follows in the approach of picture knowledge within the convolutional neural network:
  • Too large downsampling rate.
    Assume that the current small object size is 15 × 15. In general object detection, the convolution downsampling rate is 16, so in the feature map, a too large downsampling rate makes small objects unable to occupy even one pixel.
  • Too large receptive field.
    In the convolution network, the receptive field of the feature points on the feature map is much larger than the downsampling rate, resulting in fewer features occupied by small objects in a point on the feature map, which will contain a large number of features of the surrounding area, thus affecting its detection results.
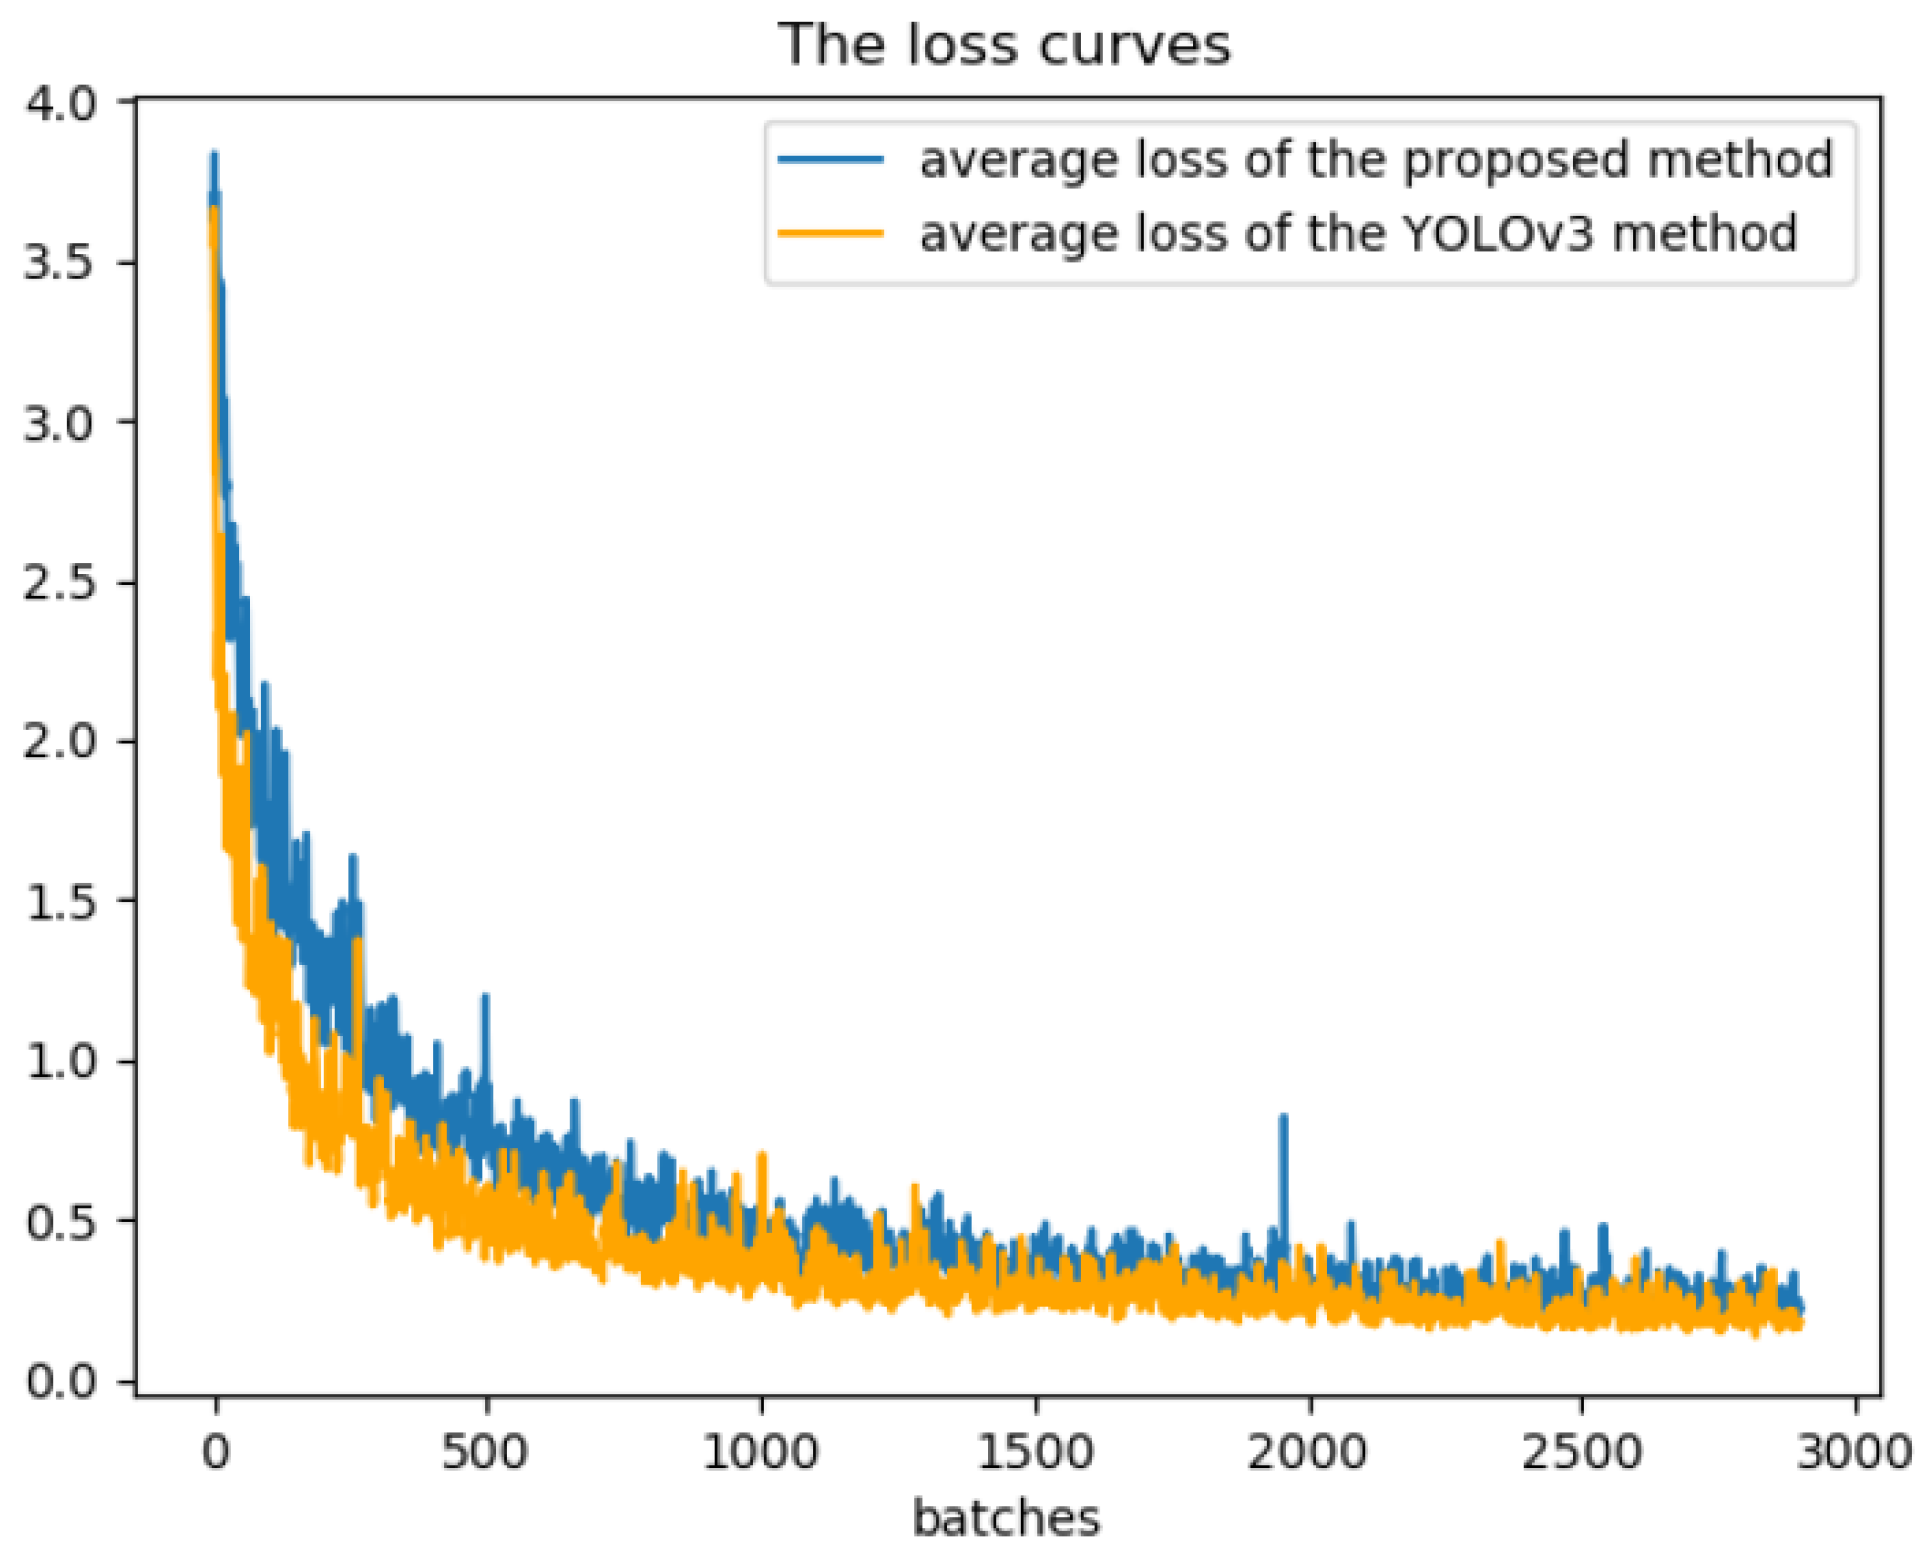
  • Contradiction between semantics and space.
    The backbones of current detection algorithms are mostly from top to bottom, and the deep and shallow feature maps do not achieve a better balance between semantics and space. For example, the YOLO algorithm can meet the real-time requirements, but the detection accuracy is low.
  • Tradeoff between detection speed and accuracy.
    Faster detection speed sometimes implies that the scale of the network model is small, resulting in light-weight feature extraction. However, the larger model improves the recognition accuracy, but it wants high computing power and so the detection speed is slow, which cannot meet the amount of desired time of the instrumentation with very little computing power in IoT.
To optimize the above four issues, we propose an Intelligent Fast Detection for Real-time Image Information in Industrial IoT (IFD). The innovation points are as follows:
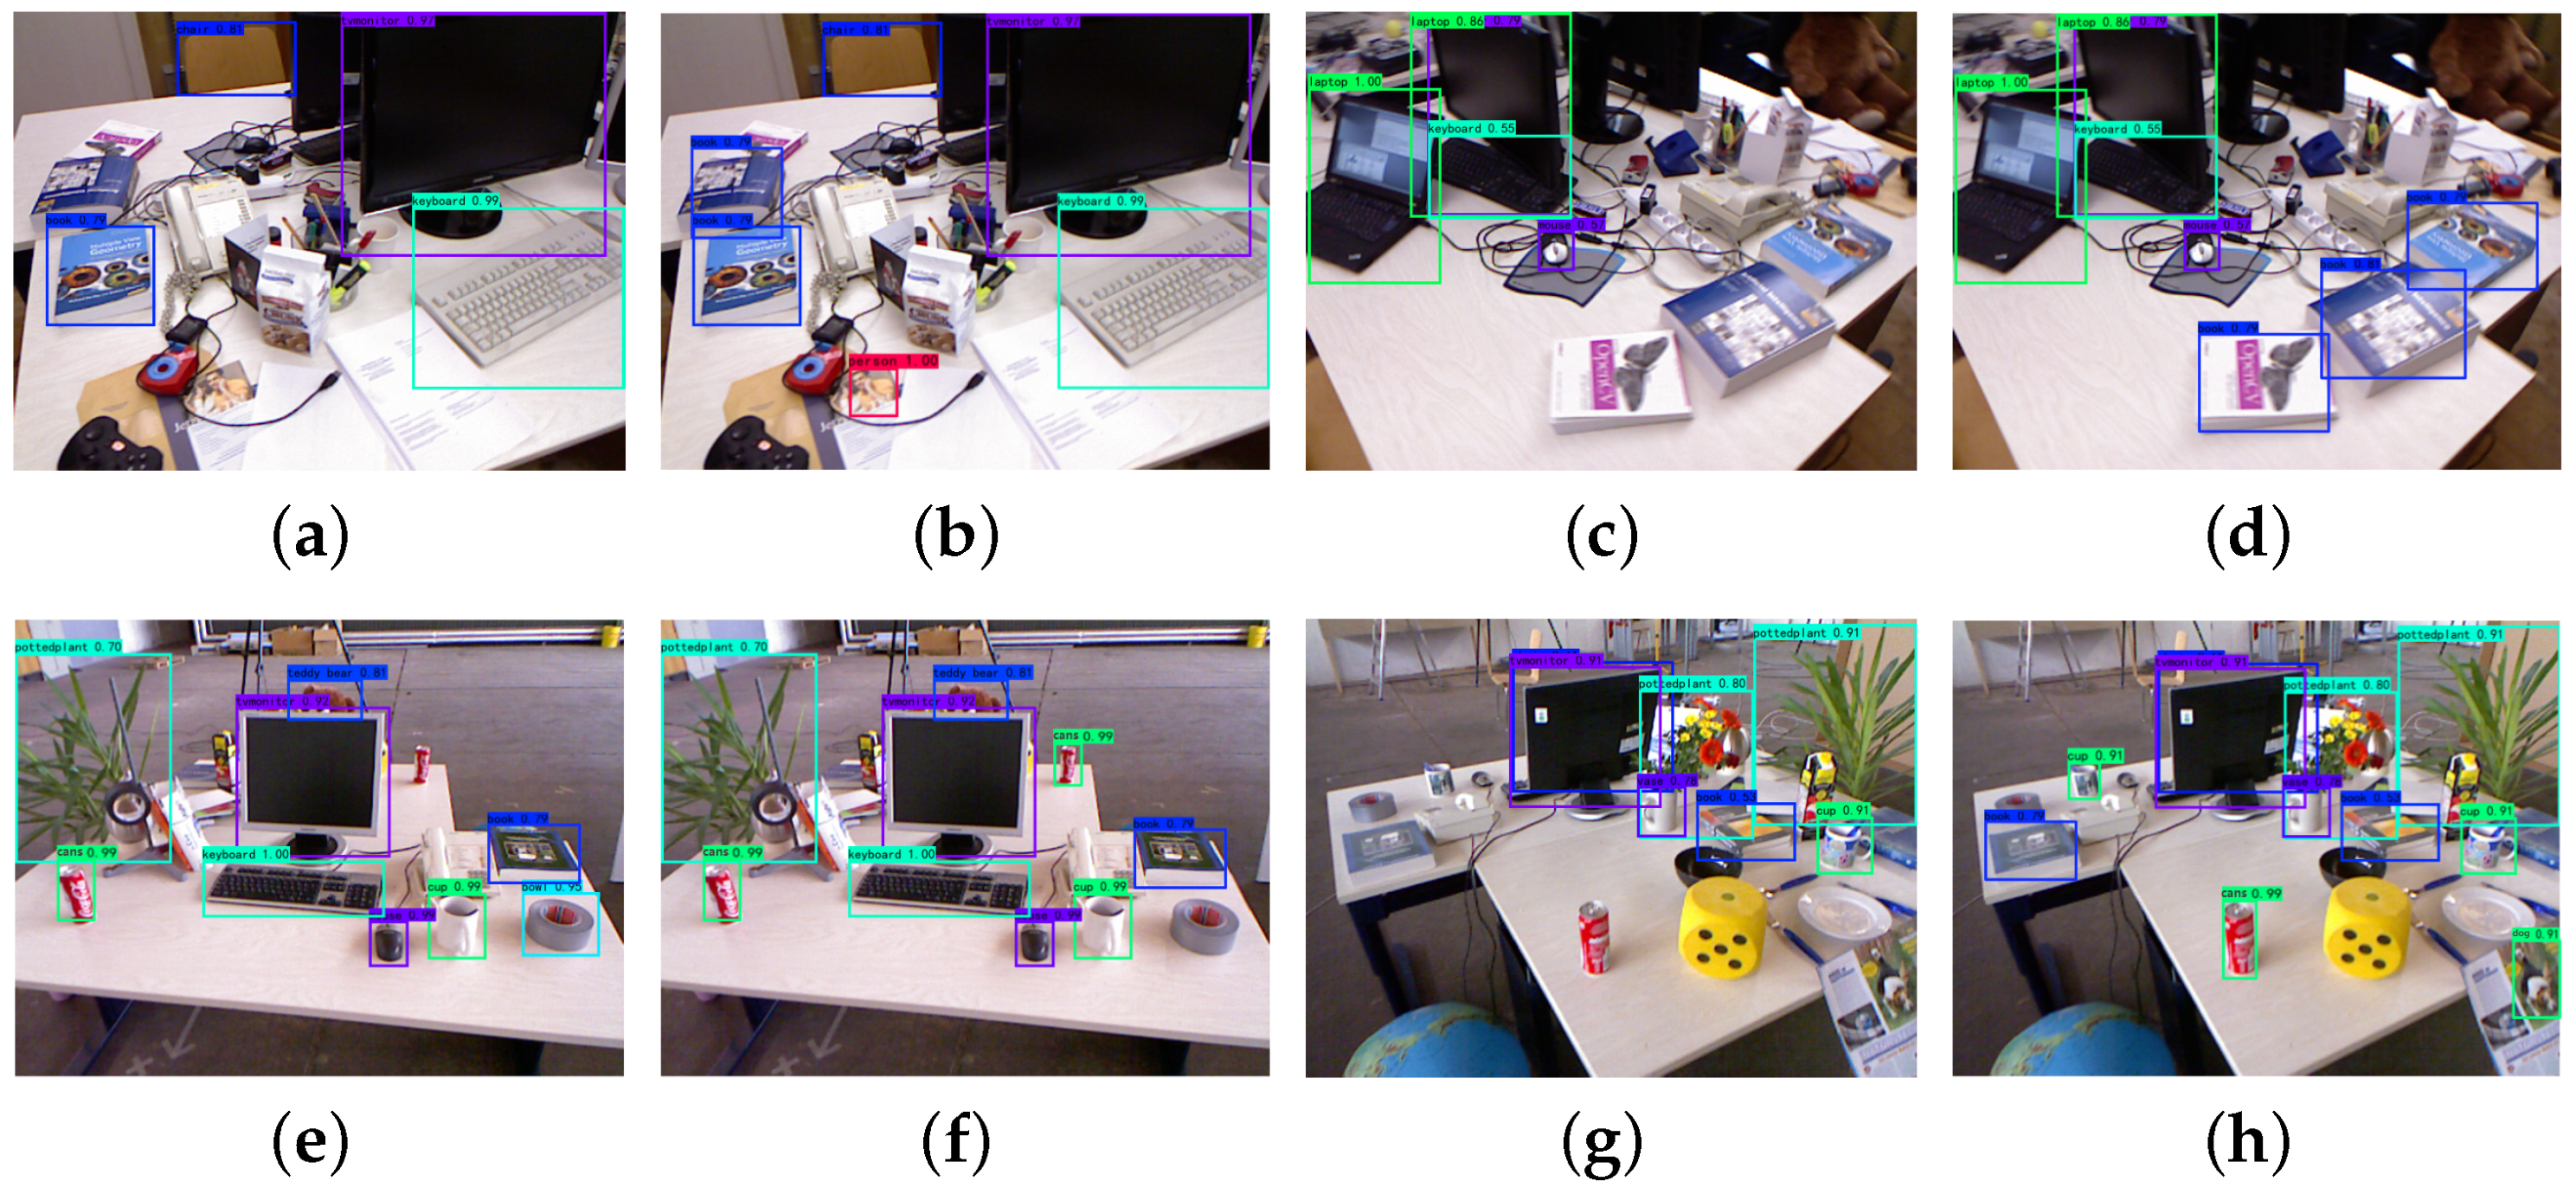
  • An Intelligent Fast Detection for Real-time Image Information in industrial IoT is proposed, which adopts the improved YOLOv3-tiny framework and can meet the detection speed necessities of a real-time system and effectively improve the detection accuracy.
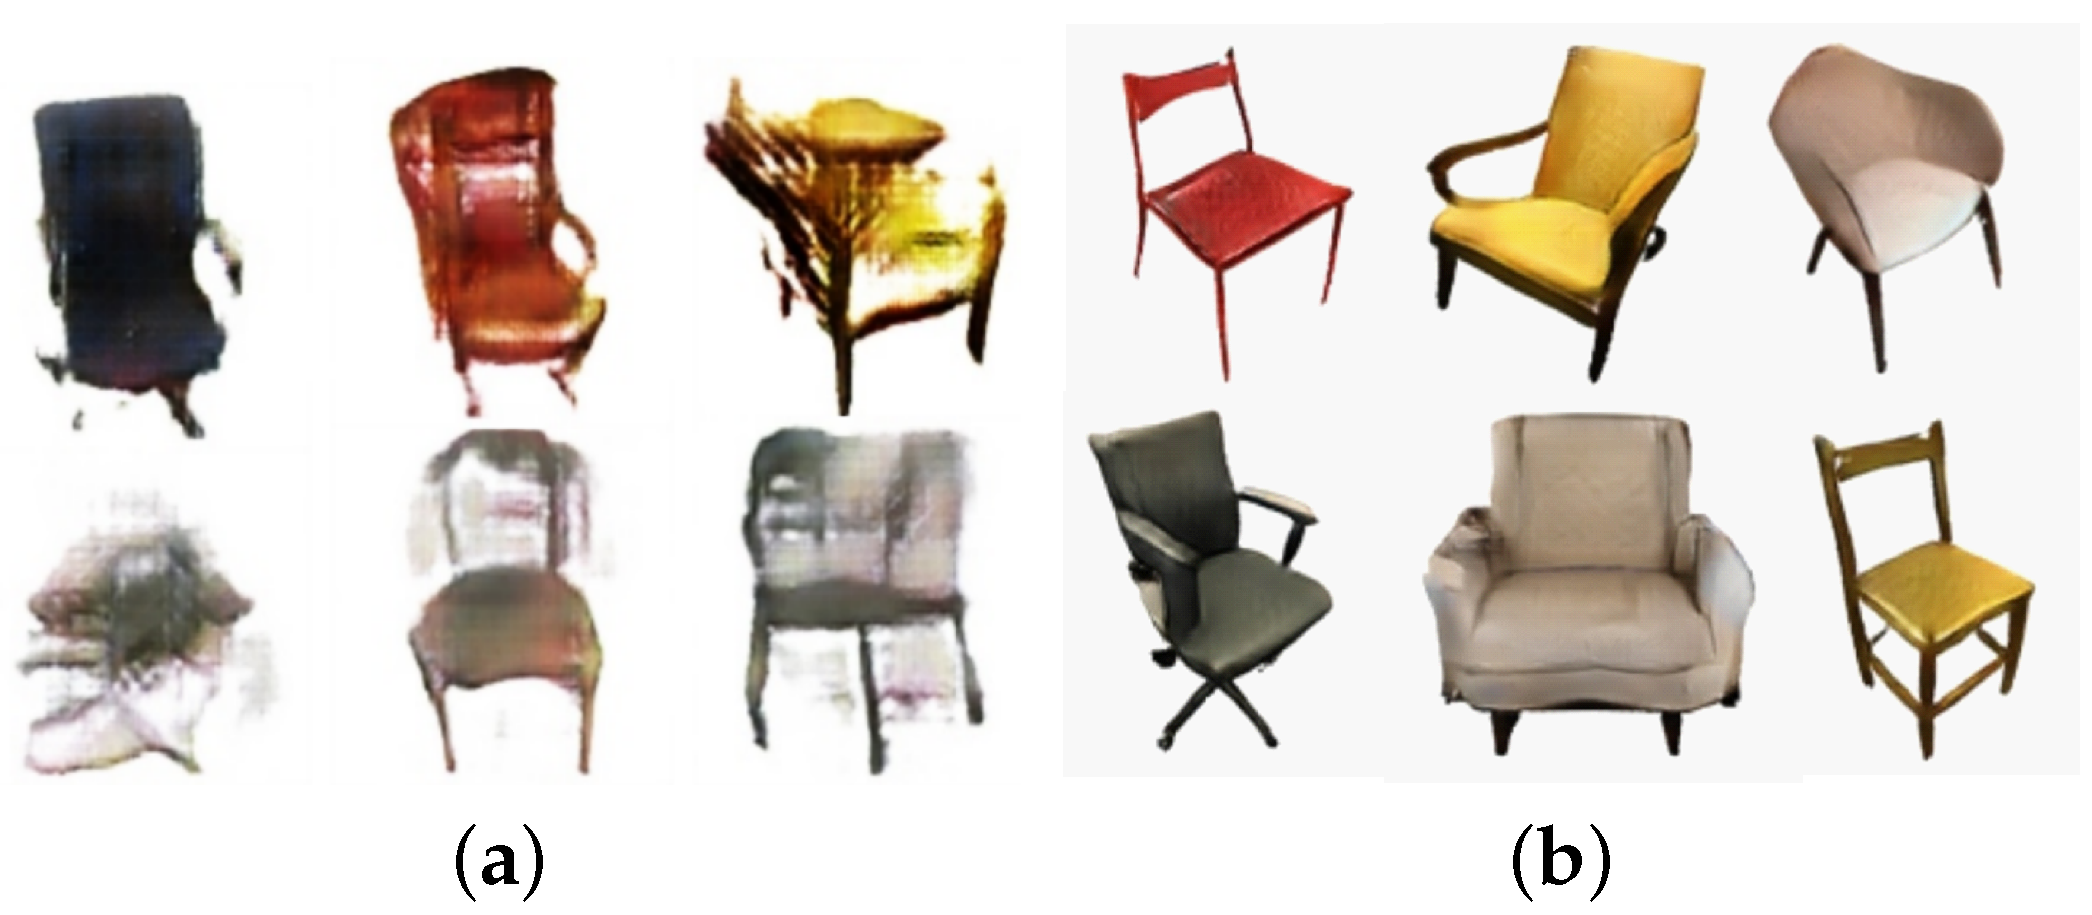
  • We distinguish whether an object belongs to a smaller object according to the number of pixels occupied by the object in the image, and then, we use WANG to expand the dataset of smaller objects. We expanded the amount of smaller objects in the dataset but reduce the larger objects. This is to reduce the preference for larger objects in network training.
  • The k-means++ clustering algorithm is employed to obtain the predetermined boundary box to enhance the accuracy of the classification results.
Among the many algorithm frameworks based on CNN, the YOLO framework is famous for its fast detection speed [19]. In the evolution of the Yolo algorithm series, the most important change between versions is the change of backbone. You can choose the version of YOLO suitable for the actual environment by replacing the backbone of YOLO, so its flexibility is suitable for industrial production. In this paper, the main reasons why our IFD model adopts the YOLOv3 family are as follows: (1) YOLOv3 does not pursue speed so much but rather pursues its performance on the basis of maintaining real-time performance. (2) Compared with the fact that there is no residual structure in the backbone (Dark-net19) of YOLOv2, YOLOv3’s Dark-net53 can achieve the same effect as resnet-152. (3) YOLOv2 performs tensor size transformation (image size transformation) in the forward propagation process through pooling operation, which will lead to a serious loss of image information in the forward propagation process. However, YOLOv3 uses convolution, which can extract more abundant image information than pooling operation.
The rest of this text is organized as follows: Section 2 introduces the work conducted by previous researchers. Section 3 details an outline of our own work. Firstly, the mechanism of VaryBlock and also the methodology of group action VaryBlock and YOLO-tiny square measure are introduced. Then, we introduce a way to extend the dataset to complement the linguistics information of smaller objects. Afterwards, we introduce the utilization of k-means++ to come up with a planned bounding box. Section 4 provides the experimental results to verify the period of time accuracy of our planned methodology in object detection. Finally, a short conclusion and future analysis square measure are given in Section 5.

2. Related Work

There are ways to assist non-deep learning and ways to support deep learning in the area of image feature extraction, and many analysts have spent a lot of time researching these two approaches. A major drawback of the approach of training a convolutional neural network is the difficulty of extracting a large amount of visual feature data by increasing the network’s structure, and a secondary drawback is the difficulty of making the network detection faster to meet time constraints. Speed and precision appear to have always been two competing concepts. We compare the current popular object detection algorithms and summarize their main ideas, as shown in Table 1.

2.1. Non-CNN Feature Extraction

SIFT (Distinctive Image Features from Scale-Invariant Keypoints) [18] and HOG (Histograms of Oriented Gradients for Human Detection) [25] are feature extraction algorithms, but they do not use the method of training convolution neural network to optimize image feature extraction. BoVW (Bags-of-Visual-Words) [26] and DPM (Deformable Part Model) [27] based on HOG make full use of artificial geometric features to obtain more of a feature map. However, SIFT, HOG, BoVW and DPM have the disadvantages of low real-time detection and insufficient image feature extraction.

2.2. CNN-Based Feature Extraction

We primarily provide the R-CNN [28] algorithm series and the YOLO [29] algorithm family in the related work to demonstrate the efforts and inadequacies of relevant researchers in order to increase target detection accuracy while taking real-time performance into account. At the same time, it demonstrates that one of the primary causes of detection accuracy loss is downsampling. When it comes to extracting image information, the convolution neural network provides a lot of advantages. Many scientists are working to improve the topology of the convolutional network used to extract picture characteristics. The R-CNN uses a selective search strategy to find anchor boxes before utilizing the pre-trained model to extract characteristics from each one. Fast R-CNN [30] extracts R-CNN image features using a CNN network; then, it uses the ROI pooling layer to produce fixed-length features for each anchor frame. The selective search of the Fast R-CNN network is converted into an RPN (Region Proposal Network) network by Faster R-CNN [31], although RPN is a rough network that does not like small objects. The mask branch is added to the Faster R-CNN network layer structure by Mask R-CNN [32]. In the mask branch, a convolutional network is used. It creates masks using the ROI classifier’s positive region as an input, resulting in high precision but poor speed.
Redmon et al. [29] propose the YOLO (You Only Look Once) framework. Although the detection accuracy could not reach the detection effect of Faster R-CNN, the detection speed reaches 50 frames per second (FPS). A more efficient Darknet-19 is used as the backbone network of YOLOv2 [33]. These measures have effectively improved the detection accuracy of YOLOv2. YOLOv3 [34] absorbs the idea of FPN (Feature Pyramid Network) [35] and performs detection tasks on three feature maps with different scales at three different locations in the network. YOLOv4 [36] is better than YOLOv3 in many indicators. To reduce the loss of image feature information, YOLOv4 introduces PAN-Net (Efficient and Accurate Arbitrary-Shaped Text Detection with Pixel Aggregation Network) [37] to make full use of feature fusion. Based on the YOLOv4 backbone, Chai et al. [38] studied the factors affecting the receptive field, used ConvDV to replace ordinary convolution, and increased the number of short circuits and stacks, which increases the receptive field.
In addition, in order to make the YOLO algorithm have a smaller volume and higher real-time performance, some small versions of the YOLO algorithm are proposed such as YOLOv3-tiny [39], YOLOv4-Tiny [40], YOLOv5 [41,42], PP-YOLO [43] based on YOLOv3, PP-YOLOv2 [44], YOLOX [45], YOLOr [46], YOLOv6 (there is no paper), and YOLOv7 [47]. The above small YOLO algorithm series means that the smaller the volume, the faster the detection speed, and it also means that the detection accuracy is lower, while the highest detection accuracy among them is 50.3%.
By enhancing the network structure, all of the aforementioned object identification algorithms for convolutional neural networks aim to increase detection speed and accuracy. Therefore, we come to a conclusion that faster image detection speed often means a smaller framework, but CNN with a small model does not extract enough image features, resulting in a decline in detection accuracy. In addition, high detection accuracy requires a large volume model, but it cannot meet the real-time performance. Therefore, we try to improve the accuracy by improving YOLOv3-tiny while ensuring real-time detection. We propose an Intelligent Fast Detection for Real-time Image Information in Industrial IoT (IFD) that can be used in the industrial Internet of Things to optimize the following two problems:
  • Small object detection.
    Downsampling and convolution operations in today’s object detection algorithms result in a significant loss of image information, which has a significant influence on the recognition of objects of varied scales, particularly small objects.
  • The weakness of the real-time detecting system’s accuracy.
    To fulfill the real-time requirements for detection speed, the initial network must be simplified, which results in a large reduction in picture information extracted by the network, and whether the network can extract adequate image information directly influences detection accuracy.
IFD adopts the improved YOLO-Tiny algorithm and integrates the VaryBlock module. The designed VaryBlock module is skillfully added to the YOLO-Tiny series network to reduce the loss of image information in downsampling operations. The upgraded network’s detection accuracy outperforms the YOLO-Tiny original network by roughly 8% without significantly slowing down the speed of detection. The experimental results also show that the enhanced network is capable of a more accurate detection and classification of some small objects.

3. Our Proposed Object Detection Algorithm Combined with Varyblock

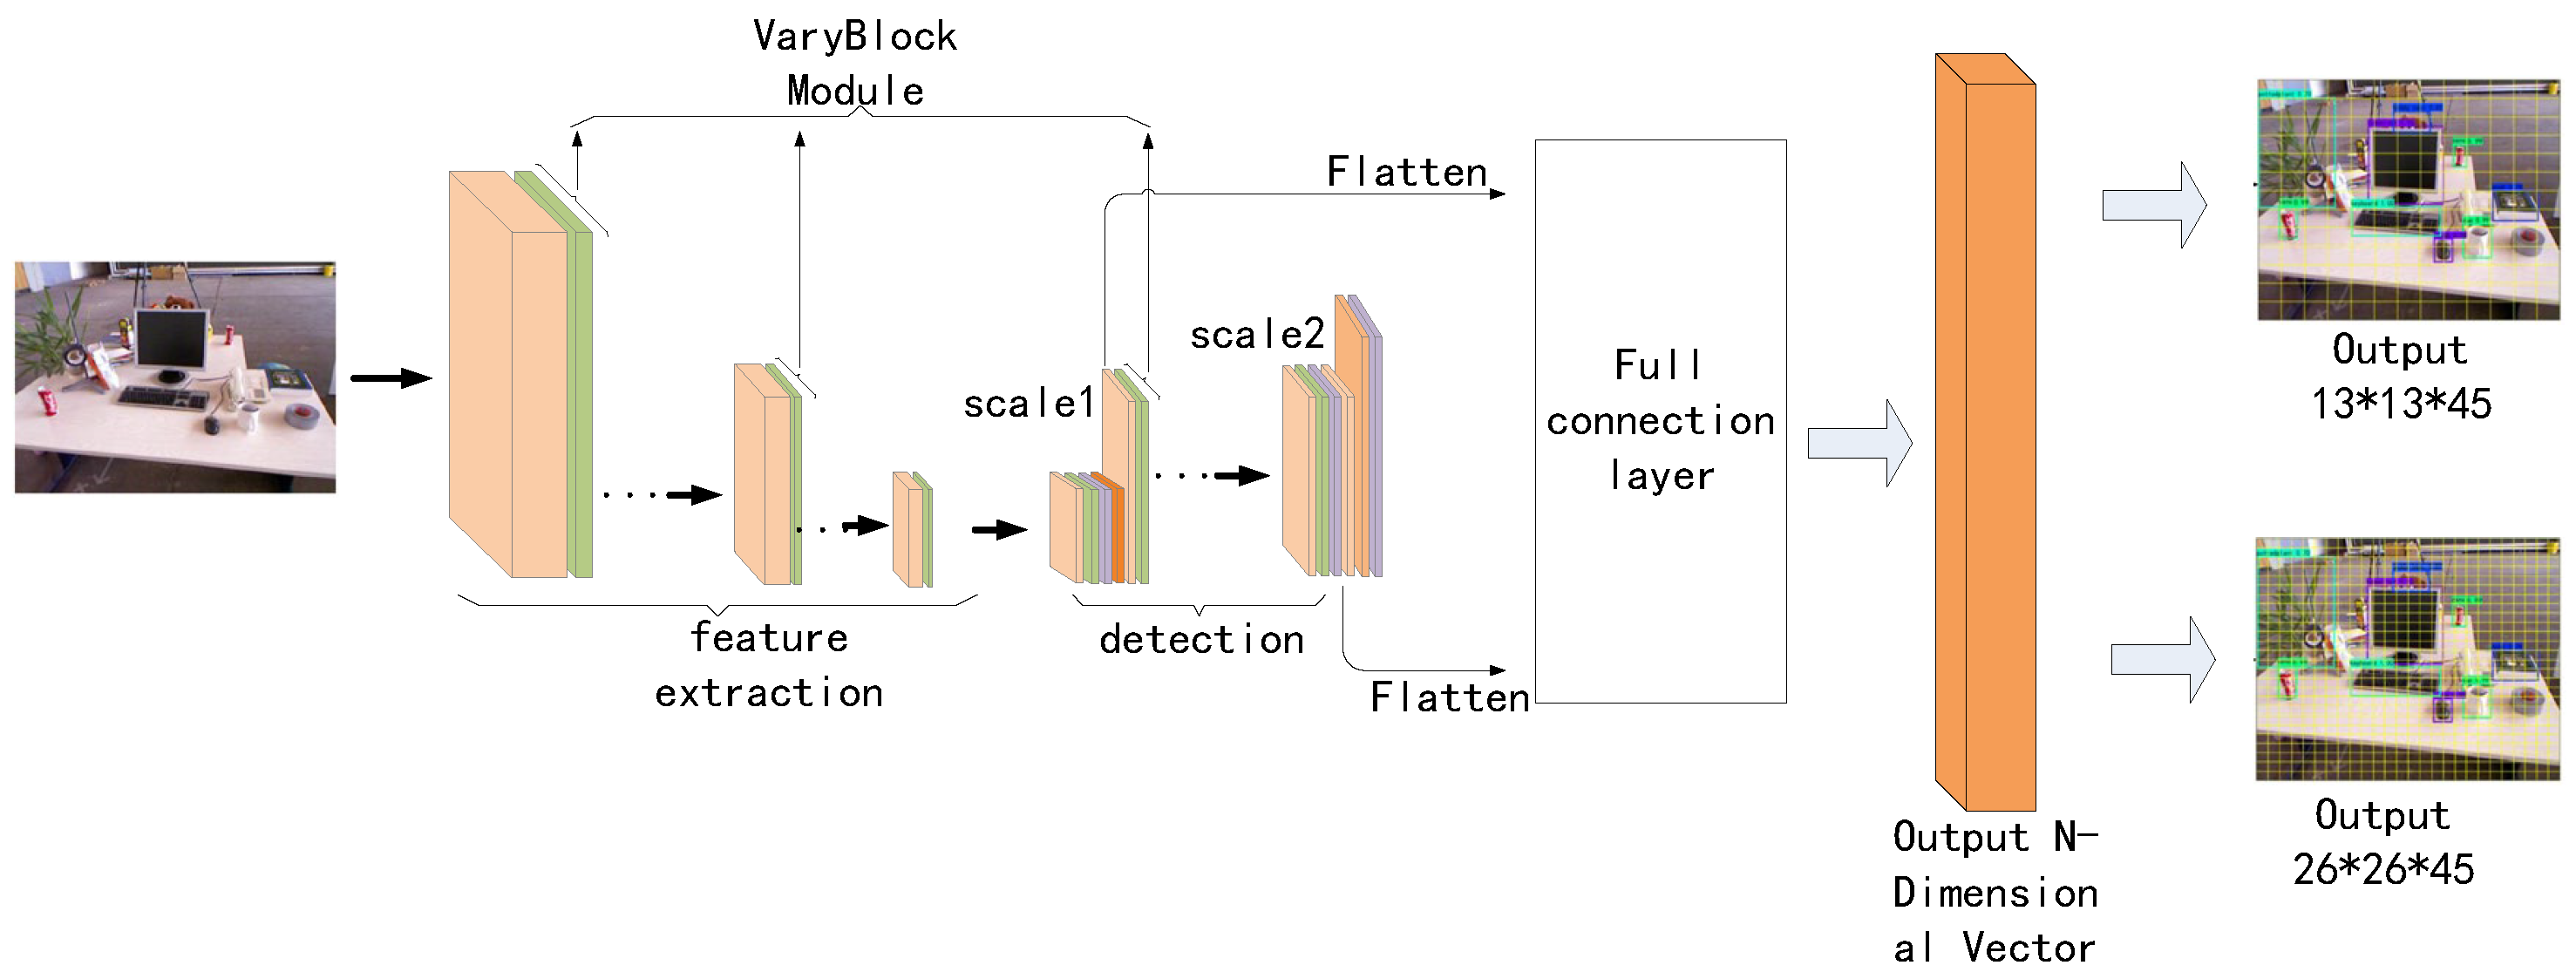
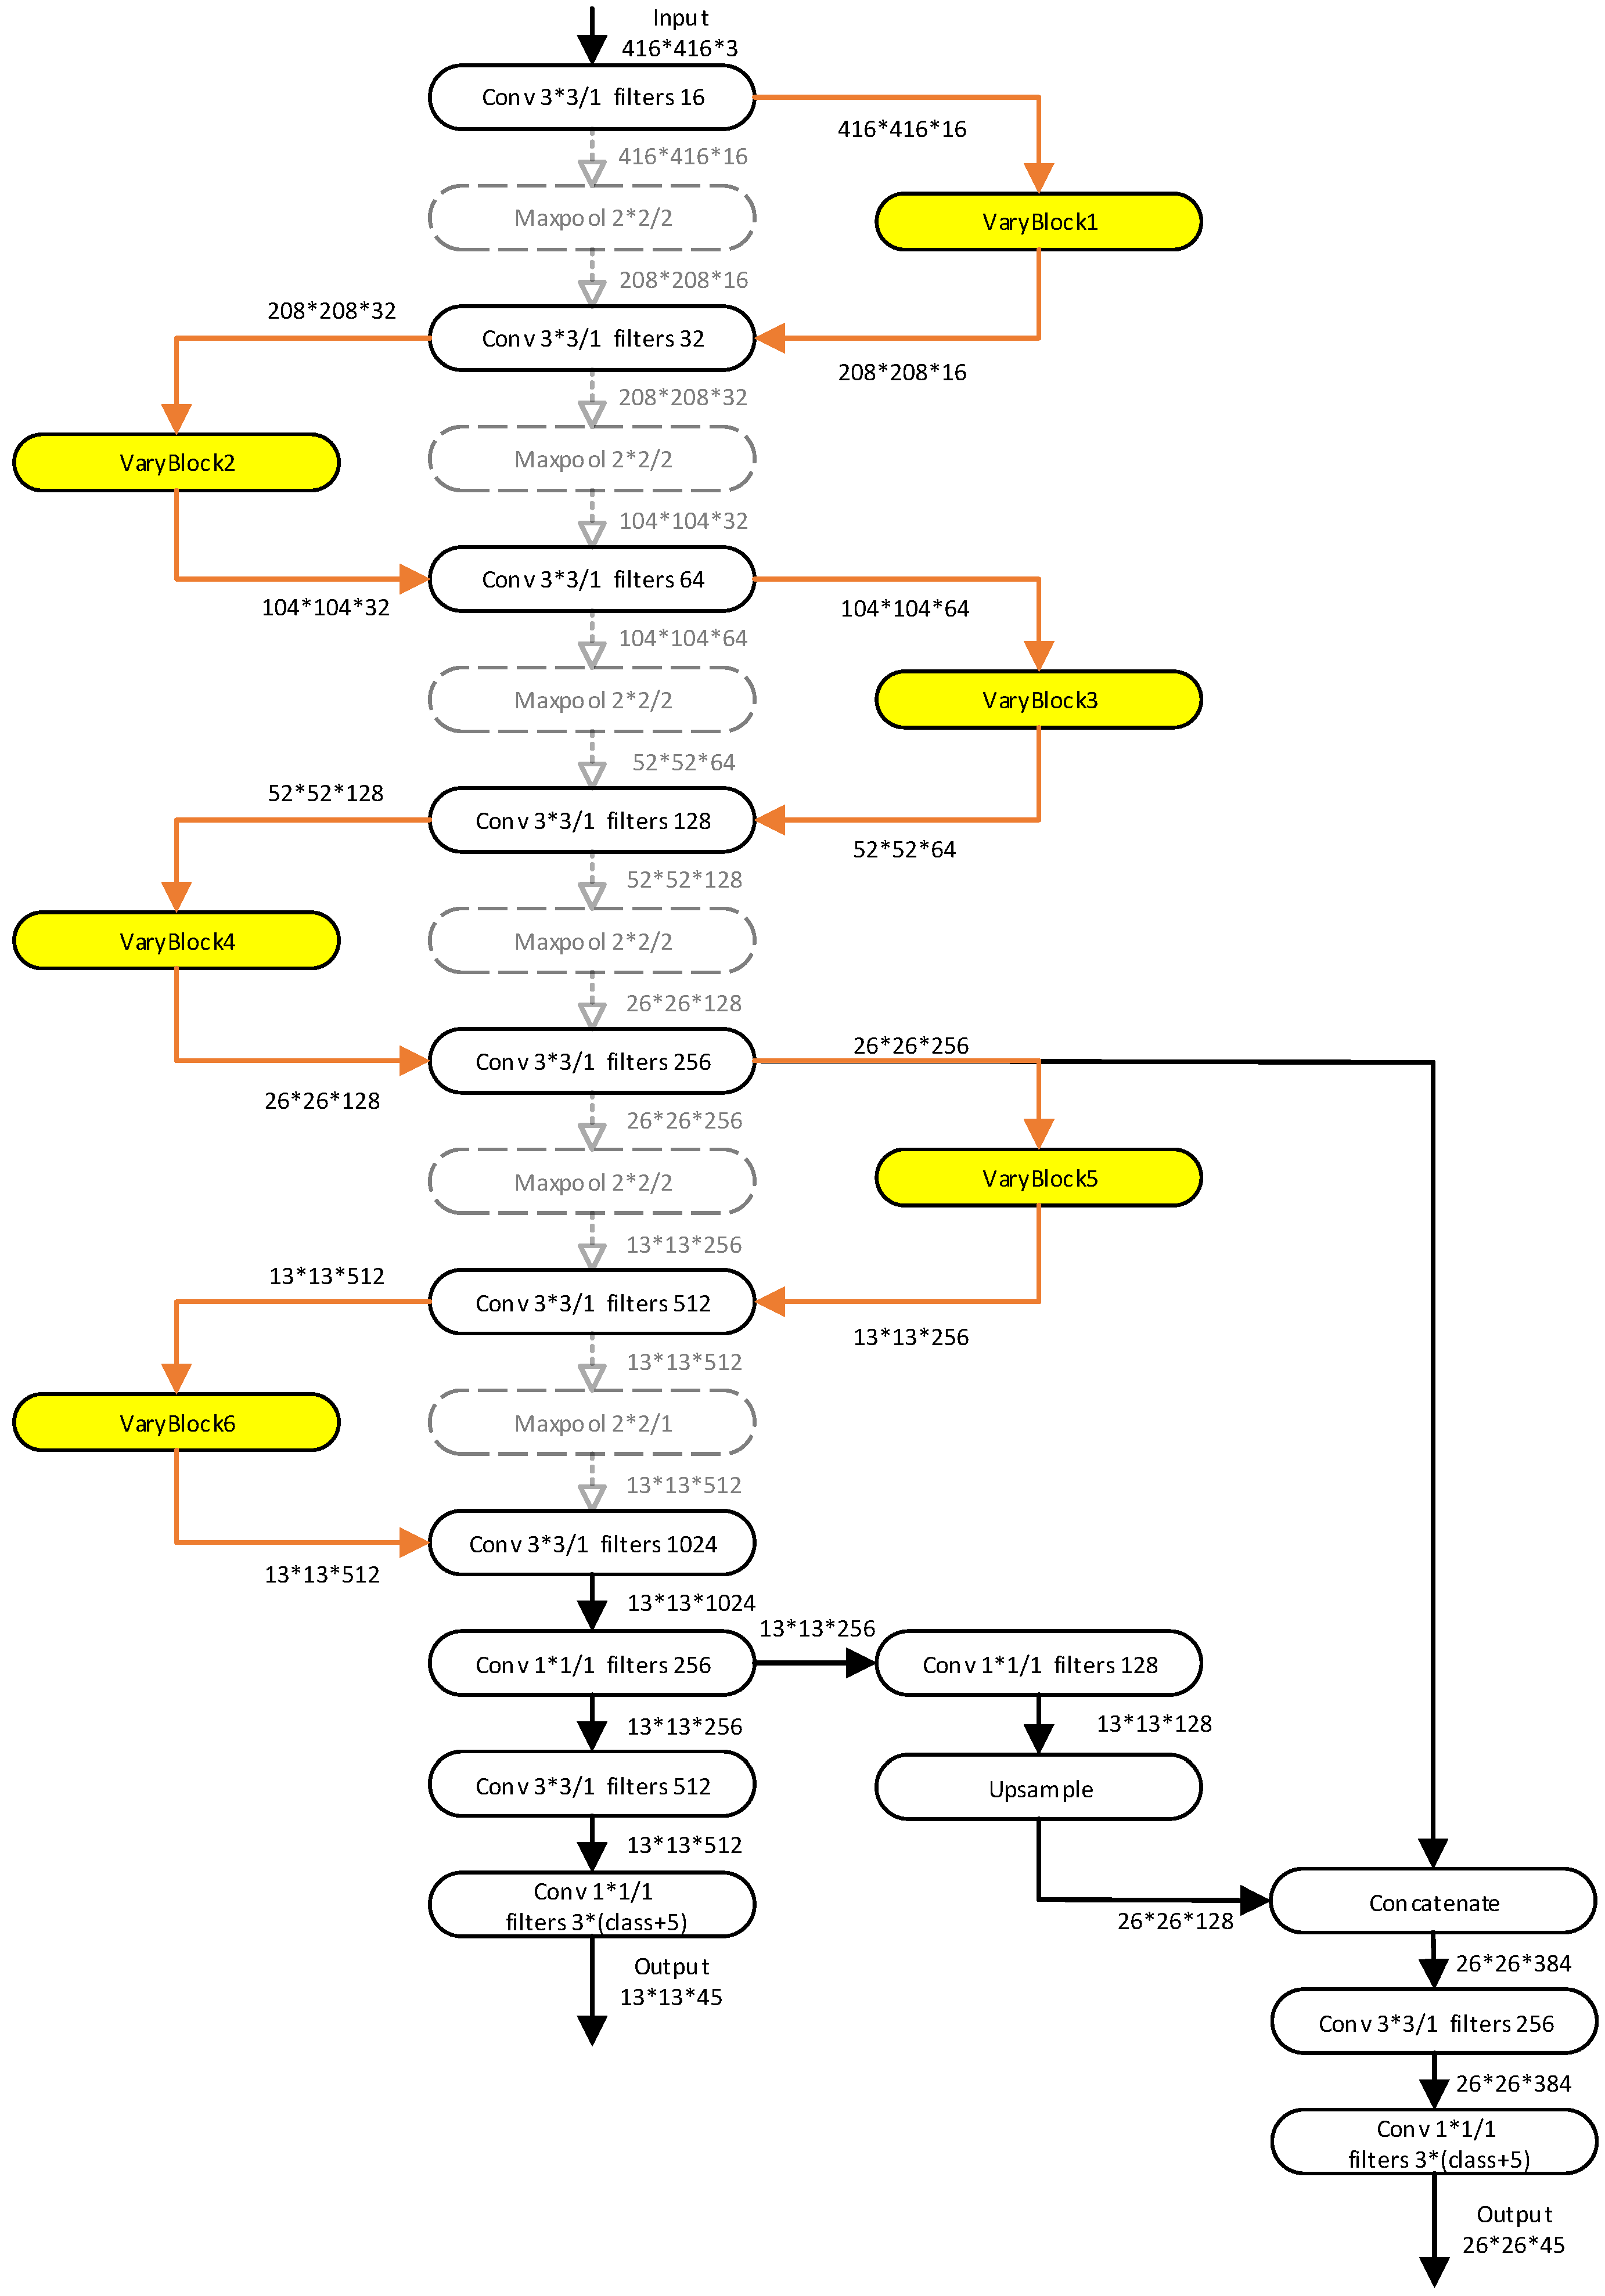
3.1. Overall Architecture

YOLO-Tiny treats object detection tasks as regression problems and uses the convolutional neural network to predict the object. YOLO-Tiny can simultaneously have a comprehensive understanding of the input image and all of the objects in the image as an object detector with sampling and stitching on the feature map as well as be able to complete end-to-end training. It has become one of the standard object detection schemes in the industry. However, it still has some shortcomings. It is still unable to prevent the loss of information due to a downsampling operation. Although an attempt is made to use the up-sample layer to obtain the information of the previous feature map as much as possible, there is no multilayer feature fusion in YOLO-Tiny. On the other hand, YOLO only analyzes the final feature map, resulting in poor detection quality of small objects, and it is difficult to distinguish when multiple objects are in the same grid cell.
The YOLO-Tiny series network is used as the backbone network in this paper’s proposed object identification approach, which integrates the VaryBlock module into the network structure to make up for the lack of downsampling information. As a result, the aforementioned drawbacks are addressed.
Figure 1 shows the overall flow chart of the improved YOLOv3-Tiny object detection algorithm in this paper. First, input the object image. The input image is then divided into grids of equal size, each grid containing two different scales, each with two different size boundary boxes. By recognizing the object in the bounding box, the location information and category information of the object can be acquired. Finally, the object’s category and coordinates from the original image are determined.

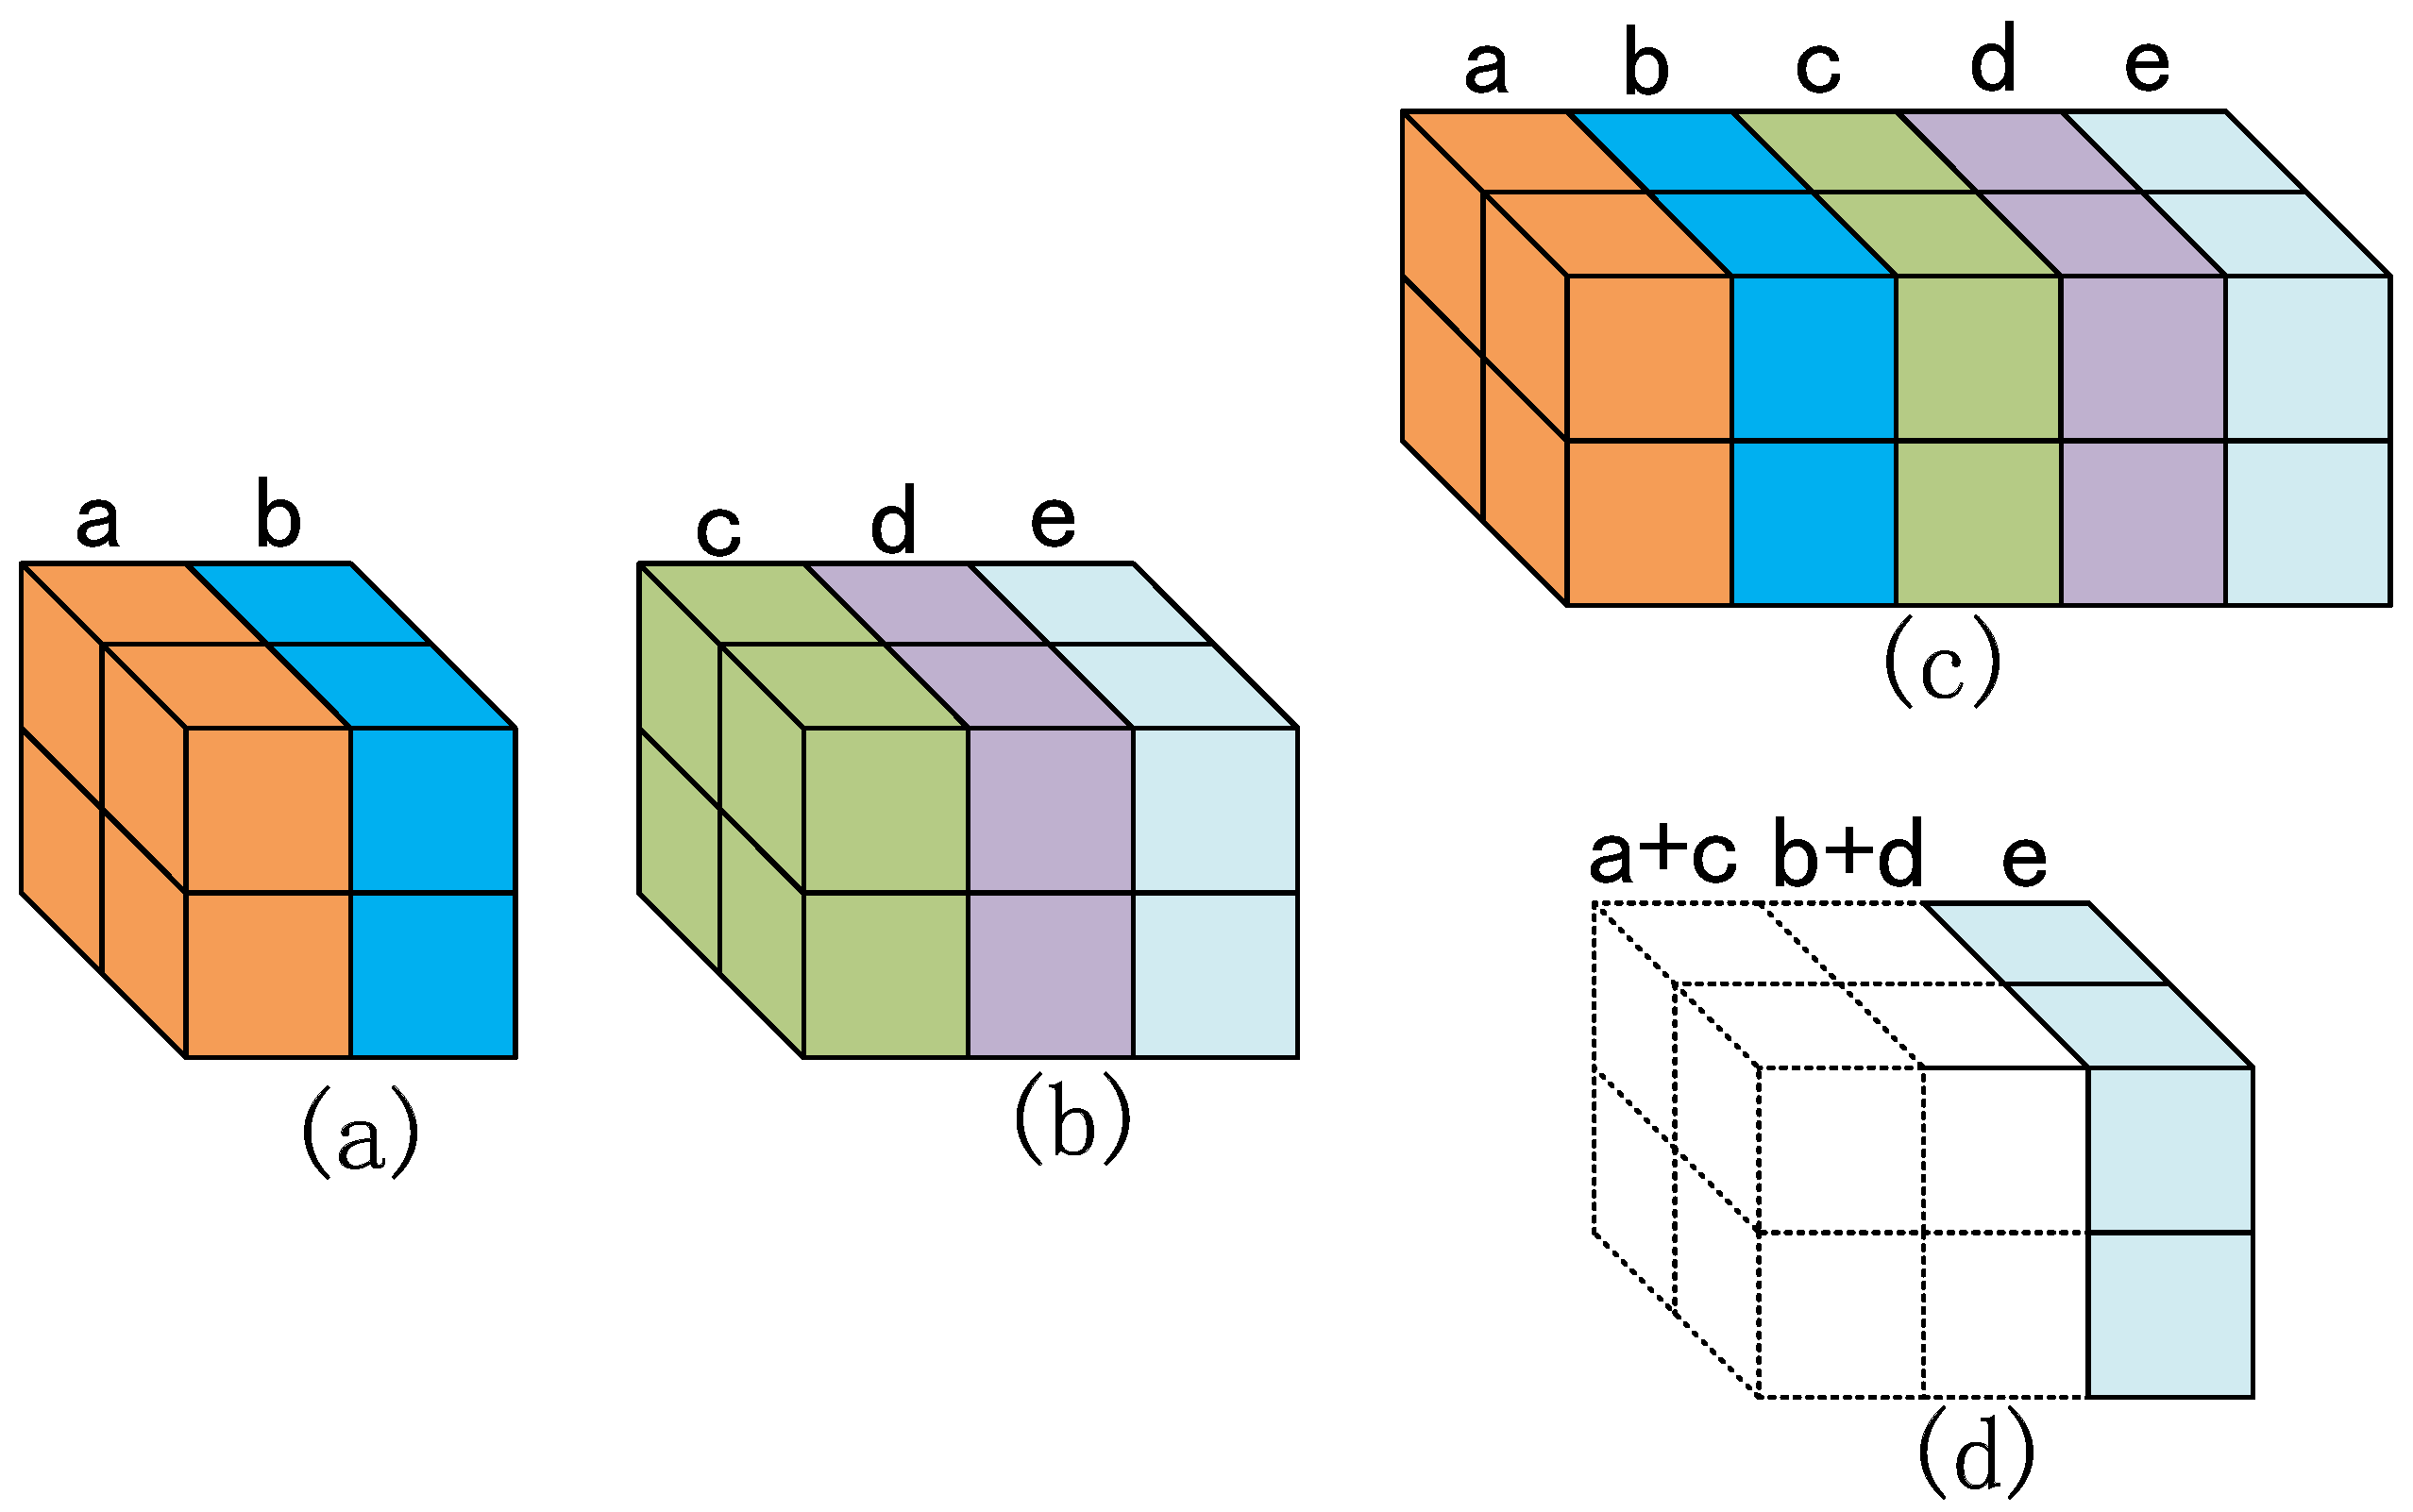
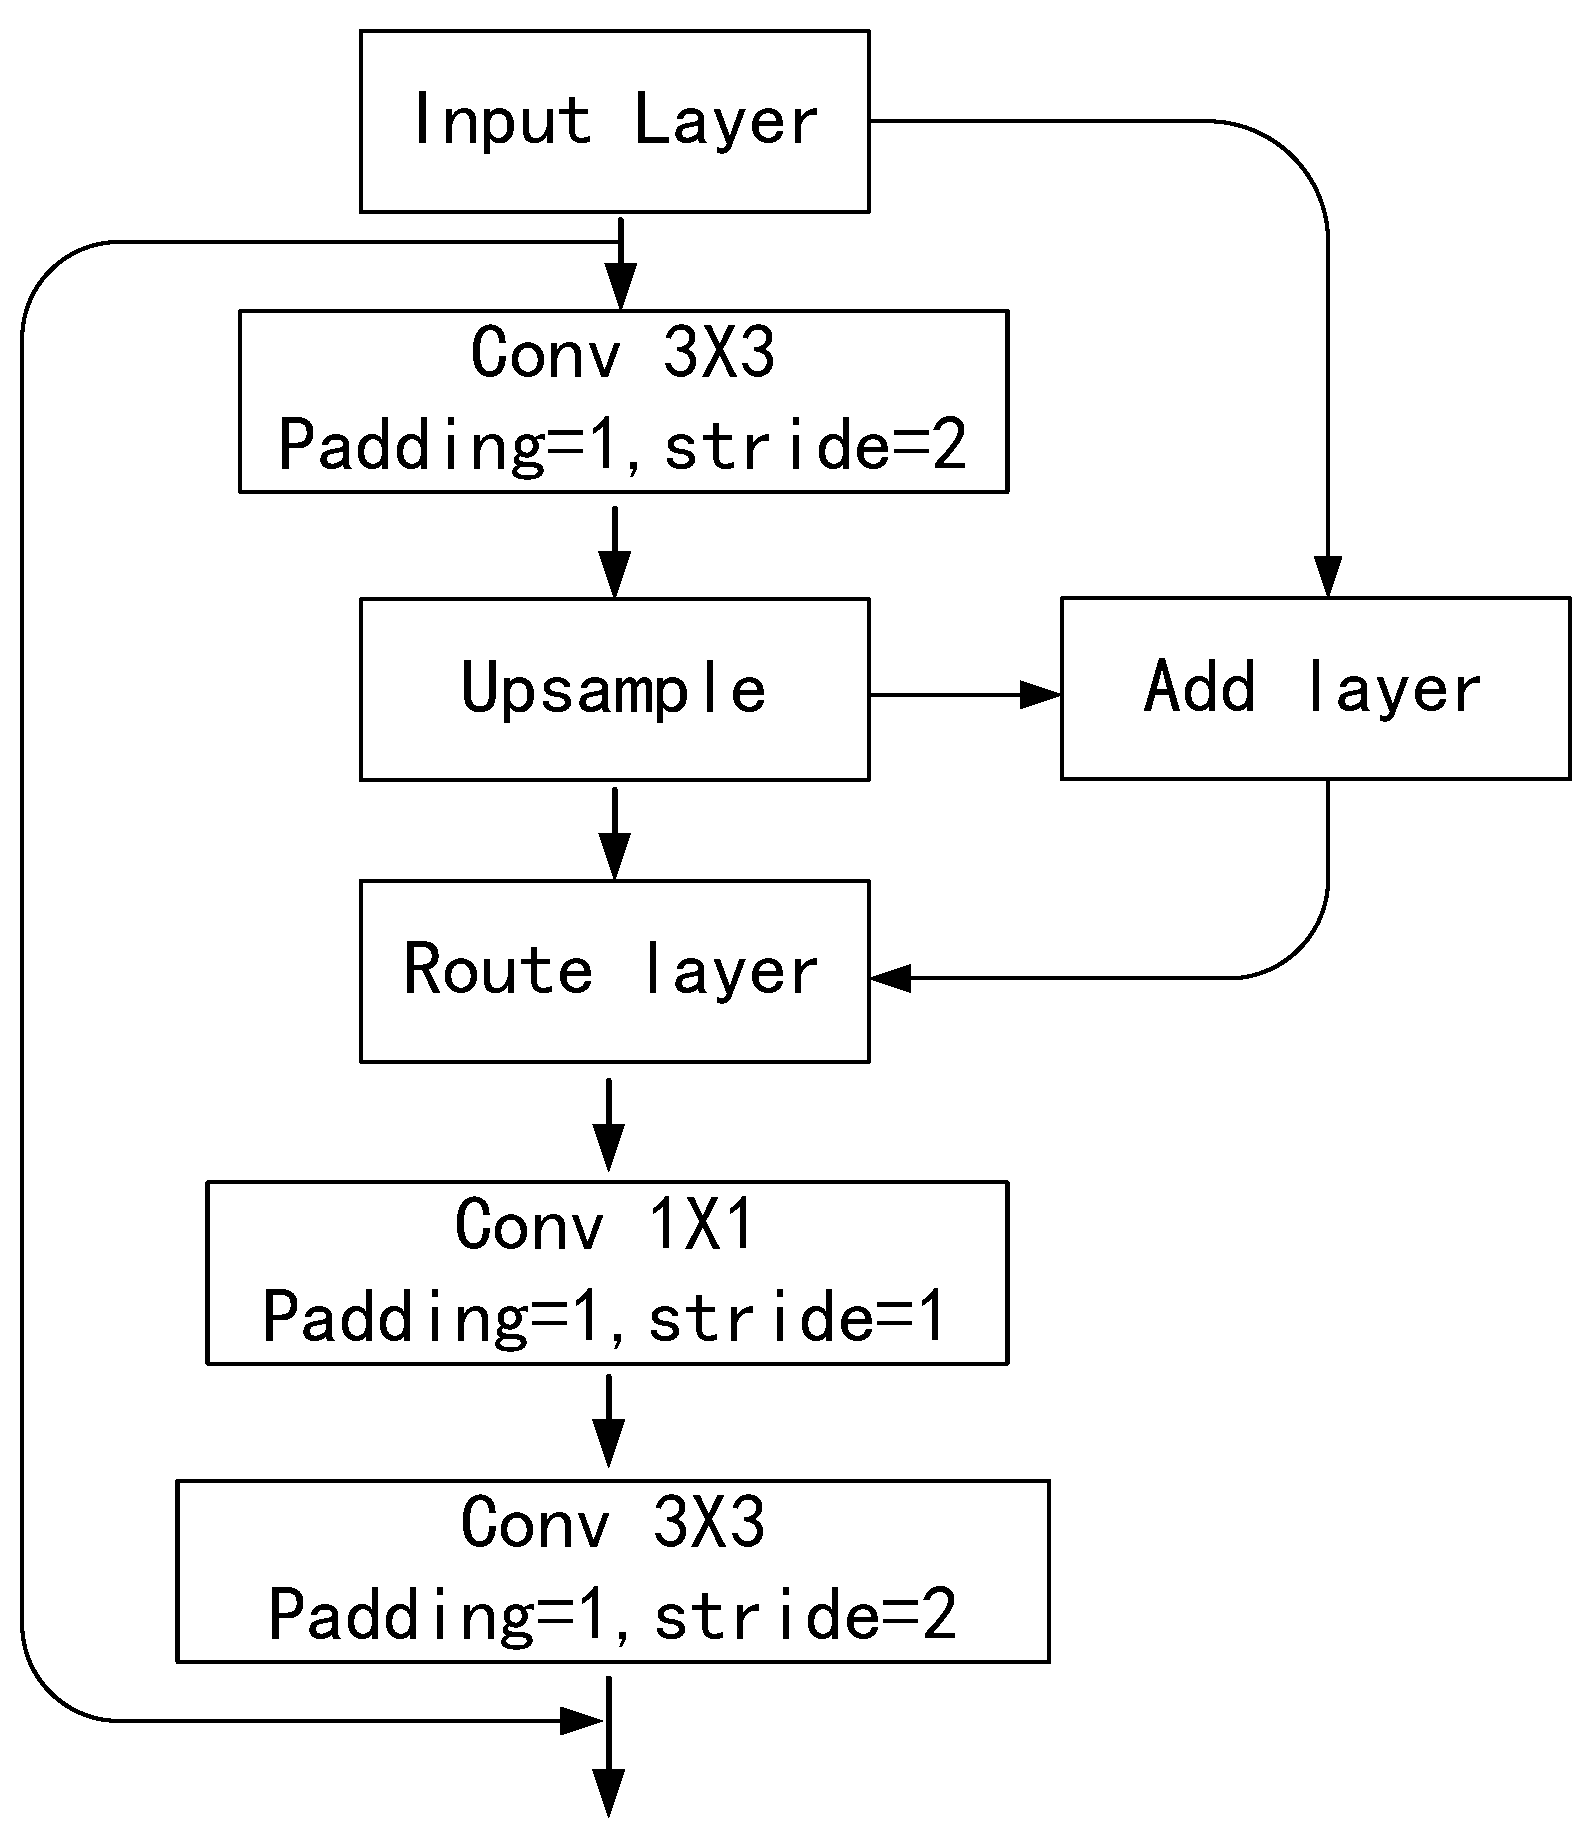
3.2. YOLO-Tiny Integrated VaryBlock

YOLO has a detection speed of 45 images per second. The speed advantage makes it the leader of end-to-end object detection networks. YOLO’s ideas different from other object detection frameworks are as follows: first, it uses the convolution neural network to extract a huge number of features of images which are not overlapping, and therefore, the fixed-size feature map is obtained. If the coordinates of the center point of an object’s ground truth fall on a grid, it divides the input image into S × S grids that are in charge of detecting and anticipating the object. It is the advantage of acceptable and real-time detection speed, and the detection accuracy and boundary recall rate can meet the requirements. Although it loses a certain accuracy, it greatly improves the detection speed. YOLO-Tiny series methods are designed based on a complete YOLO series network. They are realized by suppressing the network of the complete YOLO series network. YOLOv3-Tiny is an outstanding network of the YOLO-Tiny series, which is very fast and can even perform object detection tasks on mobile phones. The YOLOv3-Tiny network has only 24 layers, which is 86 layers less than that of YOLOv3. The convolution layer with a step size of 2 in YOLOv3 is replaced by the pooling layer in YOLOv3-Tiny. In addition, YOLOv3-Tiny has only two detection scales, which are 13 × 13 and 26 × 26, each of which should have three boundary boxes with different scales. It uses a separate CNN framework to attain end-to-end object detection. Based on the original version (the gray and black part in Figure 2), the network structure is compressed based on time consideration; only the backbone network is retained. Therefore, the detection speed of YOLOv3-Tiny is incredibly quick, and so it is very appropriate for situations with high real-time requirements.
To reduce the loss of image information, there have been some studies on the problem of partial information loss caused by a convolution operation. The paper [48] adds context information to the convolutional network through the deconvolution layer and uses the context information to make the network learn features of different depths. GC-YOLOv3 [49] realizes trainable semantic fusion between the feature extraction network and FPN [35]. In order to reduce the loss of image data and obtain more semantic information in the image, Joseph Redmon et al. introduced the upsample layer into YOLOv3 [34] to obtain higher positioning and recognition accuracy of targets in an image than YOLOv2 [33]. Inspired by the methods of deconvolution and upsampling in the image processing, we tend to propose an economical and stronger VaryBlock module for this drawback, which might effectively make amends for some image data loss caused by downsampling. The improved YOLOv3-Tiny object detection algorithm described in this paper adds the VaryBlock module to the network structure.
The problem of tiny object detection is actually because of the dearth of original image information, and also the same drawback exists in object detection of different scales. With the deepening of the network, several potential feature information or details usually disappear, which include a huge impact on the results of object detection. Additionally, downsampling and convolution operations can cause the loss of some image information, which is able to eventually have an effect on the detection results of targets of assorted sizes.
Fusing the features of the collected image is a common methodology to cut back semantic loss in downsampling. Resnet [50], FPN [35], etc. use element-wise add fusion features. DenseNet (Densely Connected Convolutional Networks) [51] uses concatenate to fuse features. The add and concatenate techniques have their advantages and disadvantages in feature fusion. In Figure 3, the add technique initially ensures that the number of feature maps does not change, but rather that each feature map represents the outcome of combining the previous feature maps. The concatenate technique will increase feature maps; however, the data in every feature map do not have any amendment.
We combine the residual mechanism of Resnet and use deconvolution as the downsampling method to organically combine the add and concatenate feature fusion methods to form the VaryBlock module.
The main structure of VaryBlock is composed of a convolution layer and feature fusion layer. In order to obtain the valuable information in the image and remove the interference of worthless information to the fitting network, convolution is performed on the image when training the neural network. However, the elimination of useless information inevitably results in the loss of useful information (mainly the loss of small object information in the picture), which is a main reason for the decline of network detection accuracy. Therefore, feature fusion operation and convolution operation (downsampling) are a pair of contradictory topics. Therefore, in order to better solve this contradiction, as shown in the Figure 4, the add layer, route layer, upsample layer and residual connection [50] in the VaryBlock are used to reduce the loss of useful information in the image, and the other convolution layers are to refine the useful information in the image.
One of the primary causes of the low detection accuracy of the YOLOv3 skeleton is the pooling process that follows the convolution operation in images. As a result, we employ VaryBlock to replace the downsampling technique in the YOLOv3 skeleton.

3.3. Data Expansion

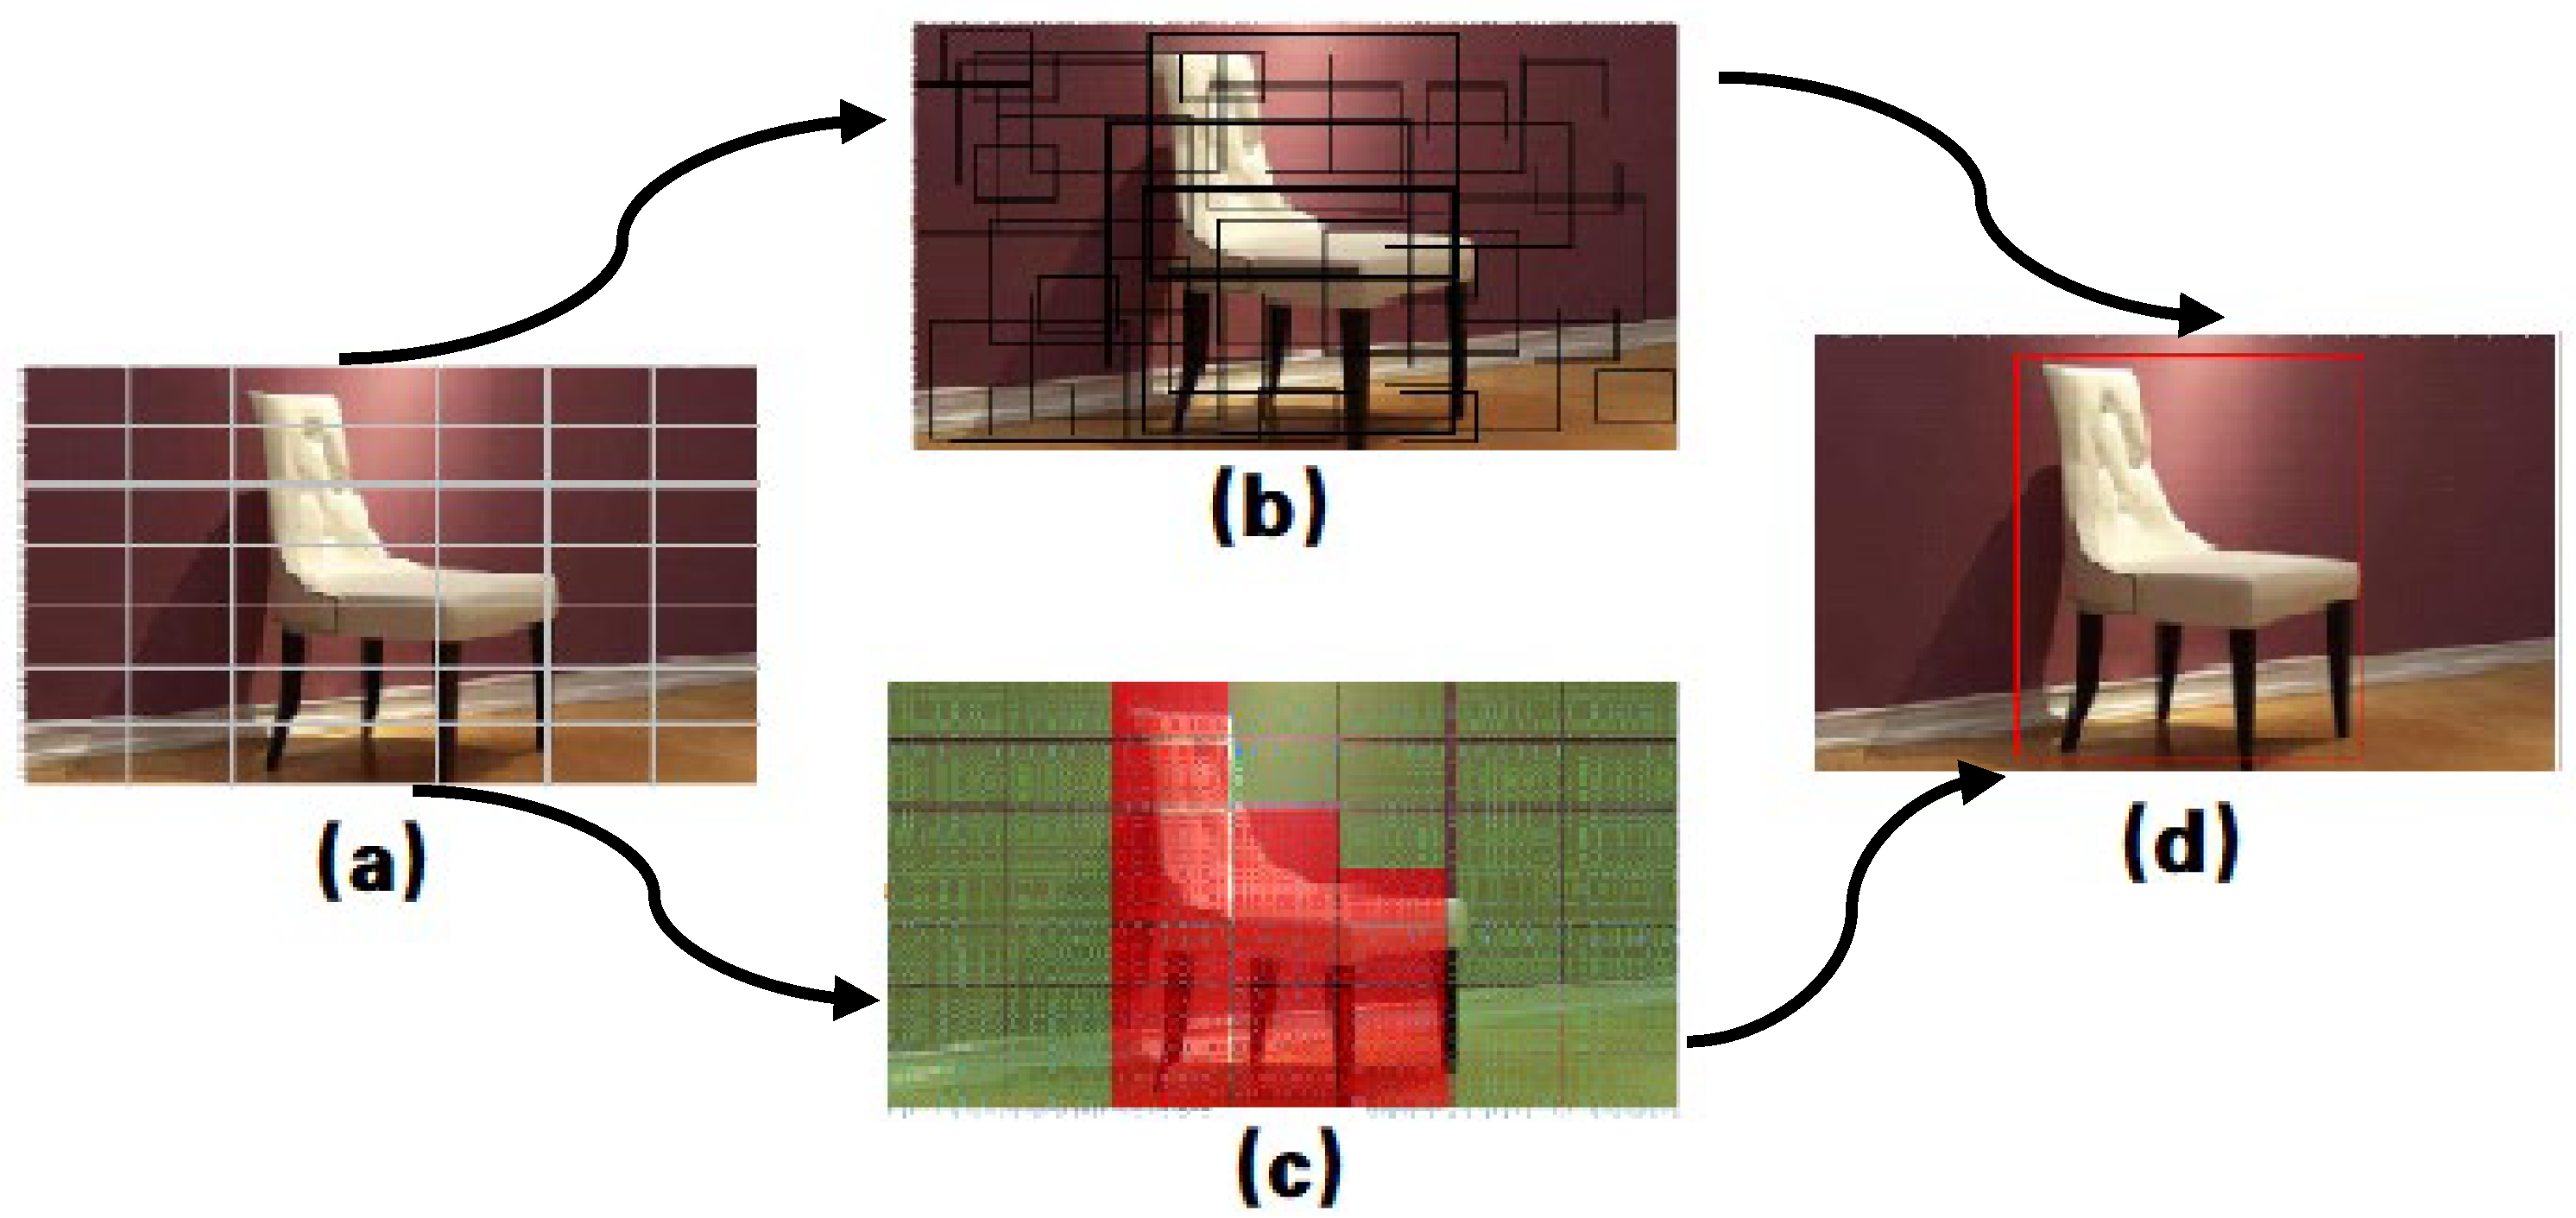
3.3.1. Distinction of Object Size

To strengthen the semantic information and limit the loss of the useful data in images during the downsampling process of the network, we increase the number of smaller objects.
In a 256 × 256 pixel picture, an object occupying less than 80 pixels is a small object, that is, less than 256 × 0.12% of 256 is a small target, which is the definition of relative size. The other is the COCO dataset’s definition of absolute size, which states that objects having a size of less than 32 × 32 pixels are considered small targets. We take the definition of object size in the COCO dataset. The small object COCO dataset is defined as an object less than 32 × 32 pixels, while the large object refers to an object with 96 × 96 pixels. We can judge the size of the object according to the mask tag data of the image because the mask tag of the image labels each pixel belonging to the object [32].
As can be seen from Table 2, although the number of small objects is 41.43%, the average area occupied by small objects in the picture is only about 1% (calculated by the number of pixels occupied by objects). As a result, when the neural network is being trained, it will gravitate toward larger targets in one image rather than little ones. Therefore, we extend small objects by 1/3 and medium objects by 1/2. That is, the smaller the object is, the more the expansion ratio is. The larger the object is, the smaller the expansion ratio is. Large objects are not expanded.

3.3.2. Extended Object Area

GAN (Generative Adversarial Networks) [52] has been widely employed in numerous research domains due to its exceptional performance. With the introduction of GAN in recent years, it has become widely employed in computer vision data expansion. For instance, this work (GAN-Supervised Dense Visual Alignment) describes a way for expanding datasets using GAN.
GAN is one of the most advanced data expansion methods, which can learn the distribution of real data in the real world. There are two neural networks that can be trained in the GAN network, one termed a generator and the other called a discriminator. These two neural networks can be coupled to the neural network in a simple way. The generator is used to fit a mapping function of a two-dimensional picture from a randomly distributed multi-dimensional vector during the training process, while the discriminator is used to evaluate the similarity between the false image generated by the generator and the real image and make binary classification judgments. As a result, the two neural networks in GAN have a conflict training relationship. One network is in charge of counterfeiting, while the other is in charge of combating counterfeiting. The training will continue until the generator’s bogus graph can truly trick the discriminator. This is a dynamic process in which G and D play each other. However, GAN has some problems such as unstable training, the disappearance of gradient descent, and model collapse. In this paper, Wasserstein distance [53], a new distributed distance measurement index, is introduced to form a new generative countermeasure network (WGAN) [54] combined with GAN. This network will essentially solve the problems of a simple GAN network, such as unstable training, model collapse, and an inability to control the training progress of the model.
Before starting to train the object detection algorithm model, this paper uses WGAN to realize the data expansion of the object detection dataset. Taking the chair (medium-sized object) as an example, the visualization results of using WGAN to generate the chair can be seen in Figure 5.

3.4. Preset Bounding Box

The author of YOLOv3 employs the K-means approach to obtain the predefined bounding box on the COCO dataset during the training stage. The YOLOv3 k-means approach uses K pairs of width and height values at random as initial cluster centers, making the K-means method susceptible to the initial cluster [55]. The initial clustering center must be artificially determined, and different beginning clustering centers can result in drastically different clustering results. Because the beginning point selection affects the classification results of the K-means method, the K-means++ clustering algorithm can greatly reduce the final error of the classification results. As a result, the scale of the preset bounding box is calculated using the K-means++ clustering technique in this study. It should be noted that the YOLOv3-Tiny network utilized in this paper only requires six anchors; hence, the k-means++ algorithm only uses six cluster centers instead of nine.
The k-means++ clustering technique enhances the initial point selection, although the rest of the processes are identical to the k-means algorithm. The key notion is that during the initial cluster center selection, the distance between cluster centers should be as large as possible. The preset bounding box is generated using the k-means ++ clustering algorithm in this paper. Algorithm 1 depicts the algorithm procedure. We may considerably minimize the time it takes to locate an object in a picture by creating a preset bounding box.
Algorithm 1: The process by which the K-means++ clustering algorithm generates the preset bounding box.
Input: The bounding box set X of the object in the dataset.
Output:
1
Randomly select a sample from the set X as the initial cluster center C 1 ;
2
For each sample x in set X, calculate the distance between it and the initial cluster center C 1 , denoted by D(x);
3
Calculate the probability that each sample is selected as the center of the next cluster;
4
According to the roulette method, select the next cluster center;
5
Repeat Step 2 to Step 4 until a total of six cluster centers are selected;
6
Use the standard k-means algorithm for set X;
7
Output the bounding box set Y.
Before the training, the k-means++ is first applied to the dataset, which will generate six preset bounding boxes. They are utilized in the prediction of objects at various scales, and the location information of the object in the image can be acquired by using constant correction and regression. Taking a set of preset bounding boxes generated during the experiment as an example, Table 3 shows the preset bounding boxes, which are essentially a set of datasets with known height and width.
Depending on the size of the object we wish to identify in the image, the size of the predefined bounding box can be changed. It can also be customized for a single category of objects if necessary.

3.5. Training and Prediction of Network Model

The network model can be used to forecast the object detection results of the input image once it has been trained. The loss function in the training process is presented in Equation (1):
l o s s = 1 n i = 1 n l o s s w h + 1 n i = 1 n l o s s c l a s s + 1 n i = 1 n l o s s c o n f i d e n c e
l o s s w h = λ c o o r d i = 0 S 2 j = 0 B 1 i , j o b j 2 w i × h i × x i x ^ i 2 + y i y ^ i 2 + w i w ^ i 2 + h i h ^ i 2
l o s s c l a s s = λ c l a s s i = 0 S 2 j = 0 B 1 i , j n o o b j c c l a s s e s P i c log P ^ i c
l o s s c o n f i d e n c e = λ n o o b j i = 0 S 2 j = 0 B 1 i , j n o o b j C i C ^ i 2 + λ o b j i = 0 S 2 j = 0 B 1 i , j o b j C i C ^ i 2
The loss is divided into three parts, l o s s w h (Equation (2)) is the loss caused by the location of the predicted bounding box, l o s s c l a s s (Equation (3)) is the loss caused by the prediction object category, and l o s s c o n f i d e n c e (Equation (4)) is the loss of confidence. (x, y) is the center coordinate and (w, h) is the width and height of the predicted bounding box. S is grid size; S 2 is defined as the number of grids; B is defined as the number of prediction boxes in each cell; C is defined as the confidence of the prediction box; P is defined as the confidence of the pedestrian [56]; 1 i , j o b j equals 1 if the box at (i, j) has an object; 1 i , j n o o b j equals 1 if the box at (i, j) does not have an object; x ^ , y ^ , w ^ , h ^ , C ^ , P ^ are the values to be predicted by the network.
For l o s s w h and l o s s c o n f i d e n c e , the sum-squared error is used as the loss function of location prediction and confidence prediction, and l o s s c l a s s uses mean squared error as the loss function probability of category. The IOU error loss function and the classification error loss function are calculated in the YOLO algorithm utilizing binary classification cross-entropy [57].
Figure 6 depicts the overall flow chart of the enhanced YOLO-Tiny object detection algorithm described in this paper. Using the VaryBlock module, feature extraction and object detection are both completed using a convolutional neural network using the YOLO-Tiny series network as the backbone network. The input image is segmented into grids in the prediction stage, and item prediction and categorization location are achieved using continuous regression of the predefined border box.
The model’s output is a collection of anticipated bounding boxes, each of which contains information on the object’s placement inside the image and the model’s level of confidence in it. As a result, we choose the box with the highest confidence among these anticipated bounding boxes. Anchors are continuously generated during the detection stage in our proposed model to discover possible object regions on the input image. The bounding box is then subjected to regression and classification. Finally, the model outputs the bounding box position as well as the object’s class probability. The flow of the program is shown in Algorithm 2.
Algorithm 2: The prediction process of the improved YOLOv3 object detection algorithm
Input: Image X and model weight M.
Output: The prediction category and probability P of all objects in image X as well as the corresponding bounding box position.
1
Load image X and weight M;
2
Create numerous matrix vectors with various anchors and use the matrix vector as the algorithm’s input;
3
Calculate the grid cells in the bounding box by scanning the grid through anchors;
4
Logistic regression and algorithm model were used to obtain the p value of each object in image X;
5
P and the matching boundary box center coordinates are output as the forecast accuracy probability P.
After the grid is separated, each grid comprises three anchors of variable sizes throughout the prediction, and the number and size can be changed depending on the actual accuracy and speed requirements. The network structure of the object detection proposed in this paper is depicted in Figure 2. A VaryBlock module based on the YOLOv3-Tiny network replaces each Maxpool layer.

4. Performance Analysis

4.1. Evaluation Indicator

Two assessment indicators for the object detection algorithm employed in this paper are utilized to compare the accuracy of different sorts of objects: The average precision (AP), which comprises mean average precision (mAP), A P 50 (AP at IOU = 0.5), A P 75 (AP at IOU = 0.75), AP for small objects (APS), AP for medium objects (APM), and AP for large objects (APL) is one (APL). The other is the FPS (frames per second) rate. APS, APM, and APL are detection indexes for objects of various sizes, and the mAP is the average of AP across many categories, which gauges the model’s performance across all categories. FPS stands for frames per second.

4.2. Experimental Verification and Result Analysis

To solve the small object problem of the object detection algorithm, this paper uses an improved YOLO-Tiny object detection algorithm fused with the VaryBlock module. Since the objects in the COCO dataset and the TUM dataset are similar in size, the Stochastic Gradient Descent (SGD) method is used to pre-train RGB images (labeled) from the COCO dataset and TUM dataset. Then, we load the obtained weight file into the model as the weight before training and finally verify it in the RGB image of TUM RGB-D. The annotation tool uses Labelimg. Labelimg is a graphical image annotation tool that labels object bounding boxes in images. Our experiment is conducted on an Ubuntu PC using an Intel I7-9700K CPU, 16 GB DDR4 3000, and NVIDIA GTX 750 with 4 GB of memory. During the experiment, the VaryBlock module is added to the network. In addition, before the start of the training phase, this paper first uses WGAN and traditional methods to expand the training set and uses the K-means++ clustering algorithm to cluster the bounding boxes of the training set to obtain the preset bounding box.
Each training image is randomly sampled to 70% for training and 30% for validation to make the detector more resilient to input objects of various sizes and shapes. In the training step, the experiment trains a total of 10 categories across 45,000 iterations, with basic learning, momentum, and weight attenuation coefficients of 0.001, 0.9, and 0.0005, respectively. With a batch size of 64 and a subdivision size of 32, we apply the Stochastic Gradient Descent method. To lessen the burden of occupying memory, each iteration randomly selects 64 samples from all training sets to engage in training; subsequently, all batch samples are separated into 32 parts and delivered to the network to participate in training. This research also use the WGAN approach to broaden the scope of the training set. The front end of the model will be changed to 416 × 416 pixels and three channels for any input image size, and the final output will be the same size as the original image.
The MS COCO dataset and RGB images from the TUM dataset were used as the training and validation sets in this work. As shown in Table 4, we apply the same enhancement to YOLOv3-Tiny and YOLOv4-Tiny, respectively, and compare the results. Our method shows a significant improvement over the original YOLO-Tiny, and it is comparable to other similar methods, such as SSD(300), RCNN, Faster RCNN, and YOLOv3. To train our approach, we utilized the COCO2017 Trainval + TUM train dataset, and to test multiple methods, we used the COCO2017 test-dev + TUM test dataset. Compared with the original YOLOv3-Tiny, the mAP of our method based on YOLOv3-Tiny is improved from 55.3% to 60.4%, especially the APS is increased by 8%, but the APM and APL are not improved very much, so our method is more targeted for small objects detection. The detection results are comparable with YOLOv4-Tiny, and some indexes even exceed YOLOv4-Tiny. However, the FPS decreases from 74 to 65, but it still meets the requirements of the real-time system. Furthermore, the improved network based on YOLOv4-Tiny has the same improvement effect in our experiment. Figure 7 shows some detection results of the MS COCO2017 dataset with our method.
We have performed some experiments to verify the improvement effect of the VaryBlock module on the original YOLOv3-Tiny network. First, we add VaryBlock 1 to VaryBlock 3 into the initial network of YOLOv3-Tiny and compare it with the initial network. Then, we add VaryBlock 4 to VaryBlock 6 for comparison again. The mAP, APS, and FPS in the experiment are shown in Table 5.
As illustrated in Table 5, adding VaryBlock 1-3 to the basic network improves detection accuracy from 55.3 to 57.6. The number of convolution cores in the convolution layer will increase as the number of layers increases, since the first seven layers of YOLOv3-Tiny are the most significant convolution layers. As the number of convolution kernels grows, the amount of computations during detection grows, resulting in a fall in FPS from 74 to 70 frames. When utilizing convolution kernels of the same size, the more convolution kernels used, the more features are extracted. As a result, more features may be recovered after adding VaryBlocks 4–6 to the convolution layer. From 57.6% to 61.5%, the accuracy has improved. The FPS is only nine frames lower than the original model, yet it still passes the real-time requirements.
Table 6 is the test results for WGAN. From the comparison results, it can be seen that APS and APM increased by 2.1% and 1.9%, respectively, in the detection results of YOLOv3-Tiny combined with WGAN, and the detection indexes for large objects basically remained unchanged. Generally speaking, the network using WGAN will obtain a higher value in the small object detection index, which means that the expansion of data by WGAN can make the network model more accurate in small object detection.
Table 7 displays the experimental outcomes. The results show that whether utilizing YOLOv3-Tiny or the upgraded YOLOv3-Tiny, the network detection time with k-means++ is faster than with the normal k-means network, and the AP also has a higher value.
Figure 8 shows the results of YOLOv3-Tiny and the improved YOLO-Tiny (based on YOLOv3-Tiny) object detection algorithm on the TUM dataset, respectively. As can be seen from the comparison between Figure 8a and Figure 8b, there is a difference in the detection results of the person in a book.
Figure 8b detects a person in a book while Figure 8a detects nothing in the book. It means that our model has good performance for small object detection. Figure 8c and Figure 8d both detect laptop, keyboard, and mouse, but books are not detected in the YOLOv3-Tiny model. The experimental comparison proves that the model we trained is more suitable for the TUM dataset and has higher accuracy. Figure 8e and Figure 8f have different detection results for cans. Figure 8f has detected two cans, while Figure 8e has detected only one cans. The tape on the far right of the table is mistakenly detected as a bowl, which is corrected in our model as shown in Figure 8f. The deeper the network, the smaller the feature maps that are retrieved by the convolution and pooling processes of convolutional neural networks, making it difficult to completely describe the features of small objects [58]. Small items, such as a cup in the distance and a dog in a magazine, are better detected in our model, as seen in the comparison between Figure 8g and Figure 8h. It demonstrates that the model developed in this research has a good small-object detection effect.
The experimental results of Table 8 show that compared with other object detection methods, the proposed method has obtained relatively considerable mAP. The mAP increased dramatically with smaller things in particular. It shows that our approach has excellent performance. Compared with baseline YOLOv3-Tiny, the proposed algorithm-based YOLOv3-Tiny improves AP values in eight categories, including keyboard (45.5 to 57.2), cans (52.1 to 55.3), plant (56.5 to 59.6), mouse (56.1 to 58.8), TV monitor (42.1 to 54.5), cup (51.7 to 68.6), person (62.1 to 64.1) and laptop (49 to 56.5). Each class has its own set of improvements, which can be used to test the model’s resilience. At the same time, YOLOv4-Tiny benefits from the same improving impact. In addition, the approach we proposed is slightly less performing in both categories than in the baseline. This could be due to a number of things. The most plausible reason is that GAN generates random images, and different noises can result in somewhat different experimental findings. The detection approach suggested in this research, on the other hand, is slower than the original YOLO-Tiny because of the increased number of network layers, but it still meets the real-time requirements. We will continue to investigate this matter in the future. Figure 9 shows the YOLOv3-Tiny loss curve as well as the improved technique. Our method’s loss value declines slower than YOLOv3-Tiny, as shown in the graph. Due to the addition of the VaryBlock module, the increase in the number of network layers reduces the information loss caused by the pooling layer, and the convergence time will be relatively extended. All the data show that our method is stable and convergent, the final loss value is close to YOLOv3-Tiny, and the detection accuracy is greatly improved, although some detection speed is sacrificed.

5. Conclusions

An Intelligent Fast Detection for Real-time Image Information in Industrial IoT is designed in this paper. We use WGAN to expand the training set, and we use k-means++ clustering to obtain a better-preset anchor box.
The downsampling processes that cause information loss have been minimized by the VaryBlock module, which significantly boosts network performance. We trained and tested our method on the COCO and TUM datasets, and the detection accuracy is very impressive. Compared with the original YOLOv3-Tiny, the mAP of our method based on YOLOv3-Tiny is improved from 55.3% to 60.4%, especially the APS is increased by 8%. However, compared with YOLOv3-Tiny+WGAN, APS (increased by 2.6%), APM (increased by 1.7%), and APL (decreased by 0.1%), our method does not improve too much.
In addition, for some objects that are difficult to be recognized by object detection, such as non-rigid objects, the method in this paper has certain limitations, and it is still difficult to accurately recognize. In addition, the addition of new modules leads to an increase in the number of network layers, and the increase in parameters leads to a slower convergence speed. In future work, we plan to improve on five aspects: (1) optimizing the detection of non-rigid objects; (2) applying the method in this article to semantic SLAM to optimize the visual odometer of traditional SLAM; (3) using XAI [59] tools to better explain, evaluate and improve our model; (4) applying this method to Edgex Foundry (an kind of edge computing framework); (5) according to the idea of GAN, we plan to explore a better expansion method of the image dataset.

Author Contributions

Conceptualization, Y.L. and H.Z.; Methodology, Y.L. and H.Z.; Validation, H.Z.; Formal Analysis, H.Z.; Software, Y.W.; Writing—Original Draft Preparation, Y.W. and N.X.; Data Curation, Y.W.; Writing—Review and Editing, Y.L., H.Z. and Y.W.; Project Administration, H.Z.; Investigation, Y.L. All authors have read and agreed to the published version of the manuscript.

Funding

This research was funded in part by the National Natural Science Foundation of China (Grant 61963017), in part by Shanghai Educational Science Research Project (Grant C2022056), and in part by Jiangxi Province’s Outstanding Youth Planning Project (Grant 20192BCBL23004).

Data Availability Statement

Not applicable.

Conflicts of Interest

The authors declare that they have no known competing financial interests or personal relationships that could have appeared to influence the work reported in this paper.

Abbreviations

The following abbreviations are used in this manuscript:
IFDAn Intelligent Fast Detection for Real-time Image Information in Industrial IoT
CNNConvolutional Neural Networks
YOLOYou Only Look Once
GANGenerative Adversarial Networks
WGANWasserstein Generative Adversarial Networks
R-CNNRegion Convolutional Neural Networks
RPNRegion Proposal Network
FPNFeature Pyramid Networks for Object Detection
k-meansk-means clustering algorithm
MS-COCOMicrosoft Common Objects in Context
IoTInternet of Things
IIoTIndustrial Internet of Things
SIFTDistinctive Image Features from Scale-Invariant Keypoints
HOGHistograms of Oriented Gradients for Human Detection
DPMDeformable Part Model
BoVWBags-of-Visual-Words
PAN-NetEfficient and Accurate Arbitrary-Shaped Text Detection with Pixel Aggregation
Network
GC-YOLOv3You Only Look Once with Global Context Block
ResnetDeep Residual Learning for Image Recognition
DenseNetDensely Connected Convolutional Networks
SGDStochastic Gradient Descent Algorithm
IOUIntersection Over Union
SSDSingle Shot MultiBox Detector
ELANEfficient Long-range Attention Network
SVMSupport Vector Machine
SSP-netSpatial pyramid pooling in deep convolutional networks for visual recognition

References

  1. Laghari, A.A.; Wu, K.; Laghari, R.A.; Ali, M.; Khan, A.A. A review and state of art of Internet of Things (IoT). Arch. Comput. Methods Eng. 2021, 29, 1395–1413. [Google Scholar] [CrossRef]
  2. Chegini, H.; Naha, R.K.; Mahanti, A.; Thulasiraman, P. Process automation in an IoT-fog-cloud ecosystem: A survey and taxonomy. IoT 2021, 2, 92–118. [Google Scholar] [CrossRef]
  3. Centenaro, M.; Costa, C.E.; Granelli, F.; Sacchi, C.; Vangelista, L. A Survey on Technologies, Standards and Open Challenges in Satellite IoT. IEEE Commun. Surv. Tutor. 2021, 23, 1693–1720. [Google Scholar] [CrossRef]
  4. Sathyan, M. Chapter six-industry 4.0: Industrial internet of things (IIOT). Adv. Comput. 2020, 117, 129–164. [Google Scholar]
  5. Sisinni, E.; Saifullah, A.; Han, S.; Jennehag, U.; Gidlund, M. Industrial internet of things: Challenges, opportunities, and directions. IEEE Trans. Ind. Inf. 2018, 14, 4724–4734. [Google Scholar] [CrossRef]
  6. Mao, K.; Srivastava, G.; Parizi, R.M.; Khan, M.S. Multi-source fusion for weak target images in the Industrial Internet of Things. Comput. Commun. 2021, 173, 150–159. [Google Scholar] [CrossRef]
  7. Sun, X.J.; Lin, J.C.W. A target recognition algorithm of multi-source remote sensing image based on visual Internet of Things. Mob. Netw. Appl. 2022, 27, 784–793. [Google Scholar] [CrossRef]
  8. Huang, X. Intelligent remote monitoring and manufacturing system of production line based on industrial Internet of Things. Comput. Commun. 2020, 150, 421–428. [Google Scholar] [CrossRef]
  9. Sadeeq, M.A.; Zeebaree, S.R.; Qashi, R.; Ahmed, S.H.; Jacksi, K. Internet of Things security: A survey. In Proceedings of the 2018 International Conference on Advanced Science and Engineering (ICOASE), Duhok, Irak, 9–11 October 2018; pp. 162–166. [Google Scholar]
  10. Darvishi, H.; Ciuonzo, D.; Eide, E.R.; Rossi, P.S. Sensor-fault detection, isolation and accommodation for digital twins via modular data-driven architecture. IEEE Sens. J. 2020, 21, 4827–4838. [Google Scholar] [CrossRef]
  11. Jacob, I.J.; Darney, P.E. Design of deep learning algorithm for IoT application by image based recognition. J. ISMAC 2021, 3, 276–290. [Google Scholar] [CrossRef]
  12. Latif, S.; Driss, M.; Boulila, W.; Huma, Z.E.; Jamal, S.S.; Idrees, Z.; Ahmad, J. Deep learning for the industrial internet of things (iiot): A comprehensive survey of techniques, implementation frameworks, potential applications, and future directions. Sensors 2021, 21, 7518. [Google Scholar] [CrossRef] [PubMed]
  13. Jiao, L.; Zhang, F.; Liu, F.; Yang, S.; Li, L.; Feng, Z.; Qu, R. A survey of deep learning-based object detection. IEEE Access 2019, 7, 128837–128868. [Google Scholar] [CrossRef]
  14. Wang, H.; Zheng, X. Survey of Deep Learning Based Object Detection. In Proceedings of the 2nd International Conference on Big Data Technologies, Nanjing, China, 17–19 June 2019; Association for Computing Machinery: New York, NY, USA, 2019. ICBDT2019. pp. 149–153. [Google Scholar] [CrossRef]
  15. Sharma, L.; Lohan, N. Internet of things with object detection: Challenges, applications, and solutions. In Handbook of Research on Big Data and the IoT; IGI Global: Hershey, PA, USA, 2019; pp. 89–100. [Google Scholar]
  16. Pathak, A.R.; Pandey, M.; Rautaray, S. Application of Deep Learning for Object Detection. Procedia Comput. Sci. 2018, 132, 1706–1717. [Google Scholar] [CrossRef]
  17. Sharma, K.; Thakur, N. A review and an approach for object detection in images. Int. J. Comput. Vis. Robot. 2017, 7, 196–237. [Google Scholar] [CrossRef]
  18. Lowe, D.G. Distinctive Image Features from Scale-Invariant Keypoints. Int. J. Comput. Vision 2004, 60, 91–110. [Google Scholar] [CrossRef]
  19. Jiang, P.; Ergu, D.; Liu, F.; Cai, Y.; Ma, B. A Review of Yolo Algorithm Developments. Procedia Comput. Sci. 2022, 199, 1066–1073. [Google Scholar] [CrossRef]
  20. Uijlings, J.R.; Van De Sande, K.E.; Gevers, T.; Smeulders, A.W. Selective search for object recognition. Int. J. Comput. Vis. 2013, 104, 154–171. [Google Scholar] [CrossRef] [Green Version]
  21. He, K.; Zhang, X.; Ren, S.; Sun, J. Spatial pyramid pooling in deep convolutional networks for visual recognition. IEEE Trans. Pattern Anal. Mach. Intell. 2015, 37, 1904–1916. [Google Scholar] [CrossRef] [Green Version]
  22. Ding, X.; Zhang, X.; Ma, N.; Han, J.; Ding, G.; Sun, J. Repvgg: Making vgg-style convnets great again. In Proceedings of the IEEE/CVF Conference on Computer Vision and Pattern Recognition, Nashville, TN, USA, 20–25 June 2021; pp. 13733–13742. [Google Scholar]
  23. Zhang, X.; Zeng, H.; Guo, S.; Zhang, L. Efficient Long-Range Attention Network for Image Super-resolution. arXiv 2022, arXiv:2203.06697. [Google Scholar]
  24. Wang, C.Y.; Bochkovskiy, A.; Liao, H.Y.M. Scaled-yolov4: Scaling cross stage partial network. In Proceedings of the IEEE/cvf Conference on Computer Vision and Pattern Recognition, Nashville, TN, USA, 20–25 June 2021; pp. 13029–13038. [Google Scholar]
  25. Dalal, N.; Triggs, B. Histograms of oriented gradients for human detection. In Proceedings of the 2005 IEEE Computer Society Conference on Computer Vision and Pattern Recognition (CVPR’05), San Diego, CA, USA, 20–25 June 2005; Volume 1, pp. 886–893. [Google Scholar] [CrossRef] [Green Version]
  26. Sivic, J.; Zisserman, A. Video Google: A text retrieval approach to object matching in videos. In Proceedings of the 9th IEEE International Conference on Computer Vision, Nice, France, 14–17 October 2003; Volume 2, pp. 1470–1477. [Google Scholar] [CrossRef]
  27. Yan, J.; Lei, Z.; Wen, L.; Li, S.Z. The Fastest Deformable Part Model for Object Detection; IEEE Computer Society: Washington, DC, USA, 2014; CVPR’14; pp. 2497–2504. [Google Scholar] [CrossRef] [Green Version]
  28. Girshick, R.; Donahue, J.; Darrell, T.; Malik, J. Rich Feature Hierarchies for Accurate Object Detection and Semantic Segmentation. In Proceedings of the 2014 IEEE Conference on Computer Vision and Pattern Recognition, Columbus, OH, USA, 23–28 June 2014; CVPR ’14. pp. 580–587. [Google Scholar] [CrossRef] [Green Version]
  29. Redmon, J.; Divvala, S.; Girshick, R.; Farhadi, A. You Only Look Once: Unified, Real-Time Object Detection. In Proceedings of the 2016 IEEE Conference on Computer Vision and Pattern Recognition (CVPR), Las Vegas, NV, USA, 27–30 June 2016; pp. 779–788. [Google Scholar] [CrossRef] [Green Version]
  30. Girshick, R. Fast R-CNN. In Proceedings of the 2015 IEEE International Conference on Computer Vision (ICCV), IEEE Computer Society, Santiago, Chile, 7–13 December 2015; ICCV ’15. pp. 1440–1448. [Google Scholar] [CrossRef]
  31. Ren, S.; He, K.; Girshick, R.; Sun, J. Faster R-CNN: Towards Real-Time Object Detection with Region Proposal Networks. IEEE Trans. Pattern Anal. Mach. Intell. 2017, 39, 1137–1149. [Google Scholar] [CrossRef] [Green Version]
  32. He, K.; Gkioxari, G.; Dollar, P.; Girshick, R. Mask R-CNN. IEEE Trans. Pattern Anal. Mach. Intell. 2020, 42, 386–397. [Google Scholar] [CrossRef] [PubMed]
  33. Redmon, J.; Farhadi, A. YOLO9000: Better, Faster, Stronger. In Proceedings of the 2017 IEEE Conference on Computer Vision and Pattern Recognition (CVPR), Honolulu, HI, USA, 21–26 July 2017; IEEE Computer Society: Los Alamitos, CA, USA, 2017; pp. 6517–6525. [Google Scholar] [CrossRef] [Green Version]
  34. Redmon, J.; Farhadi, A. YOLOv3: An Incremental Improvement. arXiv 2018, arXiv:1804.02767. [Google Scholar]
  35. Lin, T.; Dollar, P.; Girshick, R.; He, K.; Hariharan, B.; Belongie, S. Feature Pyramid Networks for Object Detection. In Proceedings of the 2017 IEEE Conference on Computer Vision and Pattern Recognition (CVPR), Honolulu, HI, USA, 21–26 July 2017; IEEE Computer Society: Los Alamitos, CA, USA, 2017; pp. 936–944. [Google Scholar] [CrossRef] [Green Version]
  36. Bochkovskiy, A.; Wang, C.; Liao, H.M. YOLOv4: Optimal Speed and Accuracy of Object Detection. arXiv 2020, arXiv:2004.10934. [Google Scholar]
  37. Wang, W.; Xie, E.; Song, X.; Zang, Y.; Wang, W.; Lu, T.; Yu, G.; Shen, C. Efficient and Accurate Arbitrary-Shaped Text Detection With Pixel Aggregation Network. In Proceedings of the 2019 IEEE/CVF International Conference on Computer Vision (ICCV), Seoul, Korea, 27 October–2 November 2019; pp. 8439–8448. [Google Scholar] [CrossRef] [Green Version]
  38. Chai, E.; Ta, L.; Ma, Z.; Zhi, M. ERF-YOLO: A YOLO algorithm compatible with fewer parameters and higher accuracy. Image Vis. Comput. 2021, 116, 104317. [Google Scholar] [CrossRef]
  39. Gong, H.; Li, H.; Xu, K.; Zhang, Y. Object Detection Based on Improved YOLOv3-tiny. In Proceedings of the 2019 Chinese Automation Congress (CAC), Hangzhou, China, 22–24 November 2019; pp. 3240–3245. [Google Scholar] [CrossRef]
  40. Jiang, Z.; Zhao, L.; Li, S.; Jia, Y. Real-time object detection method based on improved YOLOv4-tiny. arXiv 2020, arXiv:2011.04244. [Google Scholar]
  41. Zhang, Z.D.; Tan, M.L.; Lan, Z.C.; Liu, H.C.; Pei, L.; Yu, W.X. CDNet: A real-time and robust crosswalk detection network on Jetson nano based on YOLOv5. Neural Comput. Appl. 2022, 34, 10719–10730. [Google Scholar] [CrossRef]
  42. Karthi, M.; Muthulakshmi, V.; Priscilla, R.; Praveen, P.; Vanisri, K. Evolution of YOLO-V5 Algorithm for Object Detection: Automated Detection of Library Books and Performace validation of Dataset. In Proceedings of the 2021 International Conference on Innovative Computing, Intelligent Communication and Smart Electrical Systems (ICSES), Chennai, India, 24–25 September 2021; pp. 1–6. [Google Scholar] [CrossRef]
  43. Long, X.; Deng, K.; Wang, G.; Zhang, Y.; Dang, Q.; Gao, Y.; Shen, H.; Ren, J.; Han, S.; Ding, E.; et al. PP-YOLO: An Effective and Efficient Implementation of Object Detector. arXiv 2020, arXiv:2007.12099. [Google Scholar]
  44. Huang, X.; Wang, X.; Lv, W.; Bai, X.; Long, X.; Deng, K.; Dang, Q.; Han, S.; Liu, Q.; Hu, X.; et al. PP-YOLOv2: A Practical Object Detector. arXiv 2021, arXiv:2104.10419. [Google Scholar]
  45. Ge, Z.; Liu, S.; Wang, F.; Li, Z.; Sun, J. Yolox: Exceeding yolo series in 2021. arXiv 2021, arXiv:2107.08430. [Google Scholar]
  46. Wang, C.Y.; Yeh, I.H.; Liao, H.Y.M. You only learn one representation: Unified network for multiple tasks. arXiv 2021, arXiv:2207.02696. [Google Scholar]
  47. Wang, C.Y.; Bochkovskiy, A.; Liao, H.Y.M. YOLOv7: Trainable bag-of-freebies sets new state-of-the-art for real-time object detectors. arXiv 2022, arXiv:2207.02696. [Google Scholar]
  48. Zheng, L.; Fu, C.; Zhao, Y. Extend the shallow part of Single Shot MultiBox Detector via Convolutional Neural Network. arXiv 2018, arXiv:1801.05918. [Google Scholar]
  49. Yang, Y. GC-YOLOv3: You Only Look Once with Global Context Block. Electronics 2020, 9, 1235. [Google Scholar] [CrossRef]
  50. He, K.; Zhang, X.; Ren, S.; Sun, J. Deep Residual Learning for Image Recognition. In Proceedings of the 2016 IEEE Conference on Computer Vision and Pattern Recognition (CVPR), Las Vegas, NV, USA, 27–30 June 2016; pp. 770–778. [Google Scholar] [CrossRef] [Green Version]
  51. Huang, G.; Liu, Z.; Maaten, L.V.D.; Weinberger, K.Q. Densely Connected Convolutional Networks. In Proceedings of the 2017 IEEE Conference on Computer Vision and Pattern Recognition (CVPR), IEEE Computer Society, Honolulu, HI, USA, 21–26 July 2017; pp. 2261–2269. [Google Scholar] [CrossRef] [Green Version]
  52. Goodfellow, I.J.; Pouget-Abadie, J.; Mirza, M.; Xu, B.; Warde-Farley, D.; Ozair, S.; Courville, A.; Bengio, Y. Generative Adversarial Nets. In Proceedings of the 27th International Conference on Neural Information Processing Systems–Volume 2, Bangkok, Thailand, 23–27 November 2014; NIPS’14. pp. 2672–2680. [Google Scholar]
  53. Walczak, S.M. Metric Diffusion for Non-compact Foliations: Remarks. In Metric Diffusion Along Foliations; Springer International Publishing: Cham, Switzerland, 2017; pp. 49–52. [Google Scholar] [CrossRef]
  54. Arjovsky, M.; Chintala, S.; Bottou, L. Wasserstein Generative Adversarial Networks. In Proceedings of the 34th International Conference on Machine Learning—Volume 70, Sydney, Australia, 6–11 August 2017; ICML’17. pp. 214–223. [Google Scholar]
  55. Wang, Z.; Li, L.; Li, L.; Pi, J.; Li, S.; Zhou, Y. Object detection algorithm based on improved Yolov3-tiny network in traffic scenes. In Proceedings of the 2020 4th CAA International Conference on Vehicular Control and Intelligence (CVCI), Hangzhou, China, 18–20 December 2020; pp. 514–518. [Google Scholar] [CrossRef]
  56. Yi, Z.; Yongliang, S.; Jun, Z. An improved tiny-yolov3 pedestrian detection algorithm. Optik 2019, 183, 17–23. [Google Scholar] [CrossRef]
  57. Gong, X.; Ma, L.; Ouyang, H. An improved method of Tiny YOLOV3. IOP Conf. Ser. Earth Environ. Sci. 2020, 440, 052025. [Google Scholar] [CrossRef]
  58. Cao, C.; Wang, B.; Zhang, W.; Zeng, X.; Yan, X.; Feng, Z.; Liu, Y.; Wu, Z. An Improved Faster R-CNN for Small Object Detection. IEEE Access 2019, 7, 106838–106846. [Google Scholar] [CrossRef]
  59. Nascita, A.; Montieri, A.; Aceto, G.; Ciuonzo, D.; Persico, V.; Pescapé, A. XAI meets mobile traffic classification: Understanding and improving multimodal deep learning architectures. IEEE Trans. Netw. Serv. Manag. 2021, 18, 4225–4246. [Google Scholar] [CrossRef]
Figure 1. Improved YOLOv3-Tiny object detection algorithm framework.
Applsci 12 07847 g001
Figure 2. Network structure of the improved YOLO-Tiny(v3) object detection. The color part is the added module, the gray part is the replaced structure, and the rest is the reserved structure.
Applsci 12 07847 g002
Figure 3. Operation of Add layer and Route layer; (a) A = [a,b]; (b) B = [c,d,e]; (c) C = [a,b,c,d,e]; (d) D = [a+c,b+d,e]; a, b, c, d are all feature maps; C is Route layer and D is Add layer.
Applsci 12 07847 g003
Figure 4. The VaryBlock module is designed according to the residual mechanism and feature fusion method of add and concatenate.
Applsci 12 07847 g004
Figure 5. Result of WGAN; (a) poor performance; (b) good performance.
Applsci 12 07847 g005
Figure 6. The prediction process of the improved YOLOv3 object detection; The input image is divided into an equal-sized s × s grids (a); each grid includes three different scales and each scale owns three bounding boxes with different sizes (b,c) to predict the object (d).
Applsci 12 07847 g006
Figure 7. (ah) shows some detection results of the MS COCO2017 dataset with our method.
Applsci 12 07847 g007
Figure 8. Detection results of TUM dataset using YOLOv3-Tiny and our method (v3). (a,c,e,g) show results of YOLOv3-Tiny; (b,d,f,h) shows results of our method (v3).
Applsci 12 07847 g008
Figure 9. The training loss curves of our proposed method and YOLOv3-Tiny.
Applsci 12 07847 g009
Table 1. Classification of the discussed works along their main distinctive characteristics.
ModelYes or No
CNN-Based
One or
Two Stage
Loss DescriptionBackboneMain Strategy
SIFTNO---Keeping invariance to rotation, scaling,
brightness change, etc.
HOGNO---Using the distribution of light intensity or edge
direction on the surface of the object to describe
the whole object.
BoVWNO---Applying Bag-of-Words algorithm
to image representation.
DPMNO---Adopting the improved HOG feature,
SVM classifier and sliding windows detection idea.
R-CNNYesTwo-Pre-trained AlexNetUsing the selective search algorithm [20] to
improve the filtering speed of candidate boxes.
Fast R-CNNYesTwoClassification, regressionVGG-16Absorbing the characteristics of SPP-net [21] to
improve the speed based on R-CNN.
Mask R-CNNYesTwoClassification, regression, maskPre-trained ResNet or FPNAdding a branch of prediction segmentation
mask based on Fast R-CNN.
YOLOv1YesOneBounding box, confidence,
probability, etc.
VGG-16Regression of object bounding box.
YOLOv2YesOneSame as YOLOv1Darknet-19Multiscale training, full convolution network,
anchor mechanism of fast R-CNN,
more training skills, etc.
YOLOv3YesOneBinary cross entropy
in classification
Darknet-53Integrating FPN, using Softmax in classifier.
YOLOv4YesOneCIOU in anchorCSPDarkNet53Changes in input images, neck and head
based on V3.
YOLOv5YesOneCIOU in anchorBottleneckCSPNot much better than V4.
YOLOv3-TinyYesOneSame as YOLOv3Simplified Darknet-53Removing some feature layers,
retaining two independent prediction
branches based on YOLOv3.
YOLOv6YesOneSIOU in anchorEfficientRep, Rep-PANIntroducing Repvgg [22]. The backbone and
neck are redesigned based on the idea of
hardware perception.
YOLOv7YesOneCIOU in anchorELAN-Net [23]Putting forward Extended-ELAN based on
ELAN [23], model scaling based on
concatenate model.
YOLOrYesOneExplicit loss, implicit lossYOLOV4-CSP [24]Applying implicit knowledge hidden in CNN.
YOLOxYesOneIOU in anchorDarknet53Adding Decoupled Head, adopting Mosaic and
Mixup data enhancement based on YOLOv3.
PP-YOLOYesOneIOU Aware branchResNet50-vd-dcnDetection Neck adopting FPN.
Table 2. The MS COCO dataset object statistics with respect to matched anchors in Mask R-CNN based on RPN.
ItemObject CountImagesTotal Object Area
Small41.43%51.82%1.23%
Large24.24%82.28%88.59%
Table 3. The size of the generated set of preset bounding boxes.
Width212541618956
Height3053377563105
Table 4. AP values and speed of different networks on COCO+TUM dataset.
ModelTrain DataTest Data mAP  (%) AP 50 (%) AP 75 (%) APS (%) FPS Parameters (M)
SSD(300)COCO2017_trainval +TUM_trainCOCO2017_test-dev +TUM_test43.249.144.541.340-
RCNNCOCO2017_trainval +TUM_trainCOCO2017_test-dev +TUM_test59.360.255.143.237-
Faster RCNNCOCO2017_trainval +TUM_trainCOCO2017_test-dev +TUM_test64.468.264.146.74931.5
YOLOv3-TinyCOCO2017_trainval +TUM_trainCOCO2017_test-dev +TUM_test55.363.758.152.2748.7
Ours (v3)COCO2017_trainval +TUM_trainCOCO2017_test-dev +TUM_test60.467.264.960.36512
YOLOv4-TinyCOCO2017_trainval +TUM_trainCOCO2017_test-dev +TUM_test59.465.360.158.68527.6
Ours (v4)COCO2017_trainval +TUM_trainCOCO2017_test-dev +TUM_test64.568.865.765.68131
YOLOv5sCOCO2017_trainval +TUM_trainCOCO2017_test-dev +TUM_test37.056.837.435.04167.2
YOLOv5mCOCO2017_trainval +TUM_trainCOCO2017_test-dev +TUM_test44.364.145.440.029421.2
YOLOv5lCOCO2017_trainval +TUM_trainCOCO2017_test-dev +TUM_test47.767.349.047.222746.2
YOLOv5xCOCO2017_trainval +TUM_trainCOCO2017_test-dev +TUM_test50.868.950.747.314486.7
Table 5. The test results with different layers add VaryBlock.
Network StructureFPSmAP (%)APS (%)
YOLOv3-Tiny7455.352.2
YOLOv3-Tiny+ VaryBlock 1-37057.655.2
YOLOv3-Tiny+ VaryBlock 1-66861.557.2
Table 6. The test results with and without WGAN.
Network StructureFPSmAP(%)APS (%)APM (%)APL (%)
YOLOv3-Tiny7455.352.257.260.3
YOLOv3-Tiny+WGAN7457.355.759.160.4
Our method6560.457.160.860.3
Table 7. The test results with k-means++ and standard k-means.
Network StructureFPSmAP (%)
YOLOv3-Tiny + standard k-means7455.3
YOLOv3-Tiny + k-means++7856.6
YOLOv3-Tiny + VaryBlock + standard k-means6059.2
YOLOv3-Tiny + VaryBlock + k-means++6560.6
Table 8. Comparison of the AP value and speed of different networks only on the TUM dataset.
SSD(300)RCNNFaster RCNNYOLOv3-TinyOurs(v3)YOLOv4-TinyOurs(v4)
keyboard45.444.948.745.557.252.361.2
book33.738.240.752.249.560.566.8
plant5660.265.856.559.656.166.4
cans28.829.436.855.158.957.464.2
mouse20.715.245.956.156.856.763.9
chair36.837.654.860.156.461.455.3
tvmonitor56.741.660.642.154.557.557.3
cup35.822.850.751.768.653.470.3
person35.339.956.462.164.162.461.2
laptop40.734.450.249.056.553.658.7
mAP(%)39.239.451.151.759.458.962.5
FPS40374974658581
Publisher’s Note: MDPI stays neutral with regard to jurisdictional claims in published maps and institutional affiliations.

