Communication

Fast Performance Evaluation for Switched-Capacitor Converter Based on Convolutional Neural Networks

1
College of Electrical Engineering, Zhejiang University, Hangzhou 310058, China
2
Economic Research Institute of State Grid Zhejiang Electric Power Co., Ltd., Hangzhou 310063, China
*
Author to whom correspondence should be addressed.
Appl. Sci. 2022, 12(15), 7833; https://doi.org/10.3390/app12157833
Submission received: 10 July 2022 / Revised: 31 July 2022 / Accepted: 2 August 2022 / Published: 4 August 2022
(This article belongs to the Special Issue Research and Development on DC-DC Power Converters)

Abstract

:
Switched-capacitor converters (SCCs) have been developed for decades and applied successfully in many applications thanks to their merits of high power density, high efficiency, and low cost. Existing SCC evaluation methods do not provide an efficient and effective way to estimate their performance. This paper proposes a new evaluation performance method for SCCs that transforms the topology optimization issue into a more typical non-linear regression problem. The SCC topologies are described by the adjacent matrix. A CNN model is then selected to solve the regression problem. Experimental results confirm that this CNN model greatly shortens the calculation time while performing better than other machine learning algorithms.

1. Introduction

With the power consumption of data centers soaring rapidly, the sharp contradiction between computational performance and thermal limitations in the motherboard has become a major bottleneck confronting designers [1]. High power density and high-efficiency designs are extremely valuable for onboard DC–DC converters such as voltage regulator modules (VRMs) and point of load (POL) converters. Among various DC–DC converters, soft-switching solutions have greatly reduced switching losses under the irreversible trend of high frequency compared to conventional switching converters. Undesirably, they are difficult to integrate due to bulky inductive items. Furthermore, the inductor-based converter design suffers from second-order effects introduced by the nonlinear characteristics of magnetic materials.
As one of most vital branches of DC–DC converters, switched-capacitor converters (SCCs) can be easily embedded on the motherboard, and are regarded as a promising solution [2,3] for balancing performance and cooling. Currently, SCCs are widely used in chip power supply, energy buffering, LED driving, portable device fast charging, and data center power supply. SCCs are composed exclusively of capacitors and switches, and can efficiently generate a step-up or step-down output voltage of the same polarity with two or more phases. One of the most well-known switched capacitor circuits is the Dickson Charge Pump (DCP) [4]. Lacking magnetic elements [5], SCCs have an overwhelming advantage in reliability, integration level, control complexity, and power density compared with the conventional switching-mode power supply (SMPS) and soft-switching converter [6].
In order to cover existing and emerging application requirements, SCCs featuring diverse characteristics are in demand. Hence, continuous academic efforts have been directed towards SCC topology exploration, resulting in the rapid expansion of topologies of SCCs [7]. In general, there are three traditional approaches concerning topology derivation, namely, modular structure extension [8,9], iterative combination [10], and systematic generation [11]. SCC topology design is a rather complicated issue due to the integration and comprehensive effects of various parameters, such as power consumption, switch characteristics, and operation frequency [12,13].
Conventionally, the selection of an SCC topology from the large variety of derived topologies is an extremely laborious process which requires iterative synthesis, simulation, evaluation, and optimization [14,15]. This can significantly extend the development cycle due to repetitive efforts [11]. For the sake of economic cost, designers often fall into stereotypical solutions such as Dickson or Doubler without considering specific requirements, which can easily lead to non-optimal system design.
Therefore, performance evaluation methods for new converter topologies are highly valued in switched-capacitor research. In [16], a new architecture for a charge pump and its design specifications for battery-powered applications were proposed, and a simplified RC model was built for mathematical analysis. However, this method can only be applied to simple topologies. Two models were proposed by H. Lin et al. in [17] for a charge pump circuit design with a PMOS charge pump. The charge balance method and dynamic charge transfer waveforms were used to improve the output voltage and power conversion efficiency. In [18], the authors proposed a conduction loss model of an SCC based on the average-current model, with the conduction loss calculated using the total loop equivalent resistance. However, the current waveforms were obtained by approximation at the expense of accuracy. In general, complex topology, computational efficiency, and accuracy cannot all be achieved at the same time.
With the advent of machine learning techniques, state-of-the-art AI approaches can open a door for creative means of SCC performance evaluation. In this paper, we present a new performance evaluation algorithm for SCCs. The comprehensive analysis and evaluation framework provided here are novel and enlightening. Following a review of SCC analysis, the architecture of the proposed method is presented and explained; the approach is easy to implement. The effectiveness of the algorithm is tested for 48V-to-12V SCCs, and experimental results are presented. The method proposed in this paper is compared with other methods in terms of the applicable topology, calculation efficiency, and accuracy. See Table 1, it is shown that the proposed method outperforms the alternatives in the existing literature. The structure of this paper is organized as follows. Section 2 describes the problem of analysing the power loss and efficiency of SCCs. In Section 3, a novel mathematical model based on the adjacent matrix is proposed. In Section 4, the proposed performance evaluation method based on CNN is illustrated in detail. Finally, the experimental results are presented in Section 5.

2. Power Loss and Efficiency Analysis of Switched-Capacitor DC/DC Converters

SCC converts a voltage to another by means of changing rapidly between the capacitors using switches. For simplicity, the following assumptions are made:
  • All switches share identical electrical characteristics, such as on-resistance R d s ( o n ) , etc.
  • All internal (energy transfer) capacitors handling the same voltage share an identical capacitance C and equivalent series resistance E S R .
  • The dead time of the converter is neglected.
The power loss of an SCC can be divided into three parts: conduction loss, switching loss, and gate driving loss. As is evident in Equation (1), the gate driving loss can be calculated using the switching period T s , gate charge Q g , and gate driving voltage V g s
P gate = Q i V g s Q g T s
where Q i denotes the ith switch. Switching loss can be expressed as
P S W = Q i 1 2 I D S V D S t o n + t o f f T S
where I D S and V D S are the current and voltage across the MOSFET at switching moment, respectively. The conduction loss, which is generated from charging and discharging between energy-transfer capcitors, plays a major part in high current applications such as data center power supply and mobile phone quick charging. The conduction loss is composed of power dissipation in the ESR of the capacitor and the R d s ( o n ) of MOSFET.
P c o n d u c t i o n = C i 0 T s i ( t ) 2 R E S R d t T s + Q i 0 d T s i ( t ) 2 R d s { o n } d t T s
However, the current waveform of an SCC is difficult to obtain, making P S W and P c o n d u c t i o n hard to calculate. The conventional performance evaluation method is based on the well-known equivalent circuit, as shown in Figure 1, which is expressed by a cascade connection of an ideal DC transformer and an output impedance route. The conversion ratio M of the DC transformer is equal to the input and output voltage ratio V o u t / V i n at no load, and is only determined by the topology configuration. The output resistance R o u t is correlated with the operation efficiency. The most longstanding SCC evaluation method is based on the analysis of output resistance, R o u t .
Referring to the conventional practices in inductor-based power converters, academic efforts have focused on obtaining the output resistance using state equations to analyse the instantaneous equivalent circuits of all phases. However, the element number of the state vector is equal to the number of charge-transfer capacitors in an SCC. In more complex topologies, it is not feasible to solve high-order differential equation to obtain the analytical expression of the output resistance. Confronted with the analytic calculation challenge, several approximation methods have been proposed. The fast switching limit (FSL) and slow switching limit (SSL) approach is the most versatile of the approximate approaches for SCC performance evaluation [19]. The FSL is prominent at high switching frequencies. The FSL impedance is calculated supposing that the voltage of each capacitor and sources are constant. In the FSL, current flow occurs in a frequency-independent constant pattern. The total output impedance of the converter is a combination of the conduction resistance of the switches as well as the ESR of the capacitors. As for low switching frequency, SSL plays an important part in performance evaluation. The SSL impedance is calculated with the following three assumptions:
  • The switches and all other conductive interconnects are ideal.
  • The current flowing between the input and output are impulsive.
  • The voltage of each capacitor and all sources are constant.
SSL is used to describe the capacitor charging and discharging losses. The output impedance of an SCC can be analyzed through the synergy between FSL and SSL. These assumptions can only be applied to SCCs, not to other circuits, because of their substantive characteristics. SCCs feature high-order state equations and few operation phases, which makes their analytical expression difficult to obtain. Moreover, the capacitor voltage is approximately constant because the capacitor value is large enough, while the capacitor voltage in other types of circuits is time-varying. The core idea behind the FSL and SSL approach is the decoupling of voltage and current by assuming that the voltage of each capacitor and source is constant without being affected by current condition. These assumptions simplify the high-order differential equations to linear equations based on Kirchhoff’s current law (KCL) and Kirchhoff’s voltage law (KVL), overcoming the existing analytical calculation problem. Hence, the charge flow condition can be described by the charge transfer vector (CTV). The CTV corresponds to the charge flow in each respective phase of the SCC. Each element in the vector corresponds to a specific capacitor or independent voltage source, and describes the charge flow normalized by the output charge in one switching cycle q o u t . CTV can be defined as
a 1 = [ q o u t 1 q 1 1 q n 1 q i n 1 ]
where superscript means that the charge transfer occurs in phase 1 of the switching period. The acquisition of output impedance is on the basis of charge flow condition presented by CTV. Unfortunately, the calculation of CTV is not as simple as expected [18]. The volt–ampere characteristic of the element is lost due to the assumption that the voltages are constant, making it impossible to calculate each element by CTV in certain topologies; these are called ill-posed SCCs. Contrary to mainstream opinion, the charge flow condition in ill-posed circuits is both determined by the configuration and influenced by electrical parameters such as the switching frequency, capacitor value, etc. As shown in Figure 2, the simplest ill-posed SCC is the interleaved Doubler. It is evident that an interleaved Doubler is composed of two identical subcircuits which operate in complementary mode to down-convert a DC voltage to half, as shown in Figure 2. In order to obtain the CTV of an interleaved Doubler, the node current equation can be presented using Kirchhoff’s current law (KCL), as follows:
a o u t 1 + a o u t 2 = 1 a c 1 = a o u t 1 a c 2 a c 2 = a o u t 2 a c 1
where a o u t 1 and a o u t 2 are the output charge coefficient in phase 1 and phase 2, respectively. After a simple calculation, we can obtain
a o u t 1 = a o u t 2 = 1 2 a c 2 + a c 1 = 1 2
From the above calculation, we can only obtain the sum of capacitor charge coefficients a c 1 and a c 2 instead of each precise value. It is interesting that the two capacitors are parallel equivalently without sharing the same voltage in two phases. This type of circuit is classified as an ill-posed SCC, as the number of independent capacitors is more the number of KCL equations derived from the topology. In the case of voltage and current decoupling, it is not possible to find the flow condition of the charge on the capacitors. In order to analyze the charge flow condition, the equivalent series resistance (ESR) of the capacitor must be taken into consideration as well. The equivalent circuit in each phase is shown in Figure 3. The state equation for phase 1 can be calculated as
R 1 C 1 d V c 1 d t = V i n V o u t V c 1 R 2 C 2 d V c 2 d t = V o u t V c 2 R 3 C 3 d V c 3 d t = V o u t V c 3 I o u t = C 2 d V c 2 d t C 1 d V c 1 d t C 3 d V c 3 d t
The state equation for phase 2 can be calculated as
R 1 C 1 d V c 1 d t = V o u t V c 1 R 2 C 2 d V c 2 d t = V i n V o u t V c 2 R 3 C 3 d V c 3 d t = V o u t V c 3 I o u t = C 2 d V c 2 d t C 1 d V c 1 d t C 3 d V c 3 d t
Supposing V i n = 48   V , I o u t = 10   A , we can analyze the effect of capacitor value and ESR difference on charge flow condition. Switching frequency, capacitance, and ESR all influence the charge flow condition. Specifically, the resistance and charge transfer ratio on the branch are approximately inversely proportional, while the capacitance and charge transfer ratio are approximately proportional, as shown in Figure 4. It is obvious that the charge is not distributed equally in the two subcircuits when they are asymmetrical. As is apparent from the foregoing discussion, the traditional performance evaluation method based on output impedance cannot be applied to ill-posed circuits.

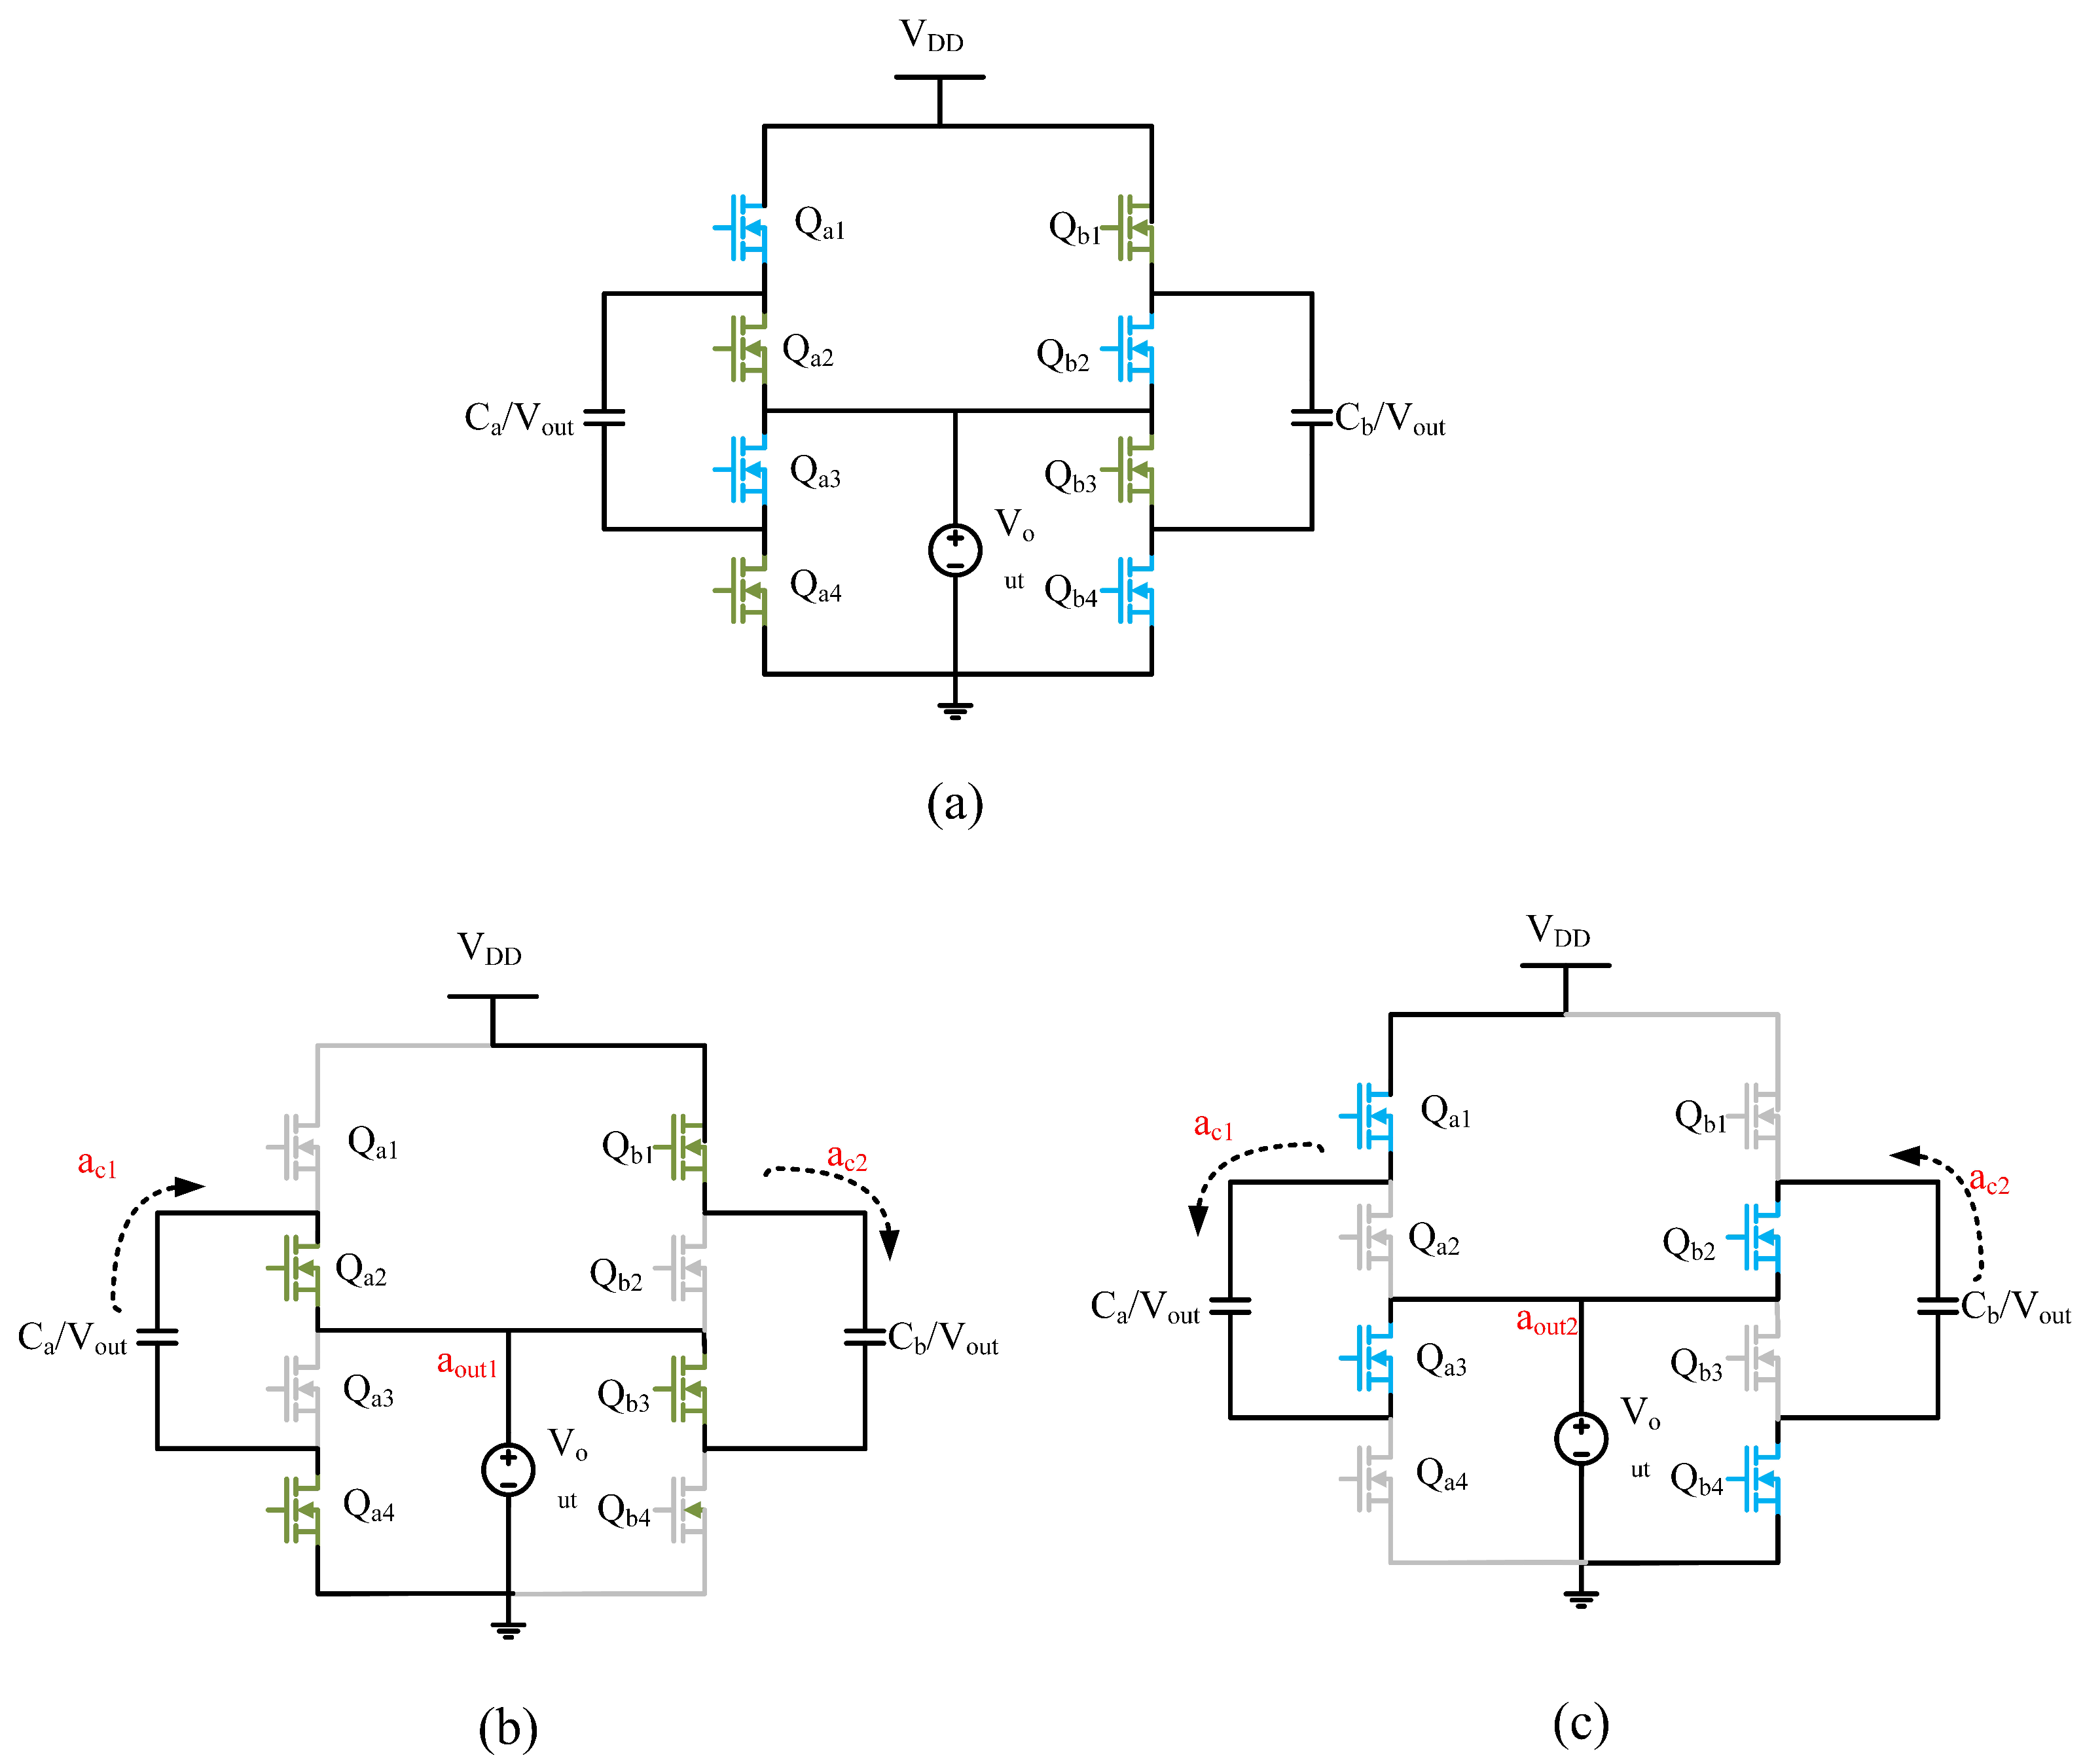
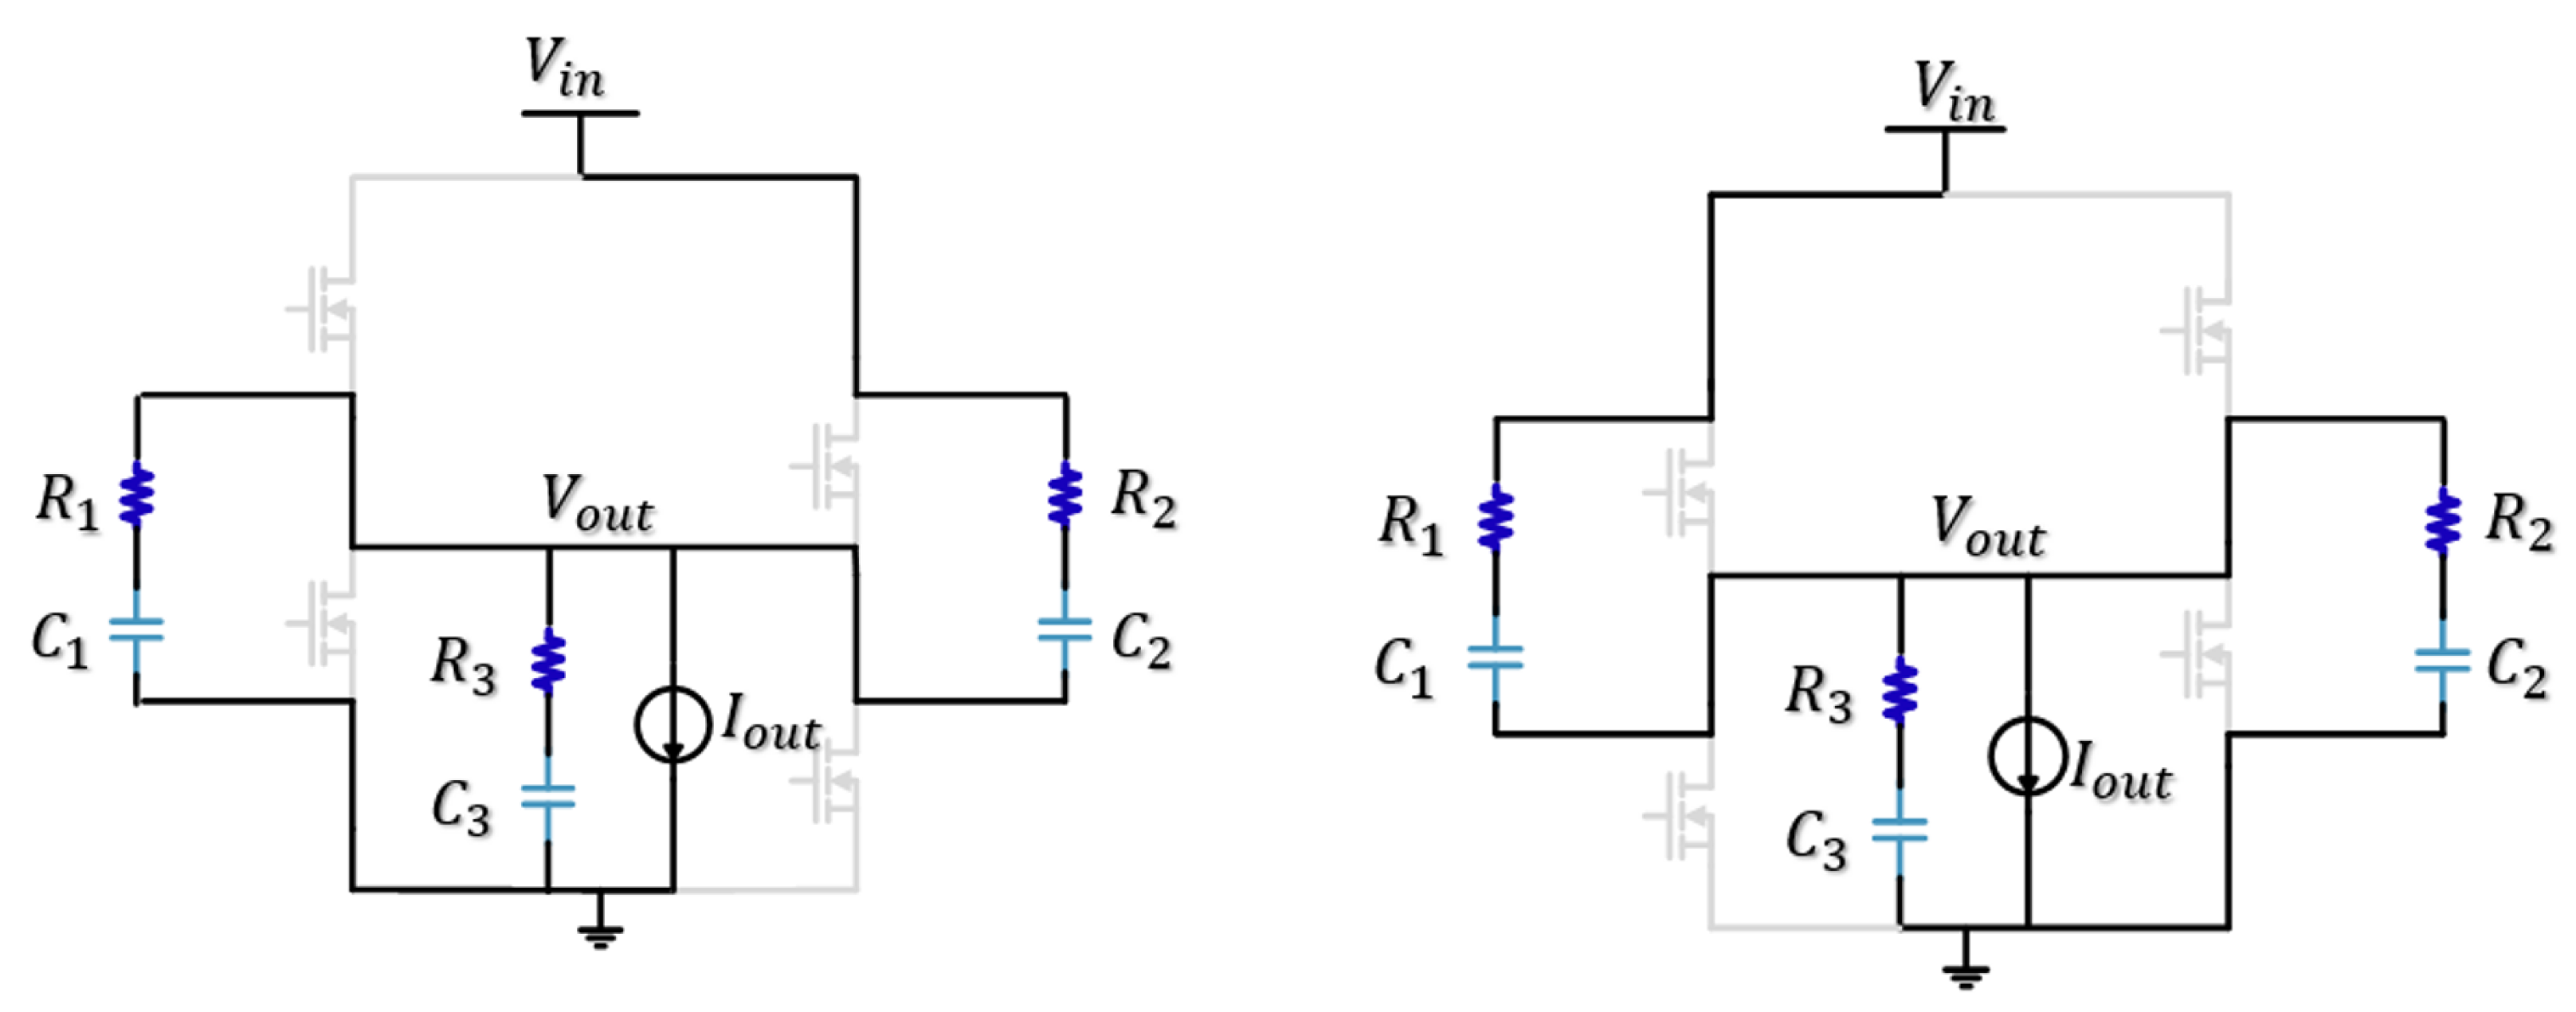
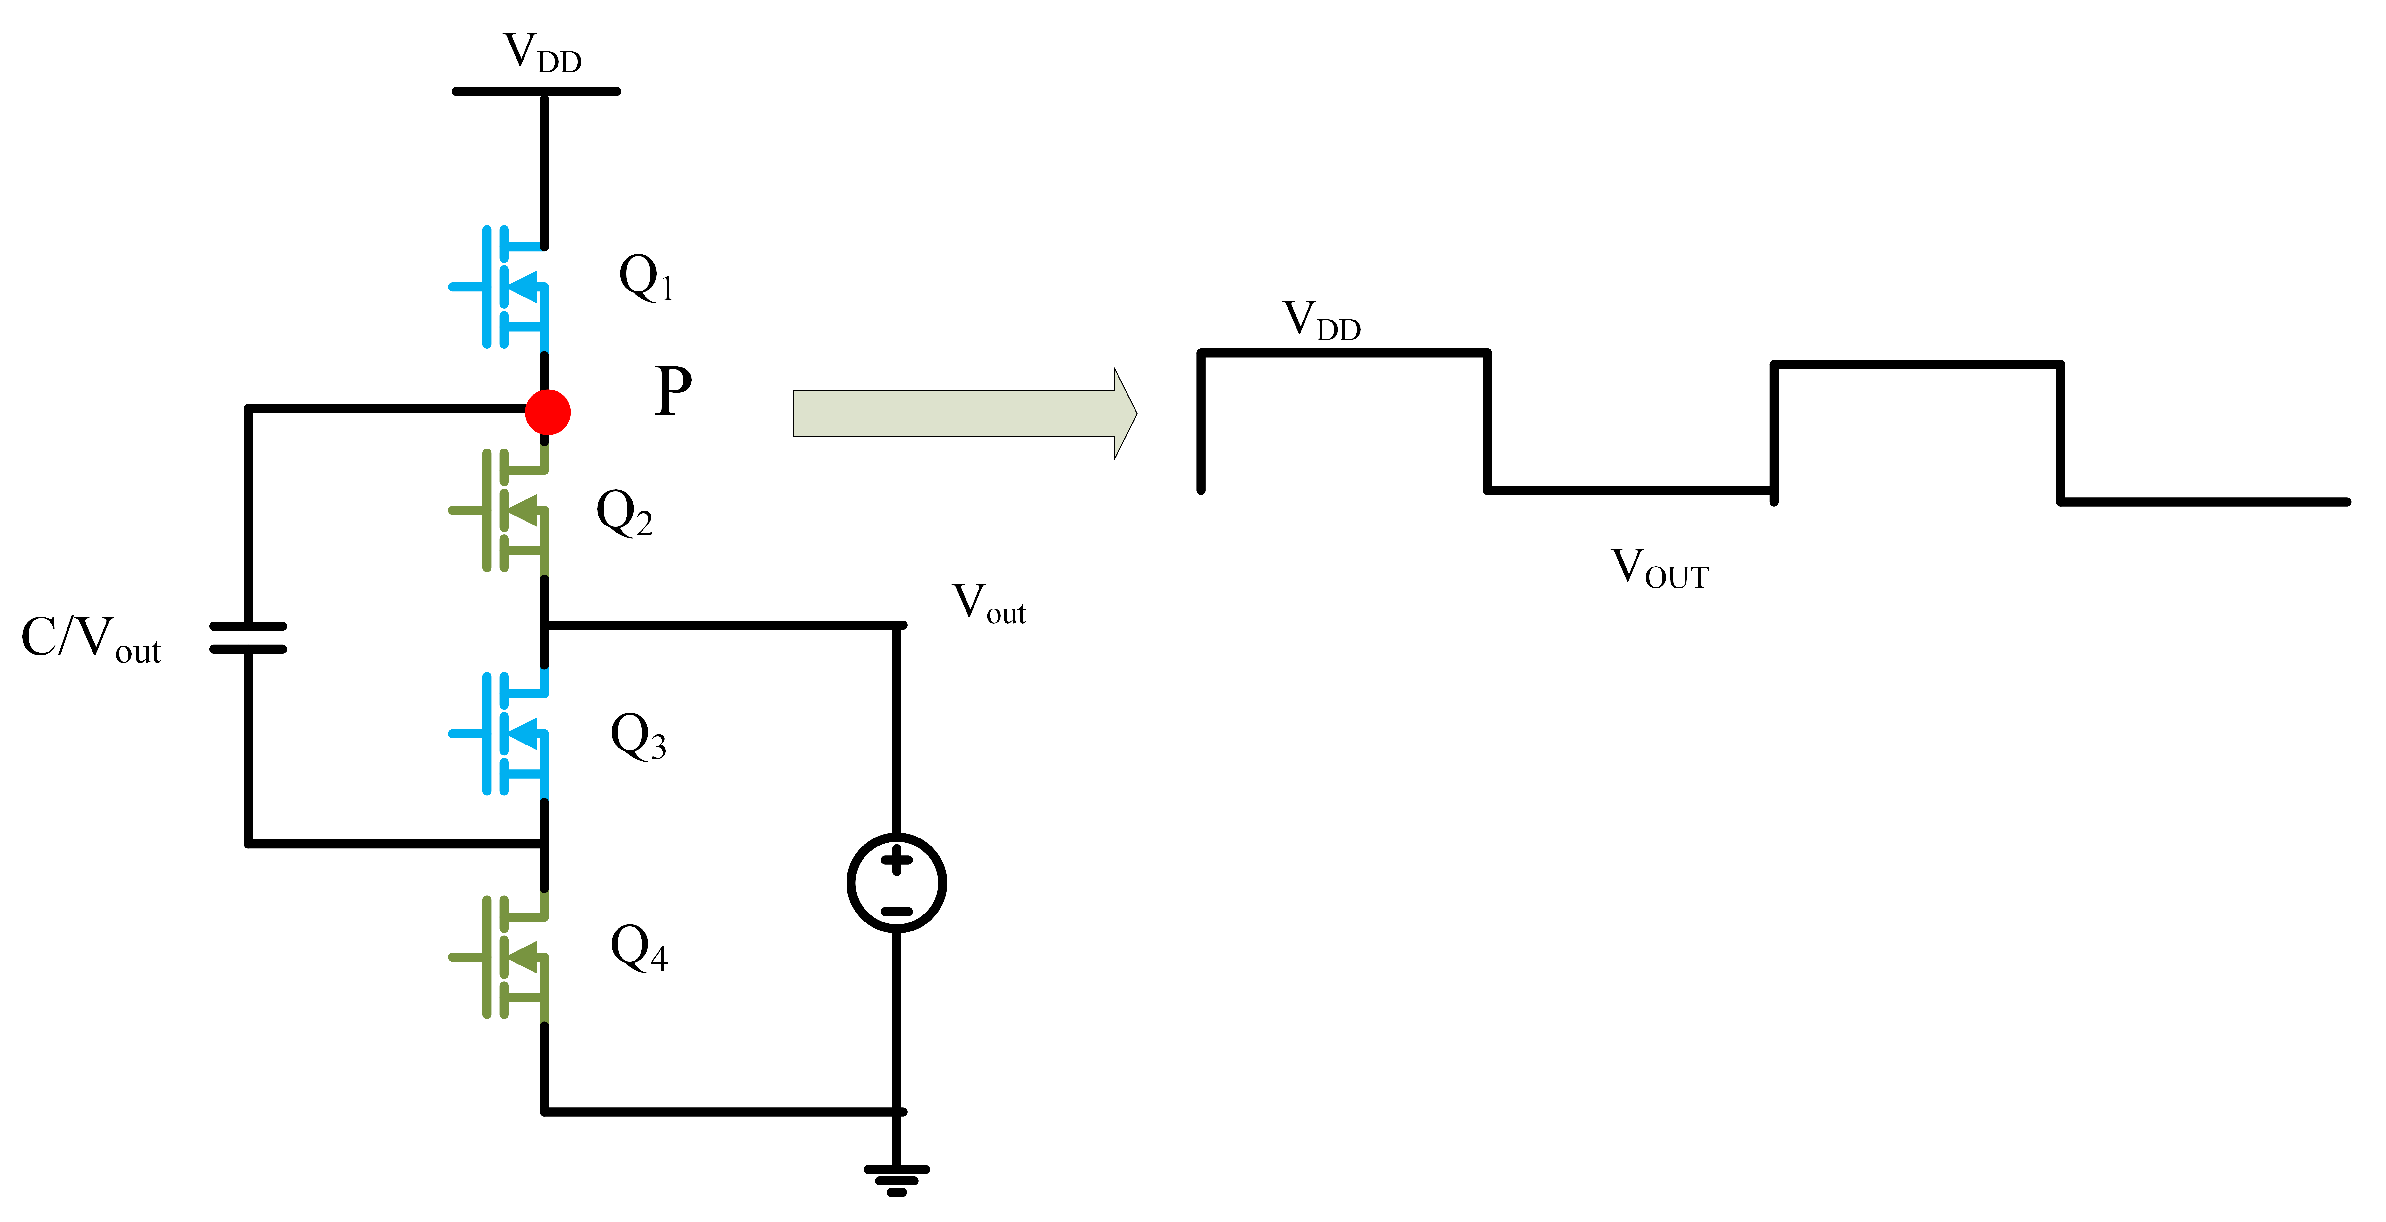
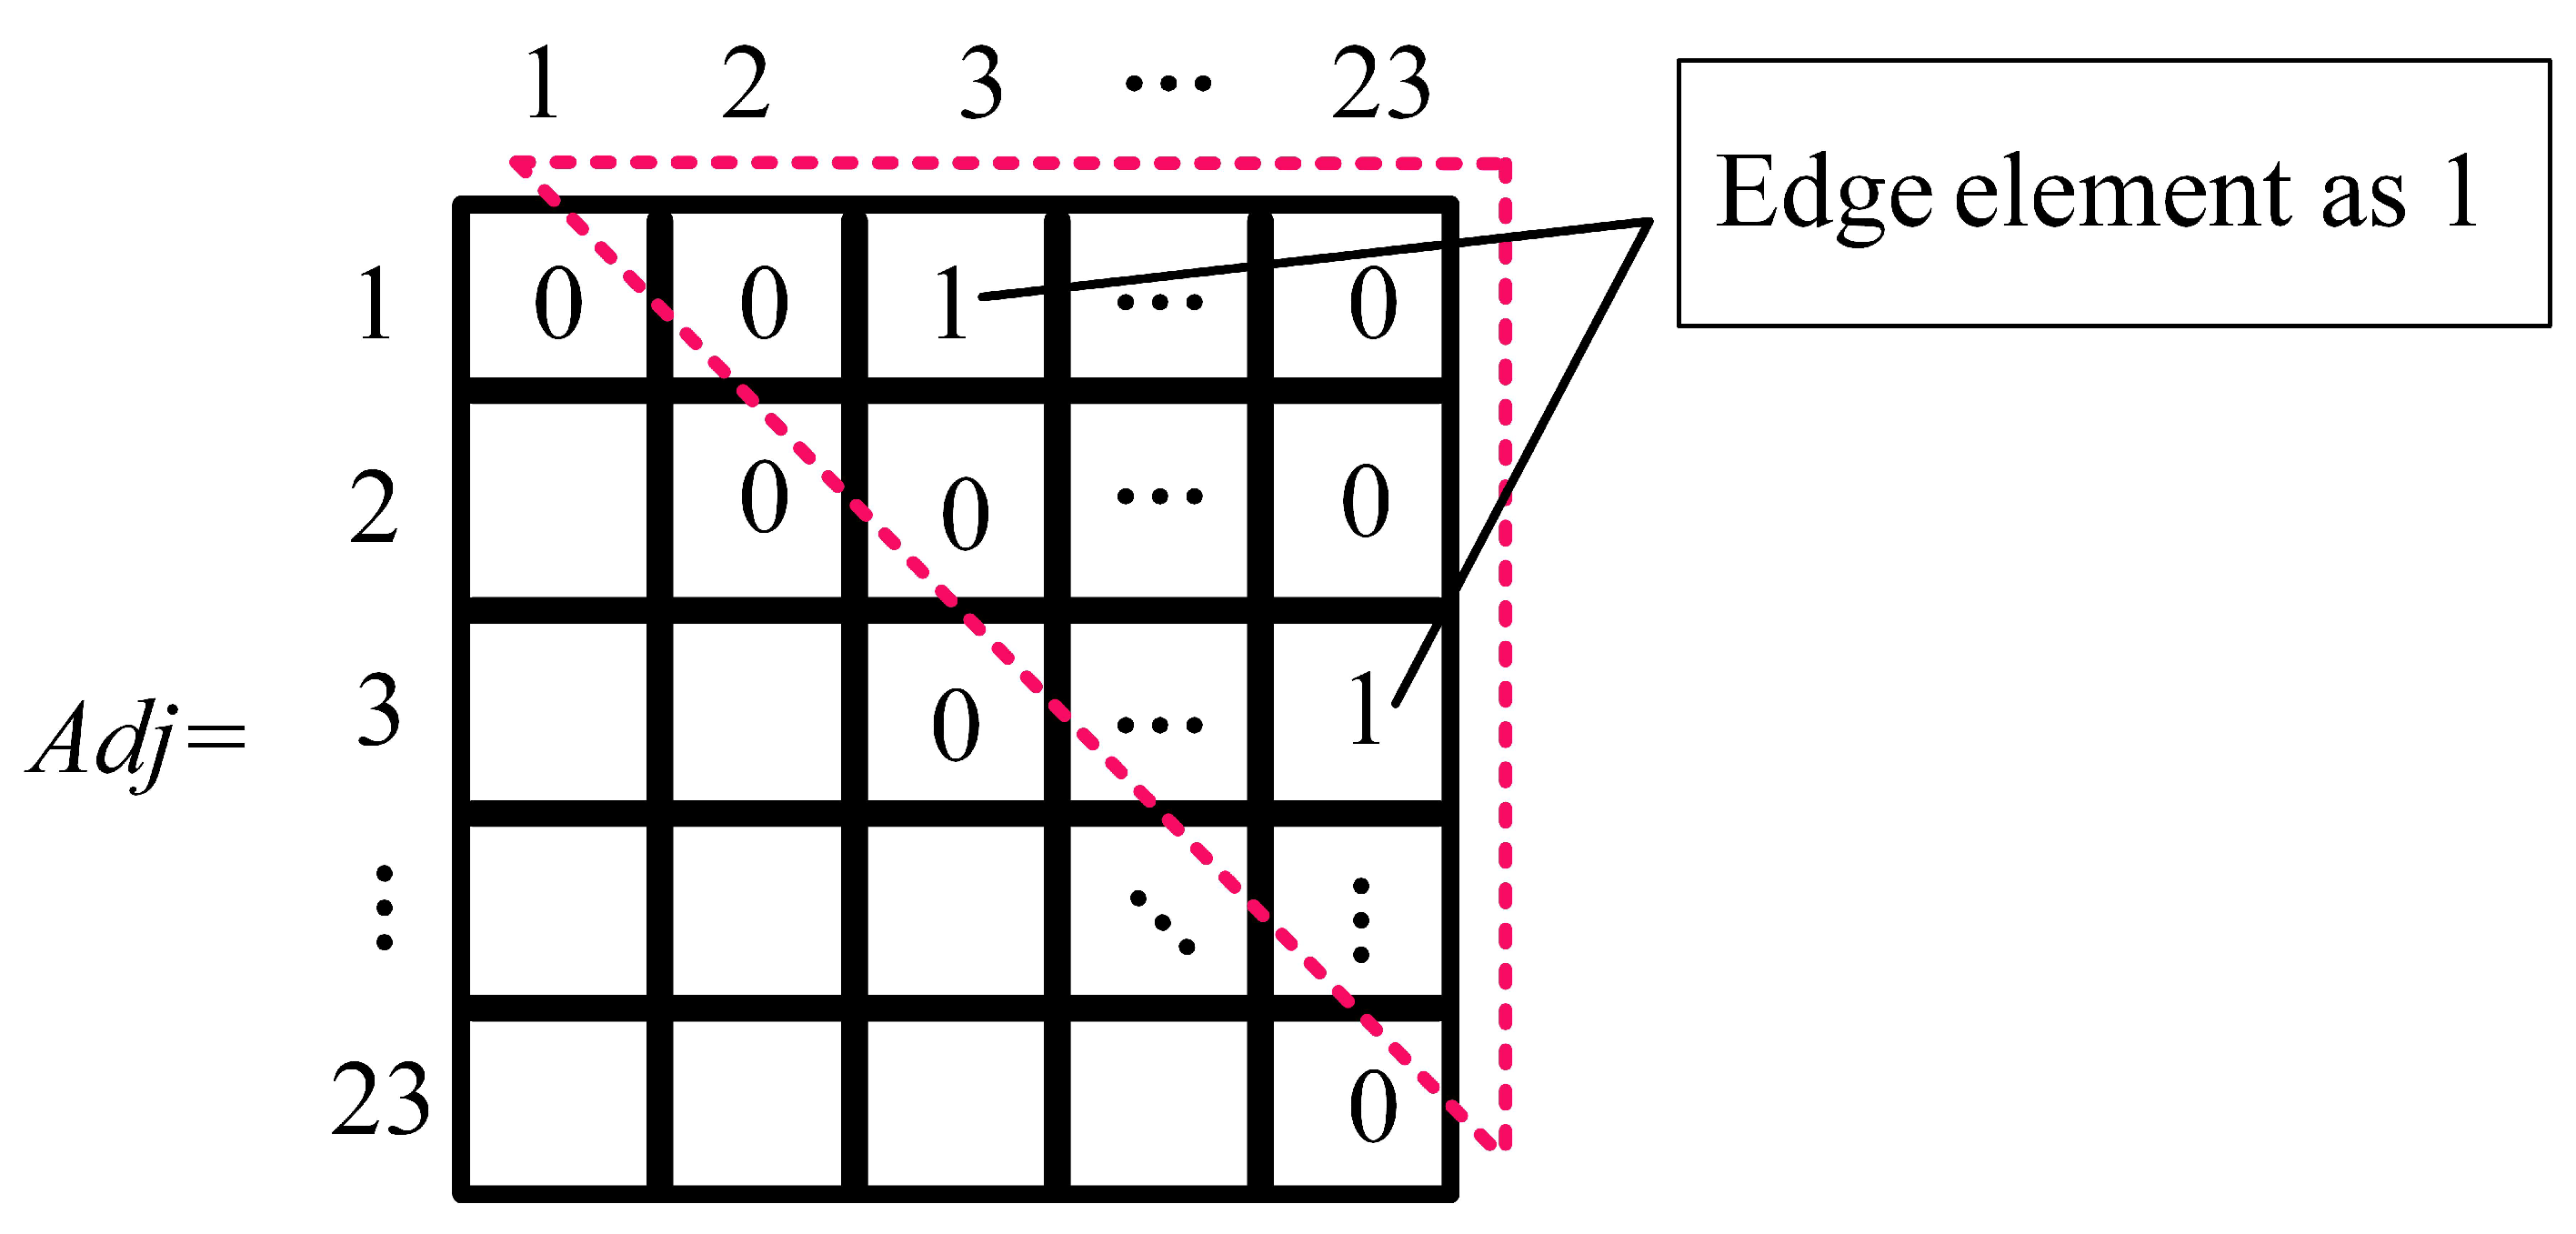
3. Mathematical Model of SCC Topologies

Due to the high switching frequency and large capacitance of energy-transfer capacitors in SCCs, the voltage of the capacitor can be viewed as constant in the steady state, in keeping with long-standing opinion. The voltage waveform of each node in the two-phase SCC can be viewed as a square wave composed of two levels when the circuit’s parasitic parameters are neglected. For example, The voltage waveform of node P in a 2-to-1 Doubler is shown in Figure 5. In phase 1, the voltage of node P is equal to V D D , as Q 1 is conducted, while node P is connected to the output terminal in phase 2, because Q 2 is conducted.
Based on the analysis above, the voltage waveform of node P can be expressed by a two-dimensional array [ V D D , V O U T ] , which presents each voltage level in its respective phase.
The optional range of the node voltage level is a particular set of positive integers that can be divisible by the maximum common factor of the input and output voltage. For example, if the SCC converts voltage from 48 V to 12 V, the node voltage levels are then selected from the set (0 V, 12 V, 24 V, 36 V, 48 V). For simplicity, the voltage conversion ratio can be rewritten as 4-to-1, while the selectable voltage level set can be represented as (0,1,2,3,4). The proposed two-dimensional array can label each node in the SCC topology uniquely; the nodes with same label share identical voltage waveforms in operation, which means that they can be connected. Therefore, the input terminal and output terminal in a 4-to-1 SCC can be expressed as [ 4 , 4 ] and [ 1 , 1 ] , respectively. Furthermore, the two-dimension array [ V 1 , V 2 ] can be transferred into a decimal number k by
k = V 1 M + V 2
where M is the maximum common factor of the input and output voltage and V 1 and V 2 are the node voltage in phase 1 and phase 2, respectively.
From the mathematical perspective, an SCC topology can be considered as a graph. The adjacent matrix [20] can be used to describe the SCC topology after every node is marked uniquely. As shown in Figure 6, the matrix element is 1 if there is a switch or a capacitor between the corresponding node, otherwise the element is 0. Additionally, the dimension of the adjacent matrix is equal to the N, which is equal to ( M + 1 ) 2 , as the two elements range from [ 0 , M ] . Obviously, the obtained adjacent matrix is a symmetric matrix, as the equation Adj[i][j]=Adj[j][i] always exists.

4. Efficiency Prediction Based on Convolutional Neural Network

The proposed performance evaluation method aims to use the existing topology database to provide an efficient SCC topology for different kinds of applications under fixed input and output condition. This method can greatly reduce the time and cost of the design cycle. The evaluation scheme is illustrated in this section.

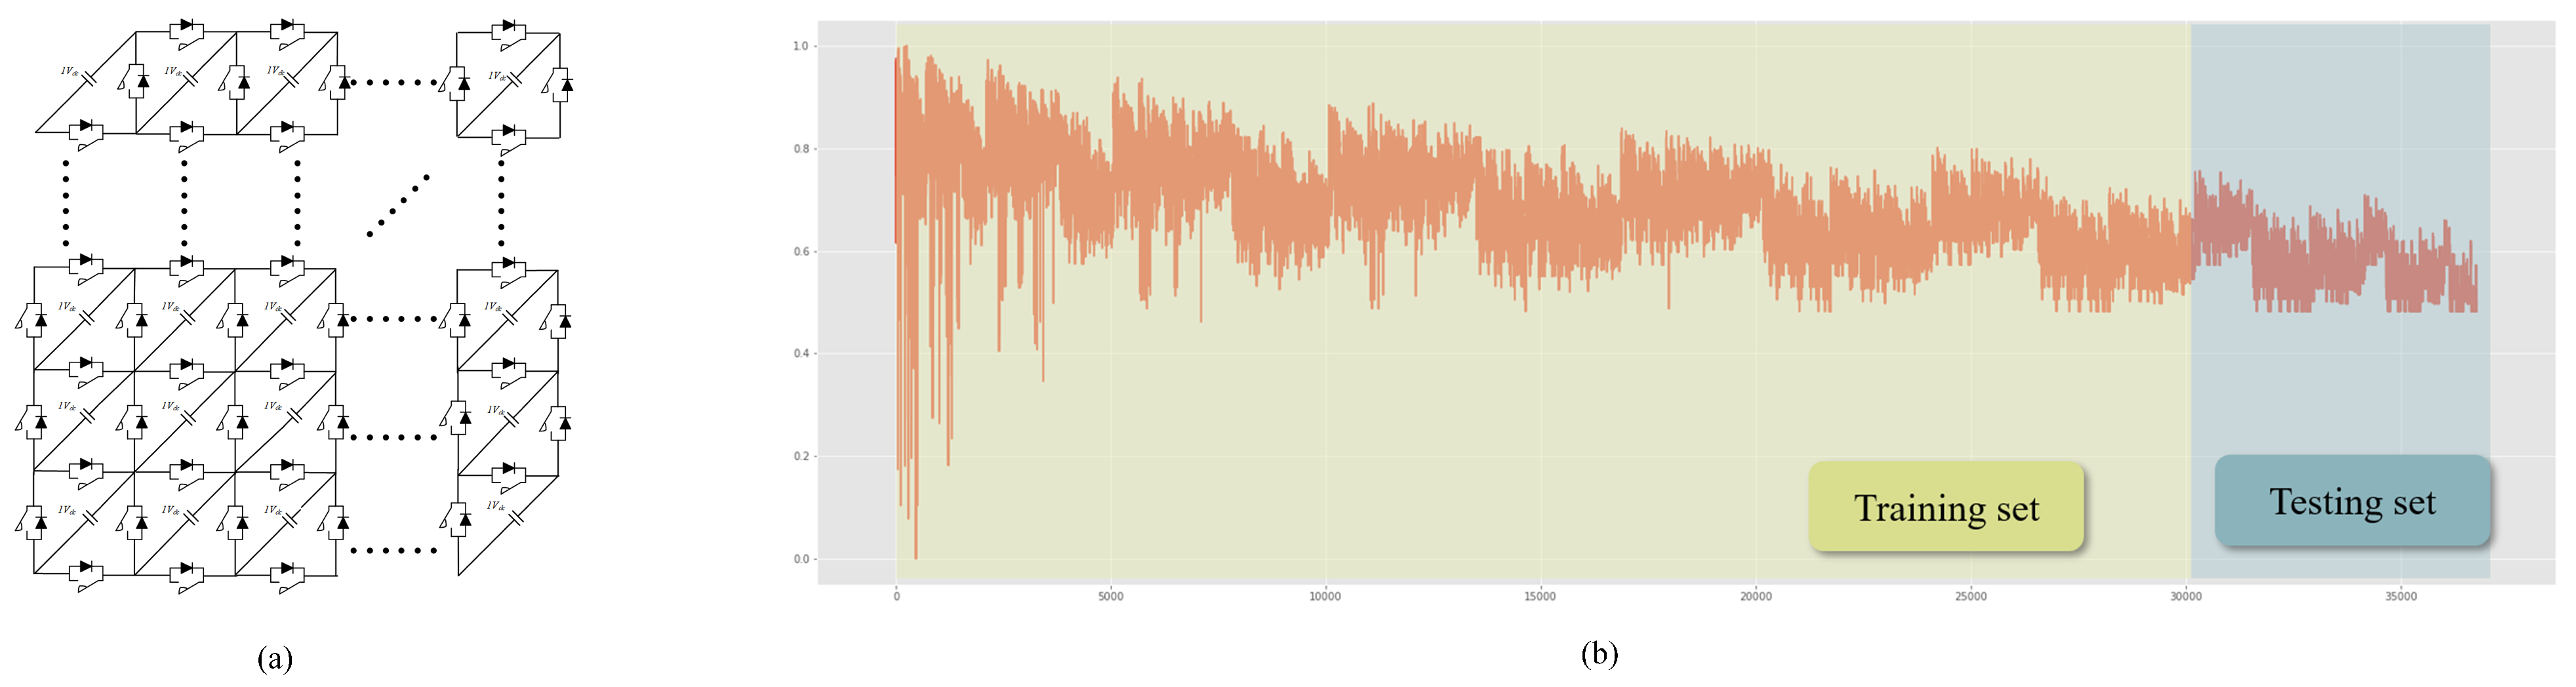
4.1. Data Collection and Preprocess

Different SCC topologies are input to a CNN model in the form of their adjacent matrix, as shown in Figure 6. The model randomly selects 36,000 different 4-to-1 SCC topologies, then their full-load efficiency η is acquired by parallel simulation (Matlab/Simulink) and normalized. After complicated simulation and data processing based on the model shown in Figure 7, the efficiency data corresponding to each topology is obtained. Conduction loss, switch loss, and driving loss are taken into consideration. Table 2 shows the detailed simulation parameters. As shown in Figure 7, the normalized data were divided into a training set and a testing set at a ratio of 5:1 after random sorting to remove data correlation.

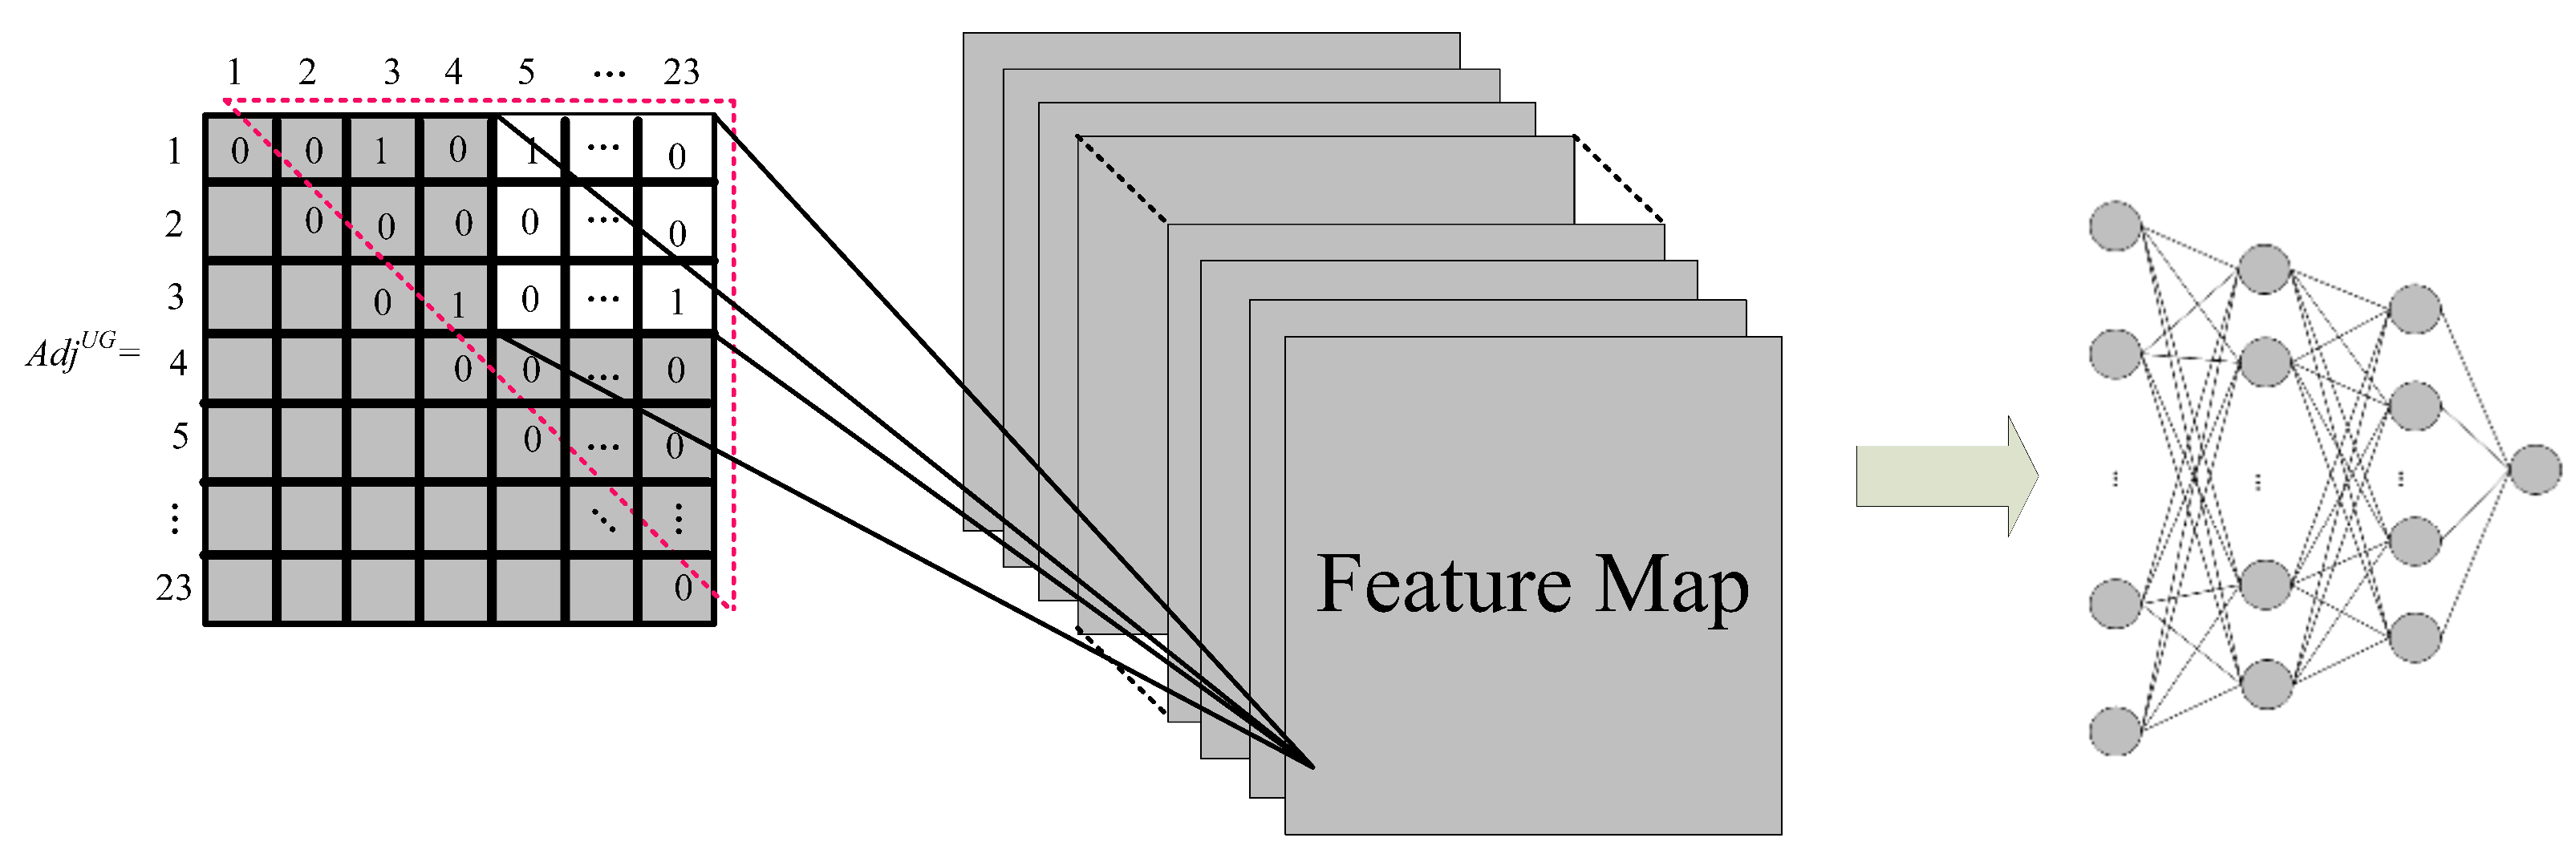
4.2. Convolutional Neural Network Construction

A convolutional neural network (CNN) is a supervised deep learning algorithm that differs from typical neural networks in using convolution as an activation function. It is superior at dealing with matrix information or image processing, applied here to learning the underlying relationship between the adjacent matrices of SCC topologies and the conversion efficiency η . Figure 8 shows the structure of the applied CNN model, which was composed of a feature extraction part and a regression analysis part [21]. The former consisted of convolution layers, while the later consisted of fully connected hidden layers in which a non-linear activation function was employed in the neurons for nonlinear regression. Finally, the prediction efficiency was realized through the output layer. The loss function was defined as the mean absolute percentage error (MAPE), calculated as follows:
MAPE = | A F | A × 100 N
The hyperparameters of the CNN model were adjusted by observing the convergence in the loss function of the training set. Finally, the Rectified Linear Unit (ReLU) was defined as the activation function of the hidden layer, and Sigmoid was selected as the activation function of the output layer. The number of epochs was set to as 50 and the Adam optimizer was selected. The details of the the CNN model structure are shown in Table 3.

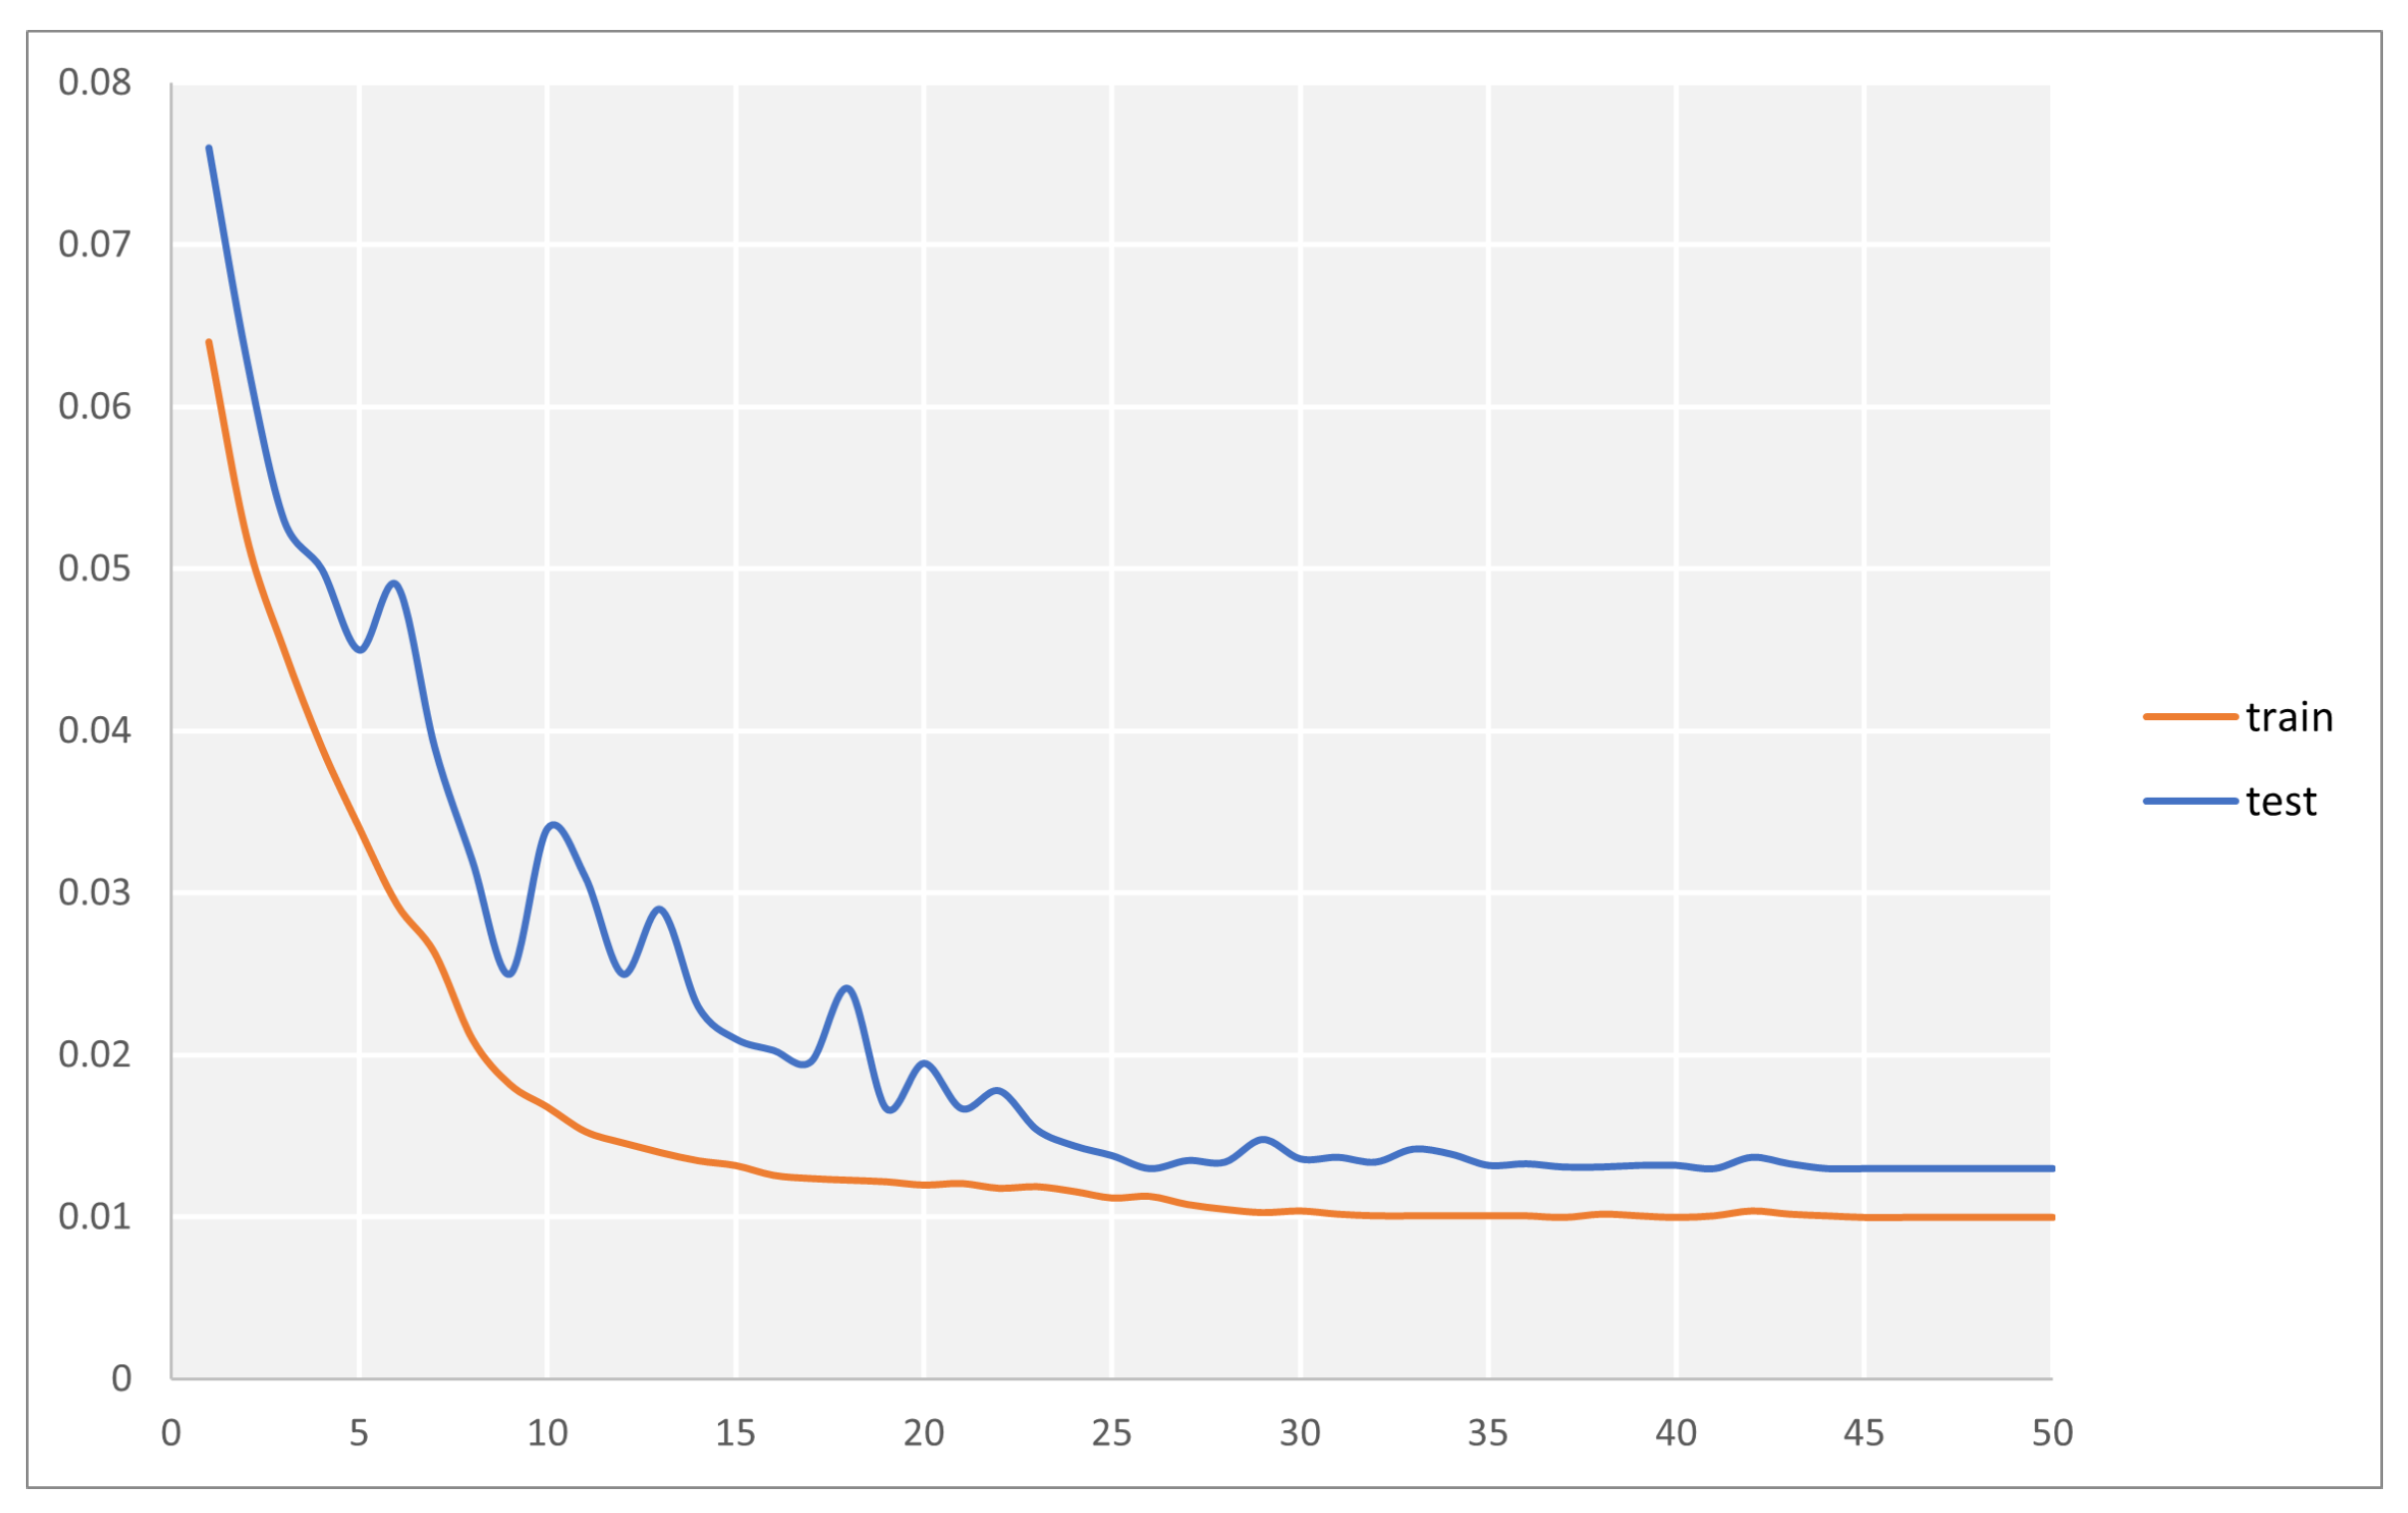
5. Result and Analysis

Compared to hours of parallel simulation, the CNN algorithm can greatly shorten the calculation time and only needs several minutes to obtain the evaluation result of six thousand topologies. The convergence curve of the CNN model is shown in Figure 9. After 30 iterations, the error function gradually became constant. A comparative experiment with alternative artificial neural network (ANN) and linear regression approaches was designed to verify the outstanding performance of the CNN model. The details on the artificial neural network model are shown in Table 4. The hyperparameters of the ANN were coordinated with those of the CNN, while the linear regression model can be expressed by
y ^ = W · x + b
The prediction result of the different methods are shown in Figure 10. The red line represents the real efficiency data, while the blue line shows the prediction results. All the methods were able to predict the results to an extent, which proves the relationship between the topology and conversion efficiency. Prediction accuracy is the most intuitive evaluation indicator of model performance. Compared with linear regression and ANN, CNN is superior in prediction accuracy, as expected. The convolution algorithm can extract topology feature effictively and predict the operation performance based on its conversion structure. Table 5 shows the prediction error of each method. The MAPE of the CNN model is 0.013, while for linear regression it is 0.07 and for ANN it is 0.03. Although the convergence speed of CNN is slower than the other two methods, it nonetheless saves a great deal of time compared with parallel simulation and manual evaluation, which can accelerate the design process compared to the current state-of-the-art.
These results show that the CNN model clearly outperforms the other two models. CNN can better fit the efficiency trend of different topologies, which clearly indicates it as a preferred choice for performance prediction of SCCs.

6. Conclusions and Future Work

This paper proposes a new evaluation performance method for SCCs by transforming the topology optimization issue into a typical nonlinear regression problem. Under the assumption that each capacitor value is same, an SCC can be described by means of its adjacent matrix. The method proposed in this paper outperforms existing evaluation methods in finding the most applicable topology, as well as in calculation efficiency and accuracy. A CNN model was selected to solve the regression problem. Our experimental results confirm that the CNN model greatly shortens the calculation time and that its prediction accuracy is within expectations. In our future work, we intend to continue our performance evaluation research using other machine learning methods, such as Graph Neural Network (GNN) and XGboost. Additional research efforts will be directed towards the efficiency evaluation of SCCs with parasitism and soft-switching converters, which could further facilitate the application of SCCs in industry.

Author Contributions

Conceptualization, W.H., J.Z. (Jihong Zhu) and P.D.; methodology, W.H. and L.L.; software, W.H. and Y.D.; validation, W.H., P.D., J.Z. (Jihong Zhu) and J.Z. (Jing Zhou); formal analysis, W.H. and Y.D.; investigation, J.Z. (Jihong Zhu) and P.D.; resources, J.Z. (Jing Zhou) and L.L.; data curation, W.H. and L.L.; writing—original draft preparation, W.H. and J.Z. (Jing Zhou). writing—review and editing, W.H. and P.D.; visualization, W.H. and Y.D.; supervision, J.Z. (Jing Zhou) and Y.D.; project administration, J.Z. (Jing Zhou) and L.L.; funding acquisition, J.Z. (Jing Zhou). All authors have read and agreed to the published version of the manuscript.

Funding

This work was financially supported by Planning and preliminary research of conventional hydropower capacity expansion and long-term energy storage pumped storage in Zhejiang Province.

Institutional Review Board Statement

Not applicable.

Informed Consent Statement

Not applicable.

Data Availability Statement

Not applicable.

Conflicts of Interest

The authors declare no conflict of interest.

Abbreviations

The following abbreviations are used in this manuscript:
SCCSwitched-capacitor converter
CTVCharge transfer vertor
KCLKirchhoff current law
CNNConvolutional neural network

References

  1. Ye, Z.; Lei, Y.; Pilawa-Podgurski, R.C.N. A 48-to-12 V Cascaded Resonant Switched-Capacitor Converter for Data Centers with 99% Peak Efficiency and 2500 W/in3 Power Density. In Proceedings of the 2019 IEEE Applied Power Electronics Conference and Exposition (APEC), Anaheim, CA, USA, 17–21 March 2019; pp. 13–18. [Google Scholar] [CrossRef]
  2. Seeman, M.D.; Sanders, S.R. Analysis and Optimization of Switched-Capacitor DC–DC Converters. IEEE Trans. Power Electron. 2008, 23, 841–851. [Google Scholar] [CrossRef]
  3. Seo, G.S.; Le, H.-P. S-Hybrid Step-Down DC–DC Converter—Analysis of Operation and Design Considerations. IEEE Trans. Ind. Electron. 2020, 67, 265–275. [Google Scholar] [CrossRef]
  4. Dickson, J. On-chip high-voltage generation in MNOS integrated circuits using an improved voltage multiplier technique. IEEE J. Solid-State Circuits 1976, 11, 374–378. [Google Scholar] [CrossRef]
  5. Seeman, M.D. A Design Methodology for Switched-Capacitor DC-DC Converters. Ph.D. Thesis, EECS Department, University of California, Berkeley, CA, USA, 2009. [Google Scholar]
  6. Hamo, E.; Evzelman, M.; Peretz, M.M. Modeling and Analysis of Resonant Switched-Capacitor Converters With Free-Wheeling ZCS. IEEE Trans. Power Electron. 2015, 30, 4952–4959. [Google Scholar] [CrossRef]
  7. Hussein, S.H.; Yaseen, M.T. Performance Evaluation of Low-Voltage CMOS Switched-Capacitor Circuit. In Proceedings of the 2021 8th International Conference on Electrical and Electronics Engineering (ICEEE), Antalya, Turkey, 9–11 April 2021; pp. 40–43. [Google Scholar] [CrossRef]
  8. Kushnerov, A.; Ben-Yaakov, S. Algebraic synthesis of Fibonacci Switched Capacitor Converters. In Proceedings of the 2011 IEEE International Conference on Microwaves, Communications, Antennas and Electronic Systems (COMCAS 2011), Tel Aviv, Israel, 7–9 November 2011; pp. 1–4. [Google Scholar] [CrossRef] [Green Version]
  9. Gupta, A.; Raizada, S. Step-down Fibonacci switched capacitor converters- a topological design method. In Proceedings of the 2020 IEEE 17th India Council International Conference (INDICON), New Delhi, India, 10–13 December 2020; pp. 1–6. [Google Scholar] [CrossRef]
  10. Mo, L.; Chen, G.; Huang, J. From Components to Converters: A Fundamental Topology Derivation Method for Single-Inductor Multi-Input Multi-Output Converters Based on Graph Theory. In Proceedings of the 2021 IEEE International Conference on Power Electronics, Computer Applications (ICPECA), Shenyang, China, 22–24 January 2021; pp. 458–463. [Google Scholar] [CrossRef]
  11. Peng, F.Z. A generalized multilevel inverter topology with self voltage balancing. IEEE Trans. Ind. Appl. 2001, 37, 611–618. [Google Scholar] [CrossRef]
  12. Gerlach, A.; Scheible, J.; Rosahl, T.; Eitrich, F.T. A generic topology selection method for analog circuits demonstrated on the OTA example. In Proceedings of the 2015 11th Conference on Ph.D. Research in Microelectronics and Electronics (PRIME), Glasgow, UK, 29 June–2 July 2015; pp. 77–80. [Google Scholar] [CrossRef]
  13. Ferro, E.; Brea, V.M.; Lopez, P.; Cabello, D. Dynamic Model of Switched-Capacitor DC–DC Converters in the Slow-Switching Limit Including Charge Reusing. IEEE Trans. Power Electron. 2017, 32, 5293–5311. [Google Scholar] [CrossRef]
  14. Panda, K.P.; Bana, P.R.; Panda, G. Reduced Switch Count Seven-level Self-Balanced Switched-Capacitor Boost Multilevel Inverter. In Proceedings of the 2020 IEEE International Conference on Power Electronics, Drives and Energy Systems (PEDES), Jaipur, India, 16–19 December 2020; pp. 1–6. [Google Scholar] [CrossRef]
  15. Barzegarkhoo, R.; Lee, S.S.; Khan, S.A.; Siwakoti, Y.P.; Lu, D.D.-C. A Novel Generalized Common-Ground Switched-Capacitor Multilevel Inverter Suitable for Transformerless Grid-Connected Applications. IEEE Trans. Power Electron. 2021, 36, 10293–10306. [Google Scholar] [CrossRef]
  16. Navidi, M.M.; Graham, D.W. A Regulated Charge Pump with Extremely Low Output Ripple. Electronics 2019, 8, 1293. [Google Scholar] [CrossRef] [Green Version]
  17. Hsu, C.P.; Lin, H. Analytical Models of Output Voltages and Power Efficiencies for Multistage Charge Pumps. IEEE Trans. Power Electron. 2010, 25, 1375–1385. [Google Scholar] [CrossRef]
  18. Makowski, M.; Maksimovic, D. Performance limits of switched-capacitor DC-DC converters. In Proceedings of the Proceedings of PESC’95—Power Electronics Specialist Conference, Atlanta, GA, USA, 18–22 June 1995; Volume 2, pp. 1215–1221. [Google Scholar] [CrossRef]
  19. Chung, H.; Ioinovici, A. Development of a generalized switched-capacitor DC/DC converter with bi-directional power flow. In Proceedings of the 2000 IEEE International Symposium on Circuits and Systems (ISCAS), Geneva, Switzerland, 28–31 May 2000; Volume 3, pp. 499–502. [Google Scholar] [CrossRef]
  20. Leordeanu, M.; Hebert, M. A spectral technique for correspondence problems using pairwise constraints. In Proceedings of the Tenth IEEE International Conference on Computer Vision (ICCV’05), Beijing, China, 17–21 October 2005; Volume 2, pp. 1482–1489. [Google Scholar] [CrossRef] [Green Version]
  21. Li, D.; Shang, D.; Xia, F.; Yakovlev, A. Modelling Switched-Capacitor DC-DC Converters with Signal Transition Graphs. In Proceedings of the 2018 15th International Conference on Synthesis, Modeling, Analysis and Simulation Methods and Applications to Circuit Design (SMACD), Prague, Czech Republic, 2–5 July 2018; pp. 1–100. [Google Scholar] [CrossRef]
Figure 1. Equivalent model of SCC.
Applsci 12 07833 g001
Figure 2. (a) Interleaved Doubler SCC topology. (b) Phase 1, (c) Phase 2.
Applsci 12 07833 g002
Figure 3. Equivalent circuits of Interleaved Doubler with parasitic resistor.
Applsci 12 07833 g003
Figure 4. Influence factors of charge flow conditions.
Applsci 12 07833 g004
Figure 5. Voltage waveform of node P in 2-to-1 Doubler.
Applsci 12 07833 g005
Figure 6. Adjacent matrix.
Applsci 12 07833 g006
Figure 7. (a) Model for parallel simulation in Matlab and (b) the dataset for the CNN model.
Applsci 12 07833 g007
Figure 8. Scheme of applied CNN.
Applsci 12 07833 g008
Figure 9. Convergence curve of CNN model.
Applsci 12 07833 g009
Figure 10. Comparison with other machine learning algorithms.
Applsci 12 07833 g010
Table 1. Comparison with existing methods.
TopologyEfficiencyAccuracy
M.Navidi et al. [16]SimpleHighMedium
H.Lin et al. [17]ComplicatedLowHigh
M.Makowski et al. [18]MediumHighLow
This paperComplicatedHighHigh
Table 2. Simulation Parameters.
ParameterValue
Input Voltage V i n 48 V
Output Voltage V o u t 12 V
Switching frequency f s w 1 MHz
Rated output power P o u t 120 W
ESR of capacitor R e s r 2 mΩ
Table 3. Details of the CNN model.
LayerCNN Model Parameter
Input layer25 neurons
Conventional layerEight 3 × 3 conv2d padding = 1
Fully connected layer 1128 neurons
Dropout layer0.5
Fully connected layer 2Eight neurons
Dropout layer0.5
Fully connected layer 3One neuron
Table 4. Details of the ANN model.
LayerANN Model Parameter
Input layer25 neurons
Fully connected layer 1128 neurons (ReLU)
Dropout layer0.5
Fully connected layer 2Eight neurons (ReLU)
Dropout layer0.5
Fully connected layer 3One neurons (Sigmoid)
Table 5. Comparison of implemented CNN model, ANN, and linear regression.
MSEMAPECalculation Time (s)
CNN0.00720.013403
ANN0.01680.032139
Linear Regression0.03230.07072
Publisher’s Note: MDPI stays neutral with regard to jurisdictional claims in published maps and institutional affiliations.

