Article

Stable Matching of Users in a Ridesharing Model

by
Daniel Fajardo-Delgado
1,
Carlos Hernández-Bernal
1,
María Guadalupe Sánchez-Cervantes
1,*,
Joel Antonio Trejo-Sánchez
2,
Ismael Edrein Espinosa-Curiel
3 and
Jesús Ezequiel Molinar-Solis
1
1
Department of Systems and Computation, Tecnológico Nacional de México/Instituto Tecnológico de Cd. Guzmán, Ciudad Guzmán 49100, Mexico
2
CONACyT-Centro de Investigación en Matemáticas A.C., Merida 97302, Mexico
3
CICESE-UT3, Tepic 63155, Mexico
*
Author to whom correspondence should be addressed.
Appl. Sci. 2022, 12(15), 7797; https://doi.org/10.3390/app12157797
Submission received: 7 July 2022 / Revised: 27 July 2022 / Accepted: 29 July 2022 / Published: 3 August 2022
(This article belongs to the Topic Intelligent Transportation Systems)

Abstract

:
A ridesharing system is a transport mode where two or more users share the same vehicle and divide the trip’s expenses based on similar routes and itineraries. Popular ridesharing systems, such as Uber, Flinc, and Lyft, define a matching among users based only on the coincidence of routes. However, these systems do not guarantee a stable matching (i.e., a matching in which no user prefers another different from the assigned one). In this work, a new ridesharing system model is proposed, including three types of trips: identical, inclusive, and partial. This model is used to introduce a new algorithm to address the stable matching problem for ridesharing systems. Finally, a set of experimental simulations of the proposed algorithm is conducted. Experimental results show that the proposed algorithm always produces a stable matching.

1. Introduction

Vehicular congestion is a growing problem and one of the main challenges in most cities in Mexico. Only in the metropolitan area of the Mexico valley, 6.60 million of trips are made daily in a private vehicle, where the average number of occupants per vehicle is barely 1.5 users [1]. Within this area, Mexico City stands out as the city with the highest traffic congestion in North America, with a time lost in rush hours per year of four days and twenty-three hours (Tomtom Traffic Index Ranking 2021. Available at: https://www.tomtom.com/en_gb/traffic-index/mexico-city-traffic/ (date of consultation: 25 July 2022)). This traffic congestion is in part because most users tend to use private vehicles rather than public transport, despite the adverse impact both economically and environmentally [2,3]. Traffic congestion also implies a considerable economic investment in road infrastructure and security controls.
Some public policies and technological solutions have been proposed to mitigate the problem of vehicular congestion. An example of a public policy in this vein is the implementation of the ‘today does not circulate’ program in Mexico (“hoy no circula” in Spanish), in which some restrictions are applied to the usage of the vehicle for certain days [4]. Some technological solutions raised to cope with this problem are autonomous vehicles [5,6], vehicular networks [7], Internet of Things [8], among others [9]. From these technological solutions, ridesharing systems stand out by their current applicability [10,11]. A ridesharing system is a mode of transportation where two or more users share the same vehicle and divide travel expenses (such as fuel, tolls, and parking fees) based on similar routes and itineraries [12,13]. Compared to other conventional means of transport, a ridesharing system maintains the flexibility and comfort of a particular vehicle in combination with rates and prices similar to public transportation [14].
Nowadays, ridesharing systems support a dynamic allocation process between participants considering times and routes [13]. The demand of multiple users (passengers and drivers) seeking to share a trip implies defining a relationship between them. Establishing this relationship of users based on their preferences is known as the ride-matching problem [15,16]. Current ridesharing systems provided by companies such as Uber (https://www.uber.com/, accessed on 25 July 2022), Flinc (https://flinc.org/, accessed on 25 July 2022), and Lyft (http://www.lyft.me, accessed on 25 July 2022) are based on a simple matching algorithm that allocates users only based on their traveling route [17,18]. According to [18,19], these commercial systems employ a user-matching scheme limited by two main aspects: (1) the driver’s destination depends on the passenger’s destination; (2) the cost of the service is defined by a provider based on distances and times, without considering the cost-sharing of both the passenger and the driver.
According to [20], the extant literature on the ride-matching problem focuses mainly on settings considering ridesharing optimization, dynamic ridesharing pricing, and cost-sharing schemes. Some works regarding ridesharing optimization address issues about vehicle routes and the improvement of ridesharing matching rates [13,21]. For example, Guan et al. [22] studied the bounded rational users’ travel decision-making from a perspective of a multi-objective problem. In particular, they sought to maximize the number of users willing to share a trip while minimizing the total vehicle usage cost. On the other hand, research on dynamic ridesharing pricing commonly addresses several problems with the pricing and dispatching rules governing the ridesharing platforms [23]. A particular concern in these works is that trips may be mispriced relative to each other, especially when spatial imbalance and temporal variation of supply and demand incentivize drivers [24]. Finally, other research efforts study cost-sharing schemes about allocating cost savings as an important factor in the adoption of ridesharing by the users [25,26,27]. In [25], Hsieh et al. proposed a simple cost-sharing scheme based on a double auction mechanism involving the passenger and the driver. Their solution approach includes a particle swarm optimization algorithm to maximize cost savings while respecting timing constraints. In [26], a study to compare metaheuristic algorithms intended to optimize monetary incentives in ridesharing systems is performed. A theoretical study on the comparison of cost-sharing schemes in ridesharing literature is proposed in [27] to provide a guideline for characterizing the performance of proportional methods. Nevertheless, compared with the current research on these topics, a limited number of works on the ride-matching problem deal with stable matching (a matching in which no user prefers another different from the assigned one).
Formally, the stable matching problem represents a pairwise relationship M between users of two disjoint sets, passengers and drivers, where no user prefers to other one different from the current assigned [28]. Given two passengers, p 1 and p 2 , and two drivers, d 1 and d 2 , where the assigned pairs ( p 1 , d 2 ) and ( p 2 , d 1 ) are part of a matching M. A  blocking pair ( p 1 , d 1 ) exists with respect to M if p 1 prefers to d 1 more than d 2 , and  d 1 prefers to p 1 more than p 2 . Formally, a stable matching exists if there is no blocking pairs. The concept of stability can be applied to different matching models such as one-to-one [28], many-to-one [29], and many-to-many [30]. However, finding a stable matching (in any of its variants) of maximum cardinality is NP-hard [31].
In particular, the ride-matching problem can be studied through the well-known hospital/resident problem proposed in [31], in which a set of medical residents seek a position in a set of hospitals. While each resident ranks hospitals according to their preferences, each hospital ranks the applicant residents for its available positions. If the number of available hospital resident positions and the number of medical applicants is different, the problem is the stable matching with incomplete lists. Stability is not possible for different cardinalities in the matching sets [31].
A variety of matching models explore the concept of stability for dynamic ridesharing considering relationships of one-to-one or many-to-one. While one-to-one matching applies to a simple setting with unit vehicle capacity [32,33,34,35,36], many-to-one matching allows multi-capacity settings. Regarding the many-to-one matching, where one vehicle can serve multiple passengers simultaneously, some research efforts have been proposed [37,38,39]. For example, a recent taxi-sharing model considering many-to-one matching is proposed in [37]. The passenger’s preference depends on the taxi and the co-riders in their model, which is reformulated to a scheme-based set partitioning model that a branch-and-price algorithm can solve. The proposed branch-and-price algorithm achieves stable matchings and, in some cases, nearly stable matchings. In [38], a many-to-one matching model involving shared autonomous vehicles (SAV) is proposed. Their model characterizes the waiting times of an SAV and multiple passengers who share rides in the SAV during online matching. A new multimodal autonomous ridesharing user equilibrium is introduced in their work in order to characterize the SAV traveler flow while considering seat capacity utilization. Passengers, dedicated drivers, and SAV have different behaviors impacting the matching decisions regarding these works. On the other hand, from the game-theoretical perspective, a many-to-one matching game is proposed to address stable solutions focused on the route-cost-assignment in [39]. Their model outputs a stable payoff space for the post-evaluation of cost allocation mechanisms. A current comprehensive review of all these topics can be found in [40]. However, most many-to-one matching models providing stable solutions do not consider diverse types of trips between users.
This paper addresses the stable matching of users in ridesharing systems. The contribution of this work is twofold. First, a new ridesharing system model is introduced. This model considers users’ preferences based on two fundamental aspects of the service: travel savings and the reputation of users (both passengers and drivers). Travel savings consider three types of trips (identical, inclusive, and partial), where one of them is novel in the literature. The reputation of users is computed through a modified version of the EigenTrust algorithm [41] for peer-to-peer systems. In the proposed model, a driver may pick up more than one passenger during the trip while respecting timing and capacity constraints, such as the slack time and the number of available seats. To address these constraints, the model assumes that the driver–passenger utility evaluation is independent of interacting with other users. Second, a new stable matching algorithm for the ridesharing system services is presented. This algorithm consists of a new iterated version of the Gale–Shapley algorithm [28]. In contrast with [33,35], in the proposed model, the capacity of each driver can be greater or equal than one, and it does not require that passengers and drivers sets have the same cardinality. To achieve this, the assumption of complete and strict preferences are relaxed through the concept of a ‘waiting list’. A demonstration that the algorithm always guarantees a stable matching solution (as well as its execution time analysis) is provided. Besides, the proposed model and the algorithm’s convergence were also verified empirically through experimental simulations involving a benchmarking of 2880 random bipartite graphs as test cases. Experimental results show that the proposed algorithm always converges to a stable matching solution for all test cases.
This paper is organized as follows. Section 2 defines a new ridesharing model based on two main aspects of the services: the savings and the reputation of users. Section 3 presents the proposed algorithm to solve the stable matching in ridesharing systems. Section 4 describes the experimental simulations conducted to measure the efficiency of the proposed algorithm empirically. Finally, Section 5 presents some concluding remarks and future work.

2. The Proposed Model

A network of roads is modeled through a directed multi-graph G = ( V , A ) , where the set of vertices V represents the intersections or corners in the network, and the set of edges A the road segments. Let u be a user traveling through a path (or route) in G. The route of u, from  v 0 to v k , is a sequence R u = v 0 a 1 v 1 a 2 a k v k , where { v 0 , v 1 , , v k } V , { a 1 , a 2 , , a k } A , and each a i connects v i 1 to v i , i [ 1 , k ] . A route R u = v 0 a 1 v 1 a 2 a j v j is a proper subroute of R u = v 0 a 1 v 1 a 2 a k v k iff j < k y v 0 = v i , a 1 = a i + 1 , v 1 = v i + 1 , , a j = a i + j , v j = v i + j . Additionally, a weight function w : A R + denotes the length of each road segment in G. The total length of R u is computed through the function w ˘ ( R u ) = i = 1 k w ( a i ) , a i included in  R u .
Two types of users, passenger and driver, are defined. Let p be a passenger requesting a ridesharing service to reduce either the costs generated by using its own vehicle or the travel times spent by using public transportation. On the other hand, let d be a driver bidding a ridesharing service by considering σ d available places in its vehicle over the route R d . Both types of users, p and d, can travel together by establishing a joint route R p d as follows:
  • Identical ridesharing: R p = R d , then R p d is also the same.
  • Inclusive ridesharing: R p is a proper subroute of R d (or the opposite). For this case, R p d is equal to this proper subroute.
  • Partial ridesharing: R p d is the longest proper subroute that is common between R p and R d when R p R d .
The type of ridesharing 3 differs from that described in the literature [12,40]. In the partial ridesharing proposed here, it may be that none of the origin or destination points are included in R d . Figure 1 illustrates the types of ridesharing allowed in the proposed model.
Let π p d be the utility of p when he/she shares its trip with d through R p d . Equation (1) models this utility based on two fundamental aspects of the ridesharing service: (1) the travel savings of p by sharing its trip with d expressed by the function s p ( R p d ) ; and (2) the global reputation of d calculated by function r ( d ) [ 0 , 1 ] . The coefficients β 0 and β 1 are two constants weighting the relevance levels for both aspects of the ridesharing service, where β 0 , β 1 > 0 .
π p d = β 0 · s p ( R p d ) + β 1 · r ( d ) .
Note that π p d is not necessarily equal to π d p .
An important assumption of the presented model is that the driver–passenger utility evaluation is independent of interacting with other users. In this vein, travel savings and reputations are computed involving only two users, discarding the information of the others.

2.1. Travel Savings

The cost of the ridesharing service provided by p and d depend on the spatial and temporal characteristics of the trip. Consider a user u (of the type p or d, interchangeably) traveling through the route R u . The transfer cost of u traveling by R u is expressed in Equation (2) by considering the unit price of fuel (gas), the vehicle performance measured by miles per gallon (mpg), and the payment of services such as tolls, parking fees, or public transportation (fees). Note that if u does not have a particular vehicle, the transfer cost only depends on the fees.
c ( R u ) = w ˘ ( R u ) · gas / mpg + fees .
Let z u R u v be the cost savings when u shares its trip with another user v through the joint route R u v . The cost savings depend on the type of user, as expressed in Equation (3).
z u R u v = c ( R u ) c ( R u v ) / 2 , if u is a passenger ; c ( R u v ) / 2 , if u is a driver .
Let t u R u be the estimated length of time in which u travel from its origin to its destination through R u . Then, the time savings of u following a joint route R u v with a user v (instead of its original route) is expressed as t u R u t u R u v . On the other hand, a slack time  η u indicates the time interval in which u is willing to wait for v at the origin point of R u v . Let t u R u v 0 be the instant of time in which u estimates to arrive to the origin point of R u v . Equation (4) computes the total time savings for u considering the joint route R u v .
t u ( R u v ) = t u R u t u R u v + ( η u | t u R u v 0 t v R u v 0 | ) .
Note that, traditionally, η u | t u R u v 0 t v R u v 0 | is positive; however, it could be negative depending of the times saving estimated for the joint route R u v . Thus, the travel savings generated by u when sharing its trip with v through R u v are calculated by Equation (5).
s u ( R u v ) = z u R u v + α t u ( R u v ) ,
where the coefficient α weights the importance assigned by the user about the times, and it allows the comparison between different magnitudes.

2.2. Reputation System

The proposed model uses a reputation system to assign a level of trust to each user regarding the quality of the service provided. In particular, this work uses a version of the EigenTrust algorithm of [41] to obtain, manage, and assign a reputation to each user (of type p or d) in the ridesharing system. This algorithm uses the notion of transitive trust, where the trust value of each user is generated from the authentic opinion of those with whom they have directly interacted. All users participate in the calculation of the trust values in a distributed way in peer-to-peer systems, making it easily scalable and efficient in terms of computational complexity [42,43]. The EigenTrust algorithm outputs a global trust value, or global reputation, for each user on the system.
Assume a set of users U = { u 1 , u 2 , , u n } in the ridesharing system, where every u i U is a user of type p or d interchangeably. By using the EigenTrust algorithm, a user u i evaluates every transaction or service received by a user u j in the ridesharing system. Let Y u i u j be the set of services that u i received from u j , then the local reputation of u j consists of the aggregation of the evaluation results performed by u i . The local reputation of u j from the perspective of u i is defined in Equation (6).
m u i ( u j ) = z Y u i u j Y u i ( z ) ,
where Y u i is a function that evaluates the transaction or the service provided by u j based on the following metrics:
  • Punctuality. This metric has a value of + 1 if the service provided by u j starts on time; otherwise, the value is 1 .
  • Cordiality. This metric has a value of + 1 if the service of u j was kind and respectful; otherwise, the value is 1 .
  • Satisfaction. This metric has a value of + 1 if the service provided by u j fulfilled the expectations; otherwise, the value is 1 .
  • Safety. This metric has a value of + 1 if the service provided by u j and the users involved in it are considered ‘trustworthy’; otherwise, the value is 1 .
The reputation that u i locally assigns to u j , denoted as m u i ( u j ) , is normalized considering the previous rated users. This normalization seeks to avoid that arbitrary values can be assigned to ‘malicious’ users and that users with more services prevail over others. Equation (7) presents a normalized version of m u i ( u j ) when j max ( m u i ( u j ) , 0 ) 0 . If u i does not know anyone or does not trust anyone, then m ^ u i ( u j ) = 1 / ( n 1 ) where i j .
m ^ u i ( u j ) = max ( m u i ( u j ) , 0 ) j max ( m u i ( u j ) , 0 ) .
Note that negative scores are truncated to 0 in Equation (7). This truncation prevents the ‘selfishness’ of some users from assigning arbitrarily low values to good users. It also avoids the whitewashing of poor services since there is no distinction between those services and the new ones.
Local reputation values are disseminated and aggregated based on a transitive reputation schema to compute a global reputation in the system. Under this scheme, u i estimates the reputation r ^ u i 0 ( u k ) from any unknown user u k . To perform such an estimation, u i requests the local reputation of u k to each user of type u i with whom u k has interacted, i.e.,  m ^ u i ( u k ) . Thus, the trust value that u i assigns to u k is based on the opinions of its acquaintances, as expressed in Equation (8).
r ^ u i 0 ( u k ) = j m ^ u i ( u j ) · m ^ u j ( u k ) .
Let M be a matrix [ m ^ u i ( u j ) ] of dimension n × n , and let m u i = [ m ^ u i ( u 1 ) , , m ^ u i ( u n ) ] T be the trust vector of u i with respect to each user in the system. Then, R u i 0 = M T m u i = [ r ^ u i 0 ( u 1 ) , , r ^ u i 0 ( u n ) ] T represents the trust values of u i based on the opinions of its acquaintances. Additionally, u i can request the opinion of the acquaintances of its acquaintances by computing R u i 1 = ( M T ) 2 m u i . After β iterations, and for a large β , r u i n 1 = ( M T ) β m u i represents a global opinion about each user in the system. Under the assumptions that M is irreducible and not periodic [41], the confidence vectors of each u i in the system converge to a single vector r = [ r ( u 1 ) , , r ( u n ) ] representing the left main eigenvector of M. Thus, the global reputation of any user (of type p or d) computed by r is considered in the utility expression of Equation (1).

3. Stable Matching

In this work, an algorithm is proposed to solve the stable matching problem in ridesharing systems according to the model described in Section 2. This algorithm is an “iterated” version of the well-known Gale–Shapley algorithm [28], relaxing the original restrictions concerning the equality in the size of the sets and the assumption of complete and strict preference lists.
The set of users U of the ridesharing system consists of n = n p + n d elements of the type p and d, respectively. The number of available seats in the vehicle driven by a user of type d is σ d , where σ d 1 . When a matching occurs between a pair of users p and d, a seat is assigned to p, decreasing σ d in one. Let N s e a t s be the total of available seats in the ridesharing system, i.e.,  N s e a t s = d σ d . Without loss of generality, assume that n p N s e a t s and δ s e a t s = n p N s e a t s . To ensure convergence to a stable matching, a waiting list μ d is assumed. This waiting list contains δ s e a t s = σ μ d remaining seats intended to those users of type p that do not find a place in a vehicle. Since the waiting list represents the last option for any passenger p, the model assigns π p μ d = , and  π μ d p = 1 .
The proposed algorithm takes as input a complete bipartite graph B = ( U , E ) , where the set of vertices U = { p 1 , p 2 , , p n p } { d 1 , d 2 , , d n d , μ d } and the set of edges E represents all possible allocations between users. Figure 2 illustrates an example of a complete bipartite graph where n p = 3 and n d = 2 .
Every user p i has a preference ranking to every user d j and vice versa. These preferences are computed through the estimated utility for each ridesharing service. Thus, each edge e i j E can be seen as two directed edges with a different weight according to their directions, where e i j and e j i represent the utilities π p i d j and π d j p i , respectively. Figure 3 illustrates an example of a pairwise relationship between the vertices p i and d j , modeled as two directed edges in the graph.
Let B k = ( U k , E k ) be a bipartite graph after k iterations of the Gale–Shapley algorithm. The matching in the k-th iteration consists of selecting a set M k E k 1 , for  k > 0 , such that no pair of edges have a common vertex in E k 1 . In this context, the matching means assigning a user p i to a user d j with σ d j available seats. Then, every matched vertex d j “hosts” one vertex of type p, decreasing its available seats by one at each iteration k. Any hosting vertex of type d in the iteration k represents a single vertex, called a ‘supervertex’, for the iteration k + 1 . For each iteration k, a subgraph B k B k 1 is generated. Thus, U k contains the supervertices and the remaining vertices that were not chosen in U k 1 , and  E k contains the edges of E k 1 M k . Iteration matching ends in two cases. The first case occurs when there are no available seats in vertices of type d; in this case, the remaining users of type p match to the waiting list μ d with its σ μ d = δ s e a t s seats. The second case occurs when all the vertices of type p match a user of type d. Notice that this case only occurs when N s e a t s = n p . Figure 4 illustrates an example of a resulting bipartite graph B 1 = ( U 1 , E 1 ) after one iteration of the Gale–Shapley algorithm. Note that for this iteration U 1 = { p 2 , d 1 , d 2 } where vertices d 1 , d 2 , and  μ d are supervertices.
Algorithm 1 presents the proposed solution for the stable matching problem in ridesharing systems. An important assumption of this algorithm is that the evaluation of the utilities does not change during each iteration. Therefore, every output matching M 1 , M 2 , , M k maintains their original utility values.
Algorithm 1:Stable matching for the ridesharing system.
Input: 
A complete bipartite graph B = ( U , E ) with a preference ranking computed by π p d : e i j R .
Output: 
The sequence of stable matchings M 1 , M 2 , , M k .
1:
B 0 ( U , E )
2:
k 1
3:
while exists a vertex d j U k 1 in which σ d j > 0  do
4:
   Executes the Gale–Shapley algorithm to reach a stable matching M k as a result
5:
   for each pair of vertices p i and d j connected by an edge of M k  do
6:
     The vertex d j hosts the vertex p i
7:
      σ d j σ d j 1
8:
   end for
9:
   Generates B k = ( U k , E k ) such that U k contains the supervertices and the no matched vertices of U k 1 , and  E k contains the edges from E k 1 M k
10:
    k k + 1
11:
end while
12:
if exists a not matched vertex p i U k 1  then
13:
   Match every vertex p i to the waiting list μ d and generate the matching M k
14:
end if
15:
return the sequence of stable matchings M 1 , M 2 , , M k
Let π M k be the sum of the utilities of each vertex incident to an edge of M k . Equation (9) shows this expression.
π M k = edges ( p , d ) M k ( π p d + π d p ) .
The 
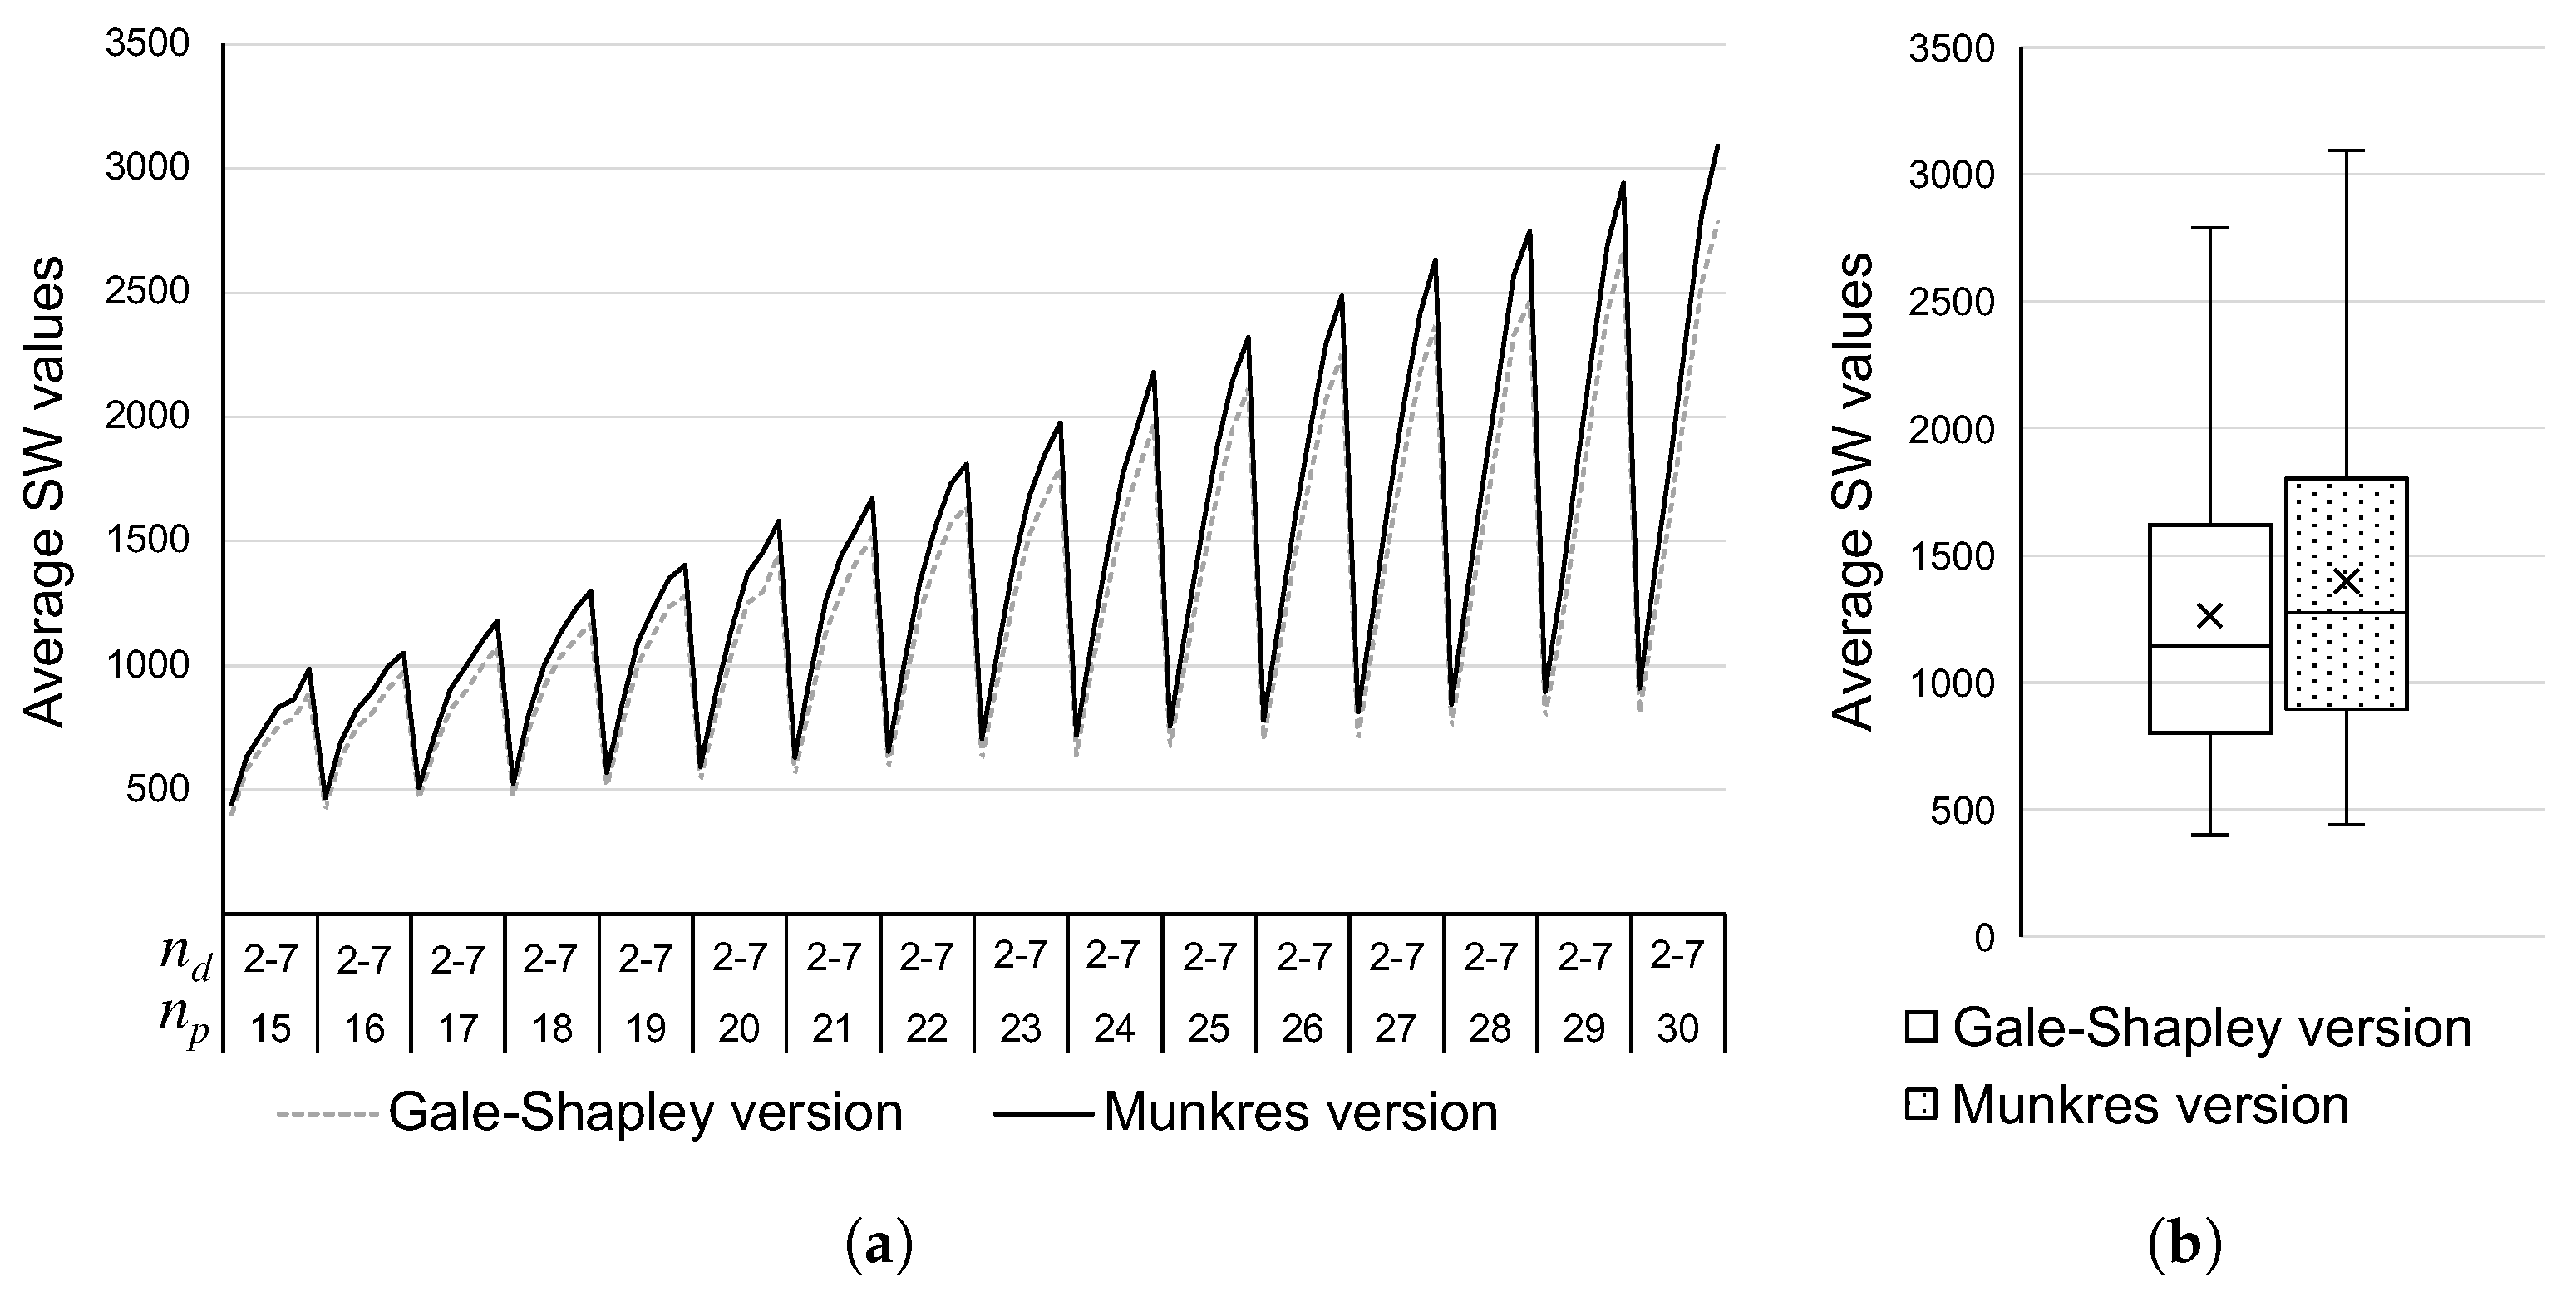
social welfare of the ridesharing system is the sum of the individual utilities of the final sequence of matchings. Equation (10) describes the social welfare function SW, where K is the total matching iterations of B = ( U , E ) .
SW ( B M K ) = k = 1 K π M k .
The following lemma proves that the proposed algorithm reaches a stable matching.
Lemma 1.
Algorithm 1 always generates a stable matching.
Proof. 
The proof is by mathematical induction in the number of iterations k of the algorithm.
Base case. Let M 1 = { ( p 1 1 , d 1 1 ) , , ( p k 1 1 , d k 1 1 ) } be the set of pairs matched at the first round. There exists a blocking pair in any of the following two cases. The first case would occur when n d < k 1 . In this case, the users p n d + 1 1 p k 1 1 are assigned to the waiting list μ d . The second case would occur if any p i 1 and d j 1 both prefer to match with another user rather than with their current one assigned in M 1 . However, this is not possible, because after the execution of Gale–Shapley algorithm, all users in { p 1 1 , , p 1 k 1 } match with their corresponding user d j 1 of their highest preference.
Inductive hypothesis. Assume that after k = r iterations there are no blocking pairs in the matching M 1 , , M r .
Inductive step. Consider the iteration k = r + 1 . Let B r = ( U r , E r ) be the bipartite graph obtained after the r-th iteration. Let M r + 1 = { ( p 1 r + 1 , d 1 r + 1 ) , , ( p k r + 1 r + 1 , d k r + 1 r + 1 ) } be the set of pairs matched at the round r + 1 . There exists a blocking pair in any of the following two cases. The first case would occur if the number of available seats at iteration r is less than the remaining users of type p for that iteration, i.e., N s e a t s r < k r + 1 . In this case, the remaining users of type p are assigned to the waiting list μ d . The second case would occur if any p i r + 1 and d j r + 1 both preferred to match with another user rather than their current one assigned in M r + 1 . Notice that this is not possible because, by inductive hypothesis and by Gale–Shapley algorithm, all users in { p 1 r + 1 , , p k r + 1 r + 1 } match with the user d j r + 1 with their highest preference.
Therefore, Algorithm 1 always generates a stable matching. □
Corollary 1.
Algorithm 1 requires O ( k n 2 ) time to generate a stable matching.
Proof. 
The result follows that each iteration of Gale–Shapley requires O ( n 2 ) , and there exist k iterations. □

4. Experimental Simulations

Experimental simulations were conducted to measure the efficiency of the proposed stable matching algorithm given the ridesharing model of Section 2. The implementation was made in Python 3.6, and the experiments were run on a 3.1 GHz Intel Core i7 Mac (Dual-core), with 8 GB of RAM, and under OS X 10.11.4.

4.1. Benchmarking

A collection of benchmark graphs were built through Python’s module networkx to conduct the simulations. A set of 30 directed complete bipartite graphs were generated for every possible combination between the number of passengers n p and drivers n d , where n p > n d , n p = N s e a t s + δ s e a t s , 15 n p 30 and 2 n d 7 (providing a total of 2880 graphs). Each of these graphs includes a vertex representing a waiting list with δ s e a t s available places. Random attributes were established for each bipartite graph under the following criteria:
  • The number of available seats can be from 1 to 4 for each set of users of type d.
  • Every vertex of type p requires exactly one seat as part of the ridesharing service.
  • The weight on each edge represents the preference of each user, which is randomly obtained from the interval [ 1 , 2 ( n p + n d ) ] .
The generated graphs were saved as text files in the GML (Graph Modeling Language) format, consisting of a simple, extensive, and flexible syntax.

4.2. Metrics

The Price of Stability (PoS) [44,45] is used as a measure of inefficiency to determine the degradation in solution quality caused by imposing the constraint of stability, i.e., the ‘sacrifice’ in the performance of the ridesharing system to obtain a stable matching. Since the stable matching problem is a maximization problem, the PoS is computed by the ratio between the SW values obtained by the maximum stable solution and an optimal matching (not necessarily stable) for each graph instance. In order to experimentally approximate such an optimal assignment, a version of Algorithm 1 using the well-known Munkres algorithm [46] instead of the Gale–Shapley algorithm in Step 4 is also implemented.
Let B M K be the output matching for a complete bipartite graph B, produced by Algorithm 1 using the Gale–Shapley version described in Section 3. Furthermore, let B O * be the output matching for the same graph by using the algorithm with the Munkres version. In order to experimentally approximate a PoS value for the proposed stable matching problem, a lower bound is computed through Equation (11).
Approximated PoS = A v g { n p , n d } ( SW ( B M K ) ) A v g { n p , n d } ( SW ( B O * ) ) ,
where A v g { n p , n d } computes the average SW values by considering all graphs with specific n p and n d values.

4.3. Statistical Analysis

A statistical test analysis of the comparison results was carried out using the Gale–Shapley algorithm versus the Munkres algorithm. First, a Lilliefors test [47] was used to determine whether experimental data were adequately fitted to a normal distribution. Previous tests showed that data do not have a normal distribution. Therefore, the Wilcoxon rank-sum test [48] was applied to determine if there is a significant difference between the outputs.

4.4. Experimental Results

Figure 5 shows the average SW values obtained by the proposed stable matching algorithm when using the Gale–Shapley version to reach stability versus the Munkres version intended to achieve maximum SW values. These two versions rely on different implementations of Step 4 in Algorithm 1. While Figure 5a illustrates the SW behavior in the increment of the number of passengers and drivers ( n p and n d , respectively), Figure 5b shows the boxplot of the SW values by considering all their combinations. In both of these images, it can be observed that the solutions obtained by the implementation using Munkres have higher average SW values than those obtained for the Gale–Shapley version. These differences seem to be homogeneous according to the number of available seats and drivers. However, the higher the number of available seats provided by drivers, the higher the differences in SW values between the Gale–Shapley and Munkres versions (see Figure 5a). Statistical tests show that the differences are significant between the solutions for both implementations. The maximum average SW value achieved in the experiments is 3091 by the Munkres version, while the Gale–Shapley version is 2787 (see Figure 5b); nevertheless, the Gale–Shapley version algorithm always reached a stable matching for all test cases.
Figure 6 shows the approximated PoS values of the solutions of the proposed algorithm. Figure 6a presents these values regarding the increment in the number of passengers and drivers. Although a decrement in the approximated PoS is shown as n p and n d increases, there is no a clear association with respect to the configuration of the benchmark graphs. On the other hand, Figure 6b shows that the approximated PoS values ranges from 0.8712 to 0.9237, with an average value of 7.63 % of degradation of the solution quality for the outcome being stable by considering all the test cases. Therefore, in general, guaranteeing the matching stability between passengers and drivers does not cause severe effects on their individual utilities.

4.5. Case Study

This section presents a small case study of the ridesharing model introduced in Section 2. Suppose a driver d bidding a ridesharing service in the Metropolitan Zone of Guadalajara (MZG), Mexico. Commuting data are taken from the Google Maps platform, generating potential routes with real costs, times, and distances. Assume that d offers σ d = 2 available seats for a ridesharing service, driving a small vehicle with a 1.6-L, 16-valve, four-cylinder engine with a combined fuel economy of 27 miles per gallon (mpg) and a fuel price of 83.30 Mexican pesos per gallon of regular gasoline. The user d publishes the route R d = v 0 a 1 v 1 a 2 a k v k in the ridesharing system, where v 0 represents the origin and v k the destination.
Figure 7 shows the route R d considering the location points (20.4767, −103.4484) and (20.7439, −103.4285) as origin and destination, respectively. The total length of this route is w ˘ ( R d ) = 22.3 miles with an estimated travel time t d R d = 57 min, and a transfer cost c ( R d ) = $ 68.80 Mexican pesos calculated by Equation (2).
Assume three passenger users p 1 , p 2 , and p 3 , which seek to arrive at their destinations using public transportation based on the commuting data presented in Table 1. Given these data, they seek to improve their travel conditions by requesting a ridesharing service. As observed, user p 1 has the exact origin and destination points as those contemplated in R d , but with a significant difference in traveling times due to their transportation mean. Furthermore, user p 2 also intersects in the destination point of R d . Therefore, the ridesharing system proposes potential joint routes implying the following types of ridesharing: identical R p 1 d , inclusive R p 2 d , and partial R p 3 d (see Section 2).
For simplicity’s sake, suppose all users have a departure time of 9:00 am and a predefined slack time of ten minutes. Each passenger p { p 1 , p 2 , p 3 } independently evaluates the savings produced by sharing its trip with d through the joint route R p d . The travel savings are measured in terms of cost and time savings by Equation (5).
The cost savings for any p, denoted as z p R p d , is computed by the difference of the transfer costs when p travels in R p d instead of R d , as expressed in Equation (3). The transfer costs depend on the route’s total length, the vehicle’s characteristics, or the trip’s estimated fees. Table 2 shows the cost savings for p and d when they travel via R p d . On the other hand, time savings rely on the difference between the estimated travel times when p shares its trip or not, i.e., t p R p t p R p d . Additionally, an implicit loss of time is assumed by considering a delay in which d arrives to the origin point of R p d at the instant of time t d R p d 0 . Considering that η p = 10 , t p R p d 0 = 9:00, and t d R p d 0 > 9:00 in Equation (4), the total time savings for d and p, denoted as t d ( R p d ) and t p ( R p d ) , respectively, are also shown in Table 2.
Notice that the estimated cost savings for the passengers when they share their trip is low (even negative) due to the cheaper costs of traveling via public transportation; however, the total time savings for all cases are significant. Because of these noteworthy differences in time, the slack time is not necessarily limited to the ten minutes considered initially. To weigh the importance between the cost and time savings in Equation (5), a value α = 1 / 2 is considered. Conversely, drivers generally do not save time traveling through a joint route, so cost savings is the main factor in their matching decisions. Table 3 shows the travel savings estimated for all driver–passenger interactions via the joint route R p d . It is important to note that values of travel savings represent a combination of cost and time, no longer separately considering terms of money or minutes used in this example.
On the other hand, assume that all users but p 3 have a local reputation in the ridesharing system regarding the quality of their previous services (punctuality, cordiality, satisfaction, and safety), as shown in Table 4. Since p 3 is a new user, its initial local reputation is zero (see Section 2.2).
By Equation (7), a normalized matrix M is generated as follows:
M = 0 1 / 2 1 / 2 0 5 / 7 0 2 / 7 0 0 1 0 0 1 / 3 1 / 3 1 / 3 0
Let u be any user (passenger or driver) of the ridesharing system. Suppose an initial trust vector m u = [ 1 / 4 , 1 / 4 , 1 / 4 , 1 / 4 ] T , representing a uniform probability distribution over all users. A transitive reputation schema is used to estimate the global opinions about each user in the system, which correspond to the left principal eigenvector of M. After a large number β of iterations (where β is the rank of the matrix), the global reputations for all users are the following:
( M T ) β m u = 0 5 / 7 0 1 / 3 1 / 2 0 1 1 / 3 1 / 2 2 / 7 0 1 / 3 0 0 0 0 β × 1 / 4 1 / 4 1 / 4 1 / 4 = 0.3030 0.4242 0.2727 0
When β 0 = 1 / 2 and β 1 = 50 , the utilities for the users sharing a trip via R p d are shown in Table 5. As observed, driver d obtains a higher utility when he/she provides a ridesharing service to p 1 and p 2 , rejecting the service to p 3 .

4.6. Research Limitations

Limitations of the research are mostly related to assumptions of the proposed model, in which any pair driver–passenger utility evaluation is made independently of the interaction with other users. In this sense, although the model supports multi-capacity settings in which a driver can provide a service to two or more passengers (according to its availability of seats), estimations of travel savings and reputation values should be adjusted. On the other hand, an ideal model is considering the ridesharing with deviation (in addition to the types of trips considered in Section 2), in which there is no common proper subroute between the passenger and the driver. Most works modeling ridesharing with deviation assume that the only one that deviates from its route is the driver. In contrast, a new joint route can be generated for both passenger and driver.

5. Conclusions and Future Work

This paper studies the stable ride-matching problem, an allocation process of ridesharing users in which no user prefers another different from the assigned one. With the aim to address this problem, a new ridesharing model using a specific pairwise utility function is introduced. This utility function is based on two fundamental aspects of the ridesharing service: travel savings and the reputation of users. While travel savings consider some spatial and temporal characteristics of the trip, the users’ reputation is calculated based on community members’ positive and negative opinions. In particular, the reputation system proposed here is a modified version of the well-known EigenTrust algorithm, where each user evaluates a service based on punctuality, cordiality, satisfaction, and trust.
A small case study was developed to show how and whether the proposed ridesharing model applies in practice. The case study focuses on public transportation users in the Metropolitan Zone of Guadalajara, the third largest city in Mexico, who are willing to improve their travel options through a ridesharing service. Although using public transportation is commonly seen as an option to reduce traffic congestion, resulting data shows that ridesharing services provide a higher utility in terms of cost and time savings (commuting public services could take hours in Mexico). In this vein, a model suitable to these contexts could motivate the use of ridesharing services, increasing the occupancy rates of vehicles, one of the significant factors behind road traffic congestion. However, mitigating traffic congestion is regarded as a result rather than a factor.
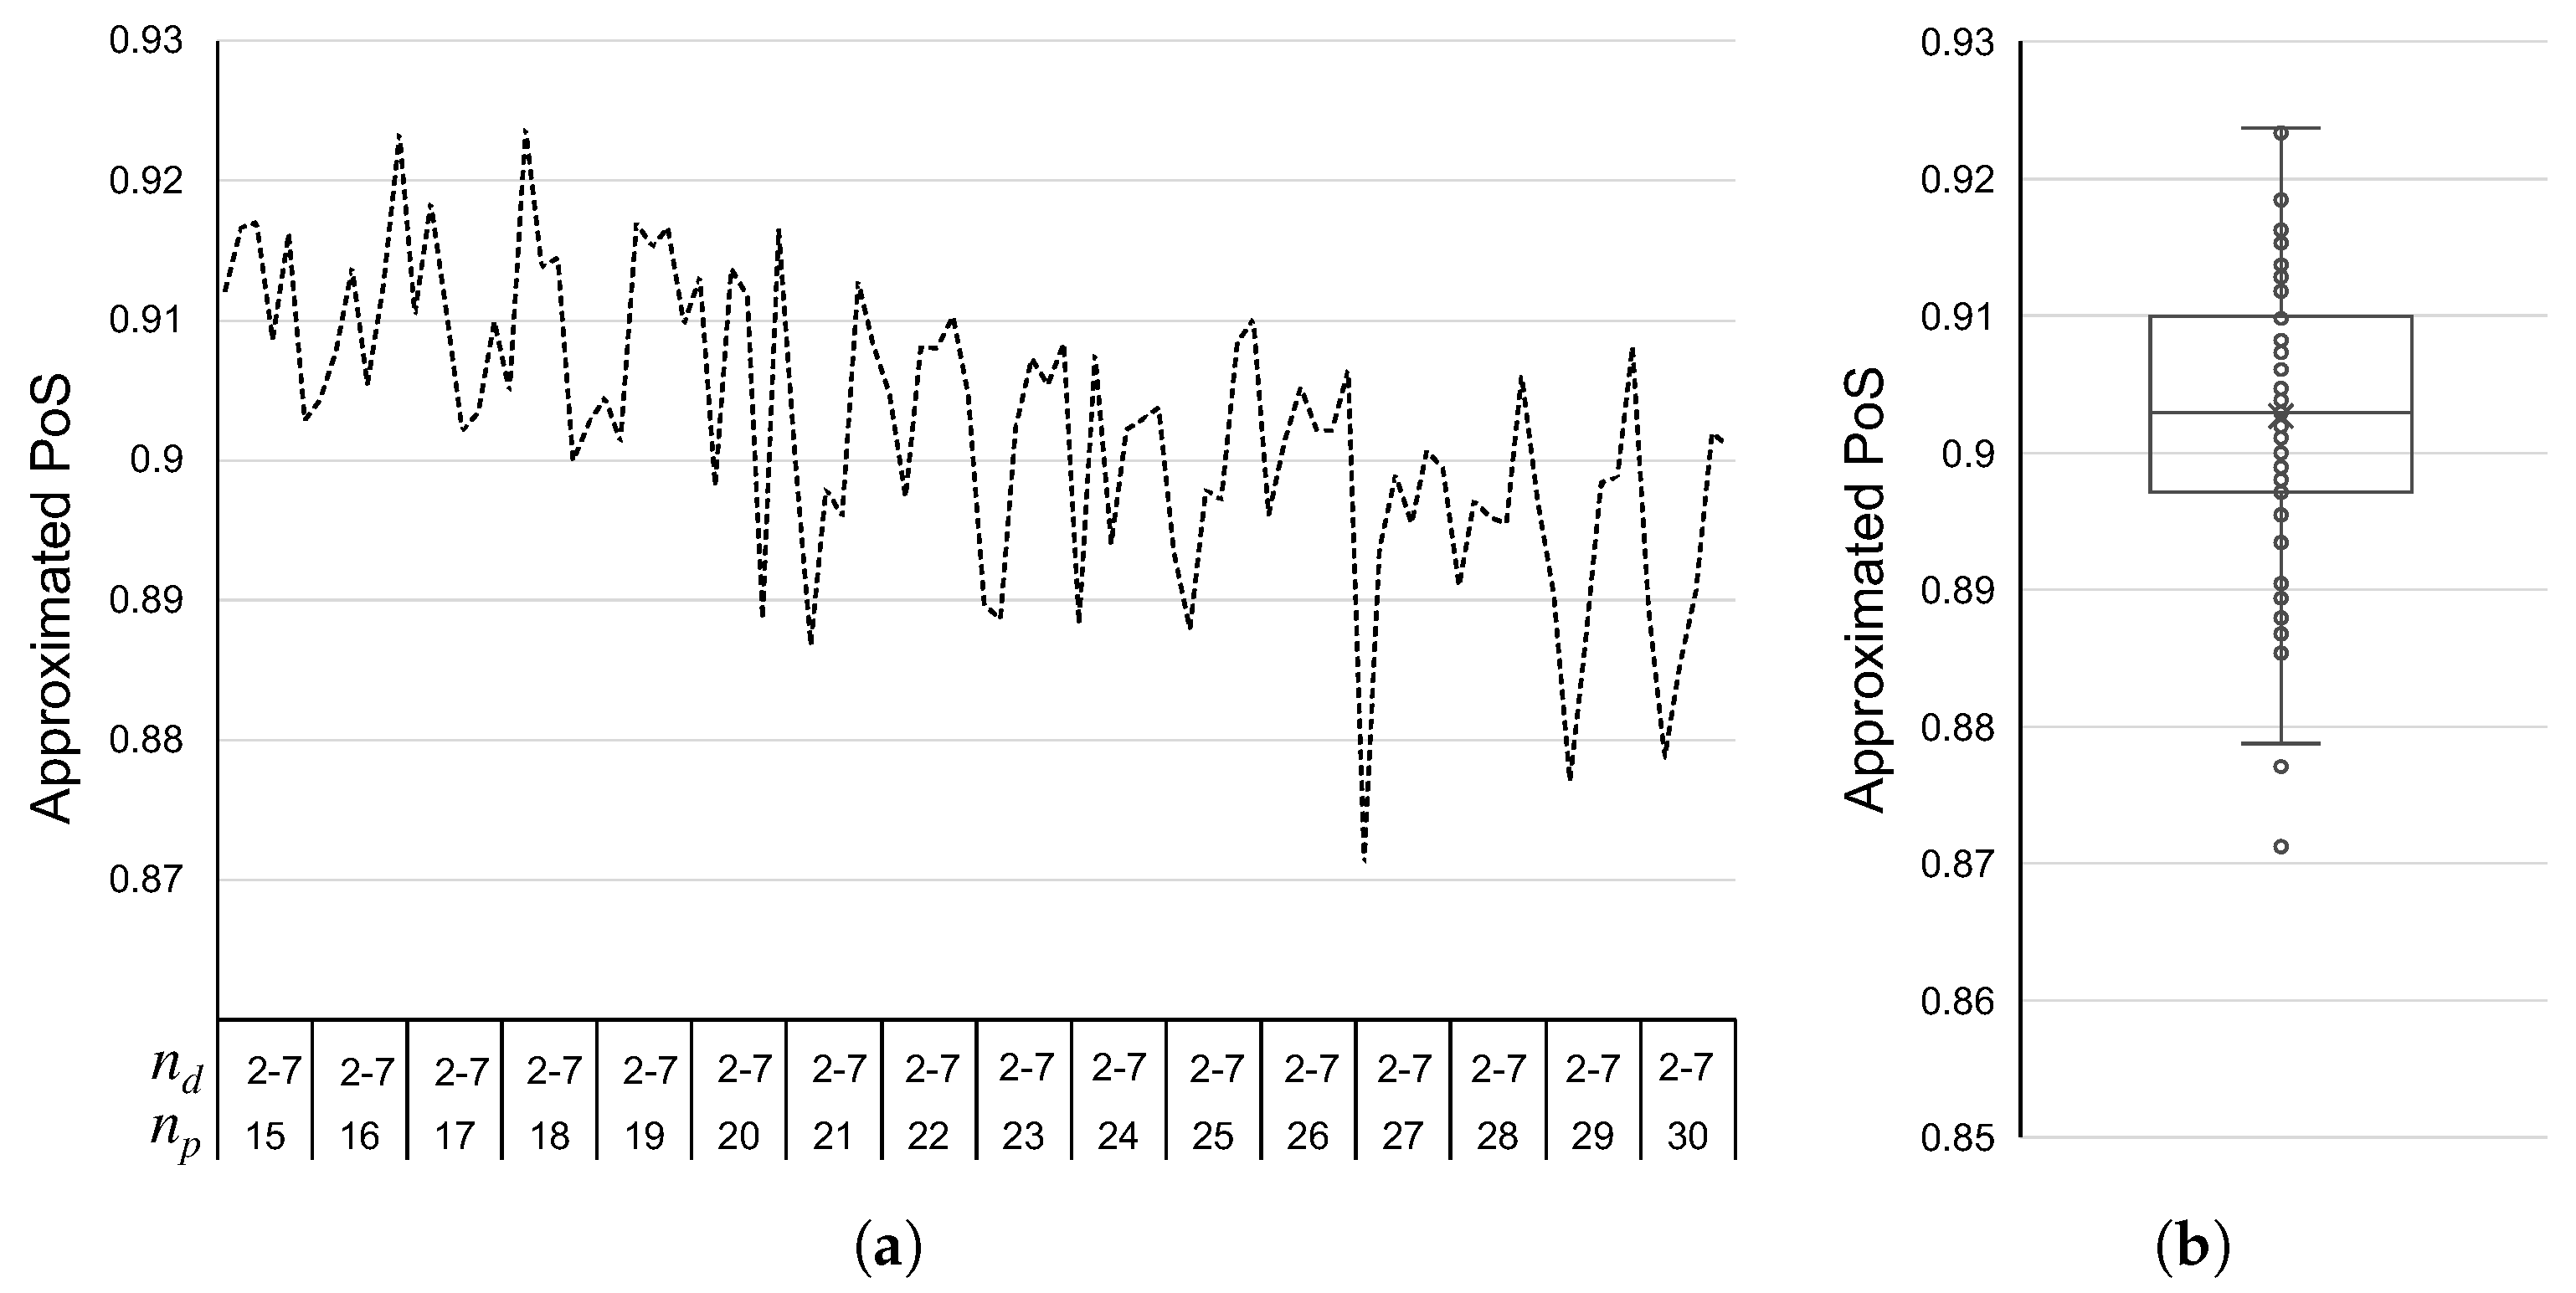
The proposed ridesharing model is used to introduce an algorithm designed to produce stable matching solutions in ridesharing systems. This algorithm consists of an iterated version of the Gale–Shapley algorithm, in which restrictions about the equality in the size of the sets and the assumption of complete and strict preferences are relaxed through the concept of a ‘waiting list’. Experimental simulations were conducted by considering a benchmarking of 2880 random bipartite graphs as test cases. Experimental results show that the proposed algorithm always converges to a stable matching solution for all test cases. An experimental price of stability indicates a level of degradation of 7.63 % in the social welfare due to the stable solutions.
This study may be extended in several directions for future work. One consists of adjusting the proposed ridesharing model to incorporate trips with deviation, where no common proper subroute exists between passenger and driver. This adjustment would be in addition to the three supported types of trips: identical, inclusive, and partial. Another interesting direction would be to implement a reputation system that considers not only the service’s evaluation but also the users’ identity. Finally, a critical question is whether this ridesharing model can reduce traffic congestion. It would be interesting to evaluate if this is possible considering a critical mass of shareable trips in terms of specific factors like trip density, city scale, and demand heterogeneity, among others.

Author Contributions

Conceptualization, D.F.-D. and C.H.-B.; methodology, D.F.-D., C.H.-B. and M.G.S.-C.; software, D.F.-D., C.H.-B. and M.G.S.-C.; validation, M.G.S.-C. and J.E.M.-S.; writing—original draft preparation, D.F.-D. and M.G.S.-C.; supervision, J.A.T.-S. and I.E.E.-C.; project administration, D.F.-D. All authors have read and agreed to the published version of the manuscript.

Funding

This research was funded by the Tecnológico Nacional de México grant numbers 8288.20-P and 11078.21-P.

Institutional Review Board Statement

Not applicable.

Informed Consent Statement

Not applicable.

Data Availability Statement

For benchmarking purposes, the set of random complete bipartite graphs are available at https://bitbucket.org/dfajardod/stable_matching_ridesharing/src/master/benchmarking/ (accessed on 25 July 2022).

Acknowledgments

Trejo-Sánchez acknowledges the CONACyT support with the Frontier Science Project No. 304006. Some of the results in this paper have collateral applications in the sabbatical project of Fajardo-Delgado approved by the TecNM (AS-2-027/2021).

Conflicts of Interest

The authors declare no conflict of interest.

Abbreviations

The following abbreviations are used in this manuscript:
GML Graph Modeling Language
SW  Welfare
PoS Price of Stability

References

  1. INEGI. Encuesta Origen-Destino en Hogares de la Zona Metropolitana del Valle de México (EOD 2017). 2017. Available online: https://www.inegi.org.mx/contenidos/programas/eod/2017/doc/resultados_eod_2017.pdf (accessed on 25 July 2022).
  2. Abdullah, M.; Dias, C.; Muley, D.; Shahin, M. Exploring the impacts of COVID-19 on travel behavior and mode preferences. Transp. Res. Interdiscip. Perspect. 2020, 8, 100255. [Google Scholar] [CrossRef]
  3. Beirão, G.; Cabral, J.S. Understanding attitudes towards public transport and private car: A qualitative study. Transp. Policy 2007, 14, 478–489. [Google Scholar] [CrossRef]
  4. Blackman, A.; Alcázar, F.; Carlsson, F.; Planter, M.R. A Contingent Valuation Approach to Estimating Regulatory Costs: Mexico’s Day without Driving Program. J. Assoc. Environ. Resour. Econ. 2018, 5, 607–641. [Google Scholar] [CrossRef]
  5. Jeong, Y. Stochastic Model-Predictive Control with Uncertainty Estimation for Autonomous Driving at Uncontrolled Intersections. Appl. Sci. 2021, 11, 9397. [Google Scholar] [CrossRef]
  6. Duarte, F.; Ratti, C. The Impact of Autonomous Vehicles on Cities: A Review. J. Urban Technol. 2018, 25, 3–18. [Google Scholar] [CrossRef]
  7. Balador, A.; Cinque, E.; Pratesi, M.; Valentini, F.; Bai, C.; Gómez, A.A.; Mohammadi, M. Survey on decentralized congestion control methods for vehicular communication. Veh. Commun. 2021, 33, 100394. [Google Scholar] [CrossRef]
  8. Khan, M.; Arora, B. Traffic Jam Minimization and Accident Avoidance System Using IoT. In Evolving Technologies for Computing, Communication and Smart World; Singh, P.K., Noor, A., Kolekar, M.H., Tanwar, S., Bhatnagar, R.K., Khanna, S., Eds.; Springer: Singapore, 2021; pp. 39–51. [Google Scholar]
  9. Cvetek, D.; Muštra, M.; Jelušić, N.; Tišljarić, L. A Survey of Methods and Technologies for Congestion Estimation Based on Multisource Data Fusion. Appl. Sci. 2021, 11, 2306. [Google Scholar] [CrossRef]
  10. Alisoltani, N.; Leclercq, L.; Zargayouna, M. Can dynamic ride-sharing reduce traffic congestion? Transp. Res. B-Methodol. 2021, 145, 212–246. [Google Scholar] [CrossRef]
  11. Chan, N.D.; Shaheen, S.A. Ridesharing in North America: Past, Present, and Future. Transp. Rev. 2012, 32, 93–112. [Google Scholar] [CrossRef]
  12. Furuhata, M.; Dessouky, M.; Ordóñez, F.; Brunet, M.E.; Wang, X.; Koenig, S. Ridesharing: The state-of-the-art and future directions. Transp. Res. B-Methodol. 2013, 57, 28–46. [Google Scholar] [CrossRef]
  13. Agatz, N.; Erera, A.; Savelsbergh, M.; Wang, X. Optimization for dynamic ride-sharing: A review. Eur. J. Oper. Res. 2012, 223, 295–303. [Google Scholar] [CrossRef]
  14. Morency, C. The ambivalence of ridesharing. Transportation 2007, 34, 239–253. [Google Scholar] [CrossRef]
  15. Meshkani, S.M.; Farooq, B. A generalized ride-matching approach for sustainable shared mobility. Sustain. Cities Soc. 2022, 76, 103383. [Google Scholar] [CrossRef]
  16. Qin, X.; Yang, H.; Wu, Y.; Zhu, H. Multi-party ride-matching problem in the ride-hailing market with bundled option services. Transp. Res. Part C Emerg. Technol. 2021, 131, 103287. [Google Scholar] [CrossRef]
  17. Sun, K.; Liu, F.; Tan, V. The Study of Car Sharing Algorithm Based on the Time Value. Wirel. Pers. Commun. 2018, 102, 2519–2526. [Google Scholar] [CrossRef]
  18. Alarabi, L.; Cao, B.; Zhao, L.; Mokbel, M.F.; Basalamah, A. A Demonstration of SHAREK: An Efficient Matching Framework for Ride Sharing Systems. In Proceedings of the 24th ACM SIGSPATIAL International Conference on Advances in Geographic Information Systems, GIS ’16, Burlingame, CA, USA, 31 October–3 November 2016; ACM: New York, NY, USA, 2016; pp. 95:1–95:4. [Google Scholar] [CrossRef]
  19. Cao, B.; Alarabi, L.; Mokbel, M.F.; Basalamah, A. SHAREK: A Scalable Dynamic Ride Sharing System. In Proceedings of the 2015 16th IEEE International Conference on Mobile Data Management, Pittsburgh, PA, USA, 15–18 June 2015; Volume 1, pp. 4–13. [Google Scholar] [CrossRef] [Green Version]
  20. Mitropoulos, L.; Kortsari, A.; Ayfantopoulou, G. A systematic literature review of ride-sharing platforms, user factors and barriers. Eur. Transp. Res. Rev. 2021, 13, 61. [Google Scholar] [CrossRef]
  21. Wang, H.; Yang, H. Ridesourcing systems: A framework and review. Transp. Res. B-Methodol. 2019, 129, 122–155. [Google Scholar] [CrossRef]
  22. Guan, L.; Pei, J.; Liu, X.; Zhou, Z.; Pardalos, P.M. Ridesharing in urban areas: Multi-objective optimisation approach for ride-matching and routeing with commuters’ dynamic mode choice. Int. J. Prod. Res. 2022, 60, 1439–1457. [Google Scholar] [CrossRef]
  23. Banerjee, S.; Johari, R.; Riquelme, C. Dynamic Pricing in Ridesharing Platforms. SIGecom Exch. 2016, 15, 65–70. [Google Scholar] [CrossRef]
  24. Ma, H.; Fang, F.; Parkes, D.C. Spatio-Temporal Pricing for Ridesharing Platforms. Oper. Res. 2022, 70, 1025–1041. [Google Scholar] [CrossRef]
  25. A solution methodology for carpooling systems based on double auctions and cooperative coevolutionary particle swarms. Appl. Intell. 2019, 49, 741–763. [CrossRef]
  26. Hsieh, F.S. A Comparative Study of Several Metaheuristic Algorithms to Optimize Monetary Incentive in Ridesharing Systems. ISPRS Int. J. Geo-Inf. 2020, 9, 590. [Google Scholar] [CrossRef]
  27. Hsieh, F.S. A Comparison of Three Ridesharing Cost Savings Allocation Schemes Based on the Number of Acceptable Shared Rides. Energies 2021, 14, 6931. [Google Scholar] [CrossRef]
  28. Gale, D.; Shapley, L.S. College Admissions and the Stability of Marriage. Am. Math. Mon. 2013, 120, 386–391. [Google Scholar] [CrossRef] [Green Version]
  29. Roth, A.E. Stability and Polarization of Interests in Job Matching. Econometrica 1984, 52, 47–57. [Google Scholar] [CrossRef]
  30. Sotomayor, M. Three remarks on the many-to-many stable matching problem. Math. Soc. Sci. 1999, 38, 55–70. [Google Scholar] [CrossRef]
  31. Manlove, D.F.; Irving, R.W.; Iwama, K.; Miyazaki, S.; Morita, Y. Hard variants of stable marriage. Theor. Comput. Sci. 2002, 276, 261–279. [Google Scholar] [CrossRef] [Green Version]
  32. Oh, H.; Tang, Y.; Zhang, Z.; Jacquillat, A.; Fang, F. Efficiency, Fairness, and Stability in Non-Commercial Peer-to-Peer Ridesharing. arXiv 2021. [Google Scholar] [CrossRef]
  33. Peng, Z.; Shan, W.; Jia, P.; Yu, B.; Jiang, Y.; Yao, B. Stable ride-sharing matching for the commuters with payment design. Transportation 2020, 47, 1–21. [Google Scholar] [CrossRef]
  34. Ma, R.; Yao, L.; Song, L.; Jin, M. A novel algorithm for peer-to-peer ridesharing match problem. Neural Comput. Appl. 2019, 31, 247–258. [Google Scholar] [CrossRef]
  35. Wang, X.; Agatz, N.; Erera, A. Stable Matching for Dynamic Ride-Sharing Systems. Transp. Sci. 2018, 52, 850–867. [Google Scholar] [CrossRef]
  36. Thaithatkul, P.; Seo, T.; Kusakabe, T.; Asakura, Y. A Passengers Matching Problem in Ridesharing Systems by Considering User Preference. J. East. Asia Soc. Transp. Stud. 2015, 11, 1416–1432. [Google Scholar] [CrossRef]
  37. Peng, Z.; Shan, W.; Zhu, X.; Yu, B. Many-to-one stable matching for taxi-sharing service with selfish players. Transp. Res. Part A Policy Pract. 2022, 160, 255–279. [Google Scholar] [CrossRef]
  38. Noruzoliaee, M.; Zou, B. One-to-many matching and section-based formulation of autonomous ridesharing equilibrium. Transp. Res. B-Methodol. 2022, 155, 72–100. [Google Scholar] [CrossRef]
  39. Rasulkhani, S.; Chow, J.Y. Route-cost-assignment with joint user and operator behavior as a many-to-one stable matching assignment game. Transp. Res. B-Methodol. 2019, 124, 60–81. [Google Scholar] [CrossRef] [Green Version]
  40. Ting, K.H.; Lee, L.S.; Pickl, S.; Seow, H.V. Shared Mobility Problems: A Systematic Review on Types, Variants, Characteristics, and Solution Approaches. Appl. Sci. 2021, 11, 7996. [Google Scholar] [CrossRef]
  41. Kamvar, S.D.; Schlosser, M.T.; Garcia-Molina, H. The Eigentrust Algorithm for Reputation Management in P2P Networks. In Proceedings of the 12th International Conference on World Wide Web, WWW ’03, Budapest, Hungary, 20–24 May 2003; ACM: New York, NY, USA, 2003; pp. 640–651. [Google Scholar] [CrossRef]
  42. Chiluka, N.; Andrade, N.; Gkorou, D.; Pouwelse, J. Personalizing EigenTrust in the Face of Communities and Centrality Attack. In Proceedings of the 2012 IEEE 26th International Conference on Advanced Information Networking and Applications, Fukuoka, Japan, 26–29 March 2012; pp. 503–510. [Google Scholar] [CrossRef]
  43. Rao, S.; Wang, Y.; Tao, X.L. The Comprehensive Trust Model in P2P Based on Improved EigenTrust Algorithm. In Proceedings of the 2010 International Conference on Measuring Technology and Mechatronics Automation, Changsha, China, 13–14 March 2010; Volume 3, pp. 822–825. [Google Scholar] [CrossRef]
  44. Schulz, A.S.; Moses, N.S. On the Performance of User Equilibria in Traffic Networks. In Proceedings of the Fourteenth Annual ACM-SIAM Symposium on Discrete Algorithms, SODA ’03, Baltimore, MD, USA, 12–14 January 2003; Society for Industrial and Applied Mathematics: Philadelphia, PA, USA, 2003; pp. 86–87. [Google Scholar]
  45. Anshelevich, E.; Dasgupta, A.; Kleinberg, J.; Tardos, E.; Wexler, T.; Roughgarden, T. The price of stability for network design with fair cost allocation. In Proceedings of the 45th Annual IEEE Symposium on Foundations of Computer Science, Rome, Italy, 17–19 October 2004; pp. 295–304. [Google Scholar] [CrossRef] [Green Version]
  46. Munkres, J. Algorithms for the Assignment and Transportation Problems. J. Soc. Ind. Appl. Math. 1957, 5, 32–38. [Google Scholar] [CrossRef] [Green Version]
  47. Lilliefors, H.W. On the Kolmogorov-Smirnov Test for Normality with Mean and Variance Unknown. J. Am. Stat. Assoc. 1967, 62, 399–402. [Google Scholar] [CrossRef]
  48. Litchfield, J.T.; Wilcoxon, F. A simplified method of evaluating dose-effect experiments. J. Pharmacol. Exp. Ther. 1949, 96, 99–113. [Google Scholar] [PubMed]
Figure 1. Types of ridesharing based on the routes. (a) identical. (b) inclusive. (c) partial.
Applsci 12 07797 g001
Figure 2. Example of a complete bipartite graph B = ( U , E ) .
Applsci 12 07797 g002
Figure 3. Example of a pairwise relationship between a vertex of type p and other one of type d.
Applsci 12 07797 g003
Figure 4. Example of a bipartite graph B 1 = ( U 1 , E 1 ) after an iteration of the Gale–Shapley algorithm.
Applsci 12 07797 g004
Figure 5. Average SW values of the proposed stable matching algorithm when using the Gale–Shapley version versus the Munkres version. (a) SW behavior in the increment of the number of passengers and drivers. (b) boxplot considering all the combinations.
Applsci 12 07797 g005
Figure 6. The approximated PoS of the solutions of the proposed algorithm. (a) PoS behavior in the increment of the number of passengers and drivers. (b) boxplot considering all the combinations.
Applsci 12 07797 g006
Figure 7. The route R d (shown in blue) in which driver d offers a ridesharing service in the Metropolitan Zone of Guadalajara, Mexico.
Applsci 12 07797 g007
Table 1. Commuting data for the passenger p { p 1 , p 2 , p 3 } traveling via public transportation.
RoutesOriginDestination t p R p c ( R p )
R p 1 20.4767, −103.448420.7439, −103.4285146$28.50
R p 2 20.5883, −103.442820.7439, −103.428590$19.00
R p 3 20.6122, −103.428320.7516, −103.513162 + 58 = 120$28.50
Table 2. The total time savings and costs estimated for passengers and driver sharing a trip through the joint route R p d .
Routes w ˘ ( R pd ) c ( R pd ) z p R pd z d R pd t d R p d 0 t p R p d t p ( R p d ) t d ( R p d )
R p 1 d 22.3$68.80$5.90$34.409:0257978
R p 2 d 11.5$35.50$1.25$17.759:244036−14
R p 3 d 7.2$22.50$17.25$11.259:271728−17
Table 3. The travel savings computed for passengers and driver through the joint route R p d .
Routes s p ( R p 1 d ) s d ( R p 1 d )
R p 1 d 42.6038.40
R p 2 d 19.2510.75
R p 3 d 31.252.75
Table 4. Local reputation values.
d p 1 p 2 p 3
d0880
p 1 18020
p 2 −101200
p 3 0000
Table 5. The utilities estimated for passengers and driver through the joint route R p d .
Routes π p d π d p
R p 1 d 36.4540.41
R p 2 d 24.7819.01
R p 3 d 30.781.38
Publisher’s Note: MDPI stays neutral with regard to jurisdictional claims in published maps and institutional affiliations.

