Abstract
Industry 4.0 brings technologies of automation, the use of collaborative robots, and modern advanced warehousing interconnected with digitization of all steps of the production process, not excluding logistics. Internal logistics vary in different product types. Due to the specification of the Industry 4.0. concept, irregularities can be improved into fully autonomous processes. This trend also raises SMEs’ flexibility in terms of business processes and production organization. The transformation to Industry 4.0 is different from many perspectives (technological, organizational, financial). Therefore, companies need to know their processes’ state and determine their readiness for automation and digitization. After this, a consecutive strategy needs to be adjusted. This article presents the evaluation results of a comparison within individual business sectors (automotive, engineering, and electrical engineering fields). Several scientific methods were used for the successful realization of the objectives of the work (basic logical methods and empirical methods). The proposed methodology was verified in the form of an experiment in selected industrial enterprises. Internal logistics processes were observed inside real enterprises as a form of suitable preliminary research. Further potential cooperation between the companies and a team of experts specializing in Industry 4.0 is planned.
1. Introduction
Industry 4.0. is widely defined from many points of view (academic, business, consultant companies, or from practice [1,2,3,4]. It is characterized by IT and intelligent cyber−physical systems (CPS) implementation enabling manufacturing process automation. Implementation of robotics, digitization, and automation is crucial [5,6,7]; they serve as “pillars of Industry 4.0.”, and their cooperation (interconnecting all operating machines and equipment) in real time is also crucial. Implementation of Industry 4.0. (especially in the West Bohemian region of the Czech Republic) is the main research area of the authors [8,9,10,11] and served as a base premise for the use and creation of several maturity models [12,13,14], involving various aspects (mostly maintenance and logistics) of the production process. Adaptation of production processes results in adaptation of the use of new technologies. Independent control units cooperate and make independent decisions to become fully autonomous (‘lights out’ factories) [15,16].
By implementing features of Industry 4.0 into logistics processes (warehouses, transportation, packaging, distribution) better efficiency is achieved [17,18,19,20,21]. As a crucial factor here, the interconnectivity of all components is important in the warehouse. Previous research presented a design of a tool for internal logistics processes’ evaluation in terms of Industry 4.0 [18,19,20]. By using it, the current level of companies’ readiness for Industry 4.0 implementation can be measured, whether across the company or just in various production areas. This article should serve as a culmination of our few years of research, defining where logistics have adapted to Industry 4.0 the most and proving this in comparison of three industry types.
2. Materials and Methods
Using the proposed tool, logistics procedures were evaluated to determine Industry 4.0 preparedness. Each company was later assigned an appropriate rank based on its current status. The highest evaluated levels represent the full applicability of principles and technologies according to Industry 4.0 [22].
The evaluation tool has already been introduced in an article titled “Evaluation of the Level and Readiness of Internal Logistics for Industry 4.0 in Industrial Companies” [22]. The article focused on the research part of the proposed evaluation tool and its characteristics. The main development steps of the tool’s creation and the implementation phase of the methodology and its applicability to industrial practice were described. The methodology was developed in several phases, in which the main steps and their specific content were determined.
For a brief introduction, the creation process concerns the structure design of internal logistics as the main subject of the evaluated area, then levels for evaluation are set. These are the main areas for the proposed methodology. It sets out the basic procedure and principles based on which input data are then collected. The characteristics of indicators set within the structure of internal logistics according to set levels are also defined and calculation relations are also determined, as the methodology uses a new evaluation system according to the ascending principle [23]. The intention is therefore to enable a detailed evaluation in greater depth, using a multi-level system, which is characterized by appropriate principles and technologies.
This part serves as an introduction of valid documents; its purpose is to define methodology inputs which will be presented further. It sets out the basic procedure and principles of data collection. The final form of the internal logistics structure in this part concerns the intersection with the levels. These are chosen to create an ascending scale, which will serve to distinguish various indicators for each level. We obtain final characteristics by multiplying indicators and levels, which are used to precisely define the grade of dimensions and subdimensions (precisely by using the abovementioned indicators).
The research carried out for the needs of this article was analytical. In research practice, it is difficult to clearly and accurately distinguish between basic and applied research, as these two types of research can enrich each other. However, from the point of view of functions, this research can be defined as basic (academic) research, which analyzes areas within the framework of the theoretical starting points of the work and contributes to the development of theoretical knowledge. Applied research methods were also used, as the work deals with a methodology that has practical significance for companies in which the methodology is verified in the form of an experiment. Furthermore, the work used a quantitative research approach, because due to the goal of the work, it was necessary to examine the assumed relationships and verify them, and this research was specific in that it first formulated the assumed relationships and only then collected data. This was done using the structured interview technique.
Several scientific methods were used for the successful realization of the objectives of the work—basic logical methods and empirical methods. Empirical methods included verification of the proposed methodology, which was in the form of an experiment in selected industrial enterprises. The enterprises were visited and the input for the evaluation was a structured interview with a representative of the enterprise, based on which indicators were evaluated as an input value for further evaluation. Another method was the observation of internal logistics processes inside real enterprises as a form of suitable preliminary research, mapping of material flows and their connection to spatial arrangement, analysis and layout of warehouse space, used handling, and warehouse technology.
The higher the level, the more Industry 4.0. was used and implemented. All this was the subject of research about this tool and the preparation of sufficient data for it to be applied in industrial practice [22]. By applying this, real values gained from enterprises were compared to the assumptions considered during the design phase. Part of the research plan was a decision on the number of evaluated companies and the method of their selection. In the case of quantitative surveys, the selection aimed to ensure that several respondents were technically able to address them and at the same time their selection would be a character reflection of the basic set [24,25,26]. The basic set included all companies for which we wanted to determine the validity of hypotheses. For the conclusions to be correct, the sample needed to be representative.
The main points of the creation process included:
- Design of internal logistics structure (dimensions, subdimensions, indicators);
- Setting up evaluation levels;
- Characteristics of the indicators set according to levels;
- Mathematical computational relations;
- Materials for a structured interview.
These main development steps are described in detail in the article.
3. Results: Verification of the Proposed Methodology
The verification phase was divided into three parts—input (data collection), calculations, and final evaluation in manufacturing companies [22].
The input phase was focused mainly on data collection. As a part of the process, a determination of the evaluation system was needed to tell how the methodology would be applied. These data were collected by a structured interview, also for a better understanding of indicators. Level assignment for all indicators was an output of this research part [22].
Five readiness levels + zero levels were established for the evaluation methodology itself. There were therefore a total of six levels for this methodology and they described the maturity of the company depending on a specific indicator. The established levels were ascending. The methodology was designed so that companies could naturally develop the readiness of their internal logistics processes according to levels. The levels were set in such a way that they covered the assessment of the readiness of the enterprise as appropriately as possible. Therefore, they worked with a certain set number and definition to comply with the compromise. A small number will not create an objective detailed evaluation; a large number of levels, on the other hand, creates small deviations between the levels and the evaluation becomes unnecessarily complex, also because it would be difficult for the company employee to answer the questions, since the differences in the answers to the questions would be minimal and there could be wrong answers. A zero level was also incorporated into the design of the levels. The main idea for designing the zero level was not only its inclusion as the worst level, but also the primary criterion for this level was that the processes were not defined at all. Furthermore, the levels were stepped, and the ascending principle was preserved with certain links between the levels. So there were six levels of readiness with this brief characteristic (see Table 1 below)

Table 1.
Six levels of readiness.
The next phase was calculation. By entering this phase, indicator values were assigned after the implementation of a structured interview. Partial and final results were obtained based on the proposed system of the evaluation presented earlier [22].
In the evaluation phase, results from earlier phases were processed. The dimensions and subdimensions were compared and the overall readiness level was determined. The graphic form of the results was also included [22].
Input data were obtained by interviews with employees of the evaluated company (in most cases head of the logistics department). A total of 29 different companies were questioned, from the Czech Republic. Most of the evaluated companies were located in the Pilsen Region (23 companies). To ensure objectivity, the application was applied to all companies, regardless of their main attributes. The verification dealt with data analysis from the applied methodology, compared subsequently to the company’s general focus.
For the correctness of the conclusions, the sample must be representative. As part of verification, this was a smaller study for research purposes. Input data were obtained by conducting a structured interview with an employee of the evaluated company, who in most cases was the head of the logistics department or a representative. The evaluated companies were either Czech or international companies that had one of several global branches there. The majority of evaluated enterprises were located in the Pilsen region (23 enterprises). To ensure the objectivity of the entire validation of the methodology, the application was made to all enterprises regardless of their main attributes. For further research, the goal is to cover the entire territory of the Czech Republic by applying the methodology to all companies and creating a large study, which is possible, because this application was from the finding that the methodology was functional and verified by individual companies.
The diversity of the selection of industrial enterprises was evidenced by their characteristics, and to ensure the objectivity of the methodology verification it was targeted at all enterprises, regardless of their size or subject of business. There was a lack of representation of the automotive sector as a key industry sector, as well as a representation of engineering companies. These two large sectors are complemented by electrical engineering companies.
3.1. Outputs (Verification)
The overall average value of the readiness level of internal logistics for the Industry 4.0 concept across all evaluated industrial enterprises was one of the final values obtained by data analysis. This value in terms of arithmetic means is shown in Figure 1.
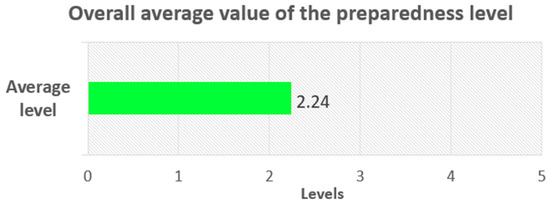
Figure 1.
The total average value of enterprises’ preparedness level.
This value includes all evaluated indicators and the resulting value will provide the company with a realistic picture of internal logistics readiness. However, the overall average preparedness value needs to be supplemented by other output information values. The methodology core was a three-level structure of internal logistics and therefore it was necessary to go deeper in the data analysis and analyze the results of sub-areas (dimensions, subdimensions, indicators).
The first part of the structure is represented by the dimensions, of which there were a total of five, and their average values for all enterprises are shown in Figure 2.
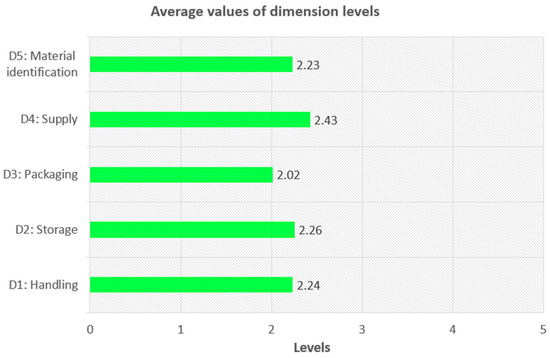
Figure 2.
Average values of dimension levels of all companies.
The average values in Figure 2 correspond to the overall preparedness level (the value is 2.42). The average dimension values have very similar values. It can be stated that the weakest dimensions analyzed for all analyzed industrial enterprises in the Czech Republic were dimensions D3: Packaging and D4: Supply. The remaining three dimensions had similar final values with minimal differences.
Subdimensions were the second part of the internal logistics structure and each dimension consisted of 2–3 subdimensions. The output of the further analysis was the average values of individual subdimensions, again for all industrial enterprises, and these are shown in Figure 3.
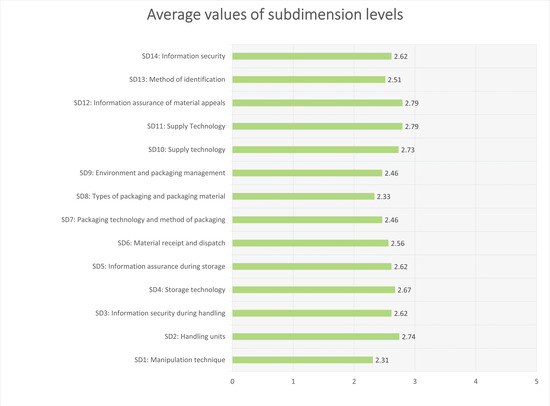
Figure 3.
Average values of subdimension levels of all enterprises.
The graph in Figure 4 has more significance than the average values of the dimensions and the graph shows that the subdimensions SD2: Handling units, SD6: Material receipt and shipping, SD10: Supply technology, and SD11: Technology were among the best-rated subdimensions in terms of readiness for all companies. supply and SD12: Information provision of material recalls. The lowest values were for the subdimensions that belonged to dimension D3: Packaging, and this underlines the low average value from the previous graph. Other weaknesses across companies were SD1: Handling technology and SD13: Method of identification.
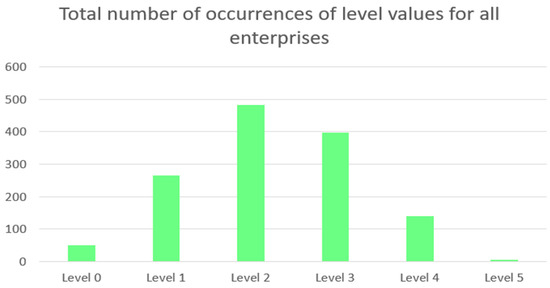
Figure 4.
Total number of occurrences of level values for all enterprises.
Each subdimension consisted of 3−4 indicators. From the graph of values of all indicators it is clear that lowest average value was for indicators in the D3: Packaging dimension, namely indicators U21 (Degree of automation), U27 (Attitude of company to packaging management), and U29 (Environmental aspects). Other indicators that had a lower level and thus potential options to increase readiness were in dimension D2: Storage.
The analyzed outputs from methodology represent aggregated data (average values supplemented by several values occurrences) (Figure 4). As can be seen from the graph, level 2 (481×) was followed by level 3 (396×) as the most assigned during the input and interview phases. The absolute minimums were levels 0 and 5. Level 2 and level 3 is clear. Then level 1 is selected, and level 4 had an even smaller number of occurrences. Figure 5 represents the total number of dimension level value occurrences for all enterprises
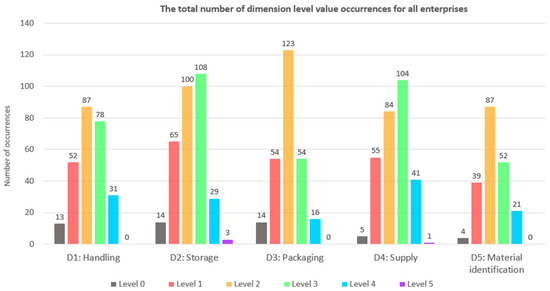
Figure 5.
The total number of dimension level value occurrences for all enterprises.
A slightly more detailed overview of assigned levels frequency is provided in Figure 6, which is a graph showing the number of occurrences of level values for subdimensions.
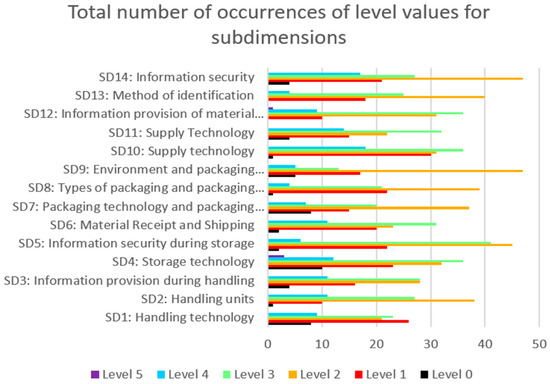
Figure 6.
Total number of occurrences of subdimension level values for all enterprises.
3.2. Application Outputs by Industry
The collected data can be analyzed according to other aspects and compared according to criteria such as industries (type), company size (number of employees), and production type (piece/small series, series, large series).
3.2.1. Enterprises in the Automotive Sector
These companies are engaged in the production of mechanical parts, components and assemblies, electrical or electronic components, software development, and the production of other components, parts, or materials used in the manufacture of vehicles, including services (e.g., heat treatment, painting, etc.).
More specifically, companies have established a production program for the production and assembly of components for cars, such as door panels, locking systems, head restraints, and seat frames or the production of steering systems. Therefore, the exclusive customers are large automakers that have set strict requirements for all their suppliers.
Car manufacturers make sure that their suppliers are certified according to standards. Ensuring and proving the required quality and timeliness of deliveries through certifications is gradually being transferred to lower-level suppliers, up to the original manufacturers of parts and materials. Suppliers to the automotive sector, if they want to succeed in the market, must have implemented not only the basic standards of the ISO 9001 —Quality Management System, ISO 14000—Environmental Management Systems, but also IATF 16949, which is an industry standard that unifies global requirements for quality management systems. The standard serves as a reference model for setting up basic control processes in the automotive industry. Like other technical standards, it defines an unsurpassable standard, requiring subsequent certification of the established management system (established processes) in the automotive industry organizations. The result is a certificate and the need to meet the requirements of this standard for the entire supply chain. These standards specify requirements for both production and support processes such as internal logistics.
A total of 13 companies in this field, which had a serial type of production, were analyzed, and this was the largest representation of the industry among the evaluated companies. The average level of preparedness in the automotive sector was 2.59. If we look deeper into the individual dimensions and subdimensions, the individual subdimensions were relatively balanced and ranged between level 2 and level 3. The weakest points were subdimensions SD1: Handling technology and SD8: Types of packaging and packaging material. Dimension D4: Supply shows the best values. The average values are shown in Figure 7. The values were all close around the medium; it would be possible to use the standard deviation in the future. There were no extreme values.
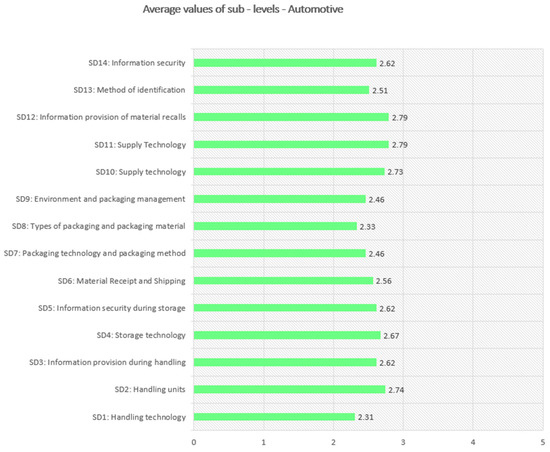
Figure 7.
Average values in the automotive sector.
The following Figure 8 shows the total number of occurrences in the automotive sector, for the 13 companies analyzed.
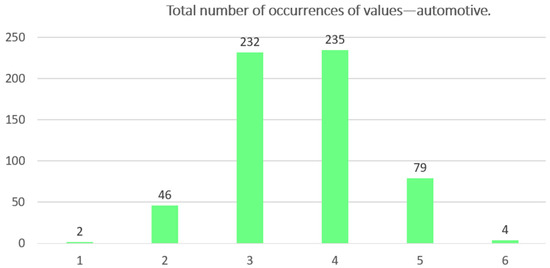
Figure 8.
Total number of occurrences of values—automotive.
As can be seen from the graph, level 4 (235×) was the most assigned to the indicators and level 3 (232×) had almost the same number, in contrast to level 5 (79×) and level 2 (46×).
Figure 9 shows the occurrences of level values for automotive sector.
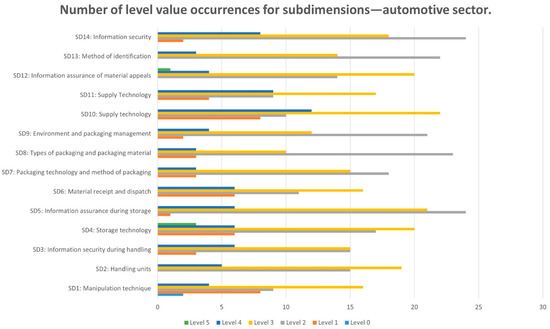
Figure 9.
Number of level value occurrences for subdimensions—automotive sector.
It can be seen from the graph that most of the values were level 2 and level 3. For certain indicators of subdimensions SD10: Supply technology and SD4: Storage technology, level 4 was often selected, which makes these two subdimensions the best rated. Less numerous is level 1, in which automotive companies, or their assessed indicators, occurred minimally.
3.2.2. Enterprises in the Mechanical Engineering Sector
Enterprises engaged mainly in engineering production were selected as engineering companies, and a total of 11 companies were analyzed. The production programs of these companies had a relatively wide range and the companies dealt with both light and heavy engineering. These were, for example, according to the nature of production, firing, pressing, machining of metal parts, production of metal components such as couplings, fans, conveyors, flaps, closures, and more. The overall average level of preparedness in the Mechanical Engineering sector was 1.67. After a more detailed analysis of subdimensions, it can be stated that almost all subdimensions were between level 1 and level 2. Individual subdimensions with average values of levels are in the graph shown in Figure 10.
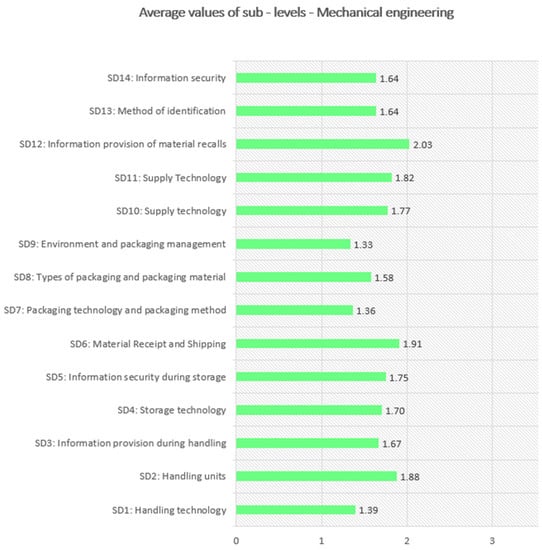
Figure 10.
Average values of suspension levels—mechanical engineering.
The weakest subdimensions included SD1: Handling technology and individual subdimensions from dimension D3: Packaging. The technical subdimensions generally in the individual handling, storage, and packaging subdimensions showed a relatively low level of readiness. Dimension D5: Material identification and its relevant subdimensions also had the potential to increase levels. The best-rated subdimensions included SD6: Material receipt and dispatch, as well as SD12: Material recall information, and SD2: Handling units.
Again, analyses were performed regarding the total number of occurrences of the assigned level values and level 1 (199×) occurred the most, level 2 (148×) had the second highest frequency, then level 3 and level 4 were assigned, see Figure 11.
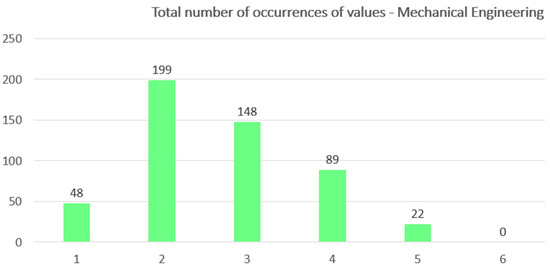
Figure 11.
Total number of occurrences of values—mechanical engineering.
In contrast to the automotive sector, level 0 was also assigned several times, which had the greatest impact on reducing the overall average value. The total number of occurrences of the level values for subdimensions in the mechanical engineering sector is shown graphically in Figure 12.
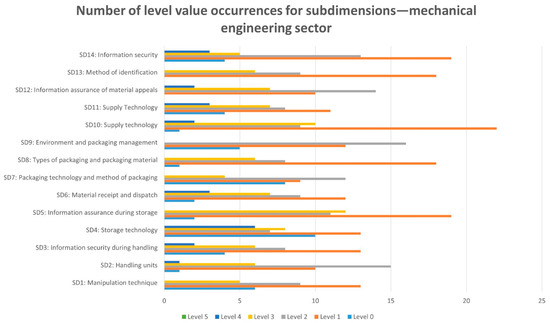
Figure 12.
Total number of occurrences of level values for subdimensions—mechanical engineering.
3.2.3. Electrical Engineering Enterprises
The last analyzed sector was companies from the electrical industry. Five companies were evaluated, which dealt with, for example, the production of electronic components, connectors for printed circuit boards, or manufactured OLED and LCD TVs. The aim was to have an evaluated sample from this group of companies, as it was assumed that these companies had implemented a basic degree of automation in the field of internal logistics and would be better prepared to meet the principles of Industry 4.0, especially in logistics processes related to handling within the company.
Only 5 companies were evaluated; however, the average level of preparedness in the electrical engineering sector was 2.55. Figure 13 is a graph showing the average level values for subdimensions and, unlike the previous two industries, all relevant subdimensions for dimension D1: Handling were better rated, and subdimensions SD3: Handling and SD2: Handling units also had very good values.
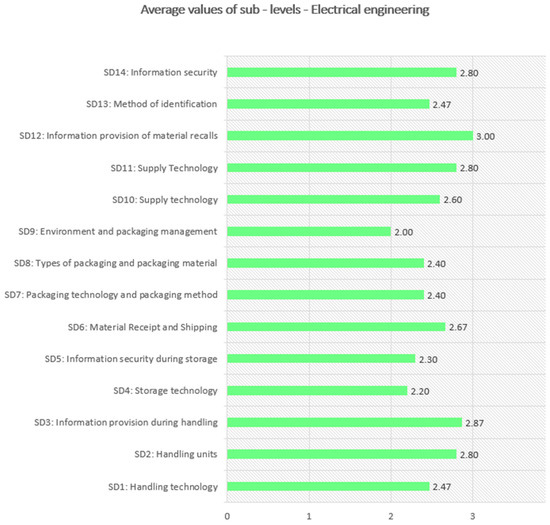
Figure 13.
Average values of sublevels—electrical engineering.
As in previous industries, analyses were again performed on the total number of occurrences of the assigned level values for the whole area for all five enterprises. Level 2 (101×) occurred the most, while level 3 (72×) and level 4 (37×) had the second highest frequency. The graphical representation is in Figure 14.
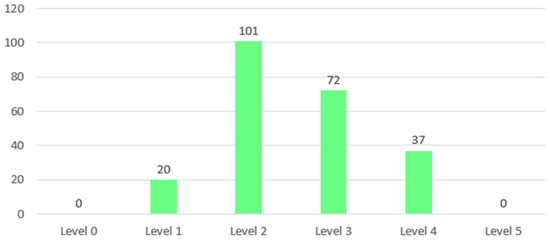
Figure 14.
Number of values’ occurrences—electrical engineering.
As with other industries, the graph in Figure 15 was processed, and the individual levels are differentiated in color.
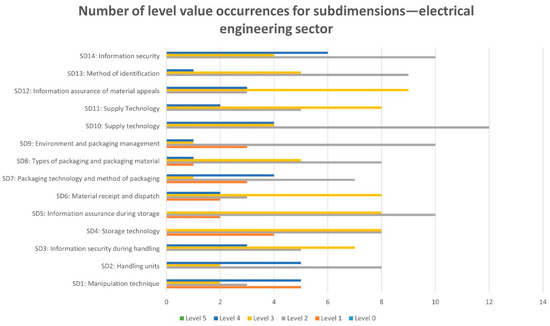
Figure 15.
Number of occurrences of level values—electrical engineering.
The level most assigned to the indicators was level 2, then the next was level 3, and several times level 4 was also assigned. The frequency of level 1 was significantly reduced and the lowest level 0 practically did not appear in the selection.
3.2.4. Comparison of Companies by Industry
In the analysis according to the industry criterion, the individual sectors were compared at the level of the overall readiness of internal logistics, which is shown graphically, including a description in Figure 16. The best-rated industry was automotive, which had a similar value to electrical engineering; however, this field was affected by a smaller sample of companies. We focused mainly on the fields of automotive and mechanical engineering, with the latter having a significantly lower readiness for internal logistics compared to automotive.
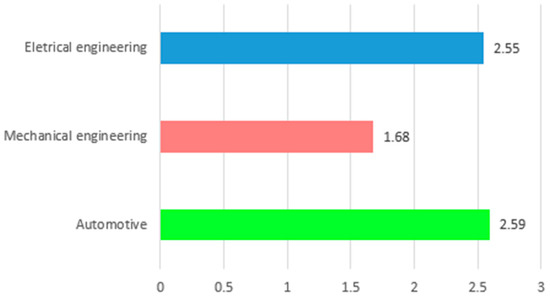
Figure 16.
Comparison of average values of dimensions according to industry.
- Comparison of average readiness levels
The average level of preparedness in the automotive sector was 2.59. If we look deeper into the lower parts of the internal logistics structure (subdimensions), the individual subdimensions were relatively balanced in a range between levels 2 and 3. The average level of preparedness in the mechanical engineering sector was 1.67. After a more detailed analysis of the lower parts of the internal logistics structure, it can be stated that almost all subdimensions were between levels 1 and 2.
Across all five dimensions, automotive companies had a better average level of preparedness than mechanical engineering. This statement is shown graphically with figures and color-coded columns given by industry in Figure 17.
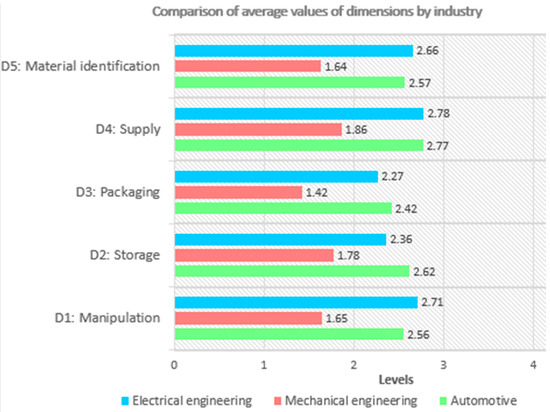
Figure 17.
Comparison of average values of dimensions in the automotive and mechanical engineering industries.
- Comparison of the total number of occurrences of level values
The industries were compared on the basis of a total number of occurrences of level values. Thirteen companies were evaluated in the automotive sector and 11 companies in the engineering sector. Frequencies were compared on the same basis while the number of enterprises was not the same (Figure 18). The field of engineering scored mainly at lower levels, especially at level 1, and then the number of occurrences decreased (red part). The automotive sector scored mainly at levels 2 and 3 (green bar). Interpolation of regression curves are shown for both sectors.
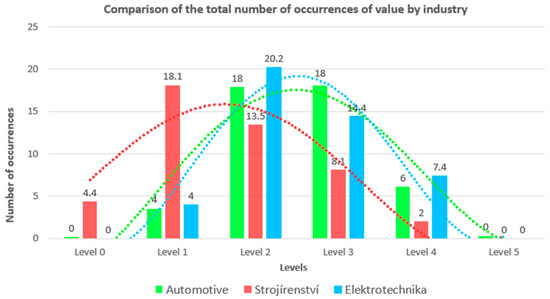
Figure 18.
Comparison of the total number of occurrences of values for automotive and mechanical engineering.
Analyzing the output data from methodology verification of average values of the level of preparedness of both sectors, the engineering sector had a significantly lower value than the automotive sector after comparing the number of occurrences with a graphical representation of values with regression curves.
4. Discussion: Functionality Verification
The methodology was tested in 29 industrial companies, which proves its real effectiveness. The transition to Industry 4.0 is not an easy step for most companies. With this tool, the process itself should go smoother. Based on all the knowledge gained, the benefits of the work were divided first into benefits for the scientific field and business practice. The practical contribution of this work is it aims to enable a company to thoroughly evaluate its readiness for internal logistics for Industry 4.0 and establish suitable strategies or reflect the appropriateness of current established strategies.
The theoretical contributions of the work can be summarized in several basic points for individual topics:
- Tools for assessing the readiness of enterprises for Industry 4.0
- A new perspective on the assessment of the company’s readiness for the concept of Industry 4.0 on a micro level, which is not common at the domestic level.
- Structure of internal logistics
- Structuring the entire area of internal logistics and defining areas affecting the overall level of readiness of internal logistics for the concept of Industry 4.0.
- Confirmation of the main areas of internal logistics in the form of dimensions and subdimensions in the general structure of internal logistics covering the entire area of internal logistics and not going beyond the gates of the company.
- Creation of a set of qualitative indicators in each subdimension for evaluation.
- Characteristics of individual indicators according to established levels, which will assess the level of fulfillment of the Industry 4.0 concept.
- The emergence of a methodology based on a defined theoretical basis, and mutual links between individual areas
- A new method of evaluation is based on the established six levels (0–5 level) for the evaluation of indicators, subdimensions, and dimensions.
- Evaluation that uses a suitable mathematical basis applicable to the entire field of internal logistics.
- An innovative evaluation method based on a point system with division into six intervals using an exponential function.
- Electronic processing of documents for a structured interview with subsequent analytical evaluation results.
The benefit for business practice is the creation of a comprehensive independent evaluation tool in the form of a methodology, which is mainly a diagnostic method for determining the level of readiness of internal logistics processes in the company. The task is to analyze the current state and evaluate readiness. It is also appropriate that companies can use the assessment with this tool repeatedly. It is therefore possible to compare the results in a certain period by repeated evaluation. This is already individual to each company and due to the measures and implementation of new equipment.
Another partial benefit of this tool is the evaluation proceeding from the lowest elements to the entire area, seeing the structure of internal logistics. The resulting evaluation also reveals the so-called narrow places. These are areas in which the assessment is at low levels. It is therefore possible to do a detailed analysis with the detection of the weakest points in any dimension and to identify the worst evaluation of a sub-area. These areas are the so-called factors that most affect the entire dimension. Therefore, in sub-areas where the level is low, it is possible to start and take measures that will subsequently increase the level.
In summary, the application of the created methodology provides companies with the following benefits:
- It will make it possible to determine the level of readiness of the area of internal logistics in the company, including sub-areas and their interconnection.
- Compares the individual main dimensions with detailed analysis, identifying the weakest points in any dimension, and obtaining the worst-rated sub-areas.
- Determination of strong and weak areas of internal logistics in the company.
- Possible repeated use of the evaluation tool and subsequent comparison.
- Verification of the established strategy for the implementation of Industry 4.0.
- Structure and detailed breakdown of the internal logistics area in the company with the determination of a set of indicators that affect the level.
- Awareness of the potential of internal logistics within the Industry 4.0 concept and the possible implementation of principles in this area.
- Identification of the situation in companies regarding Industry 4.0, whether they are familiar with the principles of Industry 4.0, whether companies can respond to these challenges, under what conditions, and at what time. In general, whether companies in the Czech Republic are ready for Industry 4.0.
5. Conclusions
Manufacturing companies are currently facing significant challenges in terms of using more or less comparable technologies with Industry 4.0. Handling, supply, and warehousing technology are areas of internal logistics in which the latest technologies corresponding to Industry 4.0 have been used for a long time. The consequent increasing complexity at all levels of companies creates uncertainty about the relevant organizational and technological capabilities and appropriate strategies for their development. Many companies already fulfill the principles of Industry 4.0., partially. Here, industry 4.0 does not represent a final stage (goal), but rather the transition to modern logistics management.
In summary, the developed application provides the following practical advantages:
- Determine the level of readiness of internal logistics in the company, including sub-areas and their interconnection;
- Gives a detailed analysis with the identification of bottlenecks within any area, pinpointing obtaining the worst-rated;
- Internal identification of logistic strengths and weaknesses;
- Reusability and adaptability of the evaluation tool;
- Strategy set verification and subsequent implementation for Industry 4.0;
- Awareness of the potential within the concept of Industry 4.0;
- Creation of a team of people (experts) on Industry 4.0. topics.
Therefore, a methodology was proposed to assess logistics processes. Next, their readiness for Industry 4.0 was analyzed, and from a practical point of view, a tool was created. It often happens that industrial companies do not comprehensively address logistics as an area suitable for the implementation of modern technologies. Innovations serve often just for marketing purposes. Industry 4.0 is an idea rather than a specific goal. The process of transformation to modern logistics management is rather organic and companies do not look at the wider context.
It is also beneficial for businesses to become familiar with the concept of Industry 4.0, and businesses should give more importance to this concept and promote comparable technologies to successfully realize the entire concept of Industry 4.0. Currently, enterprises perceive the concept of Industry 4.0 as highly complex without strategic guidance, enterprises lack a clear idea of Industry 4.0, which leads to uncertainty about the benefits and results, and enterprises cannot assess their capabilities in Industry 4.0, which prevents the adoption of any coordinated measures. The implementation of the principles of Industry 4.0 is specific, and technologically, organizationally, and financially demanding for many companies. This creates further potential cooperation between the company’s management and a team of experts specializing in internal logistics and the concept of Industry 4.0, where greater details for implementation, knowledge of the company, and the identification of technological and financial possibilities for Industry 4.0 technologies can gradually be revealed. The goal is to create a broad team of experts across a wide spectrum who will participate in workshops in the enterprise and cooperate with the research organization represented by the authors of this article. Close cooperation was established with several companies.
Author Contributions
Conceptualization, P.P. and M.S.; methodology, M.Z. and P.P.; validation, M.Z., P.P. and M.S.; formal analysis, P.P.; investigation, P.P.; resources, M.Z.; data curation, M.Z.; writing—original draft preparation, M.Z. and P.P.; writing—review and editing, P.P.; visualization, M.Z. and P.P.; supervision, M.S.; project administration, M.Z., P.P. and M.S.; funding acquisition, M.S. All authors have read and agreed to the published version of the manuscript.
Funding
This research was created with the support of the project SGS-2021-028 ‘Developmental and training tools for the interaction of man and the cyber-physical production system’ under the Internal Grant Agency of the University of West Bohemia.
Institutional Review Board Statement
Not applicable.
Informed Consent Statement
Informed consent was obtained from all subjects involved in the study.
Data Availability Statement
The data presented in this study are available on request from the corresponding author.
Conflicts of Interest
The authors declare no conflict of interest.
References
- Kowalikova, P.; Polak, P.; Rakowski, R. The challenges of defining the term “Industry 4.0”. Society 2020, 57, 631–636. [Google Scholar] [CrossRef]
- Beier, G.; Ullrich, A.; Niehoff, S.; Reißig, M.; Habich, M. Industry 4.0: How it is defined from a sociotechnical perspective and how much sustainability it includes–A literature review. J. Clean. Prod. 2020, 259, 120856. [Google Scholar] [CrossRef]
- Bibby, L.; Dehe, B. Defining and assessing industry 4.0 maturity levels—Case of the defence sector. Prod. Plan. Control. 2018, 29, 1030–1043. [Google Scholar] [CrossRef]
- Erro-Garcés, A. Industry 4.0: Defining the research agenda. Benchmarking Int. J. 2019, 28, 1858–1882. [Google Scholar] [CrossRef]
- Oesterreich, T.D.; Teuteberg, F. Understanding the implications of digitisation and automation in the context of Industry 4.0: A triangulation approach and elements of a research agenda for the construction industry. Comput. Ind. 2016, 83, 121–139. [Google Scholar] [CrossRef]
- Bahrin, M.A.K.; Othman, M.F.; Azli, N.H.N.; Talib, M.F. Industry 4.0: A review on industrial automation and robotic. J. Teknol. 2016, 78, 6–13. [Google Scholar]
- Pereira, A.C.; Romero, F. A review of the meanings and the implications of the Industry 4.0 concept. Procedia Manuf. 2017, 13, 1206–1214. [Google Scholar] [CrossRef]
- Poór, P.; Basl, J. Processes of innovations implementation into Industry 4.0. automotive industry standards. Acta Innov. 2020, 35, 21–28. [Google Scholar] [CrossRef]
- Poor, P.; Basl, J. Czech Republic and processes of industry 4.0 implementation. In Proceedings of the 29th DAAAM International Symposium, Zadar, Croatia, 24–27 October 2018; pp. 454–459. [Google Scholar]
- Poór, P.; Basl, J. Overview of current issues in Industry 4.0 implementation. Zarz. Przeds. 2018, 21, 9–14. [Google Scholar]
- Poór, P.; Basl, J. Readiness of companies in relation to Industry 4.0 implementation. In Proceedings of the International Scientific Conference Hradec Economic Days 2019 Part II (2019), Hradec Králové, Czech Republic, 5–6 February 2019. [Google Scholar] [CrossRef]
- Poór, P.; Ženíšek, D.; Basl, J. Radical change in machinery maintance–a maturity model of maintenance using elements of industry 4.0. In Proceedings of the IDIMT-2019 Innovation and Transformation in a Digital World 27th Interdisciplinary Information Management Talks, Kutna Hora, Czech Republic, 4–6 September 2019; Chroust, G., Ed.; Trauner Verlag Univeristat: Linz, Austria, 2019; pp. 67–74. ISBN 978-3-99062-590-3. [Google Scholar]
- Poór, P.; Basl, J.; Zenisek, D. Predictive Maintenance 4.0 as next evolution step in industrial maintenance development. In Proceedings of the 2019 International Research Conference on Smart Computing and Systems Engineering (SCSE), Colombo, Sri Lanka, 28 March 2019; pp. 245–253. [Google Scholar]
- Poór, P.; Trstenjak, M.; Basl, J. Maintenance Ideal Model in Industry 4.0—A Transformation Strategy Roadmap to Readiness Factor Calculation. In Hradec Economic Days; Maresova, P., Jedlicka, P., Firlej, K., Soukal, I., Eds.; University of Hradec Kralove: Hradec Kralove, Czech Republic, 2020. [Google Scholar] [CrossRef]
- Lee, N.K. Total automation: The possibility of lights-out manufacturing in the near future. Mo. ST’s Peer Peer 2018, 2, 4. [Google Scholar]
- Erdoğan, G. Land selection criteria for lights out factory districts during the industry 4.0 process. J. Urban Manag. 2019, 8, 377–385. [Google Scholar] [CrossRef]
- Torbacki, W.; Kijewska, K. Identifying Key Performance Indicators to be used in Logistics 4.0 and Industry 4.0 for the needs of sustainable municipal logistics by means of the DEMATEL method. Transp. Res. Procedia 2019, 39, 534–543. [Google Scholar] [CrossRef]
- Zoubek, M.; Šimon, M. Methodology for evaluating the readiness of internal logistics processes for Industry 4.0. In IOP Conference Series: Materials Science and Engineering; IOP Publishing: Bristol, UK, 2020; Volume 947, p. 012005. [Google Scholar]
- Zoubek, M.; Poór, P.; Šimon, M. A maturity model for evaluating and increasing the readiness of the company within the concept of Industry 4.0 with a focus on internal logistics processes. In Proceedings of the International Conference on Science, Technology, Engineering and Management (ICSTEM), Moscow, Russia, 10–11 January 2022; Institute for Technology and Research (ITRESEARCH): Moscow, Russia, 2020; pp. 7–13, ISBN 978-93-89732-92-4. [Google Scholar]
- Zoubek, M.; Šimon, M. Logistics 4.0: Readiness and technology of internal logistics processes of companies and design of a maturity model for warehousing. In Proceedings of the 35th International Business Information Management Association Conference, Seville, Spain, 1–2 April 2020; International Business Information Management Association (IBIMA): Seville, Spain, 2020. [Google Scholar]
- Skapinyecz, R.; Illés, B.; Bányai, Á. Logistic aspects of Industry 4.0. In IOP Conference Series: Materials Science and Engineering; IOP Publishing: Bristol, UK, 2018; Volume 448, p. 012014. [Google Scholar]
- Zoubek, M.; Simon, M. Evaluation of the Level and Readiness of Internal Logistics for Industry 4.0 in Industrial Companies. Appl. Sci. 2021, 11, 6130. [Google Scholar] [CrossRef]
- Spruit, M.R.; Sacu, C. DWCMM: The Data Warehouse Capability Maturity Model. J. Univers. Comput. Sci. 2015, 21, 1508–1534. [Google Scholar]
- Easterbrook, S.; Singer, J.; Storey, M.A.; Damian, D. Selecting empirical methods for software engineering research. In Guide to Advanced Empirical Software Engineering; Springer: London, UK, 2008; pp. 285–311. [Google Scholar]
- Derry, S.J.; Pea, R.D.; Barron, B.; Engle, R.A.; Erickson, F.; Goldman, R.; Sherin, B.L. Conducting video research in the learning sciences: Guidance on selection, analysis, technology, and ethics. J. Learn. Sci. 2010, 19, 3–53. [Google Scholar] [CrossRef]
- Brannen, J. Combining qualitative and quantitative approaches: An overview. In Mixing Methods: Qualitative and Quantitative Research; Routledge: Oxfordshire, UK, 2017; pp. 3–37. [Google Scholar]
Publisher’s Note: MDPI stays neutral with regard to jurisdictional claims in published maps and institutional affiliations. |
© 2022 by the authors. Licensee MDPI, Basel, Switzerland. This article is an open access article distributed under the terms and conditions of the Creative Commons Attribution (CC BY) license (https://creativecommons.org/licenses/by/4.0/).