Article

Numerical Study on Vortical Flow Structure and Performance Enhancement of Centrifugal Compressor Impeller

Department of Mechanical Engineering, Gachon University, Seongnam-si 13120, Korea
*
Authors to whom correspondence should be addressed.
Appl. Sci. 2022, 12(15), 7755; https://doi.org/10.3390/app12157755
Submission received: 22 June 2022 / Revised: 21 July 2022 / Accepted: 29 July 2022 / Published: 1 August 2022
(This article belongs to the Special Issue Computational Fluid Dynamics for Future Energies)

Abstract

:
The performance and efficiency of a centrifugal compressor are usually affected by the highly complex 3-dimensional flow structures which develop in the flow field of the compressor. Several experiments and research using numerical analysis have been reported, however, there are still many unknown physical phenomena that need to be studied, in order to optimize the design and improve the efficiency of turbomachines, especially those installed on hydrogen-powered fuel cell electric vehicles (FCEVs). In this study, the 3-dimensional vortex structures were analyzed using the critical-point theory and the probabilistic definitions, for an air supply device mounted on the commercial hydrogen FCEVs. The behavior of the complex 3-dimensional vortex structures at the design flow rate and low flow rate were elucidated. A tip leakage vortex was observed to develop at the leading edge of the main blade at all flow rates, which caused interference to the splitter blade. At 60% of the design flow rate, a vortex breakdown occurred at the tip leakage vortex near the leading edge of the main blade, and a reverse flow at 50% chord length of the main blade’s suction surface. The boundary layer which developed at the leading edge of the main blade’s suction surface at all flow rates led to the creation of a hub separation vortex by interfering with the boundary layer developed at the hub surface as a result of the centrifugal force. In addition, the boundary layer developed at the hub and shroud surface created a horseshoe vortex as it moved downstream and interfered with the leading edge of the main blade and splitter blade. It was confirmed that the behavior of the tip leakage, hub separation, and horseshoe vortex structures determined the aerodynamic performance of the centrifugal compressor. The average pressure difference improved by 1.47% of the entire flow rate after optimizing the compressor design.

1. Introduction

During the last decade, governments around the world have implemented strict regulations for reducing greenhouse gas emissions and energy consumption. This will help to protect the environment and control the effects of global warming. It is estimated that the transport sector is responsible for about 30% of the world’s greenhouse gas emissions, and internal combustion engine vehicles (ICEV) contribute close to 70% of that emission [1]. The automotive industry has developed several power train concepts, which include hybrid vehicles, electric vehicles, and fuel cell vehicles, in order to reduce the carbon footprint of the industry. Fuel Cell Electric Vehicles (FCEVs) are one of the ideal solutions to the global warming and energy crisis. They have zero carbon dioxide emissions and high system efficiency while having a long driving distance and short refilling time [2,3]. If renewable energy sources, such as hydrogen are used, FCEVs will be more environmentally friendly and can reach net-zero emission [4]. Hydrogen is readily available in nature in various forms, which will make hydrogen-fueled FCEVs indispensable in the future in terms of performance and environmental friendliness [1,5,6,7].
The electric power in the hydrogen-fueled FCEVs is generated through the electrochemical reaction of hydrogen and oxygen (air) in the fuel cell stack [1]. The air compressor supplies compressed air from the atmosphere to the fuel cell stack while the turbo blower supplies hydrogen from the compressed hydrogen tank and water is released as the by-product. The air compressor is one of the most important auxiliary components of the FCEV, that determines the cost, efficiency, performance, and power density of the system [8,9,10]. The centrifugal compressor is considered the most ideal air compressor, when compared with other types (such as screw, scroll, and roots), because of its ability to provide oil-free clean air at high efficiency, favorable NVH (noise, vibration, harshness) performance, and at a smaller energy footprint [4,8,11,12]. However, centrifugal compressors generally have narrow operating ranges and tend to operate near the surge line and flow instabilities at these operating conditions lead to undesirable pressure pulsation [11].
Therefore, to improve the performance of hydrogen FCEVs, as well as other centrifugal compressor applications, it is important to improve the pressure ratio and operating range of the centrifugal compressor [13]. The flow field in the centrifugal compressor is 3-dimensional and highly complex. Composed of many flow phenomena such as shock waves, tip leakage vortices, wakes, reverse flows, and the interactions among them. These flow phenomena greatly affect the performance of the centrifugal compressor and their occurrence need to be thoroughly understood to improve the performance of the centrifugal compressor [14]. In the previous studies, Ibaraki et al. [14] performed a computational fluid dynamics (CFD) analysis of the transonic centrifugal compressor with a double splitter blade using the k-omega turbulence model and analyzed the vortical flow structures by visualizing the vortex structure using CFD analysis. The experimental results and CFD analysis results were compared for the relative velocity distribution at various locations of the blade. They observed that the changes in pitch velocity affected by the shock wave due to the transonic were the same in both results. Tomita et al. [13] performed unsteady numerical calculations of two different centrifugal compressors at 160,000 rpm by experimental and numerical investigations and revealed that the internal flow structures were related to the operating range. In compressors with a narrow operating range, the compressors’ characteristics become unstable at low flow rates. It was predicted that the blockage caused by the tip leakage vortex breakdown can stabilize the flow field and improve performance.
The flow phenomena occurring in the centrifugal compressor are largely influenced by the shape of the impeller and the flow passage between the hub and the shroud [15]. Several methods are used for designing the geometry of flow passage and the impeller blades [15,16,17], however, the configuration of the air compressor is largely determined by the designer’s experience and intuition [12]. Therefore, the manufacturer’s design is usually modified (enhanced) to improve the performance based on the flow structures within the passage after CFD calculations. Optimization of the impeller is crucial when designing a centrifugal compressor, as the flow development inside that component not only determines the aerodynamic efficiency of the impeller itself but also strongly affects the efficiency of the downstream diffuser [18].
The previous studies conducted flow structure analysis on industrial centrifugal compressors [13,14] and so far, no studies have been conducted on turbomachines for hydrogen-fueled FCEVs using vortex visualization techniques. Therefore, in this study, the authors analyzed the behavior of the three-dimensional vortical flow structures of the internal flow of an impeller of an air supply device mounted on commercial hydrogen FCEVs, using CFD analysis and vortex visualization techniques. The CFD analysis results were compared with and validated by the experimental results. Based on the CFD analysis results of the behavior of vortical flow structures, the design of the centrifugal compressor was enhanced using the ANSYS Bladegen software. The enhanced centrifugal compressor impeller and conventional centrifugal compressor impeller were compared at design flow rate and low flow rate. By optimization of the impeller, the average performance of the centrifugal compressor was improved by 1.47% of the entire flow rate.

2. CFD Analysis and Vortex Visualization Method

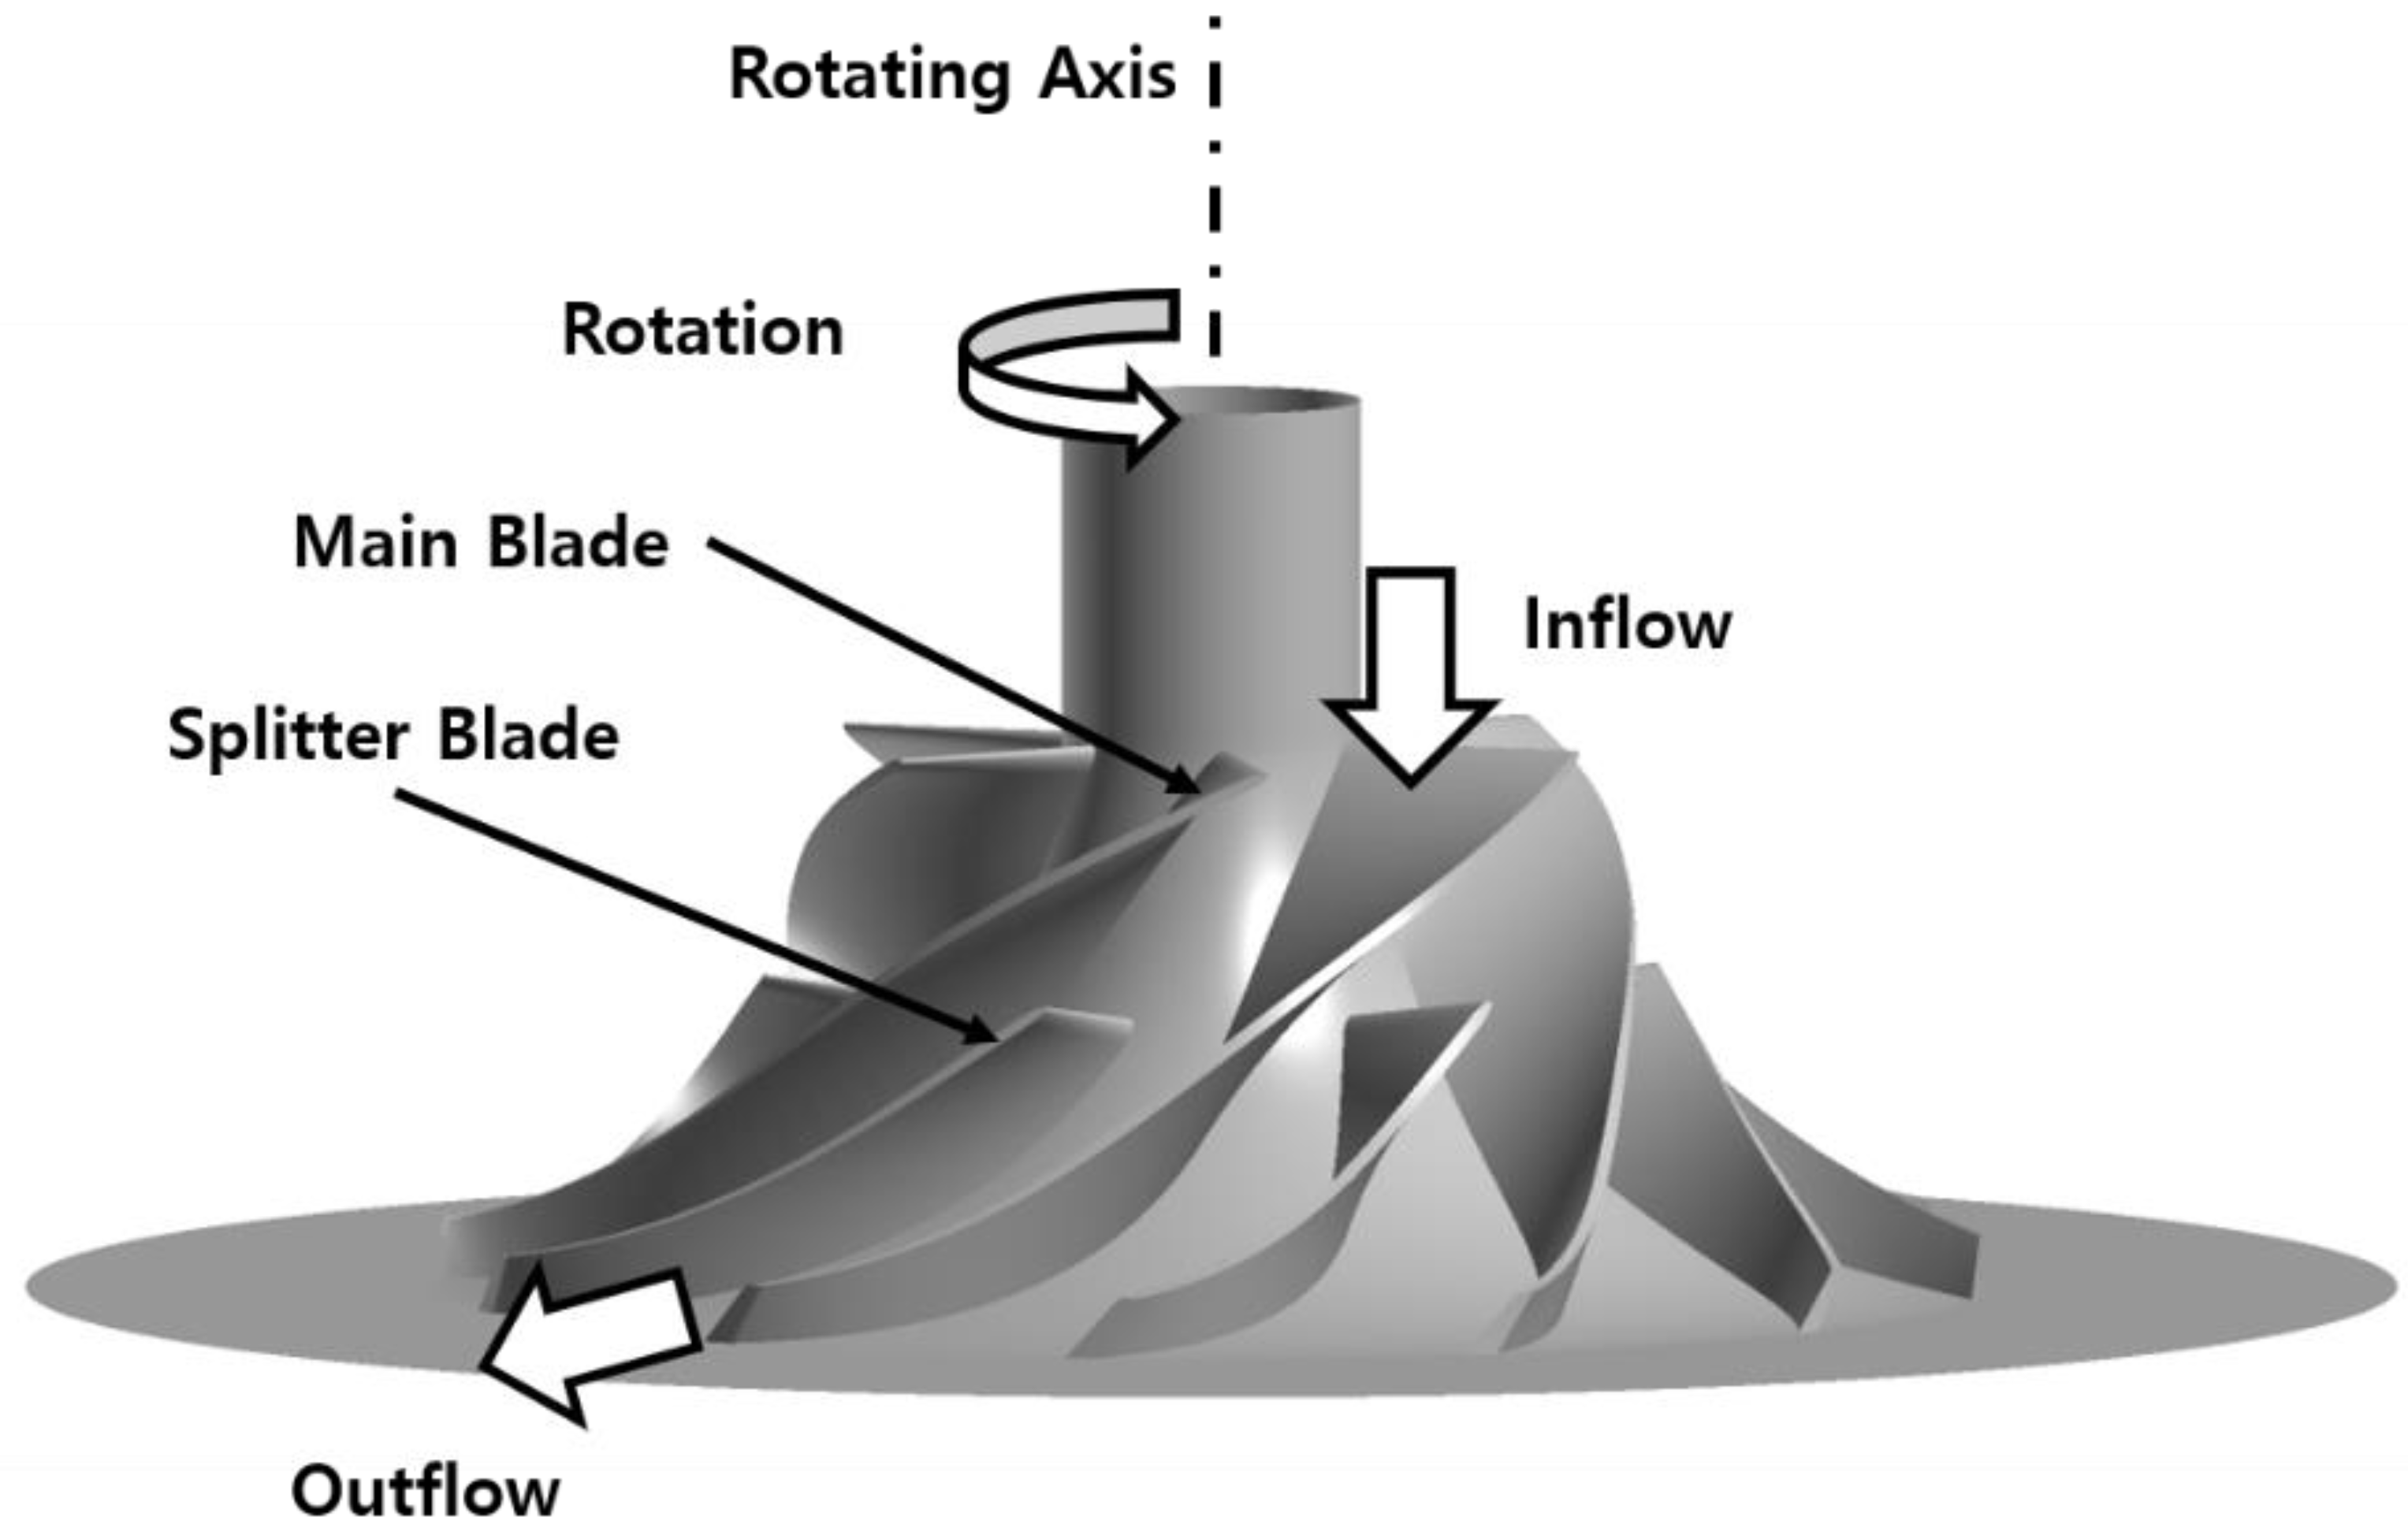
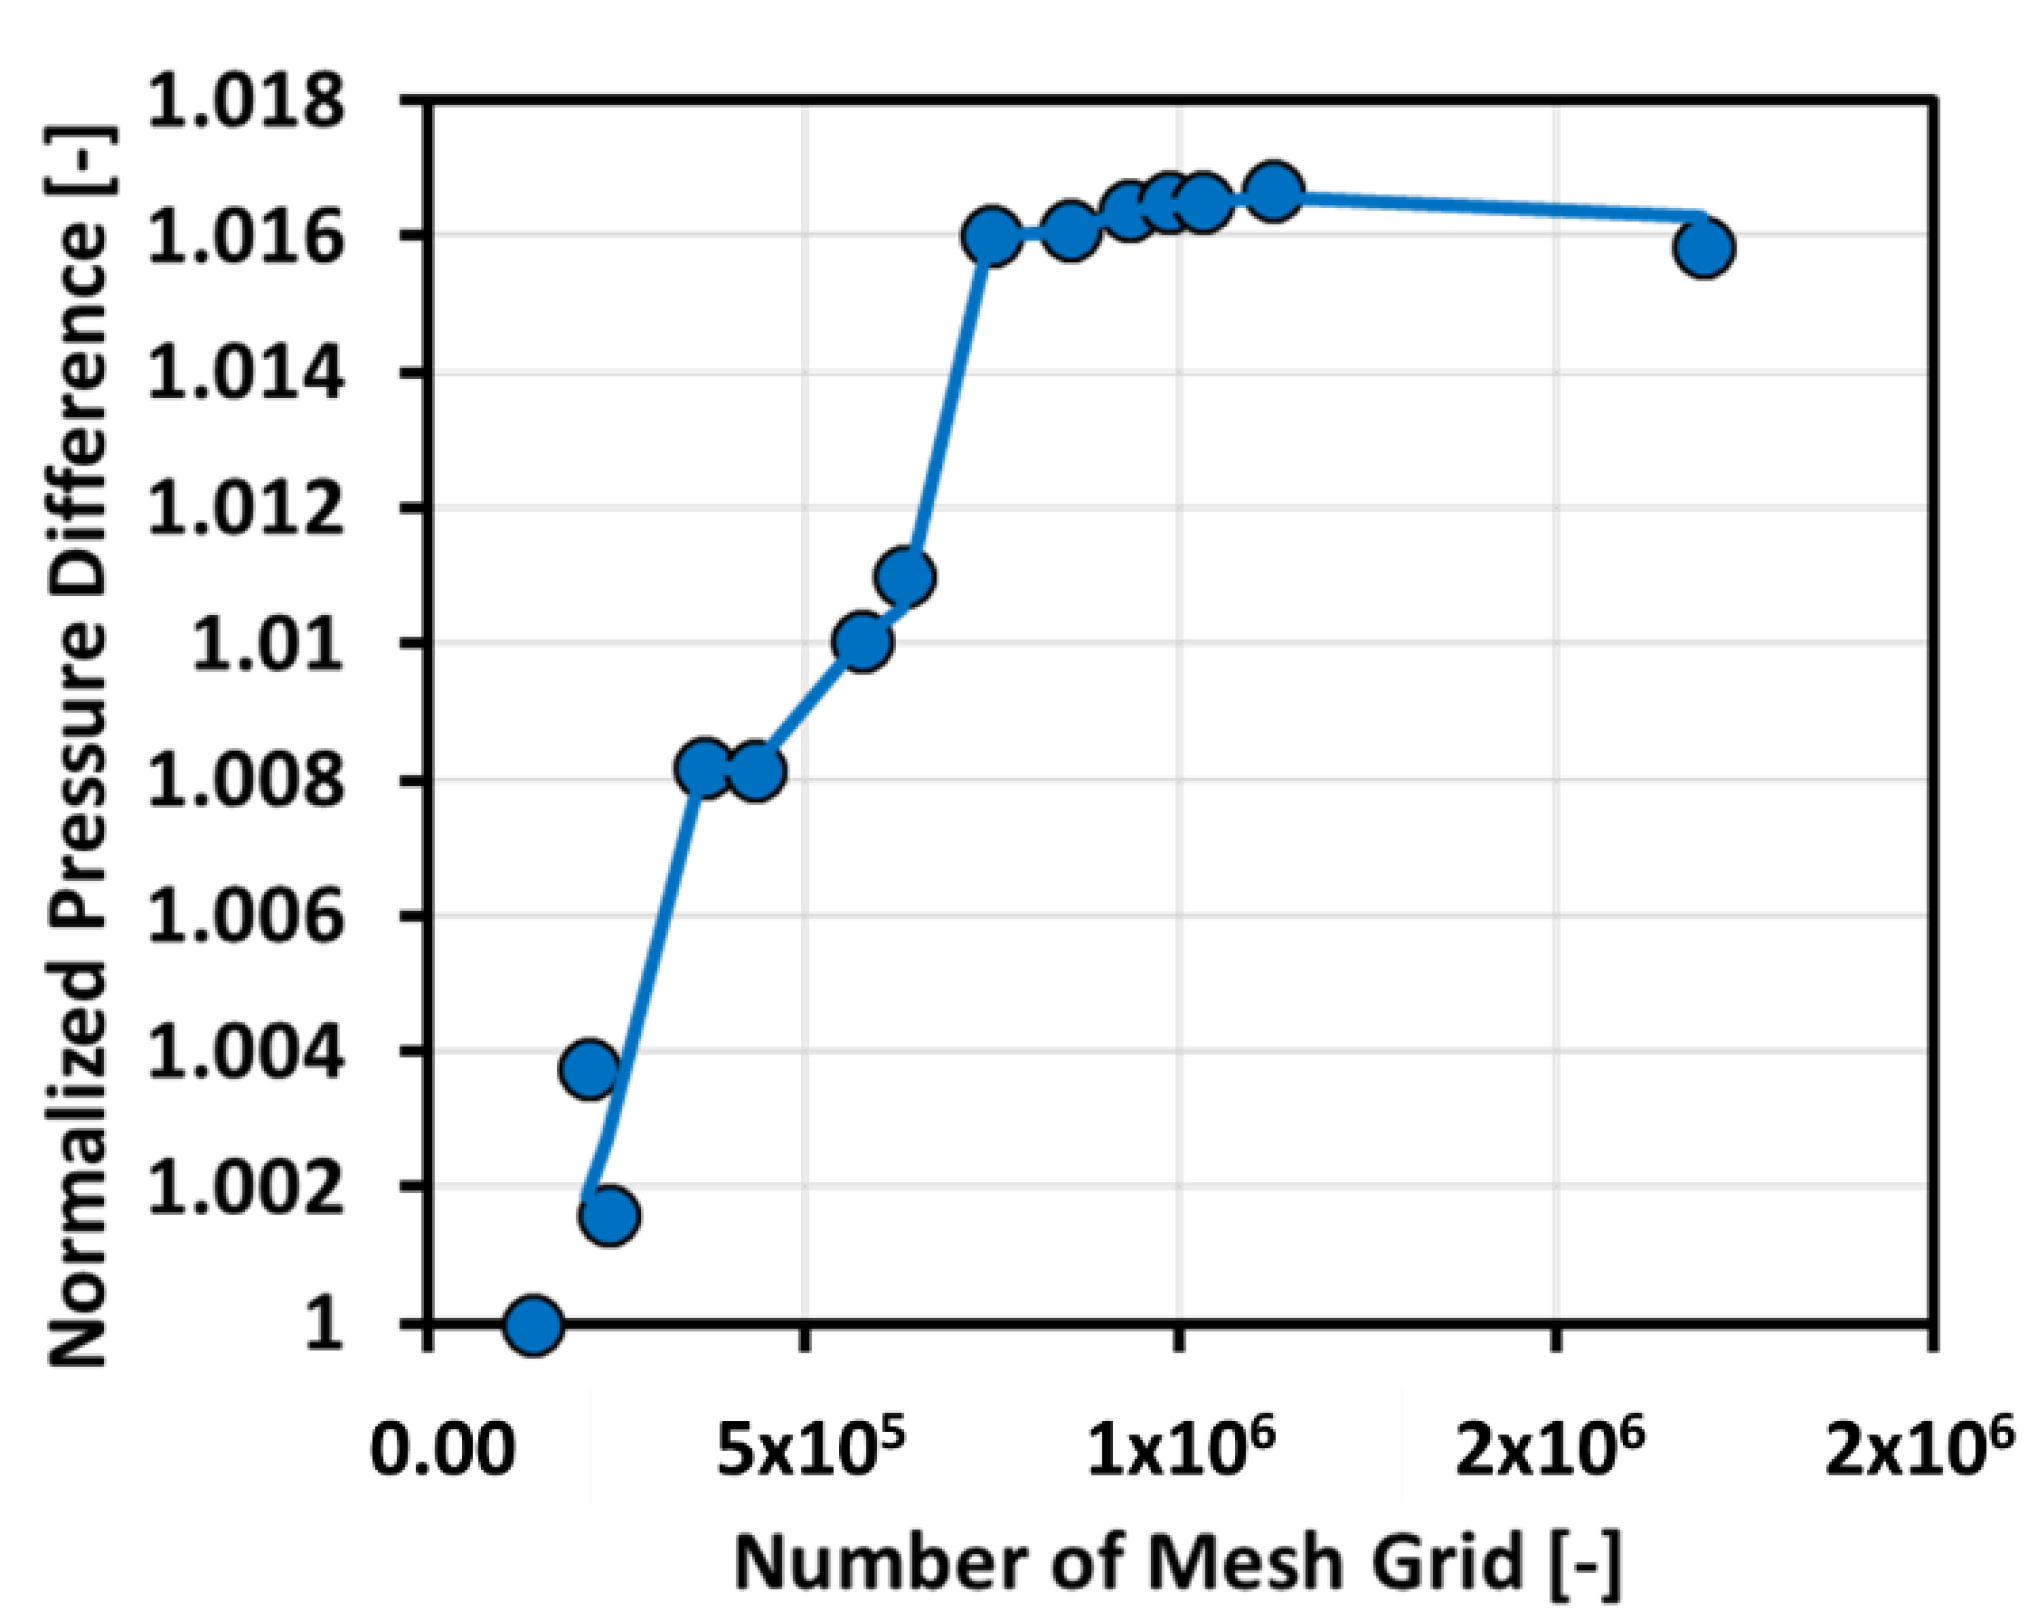
2.1. Specification of CFD Analysis Model

The model used in this study consisted of an impeller installed inside an air supply device of a commercial hydrogen FCEV. The design specifications of the impeller are shown in Figure 1 and Table 1. The impeller consisted of six main blades and six splitter blades. The design specifications except for the number of the main blades and splitter blades were normalized by the impeller diameter.

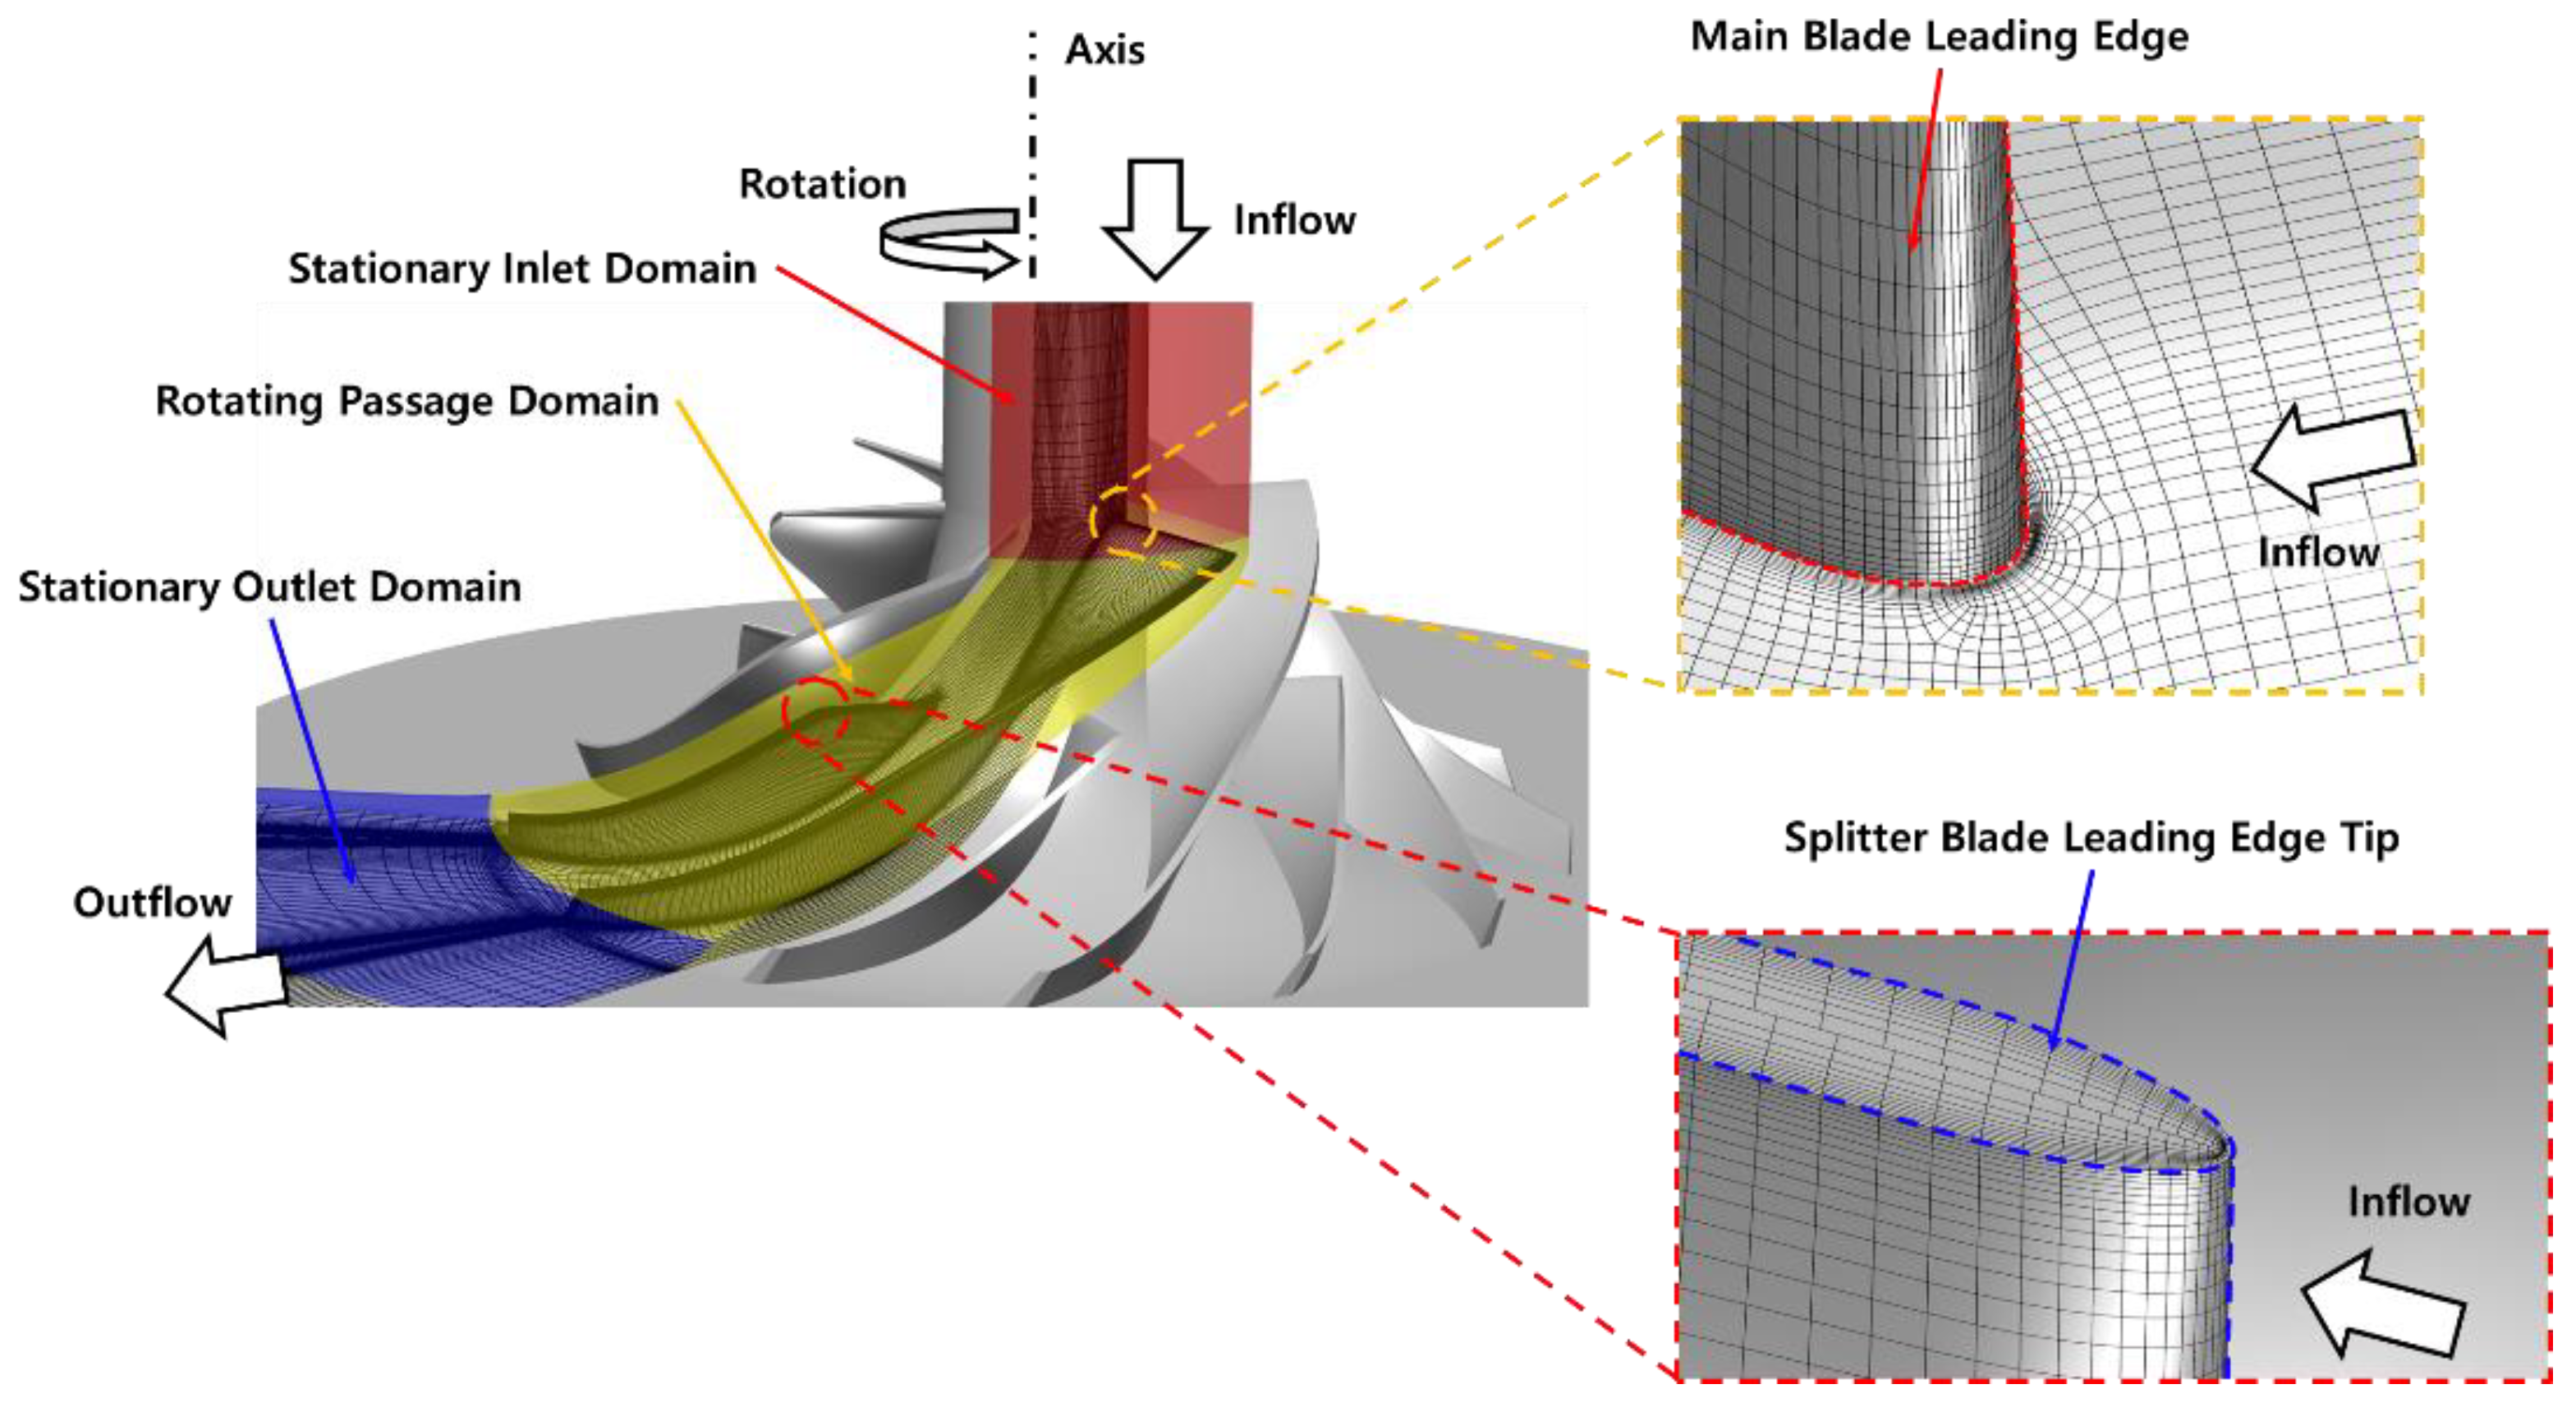
2.2. Mathematical Model and Boundary Conditions

In this study, 3D, compressible, Reynolds Averaged Navier–Stokes (RANS) equations are adopted for obtaining steady state results of the centrifugal compressor. For this simulation, it is assumed that mass, momentum, and energies are conserved and by these assumptions, the governing equations can be written as follows in a stationary frame [19];
The continuity equation is described as Equation (1),
ρ t + x j ( ρ U j ) = 0
The momentum equations are described as Equations (2) and (3),
ρ U i t + x j ( ρ U i U j ) = ( p ) x i + x j ( τ i j ρ u i u j ¯ ) + S M
The total energy equation is described as Equation (4),
( ρ h h o t ) t p t + x j ( ρ U j h h o t ) = x j ( λ T x j ρ u j h ¯ ) + x j [ U i ( τ i j ρ u i u j ¯ ) ] + S E
where h h o t is the total enthalpy, related to the static enthalpy h ( T , p ) by,
h h o t = h + 1 2 U i U j + k
The velocities at the wall can be represented as follows;
U w a l l = 0   ( at   stationary   frame )
U w a l l = ω R   ( at   rotating   frame ,   hub )
U w a l l = ω R   ( a t   r o t a t i n g   f r a m e ,   s h r o u d )
Because the shroud is fixed while the passage is rotating, wall velocity is defined as Equation (7). The heat transfer condition of the wall is defined as follows;
q w a l l = 0
For flows in the rotating frame, rotating at a constant angular velocity ω , the source of rotating momentum is defined as follows;
S M , r o t = S C o r + S c f g
S C o r = 2 ρ ω × U
S c f g = ρ ω × ( ω × r )
The calculation domains of numerical analysis were configured to contain one main blade and one splitter blade each; 1/6 of the total impellers, as illustrated in Figure 2. The red and blue parts were set as stationary domains, and the yellow blade parts were set as rotating domains.
Grid sensitivity is conducted with normalized pressure difference. As shown in Figure 3, the normalized pressure difference after about 900,000 grids is converged. Therefore, the computational grid system is consisted of 1,000,000 hexahedral grids by ANSYS Turbogrid. The inlet and outlet conditions (temperature, pressure, mass flow rate, and revolutions per minute) of the calculation domains were the same as the experimental conditions. Figure 4 shows the experimental equipment of the centrifugal compressor. Analysis was performed using ANSYS CFX using the Shear Stress Transport (SST) turbulence model [20]. The Shear Stress Transfer (SST) turbulence model is adopted to predict precisely flow separation [20,21,22,23]. In various research studies, the SST turbulence model has been confirmed to be able to predict precisely flow separation under adverse pressure gradients [21,22,23]. Additionally, the SST turbulence model has high numerical stability than k ω turbulence model [20]. By using this turbulence model, 3D-RANS simulations are conducted with high accuracy flow separation prediction and high numerical stability.

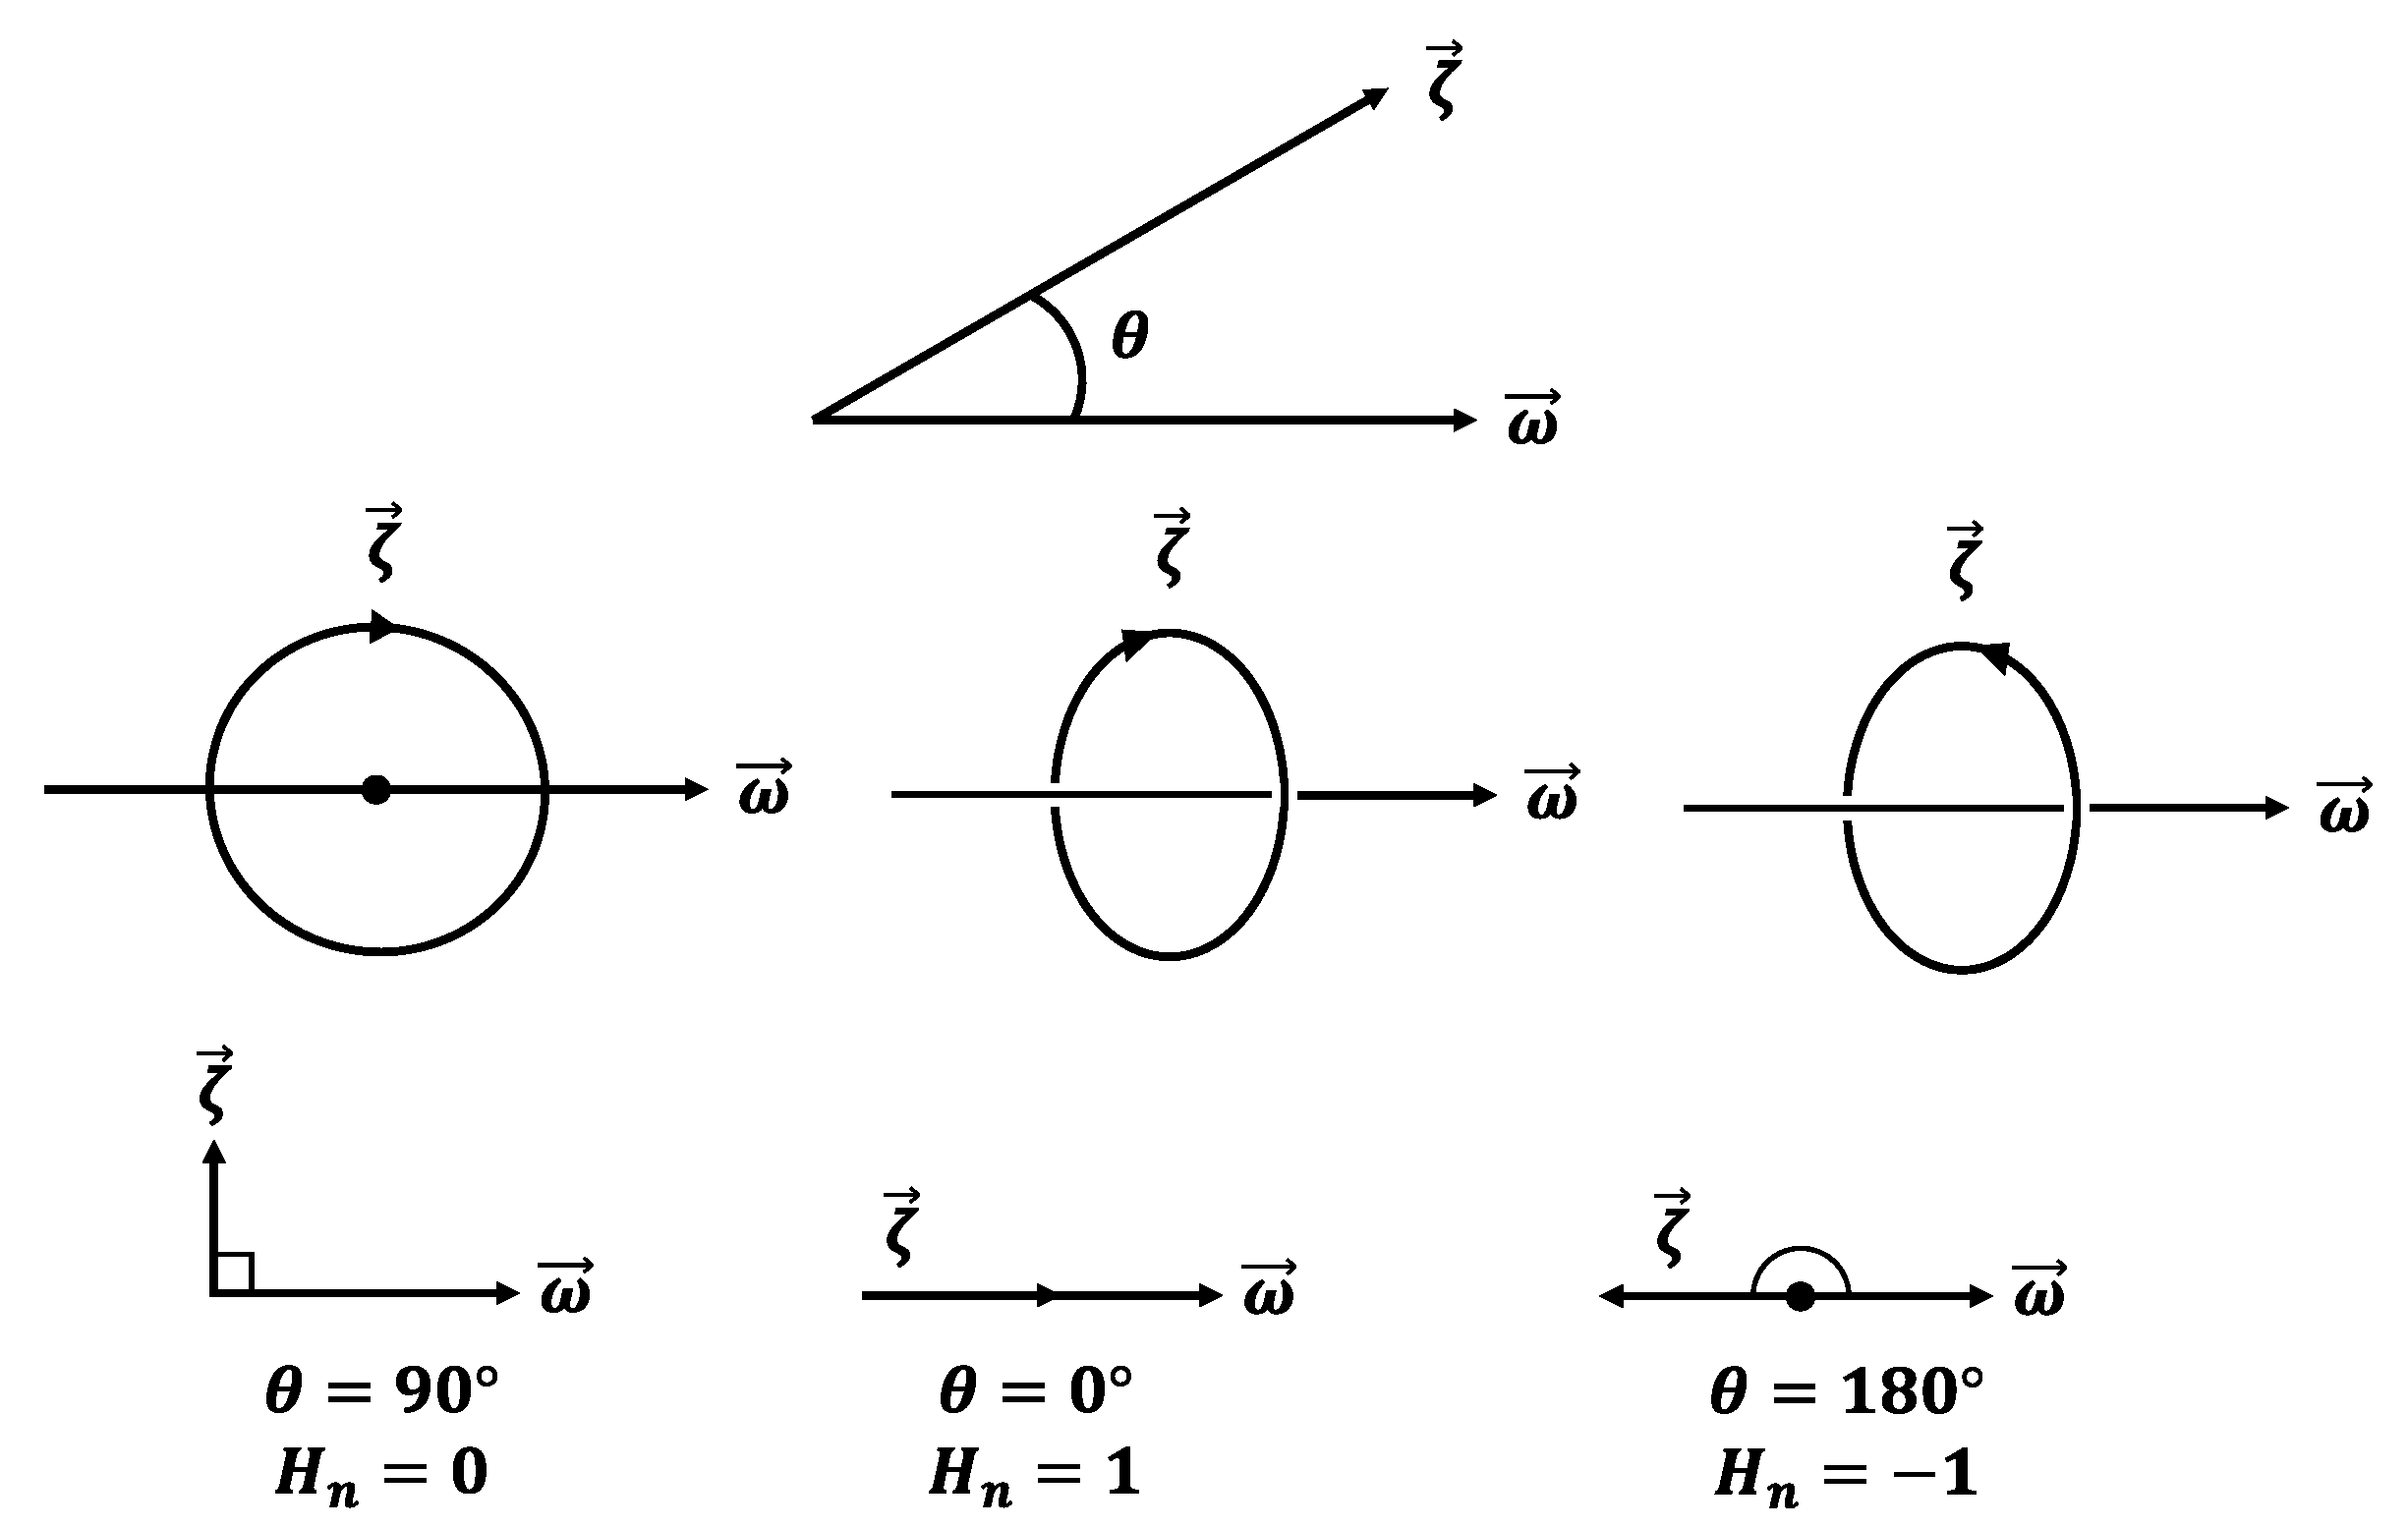
2.3. Vortex Visualization Method

Using the vortex identification method developed by Sawada in 1995 [24], the vortex structures inside the impeller were visualized using the singularity theory, the probabilistic definition of vortex structure, and the results of the computational fluid analysis. In addition, the visualized vortex core was colored with normalized helicity to visualize the rotation direction of the vortex. Normalized helicity was defined by Equation (12). Where H n is normalized helicity and ζ is an absolute vorticity vector, ω is a relative velocity vector.
H n = ζ · ω / ( | ζ | · | ω | )  
Figure 5 shows the rotation direction as normalized helicity changes. The value H n has the following physical meaning. H n > 0, means that the vortex rotates and moves axially according to the law of the right hand, H n = 0, means the vortex is in a stagnation and rotation state, and H n < 0, means the vortex rotates according to the law of the right hand and moves in the opposite direction of the axial direction.

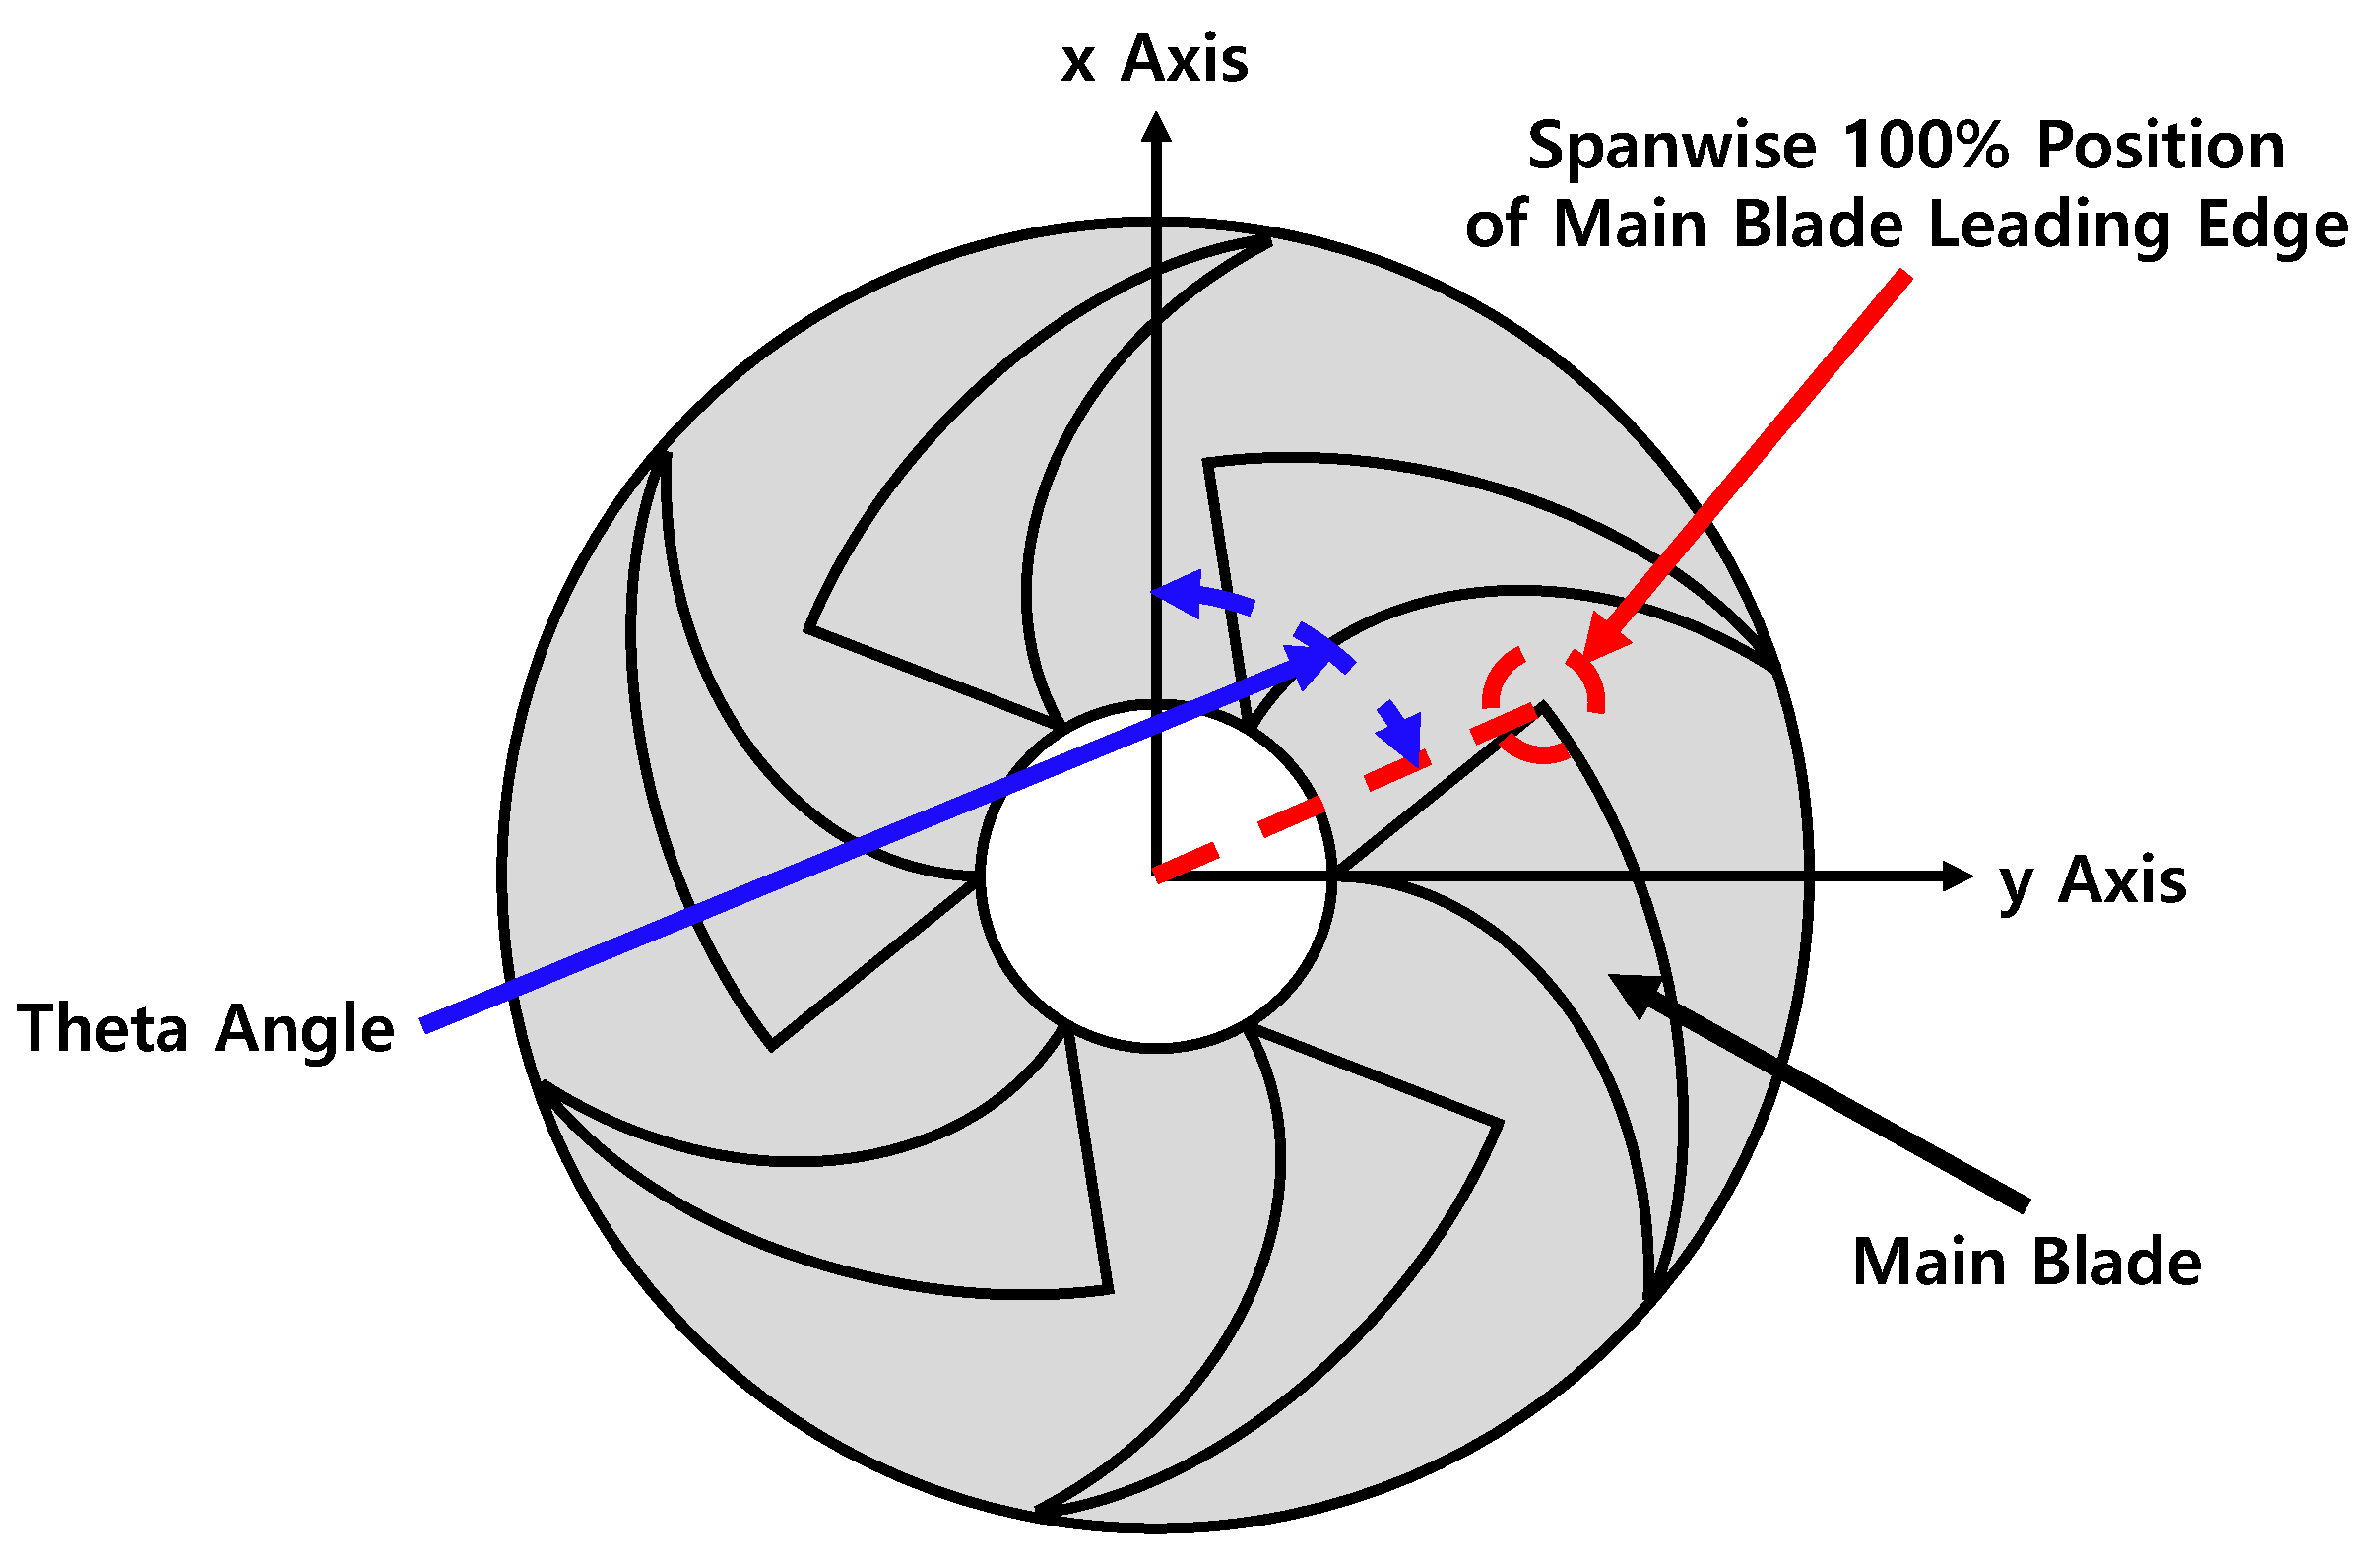
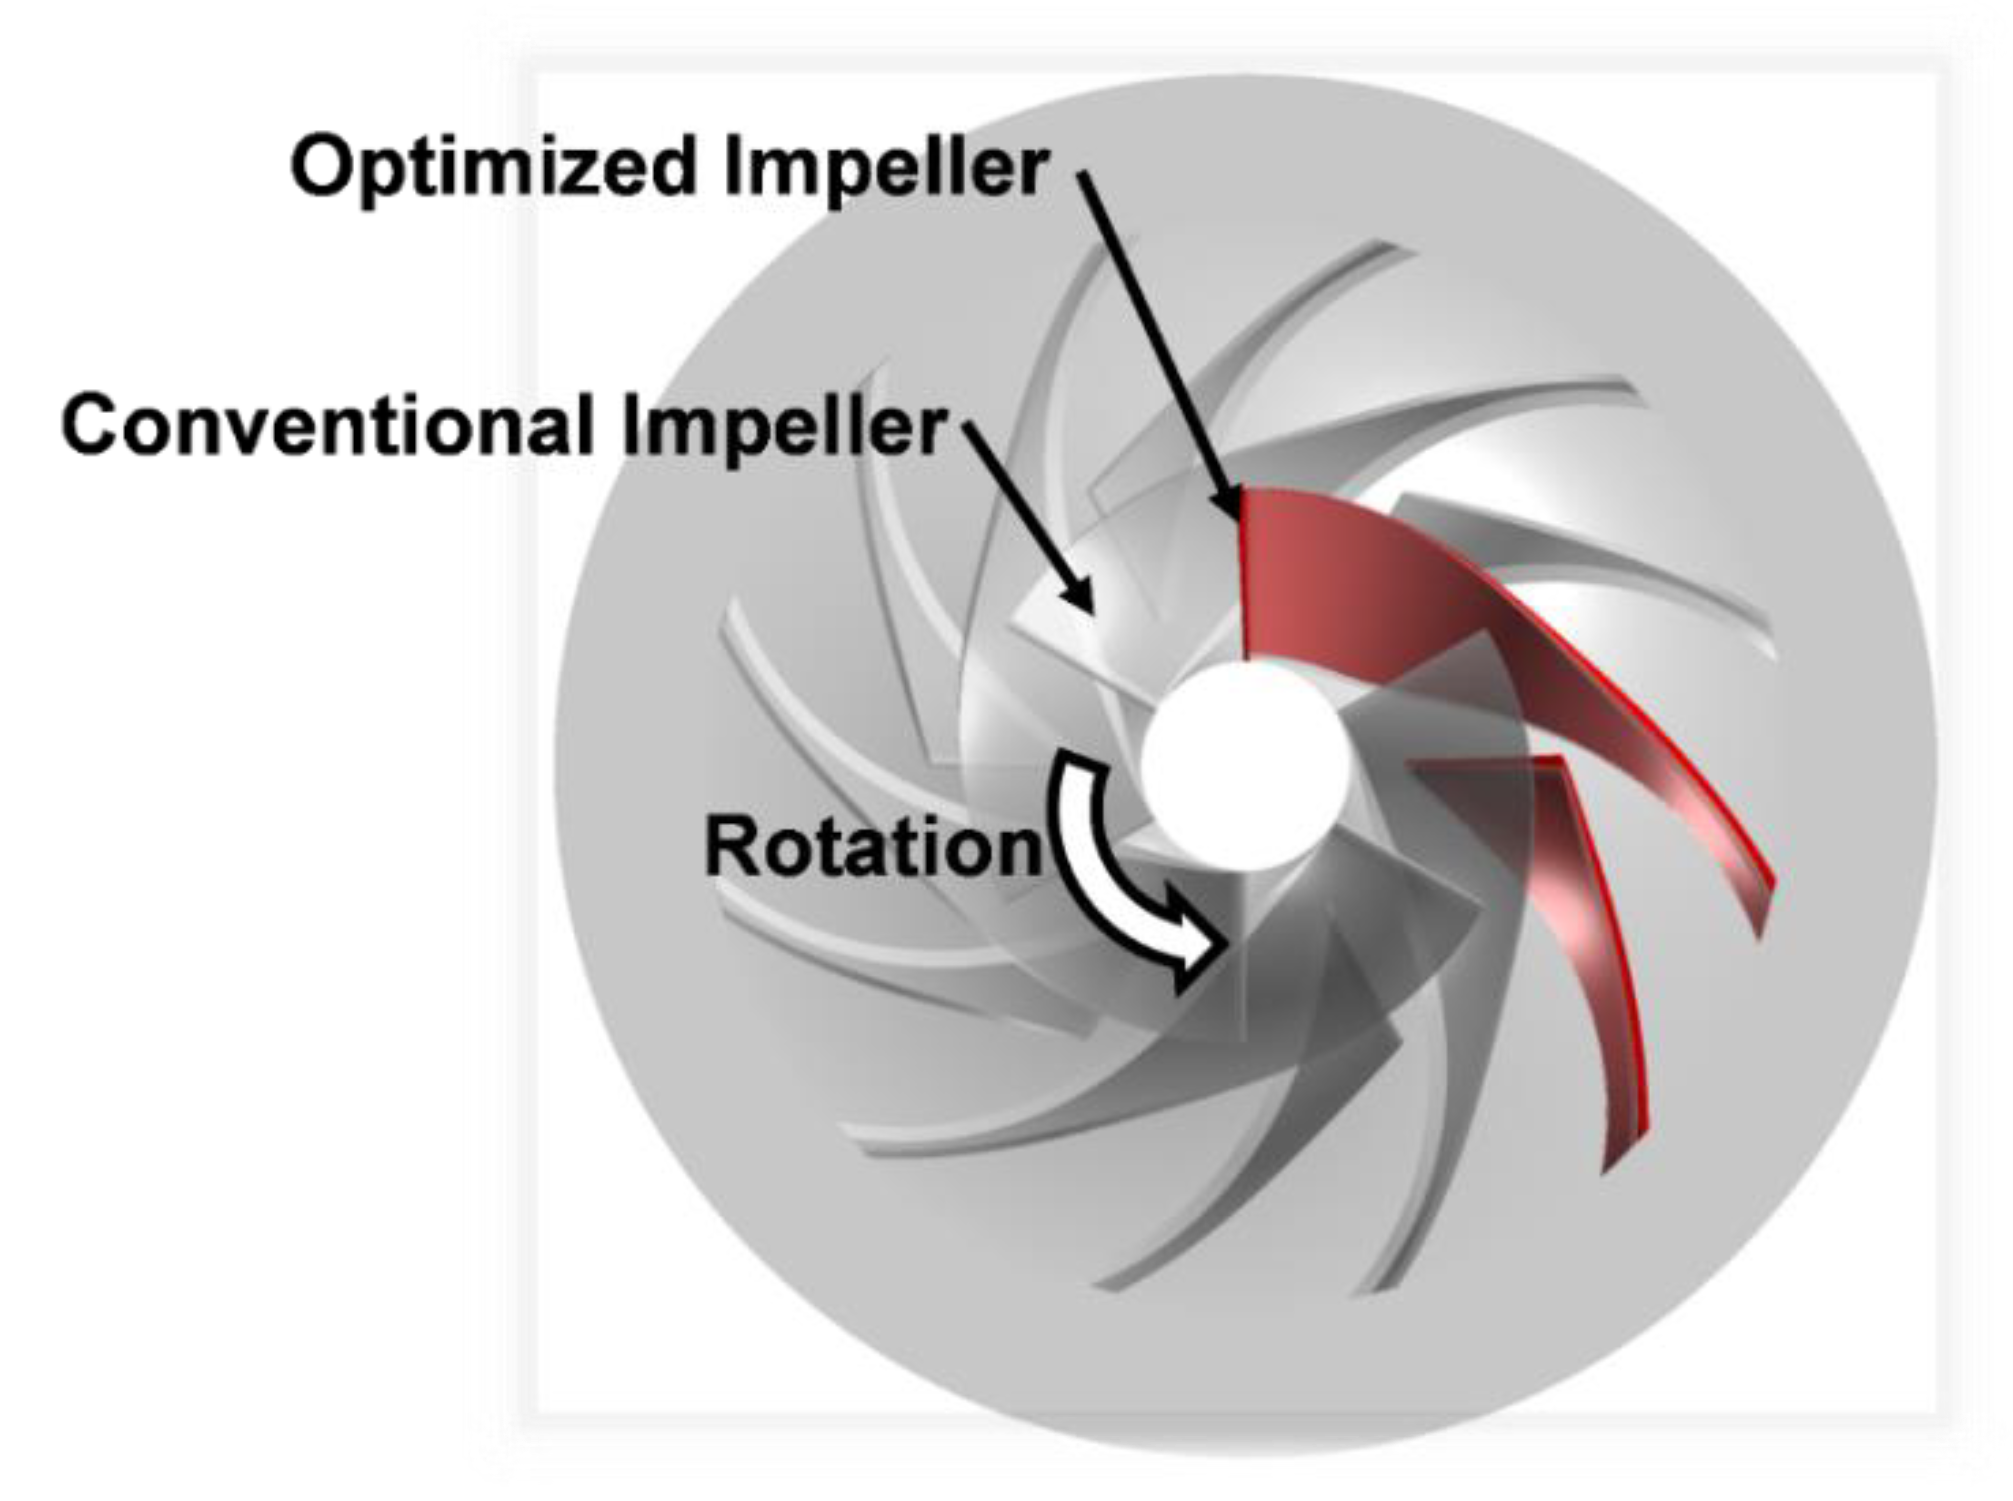
2.4. Design Optimization Parameter

ANSYS Bladegen was used to design the centrifugal compressor impeller. This software has two parameters for designing the centrifugal compressor; the theta angle and the beta angle. Theta is the angle between the x-axis of the reference coordination and the line connecting the origin of the reference coordination and the blade leading edge. Figure 6 shows the definition of theta angle at the position of spanwise 100% of the main blade’s leading edge. In this study, theta angle of blade distribution was defined using the spline curve with 5 points at chordwise 0%, 25%, 50%, 75%, and 100%. The impeller was enhanced by changing the theta angle through the 5 points. Because of the manufacturing method, the theta angle from spanwise 0 to 100% must be linear. Table 2 shows the theta angle distribution of the conventional centrifugal compressor impeller and four compressor impeller design cases. The four design cases were simulated and compared at the compressor design flow rate (hereinafter referred to as design flow rate) and at a low flow rate (about 60% of the design flow rate). After simulation, the best performance case was simulated at the whole flow rate range and compared with a conventional centrifugal compressor.

3. Results of Vortical Flow Structure Analysis

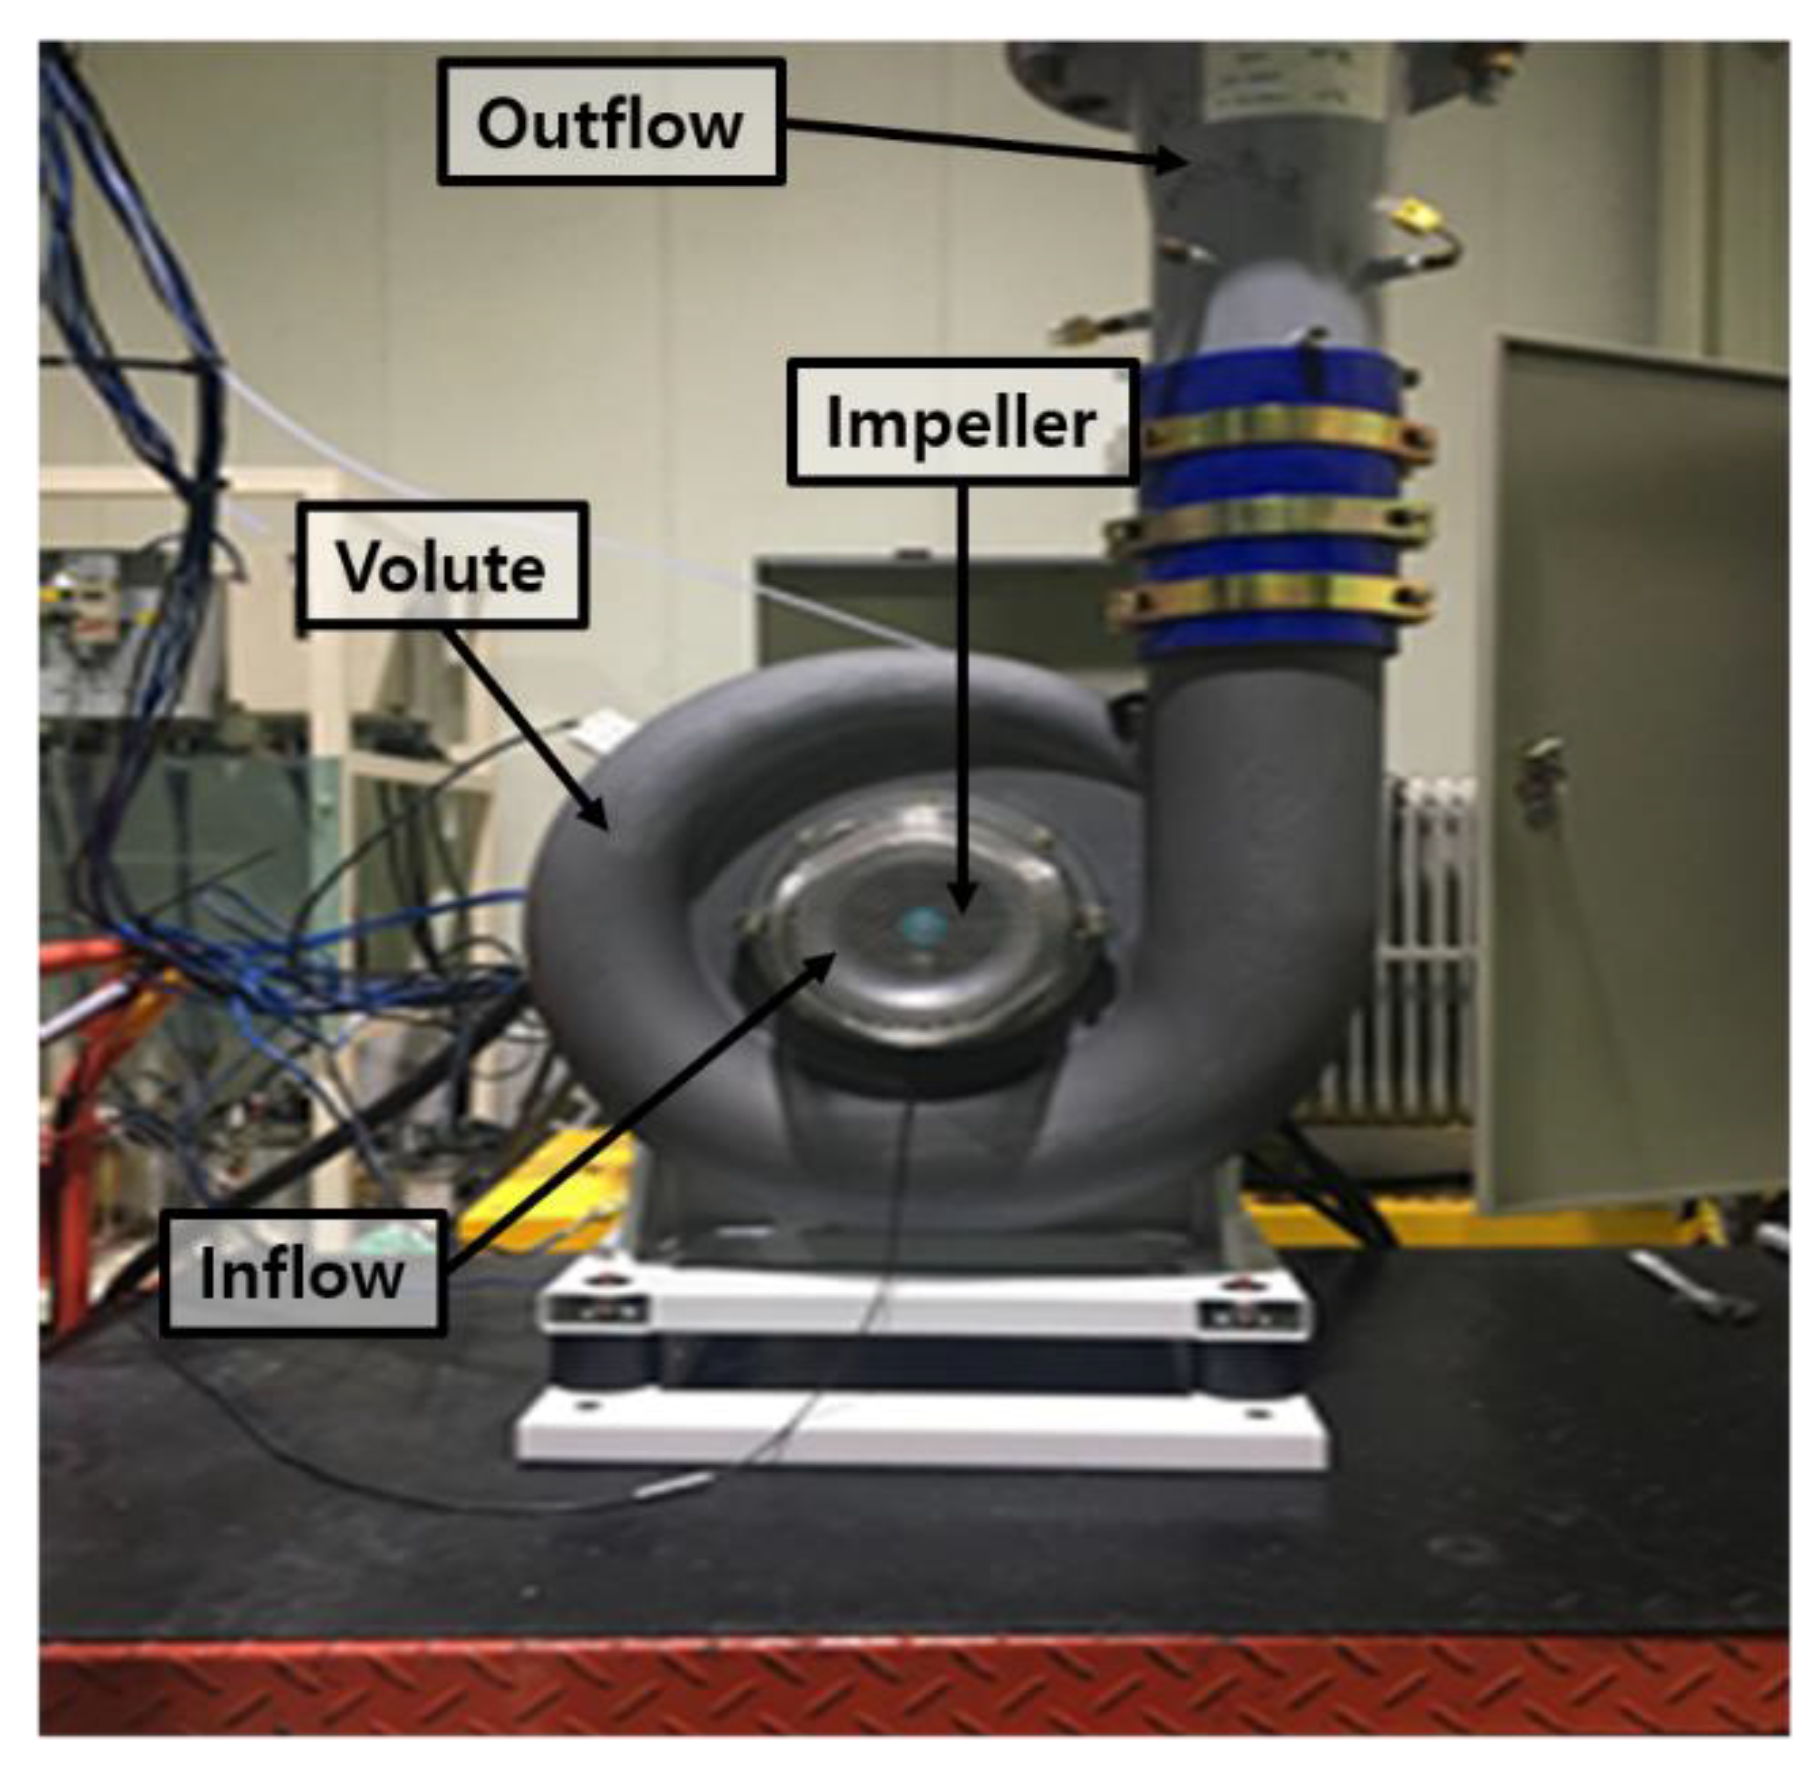
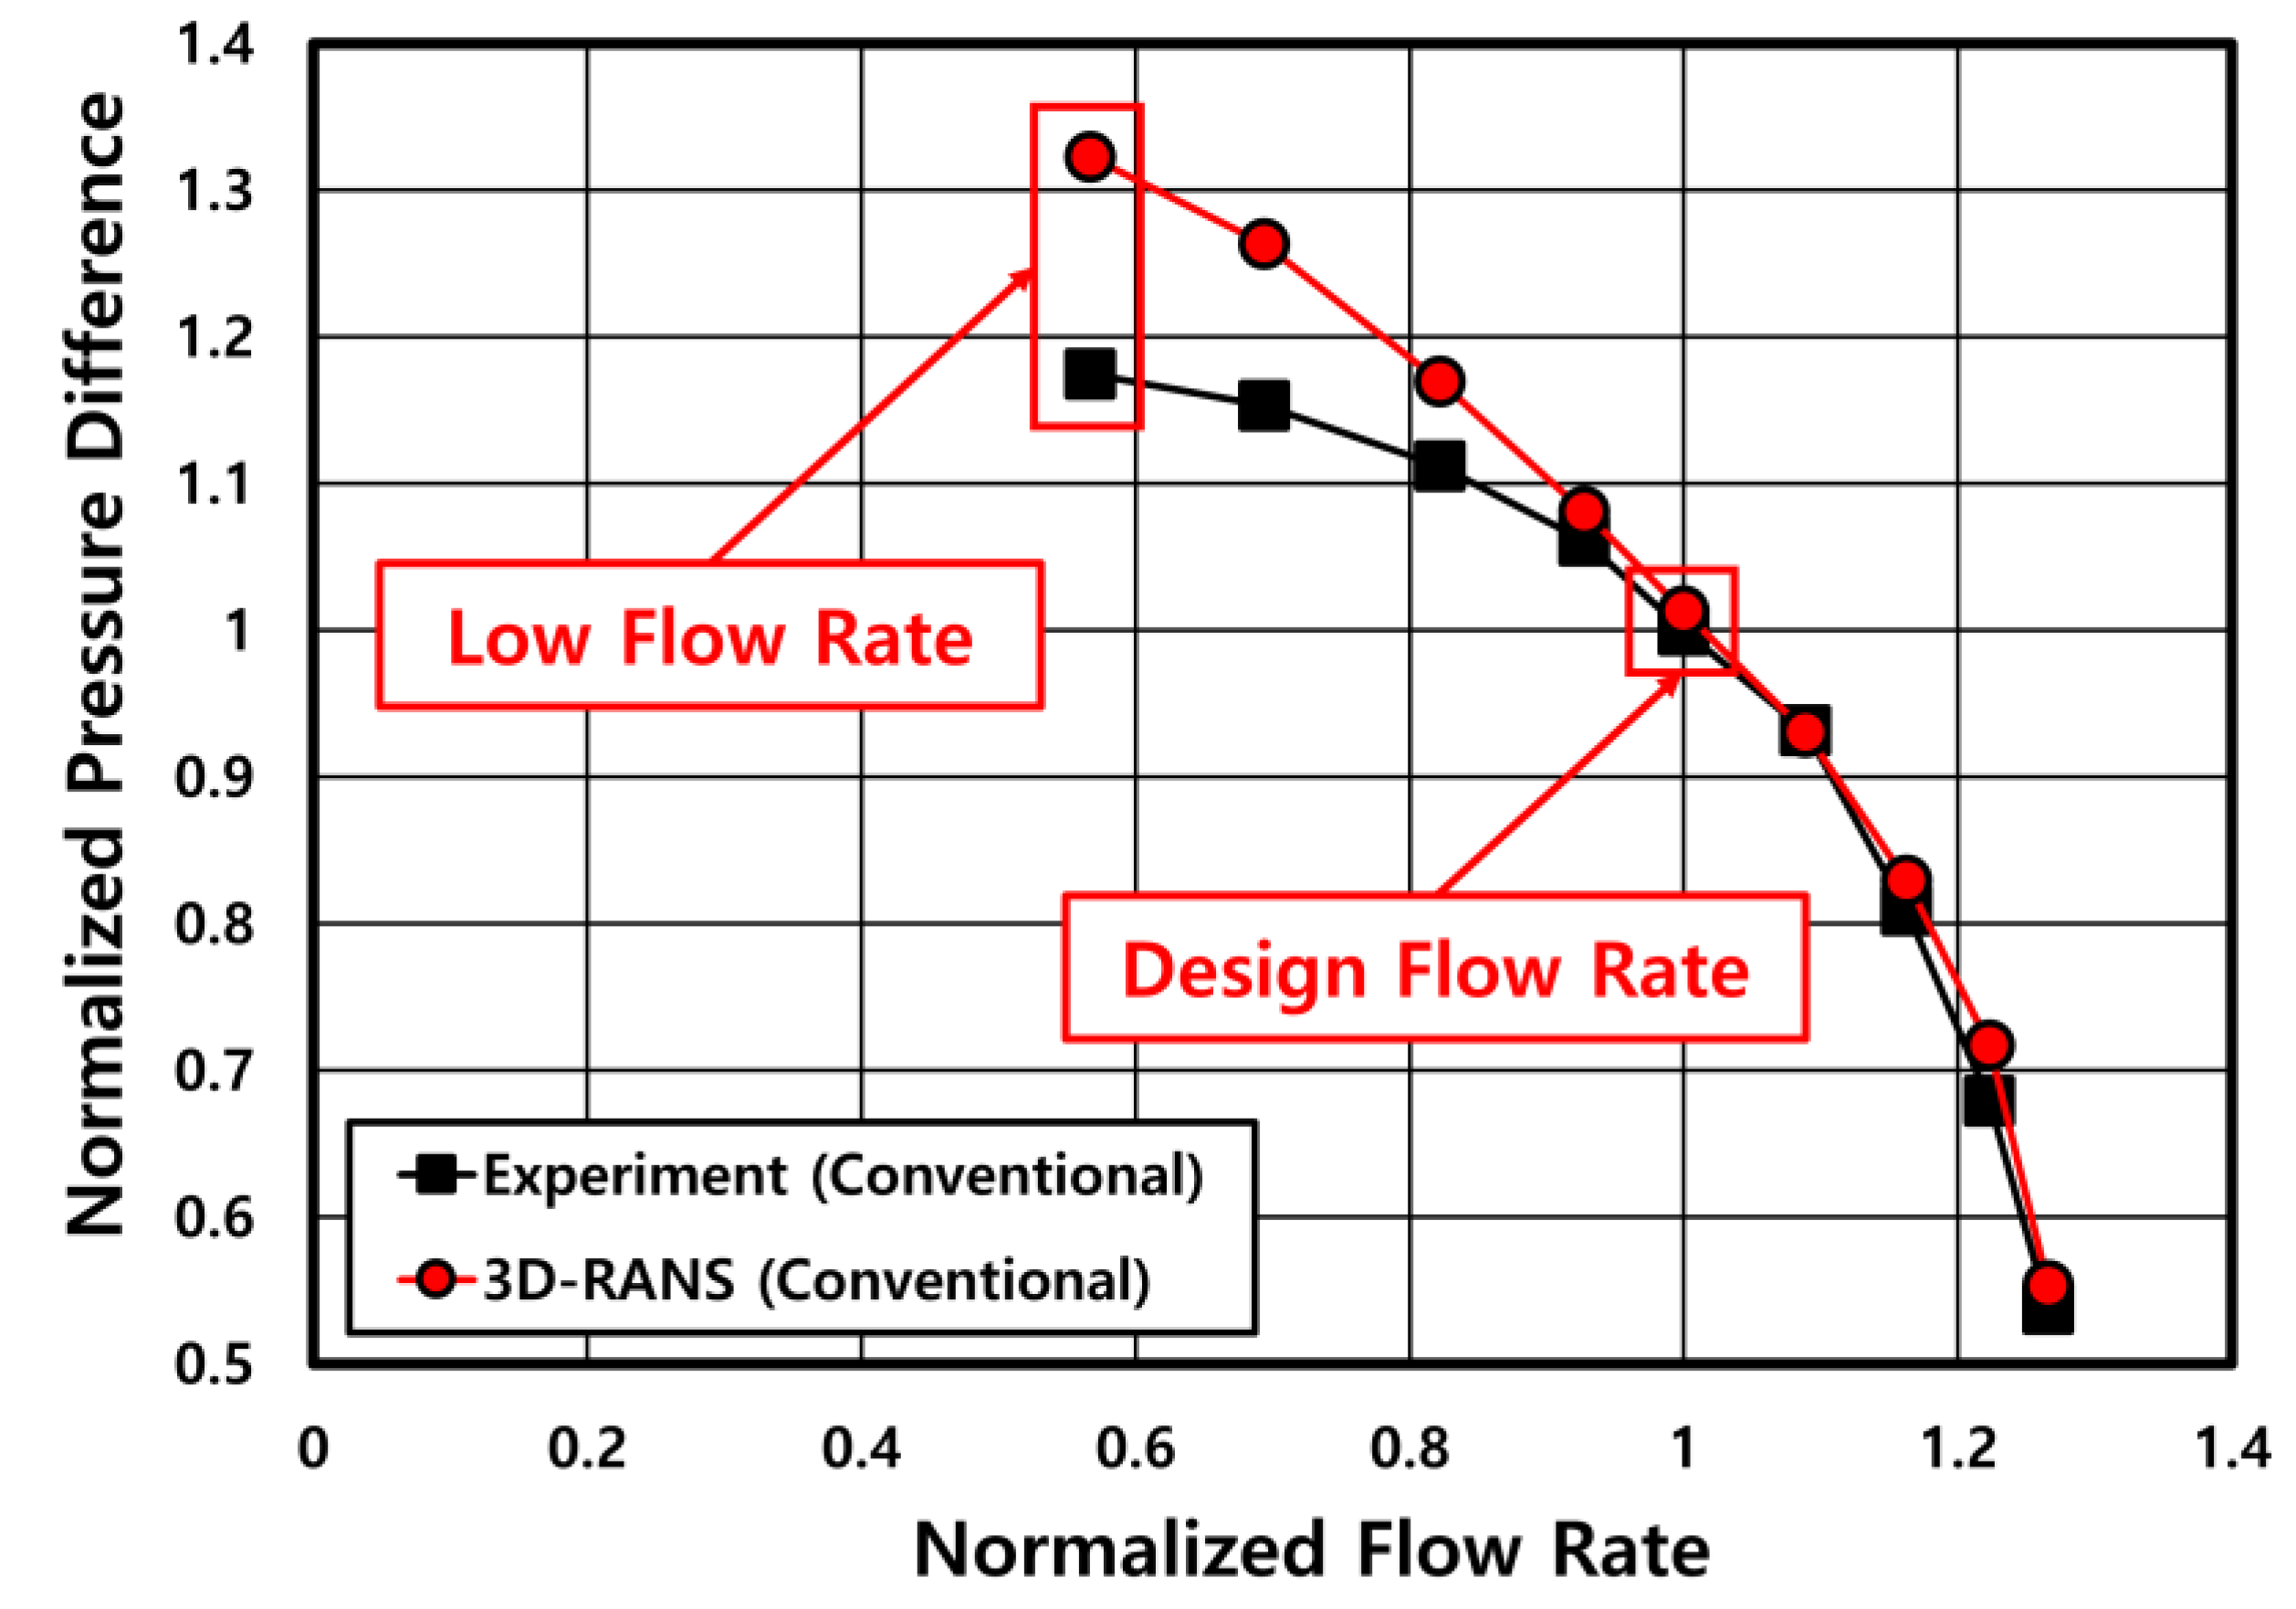
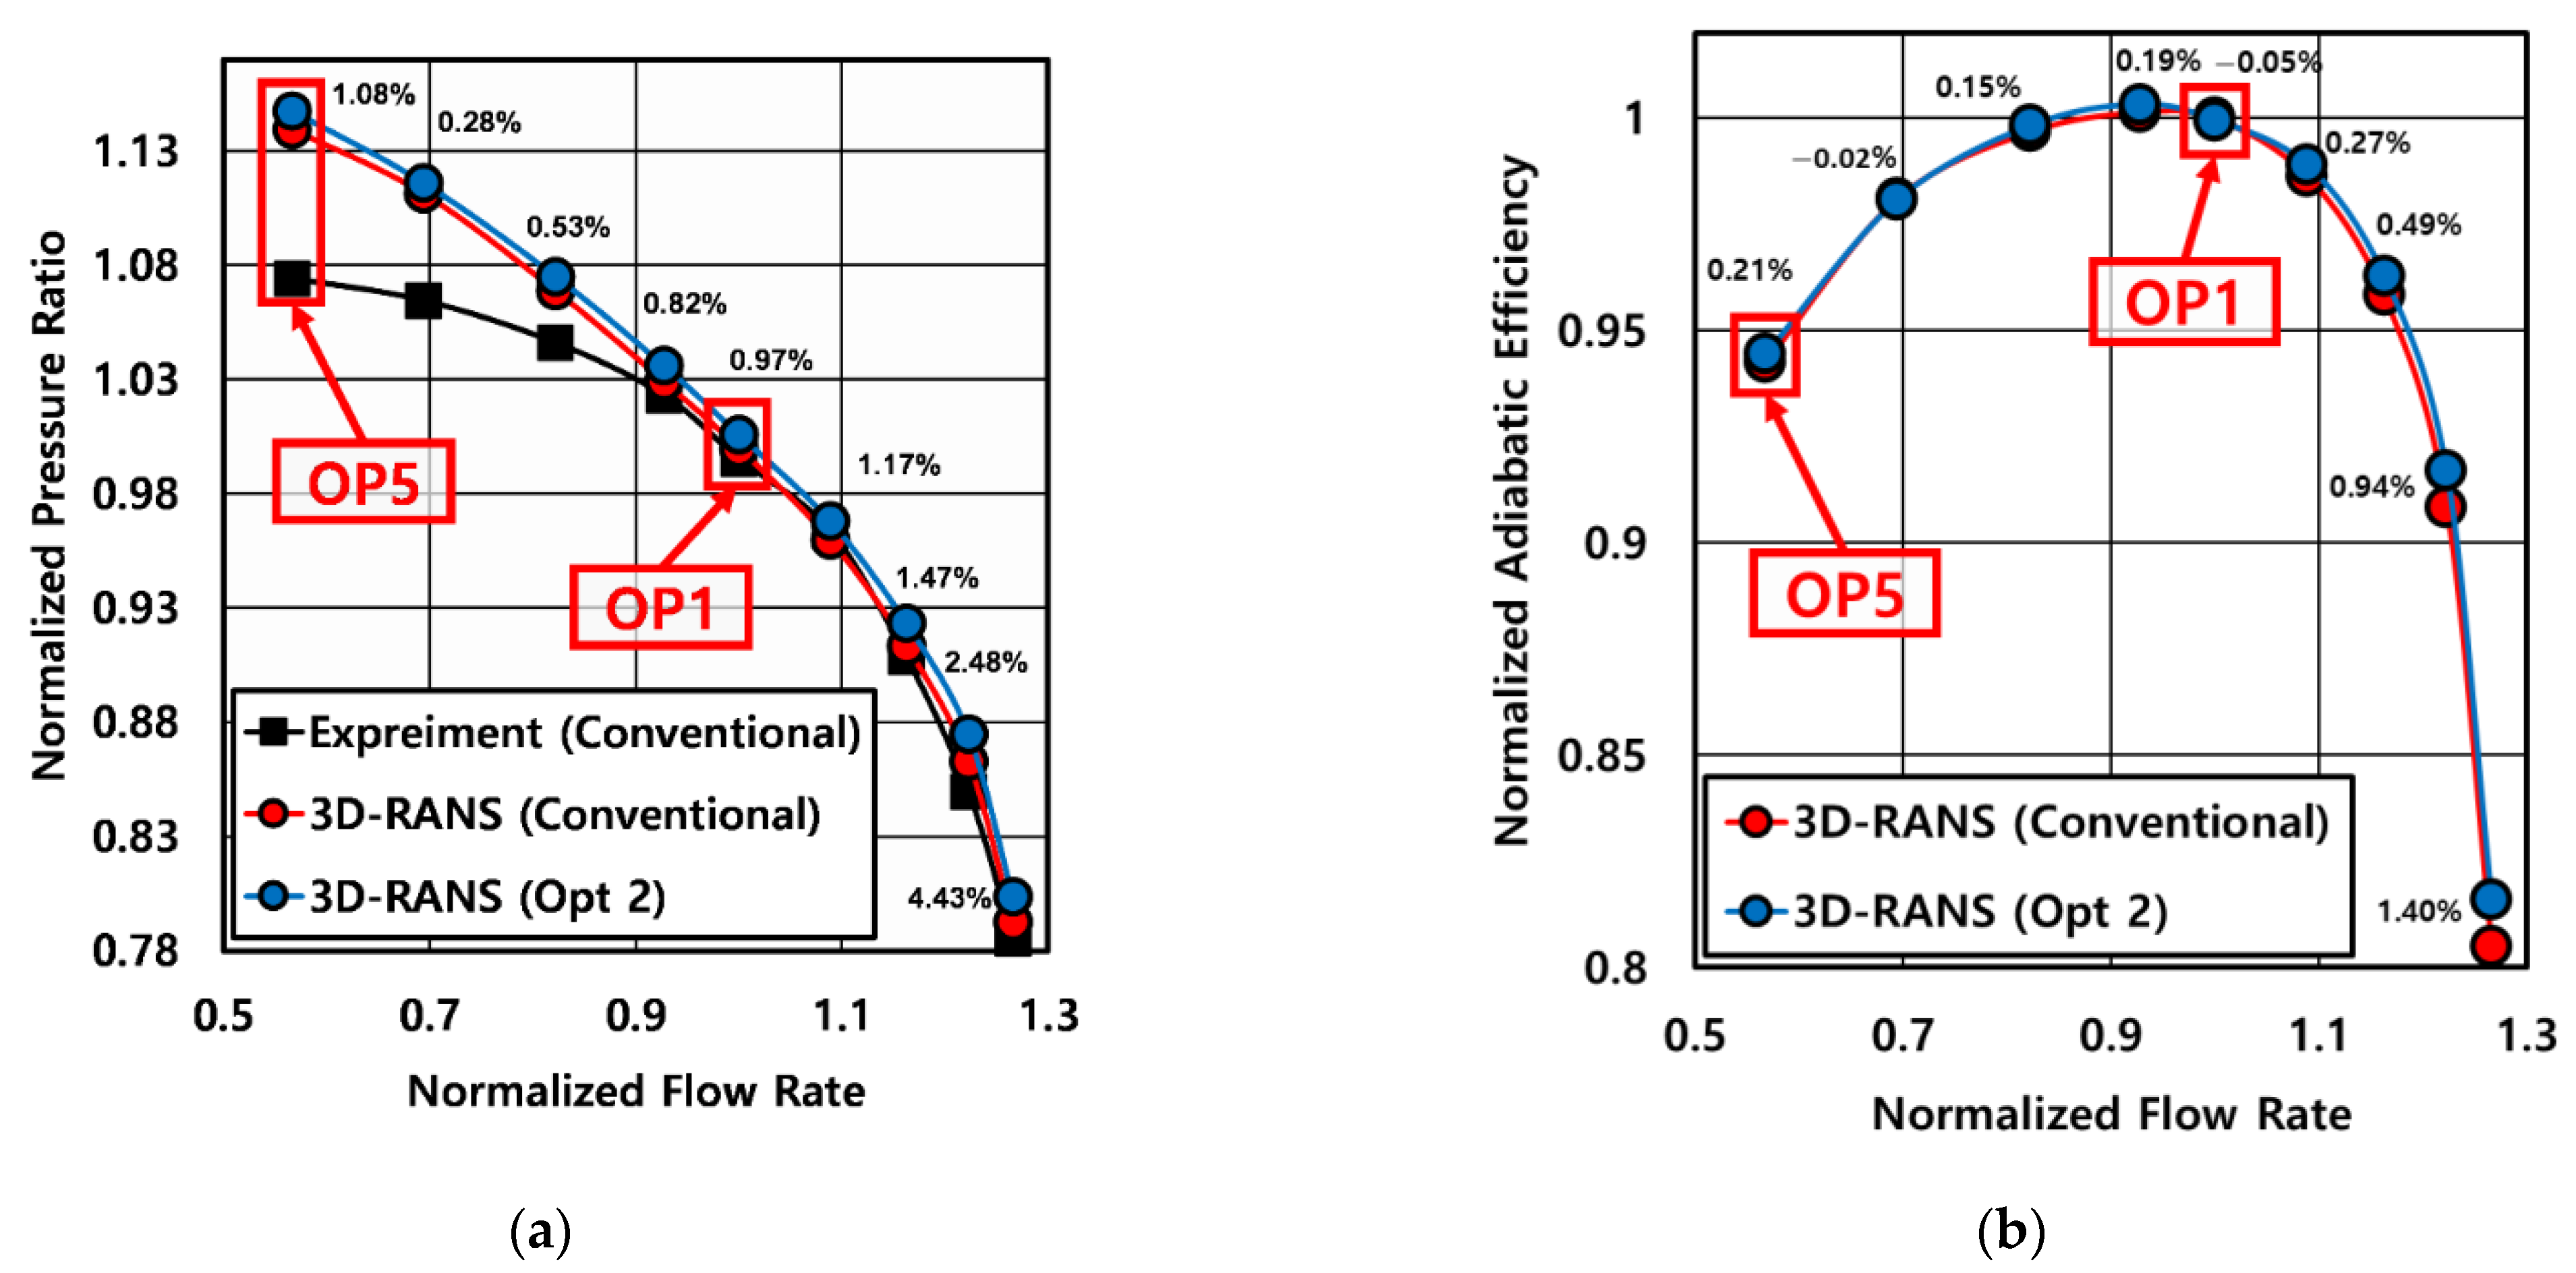
3.1. Comparison of 3D-RANS Analysis Results and Experimental Results

3D-RANS (Reynolds-Average Navier–Stokes) simulation was conducted using experimental boundary conditions and the results were validated using the experimental results. Figure 7 shows the characteristic curve of a conventional centrifugal compressor using 3D-RNAS results and experimental results. The pressure difference and the flow rate were normalized using the experimental values at the design flow rate. From the graph, OP1 designates the design flow rate results and OP5 the low flow rate results. The 3D-RANS results were higher than the experimental results at a low flow rate because the complex flow characteristics (e.g., vortex breakdown, large-scale reverse flow areas) that occurred in the experiment were predicted using time averaging in the 3D-RANS analysis. Therefore, 3D-RANS steady calculation could not predict the loss generation exactly [25].

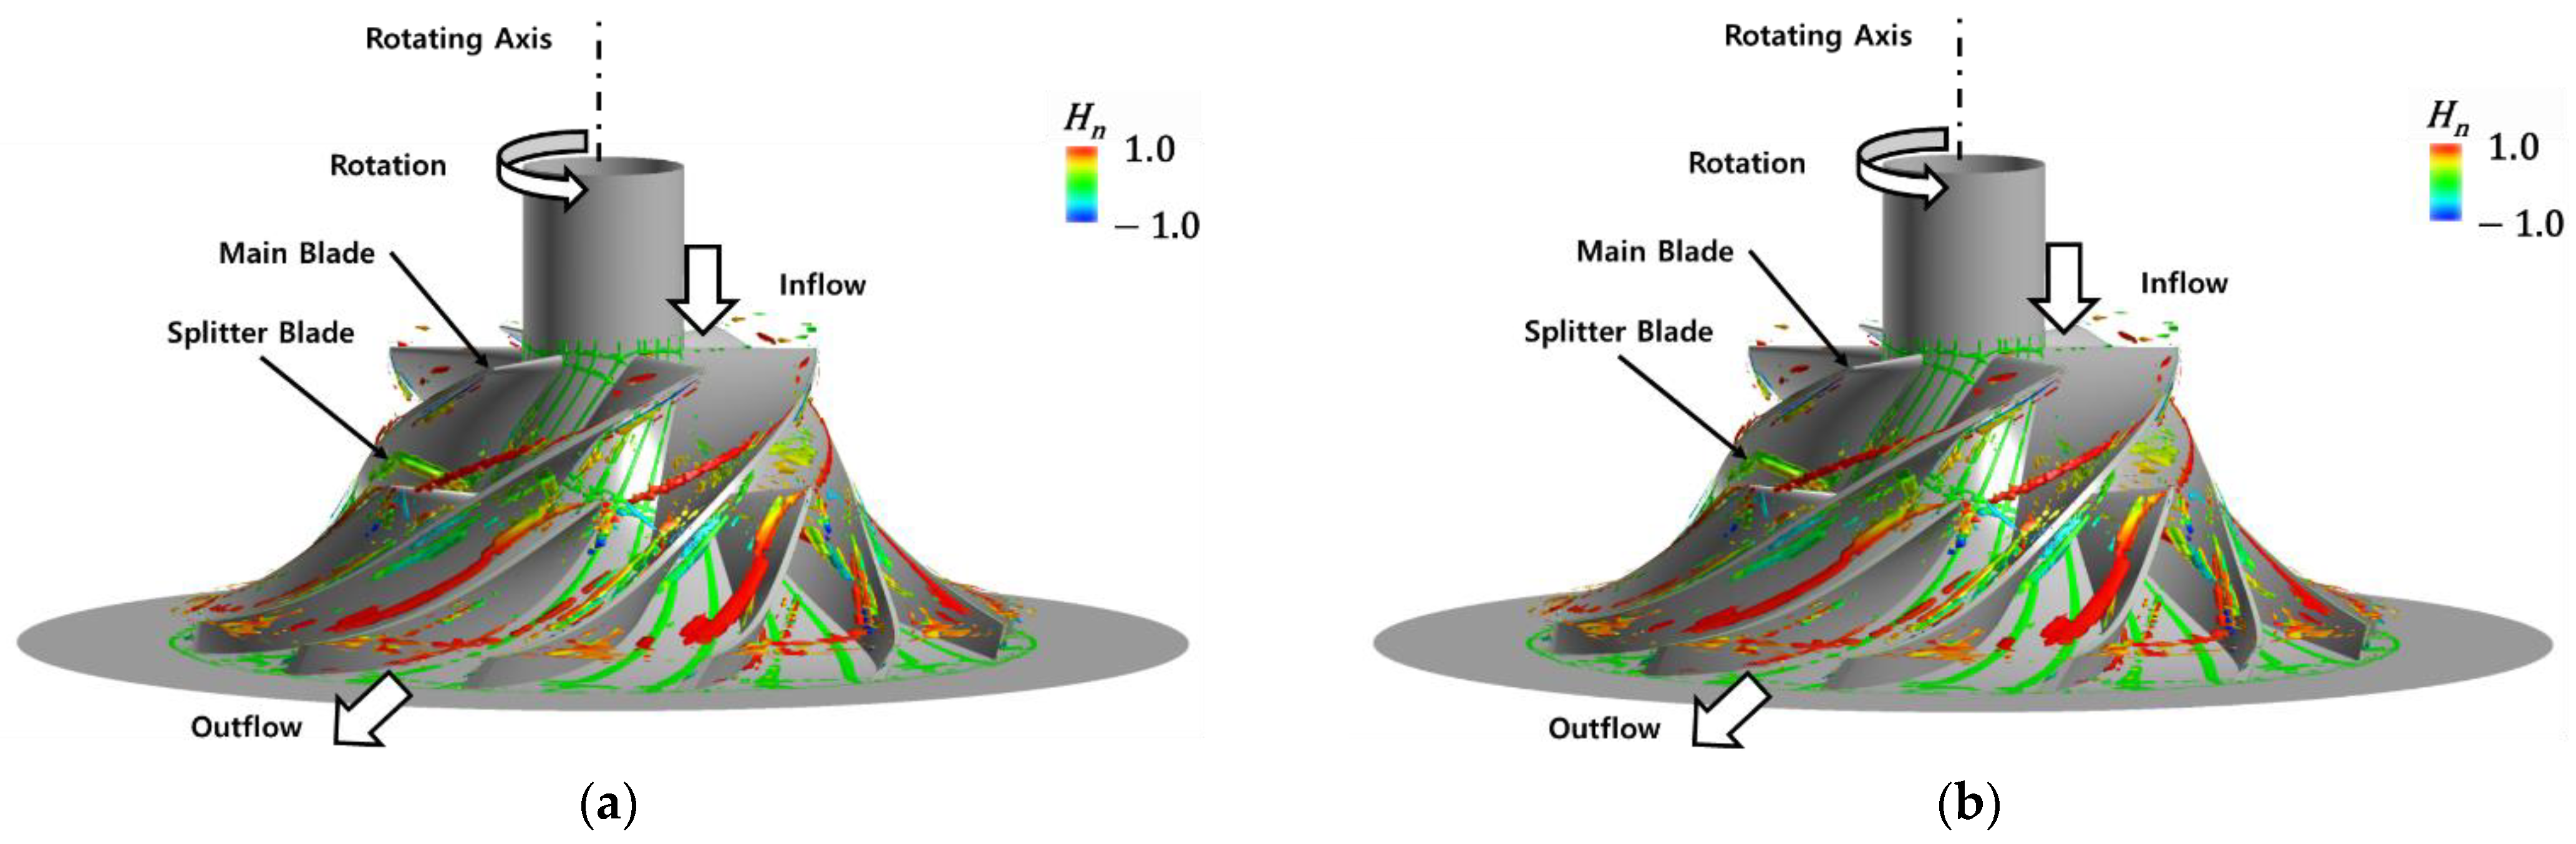
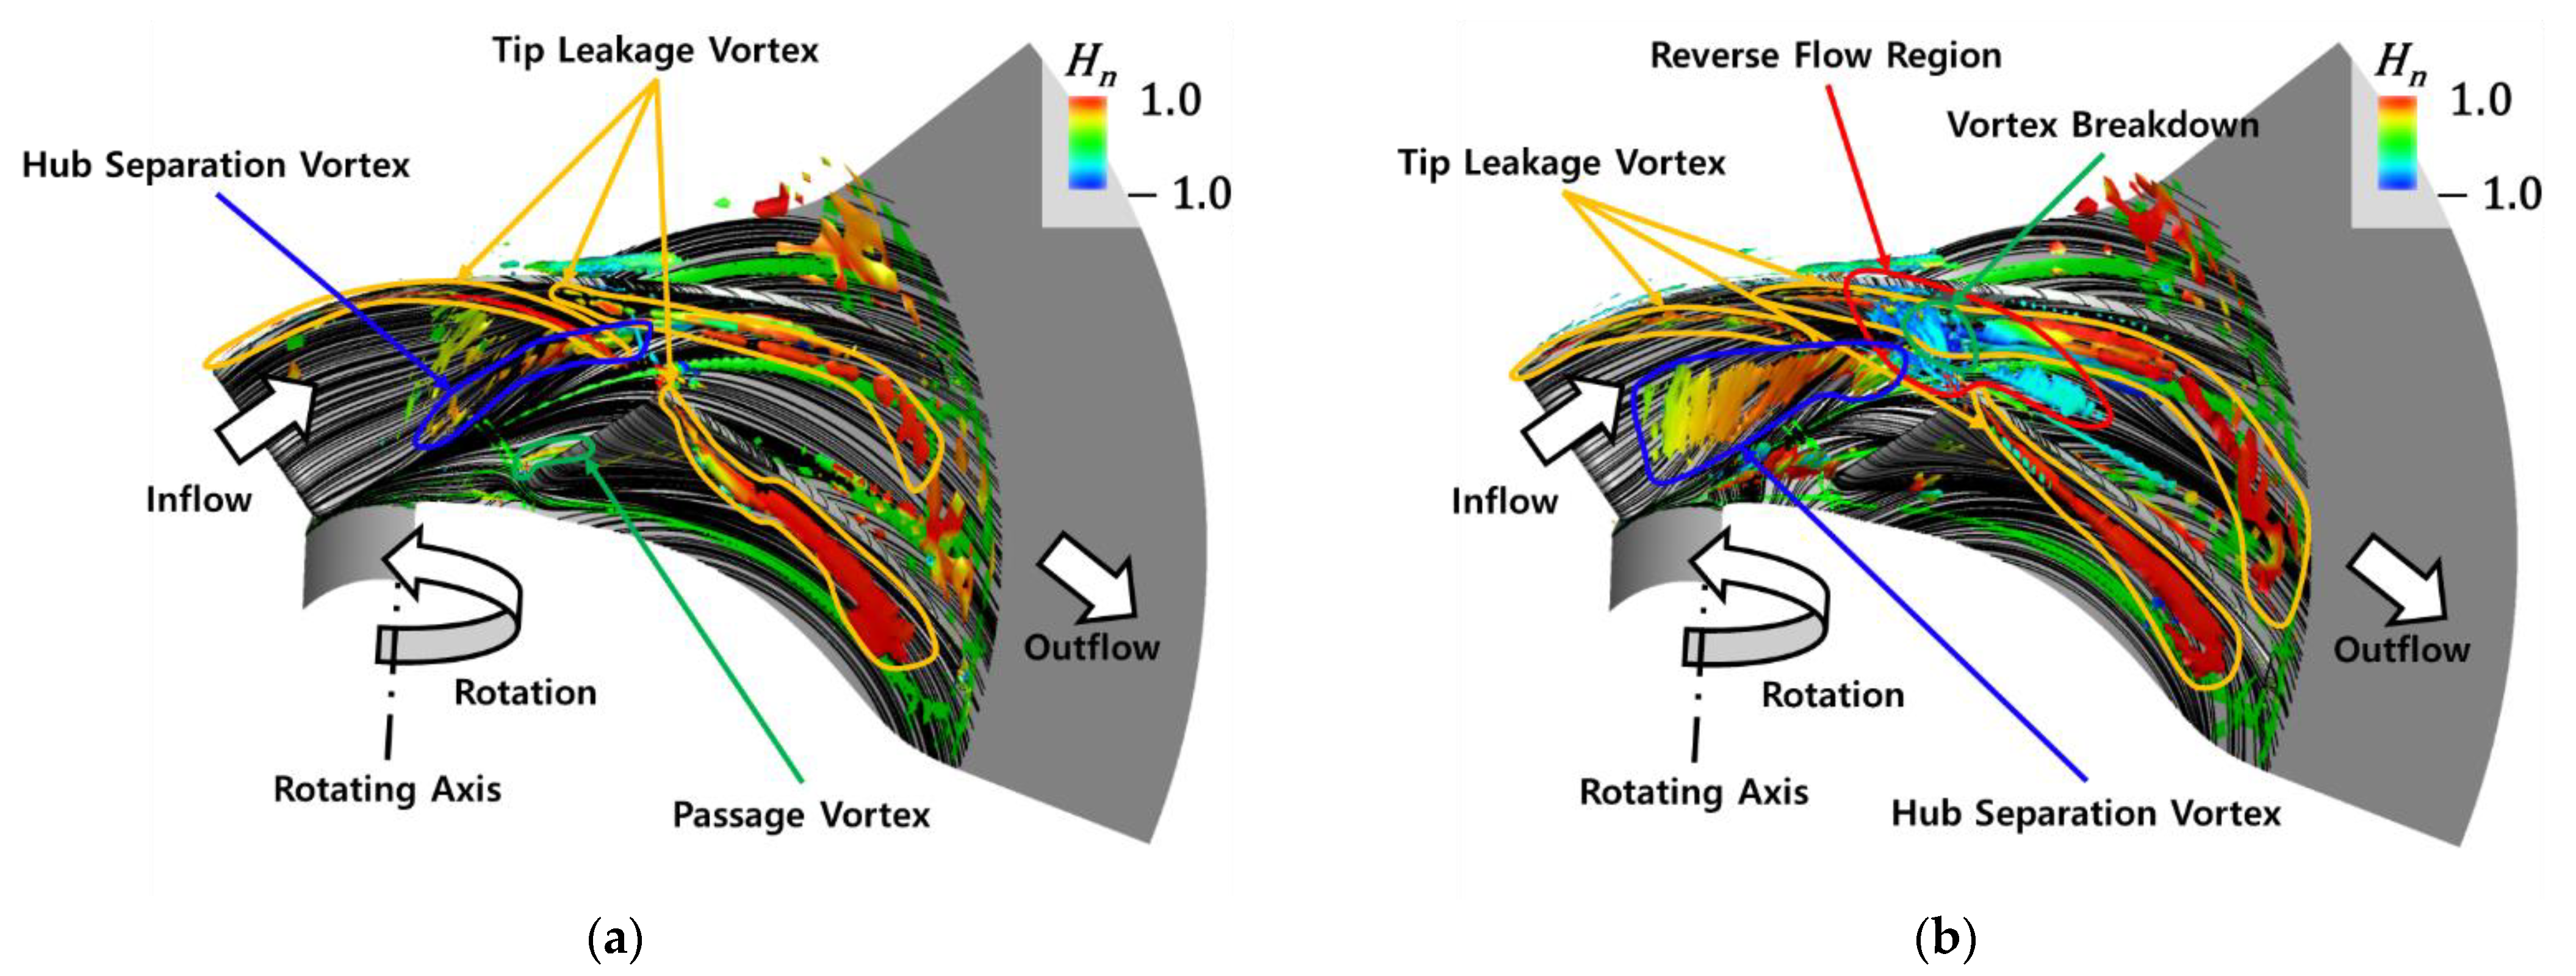
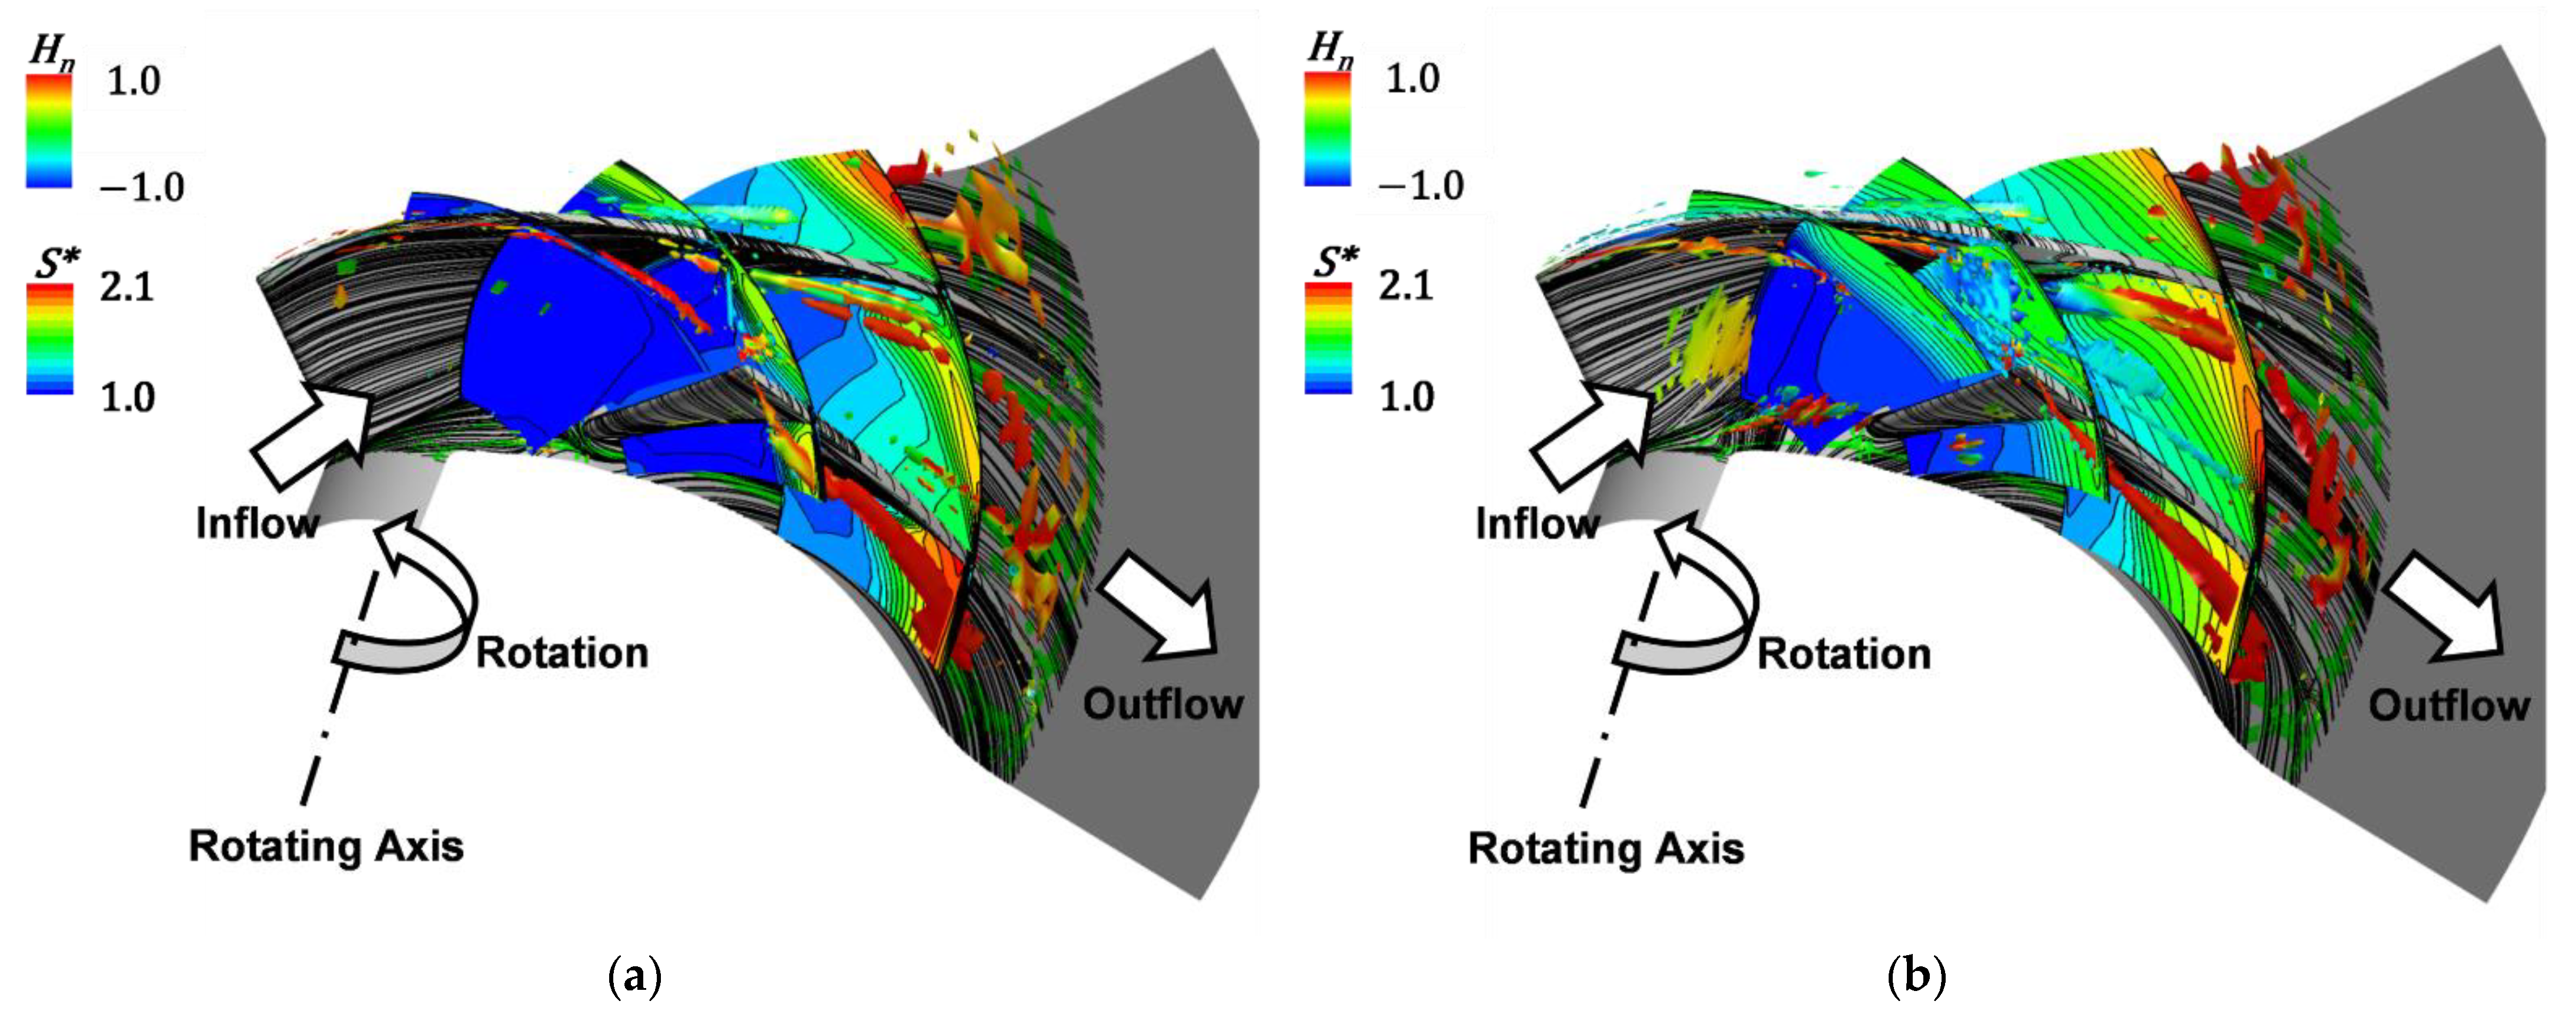
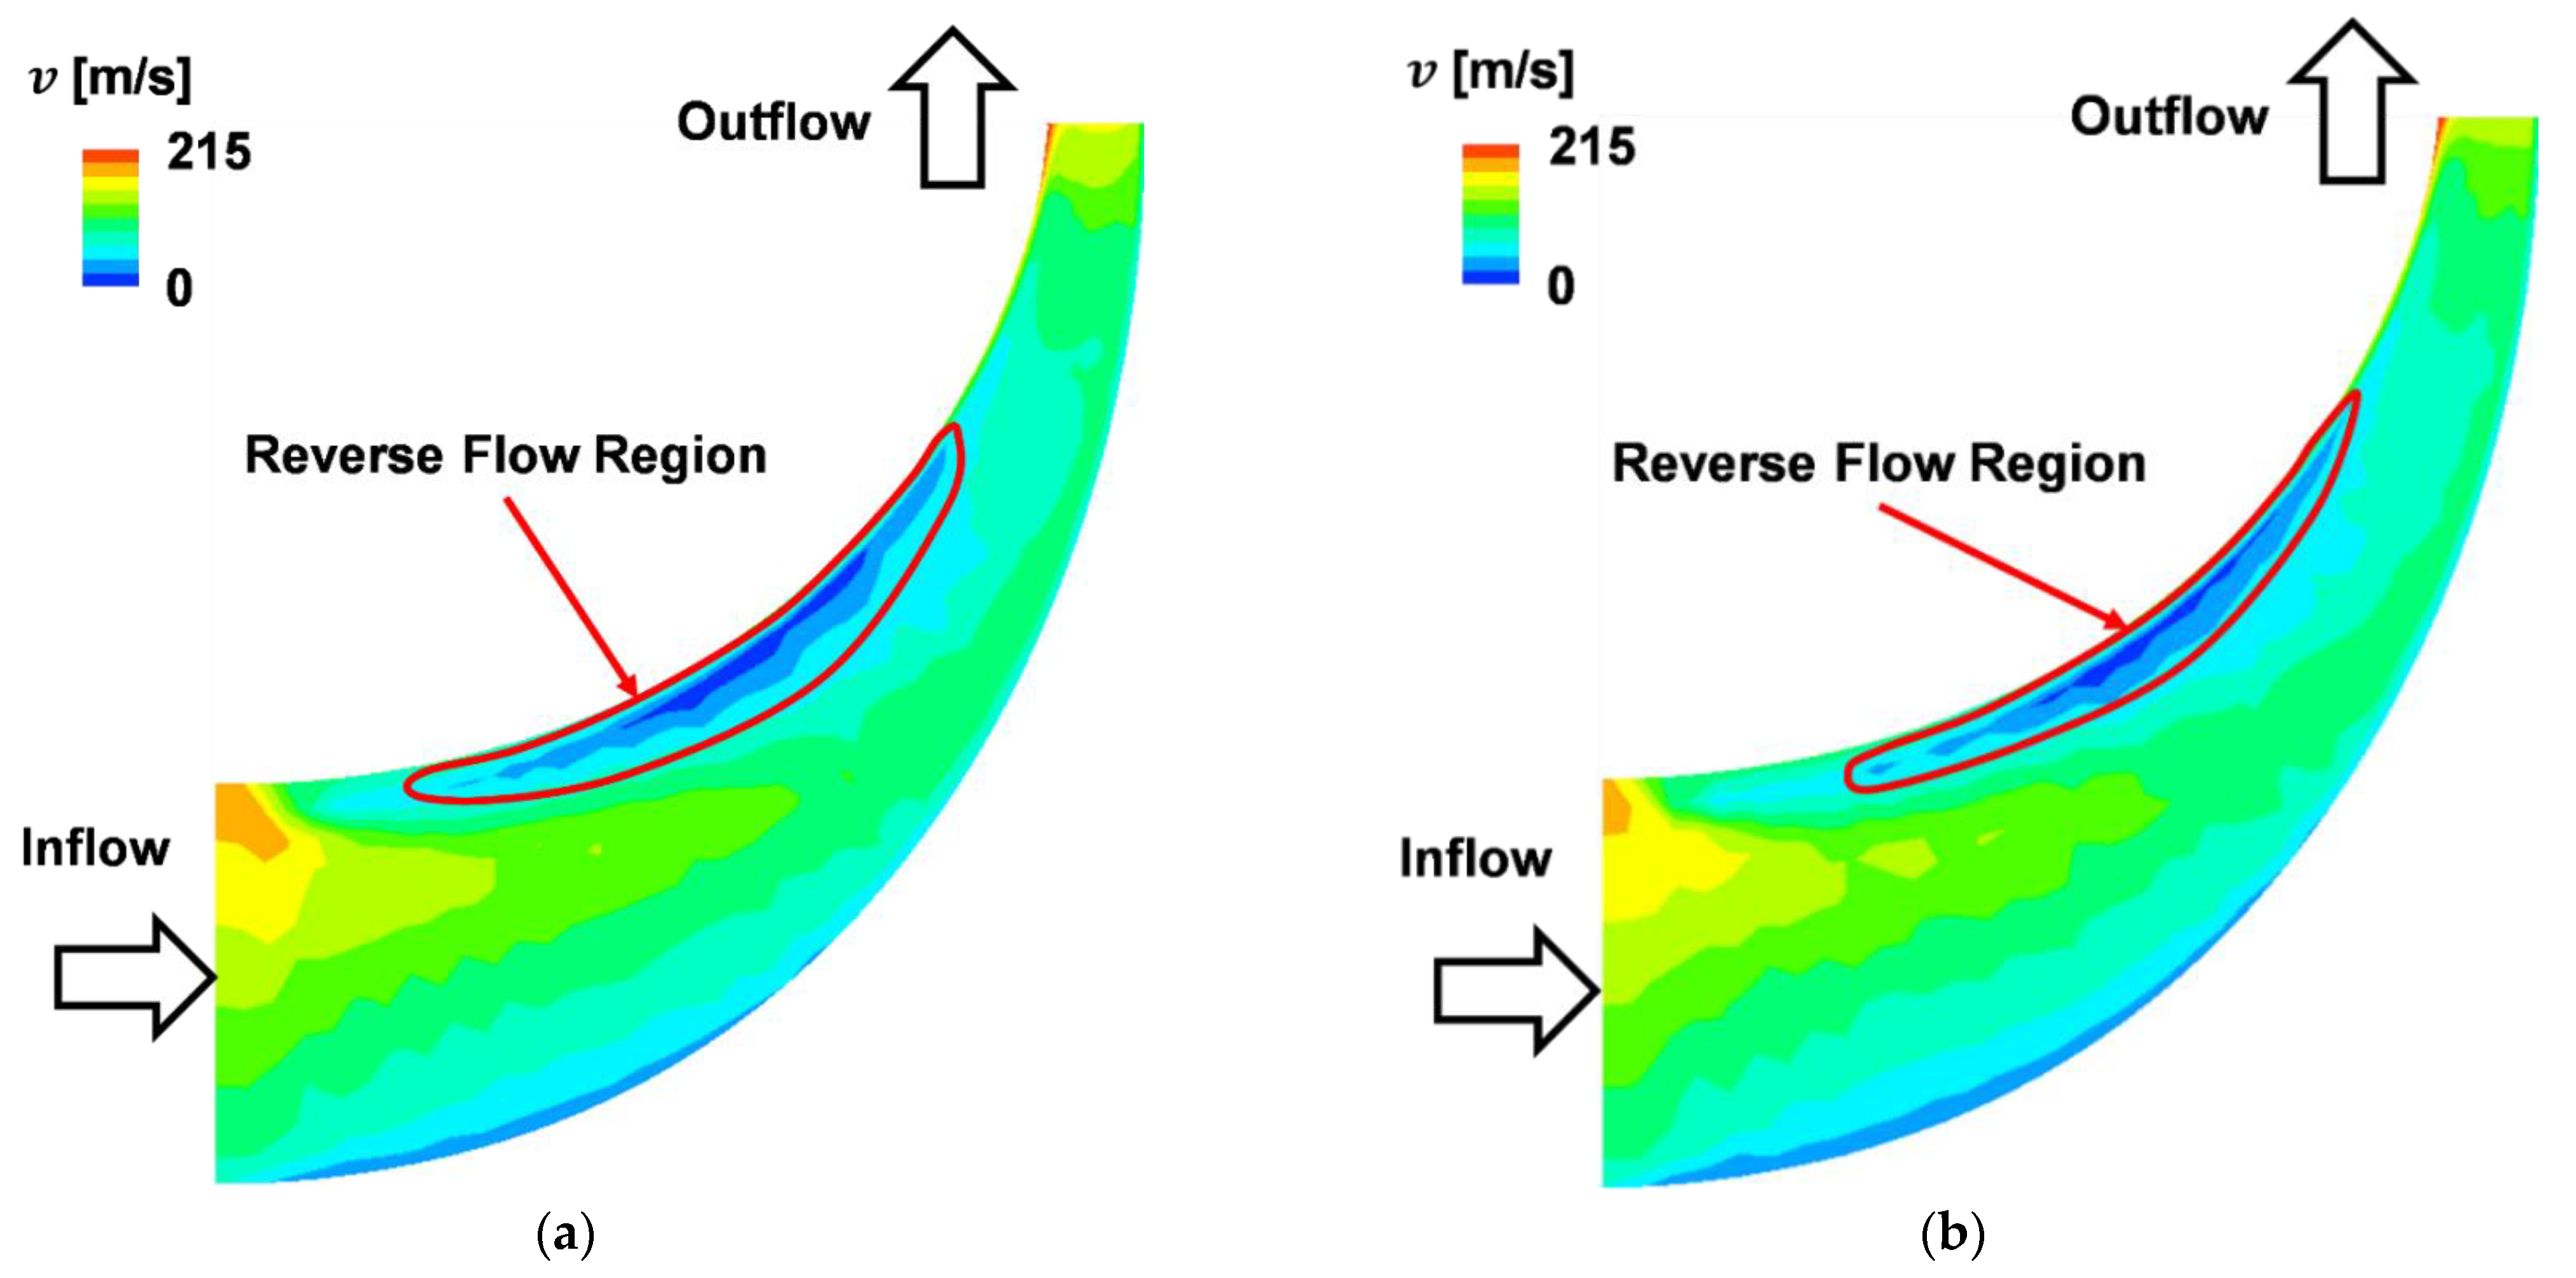
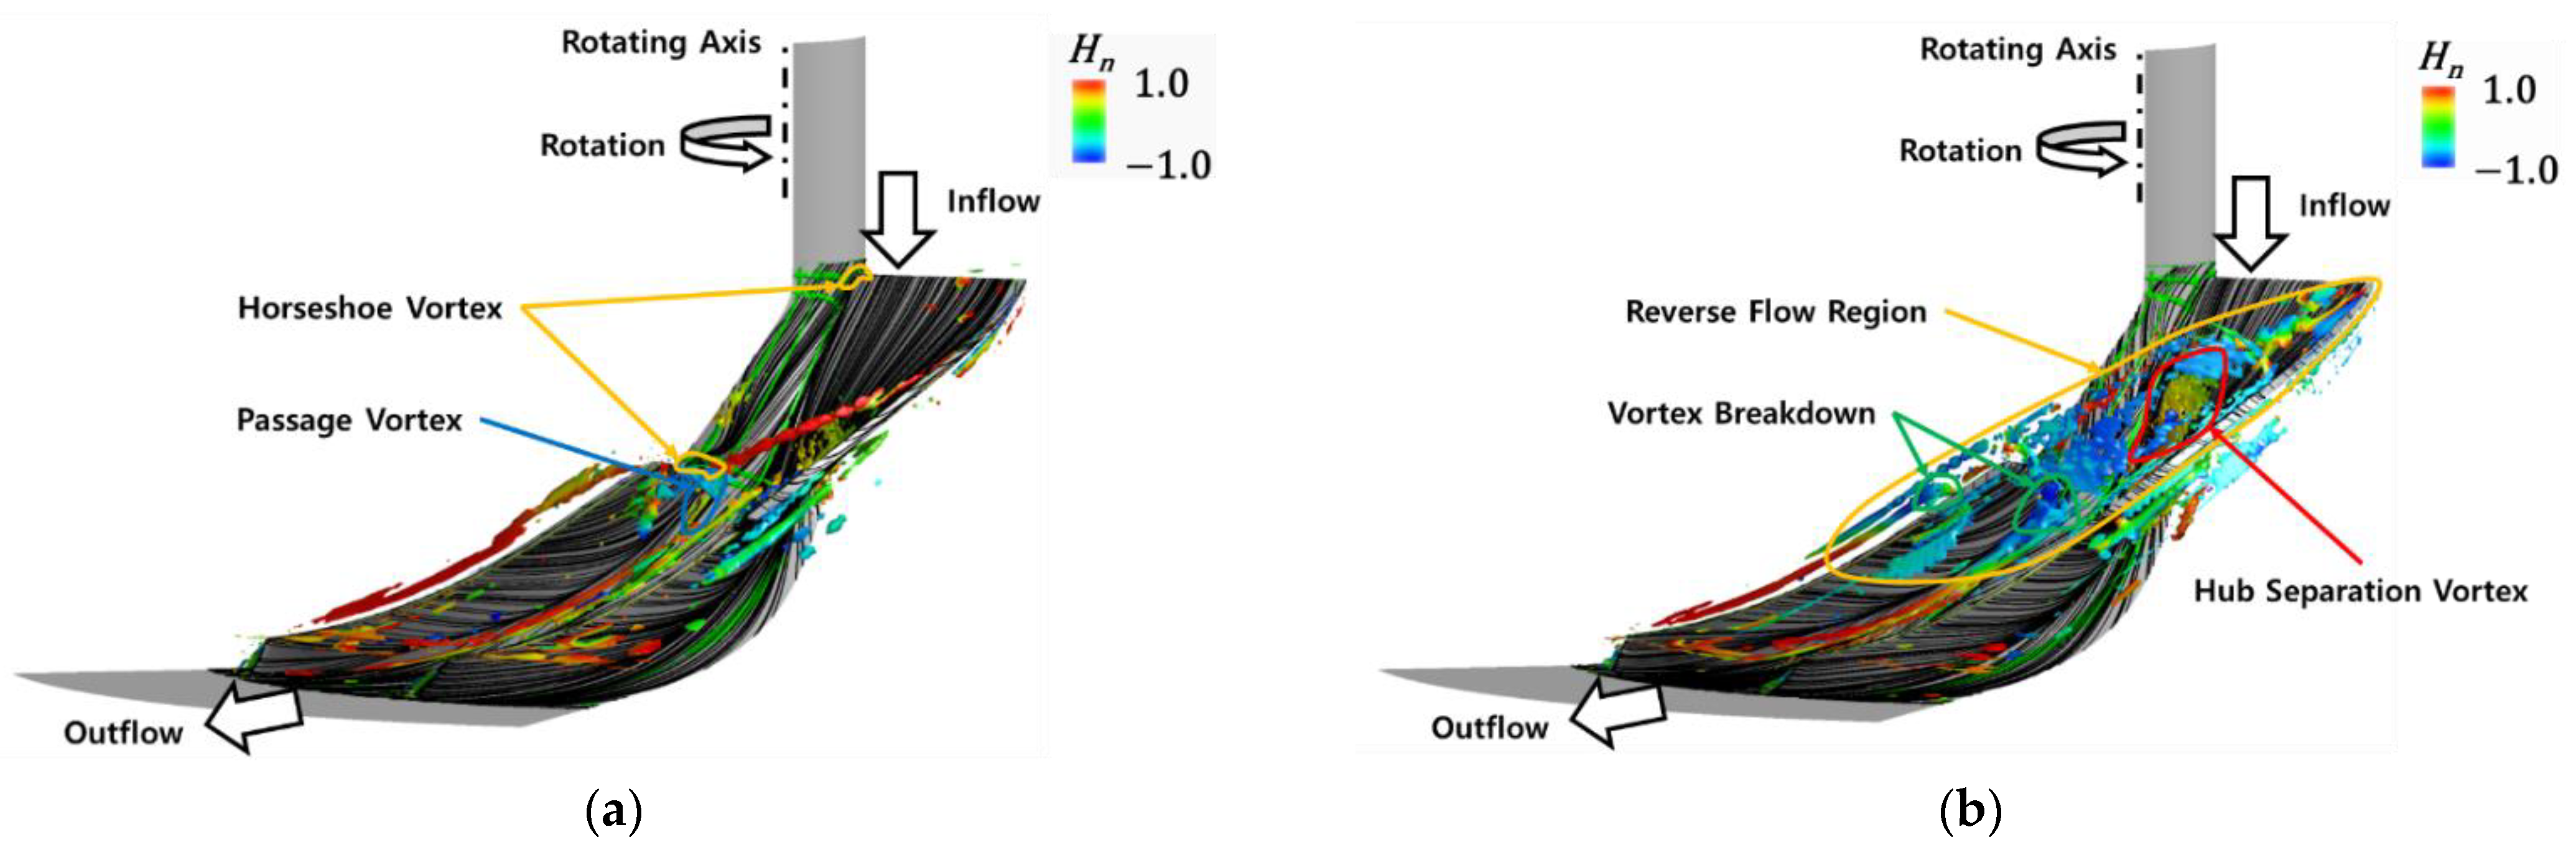
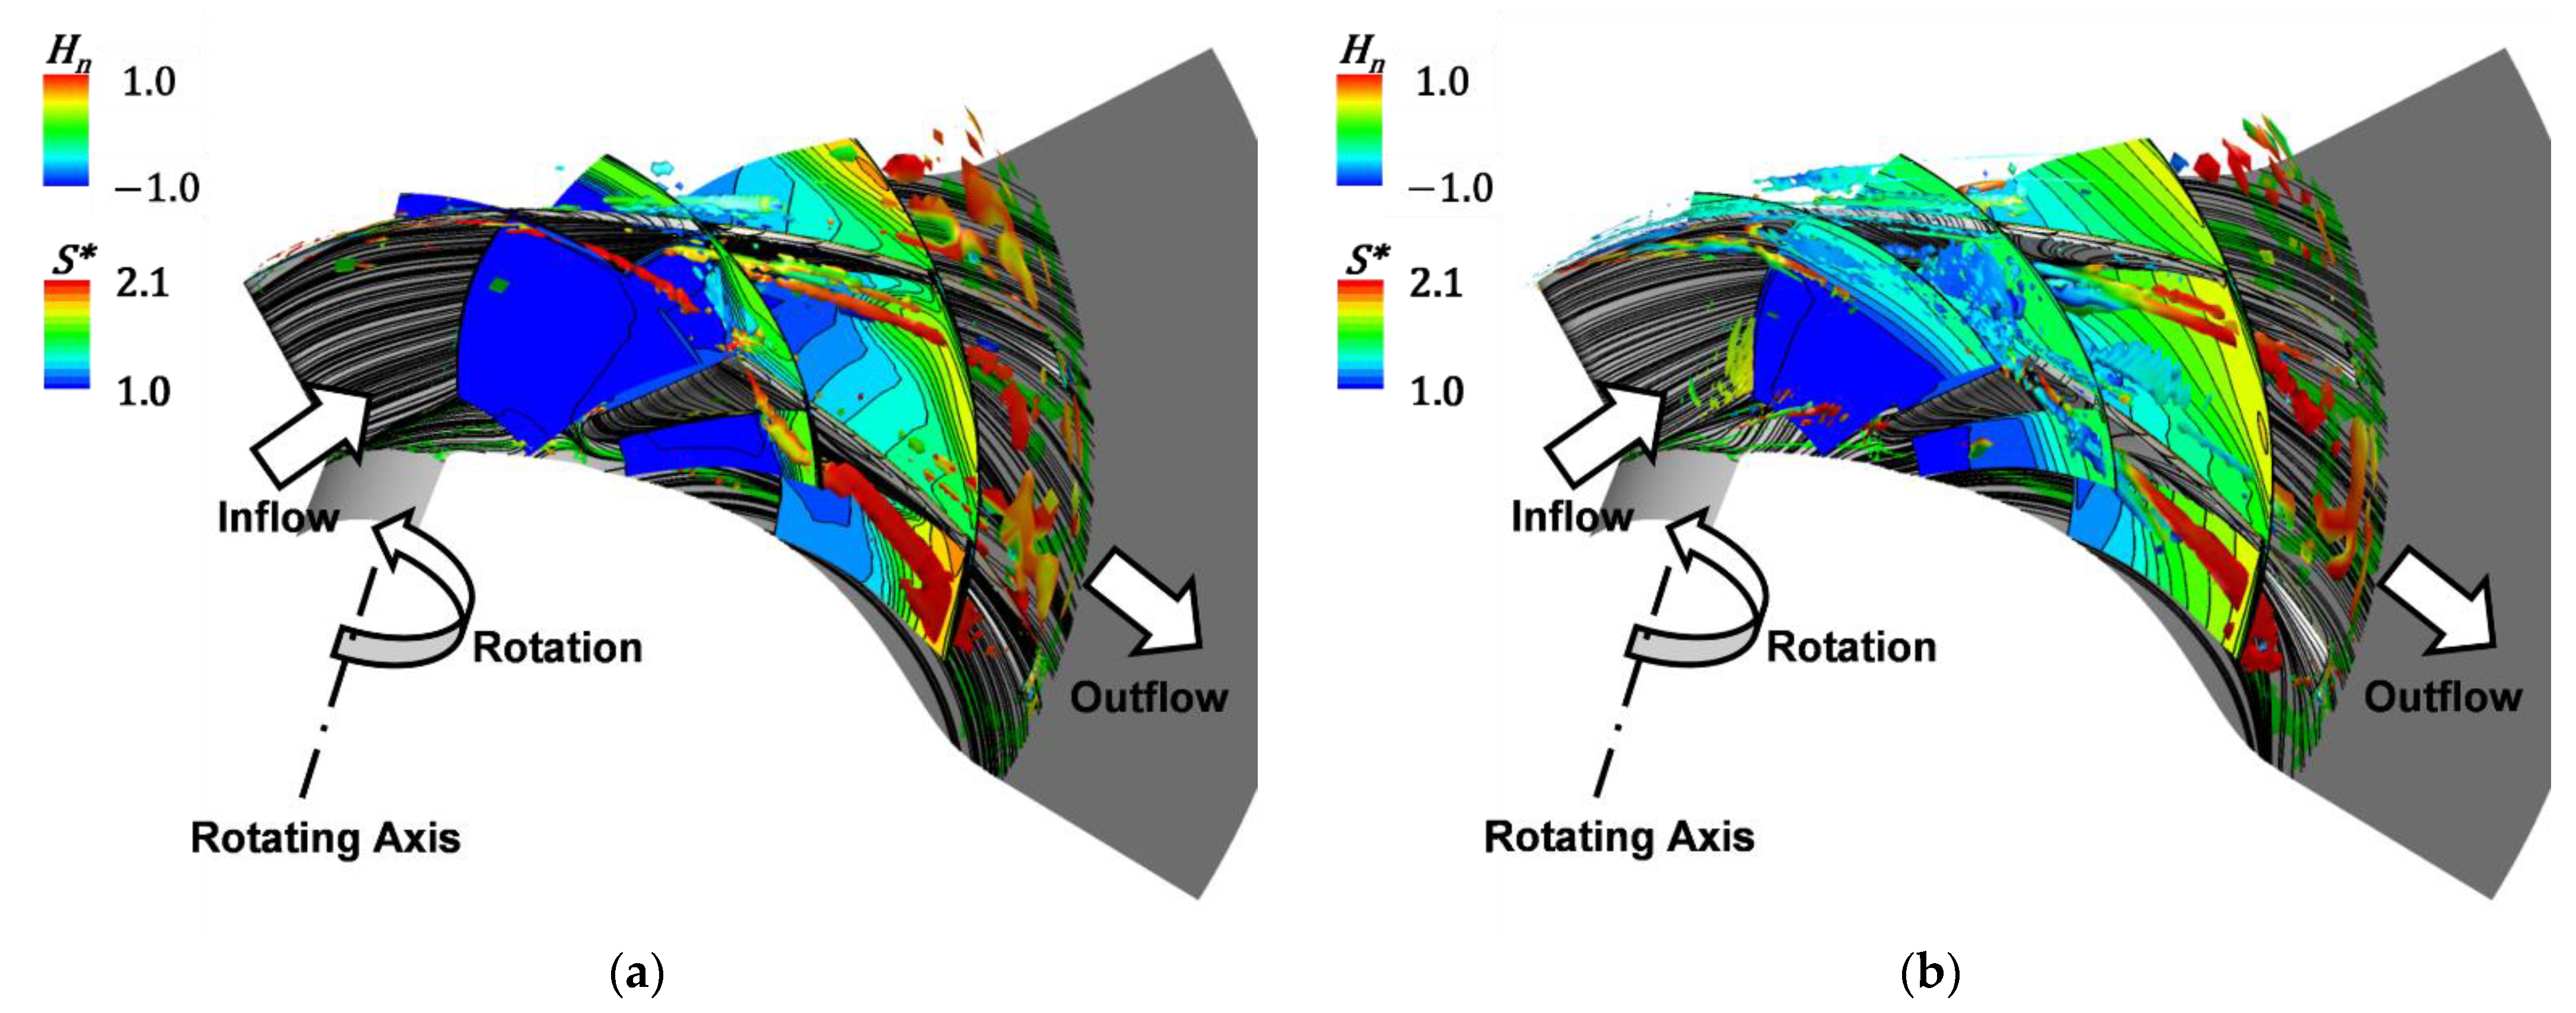
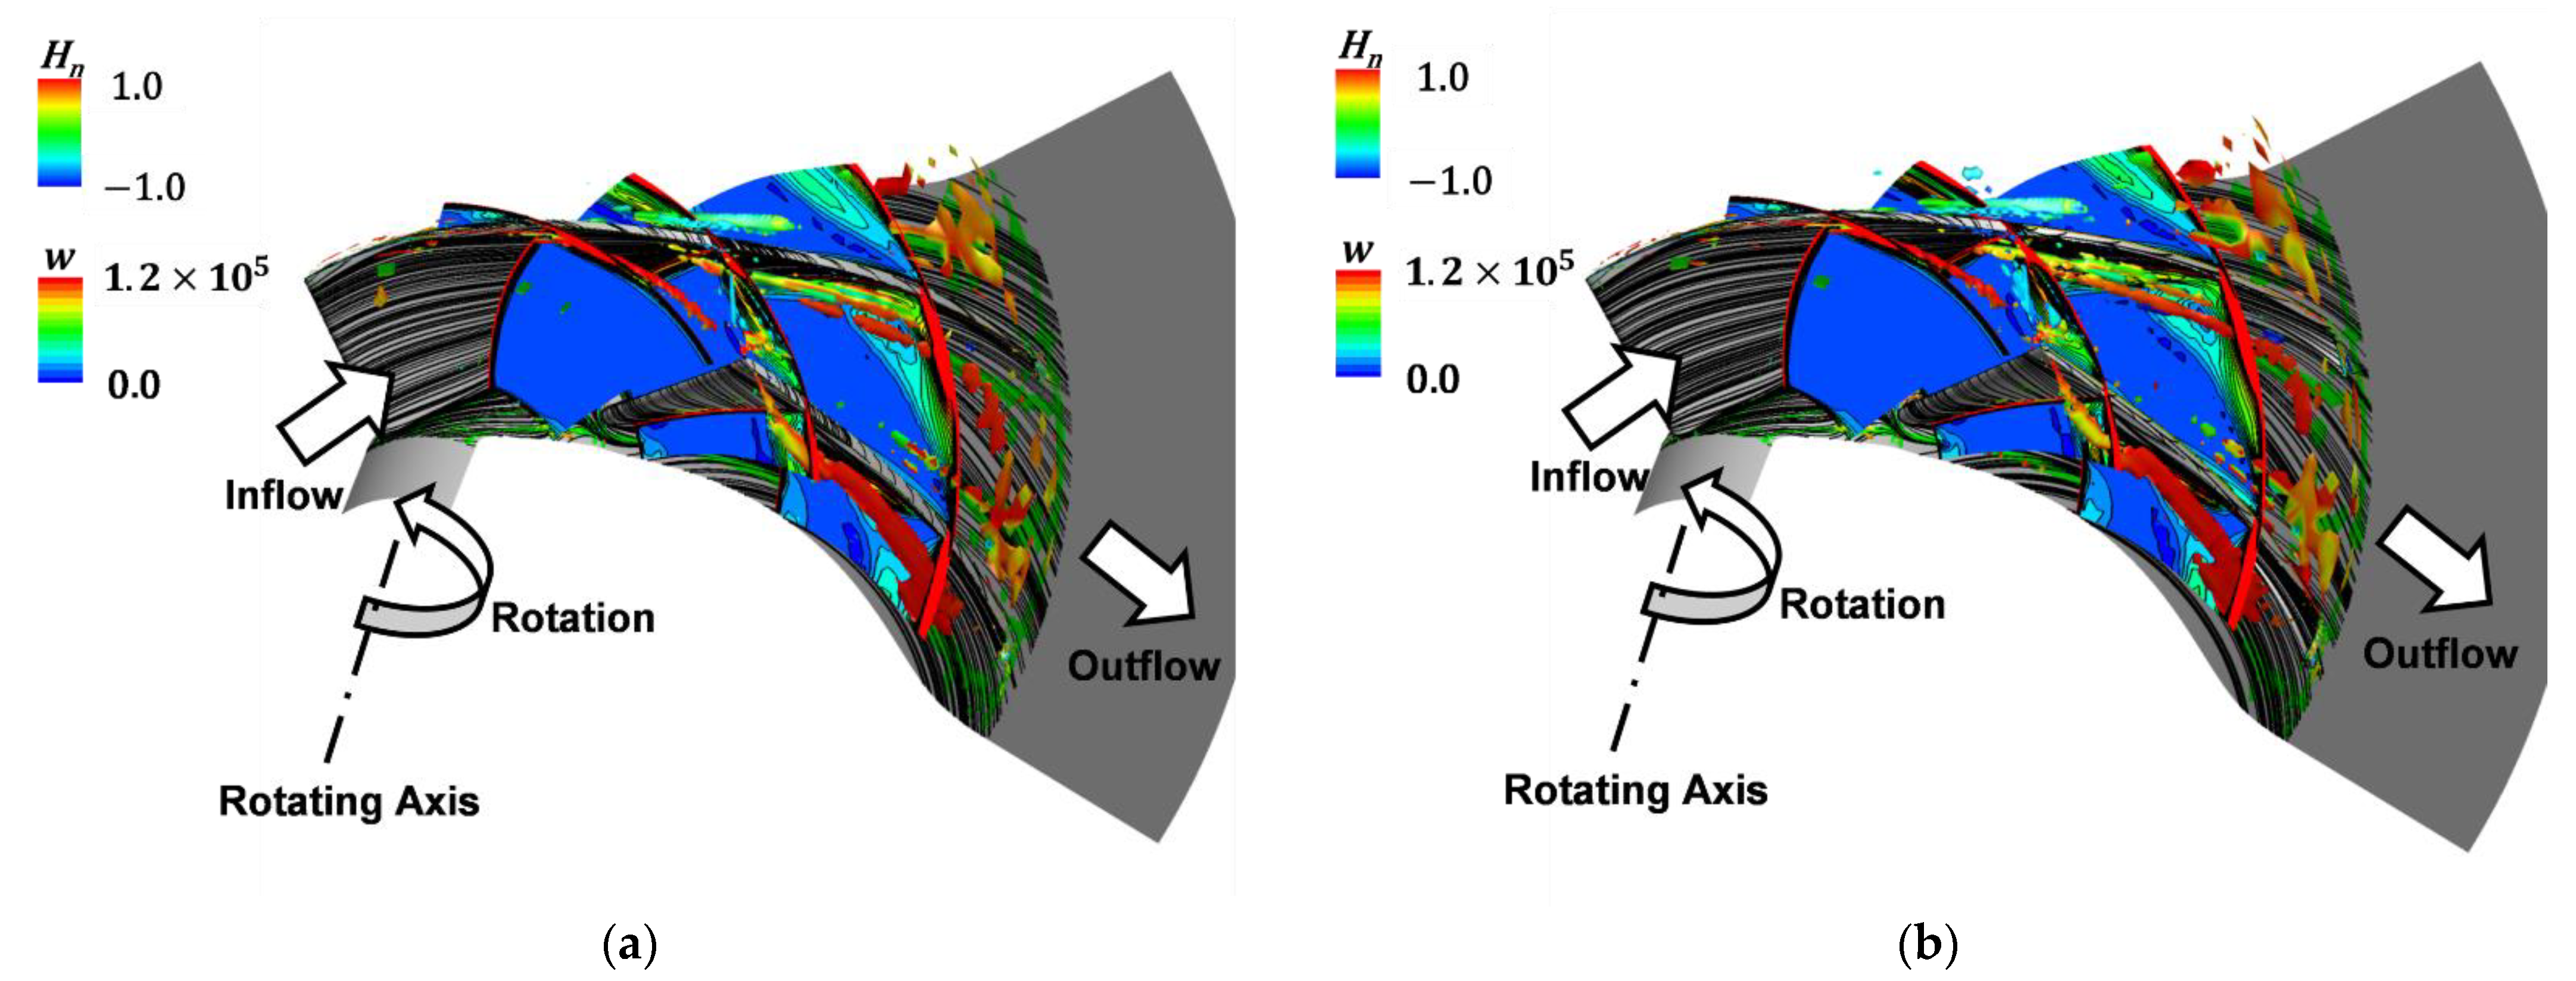
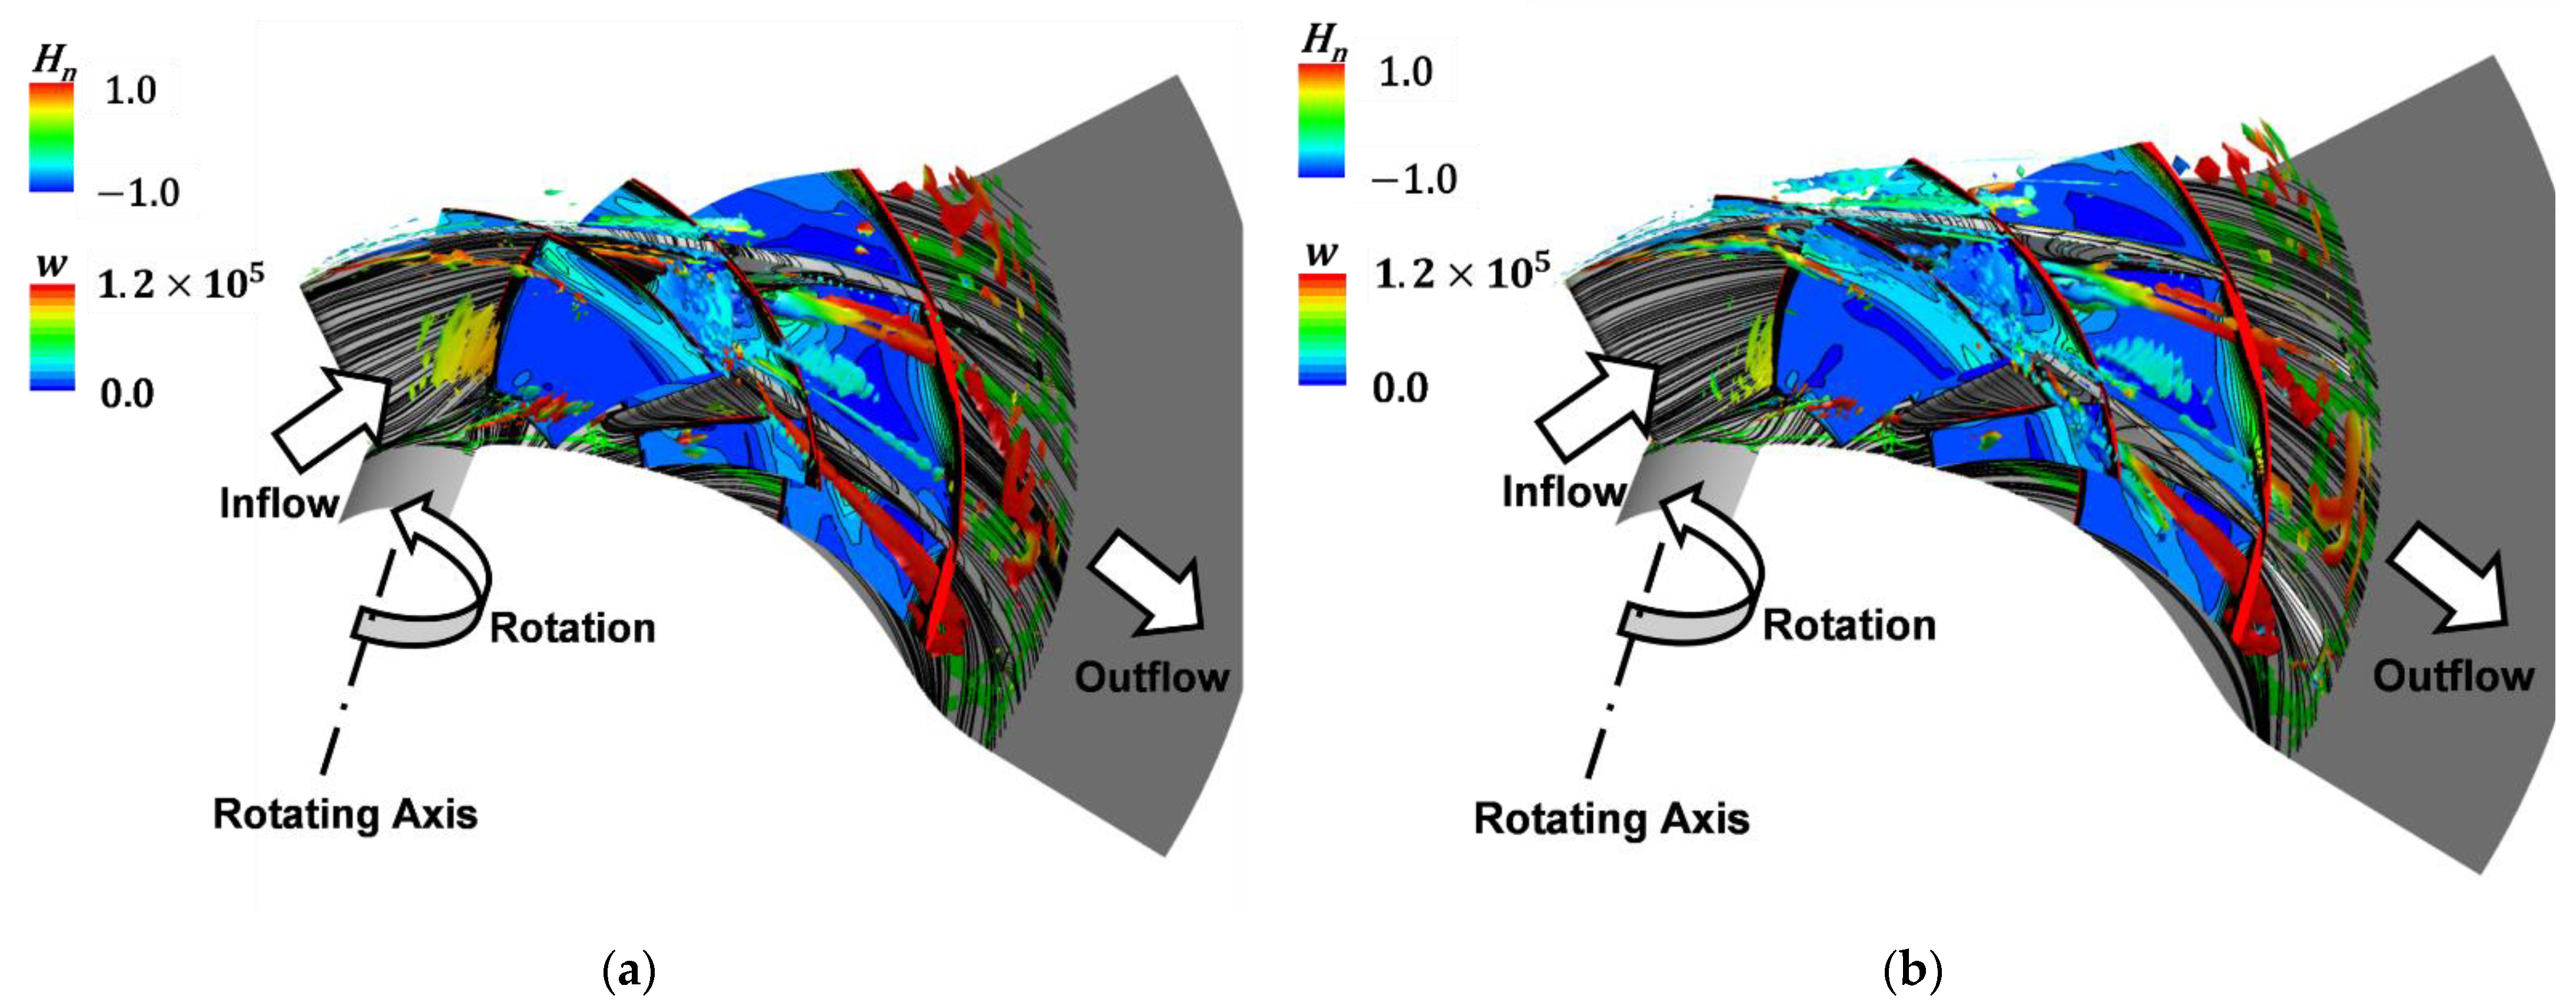
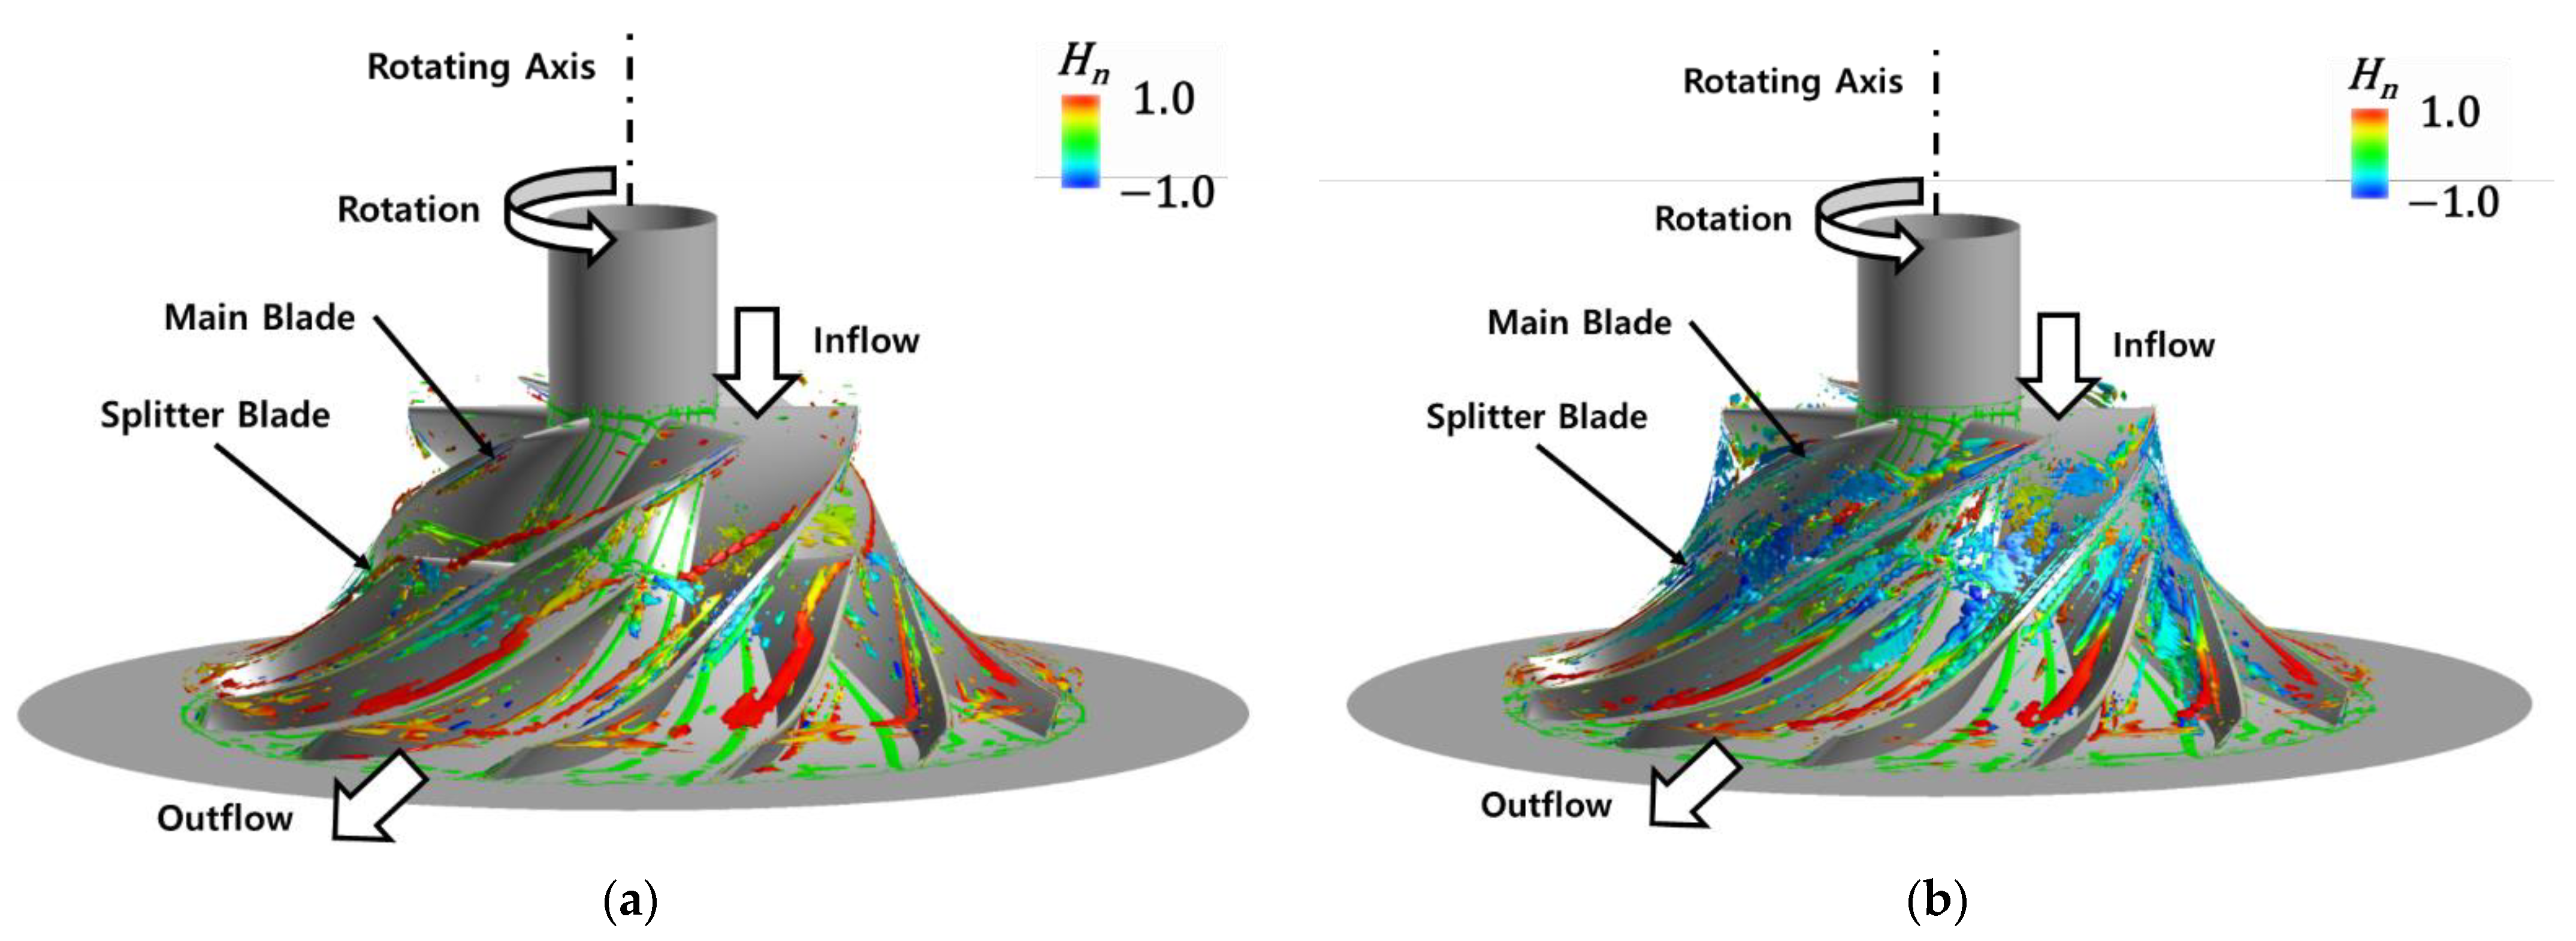
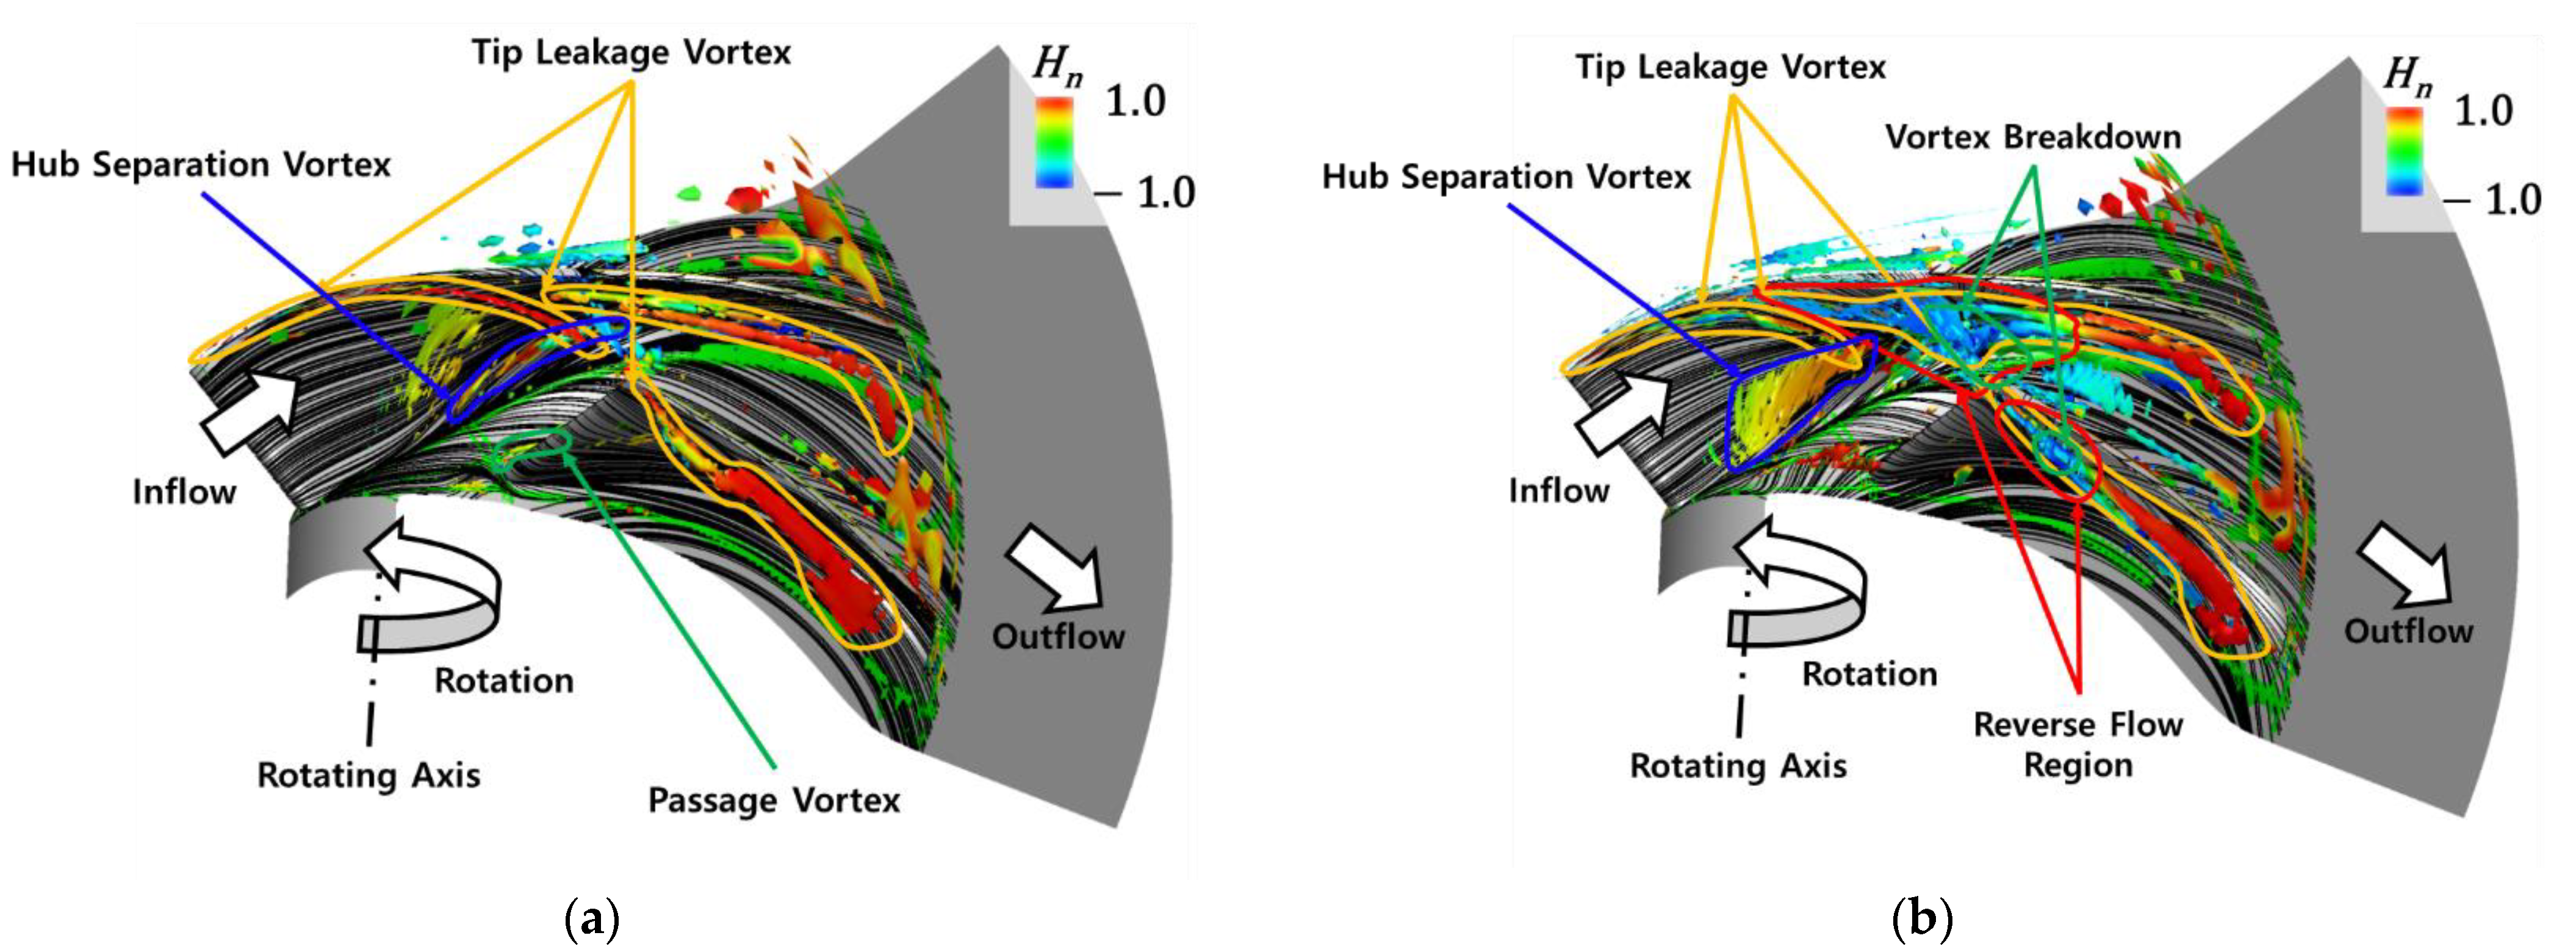
3.2. Vortical Flow Structure Analysis Results

Using the validated 3D-RANS analysis results, the vortex core was visualized and the behavior of the vortical flow structure was analyzed by changing the flow rate from the design flow rate to a lower flow rate. Figure 8 shows the perspective view of the vortical flow structure distribution of the conventional centrifugal compressor at the design flow rate (OP1) and low flow rate (OP5). The vortex core was colored using the normalized helicity as defined in Figure 5. At both flow rates, a tip leakage vortex occurred at the tip of the main blade’s leading-edge and splitter blade’s leading edge. However, at OP5, the tip leakage vortex that occurred on the main blade’s leading edge breaks down at 50% of the chord length, thus creating a reverse flow.
However, on the suction side (Figure 9) at both flow rates, the air entering the impeller from the entire flow rate leaked between the shroud and tip due to the pressure difference between the pressure surface and the suction surface near the tip of the main blade and the splitter blade. This led to the generation of a tip leakage vortex at the leading-edge tip of the blade. Additionally, as the air moved downstream, the vortex size increased, causing interference with the splitter blade, thus affecting the flow around the splitter blade. The developed boundary layers at the hub and suction surface of the main blade were interfered with by the centrifugal force, leading to the generation of a hub separation vortex at the suction surface of the main blade. At OP5, the tip leakage vortex that occurred at the main blade’s leading edge broke down at 50% of the chord length, creating a reverse flow. By changing the flow rate from the design flow rate to the lower flow rate, the size of the hub separation vortex grew bigger. The interference caused by the tip leakage vortex at the main blade’s leading-edge and splitter blade can reduce the aerodynamic performance of the centrifugal compressor by interrupting the blade rotation.
Figure 10 shows the pressure surface view of the vortical flow structure at OP1 and OP5. In both cases, as the boundary layer developed around the hub surface and the shroud surface moved downstream, the leading edge of the main blade and the splitter acted as an obstacle, causing a horseshoe vortex. The horseshoe vortex at the splinter blade, which occurred on the hub surface of the leading edge of the blade, generated a passage vortex in the area near the splitter surface. At OP5, the flow starting from the leading edge of the main blade moved along downstream, and vortex breakdown occurred at a position of about 50% of the main blade chord length, and thus the size of the vortex core increased. In addition, reverse flow occurred at 30% of the suction surface area near the shroud of the main blade, thereby degrading the performance of the centrifugal compressor.
In this paper, the entropy function (S*) was defined as an index for the evaluation of loss, as shown in Equation (13). Here, ΔS is the increase of entropy, R is gas constant, γ is the ratio of specific heat, Tt is total temperature and Pt is total pressure. The subscript 0 indicates the inlet [26].
S * = e Δ s R = ( ( T t / T t 0 ) γ γ - 1 ) / ( P t / P t 0 )
The vortical flow structure and the entropy function corresponding to the perpendicular cross-section in the streamwise direction at OP1 and OP5 are shown in Figure 11. The entropy increased near the tip leakage vortex, which meant a generation of energy loss. At OP1, the region of entropy increase is smaller than at OP5, which was a result of reverse flow and vortex breakdown occurring at OP5. Downstream the impeller, the tip leakage vortex size increased and in the region of mixing near the tip, the leakage vortex increased. The region of entropy increase became bigger which meant that OP5 had more loss generation than OP1.

3.3. Comparison of the Optimization Result with Conventional Centrifugal Compressor

The conventional and enhanced centrifugal compressor impellers are shown in Figure 12. The conventional impeller is colored grey, and the enhanced impeller is colored red. The enhanced impeller was analyzed in 4 cases and the highest adiabatic efficiency improved case was selected as the enhanced centrifugal compressor impeller as shown in Table 3.
The pressure difference and adiabatic efficiency between conventional and enhanced centrifugal compressor impellers were compared (Figure 13). The enhanced impeller had an average improvement of pressure difference and adiabatic efficiency of 1.47% and 0.47%, respectively. This showed that the enhanced impeller supplied the combustion gases more efficiently, thereby improving the efficiency of hydrogen fuel cell electric vehicles.
Additionally, the relative velocity distribution in the meridional view between conventional and enhanced centrifugal compressor impellers at OP5 was compared in Figure 14. The relative velocity in the passage is represented by colored contours. The blue region indicates the occurrence of reverse flow, where the velocity in the passage was 0 m/s. The enhanced impeller had a thinner reverse flow region as compared to the conventional one. This showed that the enhanced impeller had a higher performance than the conventional impeller.
Figure 15 shows the vortical flow structure distribution of enhanced centrifugal compressor impeller at OP1 and OP5 in perspective view, respectively. In Figure 15b, it was found that the region of reverse flow (blue color) was larger than the conventional impeller that is shown in Figure 8b, but as seen in Figure 14b, the reverse flow region was thinner than in the conventional impeller, which meant that the performance of centrifugal compressor had improved.
In Figure 16, the vortical flow structure distribution of the enhanced impeller at OP1 and OP5 in the suction surface view is shown. In both flow rates, low-energy air near the pressure surface leaked between the shroud and blade tip due to the pressure difference at the suction surface and the pressure surface. This led to the generation of a tip leakage vortex at the main blade’s leading edge, which was crushed with the leading edge of the splitter blade leading to the generation of a small reverse flow region.
However, because of a smaller vortex core of the enhanced impeller as compared to the conventional impeller, the effect of the small reverse flow was compensated for, and a passage vortex occurred at the pressure surface of the splitter blade. At OP5, a flow starting from the leading edges of the main blade and the splitter blade moved along downstream, and vortex breakdown occurred at a position of 50% of the main blade chord length, at 30% of the splitter blade chord length, and 30% of the suction surface area near the shroud of the splitter blade. Reverse flow occurred at 50% of the suction surface area near the shroud of the main blade and 30% of the suction surface area near the shroud of the splitter blade.
The vortical flow structure distribution of enhanced impeller at OP1 and OP5 in pressure surface view is shown in Figure 17. At OP1, the passage vortex occurred near the pressure surface of the splitter blade due to the generation of a horseshoe vortex on the leading edge of the splitter blade.
At OP5, a hub separation vortex occurred at a point near the pressure surface of the main blade because of the interference between the boundary layer developed at the hub and the pressure surface of the main blade. It is expected that blade optimization is related to the main parameter of blade design. Reverse flow is one of the main characteristics of flow phenomena determinant of aerodynamic performance in turbomachinery [27,28]. It reduces aerodynamic performance and increases aeroacoustic sound in the centrifugal compressor.
When the entropy difference of the enhanced case in streamwise cross-section at OP1 and OP5 was analyzed, in Figure 18a,b, it was observed that the entropy raised near the vortex core and became wider as it moved downstream. The entropy difference was smaller than the conventional case in Figure 11. This meant that the enhanced impeller had lower energy loss than the conventional one. The comparison of vorticity magnitude between conventional centrifugal compressor and enhanced centrifugal compressor at OP1(Figure 19) and OP5 (Figure 20), showed a larger magnitude of vorticity magnitude in the enhanced impeller than in the conventional impeller in the entire flow rate (OP1 and OP5), which was due to the change of the blade shape. The blade length of the enhanced impeller was shorter than that of the conventional impeller thereby increasing the blade’s loading capacity, and thus had a larger vorticity magnitude than the enhanced impeller. It seemed that the magnitude of vorticity increase made the performance of centrifugal compressor reduce as stronger tip leakage vortexes were generated, reducing the velocity of air in the passage [14]. However, a thinner reverse flow region and reduction of other vortex core size compensated for the effect of vorticity enhancement.

4. Conclusions

In this study, the three-dimensional vortical flow structures in a complex passage of the centrifugal compressor were analyzed using the vortex visualization technique. Four cases of the compressor impeller were designed (enhanced) and the behavior of the complex three-dimensional vortex structures at the compressor design flow rate and low flow rate (about 60% of the design flow rate) were studied.
It was observed that a tip leakage vortex occurred at the leading edge of the main blade and splitter blade during the entire flow rate and a hub separation vortex generated by the interference of the boundary layer developed at the hub and the suction surfaces of the main blade. As the flow rate decreased, the size of the hub separation vortex was increased, followed by the reverse flow and vortex breakdown. At the designed flow rate, a passage vortex occurred at a point near the pressure surface of the splitter blade, while at a low flow rate, a tip leakage vortex broke down at 50% of the chord length, and reverse flow occurred. When the impeller was enhanced, the tip leakage vortex generated at the leading edge of the main blade was crushed with the leading edge of the splitter blade at the design flow rate.
After optimizing the centrifugal compressor, the impeller had a thinner reverse flow region and lower entropy difference as compared to the conventional impeller. The entropy near the vortex core increased and the size of the entropy rise region grew larger downstream. It was observed that the behavior of the vortex core (such as the tip leakage vortex) changed with flow rate, which affected the performance of the centrifugal compressor. Optimization of the impeller led to a decrease in the extent of entropy rise and improvement of the pressure rise and adiabatic efficiency, more than by changing theta angle. On average, the pressure rise, and adiabatic efficiency were improved by 1.47% and 0.4%, respectively.

Author Contributions

Conceptualization, J.-H.J.; methodology, J.-H.J.; software, S.H.; validation, J.-H.J. and S.H.; formal analysis, J.M.; investigation, J.-H.J. and S.H.; resources, J.-H.J.; data curation, J.M. and S.H.; writing–original draft preparation, S.H.; writing–review and editing, J.M.; visualization, S.H.; supervision, J.-H.J.; project administration, J.-H.J.; funding acquisition, J.-H.J. All authors have read and agreed to the published version of the manuscript.

Funding

This research was funded by the Ministry of Trade, Industry, and Energy (MOTIE, Korea), 2021202080023B, 20214000000780.

Data Availability Statement

Not applicable.

Conflicts of Interest

The authors declare no conflict of interest.

References

  1. Tanç, B.; Arat, H.T.; Baltacıoğlu, E.; Aydın, K. Overview of the next quarter-century vision of hydrogen fuel cell electric vehicles. Int. J. Hydrogen. Energy 2019, 44, 10120–10128. [Google Scholar] [CrossRef]
  2. Yoshida, T.; Kojima, K. Toyota MIRAI Fuel Cell Vehicle and Progress Toward a Future Hydrogen Society. Electrochem. Soc. Interface 2015, 24, 45–49. [Google Scholar] [CrossRef]
  3. Ahluwalia, R.K.; Wang, X.; Rousseau, A.; Kumar, R. Fuel economy of hydrogen fuel cell vehicles. J. Power Sources 2004, 130, 192–201. [Google Scholar] [CrossRef]
  4. Yang, H.; Cho, K.S.; Park, C.Y.; Keon, D.B.; Lee, C.H.; Park, Y.S. The Novel Centrifugal Air Compressor Development for the Fuel Cell Electric Vehicles. In Proceedings of the SAE 2014 International Powertrain, Fuels & Lubricants Meeting, Birmingham, UK, 20–22 October 2022. [Google Scholar] [CrossRef]
  5. Borgstedt, P.; Neyer, B.; Schewe, G. Paving the road to electric vehicles—A patent analysis of the automotive supply industry. J. Clean. Prod. 2017, 167, 75–87. [Google Scholar] [CrossRef]
  6. Cagalitan, D.F.-D.; Abundo, M. A review of biohydrogen production technology for application towards hydrogen fuel cells. Renew. Sustain. Energy Rev. 2021, 151, 111413. [Google Scholar] [CrossRef]
  7. Hoffmann, P. Tomorrow’s Energy Hydrogen, Fuel Cells and the Prospects for a Cleaner Planet. Cogener. Distrib. Gener. J. 2006, 21, 76–77. [Google Scholar] [CrossRef]
  8. Zhang, Y.; Xu, S.; Wan, Y. Performance improvement of centrifugal compressors for fuel cell vehicles using the aerodynamic optimization and data mining methods. Int. J. Hydrogen Energy 2020, 45, 11276–11286. [Google Scholar] [CrossRef]
  9. Deng, Z.; Chen, Q.; Zhang, L.; Fu, Z. Data-driven NARMAX modeling for PEMFC air compressor. Int. J. Hydrogen Energy 2020, 45, 20321–20328. [Google Scholar] [CrossRef]
  10. Chen, H.; Zhuge, W.; Zhang, Y.; Ma, X.; Tao, L. Performance Improvement of a Centrifugal Compressor for the Fuel Cell Vehicle by Tip Leakage Vortex Control. J. Therm. Sci. 2021, 30, 2099–2111. [Google Scholar] [CrossRef]
  11. Chen, S.; Zuo, S.; Wei, K. Experimental and numerical investigations on the acoustic characteristics and unsteady behaviors of a centrifugal compressor for fuel cell vehicles. Proc. Inst. Mech. Eng. Part C J. Mech. Eng. Sci. 2021, 235, 1344–1356. [Google Scholar] [CrossRef]
  12. Cho, S.-Y.; Ahn, K.-Y.; Lee, Y.-D.; Kim, Y.-C. Optimal Design of a Centrifugal Compressor Impeller Using Evolutionary Algorithms. Math. Probl. Eng. 2012, 2012, 752931. [Google Scholar] [CrossRef]
  13. Tomita, I.; Ibaraki, S.; Furukawa, M.; Yamada, K. The Effect of Tip Leakage Vortex for Operating Range Enhancement of Centrifugal Compressor. J. Turbomach. 2013, 135, 649. [Google Scholar] [CrossRef]
  14. Ibaraki, S.; Furukawa, M.; Iwakiri, K.; Takahashi, K. Vortical Flow Structure and Loss Generation Process in a Transonic Centrifugal Compressor Impeller. In Proceedings of the Turbo Expo: Power for Land Sea and Air 2007, Parts A B, Montreal, QC, Canada, 14–17 May 2007; ASME: Windsdor, ON, Canada, 2007; Volume 6, pp. 1089–1098. [Google Scholar] [CrossRef]
  15. Wang, Z.; Wu, B.; Zhang, W. An Improved Method for Aerodynamic Design of Centrifugal Impeller Blades. In Proceedings of the Turbo Expo: Power for Land Sea and Air 2007, Parts A B, Orlando, FL, USA, 3–6 June 1991; ASME: Little Falls, NJ, USA, 1991; p. 8. [Google Scholar] [CrossRef]
  16. Casey, M.V. A Computational Geometry for the Blades and Internal Flow Channels of Centrifugal Compressors. J. Eng. Power. 1983, 105, 288–295. [Google Scholar] [CrossRef]
  17. Kim, H.-W.; Ryu, S.-H.; Ghal, S.-H.; Ha, J.-S. A Numerical Study on the Design And Flow Patterns of Compressor Impeller in a Marine Engine Turbocharger. In Proceedings of the ASME 2004 Internal Combustion Engine Division Fall Technical Conference, Long Beach, CA, USA, 24–27 October 2004; ASME: Little Falls, NJ, USA, 2004; pp. 309–314. [Google Scholar] [CrossRef]
  18. Bonaiuti, D.; Arnone, A.; Ermini, M.; Baldassarre, L. Analysis and Optimization of Transonic Centrifugal Compressor Impellers Using the Design of Experiments Technique. J. Turbomach. 2006, 128, 786–797. [Google Scholar] [CrossRef]
  19. ANSYS, Inc. ANSYS CFX-Solver Theory Guide; ANSYS, Inc.: Canonsburg, PA, USA, 2011. [Google Scholar]
  20. Menter, F.R. Zonal Two Equation k-ω Turbulence Models for Aerodynamic Flows. In Proceedings of the 23rd Fluid Dynamics, Plasmadynamics, and Lasers Conference, Orlando, FL, USA, 6–9 July 1993; American Institute of Aeronautics and Astronautics: Sunrise Vallery, VA, USA, 1993; pp. 1–22. [Google Scholar]
  21. Martos, P.A.; Barrera-Medrano, M.E.; Martinez-Botas, R.; Tomita, I.; Kanzaka, T.; Ibaraki, S. Flow Field Analysis and Enhanced Design of a Centrifugal Compressor Volute. In Proceedings of the ASME Turbo Expo 2021: Turbomachinery Technical Conference and Exposition, Virtual Online, 7–11 June 2021; Volume 2C: Turbomachinery—Design Methods and CFD Modeling for Turbomachinery; Ducts, Noise, and Component Interactions. ASME: Little Falls, NJ, USA, 2021. [Google Scholar] [CrossRef]
  22. Ou, M.; Yan, L.; Huang, W.; Li, S.-B.; Li, L.-Q. Detailed parametric investigations on drag and heat flux reduction induced by a combinational spike and opposing jet concept in hypersonic flows. Int. J. Heat Mass Transf. 2018, 126, 10–31. [Google Scholar] [CrossRef]
  23. Borm, O.; Kau, H.-P. Unsteady Aerodynamics of a Centrifugal Compressor Stage: Validation of Two Different CFD Solvers. In Proceedings of the ASME Turbo Expo 2012: Turbine Technical Conference and Exposition, Copenhagen, Denmark, 11–15 June 2012; Turbomachinery, Parts A, B, and C. ASME: Little Falls, NJ, USA, 2012; Volume 8, pp. 2753–2764. [Google Scholar] [CrossRef] [Green Version]
  24. Sawada, K. Convenient visualization method for identifying vortex centers. Trans. Jpn. Soc. Aeronaut. Space Sci. 1995, 38, 102–116. [Google Scholar]
  25. Iwakiri, K.; Furukawa, M.; Ibaraki, S.; Tomita, I. Unsteady and Three-Dimensional Flow Phenomena in a Transonic Centrifugal Compressor Impeller at Rotating Stall. In Proceedings of the ASME Turbo Expo 2009: Power for Land, Sea, and Air, Orlando, FL, USA, 8–12 June 2009; Turbomachinery, Parts A and B. ASME: Little Falls, NJ, USA, 2009; Volume 7, pp. 1611–1622. [Google Scholar] [CrossRef]
  26. Itou, S.; Oka, N.; Furukawa, M.; Yamada, K.; Ibaraki, S.; Iwakiri, K.; Hayashi, Y. Optimum aerodynamic design of centrifugal compressor using a genetic algorithm and an inverse method based on meridional viscous flow analysis. In Proceedings of the 17th International Symposium on Transport Phenomena and Dynamics of Rotating Machinery, Maui, HI, USA, 16–21 December 2017; (ISROMAC2017). pp. 1–9. Available online: https://hal.archives-ouvertes.fr/hal-02981000 (accessed on 7 July 2022).
  27. Yamada, K.; Furukawa, M.; Arai, H.; Kanzaki, D. Evolution of Reverse Flow in a Transonic Centrifugal Compressor at Near-Surge. In Turbo Expo: Power for Land, Sea, and Air; ASME: Little Falls, NJ, USA, 2017; Volume 50800, p. V02CT44A014. [Google Scholar] [CrossRef]
  28. Righi, M.; Pachidis, V.; Könözsy, L. On the prediction of the reverse flow and rotating stall characteristics of high-speed axial compressors using a three-dimensional through-flow code. Aerosp. Sci. Technol. 2020, 99, 105578. [Google Scholar] [CrossRef]
Figure 1. Centrifugal compressor impeller used in the analysis.
Applsci 12 07755 g001
Figure 2. Computational grid system with a specific view at the hub and tip side.
Applsci 12 07755 g002
Figure 3. Grid sensitivity results with normalized pressure difference.
Applsci 12 07755 g003
Figure 4. Experimental equipment of the centrifugal compressor.
Applsci 12 07755 g004
Figure 5. Rotation direction according to normalized helicity.
Applsci 12 07755 g005
Figure 6. Definition of theta angle at a position of spanwise 100% of centrifugal compressor impeller main blade leading edge.
Applsci 12 07755 g006
Figure 7. Comparison of 3D-RANS analysis results with the experimental results.
Applsci 12 07755 g007
Figure 8. Perspective view of vortical flow structure distribution of the conventional centrifugal compressor at (a) OP1 and (b) OP5.
Applsci 12 07755 g008
Figure 9. Suction surface view of vortical flow structure distribution of the conventional centrifugal compressor at (a) OP1 and (b) OP5.
Applsci 12 07755 g009
Figure 10. Pressure surface view of vortical flow structure distribution of conventional centrifugal compressor at (a) OP1 and (b) OP5.
Applsci 12 07755 g010
Figure 11. Streamwise cross-sectional view of vortical flow structure and entropy function distribution at (a) OP1and (b) OP5.
Applsci 12 07755 g011
Figure 12. Illustration of the conventional (grey-colored) enhanced (red-colored) centrifugal compressor impellers.
Applsci 12 07755 g012
Figure 13. Comparison of (a) pressure ratio and (b) adiabatic efficiency, between conventional centrifugal compressor impeller and enhanced centrifugal compressor impeller.
Applsci 12 07755 g013
Figure 14. Relative velocity distribution in meridional view at OP5 for the (a) conventional and (b) enhanced centrifugal compressor impellers.
Applsci 12 07755 g014
Figure 15. Perspective view of vortical flow structure distribution of enhanced centrifugal compressor at (a) OP1 and (b) OP5.
Applsci 12 07755 g015
Figure 16. Suction surface view of vortical flow structure distribution of enhanced centrifugal compressor at (a) OP1 and (b) OP5.
Applsci 12 07755 g016
Figure 17. Pressure surface view of vortical flow structure distribution of enhanced centrifugal compressor at (a) OP1 and (b) OP5.
Applsci 12 07755 g017
Figure 18. Streamwise cross-sectional view of vortical flow structure and entropy function distribution of enhanced centrifugal compressor at (a) OP1 and (b) OP5.
Applsci 12 07755 g018
Figure 19. Streamwise cross-sectional view of vortical flow structure and vorticity magnitude distribution of (a) conventional impeller and (b) enhanced impeller at OP1.
Applsci 12 07755 g019
Figure 20. Streamwise cross-sectional view of vortical flow structure and vorticity magnitude distribution of (a) conventional impeller and (b) enhanced impeller at OP5.
Applsci 12 07755 g020
Table 1. Design specification of centrifugal compressor.
Design ParameterValue (Dimensionless)
Impeller Diameter1
Impeller Height0.3546
Number of Main Blade6
Number of Splitter Blade6
Tip Clearance0.00319
Table 2. Comparison of theta angle difference between the conventional impeller and the design cases.
CaseTheta Angle Difference at Spanwise 0%Theta Angle Difference at Spanwise 100%
Conventional
Opt. 1−1°
Opt. 2−2°
Opt. 3−3°
Opt. 4−4°
Table 3. Comparison of normalized efficiency difference for 4 enhanced impeller cases.
CaseNormalized Efficiency Difference at Design Flow RateNormalized Efficiency Difference at Low Flow Rate
Opt. 1−0.34%−0.36%
Opt. 2−0.05%0.21%
Opt. 30.00%0.00%
Opt. 40.07%0.00%
Publisher’s Note: MDPI stays neutral with regard to jurisdictional claims in published maps and institutional affiliations.

