Article

Investigation on Vibration Influence Law of Double-Shield TBM Tunnel Construction

1
School of Civil Engineering, Qingdao University of Technology, Qingdao 266520, China
2
School of Mechanics and Civil Engineering, China University of Mining & Technology, Beijing 100083, China
*
Author to whom correspondence should be addressed.
Appl. Sci. 2022, 12(15), 7727; https://doi.org/10.3390/app12157727
Submission received: 9 July 2022 / Revised: 27 July 2022 / Accepted: 29 July 2022 / Published: 1 August 2022
(This article belongs to the Section Civil Engineering)

Abstract

:
Double-shield TBM is more efficient than shield tunnel construction in hard rock strata. It is widely used in subway tunnel construction, such as in Qingdao and Chongqing in China. However, construction vibration problems caused by double-shield TBM critically affect human comfort in surface buildings. In order to study the vibration influence law of double-shield TBM, the on-site monitoring plan of double-shield TBM is developed, relying on a tunnel section of Qingdao Metro Line 4. Then, the vibration monitoring results are analyzed, and the time domain and frequency domain characteristics of vibration acceleration are obtained. Subsequently, taking vibration peak acceleration as the research object, the transverse and longitudinal vibration laws of double-shield TBM construction are studied. Finally, according to the standard of human comfort in buildings, the vibration influence ranges of double-shield TBM construction are obtained. The research results can provide a reference for the vibration effect of double-shield TBM passing through houses, highways and bridges. Moreover, it can also provide a basis for the disputes that double-shield TBM tunnel construction affects the lives of inhabitants.

1. Introduction

With the increase in urban areas and population, subways have become the most convenient and environmentally friendly way to travel [1]. By the end of 2021, 50 cities in China have opened subways, with a total operating mileage of 7305 km. What is more, thousands of kilometers of the subway are under construction every year. The tunnel boring machine (TBM) is more efficient than the shield machine in hard rock strata, especially the double-shield TBM [2,3]. Double-shield TBM integrates the technical features of an open TBM and shield machine; it can realize the simultaneous construction of tunnel excavation and segment assembly [4]. In 2016, double-shield TBM in China was first applied to urban subway construction, and it achieved great success in tunneling efficiency. Subsequently, double-shield TBM is more and more widely used in urban subway construction, such as in Qingdao and Chongqing [5,6]. However, TBM inevitably passes through houses, roads, bridges or adjacent tunnels when the tunnel is excavated underground. With the popularization of double-shield TBM in urban subway tunnels, the vibration problems caused by construction are worthy of attention [7,8].
At present, many scholars have performed lots of on-site vibration monitoring to research the impact of tunnel excavation on existing tunnels [9,10], buildings [11,12] and pipelines [13,14,15], etc. For example, Yu et al. [16] studied the impact of blasting construction on existing tunnels under different blasting schemes by on-site vibration monitoring and analyzed the characteristics of vibration velocity under different excavation footage. Vibration analysis is a key method for studying the dynamic characteristics of vibrating bodies. Many scholars have also proposed some useful dynamic analysis methods [17,18]. For example, Ahmad Reshad Noori et al. [19] introduced an efficient numerical procedure to solve the dynamic response of functionally graded porous beams. Subsequently, the dynamic response of functionally graded porous beams was studied for several boundary and loading conditions. Moreover, there is a large amount of research on the aspect of vibration attenuation and propagation [20,21,22]. For instance, Wang et al. [23] analyzed the propagation characteristics and attenuation laws of blast-induced vibration in rock tunnels and proposed a formula for calculating the peak particle velocity considering diffraction and reflection amplification effects. Nevertheless, these studies mainly focus on blast-induced vibration, and there are few studies on the vibration caused by double-shield TBM construction. One of the important reasons is that double-shield TBM is generally used in mine and water tunnels, not urban subway tunnels.
Compared with blast-induced vibration, the vibration caused by double-shield TBM lasts longer, and the amplitude and frequency of vibration in tunnel construction are also different from those in blast-induced vibration [24]. In terms of TBM tunnel construction vibration, current studies have obtained some useful results. For example, Wu, F. et al. [25] have developed a cutter-head vibration monitoring system for TBM tunneling and analyzed the differences in amplitude and frequency of triaxial vibration on cutter-head vibration characteristics. Wu, K. et al. [26] monitored segment vibration during TBM construction; the main influence distance of segment vibration is 9 m. It can be seen that it is relatively lacking in vibration influence law of double-shield TBM construction. Furthermore, studies, at present, only consider the impact of double-shield TBM construction on the buildings and ignore the impact on human comfort in the buildings.
This paper is devoted to studying the vibration characteristics and influence laws of double-shield TBM in tunnel construction, determining the vibration influence range of human comfort. First, relying on the Laozhang section in Qingdao Metro Line 4, the double-shield TBM construction site vibration monitoring scheme was developed. Then, vibration data for double-shield TBM tunnel excavation are obtained. Next, the vibration characteristics and vibration influence range caused by double-shield TBM construction are analyzed. Finally, the vibration influence range by double-shield TBM tunnel construction is determined.

2. Case Description

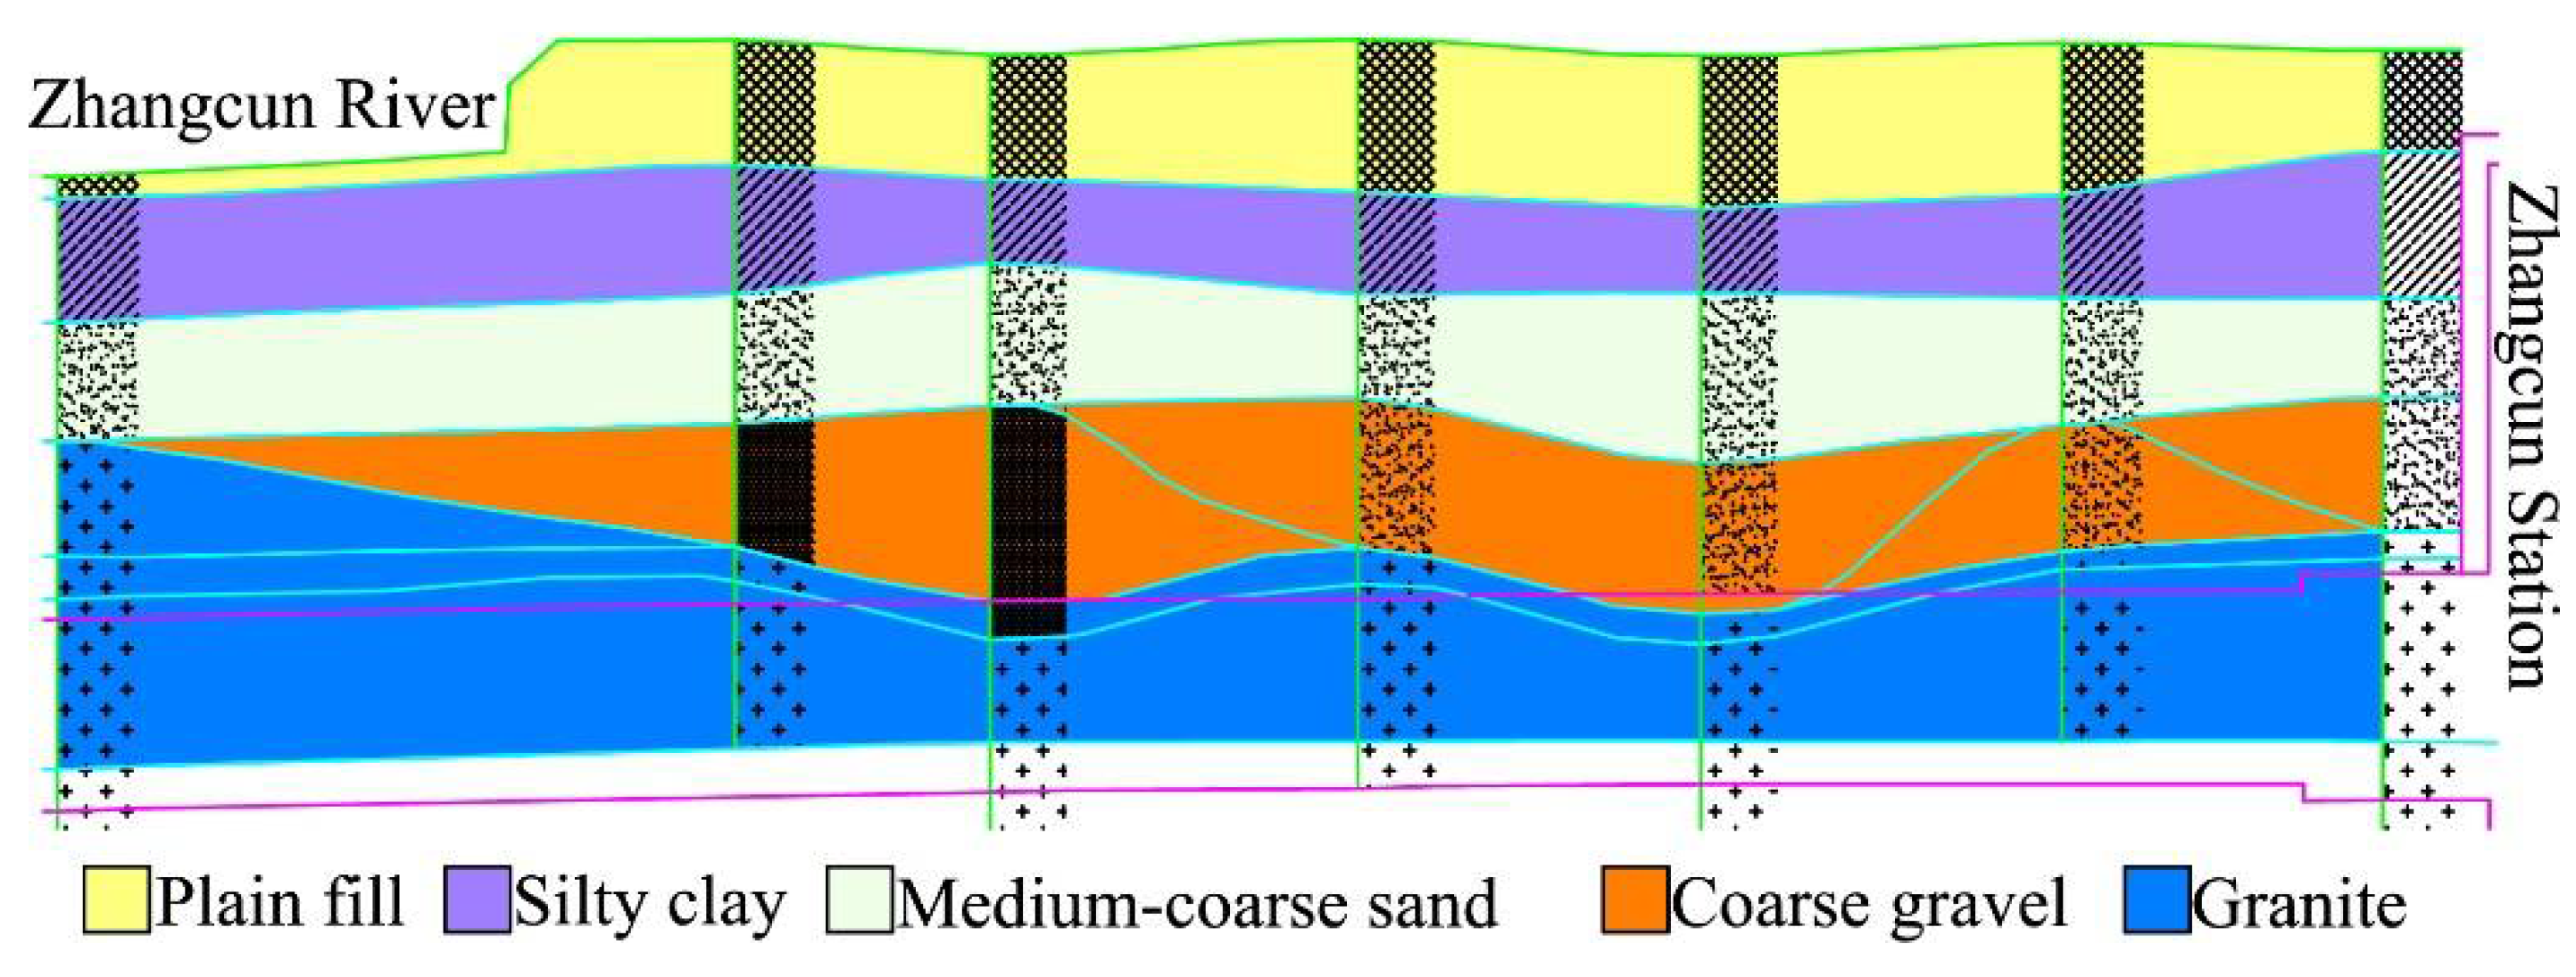
2.1. Project Overview

The tunnels of the Laozhang section are constructed with two double-shield TBMs, launching from the Station of Laoshan Science and Technology City and arriving at Zhangcun Station. The left tunnel is parallel to the right, which is in the form of a circular section. The mileage of the tunnels is K18 + 033.281~K19 + 696.555. The length of the left tunnel is 1675.624 m, and the right is 1663.274 m. Moreover, the tunnel lining is assembled with six prefabricated segments. The width of each segment is 1.5 m, and the thickness is 0.3 m. The inner diameter of the lining is 5.7 m after the segments are assembled.
The tunnel mainly passes through slightly weathered granite, with coarse sand and gravel intrusion locally in the receiving terminal. The mixed formation of rock and soil is a typical unfavorable geological area for double-shield TBM. According to the geological survey at the receiving terminal, the overlying strata of the tunnel are plain fill, silty clay, coarse sand, gravel, strongly weathered granite, and moderately weathered granite from top to bottom. The geological profile of the receiving terminal is shown in Figure 1 [27]. Moreover, there is a river near this receiving terminal, and groundwater is abundant here. The types of groundwater are mainly Quaternary pore water and bedrock fissure water, among which Quaternary phreatic water recharges the bedrock fissure water downward. According to the standard for engineering classification of rock mass (GBT 50218-2014) in China [28], the surrounding rock of the receiving terminal is classified as grade II.

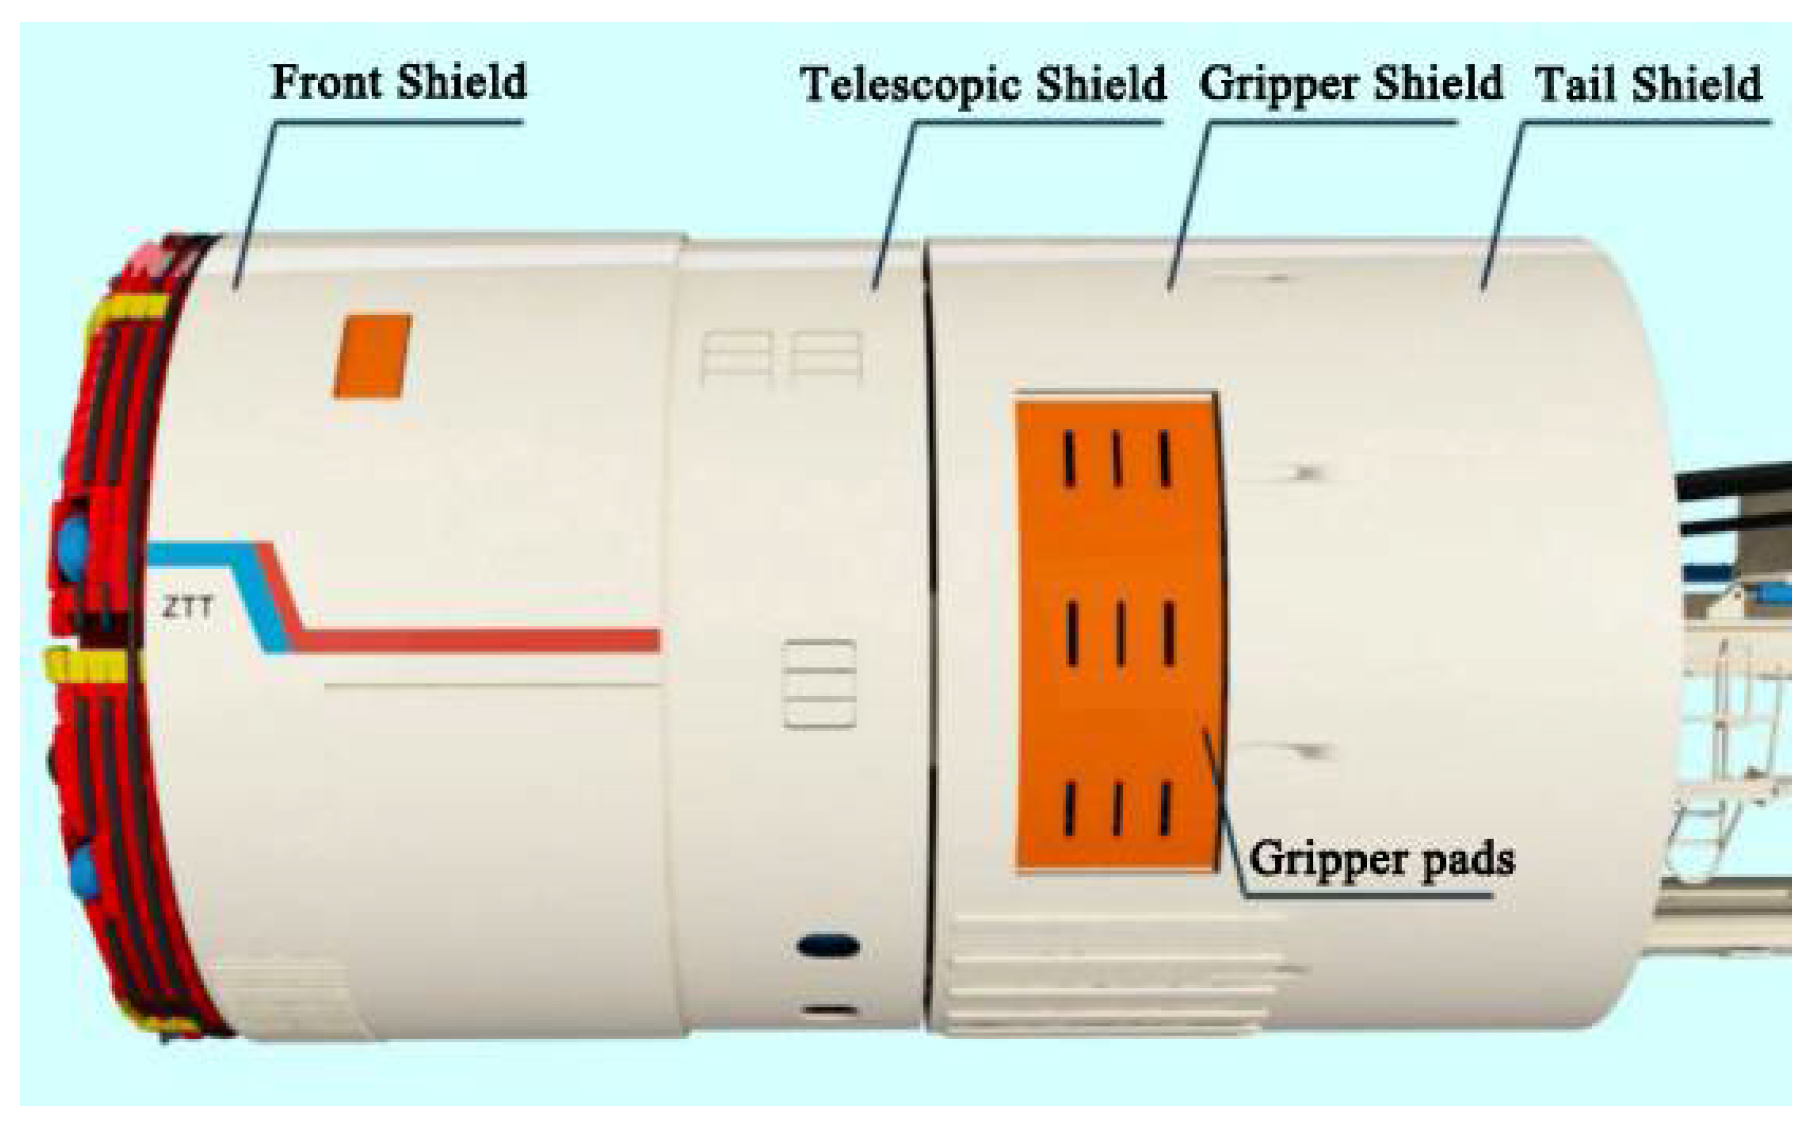
2.2. Introduction to Double-Shield TBM

The two double-shield TBMs are produced by the China Railway Construction Heavy Industry Co., Ltd. (Changsha, China). As is shown in Figure 2, its main structure includes a cutter-head, main bearing and drive components, front shield, telescopic shield, gripper shield, tail shield, backup supporting equipment, etc. The length of the mainframe is 12 m, and the whole machine’s length is 167 m. In terms of this double-shield TBM’s performance, the total maximum thrust is 24,000 KN, the rated torque is 2850 kN·m, the maximum rotation speed is 9 rpm, and the maximum driving speed is 120 mm/min.
The cutter-head of double-shield TBM adopts an integral panel structure, the excavation diameter of which is 6.31 m. The cutter-head shown in Figure 3 is equipped with 4 center cutters (#1–#8), 23 face cutters (#9–#31), and 12 gauge cutters (#32–#43). All of the disc cutters are 19 inches, the diameters of which are 483 mm. At the same time, there are also six buckets symmetrically distributed on the cutter-head so that the excavated slags can be transferred to the belt conveyor in time.

3. Monitoring Program

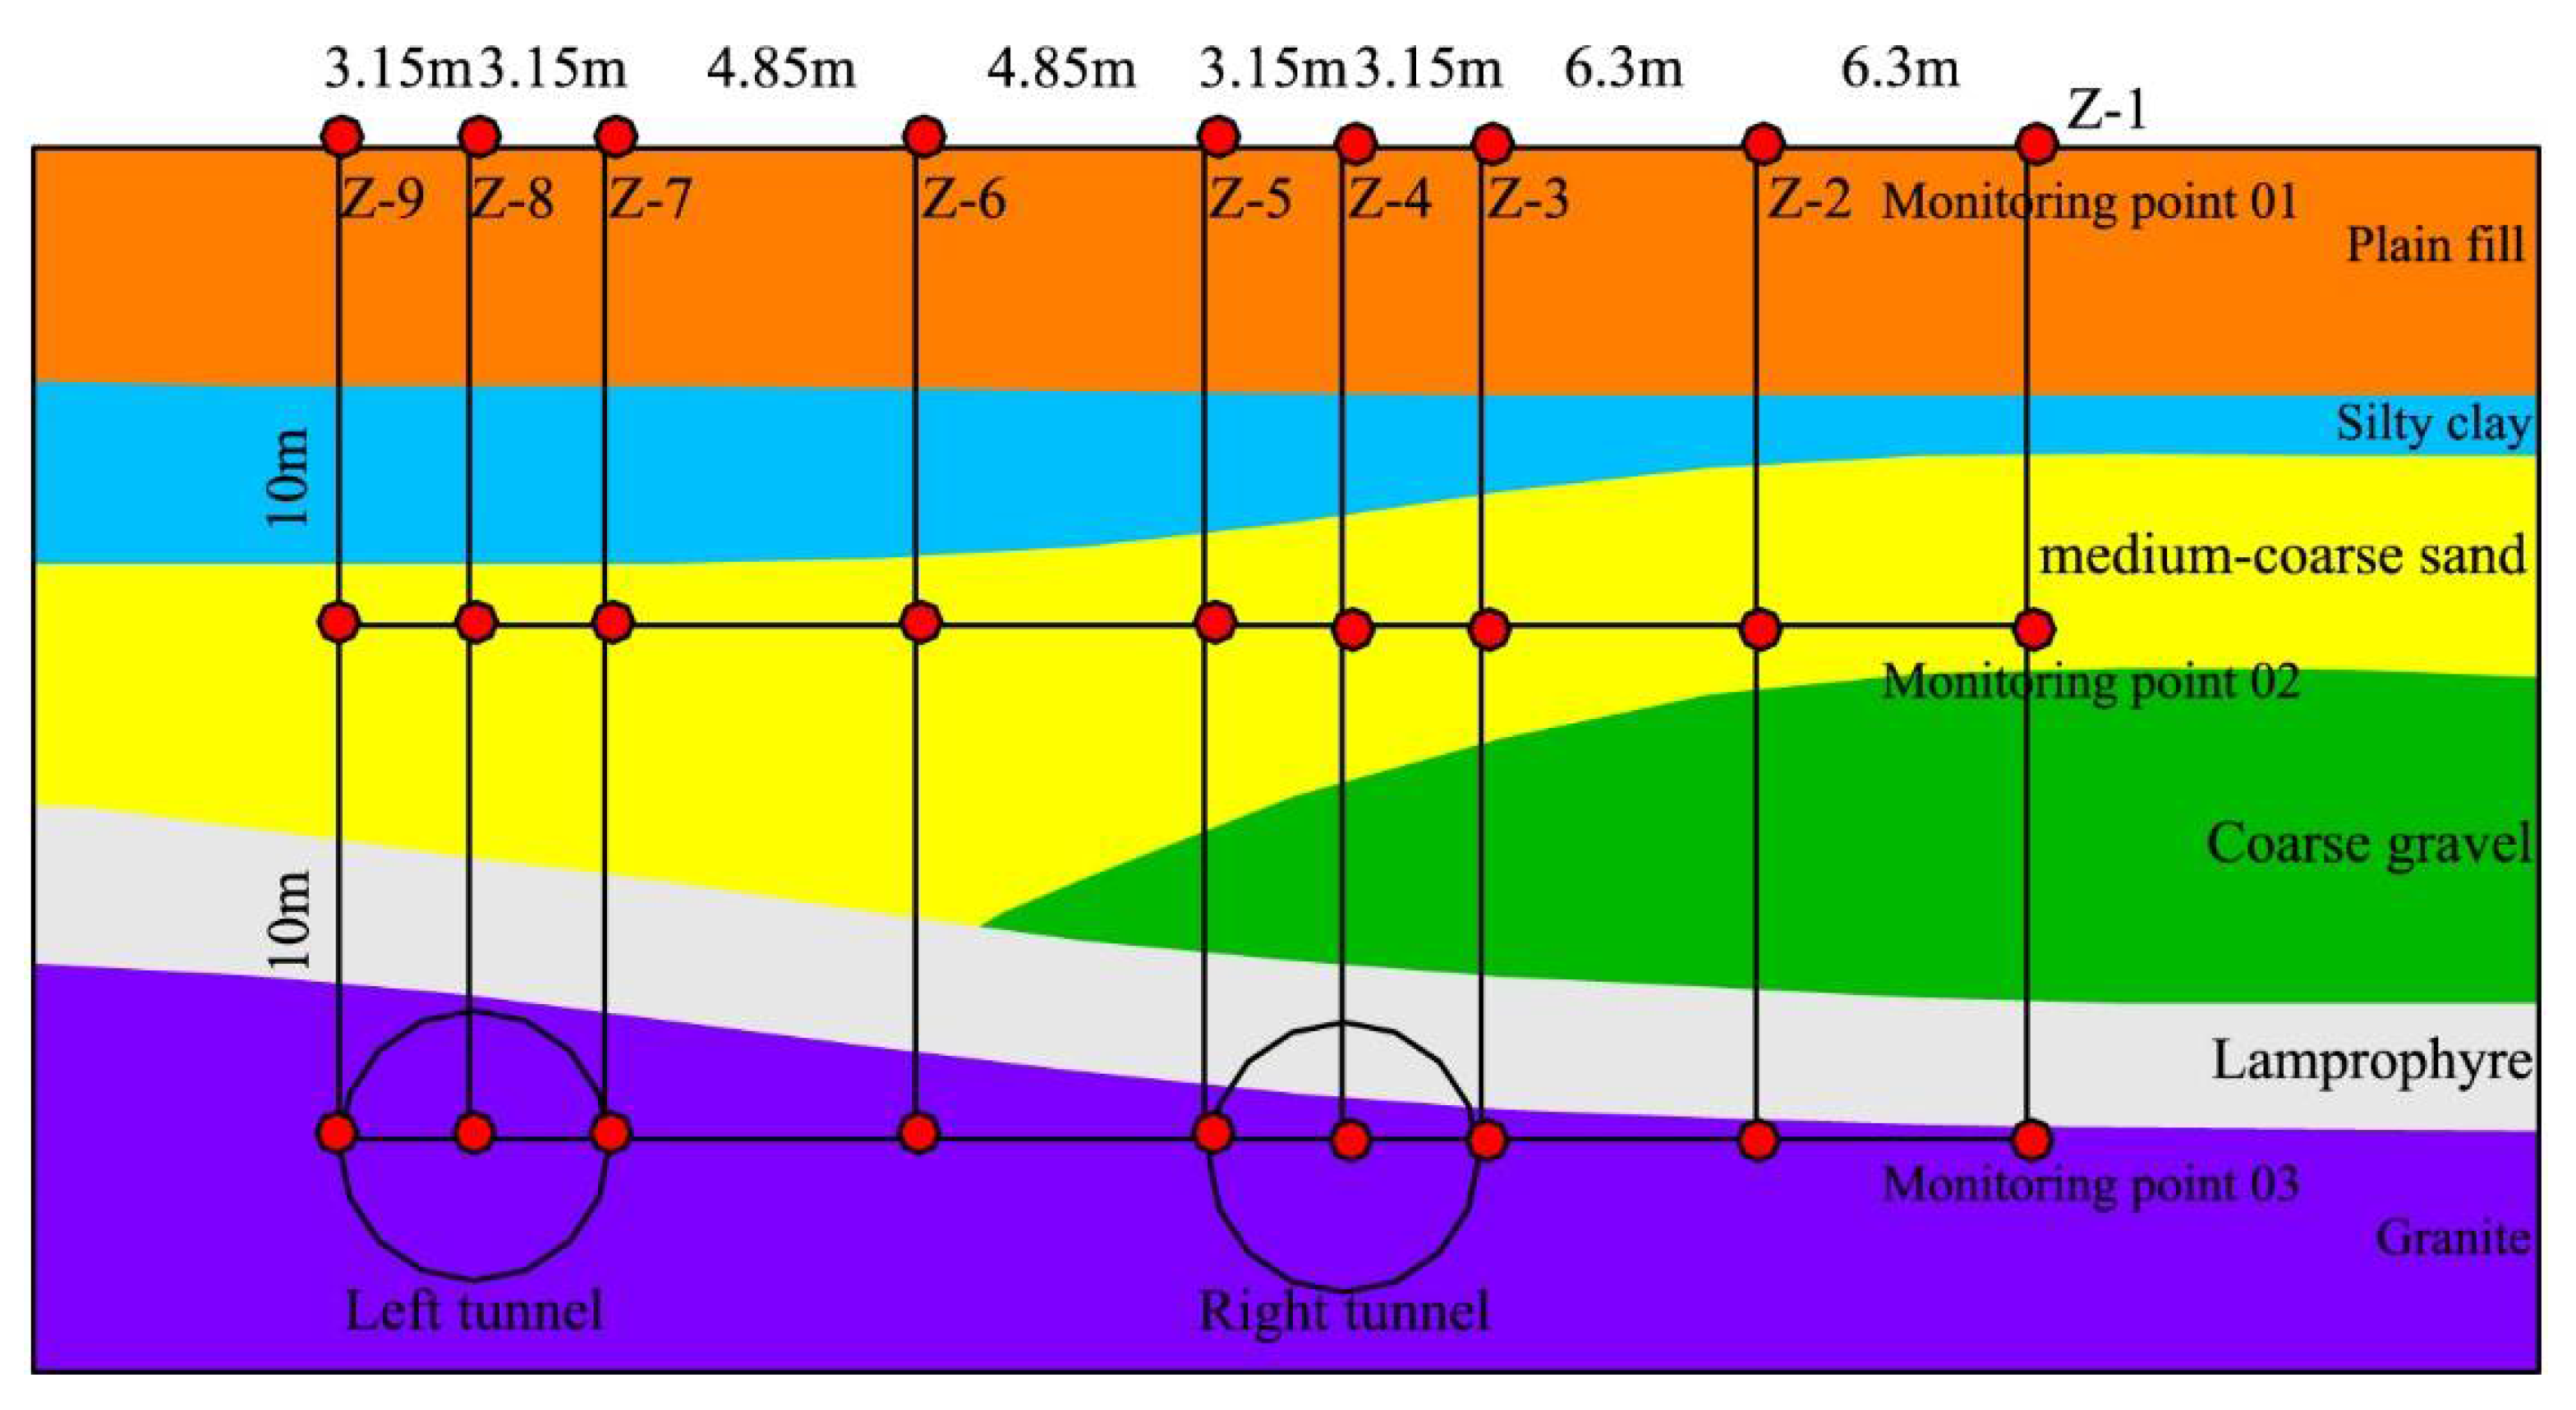
3.1. Plan of Vibration Monitoring

The vibration monitoring uses low-frequency vibration sensors (JX941) and a dynamic signal acquisition instrument (HC-1000) provided by Anhui Hengxin Hongce Electronic Technology Co., Ltd., (Hefei, China). By using passive closed-loop servo technology, the vibration sensors have good low-frequency characteristics. At the same time, there is an IPX8 waterproof steel cylinder outside the sensor, which can be used for vibration monitoring in deep holes. The technical parameters of the vibration sensor are shown in Table 1. This monitoring uses vibration sensors to pick up the acceleration of vibration signals. First, the vibration signal is converted into an electrical signal in the sensors. Then, the electrical signal is transmitted to a signal acquisition instrument through the cable. After the signal is interpreted by the signal acquisition instrument, the monitoring data are transmitted to the computer for viewing and storage. The principle of vibration monitoring is shown in Figure 4.
The mileage number of DK19 + 678.5 is selected as the vibration monitoring section, which is perpendicular to the axes of two tunnels. A total of nine sampling holes are arranged in the monitoring section. Meanwhile, the sampling holes are named Z-1–Z-9 from right to left. Among them, Z-4 and Z-8 are located above the vaults of the right and left tunnels, respectively. The spacing of each sampling hole is 0.5–1 times the tunnel diameter. Except for Z-4 and Z-8, which have a depth of 17 m, the depths of other sampling holes are 21 m.
There are three monitoring points arranged in each sampling hole. The three monitoring points are located at a depth of 0, 10 m, and at the bottom of the sampling holes. The measuring point layout of the vibration monitoring is shown in Figure 5. The sensors of three monitoring points are named 01, 02, and 03 from top to bottom. Moreover, the sensor of each measuring point can monitor three directions of X, Y, and Z. The X and Y-directions are parallel to the tunnel axis and tunnel radial direction, respectively, and the Z-direction is perpendicular to the horizontal direction. Therefore, there are a total of 27 sensors in the vibration monitoring section.

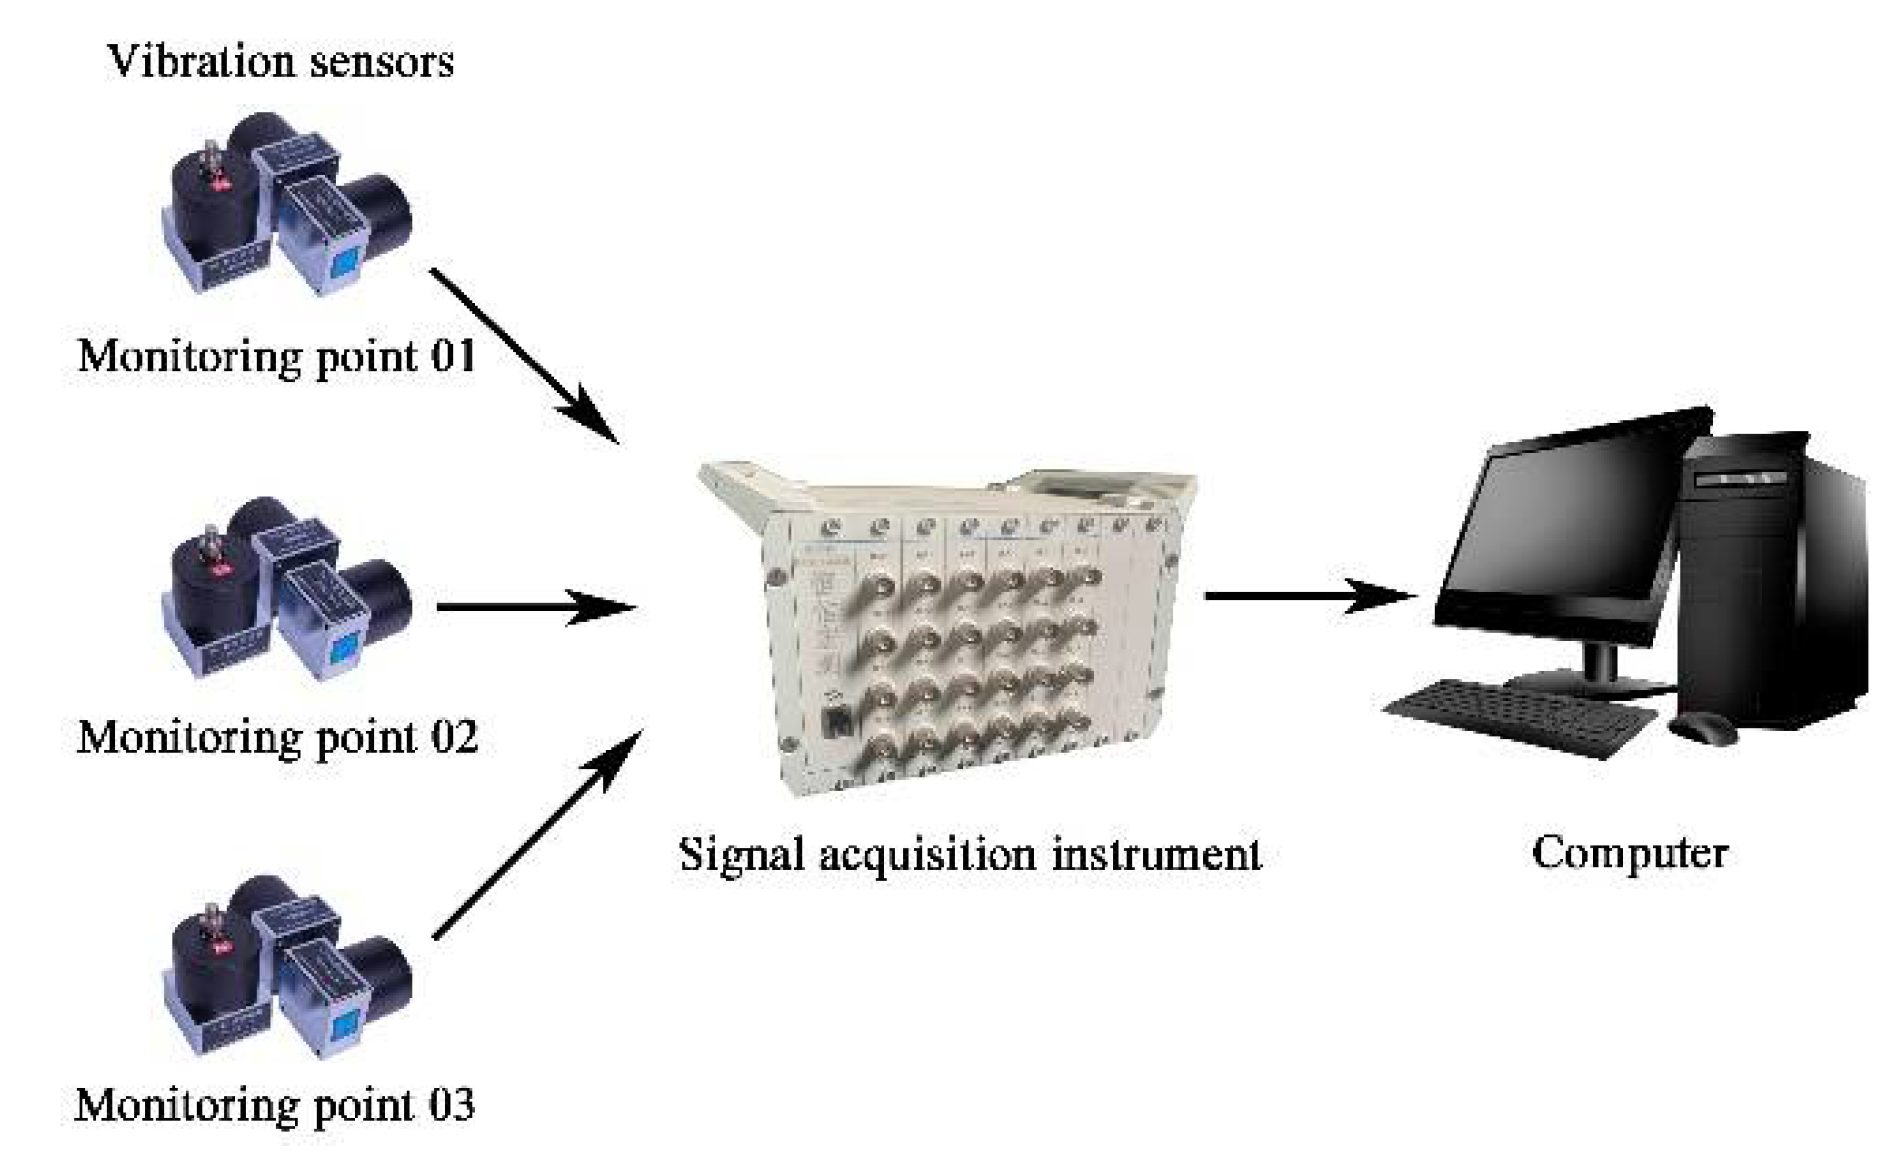
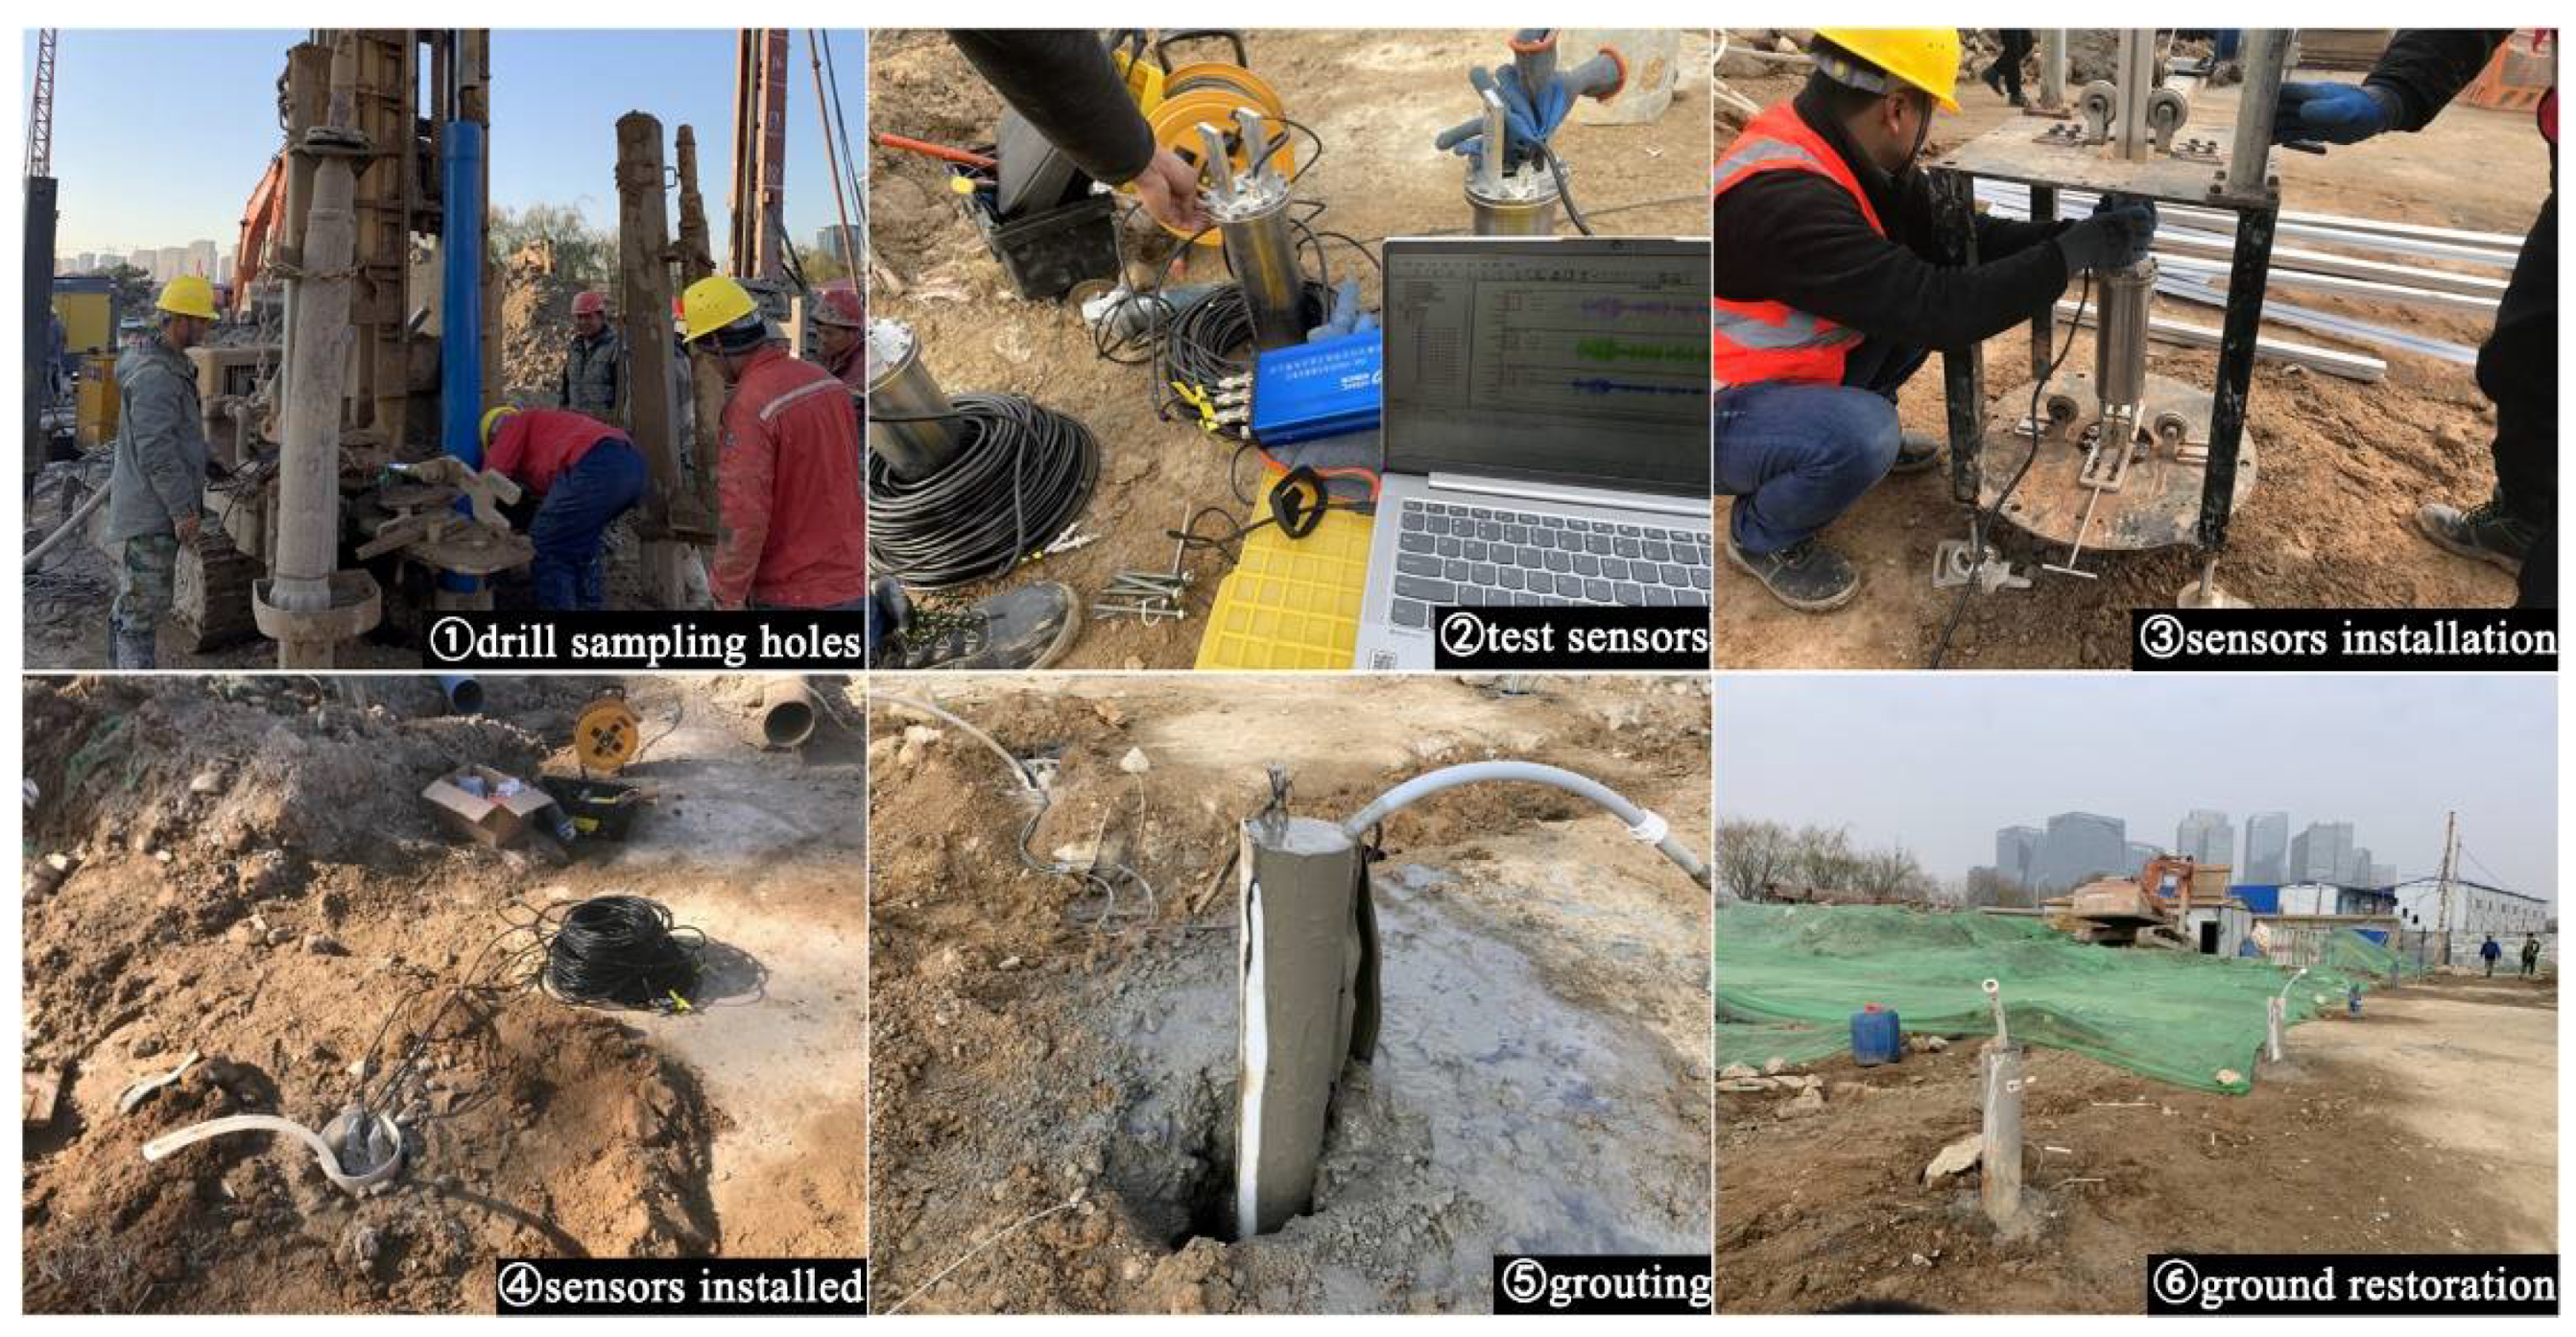
3.2. Installation of Vibration Sensors

At first, the positions of sampling holes Z-1 to Z-9 on the ground are determined by using the total station. In order to prevent the collapse of the sampling holes, the air drill is used to drill the sampling holes with an iron pipe. Then, a smaller-diameter PVC pipe is put into the sampling hole to replace the iron pipe after drilling to the fixed depth. Subsequently, the anti-collapse iron pipe is pulled out. It should be pointed out that sampling hole Z-1 cannot be drilled due to site restrictions. Next, the sensors are installed sequentially from bottom to top through a proprietary unloading rack. Before installing, the performance of the sensors should be tested. Moreover, the three sensors in the same sampling hole are fixedly connected by an aluminum rod. When all three sensors reach their predetermined position, the compass is used to calibrate the sensor orientation. It can be confirmed that the X-direction is parallel to the tunnel axis in this way. The sampling holes are plugged with cement slurry after all sensors are installed. Finally, the cables connecting the sensors and dynamic signal acquisition instrument are buried in the trench to prevent damage during ground construction. The installation process of the sensors is shown in Figure 6.
HXHC dynamic signal monitoring test analysis software (Version 11.7.0), which was developed by Anhui Hengxin Hongce Electronic Technology Co., Ltd. (Hefei, China), is installed on the computer connected to the dynamic signal acquisition instrument. By using the software, the initial sensitivities of the sensors are set. The sampling frequency is set to 128 Hz at the same time. What is more, the signal acquisition method is continuous acquisition, and the data are saved hourly. This vibration monitoring uses the signal acquisition instrument with 32 signal channels. According to the vibration monitoring scheme, there are 72 vibration signals to be acquired in the entire monitoring section. Thus, three signal acquisition instruments are required. For instance, signal channel 1-10 only means that the vibration signal of this measuring point is collected by the tenth channel of the first signal acquisition instrument. The signal channels corresponding to monitoring points are shown in Table 2 below.

4. Analysis of Vibration Monitoring Results of Double-Shield TBM Construction

According to the construction situation on site, the right tunnel reaches the monitoring section first. The vibration data generated by the right tunnel’s construction are selected to study the time domain and frequency domain characteristics of the vibration signals when the double-shield TBM reaches the monitoring section DK19 + 678.5.

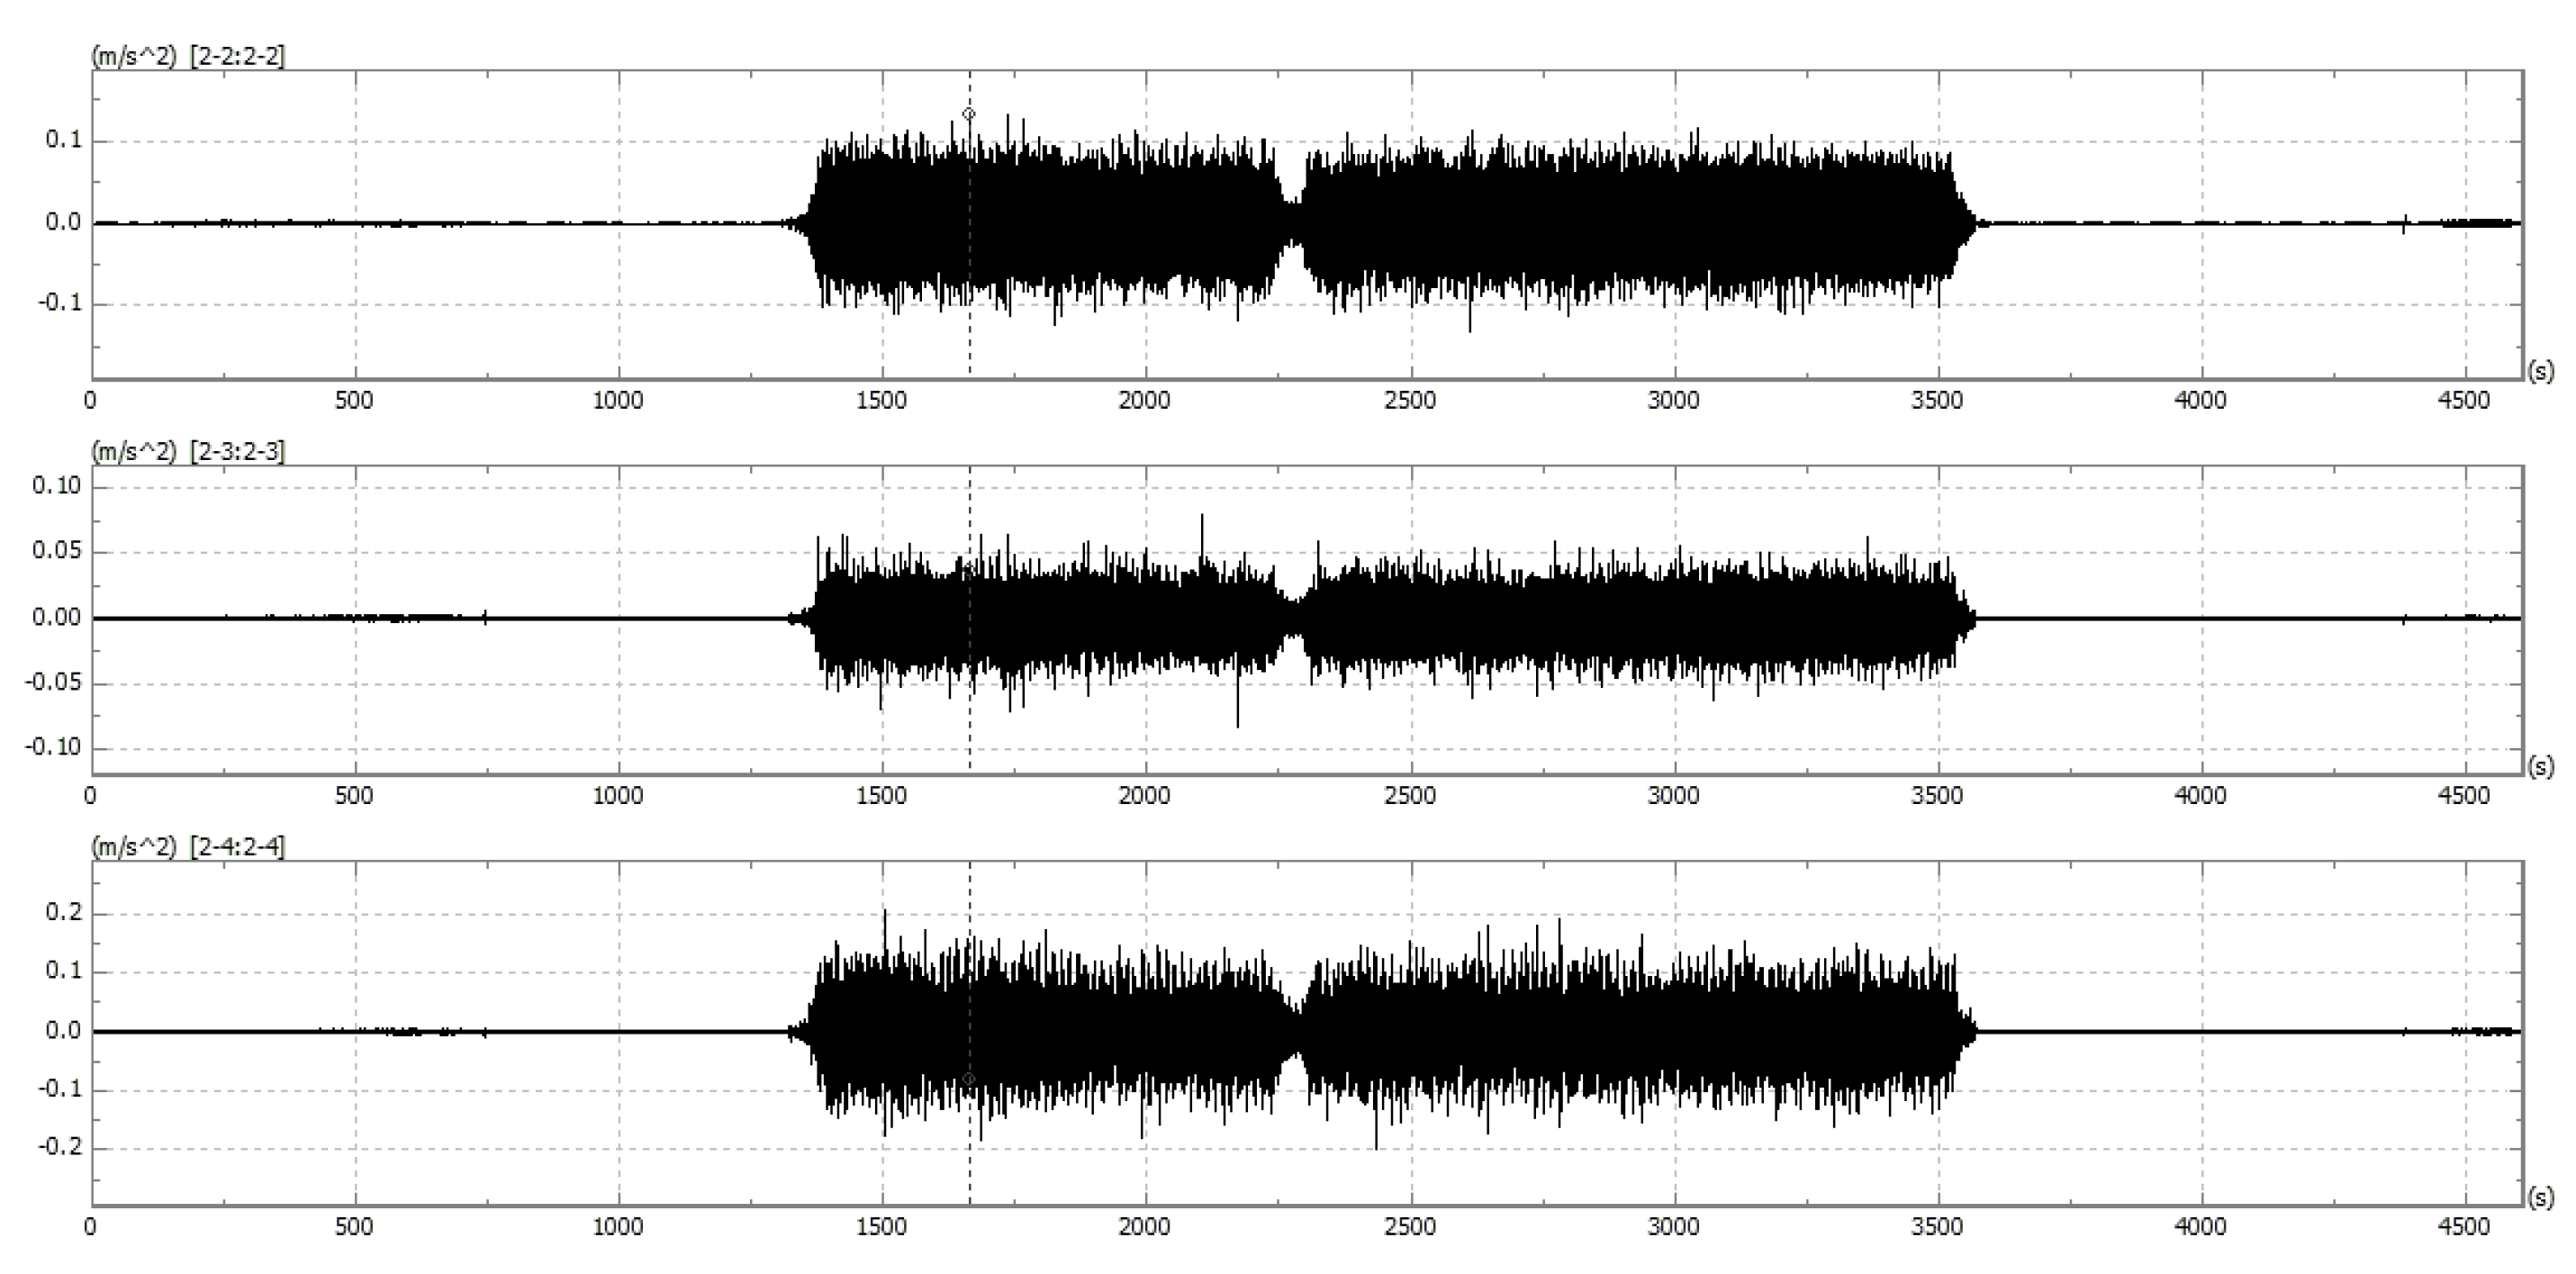
4.1. Time-Domain Analysis of Vibration Monitoring Results

When the double-shield TBM reached the monitoring section, it was advancing toward the 1091st ring. In order to get the magnitude of construction vibration as realistic as possible, the measuring point 03 of sampling hole Z-4 above the tunnel vault is selected to analyze the time-domain characteristics of the double-shield TBM excavation. The X, Y, and Z-directions of this monitoring point correspond to the signal channels 2-2, 2-3, and 2-3, respectively. The time-domain curve of monitoring point Z-4 03 is shown in Figure 7 below.
Judging from the vibration acceleration amplitude in the X, Y, and Z-directions, the peak value of the vibration acceleration in the Z-direction at the vibration source is 207.60 mm/s2, the peak value of the Y-direction is 81.16 mm/s2, and X-direction is 133.54 mm/s2. In other words, the vibration acceleration generated by double-shield TBM construction is largest in the vertical direction and smallest in the radial direction of the tunnel.
As seen from the above time-domain curves, the vibration acceleration value is about 1–2 mm/s2, from 0 to 1320 s and 3580 to 2608 s. At this time, the double-shield TBM is in a non-excavating state. However, from 1032 to 3580 s, when the double-shield TBM is in an excavating state, the vibration acceleration value increases first. Subsequently, it reaches a steady state. After 3500 s, it rapidly reduces to the non-excavating vibration level. It can clearly be seen that the vibration value of double-shield TBM in the excavating state is 100–150 times larger than that in the non-excavating state. That is to say, the vibration of double-shield TBM construction is mainly caused by excavation. Moreover, the vibration caused by the non-excavation construction process, including the operation of the muck truck, segment assembly, etc., can be ignored.
From the time-domain curves of vibration acceleration in the excavating state, the vibration caused by the double-shield TBM construction can be divided into three stages: rising stage, stable stage, and falling stage. The vibration of the rising stage and falling stage is synchronized with the rotation speed; it may be related to tunneling parameters. Moreover, peak acceleration appears in the stable stage. Considering the most unfavorable factor of vibration during double-shield TBM construction, the peak acceleration is taken as the representative value of each ring excavation.

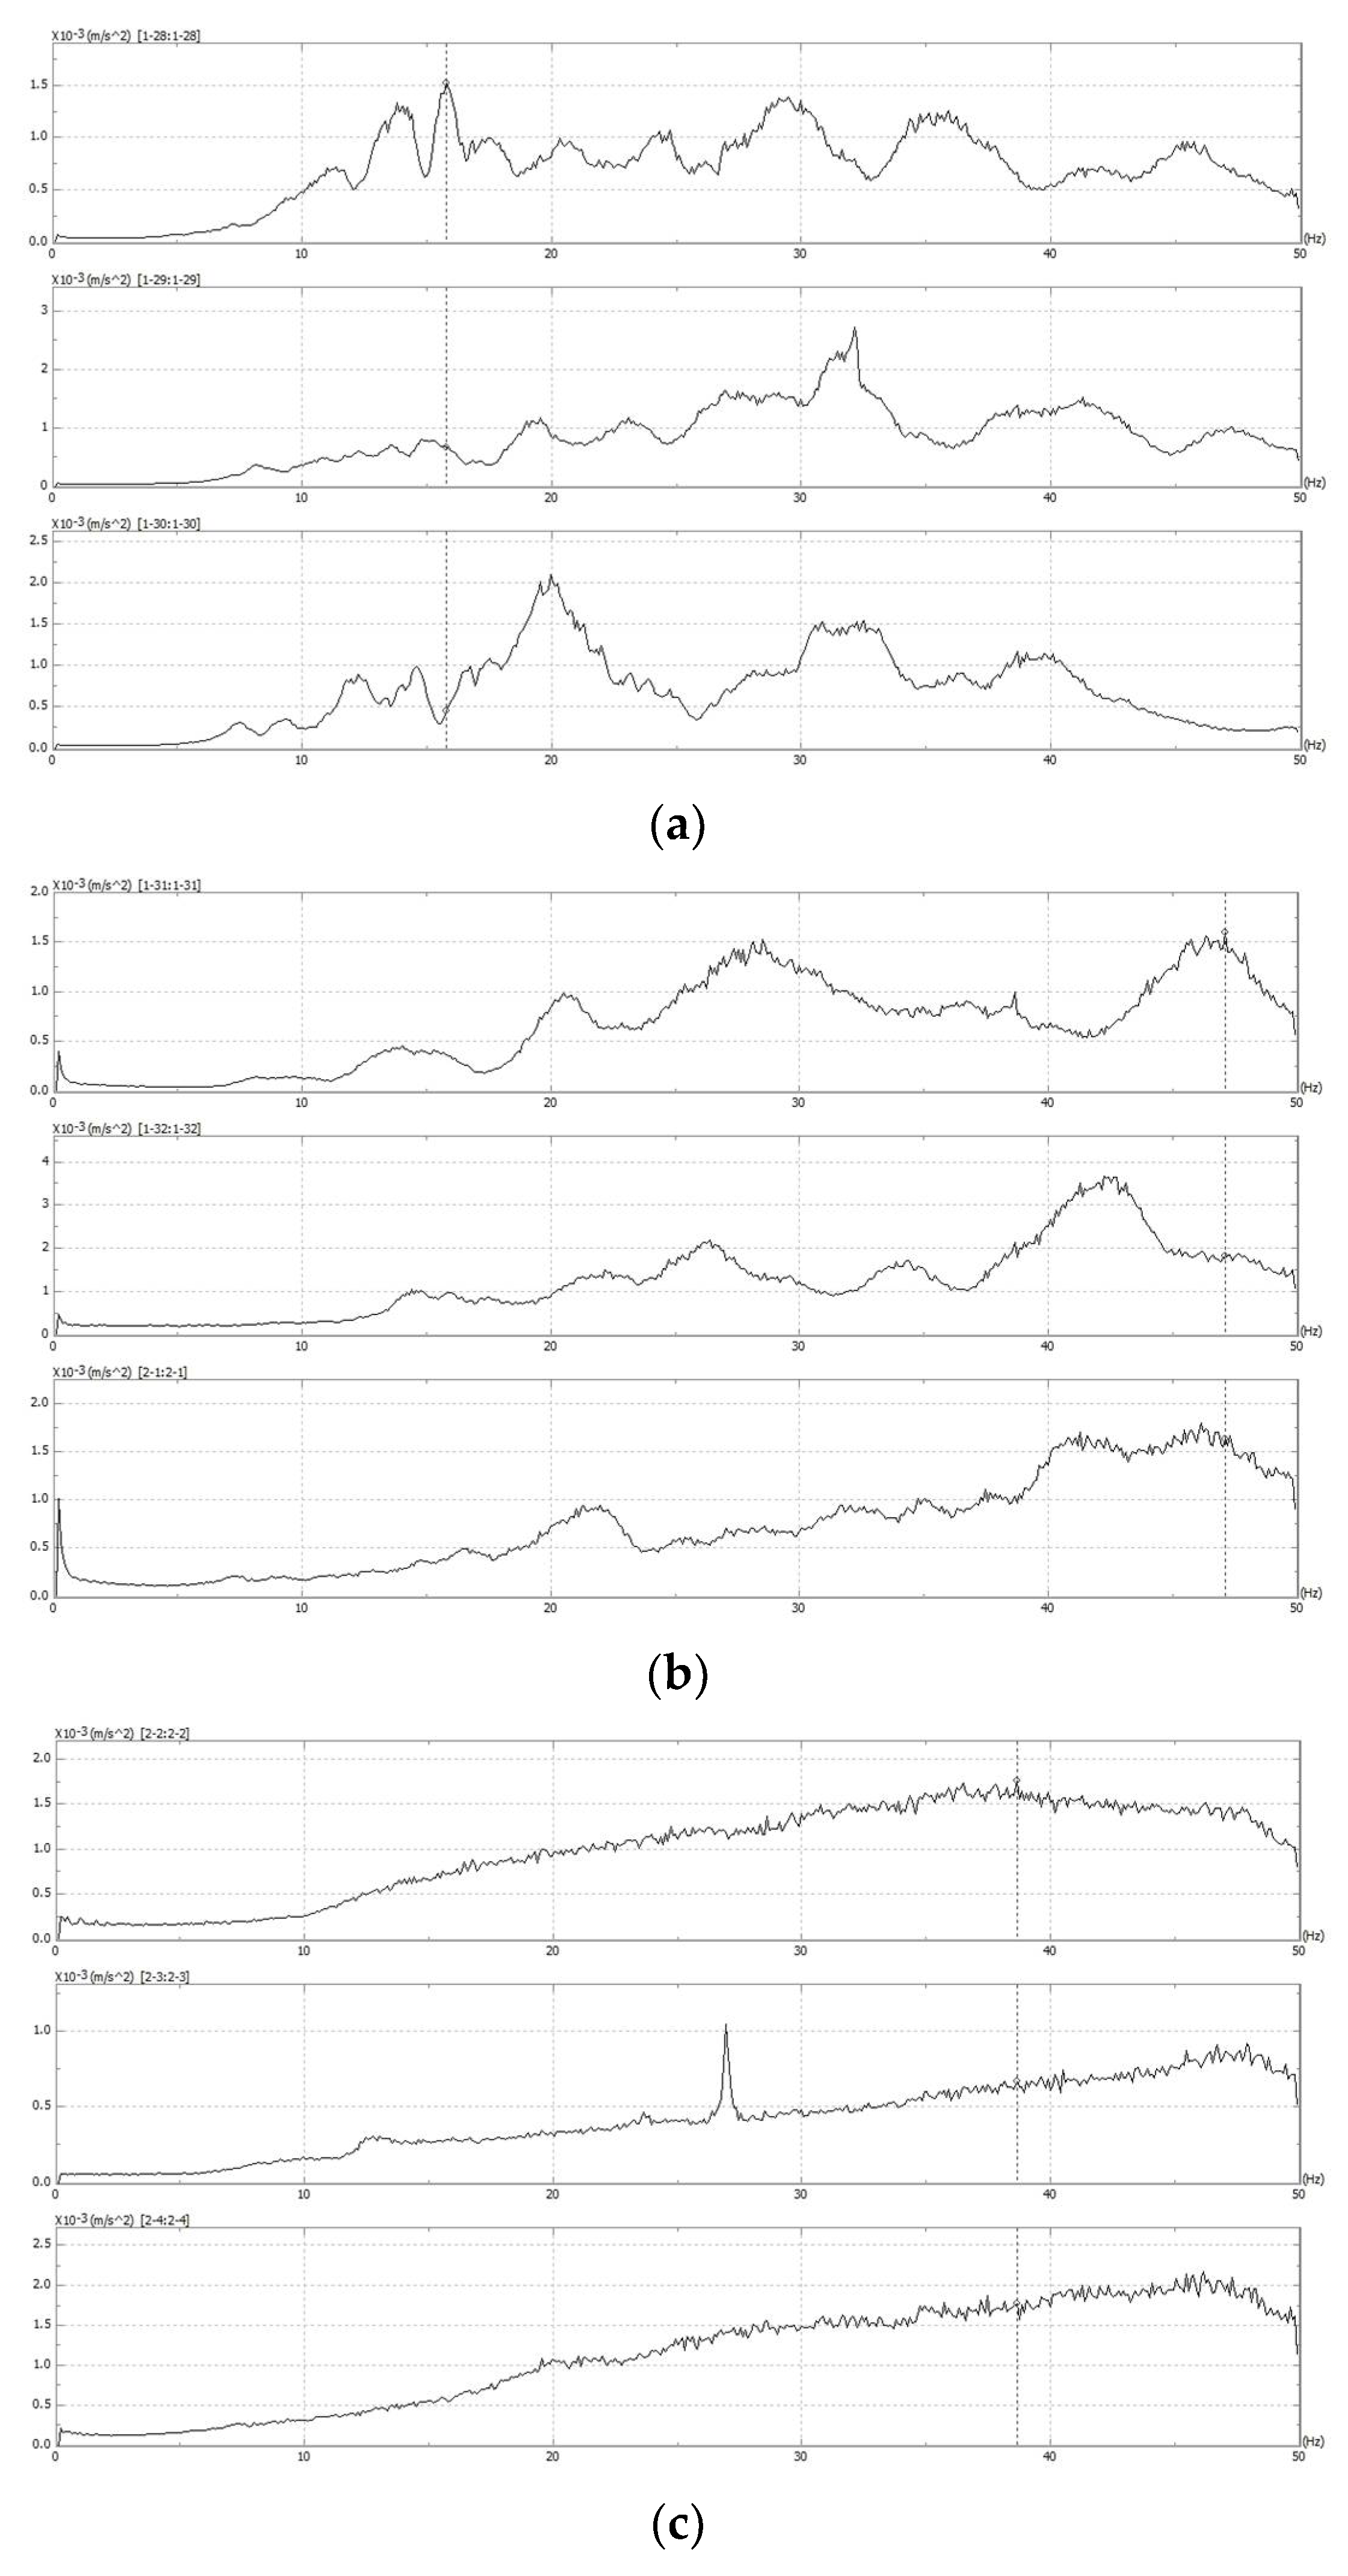
4.2. Frequency Analysis of Vibration Monitoring Results

The sampling hole Z-4 is located above the right tunnel vault, and the three measuring points of Z-4 are selected for frequency analysis. Through the fast Fourier transform [32,33] of the vibration data, the frequency spectrums of the three measuring points are obtained. The three measuring points’ frequency spectrums of sampling hole Z-4 are shown in Figure 8.
From Figure 8a, we can note that the peak of the amplitude spectrum is located at 15.72 Hz in the X-direction (Channel 1-28), the peak in the Y direction (Channel 1-29) is 32.13 Hz, and the Z-direction (Channel 1-30) is 19.92 Hz. Seeing the whole frequency range, the vibration frequency of measuring point 01 is mainly distributed in 10–40 Hz. However, the obvious difference is that the frequency of measuring point 02 is distributed in 20–50 Hz, and the amplitude spectrum peaks in the X, Y, and Z-directions are located at 40–50 Hz, as seen in Figure 8b. As can be seen in Figure 8c, the frequency of measuring point 03 is distributed in 10~–0 Hz. However, the frequency spectrums in the X, Y, and Z-directions have no obvious peaks. In addition, it can be obtained that the vibration acceleration amplitude increases with frequency. It is significantly different from the frequency in medium and coarse sand and plain fill.
Comparing the frequency spectrums in the X, Y, and Z-directions, it can be clearly seen that spectrums in the same rock mass are basically approximate. Combined with the strata where the measuring points are buried, we can obtain that the main vibration frequency of the plain fill is 20–30 Hz, and the main frequency of medium and coarse sand is 40–50 Hz.

5. Research on Vibration Influence Range of Double-Shield TBM Construction

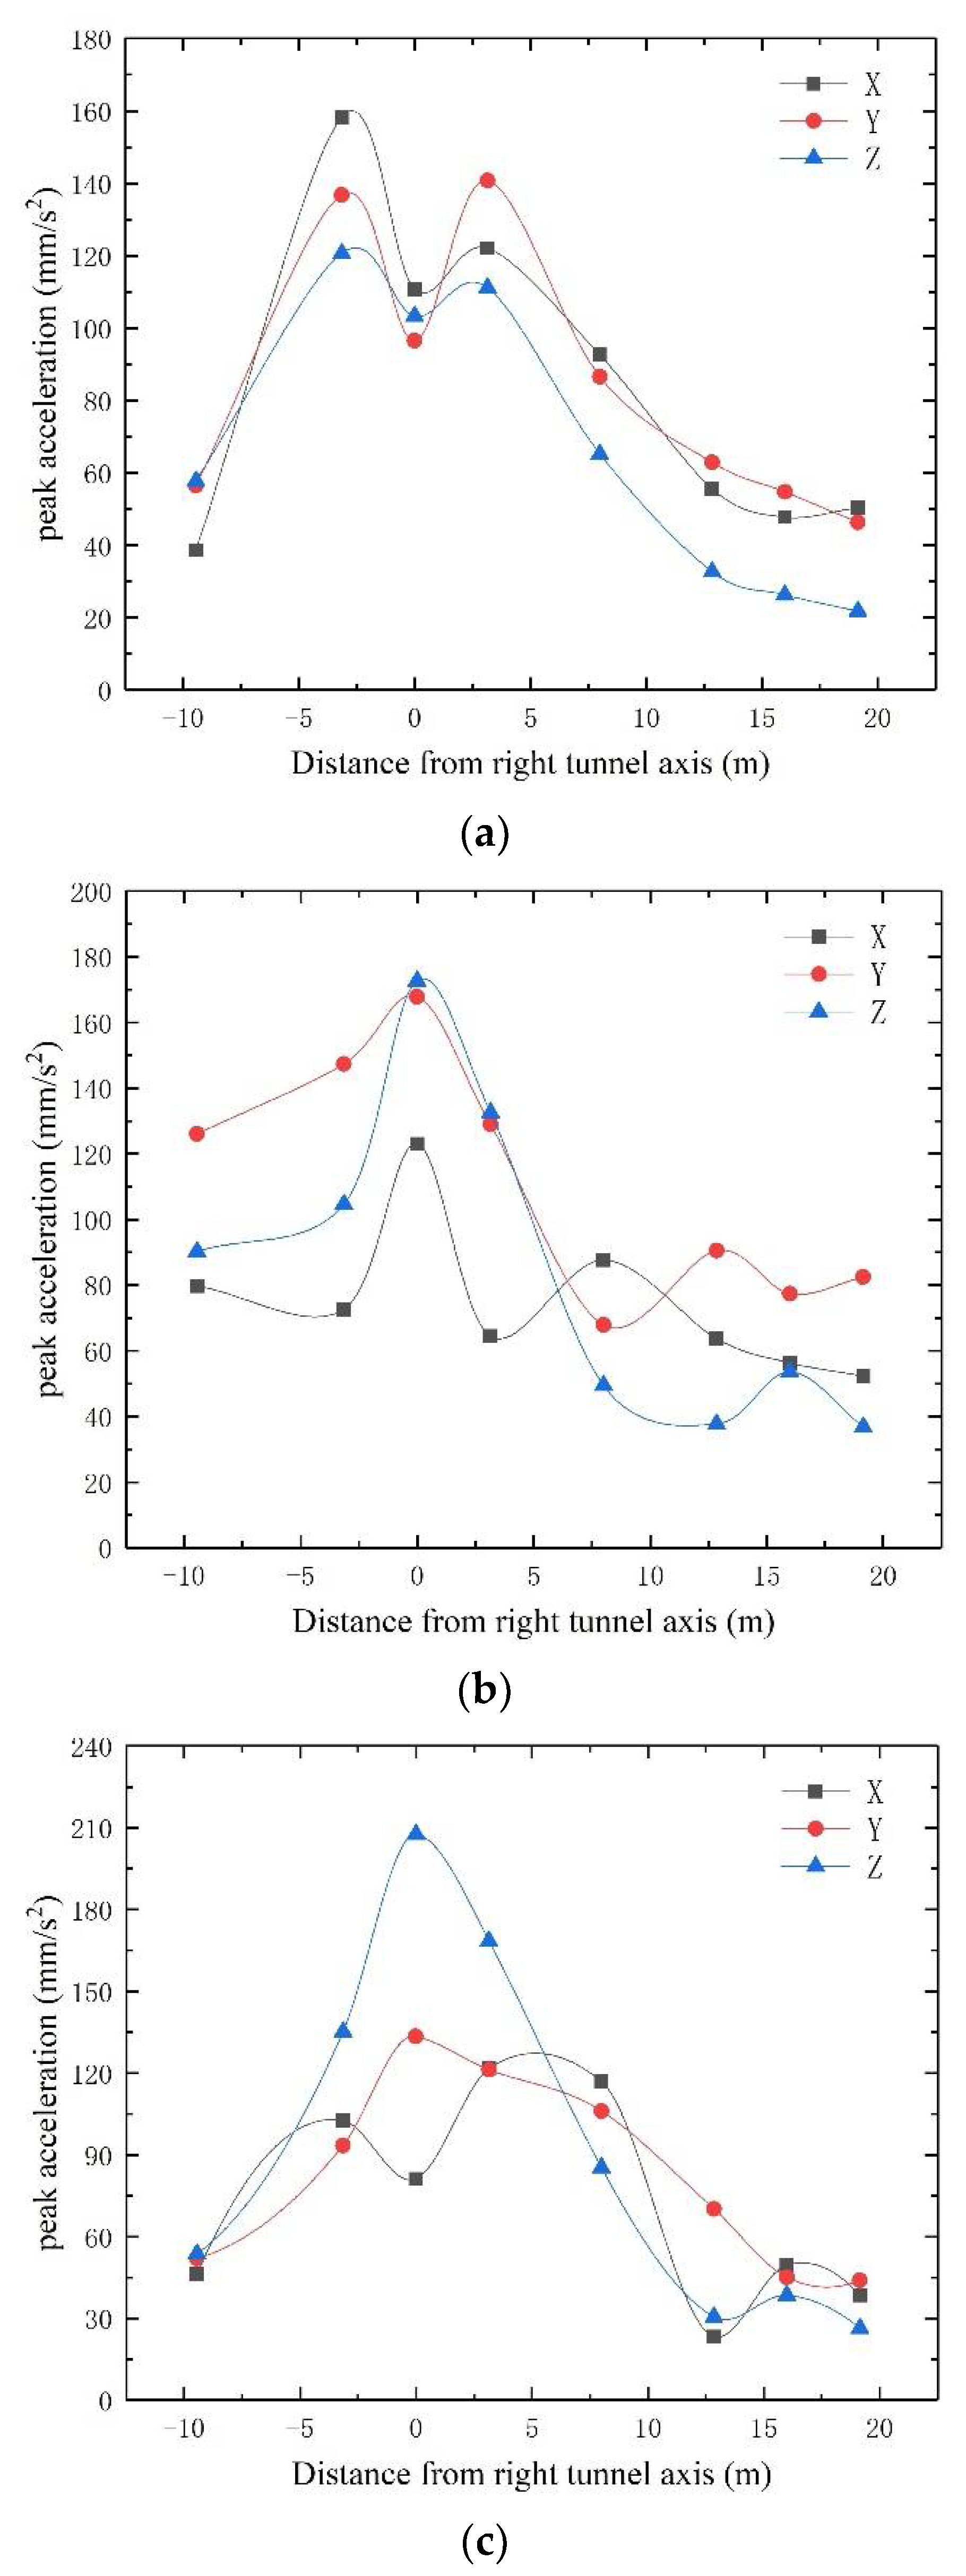
5.1. The Transverse Vibration Trend of Double-Shield TBM Construction

When the double-shield TBM reaches the monitoring section, the cutter-head is located directly below the measuring points, and the vibration peak acceleration is relatively large. Therefore, the vibration data at this time are selected to study the influence trend of double-shield TBM construction in the transverse section. Through time-domain curve analysis, the peak accelerations of all measuring points are obtained, as shown in Table 3 below.
As can be seen from Table 3, the maximum peak acceleration of the surface measuring point 01 is 158.19 mm/s2, which occurs in sampling hole Z-3. The direction of the maximum peak acceleration is the Y-direction, perpendicular to the tunnel axis. However, in measuring point 02 with a depth of 10 m, the maximum peak acceleration is at sampling hole Z-4, the value of which is 172.68 mm/s2. The difference is that the direction of maximum peak acceleration is the Z-direction. Moreover, the peak acceleration of this measuring point in the X-direction is second only to the Z-direction, the value of which is 167.8 mm/s2. Similarly, when the buried depth of the measuring point is 20 m, the maximum peak acceleration is 207.60 mm/s2 in sampling hole Z-4, in the Z-direction. It can be seen that the maximum peak acceleration mainly occurs in the vertical Z-direction when double-shield TBM passes through the monitoring section.
According to the above results of vibration monitoring, the three groups of peak acceleration curves with different burial depths are plotted as follows.
From Figure 9a, we can see that the peak acceleration in the X, Y, and Z-directions are comparable, and the peak acceleration values of the sampling holes close to the tunnel axis, for instance, Z-3, Z-4, and Z-5 are significantly larger than several other sampling holes. Moreover, the farther measuring points are from the tunnel axis, the smaller the peak acceleration. The same rule can also be obtained at measuring points with a depth of 10 and 20 m, as shown in Figure 9b,c. However, there is a significant difference in peak acceleration between the three different buried depths in the Z-direction. As shown in Figure 9c, the peak acceleration in the Z-direction is significantly larger than that in the X and Y-directions when the sampling holes are close to the tunnel axis. As the buried depths of measuring points become smaller, the peak accelerations in the Z-direction gradually decrease. The reason is that the peak acceleration decays as it propagates from deep to shallow. Furthermore, in sampling holes far from the tunnel’s axis, such as Z-7, Z-8, and Z-9, the peak accelerations are amplified in the sand at the buried depth of 10 m.

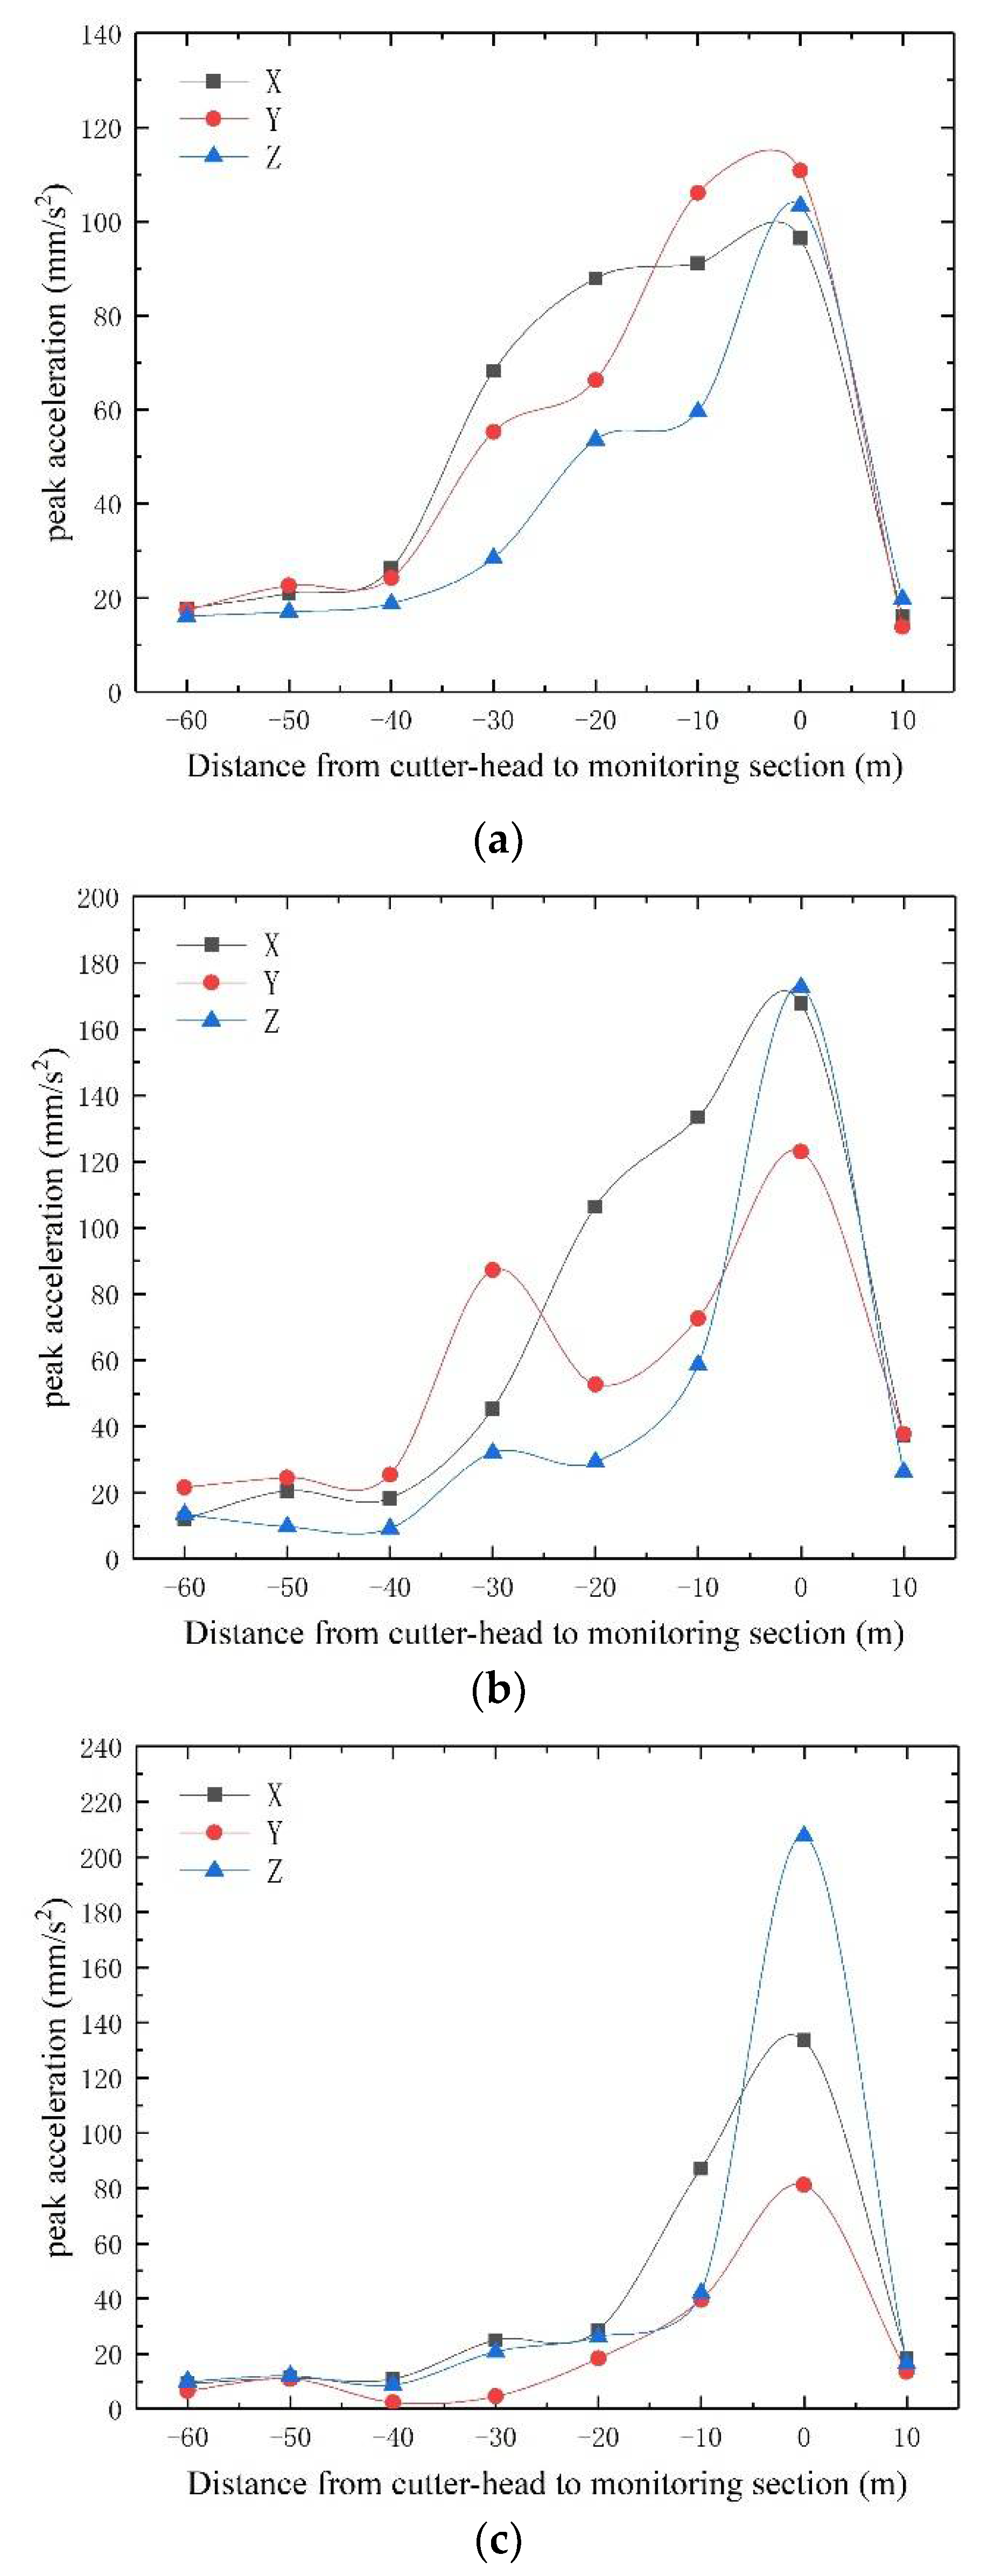
5.2. The Longitudinal Vibration Trend of Double-Shield TBM Construction

To study the vibration influence trend caused by double-shield TBM construction in the longitudinal section, the peak accelerations with a distance of −60, −50, −40, −30, −20, −10, 0, and 10 m from the TBM cutter-head to the monitoring section are obtained. It should be pointed out that the distance that the cutter-head does not reach in the monitoring section is negative, and where the cutter-head passes through in the monitoring section is positive. As mentioned before, this paper studies the vibration acceleration generated by the right tunnel’s construction, and sampling hole Z-4 is located on the axis of the right tunnel. What is more, it is the closest sampling hole to the cutter-head on the monitoring section. Therefore, we select sampling hole Z-4 as a representative to study the longitudinal vibration trend of double-shield TBM construction. Table 4 presents the peak accelerations of sampling hole Z-4 with different longitudinal distances.
As seen from the above table, the maximum peak acceleration in the X-direction occurs at a depth of 10 m when the cutter-head is 0 m away from the monitoring section; the maximum peak acceleration is 167.80 mm/s2. At the same time, the maximum peak acceleration in the Y-direction also reaches the maximum value at this measuring point, the value of which is 122.97 mm/s2. Unlike this, in the Z-direction, the maximum peak acceleration is located at a depth of 20 m, in the measuring point that is the closest to the cutting face.
Comparing the monitoring results at different distances, we can see that the maximum peak acceleration of all the measuring points occurs at 0 m, regardless of the burial depth and direction. That is, when the double-shield TBM cutter-head crosses the monitoring section, the vibration peak accelerations reach maximum values. After the cutter-head passes through the monitoring section, the peak acceleration decreases rapidly. The reason is that there is a cavity between the double-shield TBM and the surrounding rock, which has a shock absorption effect to a certain extent.
The vibration monitoring results of different longitudinal distances from the cutter-head to the monitoring section are arranged according to the buried depth, as shown in Figure 10 below.
According to Figure 10a, we can obtain that the peak acceleration increases first and then decreases over the period when the cutter-head is 60 m away from the monitoring section to 10 m passing through the monitoring section. Among them, the peak acceleration reaches the maximum when the cutter-head reaches the monitoring section. After passing through the monitoring section, the acceleration peak decreases rapidly. It is worth noting that we can also get this rule from Figure 10b,c. The reason is that after the double-shield TBM passes through the monitoring section, there is a cavity between the TBM shield and the surrounding rock, which plays a certain role in shock absorption. What is more, the increase in peak acceleration is generally small when the distance between the cutter-head and monitoring section is from 60 to 40 m. When this distance is less than 40 m, the increase in peak acceleration is more obvious.
Comparing the measuring points at 0 and 10 m depths, the peak acceleration at a depth of 20 m is smaller at −40–−20 m. It can be seen that the peak acceleration decreases with the increase in burial depth when the cutter-head is −40–−20 m away from the monitoring section. When the distance is less than 10 m, the peak acceleration changes the most in the Z-direction, and the deeper the measuring point is buried, the greater the increase in the peak acceleration in the Z-direction.

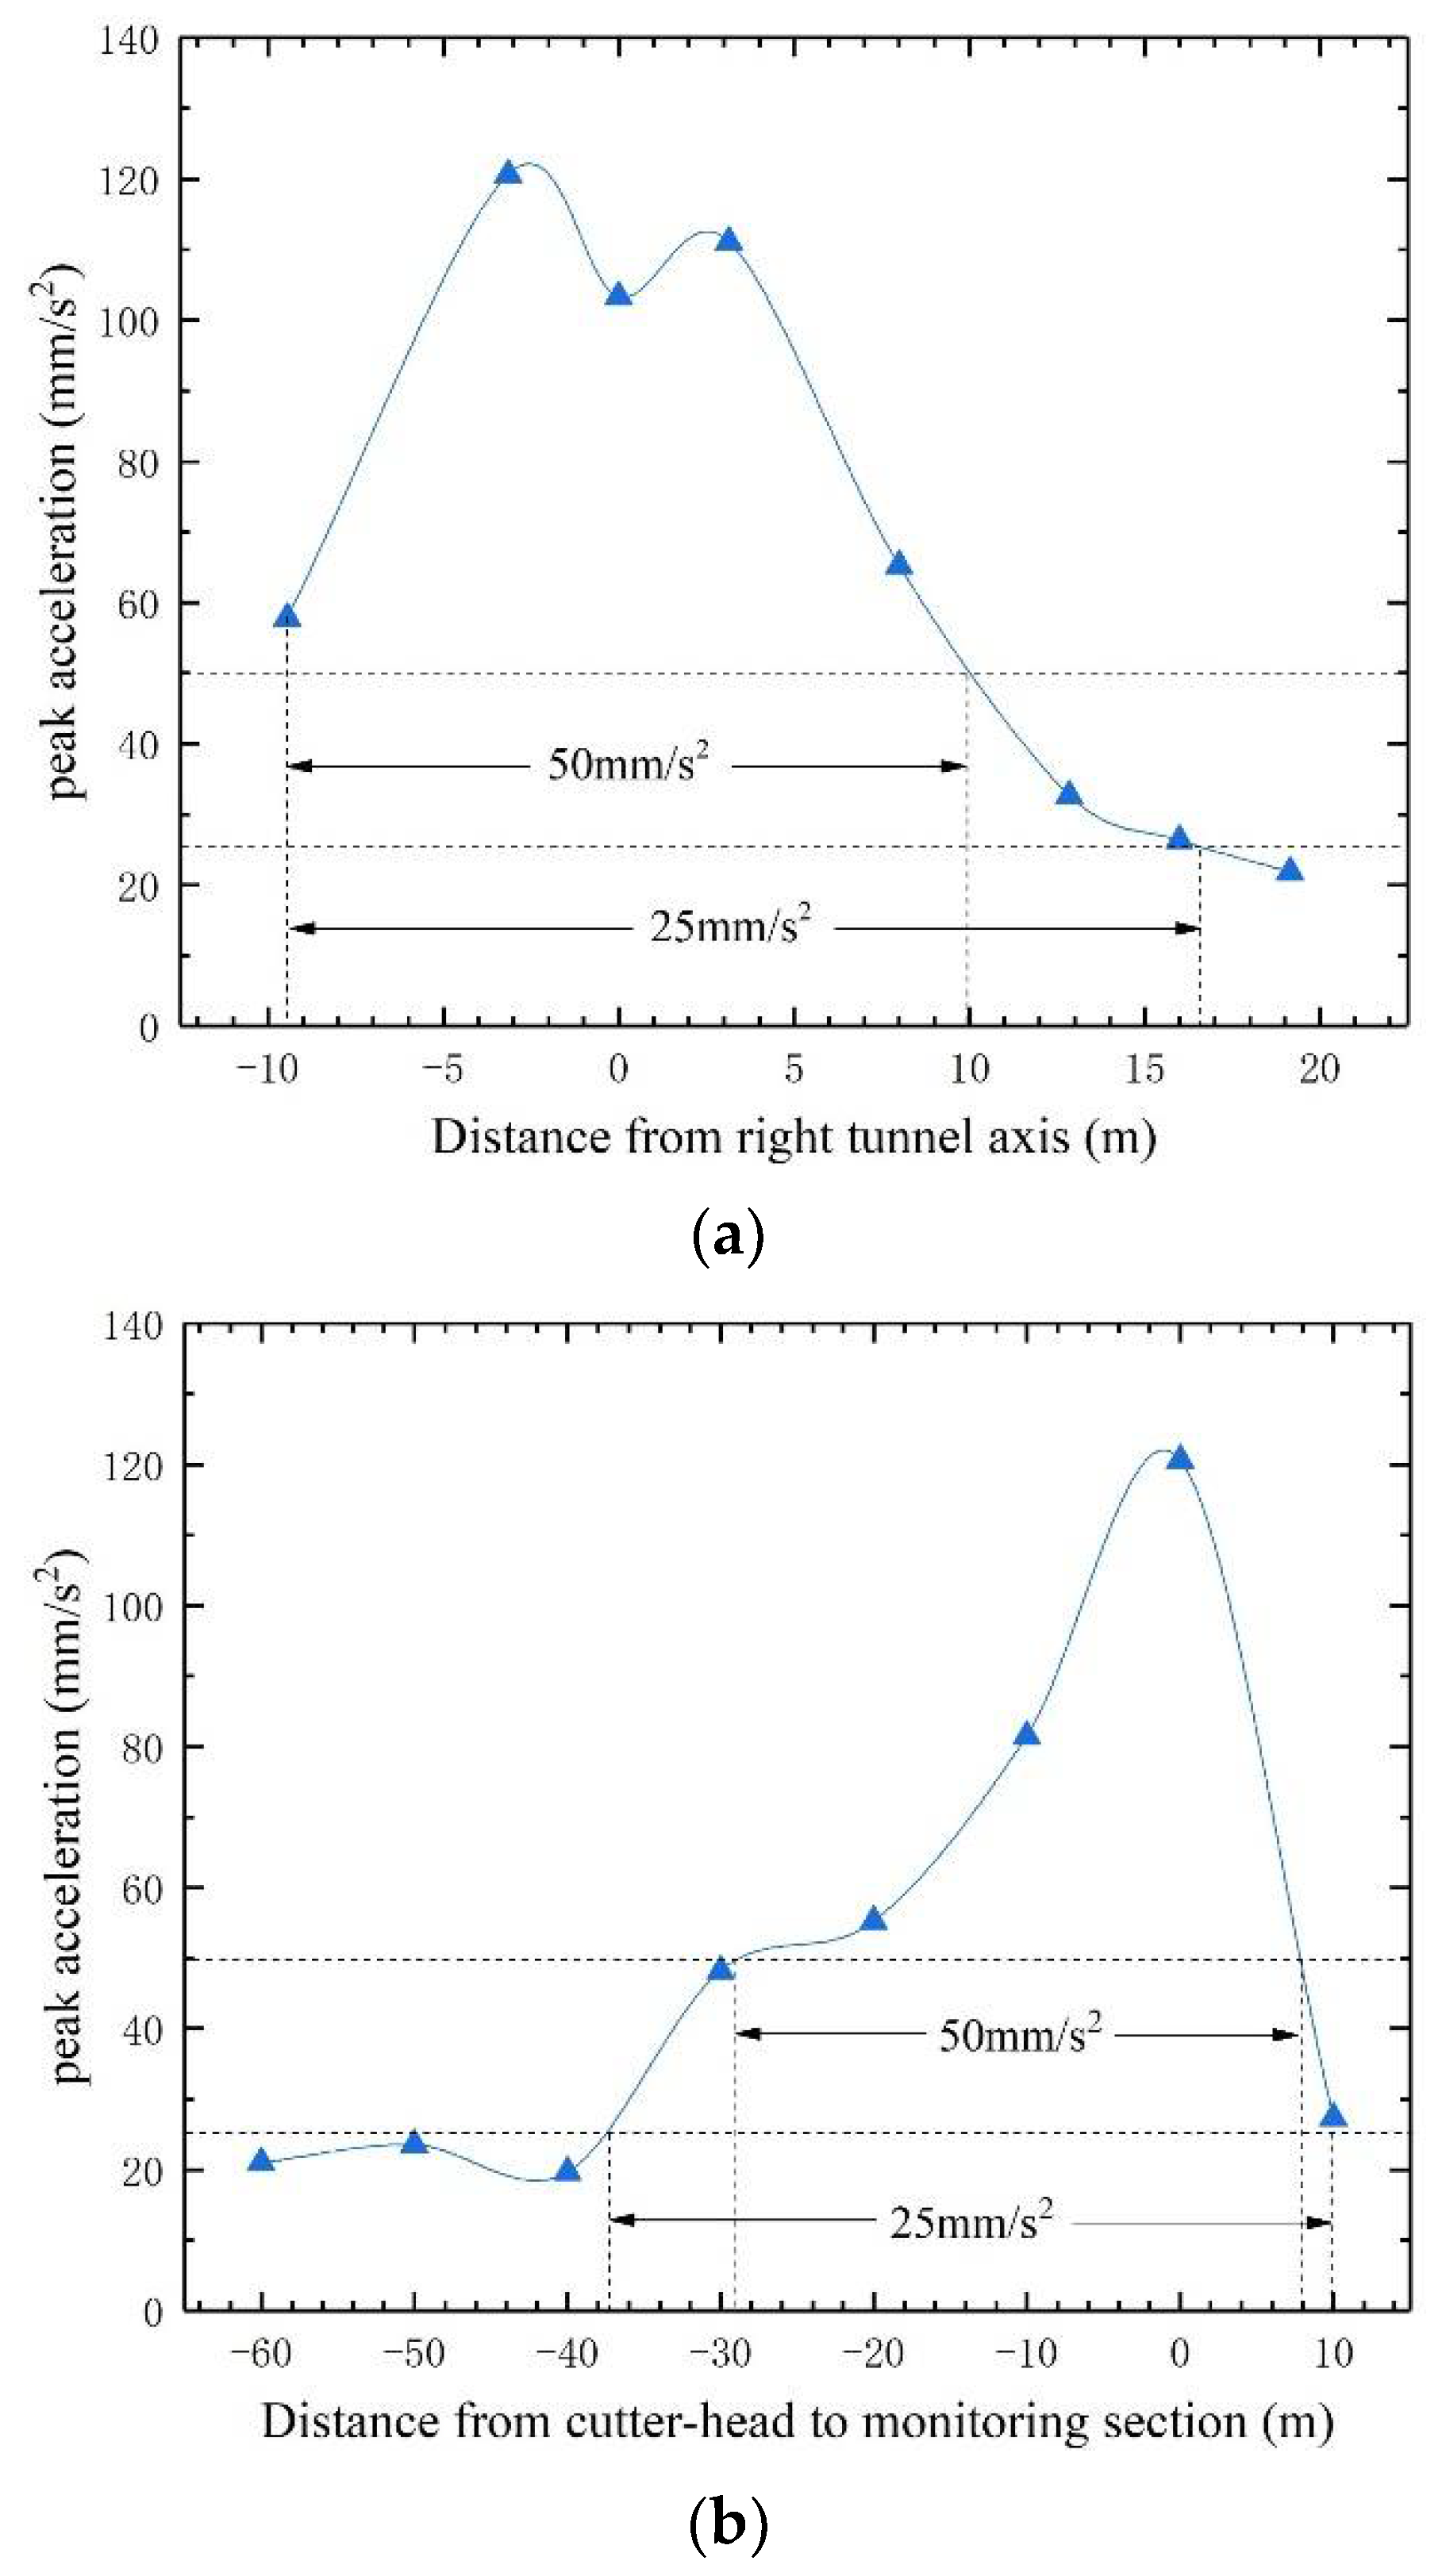
5.3. Vibration Influence Range of Double-Shield TBM Construction

In this paper, the vibration influence range generated by the double-shield TBM construction is studied by taking vibration on human comfort in surface buildings as an index. According to the Technical Standard for Human Comfort of the Floor Vibration (JGJ/T 441-2019) in China [34], the impact of vibration on human comfort is mainly considered in the Z-direction. Based on walking excitation, the peak acceleration of a floor structure, such as an operating room in a hospital, cannot exceed 25 mm/s2. The peak acceleration of residential houses, office buildings, classrooms, hotels, etc., cannot exceed 50 mm/s2. Moreover, the peak acceleration limit of shopping malls, cinemas, restaurants, etc., is 150 mm/s2.
Therefore, the peak accelerations in the Z-direction of measuring points at a 0-m depth are selected to study the transverse influence range of vibration acceleration. About the longitudinal influence range, taking the maximum peak acceleration in the Z-direction of surface measuring point Z-3 01 as the object, the relationship between the peak acceleration and the distance from the cutter-head to the monitoring section is analyzed. We can obtain a transverse and longitudinal influence range of peak acceleration, as shown in Figure 11a,b.
As is shown in Figure 11a, in terms of the transverse influence range, the special sensitive areas with lower-specified vibration limits, such as hospital operating rooms, will be affected by the double-shield TBM construction, which is within 17 m from the tunnel axis. For residential houses, office buildings, classrooms, hotels, etc., human comfort in buildings within 10 m of the tunnel axis is affected. If it exceeds 10 m, the vibration that people can perceive is weak, and it can be considered that human comfort is not affected by TBM construction. In addition, the maximum peak acceleration generated by TBM construction in the Z-direction on the surface is 120.62 mm/s2, as shown in Figure 11a. It does not exceed the limits of human comfort within shopping malls, cinemas, restaurants, etc. Therefore, we believe that human comfort is not affected in these buildings.
We can see from Figure 11b that the peak acceleration begins to exceed 25 mm/s2 when the cutter-head reaches 38 m before the monitoring section. Similarly, when the cutter-head reaches 29 m before the monitoring section, the peak acceleration exceeds limits for residential houses, office buildings, classrooms, hotels, etc. From the maximum peak acceleration, it does not exceed the peak acceleration limit of 150 mm/s2. This means that in the longitudinal range, the double-shield TBM construction will not have an impact on human comfort in shopping malls, cinemas, restaurants, etc. After the double-shield TBM passes through the monitoring section by 8 m, the peak acceleration drops to 50 mm/s2. Subsequently, the peak acceleration drops to 25 mm/s2 after passing through the monitoring section by 10 m. The vibration influence range of the double-shield TBM construction is shown in Table 5.
That is to say, the vibration influence range of double-shield TBM construction in hospital operating rooms is 38 m in front of the cutter-head, 10 m behind the cutter-head, and 17 m on both sides of the tunnel’s axis. For residential houses and office buildings, the vibration influence range is 29 m in front of the cutter-head, 8 m behind the cutter-head, and 10 m on both sides of the tunnel’s axis. Furthermore, the vibration generated by double-shield TBM construction has no effect on human comfort in shopping malls, cinemas, restaurants, etc.

6. Conclusions

Relying on the tunnel construction section of the double-shield TBM in Qingdao Metro Line 4, the construction vibration caused by the double-shield TBM has been monitored and analyzed. Subsequently, the transverse and longitudinal influence trend of peak acceleration has been studied. Finally, the vibration influence range of the double-shield TBM construction that affects human comfort is obtained. The conclusions are summarized as follows:
(1)
The vibration caused by double-shield TBM construction mainly occurs in the excavation stage. The time-domain curves of the vibration acceleration can be divided into three stages: rising stage, stable stage, and falling stage; the peak acceleration mainly occurs in the stable stage.
(2)
The vibration frequencies in the X, Y, and Z-directions at the same depth are relatively close. The main vibration frequency of the plain fill is 20–30 Hz, and the medium and coarse sand is 40–50 Hz.
(3)
In terms of transverse vibration trend, the maximum peak acceleration is located above the tunnel excavation section, and the farther the measuring point is from the tunnel axis, the smaller the peak acceleration. For longitudinal vibration trend, the peak acceleration is largest when the cutter-head reaches the monitoring section. Moreover, as the distance decreases, the peak acceleration gradually increases after the cutter-head reaches 35 m in front of the monitoring section. After passing through the monitoring section, the peak acceleration drops sharply.
(4)
For human comfort in an operating room, the vibration influence range by double-shield TBM construction is 38 m in front of the cutter-head, 10 m behind the cutter-head, and 17 m on both sides of the tunnel’s axis. In terms of residential houses and office buildings, the vibration influence range is 29 m in front of the cutter-head, 8 m behind the cutter-head, and 10 m on both sides of the tunnel’s axis. Moreover, it has no effect on human comfort in shopping malls, cinemas, restaurants, etc.
Notably, the research results are limited to the current formation or a formation of the same type. Actually, the vibration monitoring results are affected by many formation factors, such as the compactness of the rock mass, degree of fissure development, groundwater, etc. These have a great influence on vibration acceleration. Moreover, the results of this paper do not consider the effect of tunnel burial depth; it is meaningful to study the relationship between the tunnel buried depth and the vibration influence range. The peak acceleration in the manuscript is the actual maximum value of on-site vibration monitoring. However, there will be differences between the actual vibration and the monitoring results. Further, we will use a probabilistic approach to estimate peaks [35,36] and perform error analysis [37,38]. The results can provide a reference for the vibration effect of double-shield TBM passing through houses, highways, and bridges. It also has strong practical significance for resolving disputes that double-shield TBM tunnel construction affects the lives of inhabitants.

Author Contributions

Conceptualization, X.W. and Y.J.; methodology, Z.L. and L.F.; field test, Z.L. and G.Z.; data curation, Z.L. and G.Z.; data analysis, Z.L. and G.Z.; writing—original draft preparation, Z.L.; writing—review and editing, X.W. and L.F.; supervision, X.W.; project administration, X.W.; funding acquisition, Y.J. All authors have read and agreed to the published version of the manuscript.

Funding

This research was financially supported by the National Natural Science Foundation of China (grant no: 52108371), the Key Technology Research and Development Program of Shandong (grant no: 2019GSF111027), the Key Technology Research of Shield and TBM Construction in Qingdao Metro Line 4 (grant no: M4-ZX-2020-56), and the Shield/TBM Construction Risk Consultation Project of Qingdao Metro Line 4.

Institutional Review Board Statement

Not applicable.

Informed Consent Statement

Not applicable.

Data Availability Statement

All data included in this study are available upon request by contact with the corresponding author.

Acknowledgments

The authors would like to thank postdoctoral fellow Chenglong Liu (China University of Mining & Technology, Beijing) and assistant engineer Zurong Zhang (China Railway Construction Bridge Engineering Bureau Group Co., Ltd.) for their support on the vibration monitoring site.

Conflicts of Interest

No potential conflicts of interest was reported by the authors.

References

  1. Li, X.G.; Yuan, D.J. Development of the safety control framework for shield tunneling in close proximity to the operational subway tunnels: Case studies in mainland China. Springerplus 2016, 5, 527. [Google Scholar] [CrossRef] [PubMed] [Green Version]
  2. Gong, Q.M.; Yin, L.J.; Ma, H.S.; Zhao, J. TBM tunnelling under adverse geological conditions: An overview. Tunn. Undergr. Space Technol. 2016, 57, 4–17. [Google Scholar] [CrossRef]
  3. Li, S.C.; Nie, L.C.; Liu, B. The Practice of Forward Prospecting of Adverse Geology Applied to Hard Rock TBM Tunnel Construction: The Case of the Songhua River Water Conveyance Project in the Middle of Jilin Province. Engineering 2018, 4, 131–137. [Google Scholar] [CrossRef]
  4. Liu, Q.S.; Huang, X.; Gong, Q.M.; Du, L.J.; Pan, Y.C.; Liu, J.P. Application and development of hard rock TBM and its prospect in China. Tunn. Undergr. Space Technol. 2016, 57, 33–46. [Google Scholar] [CrossRef]
  5. Lu, Z.L.; Wang, X.C.; Teng, H.W.; Guan, X.M.; Song, C.; Fan, G. Rock-Breaking Laws of Disc Cutters with Different Height Differences in Hard Rock Strata. Adv. Civ. Eng. 2022, 2022, 1–11. [Google Scholar] [CrossRef]
  6. Leng, S.; Lin, J.R.; Hu, Z.Z.; Shen, X.S. A Hybrid Data Mining Method for Tunnel Engineering Based on Real-Time Monitoring Data From Tunnel Boring Machines. IEEE Access 2020, 8, 90430–90449. [Google Scholar] [CrossRef]
  7. Liu, M.B.; Liao, S.M.; Men, Y.Q.; Xing, H.; Liu, H.; Sun, L.Y. Field Monitoring of TBM Vibration During Excavating Changing Stratum: Patterns and Ground Identification. Rock Mech. Rock Eng. 2022, 55, 1481–1498. [Google Scholar] [CrossRef]
  8. Vogiatzis, K.; Zafiropoulou, V.; Mouzakis, H. Monitoring and assessing the effects from Metro networks construction on the urban acoustic environment: The Athens Metro Line 3 Extension. Sci. Total Environ. 2018, 639, 1360–1380. [Google Scholar] [CrossRef]
  9. Yang, J.H.; Cai, J.Y.; Yao, C.; Li, P.; Jiang, Q.H.; Zhou, C.B. Comparative Study of Tunnel Blast-Induced Vibration on Tunnel Surfaces and Inside Surrounding Rock. Rock Mech. Rock Eng. 2019, 52, 4747–4761. [Google Scholar] [CrossRef]
  10. Ruiz, J.F.; Soares, P.J.; Costa, P.A.; Connolly, D.P. The effect of tunnel construction on future underground railway vibrations. Soil Dyn. Earthq. Eng. 2019, 125, 105756. [Google Scholar] [CrossRef]
  11. He, R.; Jiang, N.; Li, D.W.; Qi, J.F. Dynamic Response Characteristic of Building Structure under Blasting Vibration of underneath Tunnel. Shock Vib. 2022, 2022, 1–13. [Google Scholar] [CrossRef]
  12. Namli, M.; Aras, F. Investigation of effects of dynamic loads in metro tunnels during construction and operation on existing buildings. Arab. J. Geosci. 2020, 13, 1–11. [Google Scholar] [CrossRef]
  13. Xia, Y.Q.; Jiang, N.; Zhou, C.B.; Luo, X.D. Safety assessment of upper water pipeline under the blasting vibration induced by Subway tunnel excavation. Eng. Fail. Anal. 2019, 104, 626–642. [Google Scholar] [CrossRef]
  14. Yang, Y.M.; Cai, Z.W.; Jiang, N.; Zhou, C.B.; Li, H.B. Safety Evaluation of Underground Gas Pipe under Blasting of Subway Connected Aisle: A Case Study. Ksce J. Civ. Eng. 2022, 26, 921–932. [Google Scholar] [CrossRef]
  15. Liu, X.; Jiang, A.N.; Guo, X.P.; Hai, L. Effect of Excavation Blasting in the Arch Cover Method on Adjacent Existing Pipelines in a Subway Station. Appl. Sci. 2022, 12, 1529. [Google Scholar] [CrossRef]
  16. Yu, J.X.; Zhou, Z.B.; Zhang, X.; Yang, X.L.; Wang, J.X.; Zhou, L.H. Vibration Response Characteristics of Adjacent Tunnels under Different Blasting Schemes. Shock Vib. 2021, 2021, 5121296. [Google Scholar] [CrossRef]
  17. Vinh, P.V.; Tounsi, A. Free vibration analysis of functionally graded doubly curved nanoshells using nonlocal first-order shear deformation theory with variable nonlocal parameters. Thin-Walled Struct. 2022, 174, 109084. [Google Scholar] [CrossRef]
  18. Melaibari, A.; Daikh, A.A.; Basha, M.; Abdalla, A.W.; Othman, R.; Almitani, K.H.; Hamed, M.A.; Abdelrahman, A.; Eltaher, M.A. Free Vibration of FG-CNTRCs Nano-Plates/Shells with Temperature-Dependent Properties. Mathematics 2022, 10, 583. [Google Scholar] [CrossRef]
  19. Noori, A.R.; Aslan, T.A.; Temel, B. Dynamic Analysis of Functionally Graded Porous Beams Using Complementary Functions Method in the Laplace Domain. Compos. Struct. 2021, 256, 113094. [Google Scholar] [CrossRef]
  20. Yao, Z.G.; Tian, Q.F.; Fang, Y.; Ye, L.B.; Pu, S.; Fang, X.F. Propagation and Attenuation of Blast Vibration Waves in Closely Spaced Tunnels: A Case Study. Arab. J. Sci. Eng. 2022, 47, 4239–4252. [Google Scholar] [CrossRef]
  21. Tian, X.X.; Song, Z.P.; Wang, J.B. Study on the propagation law of tunnel blasting vibration in stratum and blasting vibration reduction technology. Soil Dyn. Earthq. Eng. 2019, 126, 105813. [Google Scholar] [CrossRef]
  22. Yin, T.; Zhou, C.B.; Zheng, C.Q.; Fu, J.G.; Guo, Z.R. The Vibration Characteristics of Ground of Rock Blasting in Silt-Rock Strata. Shock Vib. 2021, 2021, 3318965. [Google Scholar] [CrossRef]
  23. Wang, X.; Li, J.C.; Zhao, X.B.; Liang, Y. Propagation characteristics and prediction of blast-induced vibration on closely spaced rock tunnels. Tunn. Undergr. Space Technol. 2022, 123, 104416. [Google Scholar] [CrossRef]
  24. Kong, S.M.; Kim, A.R.; Byun, Y.; Shim, S.; Choi, S.I.; Lee, S.W. Analysis of Stability and Required Offset with Vibration Velocity Considering Conditions of Bedrock and Explosive Charges Using the TBM and NATM Extension Blasting Method. Appl. Sci. 2022, 12, 3473. [Google Scholar] [CrossRef]
  25. Wu, F.; Gong, Q.M.; Li, Z.G.; Qiu, H.F.; Jin, C.; Huang, L.; Yin, L.J. Development and application of cutterhead vibration monitoring system for TBM tunnelling. Int. J. Rock Mech. Min. Sci. 2021, 146, 104887. [Google Scholar] [CrossRef]
  26. Wu, K.; Zheng, Y.; Li, S.C.; Sun, J.; Han, Y.C.; Hao, D.X. Vibration response law of existing buildings affected by subway tunnel boring machine excavation. Tunn. Undergr. Space Technol. 2022, 120, 104318. [Google Scholar] [CrossRef]
  27. Qingdao Geology and Mineral Geotechnical Engineering Co., Ltd. Geotechnical Investigation Report between Laoshan Science and Technology City Station and Zhangcun Station; Qingdao Geology and Mineral Geotechnical Engineering Co., Ltd.: Qingdao, China, 2016. [Google Scholar]
  28. GBT 50218-2014; Standard for Engineering Classification of Rock Mass. China Planning Press: Beijing, China, 2014; pp. 1–25. (In Chinese)
  29. Qingdao Metro Line 4 Civil Engineering Zone 10 Project Manager Department. Special Plan for TBM Construction in Civil Engineering Zone 10 of Qingdao Metro Line 4; Qingdao Metro Line 4 Civil Engineering Zone 10 Project Manager Department: Qingdao, China, 2018. [Google Scholar]
  30. Elbaz, K.; Shen, S.L.; Zhou, A.N.; Yin, Z.Y.; Lyu, H.M. Prediction of Disc Cutter Life During Shield Tunneling with AI via the Incorporation of a Genetic Algorithm into a GMDH-Type Neural Network. Engineering 2021, 7, 238–251. [Google Scholar] [CrossRef]
  31. China Railway Construction Heavy Industry Co., Ltd. ZTT6300 Double-Shield TBM Technical Parameter Report for Civil Engineering Zone 10 of Qingdao Metro Line 4; China Railway Construction Heavy Industry Co., Ltd.: Changsha, China, 2018. [Google Scholar]
  32. Paliwal, D.; Choudhury, A.; Govardhan, T. Detection of Bearing Defects from Noisy Vibration Signals Using a Coupled Method of Wavelet Analysis followed by FFT Analysis. J. Vib. Eng. Technol. 2017, 5, 21–34. [Google Scholar]
  33. Shirmohammadi, F.; Bahrami, S.; Saadatpour, M.M.; Esmaeily, A. Modeling wave propagation in moderately thick rectangular plates using the spectral element method. Appl. Math. Model. 2015, 39, 3481–3495. [Google Scholar] [CrossRef]
  34. JGJ/T 441-2019; Technical Standard for Human Comfort of the Floor Vibration. China Construction Industry Press: Beijing, China, 2019; pp. 1–40. (In Chinese)
  35. Fouladgar, N.; Hasanipanah, M.; Amnieh, H.B. Application of cuckoo search algorithm to estimate peak particle velocity in mine blasting. Eng. Comput. 2017, 33, 181–189. [Google Scholar] [CrossRef]
  36. Yan, W.M.; Yuen, K.V. On the Proper Estimation of the Confidence Interval for the Design Formula of Blast-Induced Vibrations with Site Records. Rock Mech. Rock Eng. 2015, 48, 361–374. [Google Scholar] [CrossRef]
  37. Zhang, X.Q.; Sarris, C.D. Error Analysis and Comparative Study of Numerical Methods for the Parabolic Equation Applied to Tunnel Propagation Modeling. IEEE Trans. Antennas Propag. 2015, 63, 3025–3034. [Google Scholar] [CrossRef]
  38. Dobaczewski, J.; Nazarewicz, W.; Reinhard, P.G. Error estimates of theoretical models: A guide. J. Phys. G-Nucl. Part. Phys. 2014, 41, 047001. [Google Scholar] [CrossRef]
Figure 1. Geological profile of the receiving terminal.
Applsci 12 07727 g001
Figure 2. Mainframe of double-shield TBM (Reprinted with permission from Ref. [29]. 2018, Qingdao Metro Line 4 Civil Engineering Zone 10 Project Manager Department.)
Applsci 12 07727 g002
Figure 3. Cutter-head of double-shield TBM (Reprinted with permission from Refs. [30,31].)
Applsci 12 07727 g003
Figure 4. The principle of vibration monitoring.
Applsci 12 07727 g004
Figure 5. Measuring point layout of vibration monitoring.
Applsci 12 07727 g005
Figure 6. Installation process of the sensors.
Applsci 12 07727 g006
Figure 7. Time-domain curve of monitoring point Z-4 03.
Applsci 12 07727 g007
Figure 8. Frequency spectrums of sampling hole Z-4. (a) Measuring point 01; (b) Measuring point 02; (c) Measuring point 03.
Applsci 12 07727 g008
Figure 9. Transverse influence trend with different buried depths. (a) 0 m depth; (b) 10 m depth; (c) 20 m depth.
Applsci 12 07727 g009
Figure 10. Longitudinal influence trend with different buried depths. (a) 0 m depth; (b) 10 m depth; (c) 20 m depth.
Applsci 12 07727 g010
Figure 11. Vibration influence range of double-shield TBM construction. (a) Transverse influence range; (b) Longitudinal influence range.
Applsci 12 07727 g011
Table 1. Technical parameters of the vibration sensor (JX941).
Physical QuantitiesSensitivity (V/m/s2)Measurement Range (m/s2)Pass Band (Hz)Output Load Resistance (kΩ)Resolution Ratio (m/s2)Size (mm)
acceleration0.30~200.2~8010005 × 10−656 × 56 × 77
Table 2. Signal channels corresponding to monitoring points.
Sampling HolesMonitoring PointsSignal ChannelsSampling HolesMonitoring PointsSignal Channels
XYZXYZ
Z-2011-101-111-12Z-6012-142-152-16
021-131-141-15022-172-182-19
031-161-171-18032-202-212-22
Z-3011-191-201-21Z-7012-232-242-25
021-221-231-24022-262-272-28
031-251-261-27032-292-302-31
Z-4011-281-291-30Z-8012-323-13-2
021-311-322-1023-33-43-5
032-22-32-4033-63-73-8
Z-5012-52-62-7Z-9013-93-103-11
022-82-92-10023-123-133-14
032-112-122-13033-153-163-17
Table 3. Peak accelerations of measuring points in the transverse section (unit: mm/s2).
Sampling HolesMonitoring PointsPeak AccelerationsSampling HolesMonitoring PointsPeak Accelerations
XYZXYZ
Z-20156.5538.68 57.80 Z-60186.5992.59 65.23
02126.0179.71 90.26 0267.8787.60 49.44
0351.9846.26 53.62 03106.1116.91 85.30
Z-301136.79158.19 120.62 Z-70162.9155.63 32.70
02147.3672.62 104.57 0290.5263.65 37.69
0393.45102.53 135.21 0370.2523.30 30.63
Z-40196.51110.79 103.30 Z-80154.7447.80 36.32
02167.8122.97 172.68 0277.3556.33 53.60
03133.5481.16 207.60 0345.0749.59 38.42
Z-501140.75122.02 111.12 Z-90146.3350.38 46.81
02128.9764.41 132.59 0282.4452.27 36.83
03121.19121.61 168.50 0343.9238.52 26.32
Table 4. Peak accelerations of sampling hole Z-4 (unit: mm/s2).
Buried DepthDirectionDistance between Cutter-Head and Monitoring Section
−60 m−50 m−40 m−30 m−20 m−10 m0 m10 m
0 mX17.7420.9826.2168.2287.9291.0796.5116.08
Y17.3822.6624.2055.2566.33106.08110.7913.85
Z16.1417.0518.8128.5053.5959.62103.3019.76
10 mX12.0320.5218.4045.42106.33133.34167.8037.29
Y21.6224.5525.4687.2252.6972.69122.9737.81
Z13.469.719.2432.0829.3458.71172.6826.29
20 mX9.1911.1710.7724.9228.6187.16133.5418.40
Y6.5010.882.384.5218.3239.5281.1613.40
Z9.9111.988.7220.6826.1642.04207.6016.48
Table 5. The vibration influence range of double-shield TBM construction.
Building TypeInfluence Range in Front of Cutter-Head (m)Influence Range behind the Cutter-Head (m)Influence Range on Both Sides of Tunnel Axis (m)
Operating rooms381017
Residential houses, office buildings, classrooms, hotels, etc.29810
Shopping malls, cinemas, restaurants, etc.No effectNo effectNo effect
Publisher’s Note: MDPI stays neutral with regard to jurisdictional claims in published maps and institutional affiliations.

