Article

Correlation Mapping of Perfusion Patterns in Cutaneous Tissue

1
Department of Electromagnetic and Biomedical Engineering, Faculty of Electrical Engineering and Information Technology, University of Zilina, 010 26 Zilina, Slovakia
2
1st Department of Internal Medicine, Faculty of Medicine, Comenius University, 813 69 Bratislava, Slovakia
*
Author to whom correspondence should be addressed.
Appl. Sci. 2022, 12(15), 7658; https://doi.org/10.3390/app12157658
Submission received: 23 June 2022 / Revised: 24 July 2022 / Accepted: 26 July 2022 / Published: 29 July 2022
(This article belongs to the Section Biomedical Engineering)

Abstract

:
Perfusion patterns of cutaneous tissue represent a valuable source of information about the state of the patient’s cardiovascular system and autonomic nervous system (ANS). This concept aims to observe the perfusion changes in the foot sole in two healthy individuals and two subjects affected by diabetes mellitus (DM). We use photoplethysmography imaging (PPGI) to monitor cutaneous perfusion changes. This method, in contrast to conventional contact photoplethysmography (PPG), allows the monitoring of skin perfusion with spatial distribution. We use a machine vision camera and an illumination system using the green light. To induce the perfusion changes, we perform an experiment in the form of a deep breathing test (DBT). The experiment consists of three stages, with the middle stage being the DBT. To evaluate spatial perfusion changes, we use a normalized measure of the correlation of PPGI signals with a reference PPG signal obtained from the foot’s little toe. This method also increases the signal-to-noise ratio (SNR). Subjects with DM shows different patterns of tissue perfusion changes compared to healthy subjects. The DM subjects show increased perfusion after DBT compared to the pre-DBT state, whereas in healthy subjects, the tissue perfusion does not reach the level of the pre-DBT phase. This work can be considered as proof of concept in developing a non-contact and non-intrusive monitoring system that allows a different view of microcirculatory damage in patients with diabetes mellitus, focusing on its spatial distribution.

1. Introduction

The number of people suffering from diabetes mellitus (DM) is increasing worldwide. According to [1], the number of registered people with diabetes mellitus has quadrupled over the past 40 years and is still rising while we can also observe an increase in DM mortality. In addition, DM is the leading cause of blindness, kidney failure, heart attacks, strokes, and lower-limb amputations. This information also points to the fact that more attention needs to be paid to this disease. It is not just a metabolic disorder in the body but a complex disease that affects the kidneys, the nervous system, and the cardiovascular system in the long term. Diabetic foot is the leading cause of lower extremity amputation worldwide. Therefore, it is crucial to investigate methods of early diagnosis of this disease, as well as what methodology or instruments should be used to prevent not only macrovascular but also microvascular damage in diabetic foot syndrome.
One way to monitor microcirculation changes induced by DM is non-invasive and non-contact cardiovascular diagnostics based on optoelectronic methods—photoplethysmography imaging. This technique of investigating cutaneous tissue perfusion represents a significant step forward and has seen increased development in recent years, which is also related to technological advances [2]. Photoplethysmography imaging (PPGI) is based on conventional photoplethysmography (PPG) first published in [3] but operated without contact with patient skin. A significant milestone were the works of [4,5] which transformed contact PPG into a completely contact-free method of investigating cutaneous perfusion using a camera system. The PPGI technology finds its application in the monitoring of many physiological or pathophysiological processes, among which we can include vital signs monitoring [6,7,8,9,10,11], heart rate variability [12], oximetry [13], pulse transit time assessment [14], wound assessment [15,16], driver state estimation [17,18,19], or pain evaluation [20]. Tissue perfusion changes are also related to respiratory activity. For example, [21] confirm changes in perfusion measured by PPG in the fingers during brachial artery occlusion. The shape of the PPG curve varies according to the measurement site as well as depending on the breathing pattern [22]. Thus, the PPG signal can also be used to extract information related to respiratory activity [23,24]. During spontaneous breathing and its controlled form, the pulse wave propagation velocity also changes, as documented, e.g., in [25].
Early assessment of the vascular system state could be beneficiary also for patients suffering from DM. Therefore, this work combines the PPGI measurements and correlation mapping to understand better and evaluate quantitative and qualitative changes in the skin perfusion of patients suffering from DM. Here, the non-invasiveness of PPGI makes it possible to sense skin perfusion during all phases of diabetic foot syndrome. In this way, we also avoid the discomfort caused by cables connected to probands. To track perfusion changes, we need to induce them. Several tests elicit complex cardiovascular responses allowing for assessment of changes, e.g., in heart rate, blood pressure, and length of RR intervals. The results of these tests depend on several tracked physiological parameters and used systems. Validated cardiovascular tests include the deep breathing test (DBT) [26], the orthostatic test [27], and the Valsalva test [28]. For our experiment, the deep breathing test was chosen, representing a relatively simple cardiovascular test used clinically to assess the effect of ANS on heart rate and peripheral perfusion regulation [29]. This work aims to create an appropriate methodology for processing and evaluating perfusion data obtained through a camera synchronously with auxiliary PPG, ECG, and respiratory waveform. These auxiliary data should allow for improved processing and analysis of PPGI signals. The proposed methodology is tested in our case on a small sample of subjects. In this way, we seek to highlight the possibilities of using this measuring technique for DM patients.

2. Materials and Methods

PPGI signals recorded by the camera have low-intensity variability because the vasculature in the skin contains only a small amount of blood (approximately 2% to 5% of the total blood volume), and only 5% of the blood volume changes synchronously with heart activity [30].

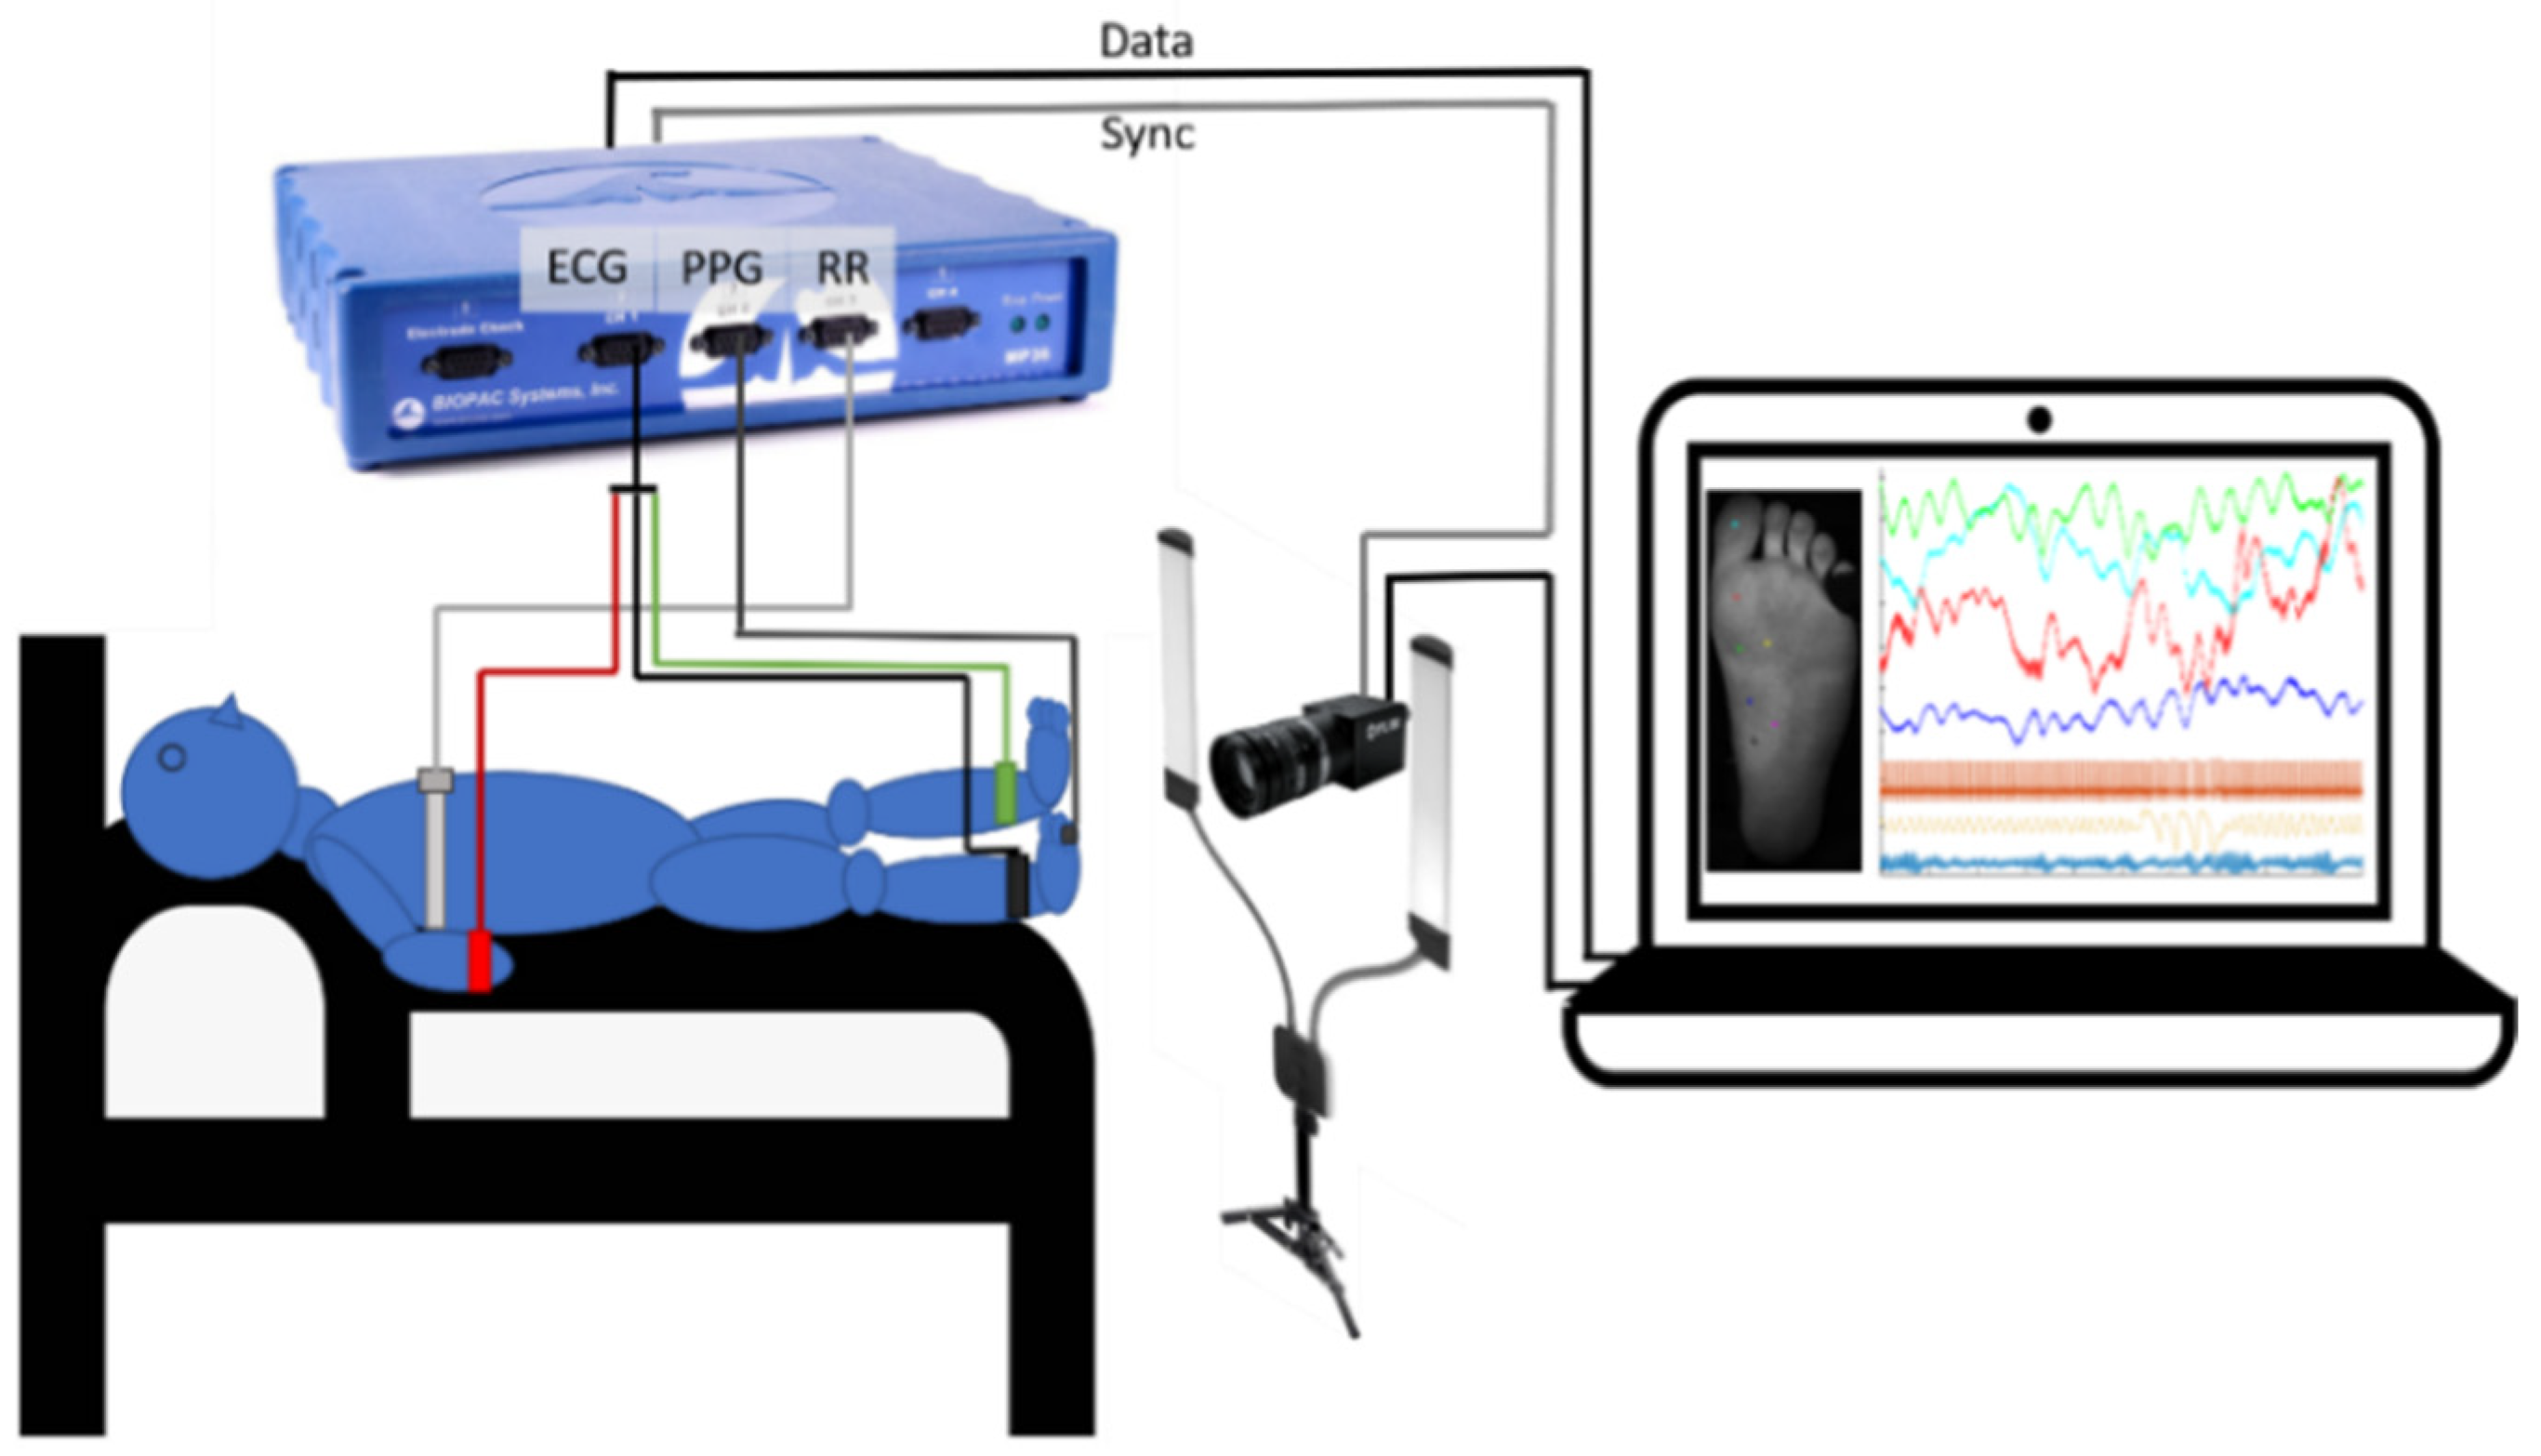
2.1. Measurement Setup

To detect perfusion changes, we used a Blackfly® S BFS-U3-28S5M camera (FLIR Systems, Wilsonville, OR, USA). Simultaneously, we used the SpinView (FLIR Systems, Wilsonville, OR, USA, version 2.5.0.80) to control the camera during measurements. We saved recorded images in a 12-bit .raw format to avoid compression or data loss.
A two-panel LED illumination emitting white light with a temperature of 5500 K was used as the light source, which according to Wien’s law corresponds to the value of the radiation peak at a wavelength of approximately 527 nm and thus complements the used band-pass optical filter with a central wavelength of (540 ± 2) nm and a bandwidth of (10 ± 2) nm (Edmund Optics®, Barrington, NJ, USA). Data were recorded at 30 frames per second with a spatial resolution of 1936 × 1464 px2 with a Fujinon CF12.5HA-1B fixed focal length lens (Fujifilm Holdings, Tokyo, Japan) mounted on the camera. By default, the aperture value was set to f/2 because of a narrow band-pass optical filter causing light with low-intensity incidents on the sensor. The value is a trade-off between ensuring sufficient intensity of incident light on the sensor and the image’s depth of field. The number of recorded frames was 20,000, representing approximately an 11-min-long record. The automatic exposure time and signal gain were turned off and set to a static value. The camera gain was set at low values because noise is amplified along with the useful signal. The camera exposure time was set to 32 ms. When setting the exposure time, we were limited by the frame rate (in our case 30 fps), and therefore it was not possible to exceed the value of 33 ms. At the same time, gamma correction was manually turned off.
To obtain reference signals, we used a BIOPAC MP36R device (BIOPAC Systems Inc., Goleta, CA, USA). With this device, we synchronously acquired the electrocardiogram, respiratory, and pulse wave waveform of the examined patients. The ECG signal was recorded using the Einthoven lead II (BIOPAC SS2LB shielded cable, F9024SSC Ag/Cl electrodes). Respiratory activity was acquired with a chest belt placed in the thoracic region (BIOPAC SS5LB). The pulse wave was measured with an infrared reflectance sensor (BIOPAC SS4LA). Furthermore, the BIOPAC Student Lab 4.0.3 unit offers predefined settings for individual measurements. The sampling rate of the BIOPAC unit is set to 1000 Hz by default. The layout of the measurement setup is shown in Figure 1.

2.2. Experimental Protocol

The measurement was performed on subjects in the supine position, as shown in Figure 1. A total number of 4 subjects aged (36 ± 25.34) years participated in the experiment. Two subjects were healthy (ages 23 and 24), one subject suffered from type I DM (age 23), and one subject was affected by type II DM (age 74). All subjects signed informed consent forms before the experiment, while the institutional committee statement does not apply in this case. Furthermore, the experiment was non-invasive, and all persons were outpatients under a standard examination of vital parameters without medication administration. The camera system focused on the foot sole of the patient. The choice of the measured limb can change depending on the measurement needs. Since we focused on the method of assessing the skin perfusion changes, we did not prefer a specific side in our case. To exclude the influence of the orthostatic reflex, we started to measure approximately 10 to 15 min after the patient had stabilized in the supine position. We used this time for the preparation of the BIOPAC unit and the camera system. To avoid any other external influences, we performed the measurements in a quiet, non-stressful environment with adequate room temperature and shaded windows. The patient was lying in a relaxed position to move the measured body part as little as possible. The measurement itself took eleven minutes and was divided into three parts (Figure 2).
In the first part, the patient was asked to breathe naturally. The second part started after five minutes of measurement with a deep breathing test. The test comprised four deep inhales lasting four seconds, and four deep exhales of the same duration, giving a respiratory rate of approx. 7.5/min. In contrast to the standardized cycle length (6/min), the length of one cycle was adjusted so that the respiratory rate was above the value of changes in blood perfusion related to baroreceptor activity. The test was controlled through the Breathly mobile app (© Matteo Mazzarolo). In the third part of the measurement, the patient was again asked for a natural breathing pattern.

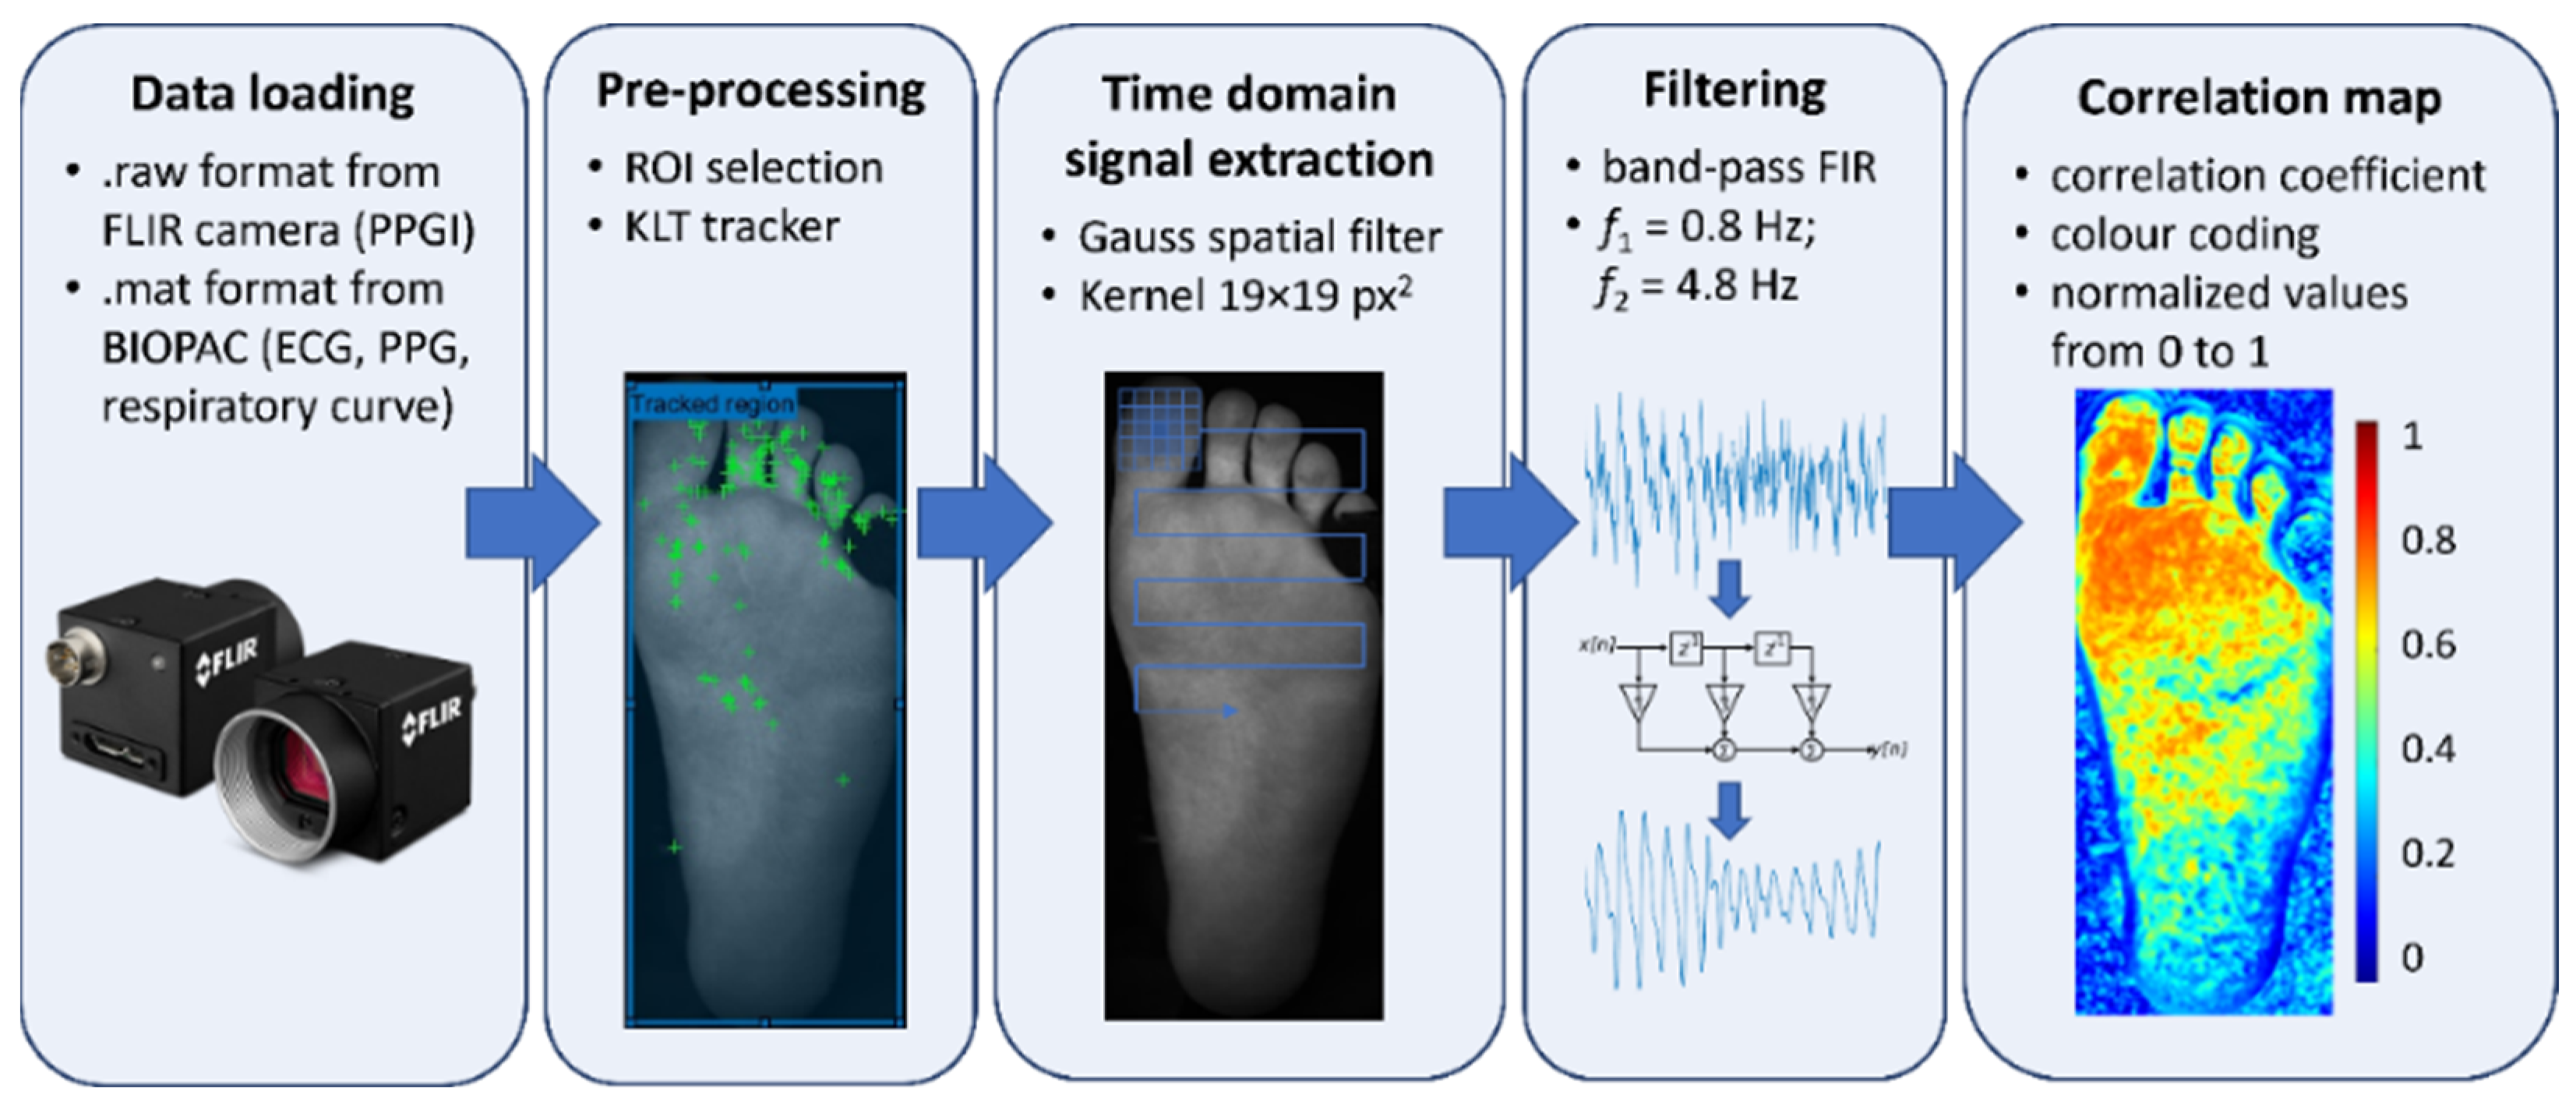
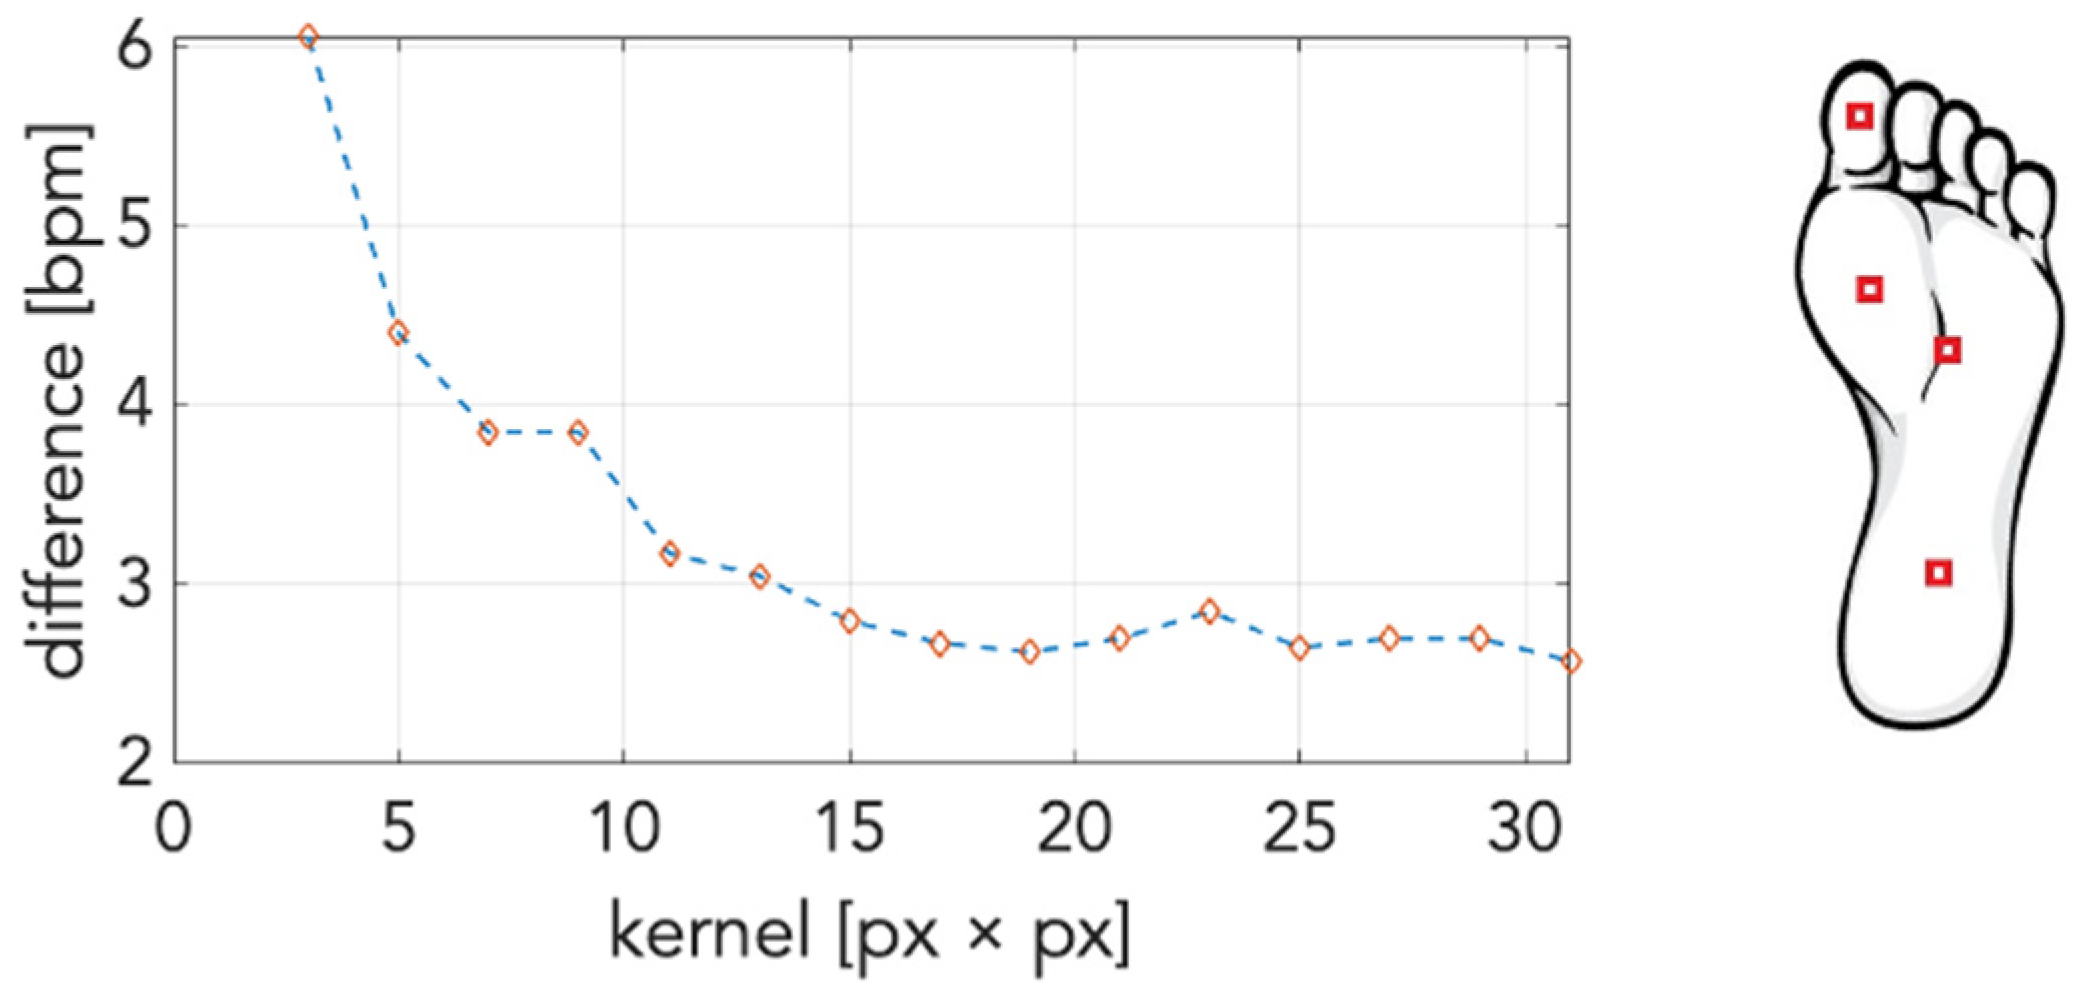
2.3. Data Processing
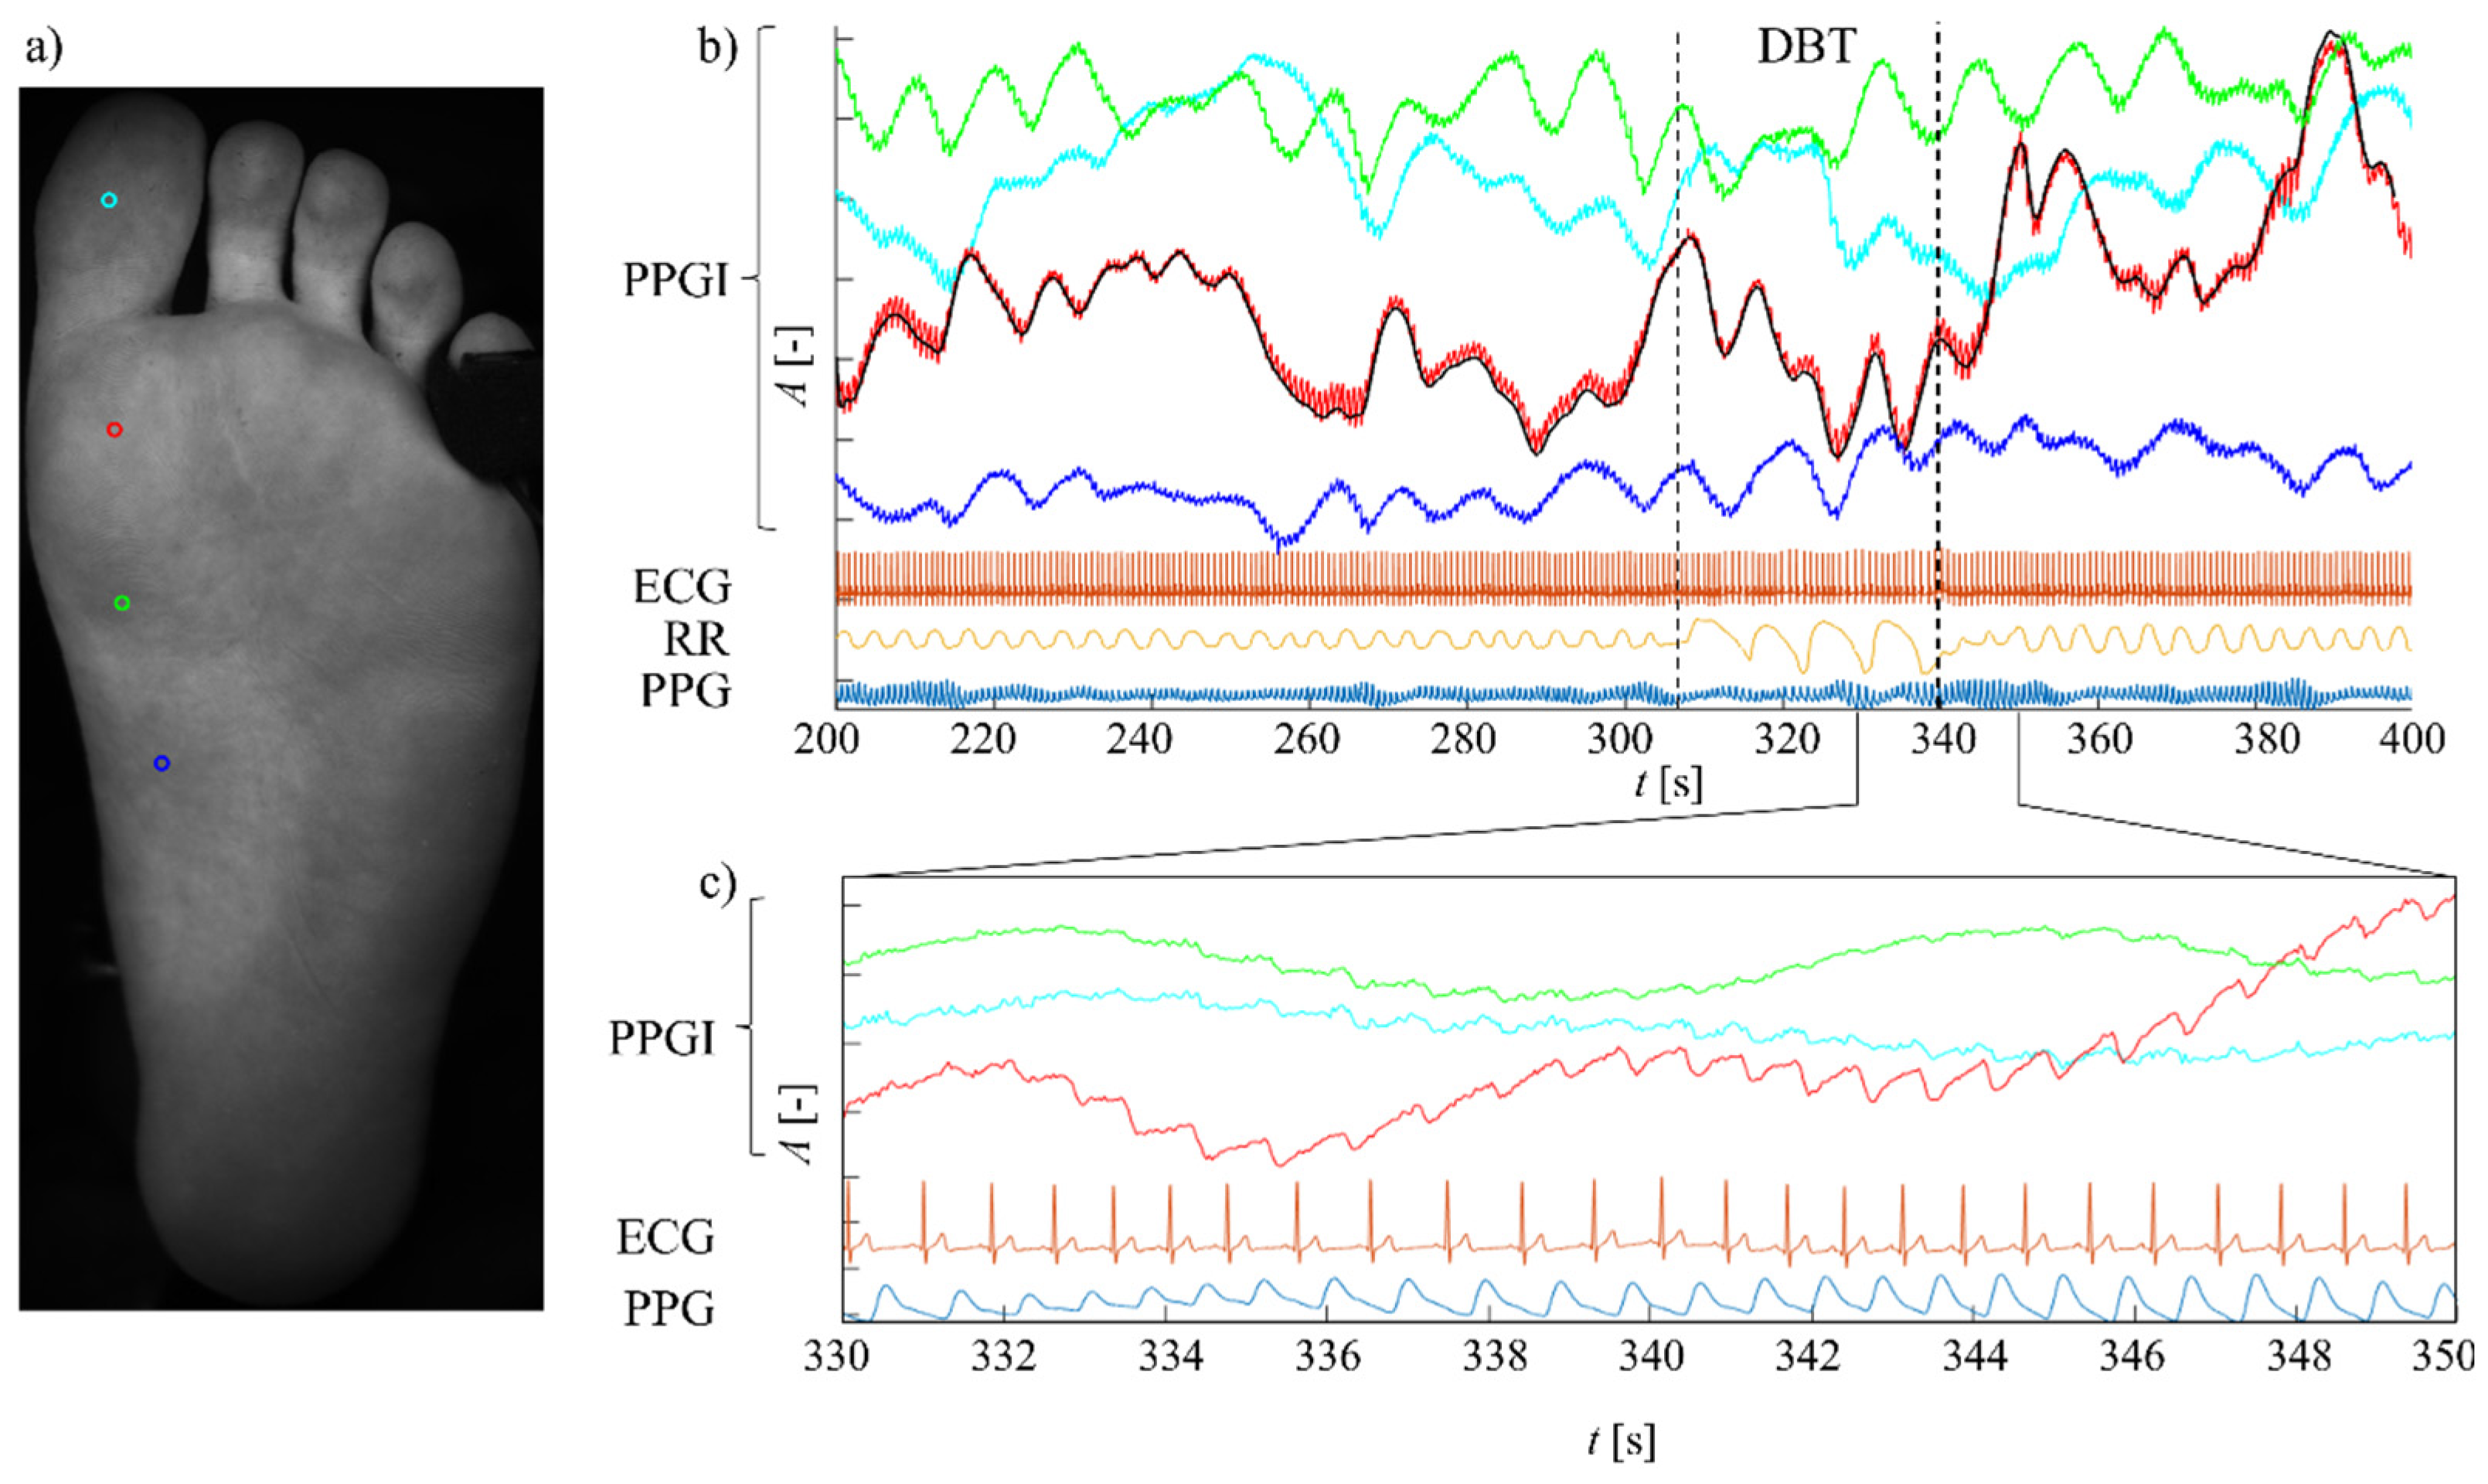
The data pre-processing process was performed in a MATLAB (The MathWorks, Inc., Natick, MA, USA, version R2021a, update 6). Since the data was saved in .raw format, camera parameters such as resolution, frame rate, or bit resolution are not included in the file. Therefore, this data had to be stored in a separate file during the measurement. In addition, during image processing, this data cannot be read from the file but must be entered manually. The speed of this data processing depends on the type and number of input frames and the number of processes performed on the images required by the user. Storing 12-bit data saves memory space compared to 16-bit and provides more quantization levels compared to 8-bit. However, saving in the 12-bit .raw format has its drawbacks. One of them is the speed of loading data into the MATLAB programming environment. One solution to this problem was to write a custom function to load the data.
After the data were read (see Figure 3, stage 1), the frame was rotated so that the leg was oriented vertically. Then, using a rectangular region of interest, the foot was marked where the corner points were detected using a modified KLT algorithm [31,32]. Subsequently, all images were processed using this tracking algorithm. The KLT algorithm is suitable for the slow motion of the foot. Nonetheless, rapid movements of the fingertips or various muscle twitches could be a problem for the tracker. We saved the processing that resulted in images of the foot sole in TIFF format with the same index as the input (Figure 3, stage 2).
The pre-processed images were reloaded as part of further processing when we applied a spatial Gaussian filter. Spatial filtering increases the SNR of the PPGI signal for each pixel [33] (Figure 3, stage 3). The SNR refers to the ratio between the power of the desired output signal and the background noise. Therefore, we can better detect perfusion changes with an increase in SNR. A two-dimensional approximation of the Gaussian function is defined by (1):
g ( x , y ) = 1 2 π σ 2 e x 2 + y 2 2 σ 2 ,
where x is the distance from the central pixel in the horizontal axis, y is the distance from the central pixel in the vertical axis, and σ is the standard deviation of the Gaussian distribution. In our case, the values of x and y were the same. Using the averaging function of the moving kernel, the number of pixels is reduced:
r ( x , y , t ) = 1 ( 2 K + 1 ) 2 l 2 = K K l 1 = K K v x + l 1 , y + l 2 , t ,
where r(x, y, t) is the signal from a single pixel with positions x and y, K is the distance from the central point of the kernel to the edge, and v is a three-dimensional matrix of input points. The extracted signals contain a component associated with changes in cutaneous tissue perfusion, which are also related to cardiac activity. A band-pass finite response filter (FIR) with cut-off frequencies of 0.8 Hz and 8 Hz was applied to these signals, yielding an alternating component referred to as AC. Similarly, a low-pass FIR with a cut-off frequency of 0.3 Hz was used to obtain a DC component. Hence, the waveforms of the PPGI signals were extracted from a mask of size 19 × 19 px2 (Figure 3, stage 4). Subsequently, we calculated a normalization coefficient:
n ( x , y ) = r ¯ AC ( x , y ) r ¯ DC ( x , y ) ,
where r ¯ AC ( x , y ) is the mean value of the AC component of the signal and r ¯ DC ( x , y ) is the mean value of the DC component. Subsequently, the input signals were multiplied by a normalization coefficient, which ensured that the perfusion measurements were invariant to the intensity of the incident light. The normalized signals were then filtered again using a band-pass FIR filter (with cut-off frequencies f1 = 0.8 Hz and f2 = 4 Hz). Next, the PPG data from the BIOPAC unit were downsampled so that the resulting sampling rate corresponded to the camera frame rate.
During the measurement, different types of artifacts affected the recording, such as motion artifacts, and the change of ambient light in the room. These ambient influences were suppressed by appropriate methods (tracking algorithm, dark room measurement). Assuming that this noise was constant, the PPG signal acquired by the BIOPAC device did not contain significant noise, and the only parameter that varied was the amplitude of the acquired signal; we could apply the correlation mapping method to the acquired data. Using Equation (4) (xcorr() function in MATLAB), the cross-correlation between the PPG signal and PPGI signals stored in a 3D matrix carrying information about the spatio-temporal changes of the perfusion of the imaged area was sequentially calculated. Assuming a possible phase shift between PPGI and PPG signals, we set the offset (scaleopt parameter) to half of the camera frame rate:
R ^ x y ( l ) = {   k = 0 N l 1 x k + l y k * ,               l 0 ,       R ^ y x * ( l )                       l < 0 ,
where x and y are the input signals, R ^ x y is the coefficient representing the correlation measure, the asterisk denotes complex conjugation, k is the sample number, and l is the offset. The values of the calculated correlations were normalized in the interval from zero to one using Equation (5) (Figure 3, stage 5):
R ^ x y , norm ( l ) = 1 R ^ x x ( 0 ) R ^ y y ( 0 ) R ^ x y ( l ) .
The calculation result is a matrix depicting the limb locations where the signal captured by the camera is most similar to the recorded PPG signal from the little toe using the BIOPAC unit in reflective mode. The resulting correlation coefficient depended mainly on the quality of the recorded PPGI signal. The quality of the signal can be influenced by the way the image data is processed. Averaging the pixel values contributes significantly to the SNR increase, so it is a good question what size of averaging mask to use. For this reason, we extracted the signals from the beginning of the recording and the part when the deep breathing test took place for the limb locations depicted in Figure 4 (right). Then, we filtered these signals, and subsequently, we detected the heart rate. As a heart rate reference value, we chose the ECG signal recorded by the BIOPAC unit. Therefore, we used the Pan–Tompkins algorithm to obtain the number of QRS complexes [34]. The algorithm involves band-pass filtering (5 Hz–16 Hz), derivation, bringing to square (removing negative values), averaging with a window length of 80 ms, and local maxima detection with thresholding. Subsequently, we compared the heart rate (HR) estimated from ECG with HR obtained from PPGI signals while the averaging masks from 3 to 31 pixels were analyzed. The first mentioned showed an error rate of approximately 6 beats per minute. A mask with a size of 19 × 19 px2 seemed the optimal option for pixel averaging kernel. In this case, the error was 2.6 beats per minute (see Figure 4, left).

3. Results

Four subjects (two females and two males) participated in the measurement, while one subject suffered from DM type II and one from DM type I. None of the participants suffered from limb pain or indicated diabetic foot syndrome. The image and signals shown in Figure 5 are after the KLT tracking. Despite the subjects’ efforts not to move the limb, the differences between the first and last images were present in the records. Mostly, there were slight rotations of the foot. This problem was eliminated using the proposed algorithm. Figure 5 shows the signals approximately three and a half minutes along with a zoomed-in period of 20 s. Additionally, the dashed black line highlights the deep breathing test. Furthermore, we can see along with the whole record the low-frequency perfusion oscillations in the frequency range 0.05 Hz–0.4 Hz [15,35,36,37]. For instance, the low-frequency perfusion oscillations in the red signal are highlighted in Figure 5 by the black line. Within this slow perfusion oscillation, there are superimposed changes related to cardiac activity. Moreover, we can observe an increase in the amplitude of the PPG signal in some stages of the record. The change in amplitude of the red-coloured signal strongly resembles the change in amplitude of the reference PPG signal obtained from the little toe, noting that the PPG signal from BIOPAC is inverted relative to the natural PPG signal.
Three correlation maps (Figure 6) showing perfusion changes related to cardiac activity were created from the acquired recordings. The first correlation map corresponds with the stage before DBT is performed. The second depicts perfusion changes during the DBT, and the third correlation map shows the perfusion three minutes after the DBT is completed. All correlation maps are created from a 20-s-long segment of the record. The time courses shown in Figure 6 are associated with the third correlation map, thus with the stage after DBT for each subject. The red signal is from the toe region, the green signal is from the central region of the foot, the blue signal is from the heel region, and the last black signal is the reference signal acquired by the BIOPAC unit. Similar to the signals from Figure 5, we can see the amplitude differences of the signals obtained from different positions of the same subject in these recordings. The differences in light intensity modulation are particularly pronounced across the recordings.
While in record one, the signals show a significant modulation of light intensity along the whole foot, the correlation coefficient is significantly lower in record two. In record two, the signal is more affected by noise, but the amplitude of the signal intensity change is not significantly different from the other records. When evaluating the maps, we can notice that the correlation coefficient during DBT decreased for all subjects; for record number two, up to such an extent that the foot contour is hardly visible on the map. After DBT, the correlation coefficient in all cases increased slightly compared to the pre-DBT condition. The correlation maps of healthy subjects are also shown in Figure 6 (3,4). Record four is more significantly affected by noise compared to record three. Similar to records one and two, there is a decrease in the correlation coefficient during DBT. However, unlike records one and two, there was a noticeable decrease in the correlation coefficient after the DBT compared to the pre-test condition.
To gain another perspective on the changes in cutaneous tissue perfusion during the different phases of the experiment, we created bar graphs showing the normalized correlation coefficients from the regions marked in Figure 7; see the map on the left. All values of R ^ x y , norm are normalized according to the stage before DBT was performed. In DM patients (subjects 1, 2), there is a noticeable decrease in perfusion during DBT and a subsequent increase after DBT compared to pre-test values. In healthy subjects (3, 4), the pattern is slightly different. Although there was a decrease in tissue perfusion during DBT, the post-test perfusion value did not reach the pre-test level, except in subject 3 in the location of lower ROI.

4. Discussion and Conclusions

Correlation mapping of tissue perfusion using PPGI contributes to the possibilities for assessing the microcirculation of subjects with DM. The proposed method allows quantitative assessment of local tissue perfusion with spatial resolution. On the one hand, this method can be considered relatively simple and computationally inexpensive. However, on the other hand, to make the results relevant, stable measurement conditions must be ensured. In our case, the need for synchronous recording of the contact PPG may be a drawback. Another possibility to overcome this is generating a reference signal from a larger ROI size [38] or using low-cost imaging systems such as a smartphone or consumer digital cameras to use their microphone input [39]. These solutions thus lead to a fully contactless measurement modality. The method was applied to a sample of two DM and two non-DM subjects, and we could observe different perfusion patterns for these two groups of subjects. In particular, a different response to DBT can be observed in DM subjects, where a low response is evident in subject 1 (Figure 6) compared to subject 2, which may be due to different ages and different degrees of impairment in the regulation of vasomotor mechanisms.
The results show that respiratory activity also influences the peripheral hemodynamics of DM and healthy subjects. These changes in tissue perfusion are induced by sympathetic or parasympathetic activity. The effect of sympathetic activity reduces blood flow through the cutaneous tissue, and thus respiratory activity can also be observed to some extent in signals obtained by photoplethysmography [40,41,42]. The DC component of the photoplethysmography signal, which is unrelated to cardiac activity, can change its level just according to respiratory activity [21,43,44,45]. Changes in the PPG signal conditioned particularly by respiratory activity may be caused, for example, by changes in arterial blood pressure transmitted mechanically in the thoracic region from large arteries to smaller ones or by oscillations in the activity of the autonomic nervous system [46].
In our case, choosing the DBT, we confirmed this effect of peripheral changes in cutaneous perfusion by a unique non-invasive and non-contact method of photoplethysmography imaging. Thus, tissue perfusion can be mapped spatially [4,5,7,15,39], allowing comprehensive monitoring of the subject’s cardiovascular system responses [47]. This method could be used even in extensive skin damage where contact methods cannot be used for measurement, such as when examining ulcerations [15,16]. Since the probands did not have an indicated diabetic foot syndrome, we did not focus to the choice of leg. However, for further study, it is suggested to record both legs simultaneously, as was used in the case of thermography measurements in [48]. Such data enable the detection of differential perfusion patterns [49], especially in comparing the feet with and without ulceration or skin damage. Although our sample of subjects did not include subjects with visible skin damage, this group of patients may still benefit from PPGI in screening perfusion or assessing the stage of development of their DM when there is a gradual decline in the regulatory capacity of vasoactive mechanisms [50], the efficacy of which could be evaluated using DBT.
Although this work contains a small number of subjects with an extensive age range, we consider it a pioneering step toward developing a non-contact and non-intrusive monitoring system that would allow the investigating physician to view the microcirculatory damage in patients with diabetes mellitus while focusing on the spatial distribution of damaged tissue. The work also points to the importance of understanding the effects of the disease on the peripheral parts of the body. The results of this work will be used as the base for further research with an expanded number of subjects.

Author Contributions

Conceptualization, P.P. and S.B.; methodology, S.B. and D.C.; software, P.P.; validation, S.B., P.P., M.S. and D.C.; formal analysis, S.B.; investigation, P.P. and S.B.; data curation, P.P. and M.S.; writing—original draft preparation, P.P. and S.B.; writing—review and editing, S.B., P.P., M.S. and D.C.; visualization, P.P. and S.B.; supervision, S.B.; project administration, S.B.; funding acquisition, S.B. All authors have read and agreed to the published version of the manuscript.

Funding

This work was supported by the UNIZA Grant System of the University of Zilina, Slovakia—Project No. O-22-103/0011-03.

Institutional Review Board Statement

The study was conducted in accordance with the Declaration of Helsinki, and approved by the Ethics Committee of Comenius University, Medical Faculty and University Hospital Bratislava (protocol code 48/2021 and date of approval 19 April 2021).

Informed Consent Statement

Informed consent was obtained from all subjects involved in the study.

Data Availability Statement

Data underlying the results presented in this paper are not publicly available at this time but may be obtained from the authors upon reasonable request.

Acknowledgments

The authors thank the Grant System of the University of Zilina for their support.

Conflicts of Interest

The authors declare no conflict of interest.

References

  1. WHO. Diabetes. Available online: https://www.who.int/news-room/fact-sheets/detail/diabetes (accessed on 10 May 2021).
  2. Leonhardt, S. Concluding Remarks and New Horizons in Skin Perfusion Studies. In Studies in Skin Perfusion Dynamics; Springer: Berlin/Heidelberg, Germany, 2021; pp. 223–232. [Google Scholar]
  3. Hertzman, A.B. Photoelectric plethysmography of the fingers and toes in man. Proc. Soc. Exp. Biol. Med. 1937, 37, 529–534. [Google Scholar] [CrossRef]
  4. Such, O.; Acker, S.; Blazek, V. Mapped hemodynamic data acquisition by near infrared CCD imaging. In Proceedings of the 19th Annual International Conference of the IEEE Engineering in Medicine and Biology Society ’Magnificent Milestones and Emerging Opportunities in Medical Engineering’ (Cat. No. 97CH36136); IEEE, Chicago, IL, USA, 30 October–2 November 1997; Volume 2, pp. 637–639. [Google Scholar]
  5. Wu, T.; Blazek, V.; Schmitt, H.J. Photoplethysmography imaging: A New noninvasive and noncontact method for mapping of the dermal perfusion changes. In Proceedings of the Optical Techniques and Instrumentation for the Measurement of Blood Composition, Structure, and Dynamics; International Society for Optics and Photonics, Amsterdam, The Netherlands, 7–8 August 2000; Volume 4163, pp. 62–70. [Google Scholar]
  6. Blazek, V.; Schultz-Ehrenburg, U. Frontiers in computer-aided visualization of vascular functions. In Proceedings of the Seventh International Symposium CNVD’97, Paris, France, 10–12 January 1997; VDI Verlag: Düsseldorf, Germany, 1998. ISBN 3183263203. [Google Scholar]
  7. Verkruysse, W.; Svaasand, L.O.; Nelson, J.S. Remote plethysmographic imaging using ambient light. Opt. Express 2008, 16, 21434. [Google Scholar] [CrossRef] [PubMed] [Green Version]
  8. Tarassenko, L.; Villarroel, M.; Guazzi, A.; Jorge, J.; Clifton, D.A.; Pugh, C. Non-contact video-based vital sign monitoring using ambient light and auto-regressive models. Physiol. Meas. 2014, 35, 807–831. [Google Scholar] [CrossRef] [PubMed]
  9. Kumar, M.; Veeraraghavan, A.; Sabharwal, A. DistancePPG: Robust non-contact vital signs monitoring using a camera. Biomed. Opt. Express 2015, 6, 1565. [Google Scholar] [CrossRef] [PubMed] [Green Version]
  10. Blanik, N.; Heimann, K.; Pereira, C.; Paul, M.; Blazek, V.; Venema, B.; Orlikowsky, T.; Leonhardt, S. Remote vital parameter monitoring in neonatology—Robust, unobtrusive heart rate detection in a realistic clinical scenario. Biomed. Tech. 2016, 61, 631–643. [Google Scholar] [CrossRef] [PubMed]
  11. Wang, W.; Den Brinker, A.C.; Stuijk, S.; De Haan, G. Robust heart rate from fitness videos. Physiol. Meas. 2017, 38, 1023–1044. [Google Scholar] [CrossRef] [PubMed] [Green Version]
  12. Moreno, J.; Ramos-Castro, J.; Movellan, J.; Parrado, E.; Rodas, G.; Capdevila, L. Facial video-based photoplethysmography to detect HRV at rest. Int. J. Sports Med. 2015, 36, 474–480. [Google Scholar] [CrossRef]
  13. Verkruysse, W.; Bartula, M.; Bresch, E.; Rocque, M.; Meftah, M.; Kirenko, I. Calibration of contactless pulse oximetry. Anesth. Analg. 2017, 124, 136–145. [Google Scholar] [CrossRef] [Green Version]
  14. Murakami, K.; Yoshioka, M.; Ozawa, J. Non-contact pulse transit time measurement using imaging camera, and its relation to blood pressure. In Proceedings of the MVA 2015—14th IAPR International Conference on Machine Vision Applications, Tokyo, Japan, 18–22 May 2015; pp. 414–417. [Google Scholar] [CrossRef]
  15. Huelsbusch, M.; Blazek, V. Contactless Mapping of Rhythmical Phenomena in Tissue Perfusion Using PPGI. In Proceedings of the Medical Imaging 2002: Physiology and Function from Multidimensional Images, San Diego, CA, USA, 24–26 February 2002; Volume 4683, p. 110. [Google Scholar] [CrossRef]
  16. Thatcher, J.E.; Li, W.; Rodriguez-Vaqueiro, Y.; Squiers, J.J.; Mo, W.; Lu, Y.; Plant, K.D.; Sellke, E.; King, D.R.; Fan, W.; et al. Multispectral and photoplethysmography optical imaging techniques identify important tissue characteristics in an animal model of tangential burn excision. J. Burn Care Res. 2016, 37, 38–52. [Google Scholar] [CrossRef] [PubMed] [Green Version]
  17. Kuo, J.; Koppel, S.; Charlton, J.L.; Rudin-Brown, C.M. Evaluation of a video-based measure of driver heart rate. J. Safety Res. 2015, 54, 55.e29. [Google Scholar] [CrossRef] [PubMed] [Green Version]
  18. Pilz, C.S.; Zaunseder, S.; Canzler, U.; Krajewski, J. Heart rate from face videos under realistic conditions for advanced driver monitoring. Curr. Dir. Biomed. Eng. 2017, 3, 483–487. [Google Scholar] [CrossRef] [Green Version]
  19. Leonhardt, S.; Leicht, L.; Teichmann, D. Unobtrusive vital sign monitoring in automotive environments—A review. Sensors 2018, 18, 3080. [Google Scholar] [CrossRef] [PubMed] [Green Version]
  20. Koeny, M.; Blanik, N.; Yu, X.; Czaplik, M.; Walter, M.; Rossaint, R.; Blazek, V.; Leonhardt, S. Using photoplethysmography imaging for objective contactless pain assessment. Acta Polytech. 2014, 54, 275–280. [Google Scholar] [CrossRef]
  21. Nitzan, M.; de Boer, H.; Turivnenko, S.; Babchenko, A.; Sapoznikov, D. Power spectrum analysis of spontaneous fluctuations in the photoplethysmographic signal. J. Basic Clin. Physiol. Pharmacol. 1994, 5, 269–276. [Google Scholar] [CrossRef] [PubMed]
  22. Hartmann, V.; Liu, H.; Chen, F.; Qiu, Q.; Hughes, S.; Zheng, D. Quantitative comparison of photoplethysmographic waveform characteristics: Effect of measurement site. Front. Physiol. 2019, 10, 198. [Google Scholar] [CrossRef]
  23. Liu, H.; Chen, F.; Hartmann, V.; Khalid, S.G.; Hughes, S.; Zheng, D. Comparison of different modulations of photoplethysmography in extracting respiratory rate: From a physiological perspective. Physiol. Meas. 2020, 41, 094001. [Google Scholar] [CrossRef]
  24. Nilsson, L.M. Respiration signals from photoplethysmography. Anesth. Analg. 2013, 117, 859–865. [Google Scholar] [CrossRef] [Green Version]
  25. Allen, J. Quantifying the delays between multi-site photoplethysmography pulse and electrocardiogram r-r interval changes under slow-paced breathing. Front. Physiol. 2019, 10, 1190. [Google Scholar] [CrossRef] [Green Version]
  26. Shields, J.W. Heart rate variability with deep breathing as a clinical test of cardiovagal function. Cleve. Clin. J. Med. 2009, 76, 37–40. [Google Scholar] [CrossRef]
  27. Hynynen, E.; Konttinen, N.; Kinnunen, U.; Kyröläinen, H.; Rusko, H. The incidence of stress symptoms and heart rate variability during sleep and orthostatic test. Eur. J. Appl. Physiol. 2011, 111, 733–741. [Google Scholar] [CrossRef]
  28. Levin, A.B. A simple test of cardiac function based upon the heart rate changes induced by the valsalva maneuver. Am. J. Cardiol. 1966, 18, 90–99. [Google Scholar] [CrossRef]
  29. Ewing, D.J.; Martyn, C.N.; Young, R.J.; Clarke, B.F. The Value of Cardiovascular Autonomic Function Tests: 10 Years Experience in Diabetes. Diabetes Care 1985, 8, 491–498. [Google Scholar] [CrossRef]
  30. Hu, S.; Azorin-Peris, V.; Zheng, J. Opto-Physiological Modeling Applied to Photoplethysmographic Cardiovascular Assessment. J. Healthc. Eng. 2013, 4, 505–528. [Google Scholar] [CrossRef] [Green Version]
  31. Lucas, B.D.; Kanade, T. An iterative image registration technique with an application to stereo vision. In Proceedings of the 7th International Joint Conference on Artificial Intelligence, Vancouver, BC, Canada, 24–28 August 1981. [Google Scholar]
  32. Tomasi, C.; Kanade, T. Detection and Tracking of Point Features; (Technical Report CMUCS-91-132); Carnegie Mellon University: Pittsburgh, PA, USA, 1991. [Google Scholar]
  33. Zheng, J.; Hu, S.; Azorin-Peris, V.; Echiadis, A.; Chouliaras, V.; Summers, R. Remote simultaneous dual wavelength imaging photoplethysmography: A further step towards 3-D mapping of skin blood microcirculation. In Proceedings of the Multimodal Biomedical Imaging III, San Jose, CA, USA, 19–24 January 2008; Volume 6850, p. 68500S. [Google Scholar]
  34. Pan, J.; Tompkins, W.J. A real-time QRS detection algorithm. IEEE Trans. Biomed. Eng. 1985, BME-32, 230–236. [Google Scholar] [CrossRef] [PubMed]
  35. Perlitz, V.; Cotuk, B.; Lambertz, M.; Grebe, R.; Schiepek, G.; Petzold, E.R.; Schmid-Schönbein, H.; Flatten, G. Coordination dynamics of circulatory and respiratory rhythms during psychomotor drive reduction. Auton. Neurosci. Basic Clin. 2004, 115, 82–93. [Google Scholar] [CrossRef]
  36. Schwerdtfeger, A.R.; Schwarz, G.; Pfurtscheller, K.; Thayer, J.F.; Jarczok, M.N.; Pfurtscheller, G. Heart rate variability (HRV): From brain death to resonance breathing at 6 breaths per minute. Clin. Neurophysiol. 2020, 131, 676–693. [Google Scholar] [CrossRef] [PubMed]
  37. Pfurtscheller, G.; Schwerdtfeger, A.R.; Rassler, B.; Andrade, A.; Schwarz, G.; Klimesch, W. Verification of a central pacemaker in brain stem by phase-coupling analysis between HR interval- and BOLD-oscillations in the 0.10–0.15 Hz frequency Band. Front. Neurosci. 2020, 14, 922. [Google Scholar] [CrossRef]
  38. Kamshilin, A.A.; Miridonov, S.; Teplov, V.; Saarenheimo, R.; Nippolainen, E. Photoplethysmographic imaging of high spatial resolution. Biomed. Opt. Express 2011, 2, 996. [Google Scholar] [CrossRef] [Green Version]
  39. Borik, S.; Procka, P.; Kubicek, J.; Antink, C.H. Skin tissue perfusion mapping triggered by an audio-(de) modulated reference signal. Biomed. Opt. Express 2022, 13, 4058–4070. [Google Scholar] [CrossRef]
  40. Low, P.A.; Neumann, C.; Dyck, P.J.; Fealey, R.D.; Tuck, R.R. Evaluation of skin vasomotor reflexes by using laser doppler velocimetry. Mayo Clin. Proc. 1983, 58, 583–592. [Google Scholar]
  41. Wallin, B.G.; Båtelsson, K.; Kienbaum, P.; Karlsson, T.; Gazelius, B.; Elam, M. Two neural mechanisms for respiration-induced cutaneous vasodilatation in humans? J. Physiol. 1998, 513, 559–569. [Google Scholar] [CrossRef]
  42. Rauh, R.; Posfay, A.; Mück-Weymann, M. Quantification of inspiratory-induced vasoconstrictive episodes: A comparison of laser doppler fluxmetry and photoplethysmography. Clin. Physiol. Funct. Imaging 2003, 23, 344–348. [Google Scholar] [CrossRef] [PubMed]
  43. Bernardi, L.; Radaelli, A.; Solda’, P.L.; Coats, A.J.S.; Reeder, M.; Calciati, A.; Garrard, C.S.; Sleight, P. Autonomic control of skin microvessels: Assessment by power spectrum of photoplethysmographic waves. Clin. Sci. 1996, 90, 345–355. [Google Scholar] [CrossRef]
  44. Nilsson, L.; Johansson, A.; Kalman, S. Macrocirculation is not the sole determinant of respiratory induced variations in the reflection mode photoplethysmographic signal. Physiol. Meas. 2003, 24, 925. [Google Scholar] [CrossRef]
  45. Allen, J.; Frame, J.R.; Murray, A. Microvascular blood flow and skin temperature changes in the fingers following a deep inspiratory gasp. Physiol. Meas. 2002, 23, 365. [Google Scholar] [CrossRef] [PubMed]
  46. Nitzan, M.; Faib, I.; Friedman, H. Respiration-induced changes in tissue blood volume distal to occluded artery, Measured by photoplethysmography. J. Biomed. Opt. 2006, 11, 40506. [Google Scholar] [CrossRef] [PubMed]
  47. Borik, S.; Lyra, S.; Perlitz, V.; Keller, M.; Leonhardt, S.; Blazek, V. On the spatial phase distribution of cutaneous low-frequency perfusion oscillations. Sci. Rep. 2022, 12, 5997. [Google Scholar] [CrossRef]
  48. van Netten, J.J.; van Baal, J.G.; Liu, C.; van Der Heijden, F.; Bus, S.A. Infrared thermal imaging for automated detection of diabetic foot complications. J. Diabetes Sci. Technol. 2013, 7, 1122–1129. [Google Scholar] [CrossRef] [Green Version]
  49. Urbancic-Rovan, V.; Stefanovska, A.; Bernjak, A.; Ažman-Juvan, K.; Kocijančič, A. Skin blood flow in the upper and lower extremities of diabetic patients with and without autonomic neuropathy. J. Vasc. Res. 2004, 41, 535–545. [Google Scholar] [CrossRef] [PubMed]
  50. Shapiro, S.A.; Stansberry, K.B.; Hill, M.A.; Meyer, M.D.; McNitt, P.M.; Bhatt, B.A.; Vinik, A.I. Normal blood flow response and vasomotion in the diabetic charcot foot. J. Diabetes Complicat. 1998, 12, 147–153. [Google Scholar] [CrossRef]
Figure 1. Measurement Setup—BIOPAC (ECG, PPG, RR), FLIR machine vision camera (BFS-U3-28S5M), LED illumination source and registration unit (laptop).
Applsci 12 07658 g001
Figure 2. Stages of the experiment.
Applsci 12 07658 g002
Figure 3. Data processing steps. Ordered from the left, stage 1 to stage 5.
Applsci 12 07658 g003
Figure 4. Left—Different averaging masks and their impact on HR accuracy, right—foot with marked locations for signal extraction.
Applsci 12 07658 g004
Figure 5. (a) Frame from the video record with marked points of signal extraction; (b) PPGI signals between 200 s and 400 s from different foot locations after tracking (colours of PPGI signals correspond to marked points on foot) together with signals obtained using the BIOPAC device (ECG, RR, PPG). The THD section is highlighted on the graph with black dashed horizontal lines; (c) zoom-in area from 330 s to 350 s of the recording (ECG, PPG, and 3 PPGI signals).
Applsci 12 07658 g005
Figure 6. Correlation maps of DM (1,2) and healthy (3,4) subjects (one subject in a row). The first column shows a frame from the recording with a bounded region of interest (white rectangle). The coloured maps represent the output from the correlation mapping script before, during, and after the DBT, respectively. In the right part, there are the signals from the places marked on the first column (the colours of the signals correspond to the marked points). The black signal is the PPG obtained with the BIOPAC device from the little toe of the proband’s foot.
Applsci 12 07658 g006
Figure 7. (a) correlation map with marked regions (Upper, Middle, Lower); (b) Bar graphs with normalized values of correlation coefficients from marked regions for comparison of the perfusion changes in different stages of the experiment.
Applsci 12 07658 g007
Publisher’s Note: MDPI stays neutral with regard to jurisdictional claims in published maps and institutional affiliations.

