1. Introduction
With its economic development, massive infrastructure construction has been carried out in China, especially highway projects. As an important part of highway systems, the number of interchanges which connect all the roads is gradually increasing.
Interchanges are often constructed beneath existing bridges and roads. It is inevitable that interactions between interchanges and existing structures will occur. In some cases, considering the normal operation of underpass roads, the design and construction of interchanges may be adjusted. In addition, the filling of the underpass road embankment may cause the lateral displacement of the pier column of the overpass bridge, especially in areas with soft soil [
1]. The soft soil foundation under surcharge loading may also produce large lateral deformation while settling, which may cause the inclination of adjacent bridge piers [
2,
3]. The pier inclination causes excessive support slip, expansion joint damage, and other related issues, which influence the structural safety and operation, even resulting in increased economic and social costs [
4,
5,
6].
Traditionally, based on numerical simulations, bridge pier inclination will occur due to structural factors such as structure traits and eccentric compression on the pier resulting from the superstructure load [
7,
8]. On the other hand, asymmetric foundation settlement under external load will also result in pier inclination [
9,
10,
11]. Soil excavation and surcharge will cause asymmetric foundation settlement; many researchers have conducted a lot of research on the influence of surcharge on adjacent piles and piers [
12,
13,
14,
15,
16]. Kelesoglu. M. K et al. discussed the effectiveness of an analysis method for pile foundation under adjacent overload load [
17], and Yue. Li et al. analyzed the dynamic response of a foundation pit supporting structure under vehicle load through numerical simulation and found that the closer the vehicle load is to it, the greater the displacement of the supporting pile [
18]. The methods used to analyze the influence of the lateral displacement of soil on the adjacent pile foundations under surcharge loading mainly assess soil pressure and soil displacement. The method based on soil pressure can make a reasonable assumption and evaluation of the horizontal extrusion force induced by lateral soil displacement [
19,
20]. However, pile–soil interactions are mainly caused by the lateral displacement of soil. The method based on soil displacement can better reflect the passive pile–soil interaction in the mechanism [
21,
22].
Engineering structure disease is an integrative process affected by multiple factors. Except traditional structural analysis methods, in recent years, many scholars have discussed engineering disease caused by forensic engineering [
23,
24]. As defined by ASCE, forensic engineering is the execution of engineering principles in the investigation of disease or various structural performance problems [
25]. The forensic engineering process has been applied in cases in Italy [
26,
27], Turkey [
28,
29], and the US [
30]. The basic questions of an event to consider include: (1) what is the problem; (2) what is the severity and measure of the problem; (3) when did the problem occur; (4) why does the problem of concern occur? [
31,
32]. In engineering projects, the construction process, quality, and security are tightly coupled. Wangberg et al. [
33] conducted a statistical analysis showing that the increase in safety performance is related to the increase in quality performance. Further research indicated that one type of performance positively influences the other [
34,
35]. Therefore, all data related to the project, including the construction process, quality and security data, should be considered for forensic engineering investigation.
A numerical simulation considers the influence of various factors on the structure quantitatively, and then finds out what factors result in disease. However, it is limited to the structural response under loads. Engineering disease is related to structural response and construction process. Due to the non-reproducible characteristics of the construction process, many problems that occur in the midst of it cannot be specifically considered in numerical simulations, such as the rigid body deformation of the pier caused by asymmetric foundation settlement before the superstructure is constructed. Forensic engineering provides a method to find the time of occurrence and amount of damage through some engineering principal relationships in field investigation data.
In 2019, obvious disease phenomenon, such as pier inclination, excessive support slipping, and expansion joint damage, were found in the ramp bridge in Guangdong Province, China. As the structure had been 3 years prior, it is difficult to find out how the disease occurred and take the appropriate treatment measures. The main aim of this research is to reveal the process of disease occurrence, in this case combining a forensic engineering field investigation and numerical analysis. The time of occurrence and amount of disease were determined through forensic engineering investigation data cooperation relations in the pier–support–girder region and verified with numerical results considering soil elastoplastic and nonlinear soil–structure interactions. Then, appropriate treatment measures to repair the piers and supports are proposed based on cause analysis. Finally, technical and ethical factors leading to the disease are summarized. From this case study, the design and construction process of high-pier bridges with a soft soil foundation should be carefully considered to avoid the eccentric compression of the pier and asymmetric foundation settlement.
2. Engineering Background
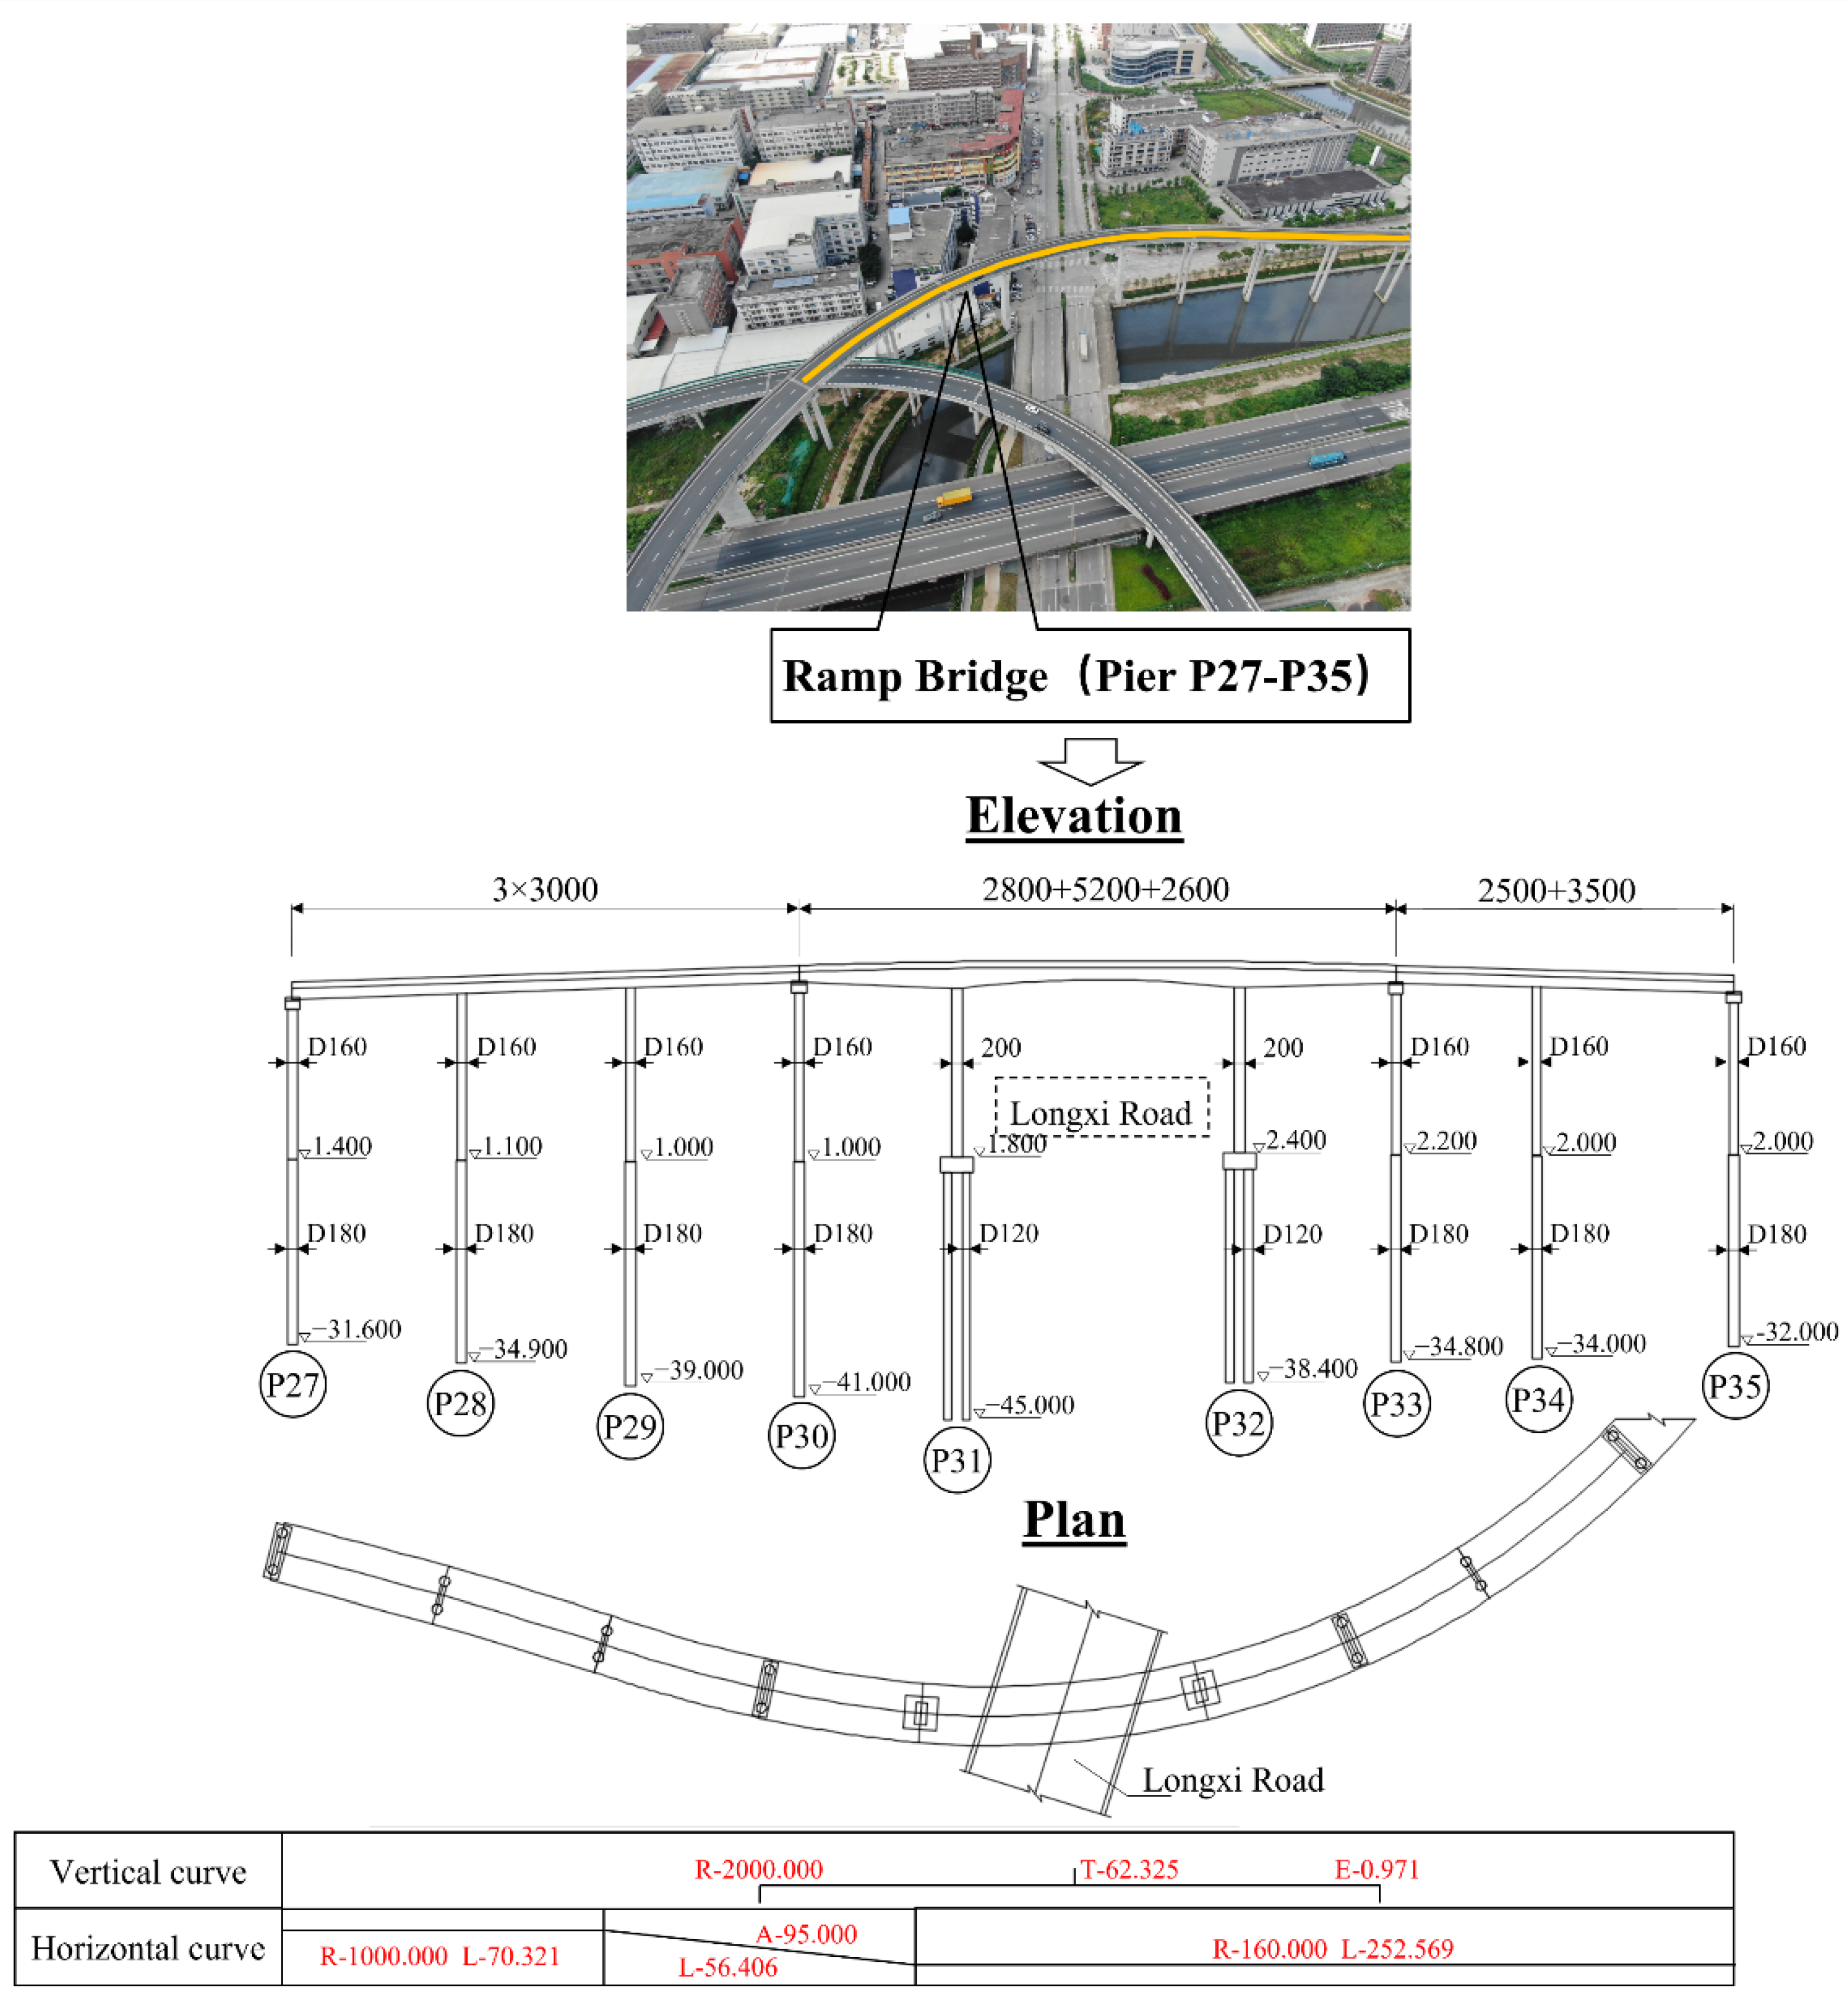
Longxi interchange ramp bridge of Guangzhou–Zhongshan–Jiangmen Expressway, which connects the North Jiangzhu Extension Expressway and Zhongjiang Expressway, with a total length of 1452.236 m, as shown in
Figure 1.
The original design of the ramp bridge adopted cast-in-situ concrete box girders. Since the long closure time of Longxi Road between Piers P30 and P33 had an impact on the surroundings, the original design was changed, and a steel box girder was adopted between Piers P30 and P33.
The ramp is composed of three bridges, including: a PC box girder bridge with spans of 3 × 30 m, a steel box girder bridge with spans of 28 m + 52 m + 26 m, and a PC box girder bridge with spans of 25 m + 35 m. The superstructures include a cast-in-place PC box girder between Piers P27 and P30, a steel box girder between Piers P30 and P33, and a cast-in-place PC box girder between Piers P33 and P35. The substructures include cast-in-place piles and double-column piers. The height of the pier is about 30 m. Additionally, Piers P28, P29, and P34 are consolidated with the girders. The layout of the ramp is shown in
Figure 2.
The concrete box girder bridge between Piers P27 and P30 was completed in April 2016, the concrete box girder bridge between Piers P33 and P35 was constructed in October 2016, and, subsequently, the steel box girder bridge between Piers P30 and P33 was finished in November 2016.
The ramp was fully completed in December 2016. In July 2019, obvious disease phenomenon, such as pier inclination, excessive support slipping, and expansion joint damage, was observed in the ramp between Piers P27 and P35. This is shown in
Figure 3. As the ramp bridge was built over a period of 3 years, it is difficult to find out how the disease occurred and take appropriate treatment measures.
3. Methodology
3.1. Research Procedure
This article conducted a forensic engineering field investigation and numerical analysis to reveal the process of disease occurrance. The time of occurrence and amount of damage were determined through forensic engineering investigation data cooperation relations in the pier–support–girder region.
In this case, the engineering principles of pier inclination and support slipping in the bridges are summarized as follows:
Pier inclination is induced by the dead load of the superstructure and the foundation deformation at the bottom of the pier; then, pier inclination leads to support slipping.
Support slips when the longitudinal displacement of the girder occurs due to the environment temperature, creep of concrete, and inclination of the consolidated pier.
Support slipping is determined by the pier inclination and the longitudinal displacement of the girder.
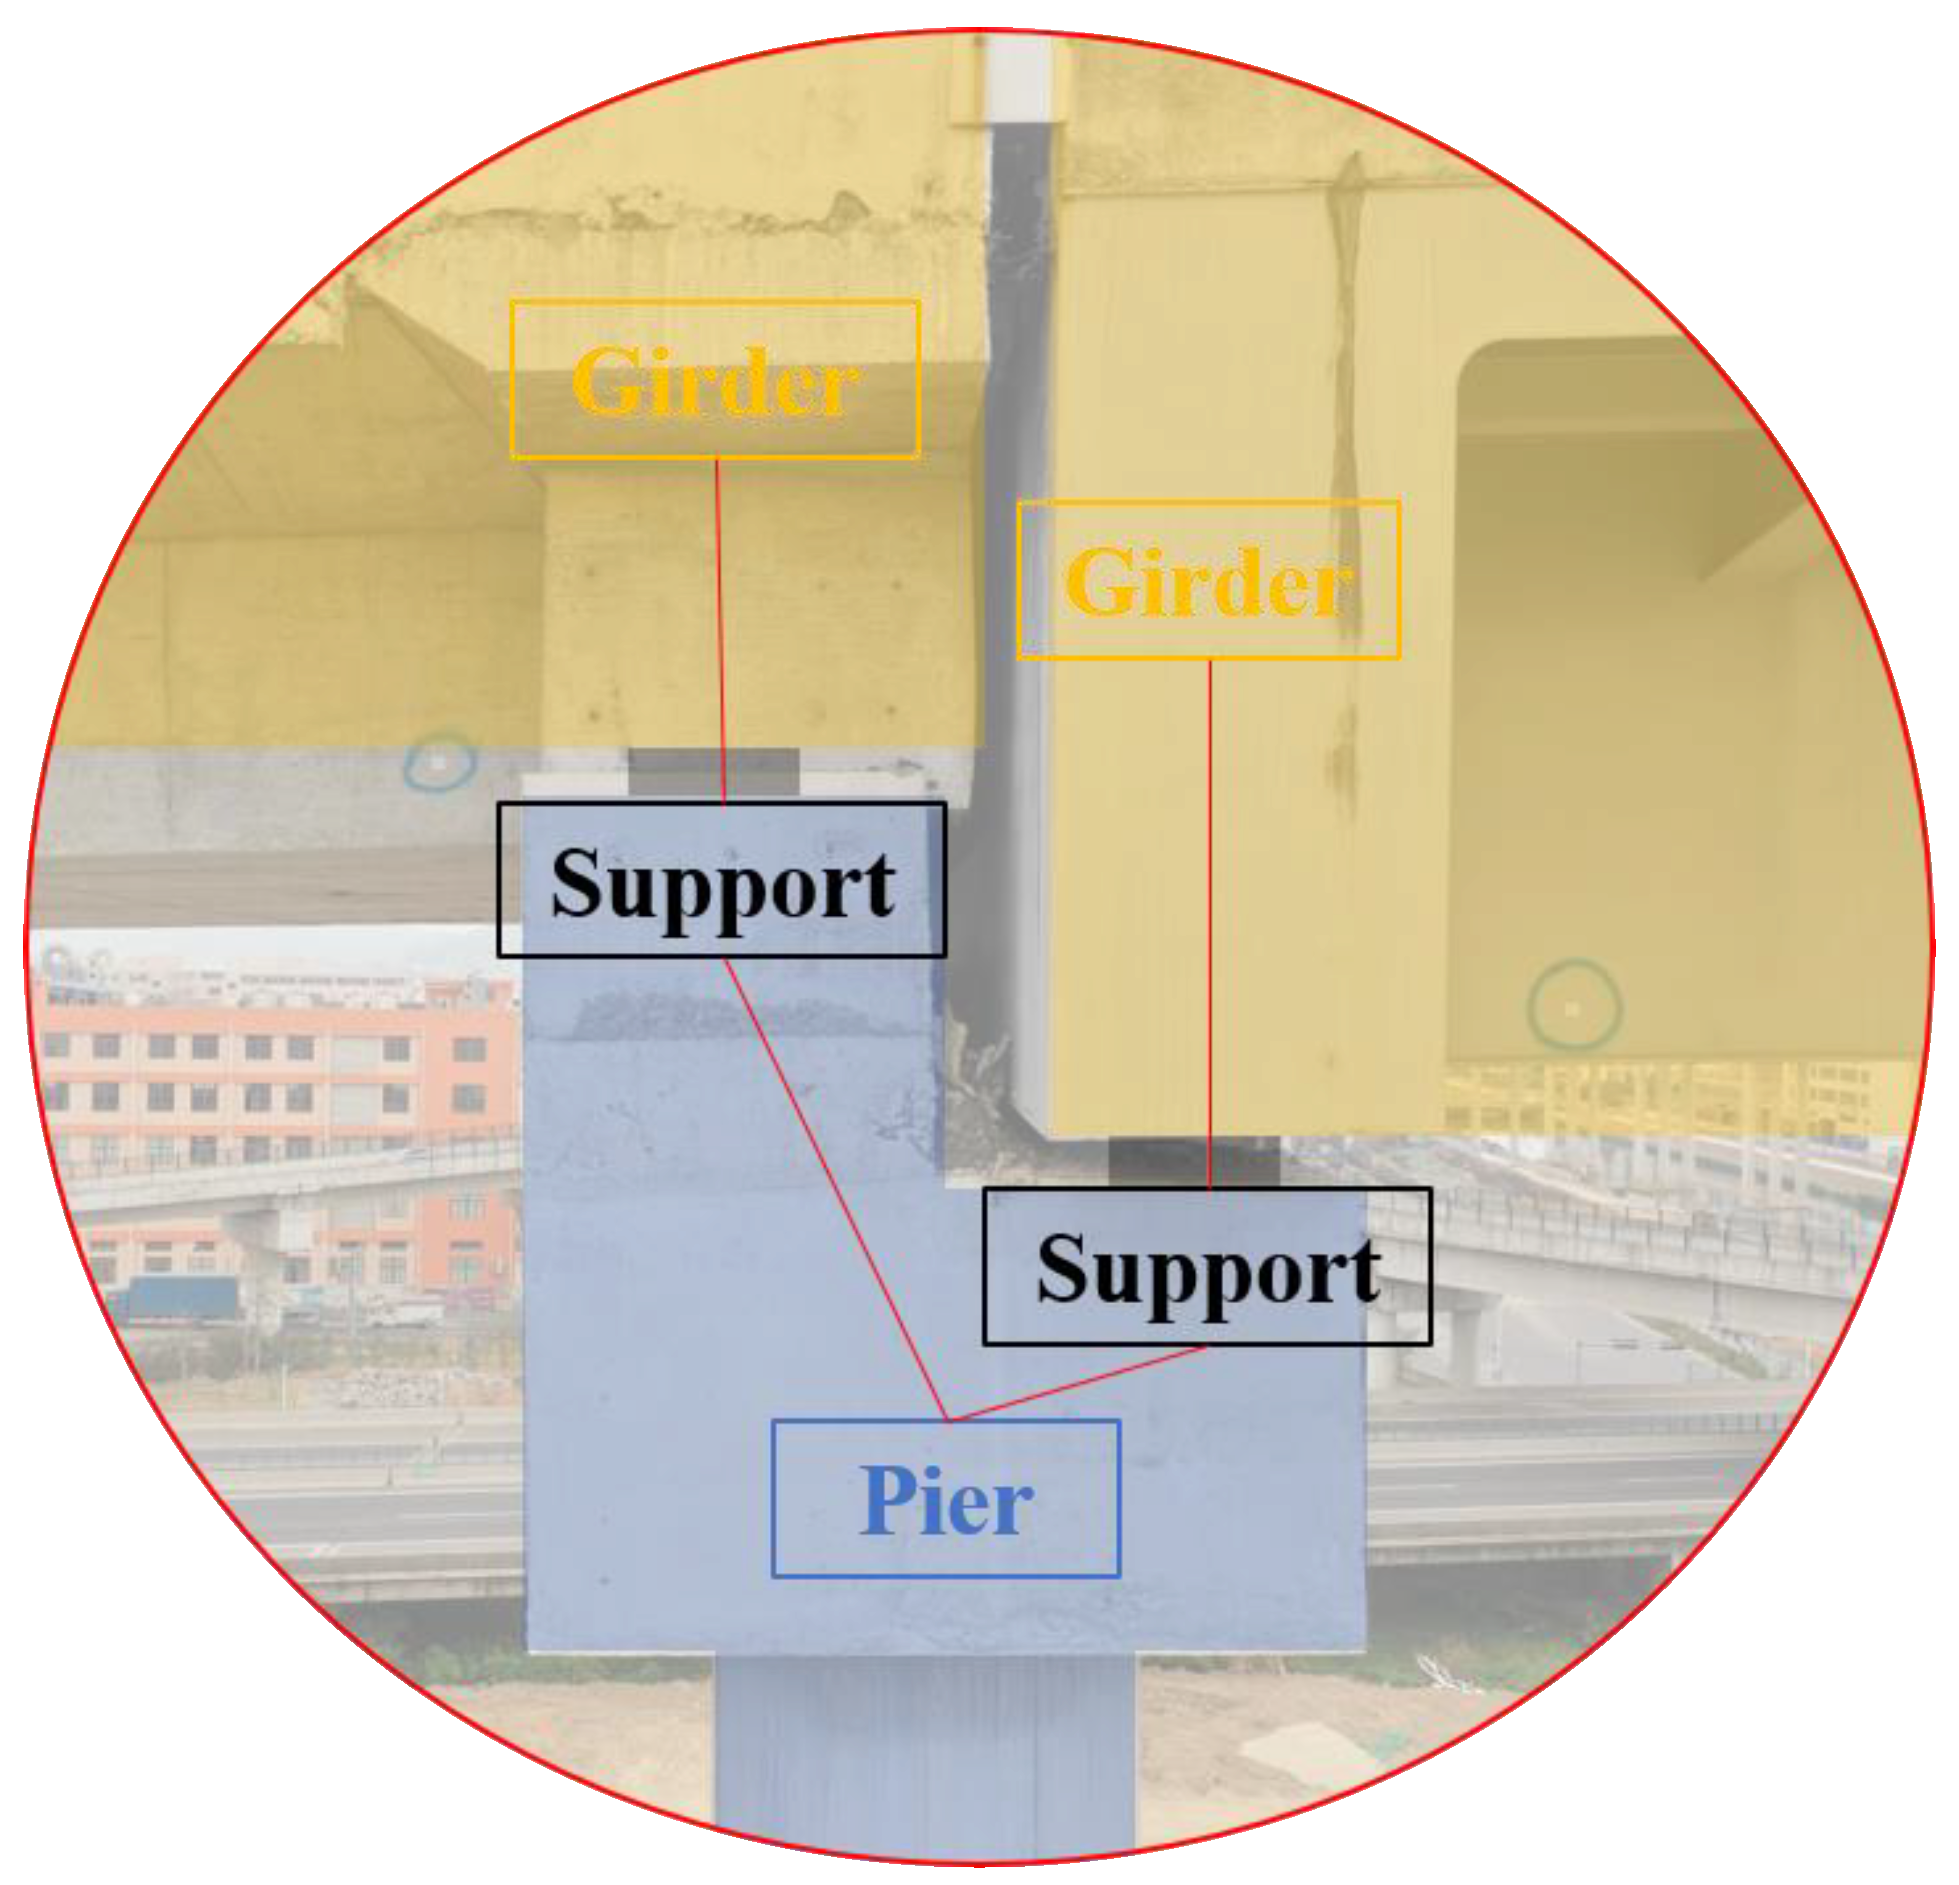
As mentioned above, it is important to determine displacement relations among the pier, support, and girder end. This paper proposes a critical pier–support–girder region to explain the cause of disease in detail, as shown in
Figure 4.
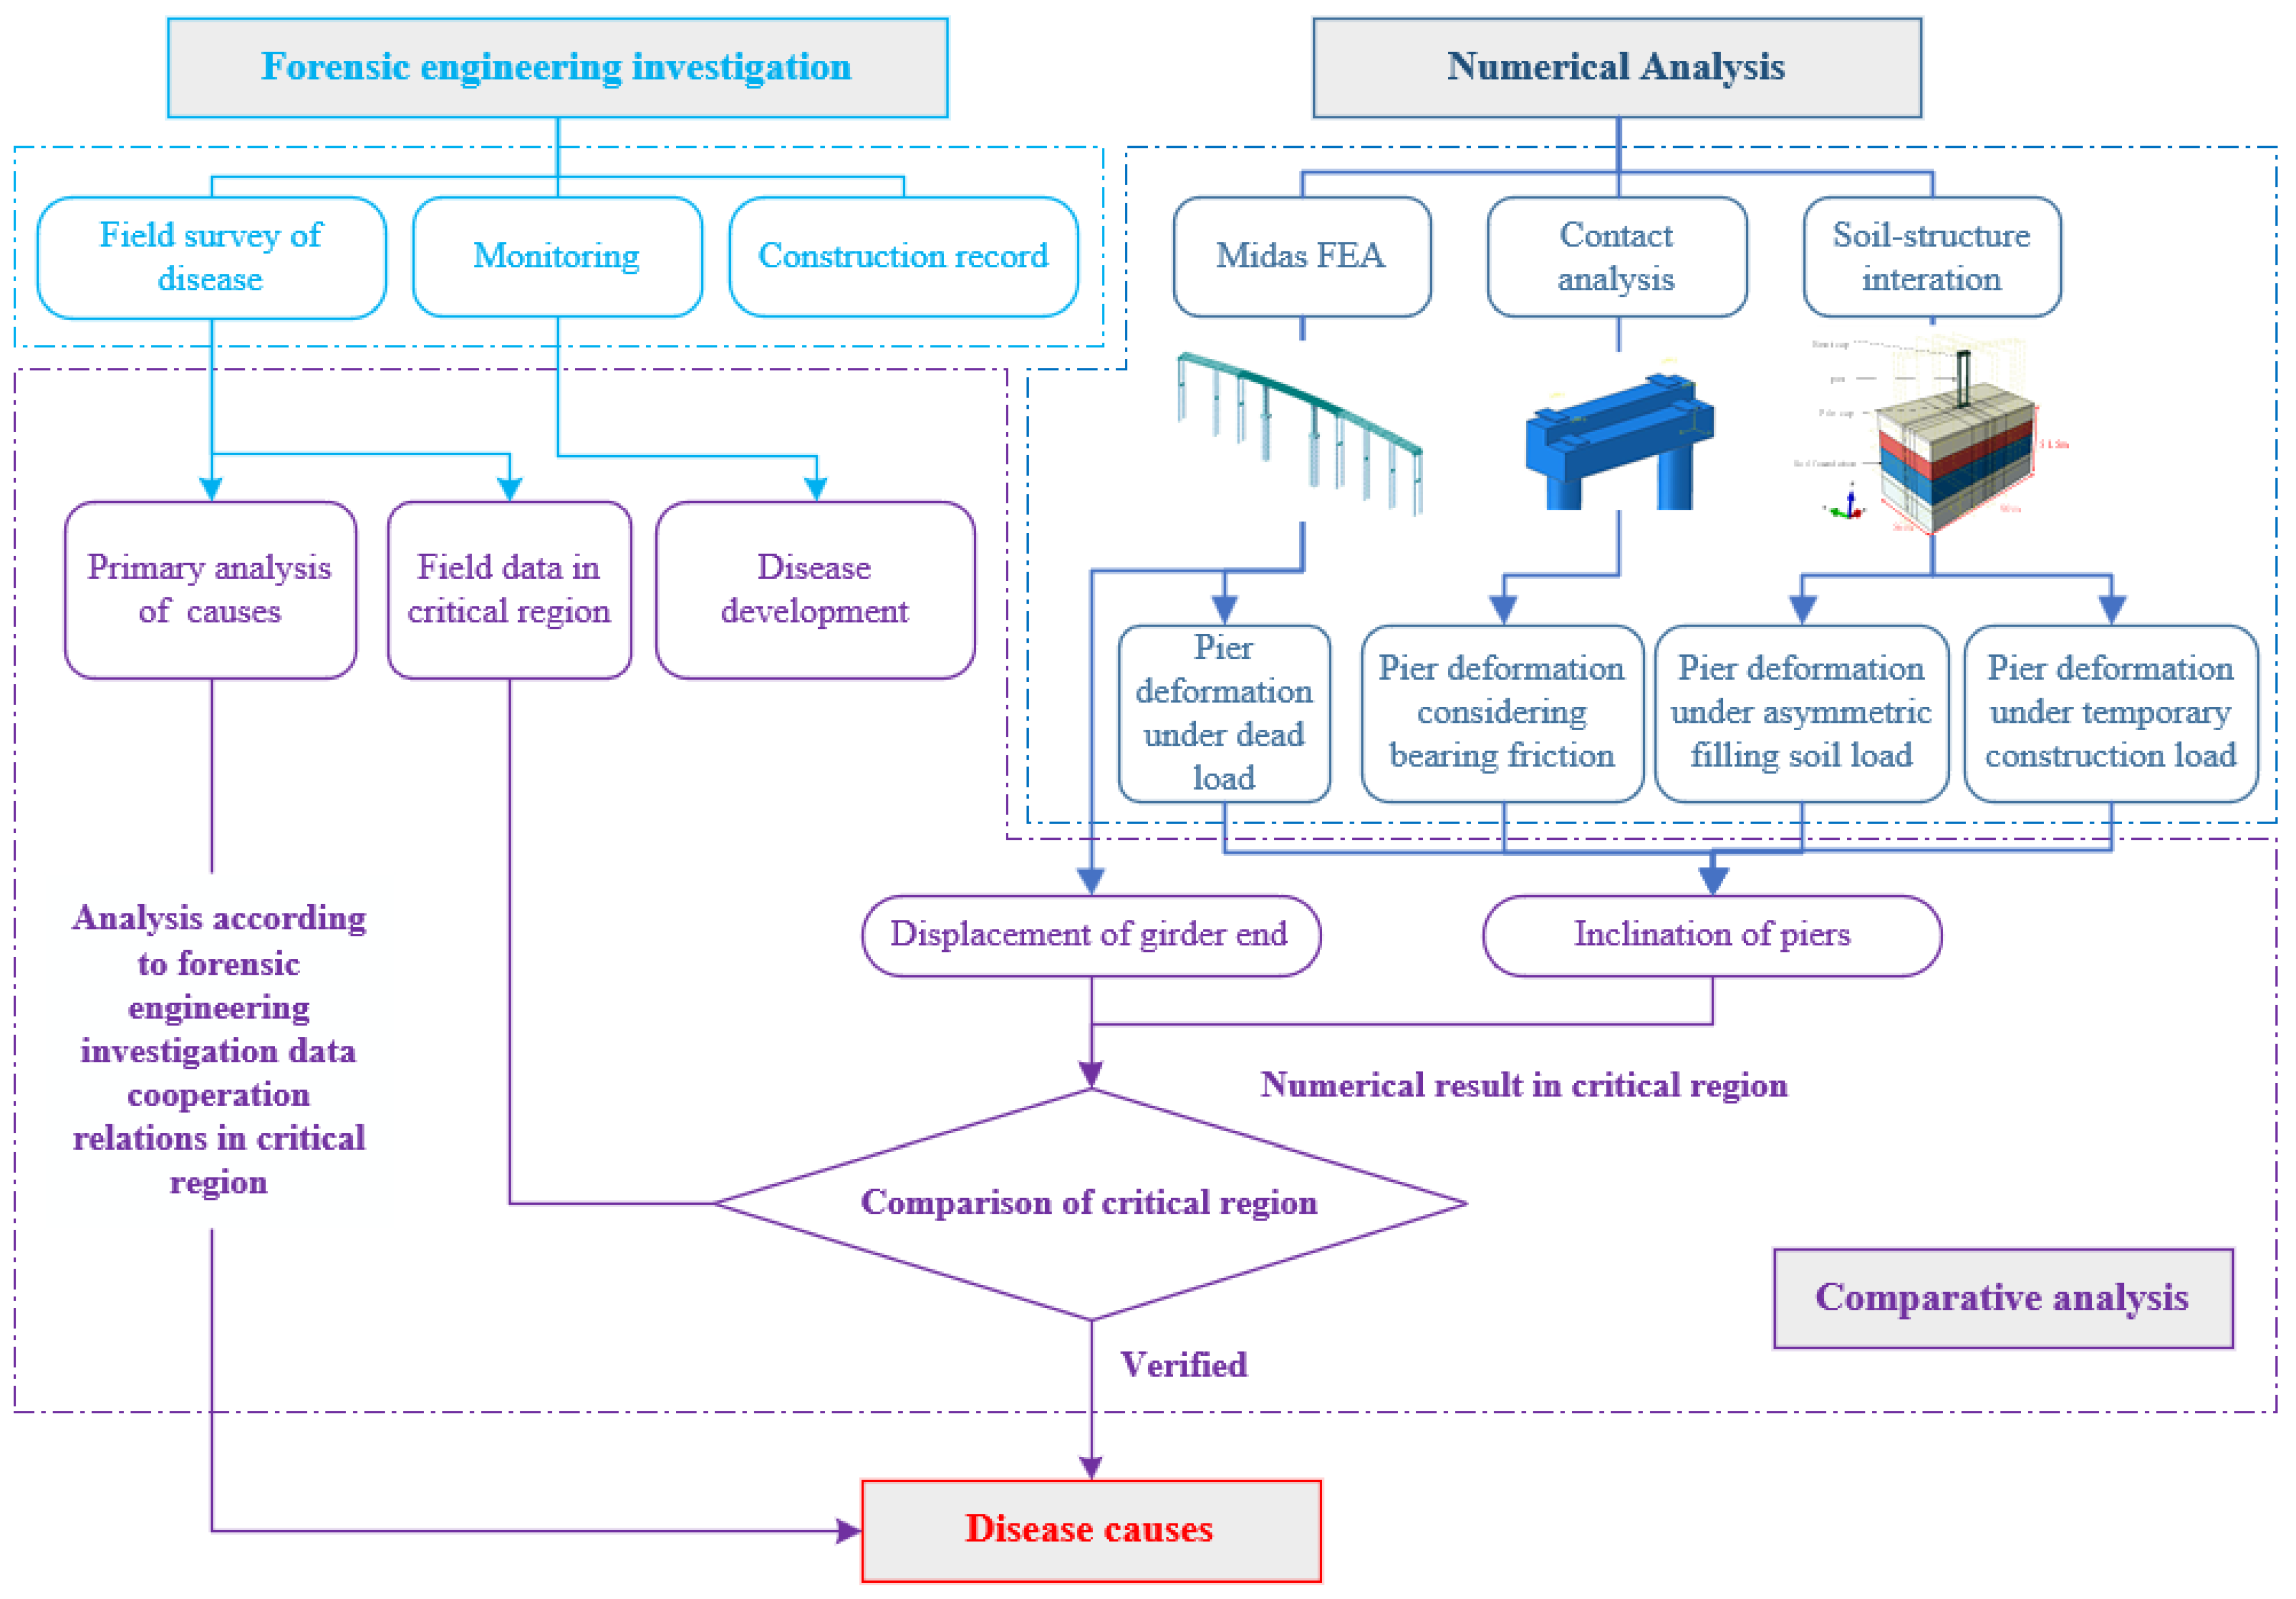
As shown in
Figure 5, the problem was solved through a forensic engineering field investigation, numerical analysis, and comparative analysis. Firstly, a forensic engineering field investigation was conducted, including a field survey, monitoring, and construction record. In the field survey, the occurrence time and amount of damage are determined according to the displacement relations in the critical region based on forensic engineering. The monitoring was conducted to identify the development of disease in the bridge. The construction record was used to determine the quality of construction and geometry of the ramp bridge. Then, in the numerical analysis, several finite element methods were used to analyze structure response in the critical region, including pier inclination under different loads and girder-end displacement. Finally, the reason for the disease is verified by a comparative analysis of field data and numerical results.
3.2. Calculation Methods of Pier Inclination and Support Slipping
This section proposes the calculation methods of pier inclination and support slipping based on structure deformation process.
3.2.1. Calculation Method of Pier Inclination
The pier inclination value is calculated as follows:
where ∆
1 refers to pier inclination under dead load (considering the impact of support friction); ∆
2 refers to pier inclination under asymmetric filling soil load. The inclination value is positive along the direction of pier number increasing.
3.2.2. Calculation Method of Support Slipping and the Length of Slip Mark on Top Plate
Support slipping consists of two parts: (1) Slipping caused by the pier inclination occurs after the support is installed (note that the pier inclination occurs before the support is installed and does not lead to slipping). (2) Slipping caused by the displacement of the girder end (e.g., temperature, shrinkage and creep of concrete, rigid body movement of girder, etc.).
As shown in
Figure 6, assuming that the top and bottom plates are strictly aligned when the support is installed, the relative movement between the top and bottom plates at a certain time is defined as the support slipping value, and calculated as follows:
where s
1 is slipping caused by the pier inclination after the support is installed; s
2, s
3, and s
4 are slipping caused by girder-end displacement under concrete shrinkage and creep, temperature, and the rigid body movement of the girder, respectively. A positive value highlights the top plate moves towards the direction of pier number increasing.
Support slipping under pressure forms a slip mark on the top plate, as shown in
Figure 7. The length of the slip mark represents the slip process of the support accurately since the slip mark is formed after the girder is set on pier.
When the centerline of the top plate is always on one side of the support centerline during slip, as shown in
Figure 7a, the centerline of the top plate is to the right of the support centerline at stage a_2, and the length of slip mark is calculated as follows:
When the centerline of the top plate crosses from one side of the support centerline to the other during slip, as shown in
Figure 7b, the centerline of the top plate is s_L to the right of the support centerline at stage b_2 and s_m to the left of the support centerline at stage b_3 (the slipping interval is [s_m, s_l]). The length of the slip mark is calculated as follows:
4. Engineering Field Investigation
Obvious disease phenomenon, such as pier inclination, excessive support slipping, and expansion joint damage, was found in the ramp between Piers P27 and P35. To determine the cause of this, a detailed forensic engineering field investigation was carried out, including looking at the related construction record, conducting a field survey of disease, conducting a field survey of structure and surroundings, and monitoring disease development.
4.1. Related Construction Record
Engineering disease is related to structural responses and the construction process. Due to the non-reproducible characteristics of the construction process, a related construction record investigation was conducted, including design change information, the construction scheme and schedule, geological prospecting data and construction quality assessment reports, which can determine the construction quality of the ramp bridge and conduct a numerical analysis that closely resembles the real situation.
Design change and construction schedule: The design change information and construction schedule are introduced in the engineering background.
Geological prospecting information: The ramp bridge site is located in the soft soil foundation. According to the field geological prospecting conditions, there are mainly four layers in the soil foundation, and the measured parameters of each soil layer are given in
Table 1.
Quality assessment reports: According to the quality assessment reports provided by the supervision unit, the construction quality and geometry of the ramp met the requirements of the design codes, which means that the values of pier inclination were within the minimum, between 20 mm and 0.3% of the pier height. In other words, there was no pier inclination when the substructures were constructed.
4.2. Field Survey of Disease
A detailed forensic engineering field investigation of disease was carried out in March 2020, when the outdoor temperature was 19 °C and the weather was cloudy. The degradation includes:
Pier inclination: Piers P27, P28, P29, P30, P33, P34, and P35 were obviously inclined, and the maximum inclination of the top pier was up to 12 cm. However, there were no cracks, concrete defects, or other damage found on the pier columns.
Support slipping: Supports on Piers P30 and P33 had slipped excessively, which exceeded the design maximum limit value of ±10 cm.
Expansion joint damage: The expansion joint on Pier P33 was large; the other expansion joints worked properly.
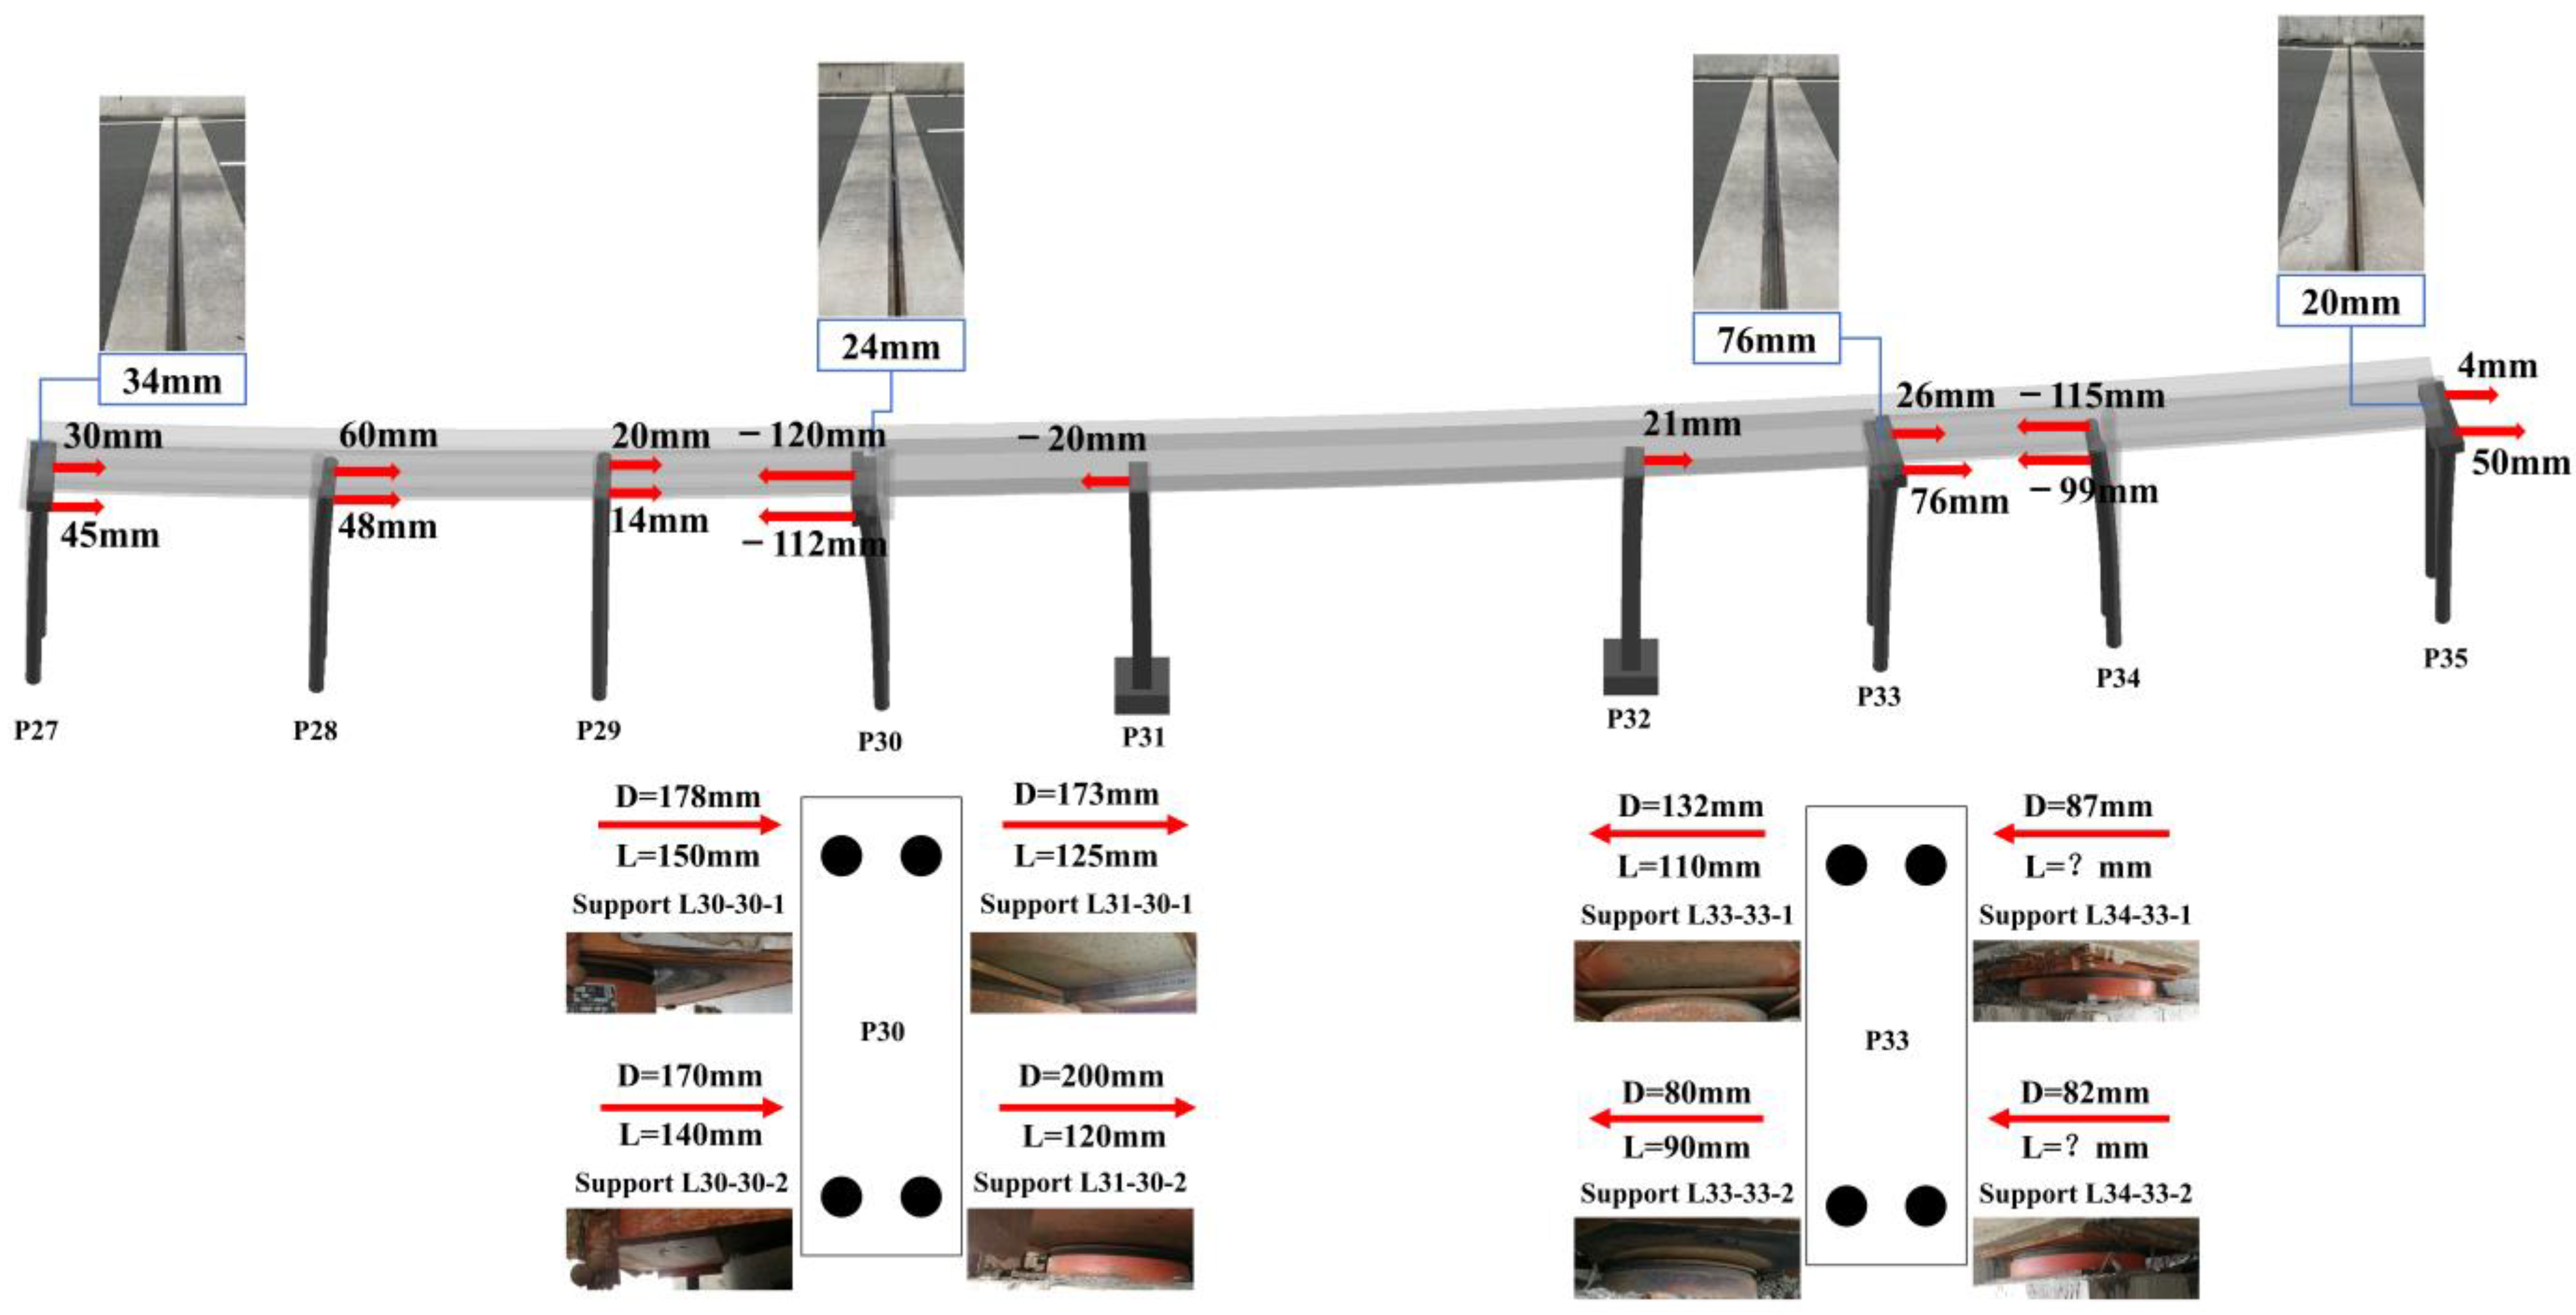
Detailed forensic disease investigation data are shown in
Figure 8. (The symbols and notations in
Figure 8 are summarized as follows: ① arrows at the top of the pier column in the figure represent the inclination direction, and a positive value shows that the inclination direction as the pier number is increasing; ② within the support region, the arrow to the right highlights the top plate moves as the pier number is increasing. D refers to the relative slip between the top and bottom plates, and L refers to the length of the slip mark on the top plate; ③ the expansion joint width was measured at 19 °C.)
4.3. Field Survey of Structure and Surroundings
4.3.1. Eccentricity of Support on Cap
As shown in
Figure 9, the design eccentricities of the supports on Piers P30 and P33 are 89 cm for each concrete side. Since the original design was changed, i.e., a steel box girder was adopted between Piers P31 and P32, the design eccentricities of the supports on Piers P30 and P33 were adjusted to 89 cm for the concrete side and 54 cm for the steel side. However, the engineering field investigation showed the great difference between the measured and design values of the support. The field data are 64 cm for the concrete side and 53.5 cm for the steel side on Pier P30, and 100 cm for the concrete side and 45 cm for the steel side on Pier P33. The measured support eccentricities should be considered in numerical analysis.
4.3.2. Distance between Girder Ends
The distance between girder ends can help to determine whether the superstructure moves and the support slipping, so the distances between girder ends were measured in the field survey. The distances between girder ends are depicted in
Table 2.
4.3.3. Surroundings
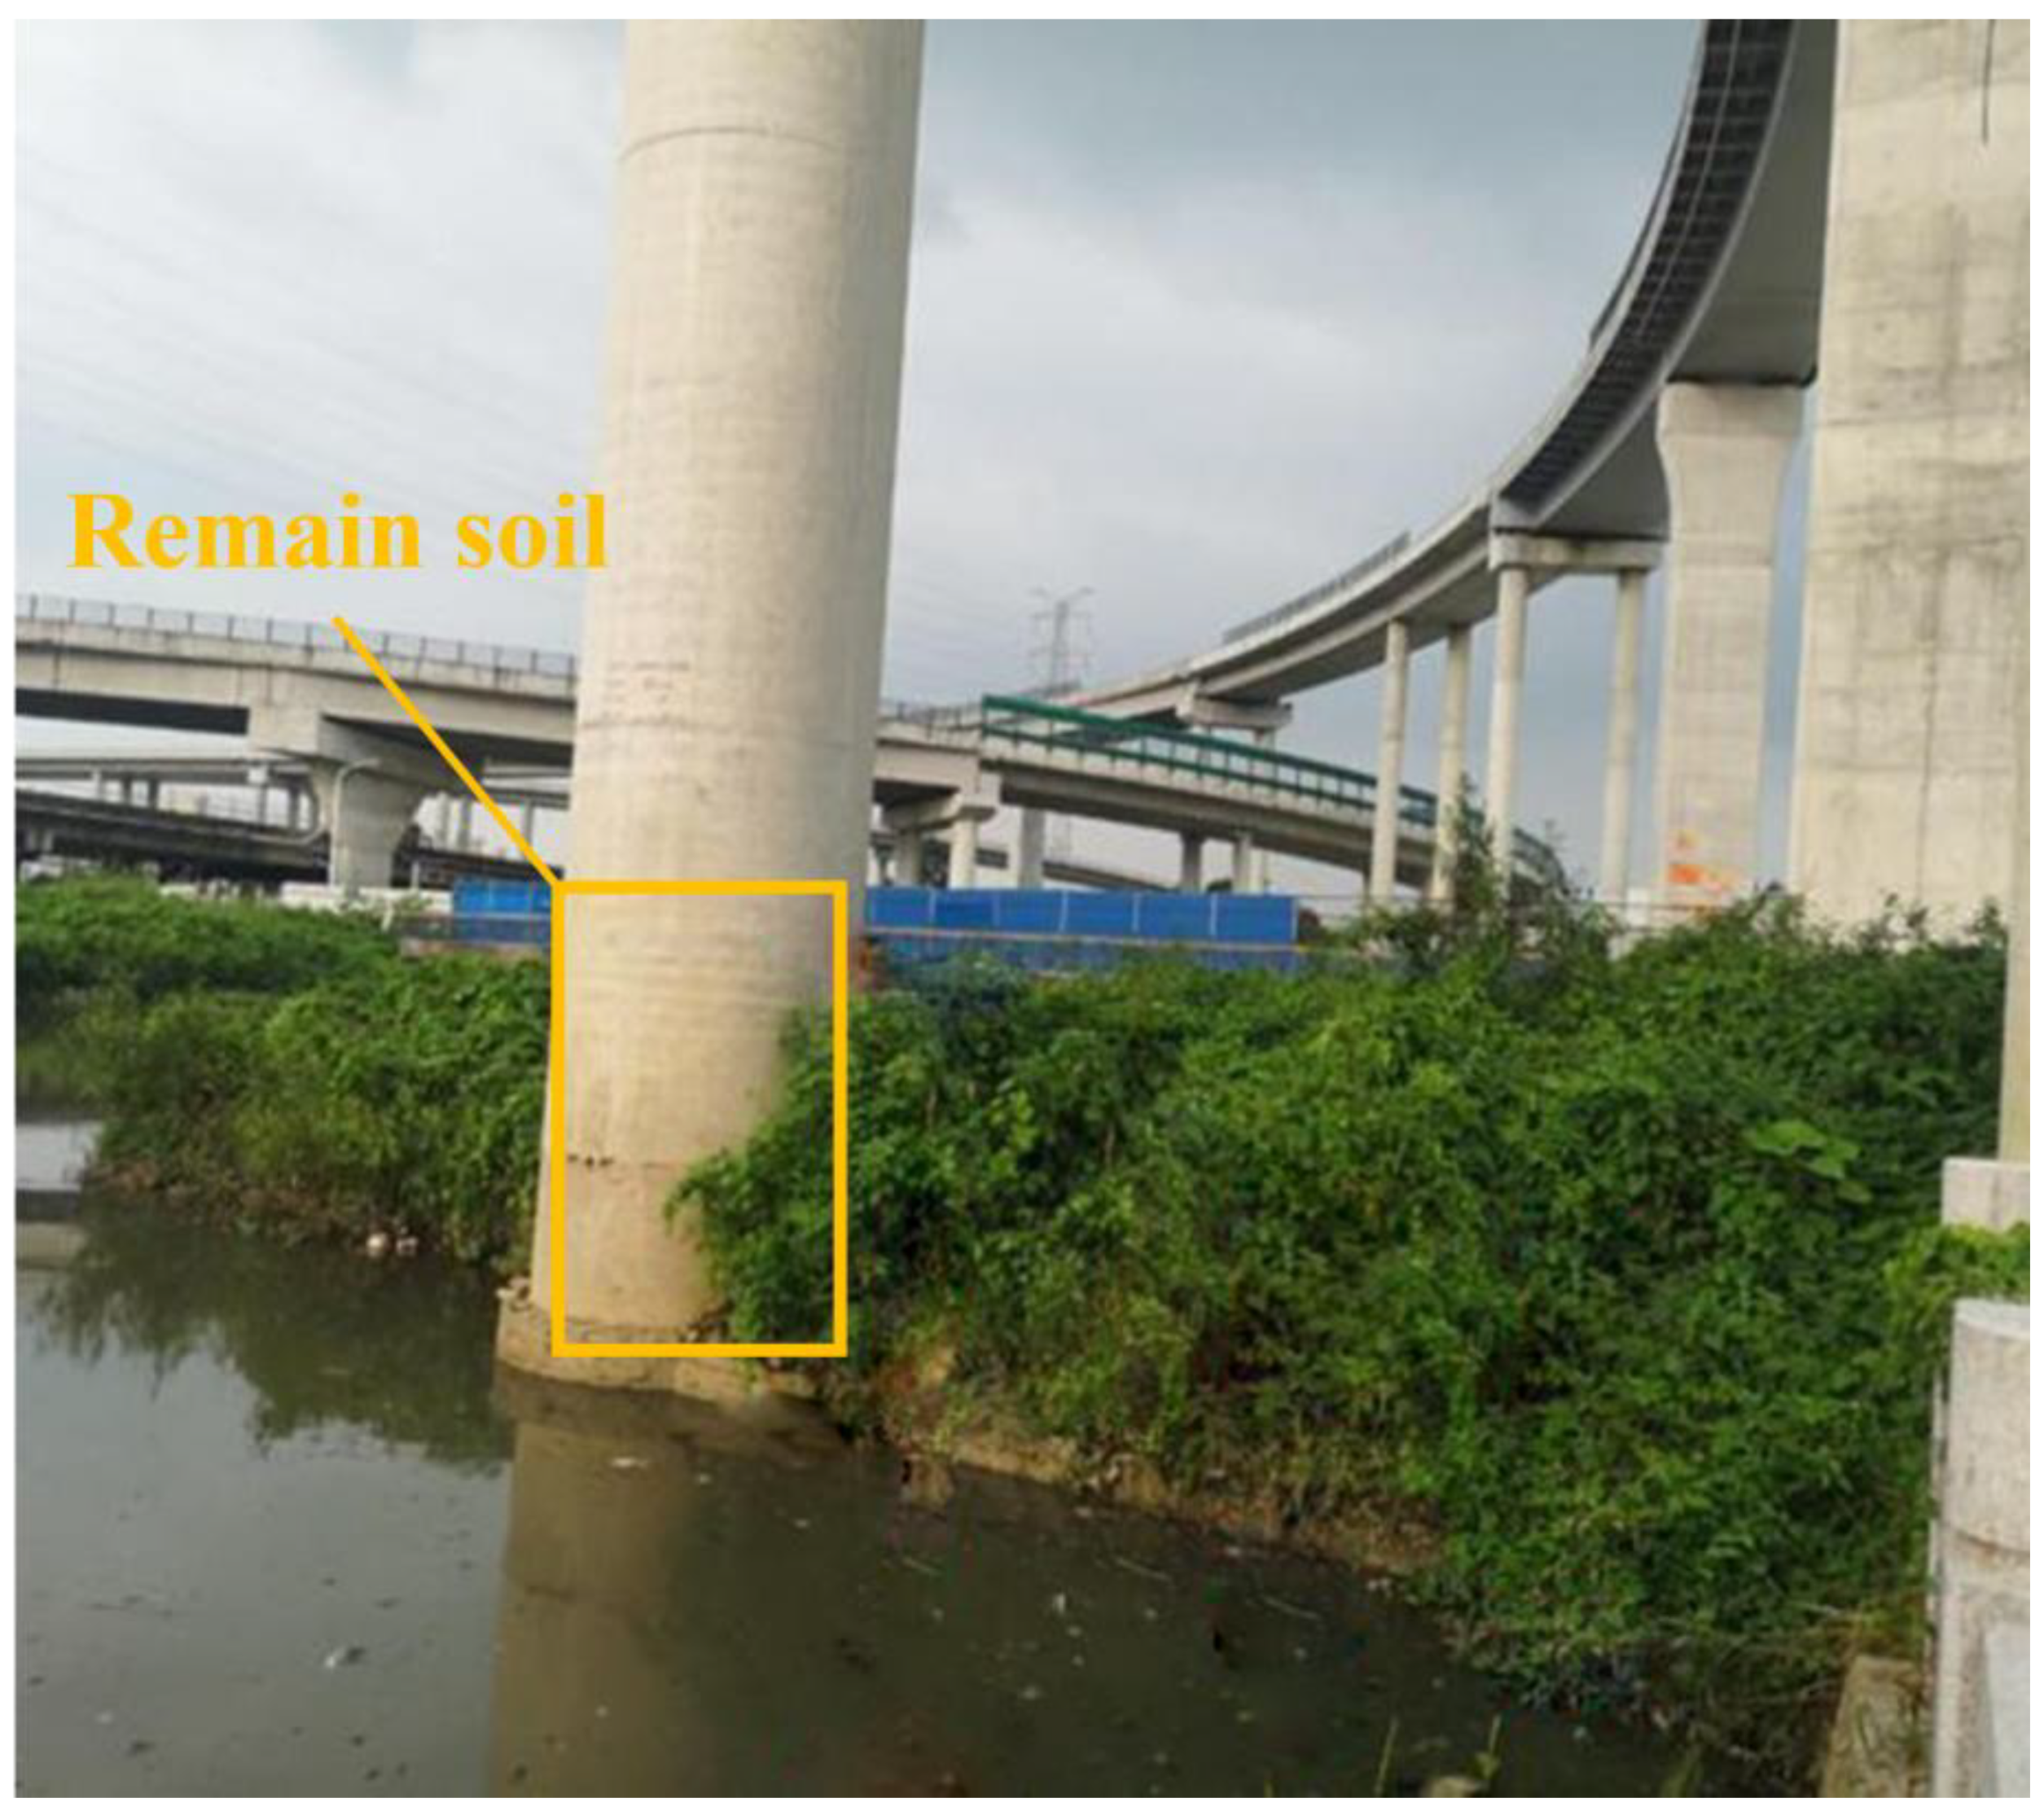
The foundation of the ramp bridge site is manly soft soil. In the forensic engineering investigation, as shown in
Figure 10, the remaining soil under Pier P30 reveals that the silt around the pier was excavated to a depth of 2 m at the river side and dumped at the other side during operation, which resulted in an asymmetric filling soil load at the bottom of Pier P30.
4.4. Monitoring of Disease Development
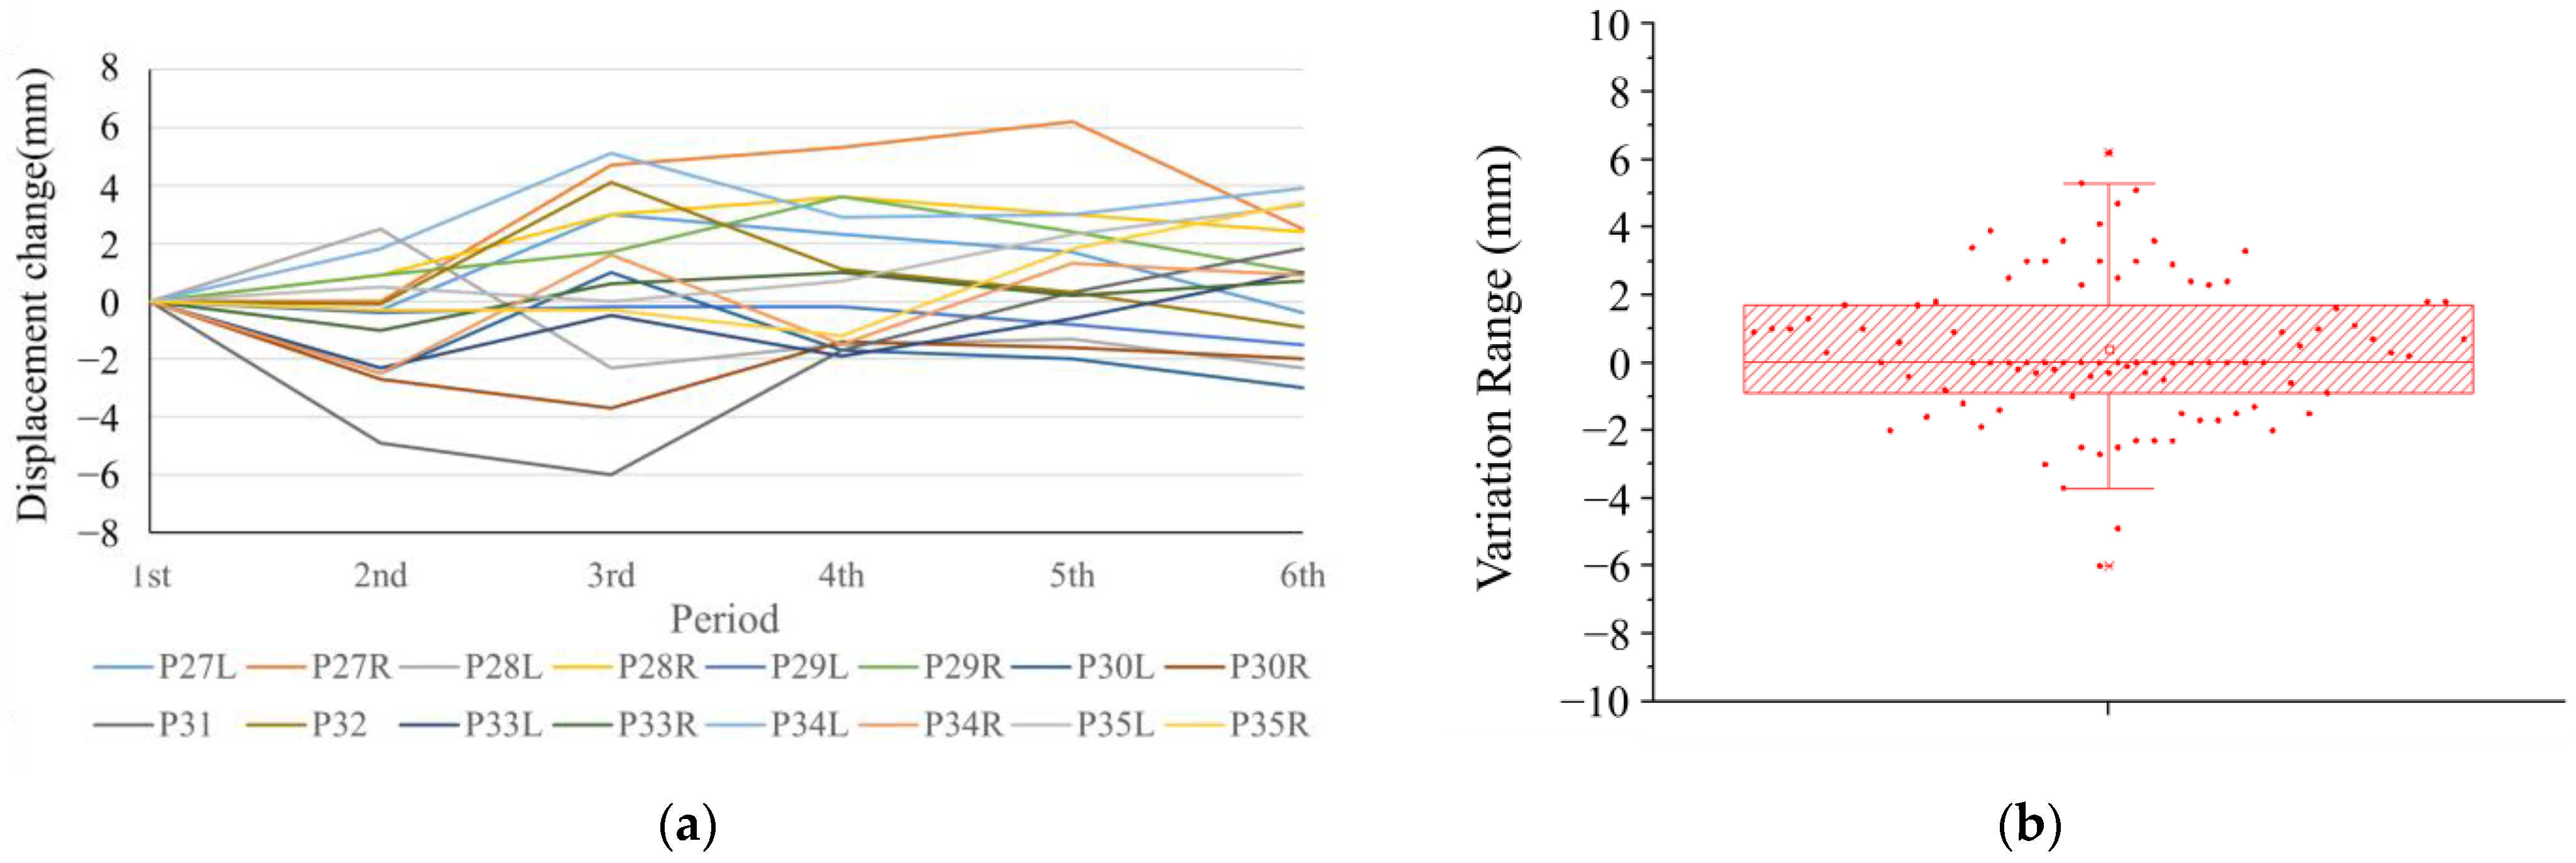
To identify the development of disease in the bridge, six monitoring sessions on the pier inclination, foundation settlement, and girder displacement of the ramp were conducted from July 2019 to March 2020.
Figure 11 shows the change in the longitudinal inclination of the top of the pier during the monitoring period. It can be seen from the data that the changes were within ±6 mm during the monitoring period, mainly induced by vehicle load or environmental influences. In conclusion, there was no obvious change in pier inclination, foundation settlement, and girder displacement during the monitoring period. The monitoring results indicate that piers did not continuously incline, and the disease of the ramp bridge occurred before the bridge was open to traffic.
5. Numerical Analysis
Using several numerical methods, considering the structure, construction process, foundation deformation, and other factors, this section analyzes the pier inclination and displacement of the girder end in the ramp bridge, and then the support slipping value and corresponding slip mark length are calculated.
5.1. Pier Deformation under Dead Load and Displacement of Girder End
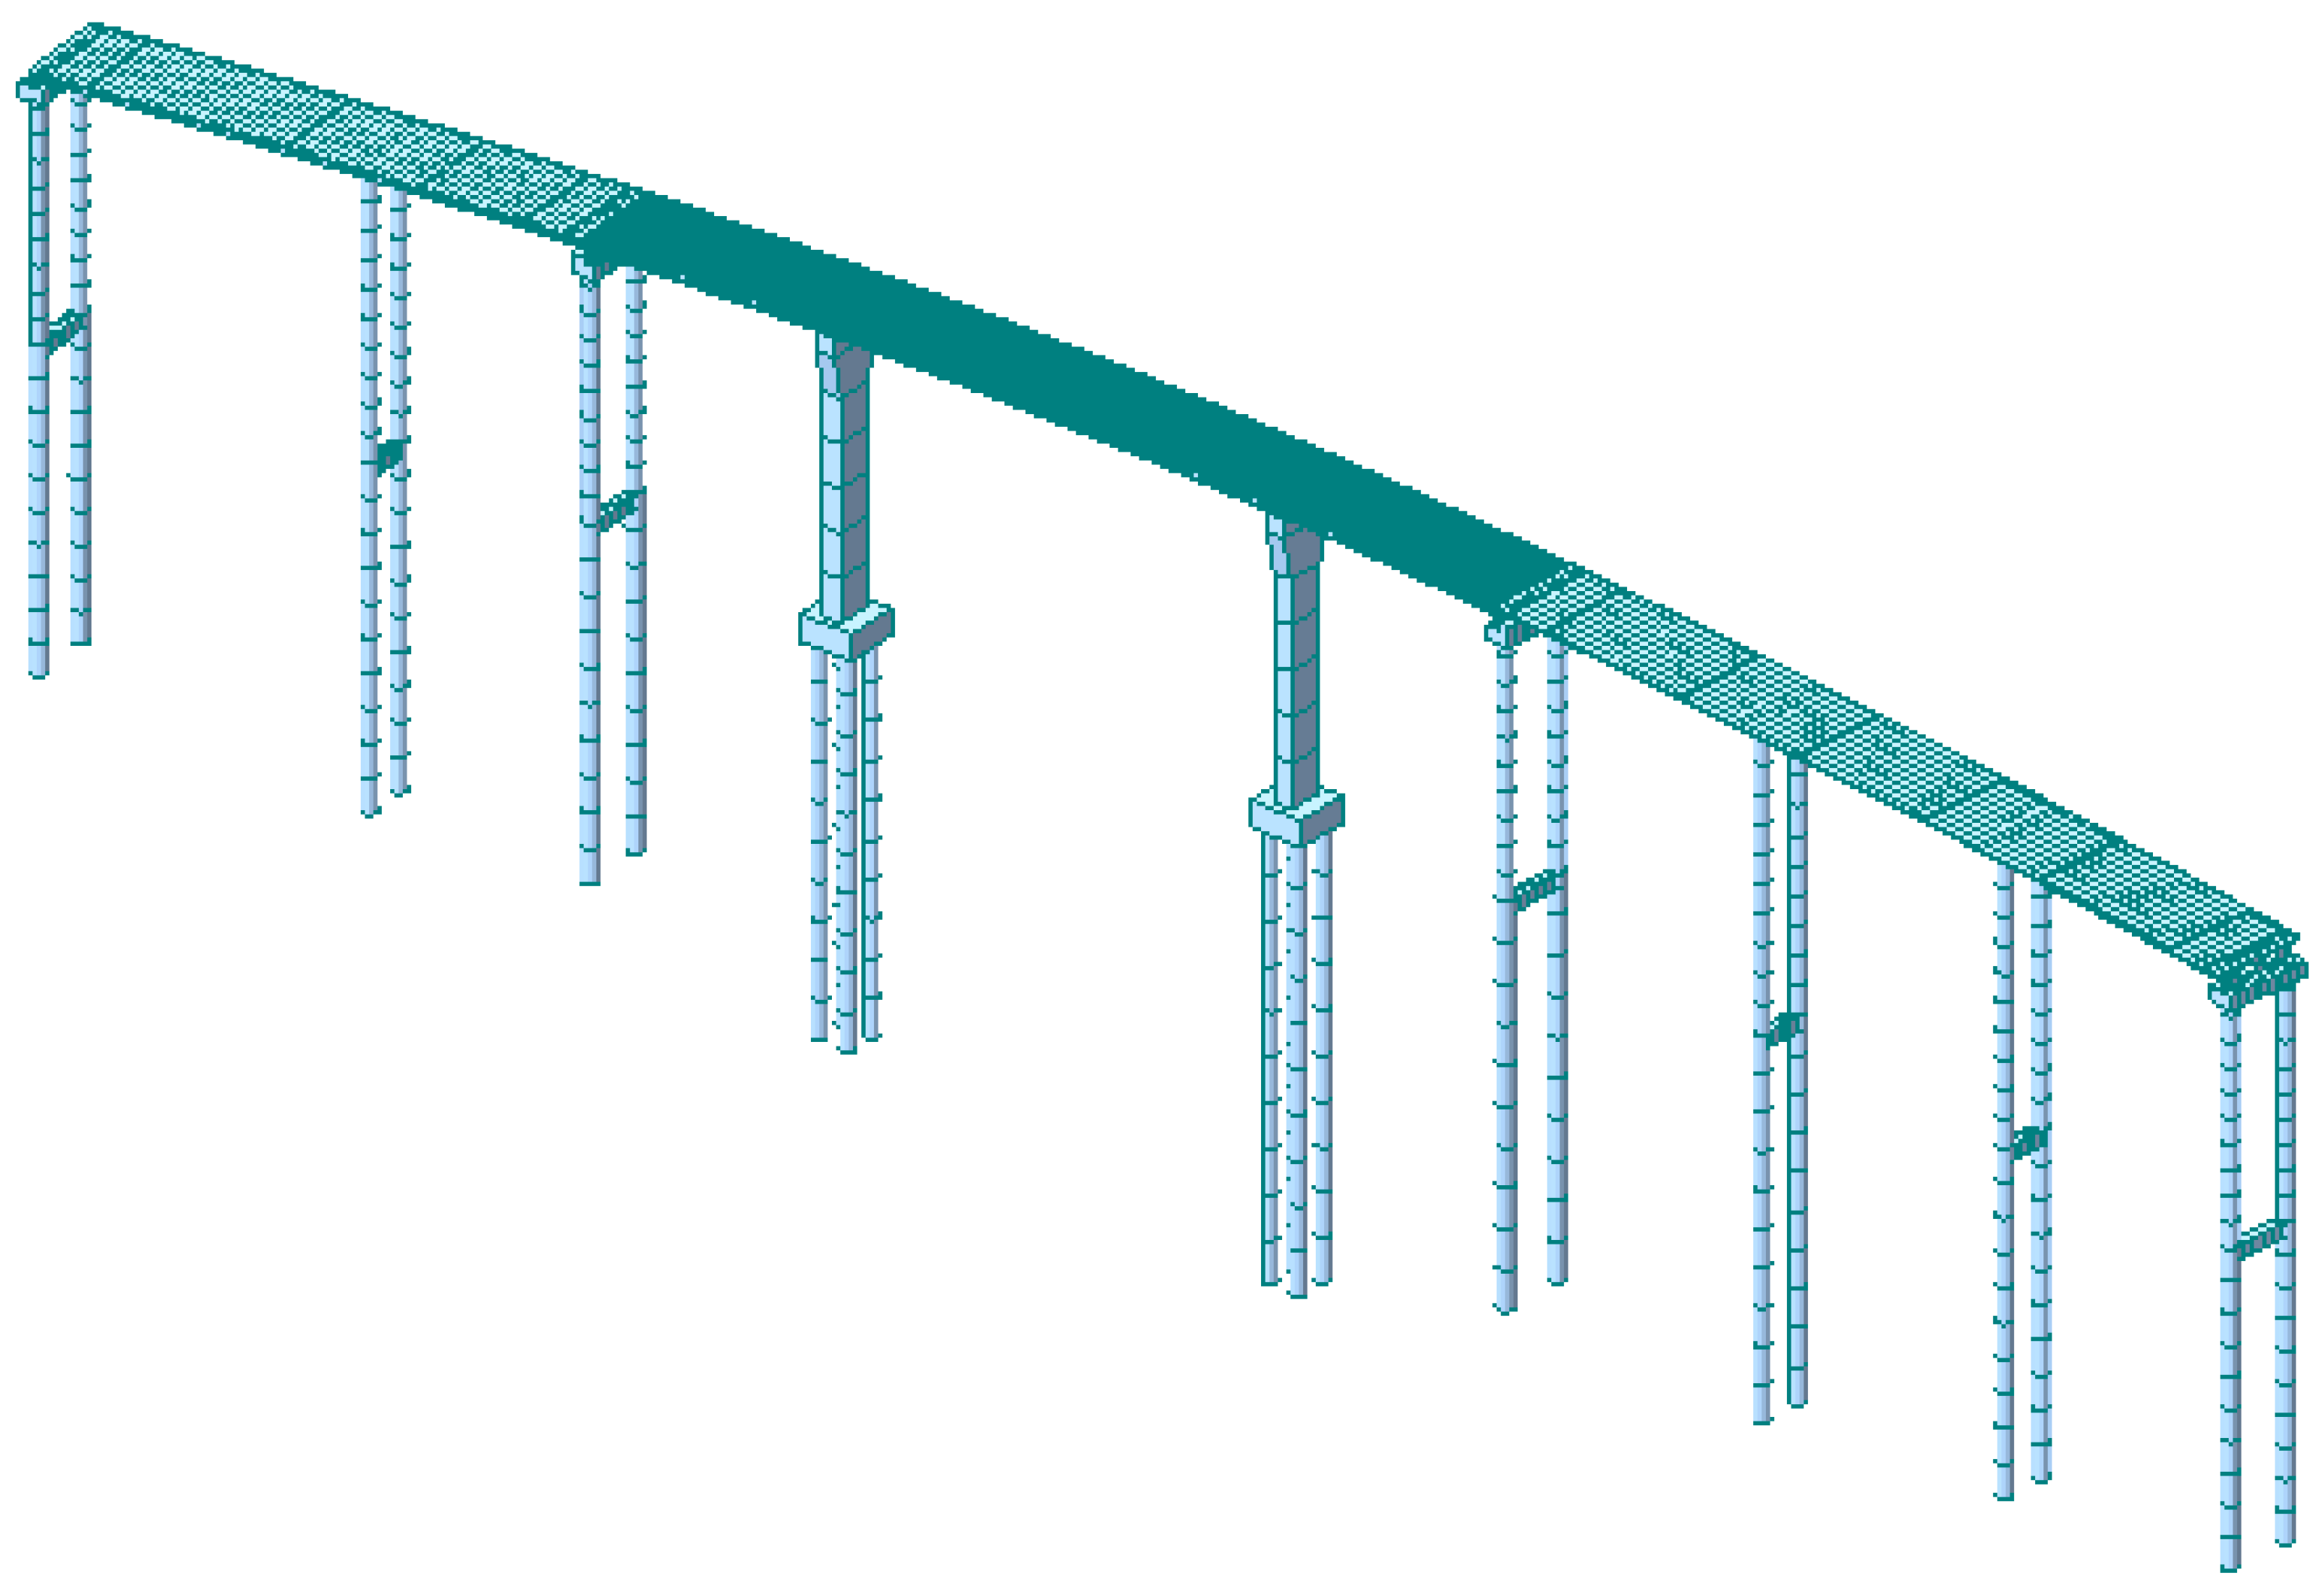
5.1.1. Pier Deformation under Dead Load
A 3D model was developed using Midas Civil to analyze pier inclination during construction, girder-end displacement under temperature, and the creep of concrete, as shown in
Figure 12.
There is a difference between the measured and design values of the support eccentricities for Piers P30 and P33 (see in
Figure 9). Two models were established in the numerical analysis, the design model, considering the design values of support eccentricities, and the as-built model, considering the measured values. The analysis results show that Piers P30 and P33 are obviously inclined in both the design and as-built models (see in
Figure 13).
The original design was changed; a steel box girder was adopted between Piers P30 and P33, resulting in the reaction force of the concrete side being much greater than that of the steel girder side on Piers P30 and P33. However, the design values of support eccentricities on Piers P30 and P33 are not reasonable, leading to a large eccentric compression occurring on the piers during construction and operation. Significantly, due to the difference between the measured and design values of support eccentricities, in the as-built model, the effect of the eccentricities of Pier P30 decreases and the same effect of Pier P33 increases, different to the design model.
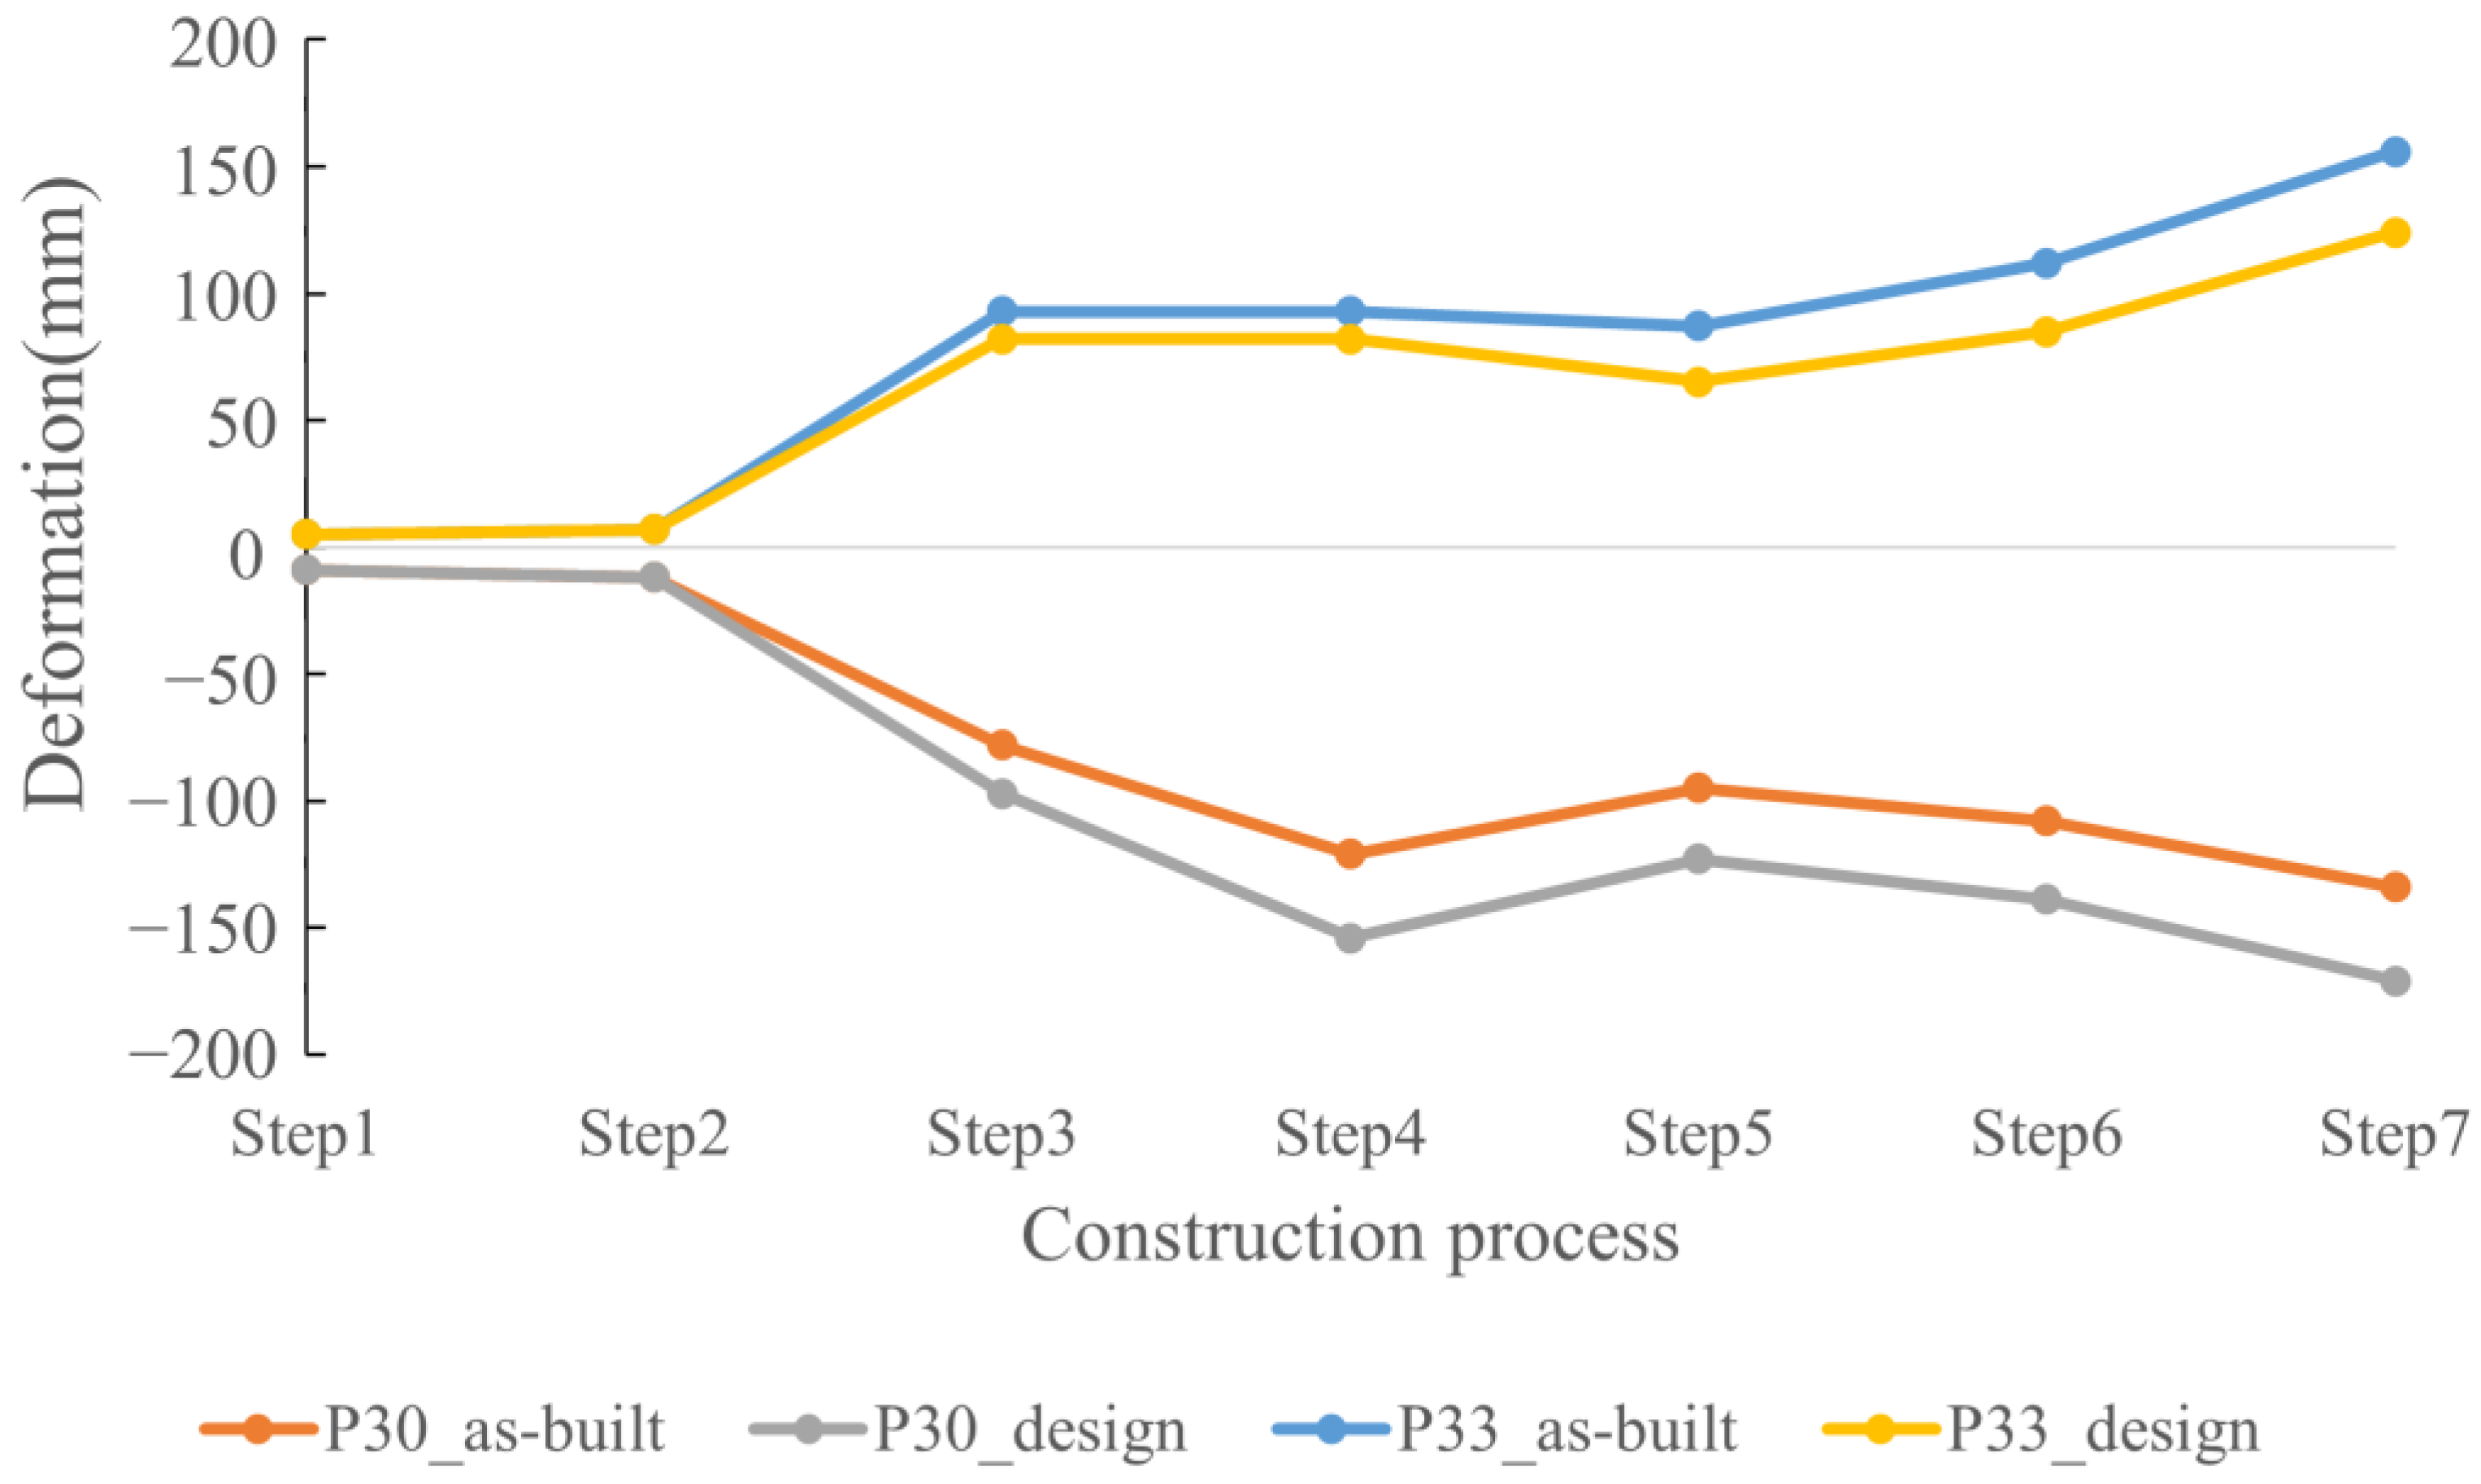
Considering the actual construction process and eccentricities of the support on the cap, the Midas as-built model was used to analyze the deformation of the bridge after the design was changed. The analysis results show that Piers P30, P33, and P35 incline obviously while the other piers are almost vertical.
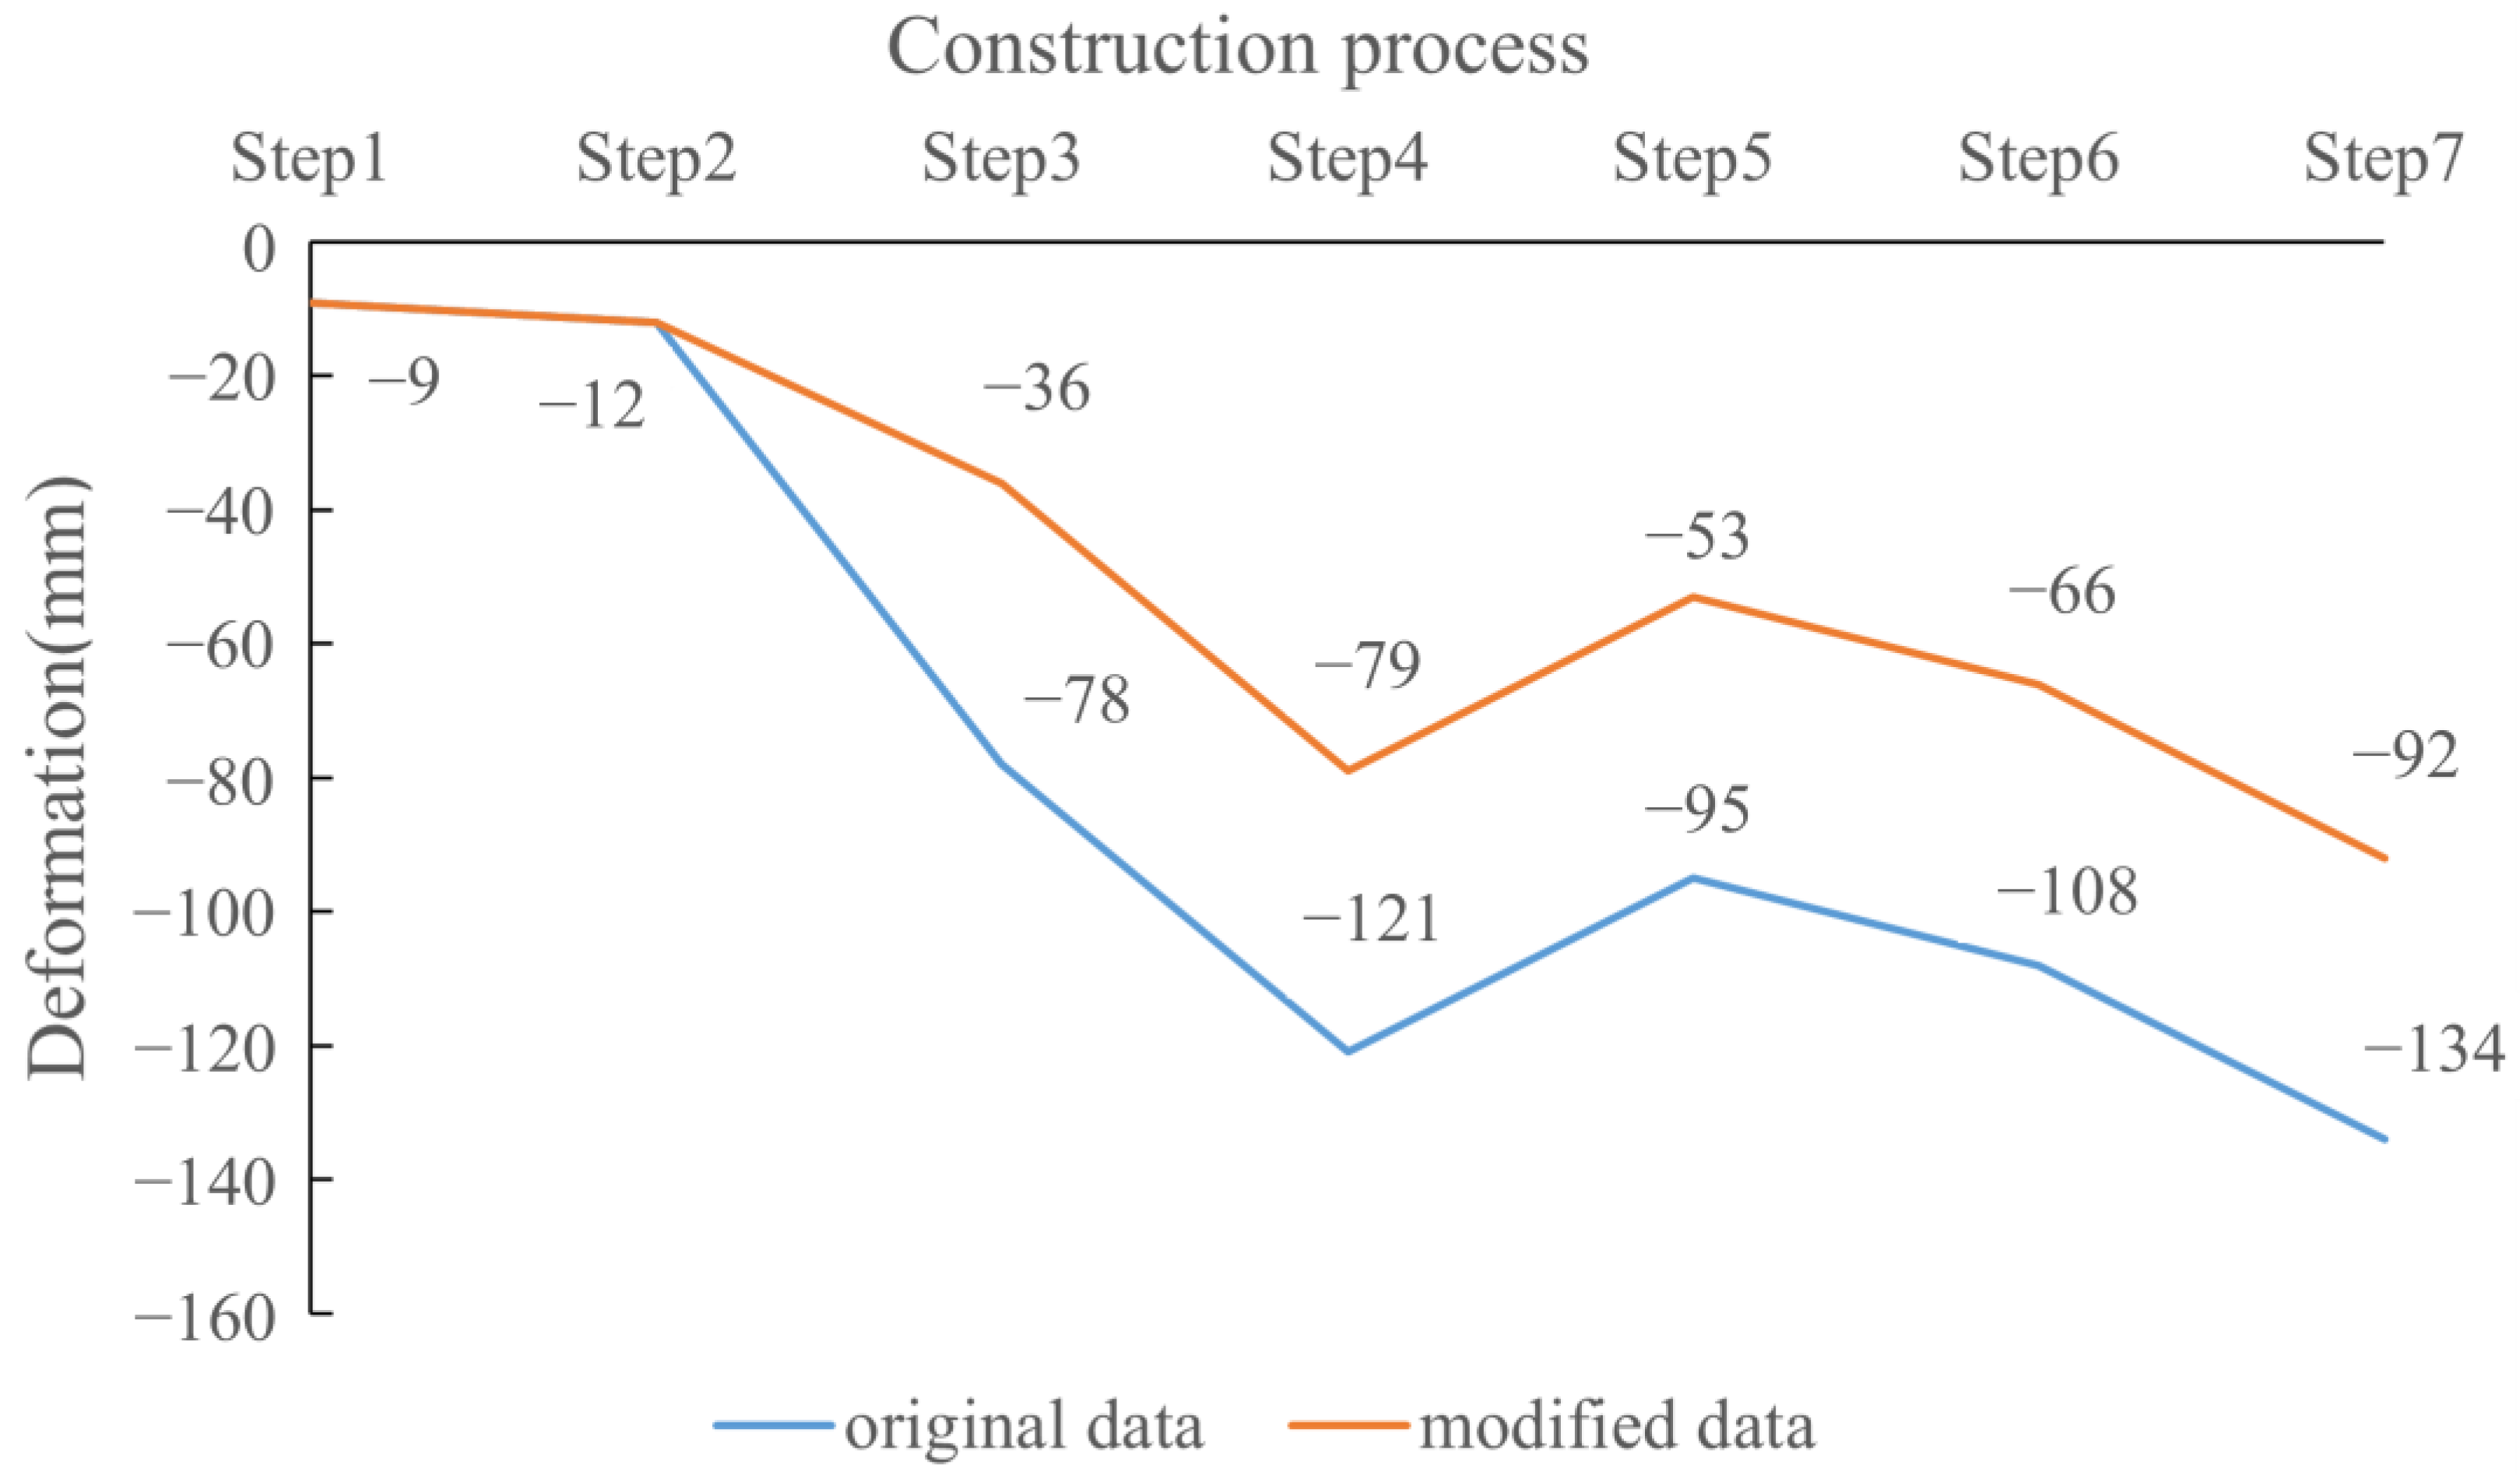
Using Pier P30 as an example, the longitudinal inclination change during construction is shown in
Figure 14, and the deformation process is described as follows:
Step 1: After the substructure was completed, there was a small longitudinal inclination of −9 mm since the cap is equivalent to the eccentricity of the pier.
Step 2: The displacement increased to −12 mm due to concrete shrinkage and creep in one year.
Step 3: After the superstructure between Piers P27 and P30 was constructed, the displacement increased abruptly to −78 mm since only the concrete bridge was erected on the pier.
Step 4: Over half a year, the displacement reached −121 mm.
Step 5: After the erection of the steel box girder between Piers P30 and P33, the displacement decreases to −95 mm since the eccentricity on the pier reduces.
Step 6: When the bridge construction was completed, the displacement was −108 mm.
Step 7: After 3 years of shrinkage and creep, the displacement reached −134 mm.
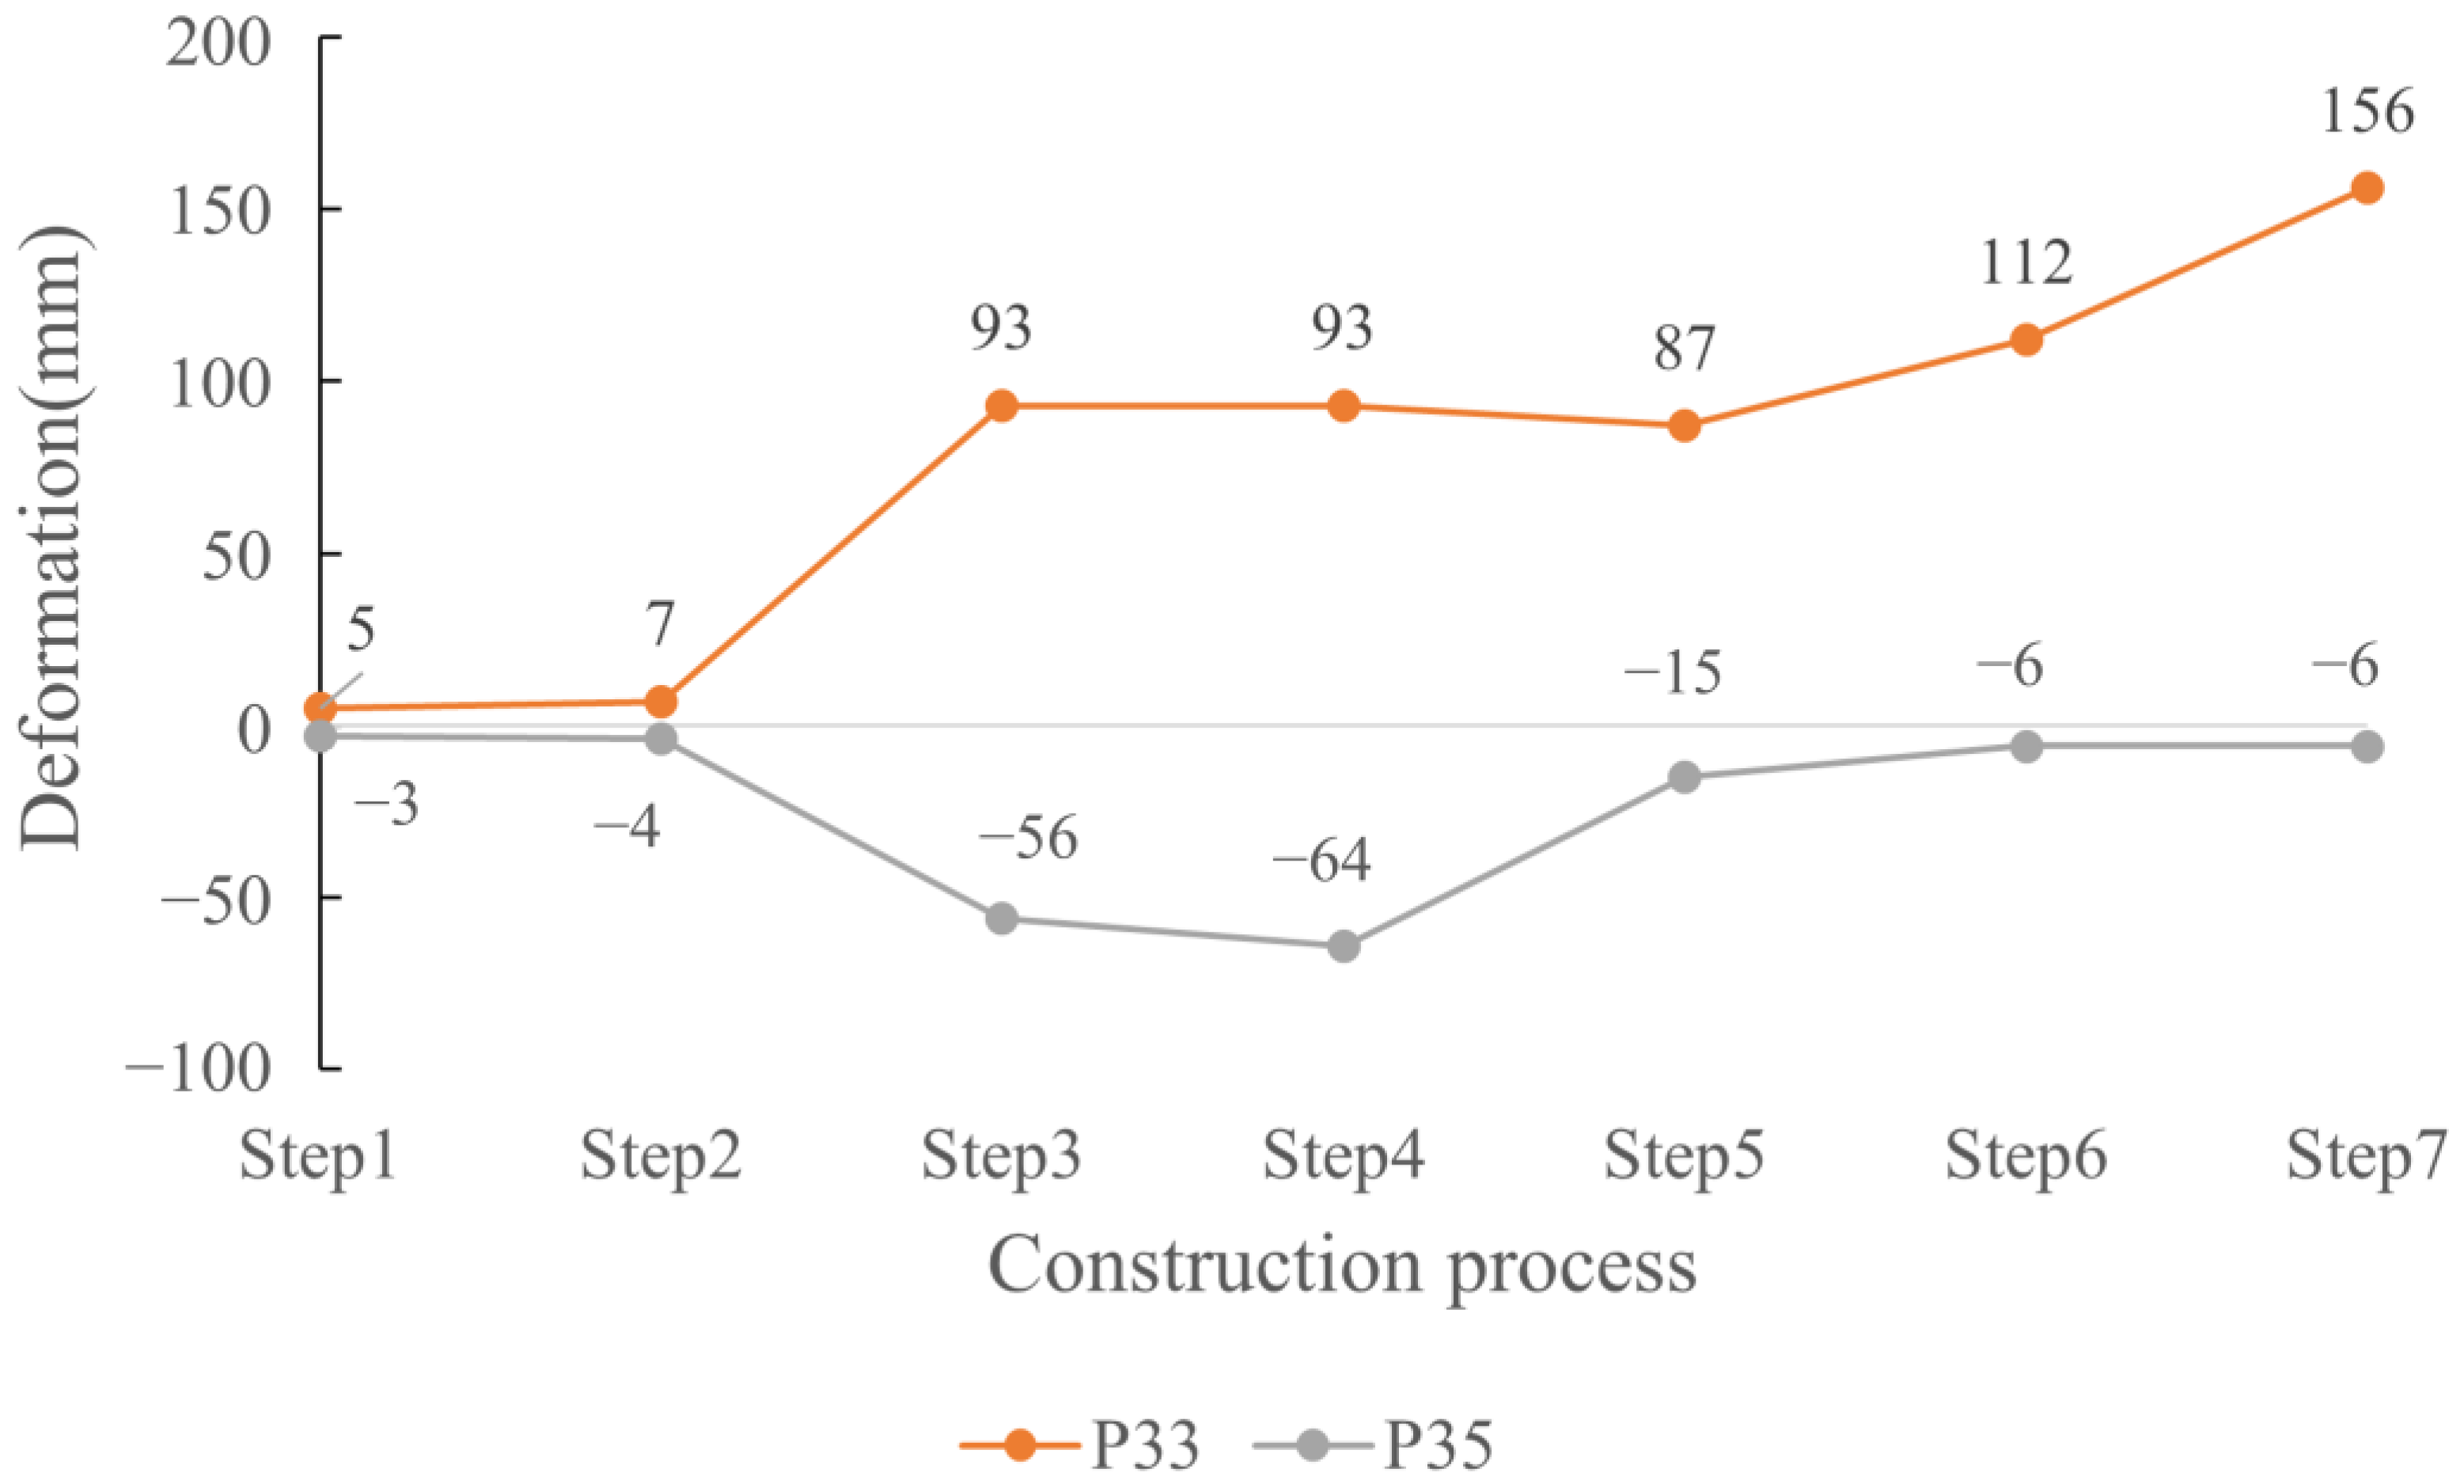
The longitudinal inclination processes of Piers P33 and P35 are shown in
Figure 15.
It is shown that after the design change, the reaction force of the concrete side is much greater than that of the steel girder side on Piers P30 and P33, as is the eccentricities of the support, and the concrete and steel girder were constructed asynchronously. All of the above data show that a large eccentric compression occurs on the piers during construction and operation, resulting in a larger inclined deformation of Piers P30 and P33.
5.1.2. Displacement of Girder End
The Midas model analysis results suggest that the main factors affecting the displacement of the girder end are the temperature and shrinkage/creep of concrete. The displacement of the girder end under temperature rising by 10 °C and 3 years of shrinkage and creep are shown in
Table 3. The positive value indicates that the girder end moves along the direction of pier number increasing. It is noted that the displacement induced by creep is zero on 35#L since the girder on the side that the pier with the larger number is prefabricated.
5.2. Pier Deformation Considering Support Slipping
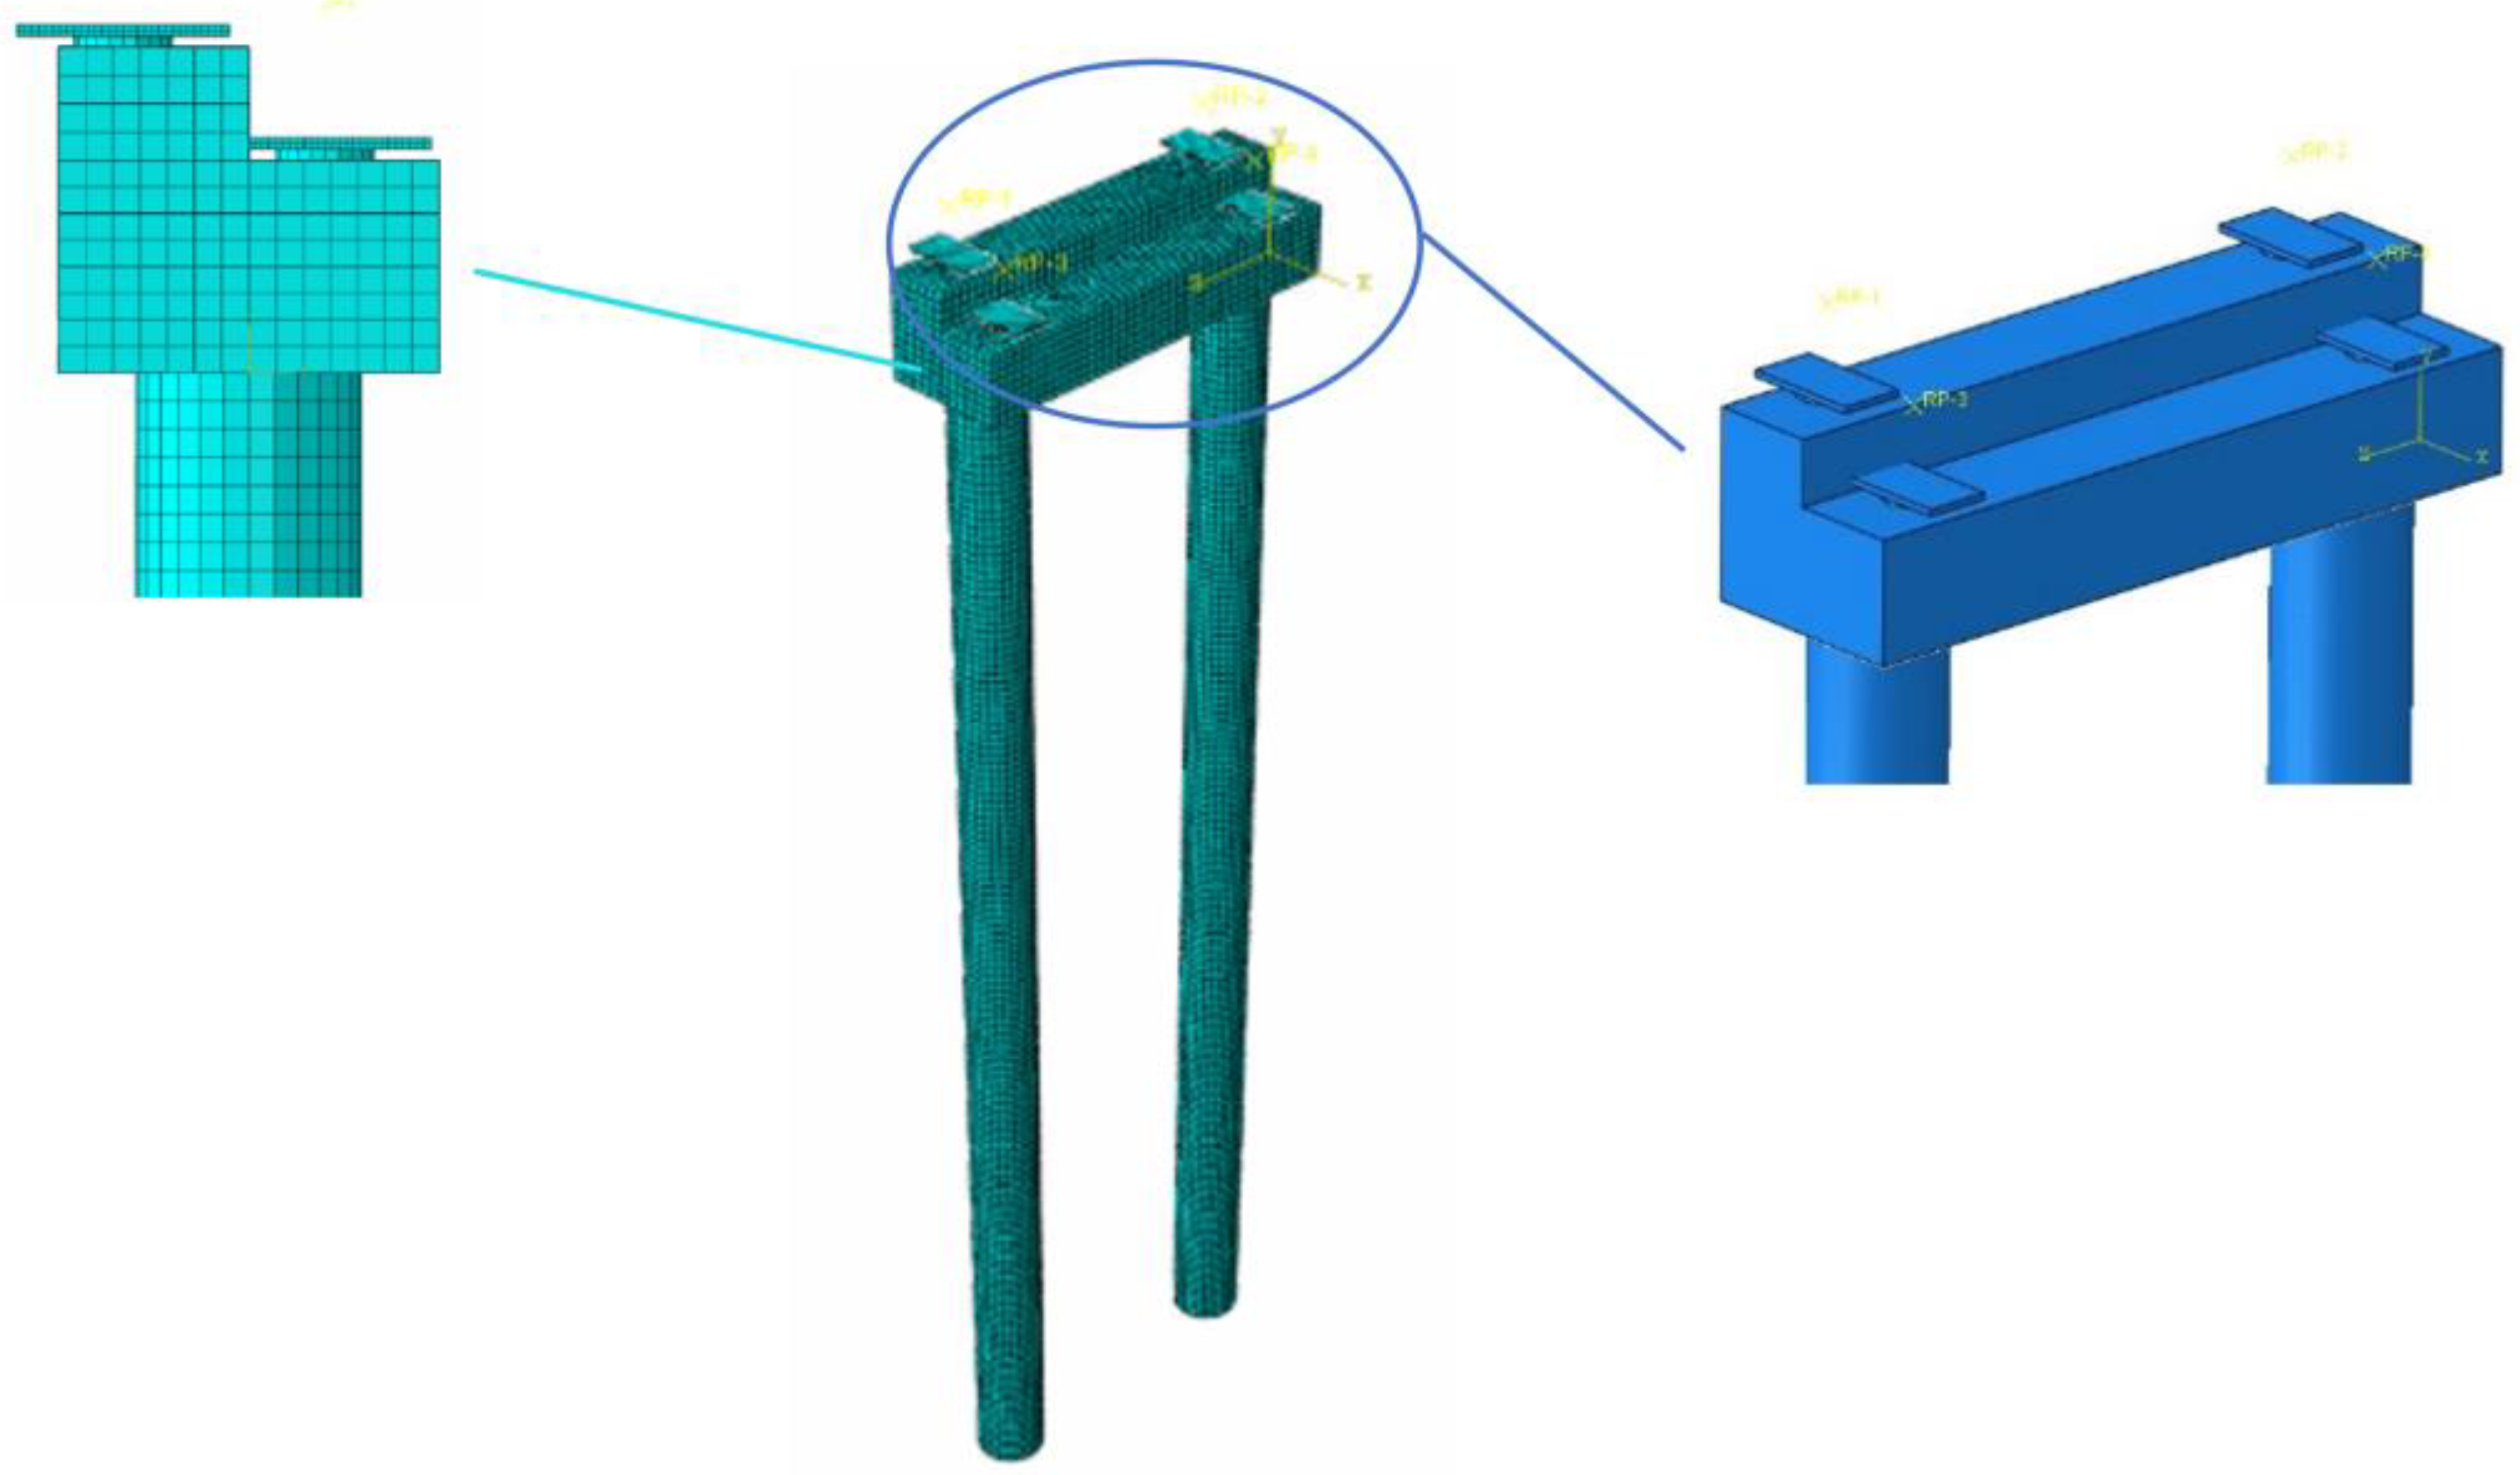
A contact analysis model was developed using Abaqus and was used to conduct a contact analysis of support friction to determine the influence of the frictional force of the support on high-pier inclination.
The Abaqus solid model of Piers P30, P33 and P35 was established, including piers, caps, and the top and bottom plates of supports (see in
Figure 16). Hard contact between top and bottom plate was defined to simulate the friction under support slip, and the top plate of the support exerted the superstructure reaction force. The friction coefficient of the support refers to the JT 391(friction resistance
f = μR, where μ = 0.03 and R is the supporting reaction force).
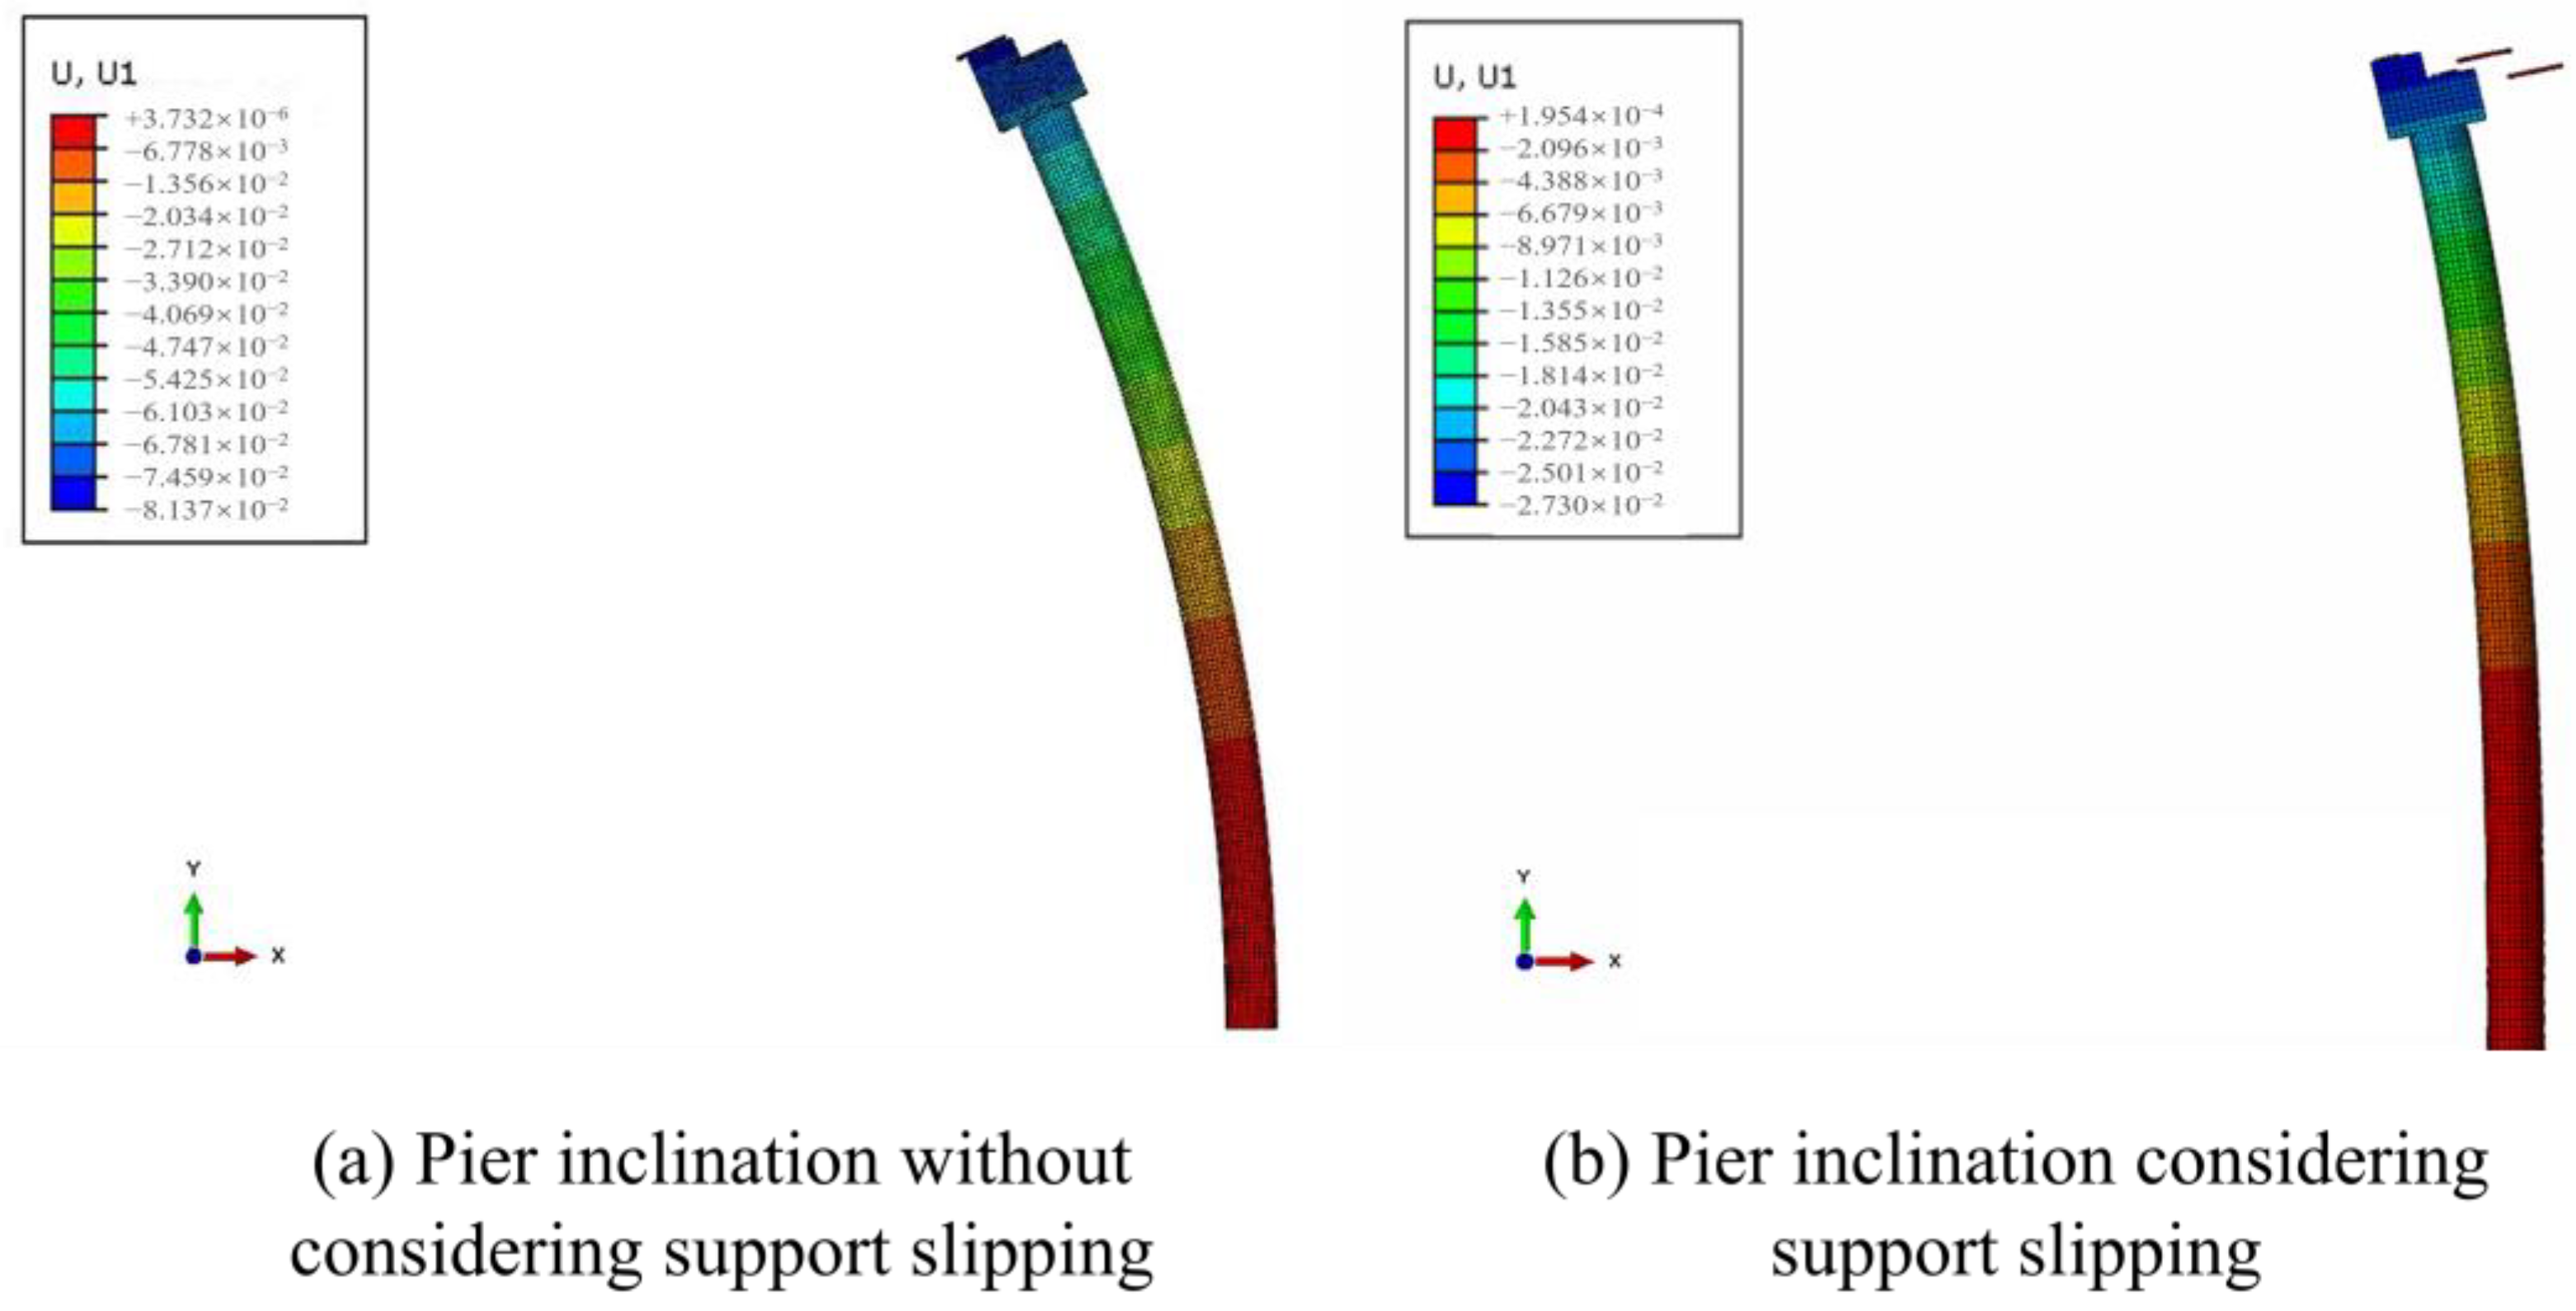
In the situation that the concrete girder is constructed on one side of a pier while the steel girder is not, under the conditions of the dead load on Pier P30, the longitudinal inclination at the top of the pier is −28 mm considering support friction resistance, while the displacement is −70 mm without considering this, as shown in
Figure 17. Therefore, the deformation of Pier P30 caused by support friction resistance is 42 mm, in the direction opposite to pier deformation. It is worth noting that the deformation caused by support friction in the subsequent stages is stable. Similarly, the deformation values caused by the support friction resistance of Piers P33 and P35 are 41 mm and 20 mm, respectively. Therefore, the influence of support friction on pier inclination is not negligible when the support slips obviously, especially in high piers.
5.3. Pier Deformation Considering Asymmetric Foundation Settlement
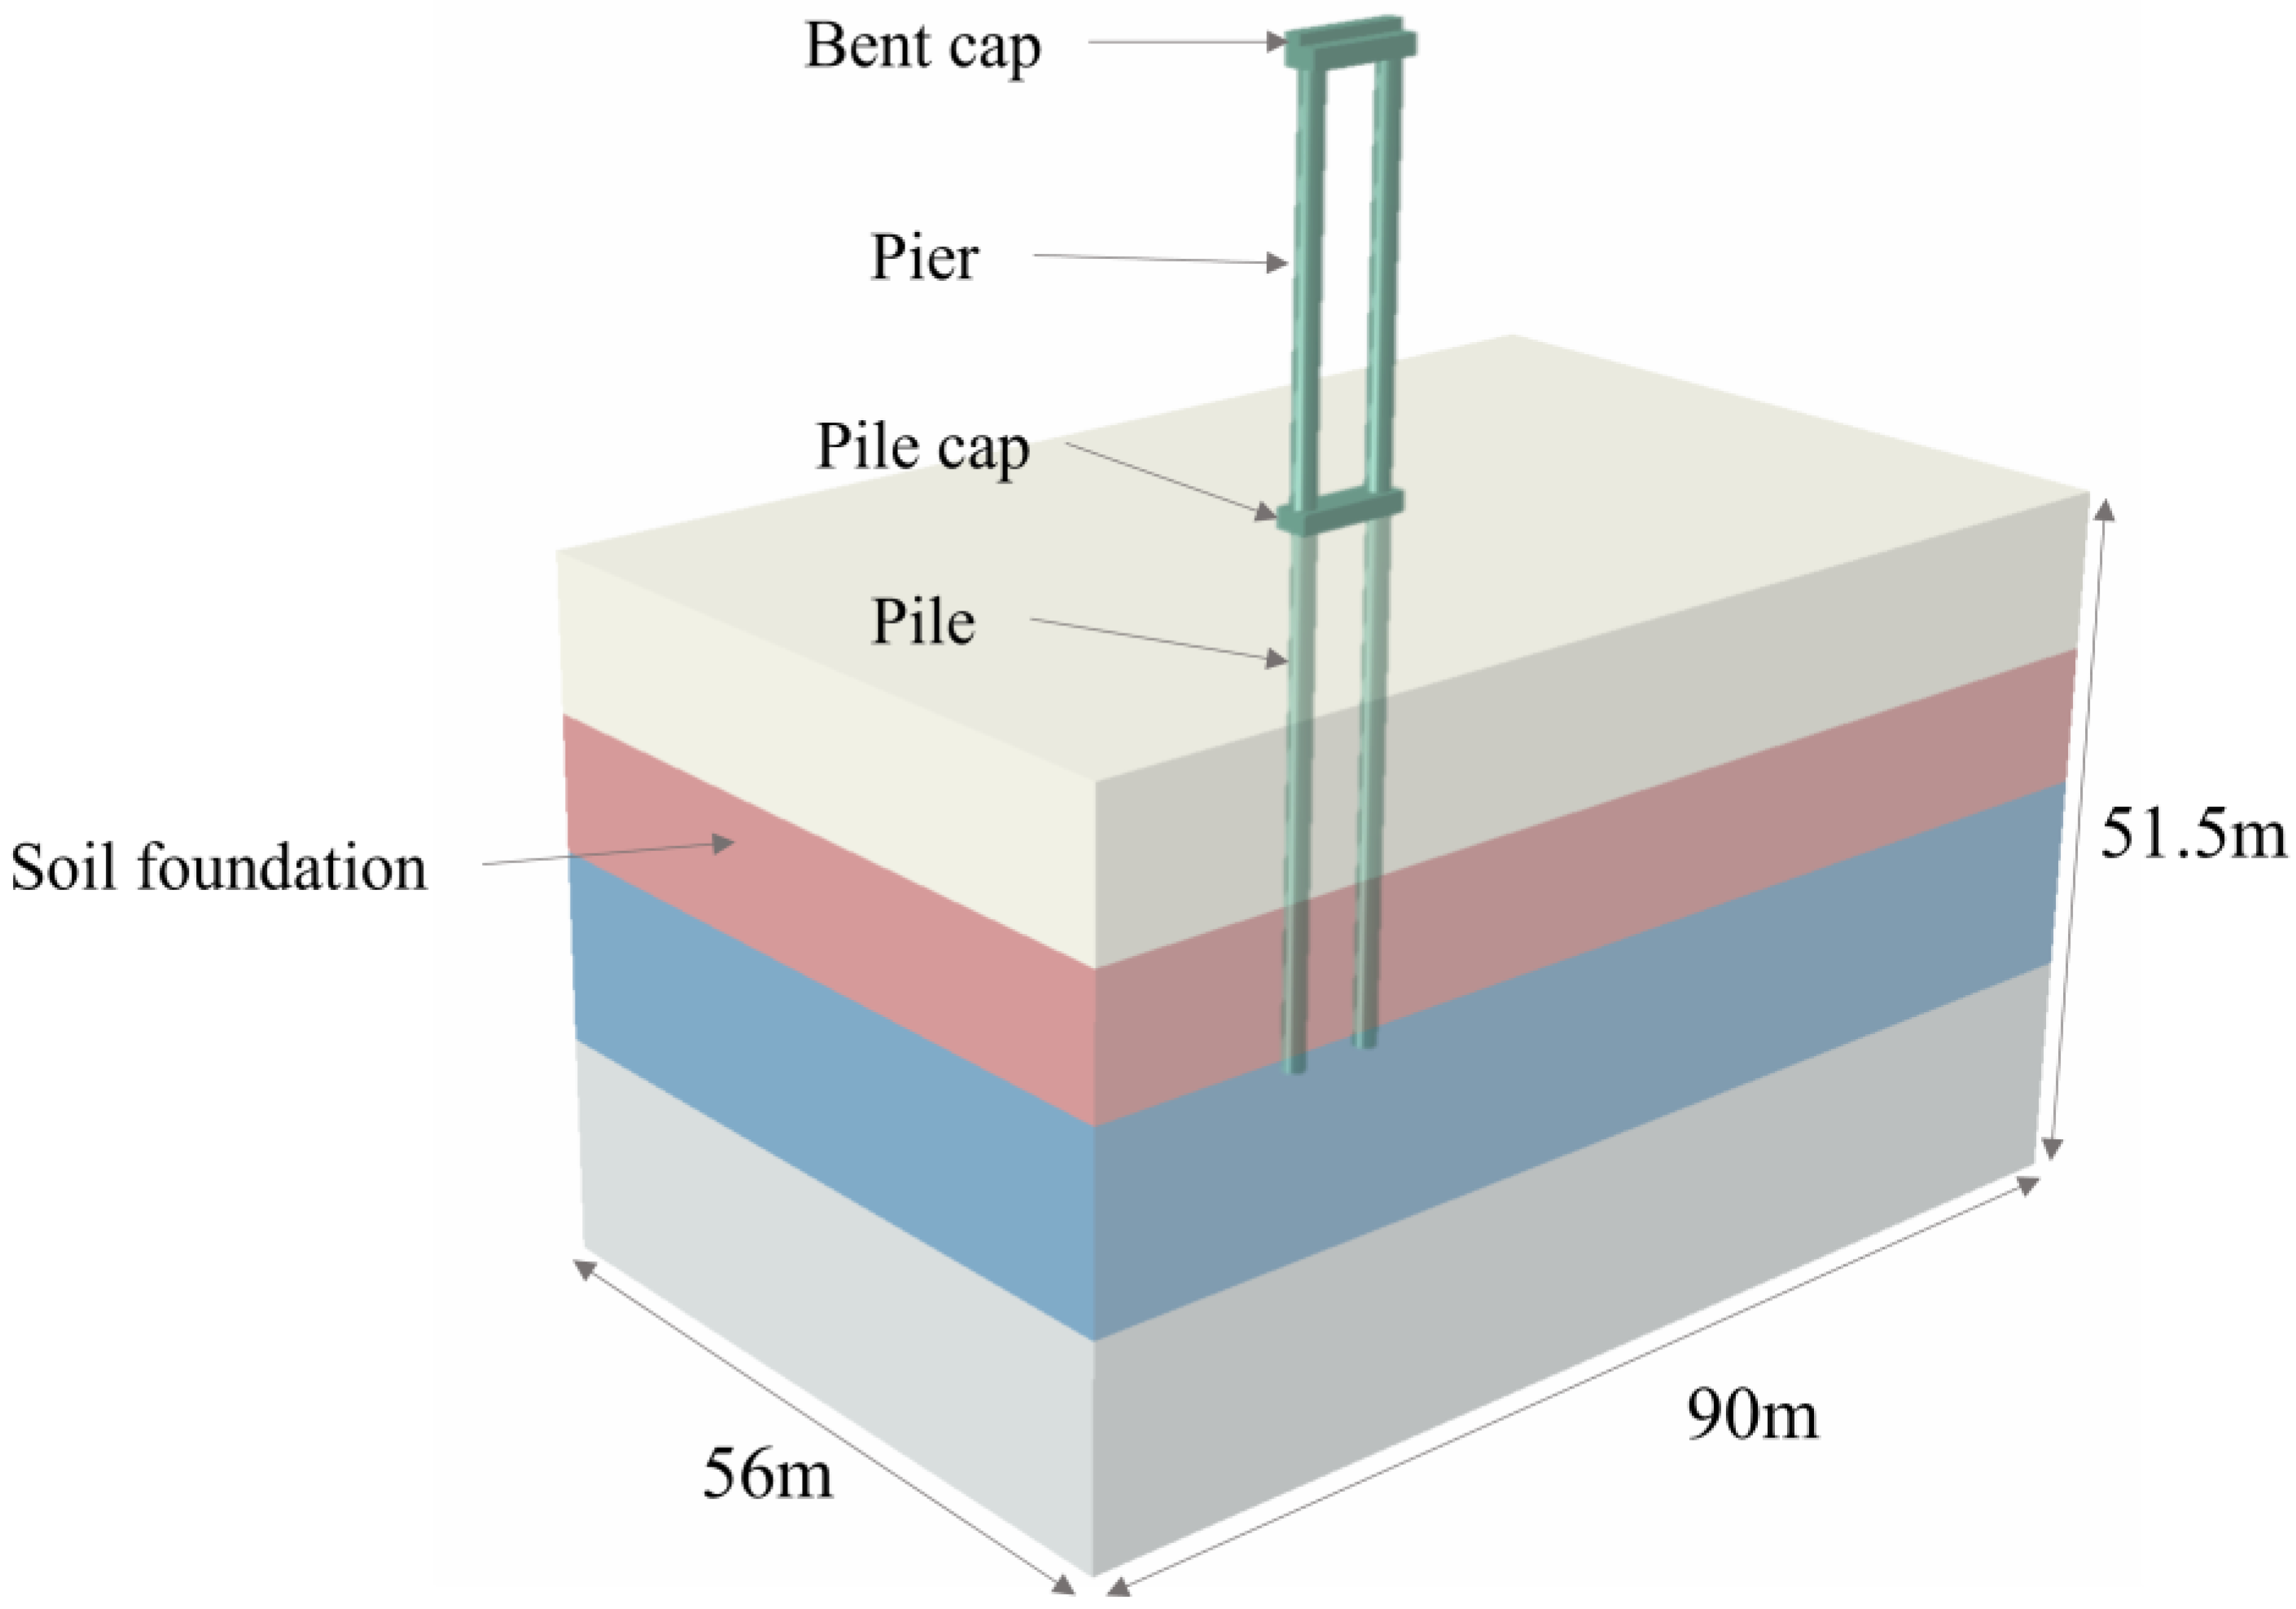
The Abaqus FEM model, considering soil elastoplastic and non-linear soil–structure interactions, was developed to analyze the deformation of Pier P30 under asymmetric foundation settlement caused by temporary load during construction and asymmetric filling soil load during operation (see
Figure 18).
According to the field geological prospecting condition, the soil was divided into four representative layers for modeling, and the parameters of each soil layer are given in
Table 1. The Mohr–Coulomb elastoplastic constitutive model was used to evaluate soil. The pile foundation, pile cap, bridge pier and support all adopt elastic materials with a weight of 25 kN/m
3 and Poisson’s ratio of 0.17.
The contact surface was set between pile and soil, adopting the Columbus friction model, the parameters of contact surface mainly include normal stiffness, tangential stiffness, cohesive force, and the frictional angle, which need to be selected according to the unit size and model calculation parameters. The tangential stiffness and normal stiffness should be 10 times the equivalent stiffness of the “hardest” adjacent areas, as follows:
where
K represents the volume modulus,
G represents the shear modulus, and
zmin represents the minimum size of the connection area in the direction of the contact surface.
In the simulation of pile–soil interaction, the frictional parameters of the contact surface, such as the frictional angle and cohesion, are more important than the others. The frictional angle should be 0.6~0.7 times that of the soil around pile, and cohesion should be about 0.5 times that in the soil around pile [
36,
37].
In this paper, the frictional parameters of the contact surface between pile and soil are as follows:
Due to weak physical and hydraulic properties of the surrounding soil and the exposed pile cap, the contact surface was only established at the bottom of the pile cap, and the physical and mechanical parameters are as follows:
5.3.1. Pier Inclination Caused by Temporary Load during Construction
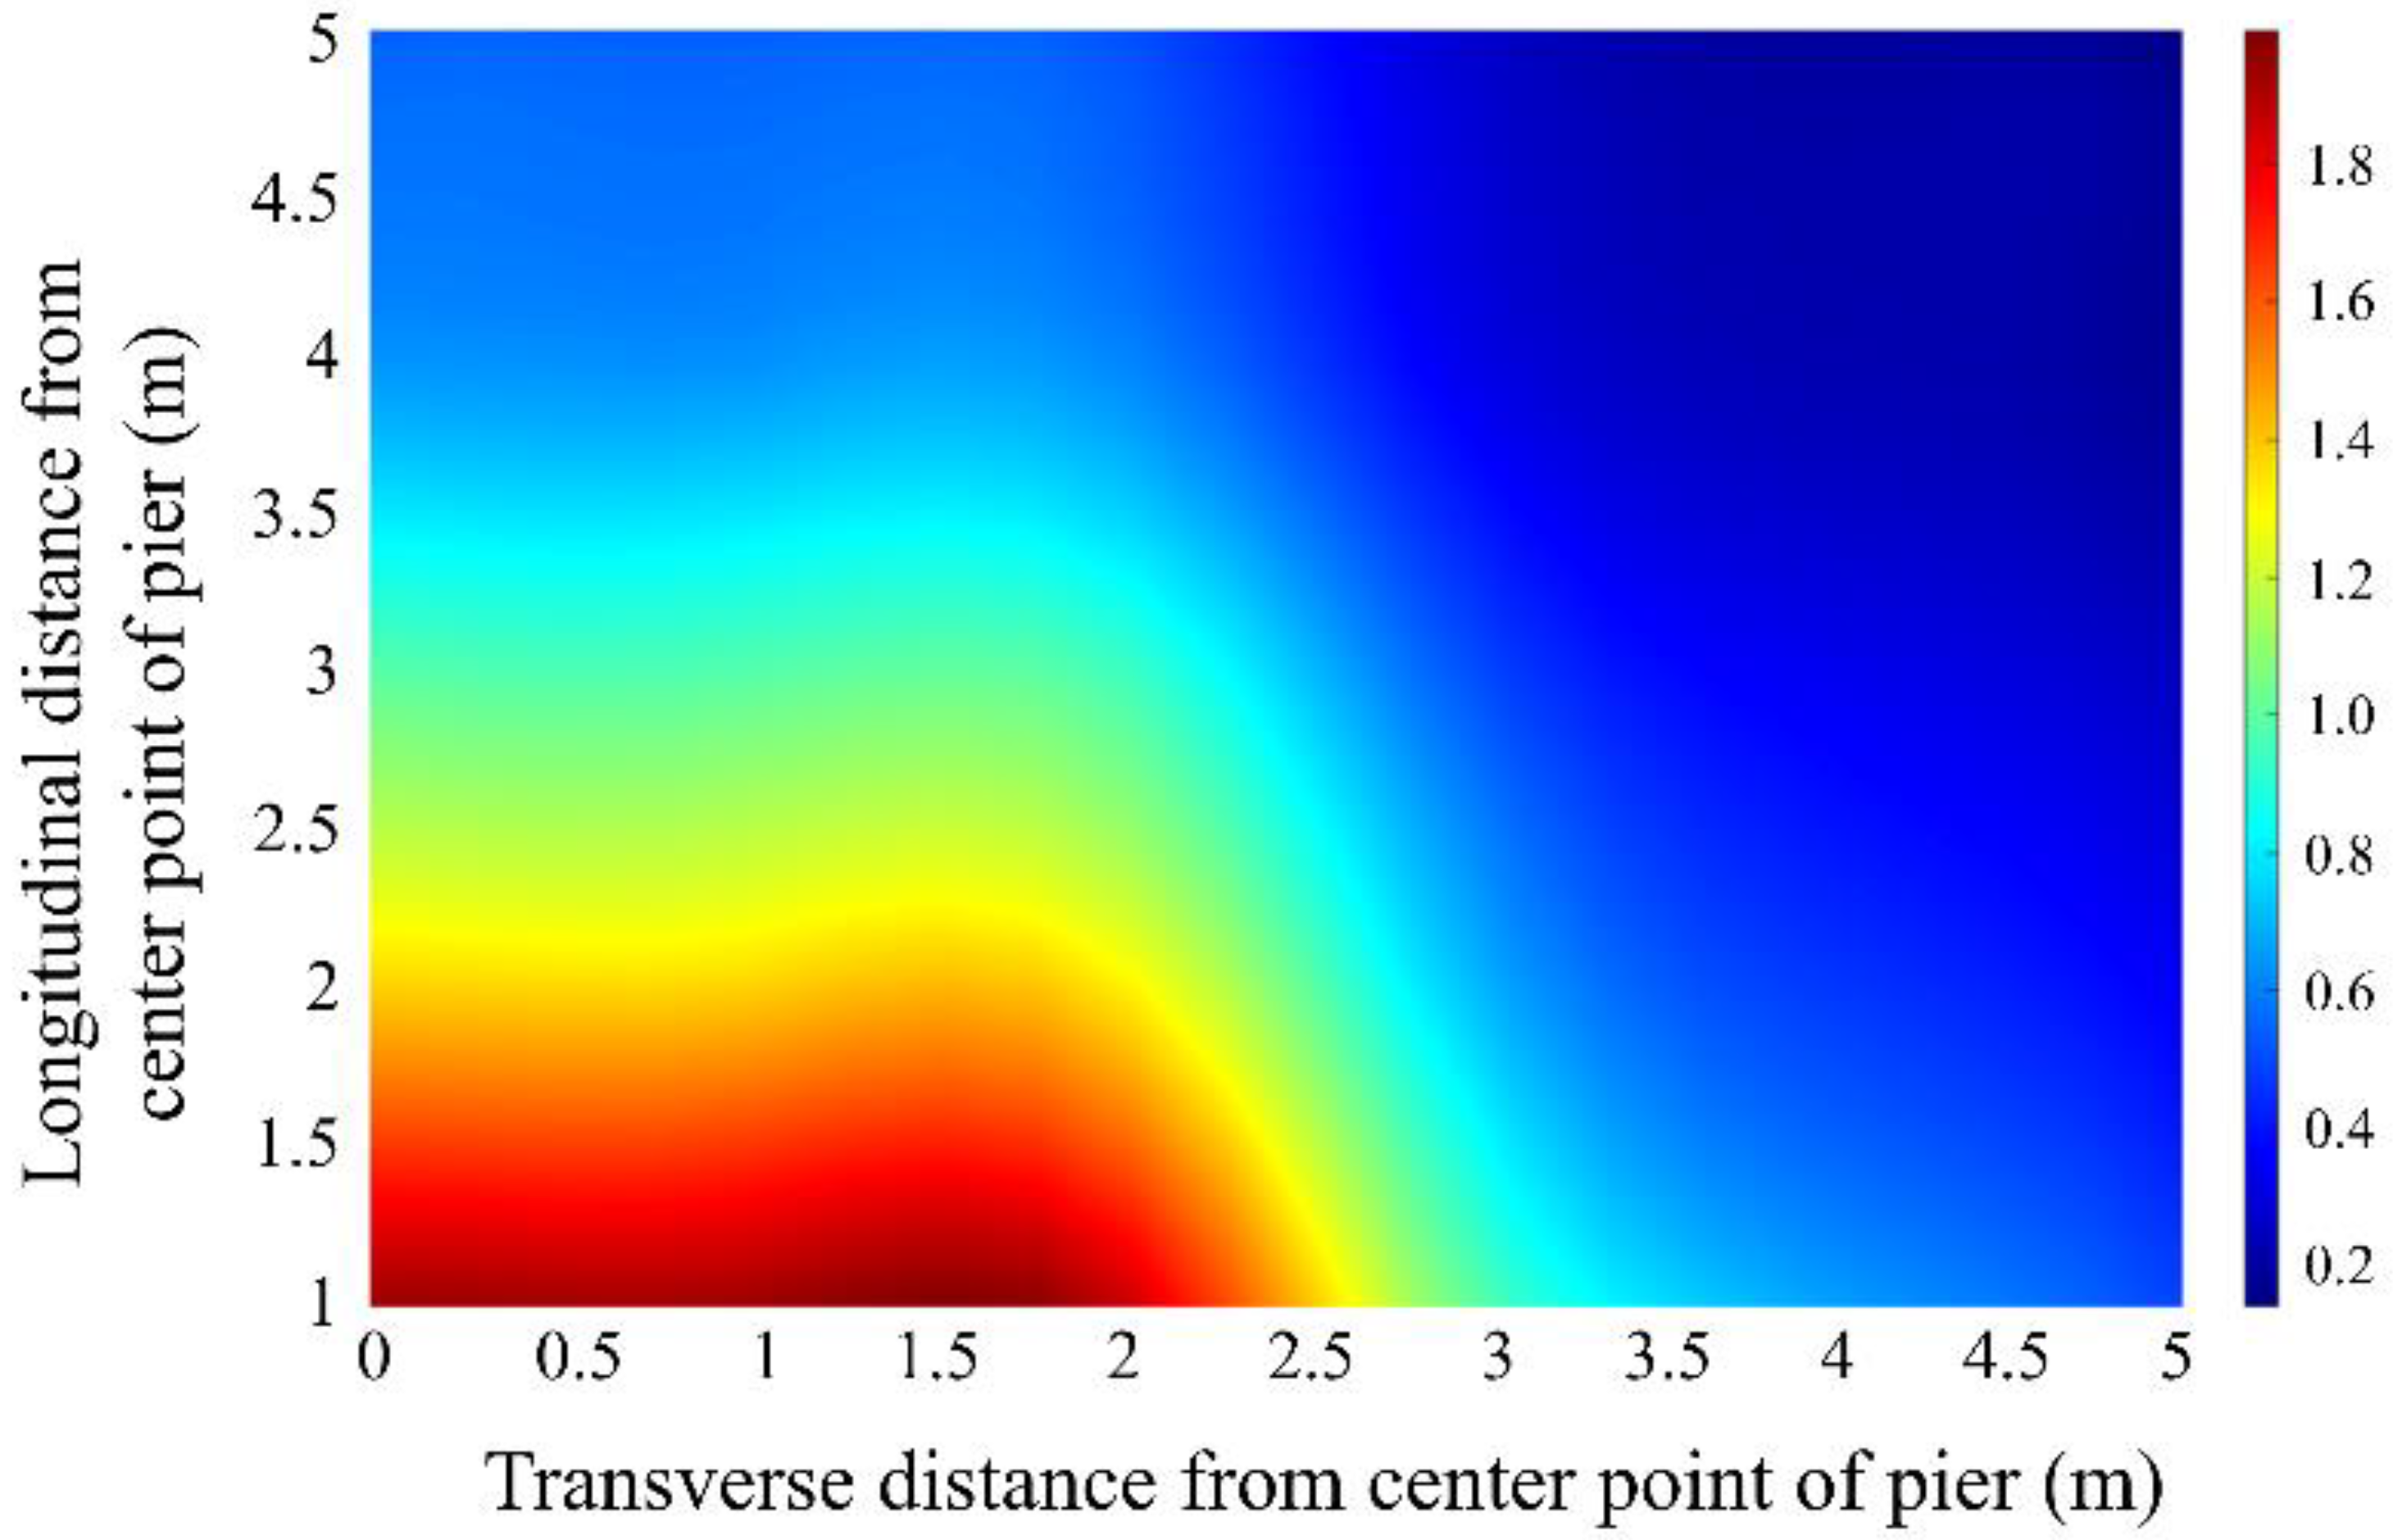
When pier construction is completed but the superstructure is not, due to the randomness of temporary load during construction, this section considers pier inclination under a 490 kN load set at different positions in a 4 × 8 m area in the construction site. Considering the symmetry of spatial distribution, the one-quarter model was taken for calculation, as shown in
Figure 19.
As shown in
Figure 20, in the situation that a temporary load of 490 kN stowed within 3 m from the center point of the pier, the longitudinal deformation at the top of the pier is larger than 1 cm. The maximum deformation can reach 1.95 cm. This is due to the translation and rotation of the pile top caused by foundation deformation, which then leads to the rigid body deformation of the pier.
In conclusion, when pier construction is completed but the superstructure is not, soft foundation deformation caused by related construction equipment and temporary load on-site results in the deformation of piles, and then leads to the rigid body deformation of pier. The displacement value cannot be neglected and related to the position and magnitude of the temporary load.
5.3.2. Pier Inclination Caused by Filling Soil Load during Operation
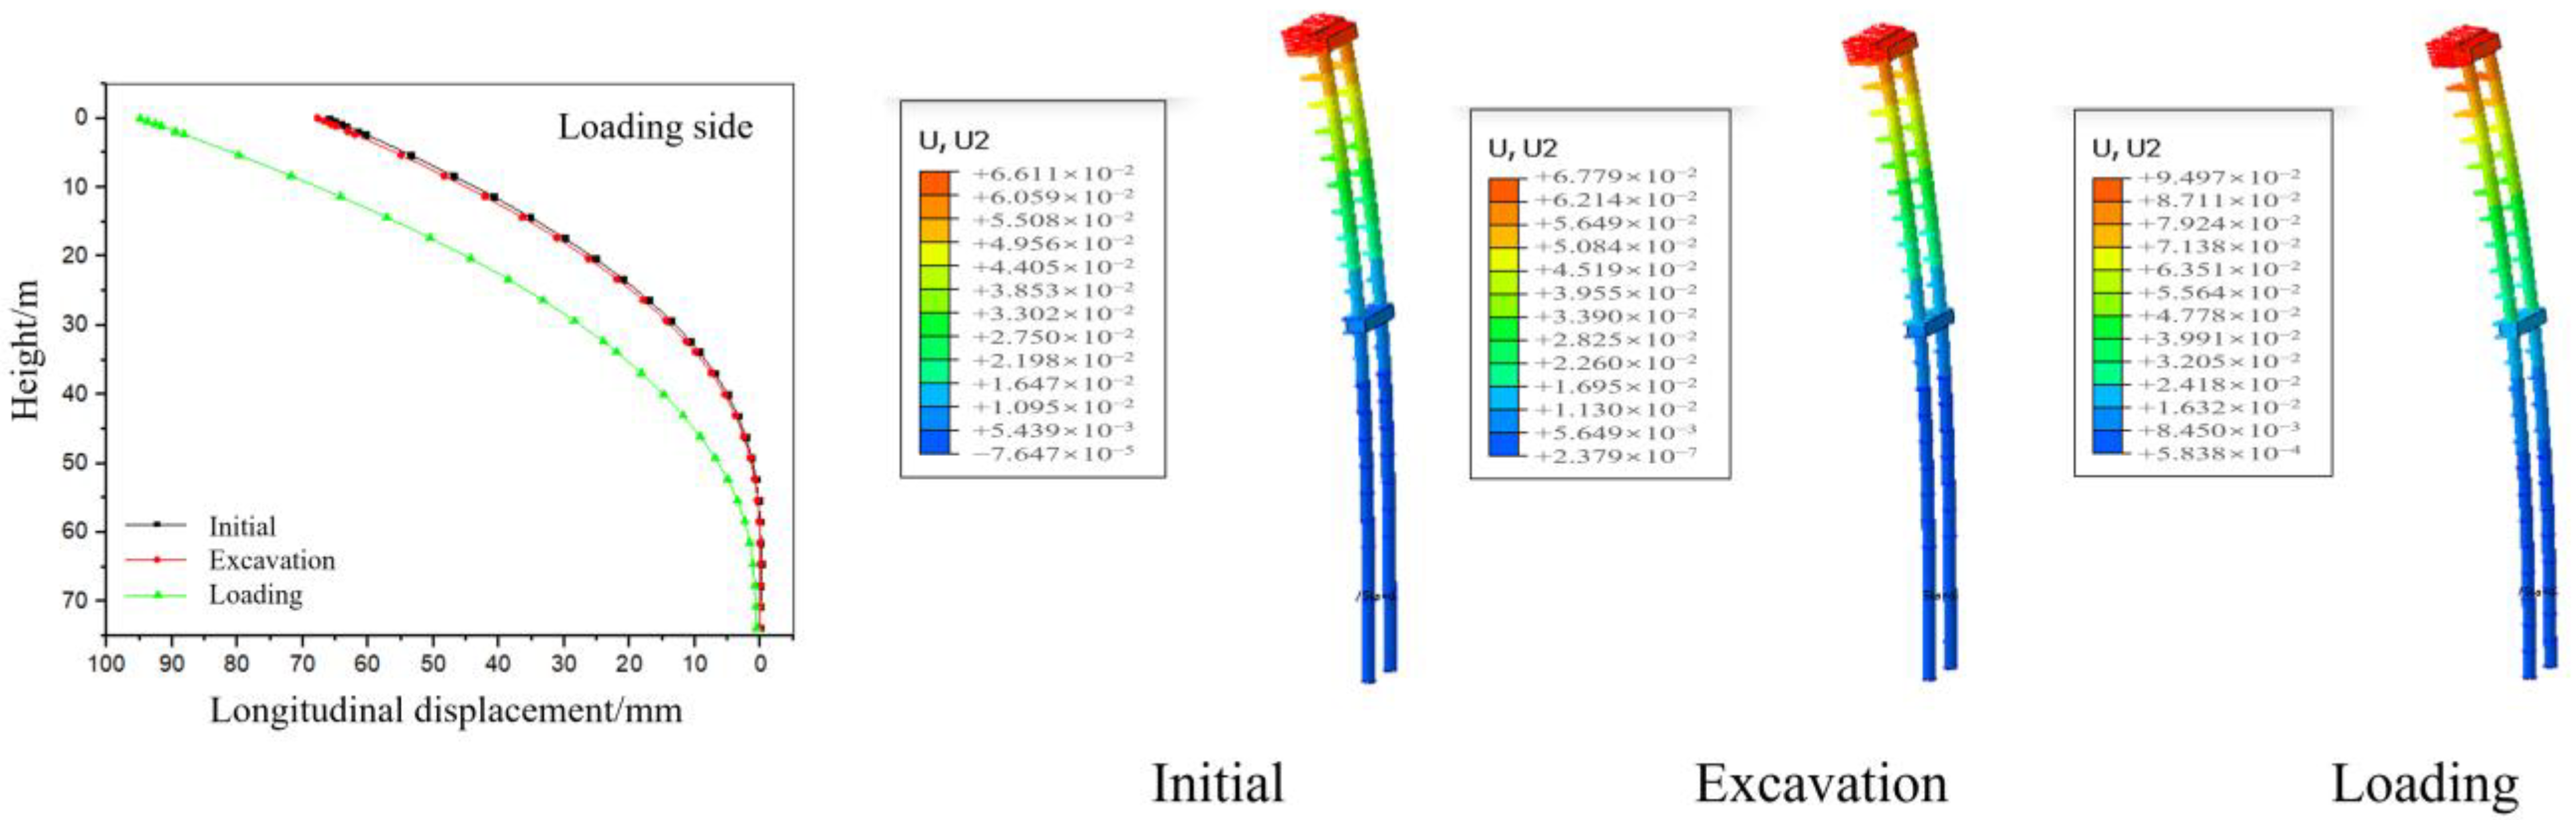
As shown in
Figure 10, there is an asymmetric filling soil load at the bottom of Pier P30 during operation. The numerical results are shown in
Figure 21 (note that the length of arrows indicates the magnitude of the displacement).
During the operation of the bridge, the silt around Pier P30 was excavated at a depth of 2 m at the river side and dumped at the other side. When the filling depth difference is 4 m in the numerical model, the longitudinal inclination of Pier P30 is −(94.97 − 66.11) = −28.9 mm, which is one of the main factors resulting in the inclination of Pier P30.
5.4. Calculation Value of Pier Deformation and Support Slipping
According to Equations (1)–(4), pier inclination, support slipping, and the length of the slip mark on top plate are calculated. This section takes Pier P30 as an example to demonstrate the calculation process. The remaining calculated values of disease for piers and supports are presented in the next section.
The outdoor temperature was 19 °C and the weather was cloudy during the forensic field investigation. The numerical simulation conditions were 3 years after bridge construction with a temperature of 20 °C, to ensure the consistency of the comparative conditions.
The inclination of pier under dead load is modified considering support slipping, as shown in
Figure 22.
The calculated values of inclination and support slipping of Pier P30 at different stages are presented in
Table 4.
6. Discussion and Comparative Analysis
This section discusses the causes of disease according to forensic engineering field investigation data relations in the critical region and verifies the conclusions with numerical results.
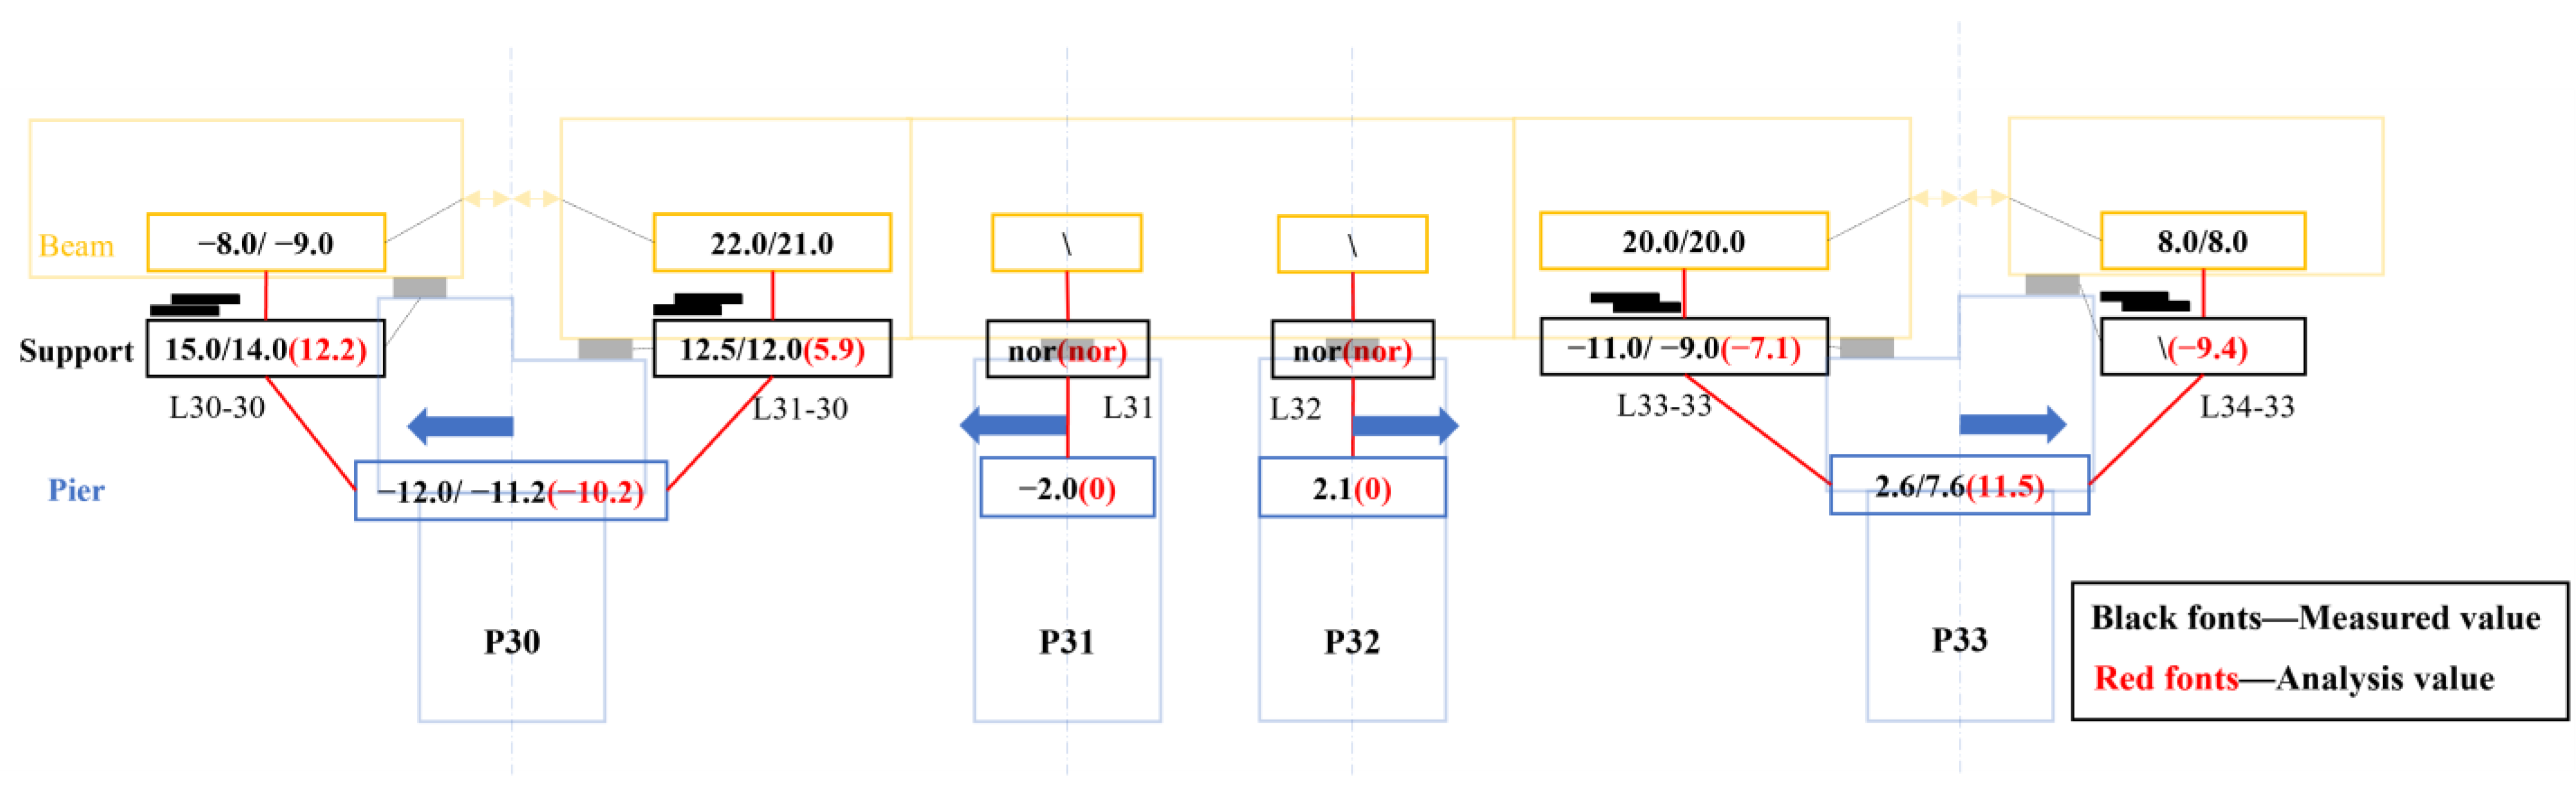
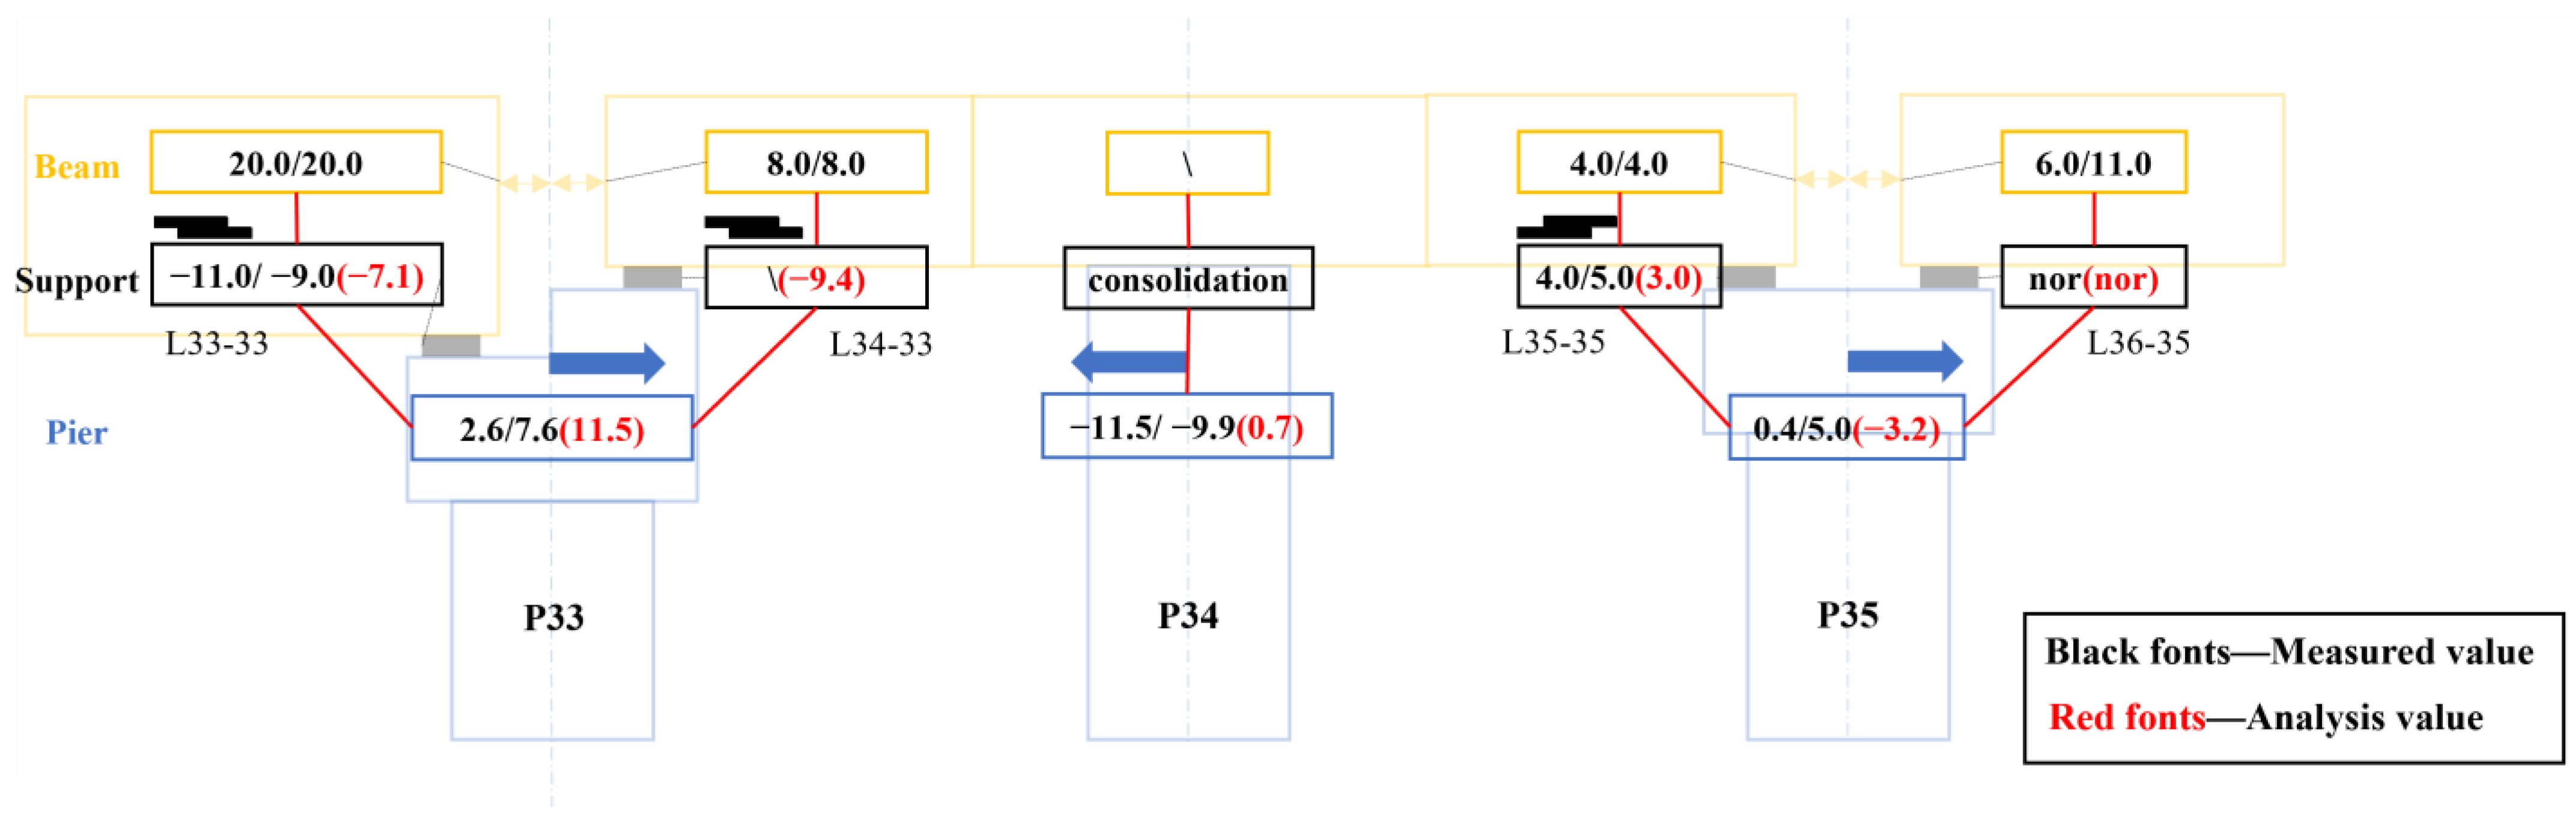
Figure 23,
Figure 24 and
Figure 25 show the forensic field investigation data and numerical results of degradation between Piers P27 and P35. The symbols and notations in the figures are defined as follows:
① Data in brackets represent the numerical results of pier inclination and support slipping. ② The “/” used between data is used to indicate the measured values of two sides along the transverse direction of the bridge. ③ In the pier region, the arrows at the top of the pier column represent the inclination direction, and a positive value indicates the direction of the pier number increasing. ④ In the support region, a positive value indicates that the top plate moves along the direction of the pier number increasing, and “nor” represents support works normally. ⑤ In the girder region, a positive value indicates that the girder end moves in the direction away from the centerline of the cap.
In general, the numerical results of pier inclination and support slipping are consistent with the forensic field investigation data, which indicates that the numerical analysis results closely mirror the actual disease situation. According to the numerical analysis, improper reaction force and the eccentricities of the support on the piers, due to the design change and the asynchronous construction of the concrete and steel girder, cause a large, eccentric compression on Piers P30 and P33 during construction and operation. The asymmetric foundation settlement at the bottom of Pier P30 caused by the filling soil load during operation results in a larger pier inclination and excessive support slipping. On the other hand, the rigid body deformation of the pier occurs due to the soft soil foundation deformation caused by construction equipment and temporary loads on-site when the pier construction is completed but the superstructure is not.
According to displacement relations in the critical region based on forensic engineering, the occurrence time and amount of pier inclination were determined. The causes of disease are discussed, including the status of the superstructure, the rigid body deformation of the pier occurring before the superstructure was constructed, and pier deformation under load after the bridge was constructed.
6.1. Status of Superstructure
6.2. Rigid Body Deformation of Pier
Piers P27, P28, P29, P33, P34, and P35 underwent rigid body deformation when the pier construction was completed but the superstructure was not. There are four types of forensic engineering evidence:
Pier P27: The forensic engineering investigation showed that the inclination of the top of Pier P27 is 3.0/4.5 cm, which means that the measured inclination value is 3.0 cm for one column and 4.5 cm for the other in the double-column pier, and the supports on the pier show no obvious slip or shear deformation. Meanwhile, the superstructure between Piers P27 and P30 does not move, so the pier did not deform after the superstructure was constructed.
Piers P33 and P35: Due to the restraint of the cap, the displacement of the column under non-torsional load should be the same in the double-column pier. However, in the forensic field investigation, the inclination of the top of Pier P33 is 2.6/7.6 cm, and that of Pier P35 is 0.4/5.0 cm. The difference in inclination between the two columns is up to 5 cm, so the pier deformed before the cap was constructed.
Piers P28 and P29: In the forensic field investigation, the inclination of the top of Pier P28 is 6.0/4.8 cm, and that of Pier P29 is 2.0/1.4 cm. Firstly, if the pier inclination occurs after the consolidation of the pier and superstructure, the deformation of the consolidated pier would induce the movement of the superstructure. However, when actually monitored the superstructure between Piers P27 and P30 did not move. Secondly, since the consolidated piers are constrained by the same superstructure, the deformation of the top of the pier would not differ too much, but the field data show a 4 cm difference between Piers P28 and P29.
Pier P34: In the forensic field investigation, the inclination of the top of Pier P34 is −11.5/−9.9 cm. Firstly, if the pier inclination occurs after the consolidation of the pier and superstructure, the deformation of the consolidated pier would drive the superstructure along the direction of the pier number decreasing, resulting in a narrower expansion joint on Pier P33 and a wider one on Pier P35. However, the expansion joint on Pier P33 is actually wider. Then, no concrete cracking was found on the surface of Pier P34 during the field inspection. Thus, the pier inclination occurred before the consolidation of the pier and superstructure.
6.3. Pier Deformation under Load
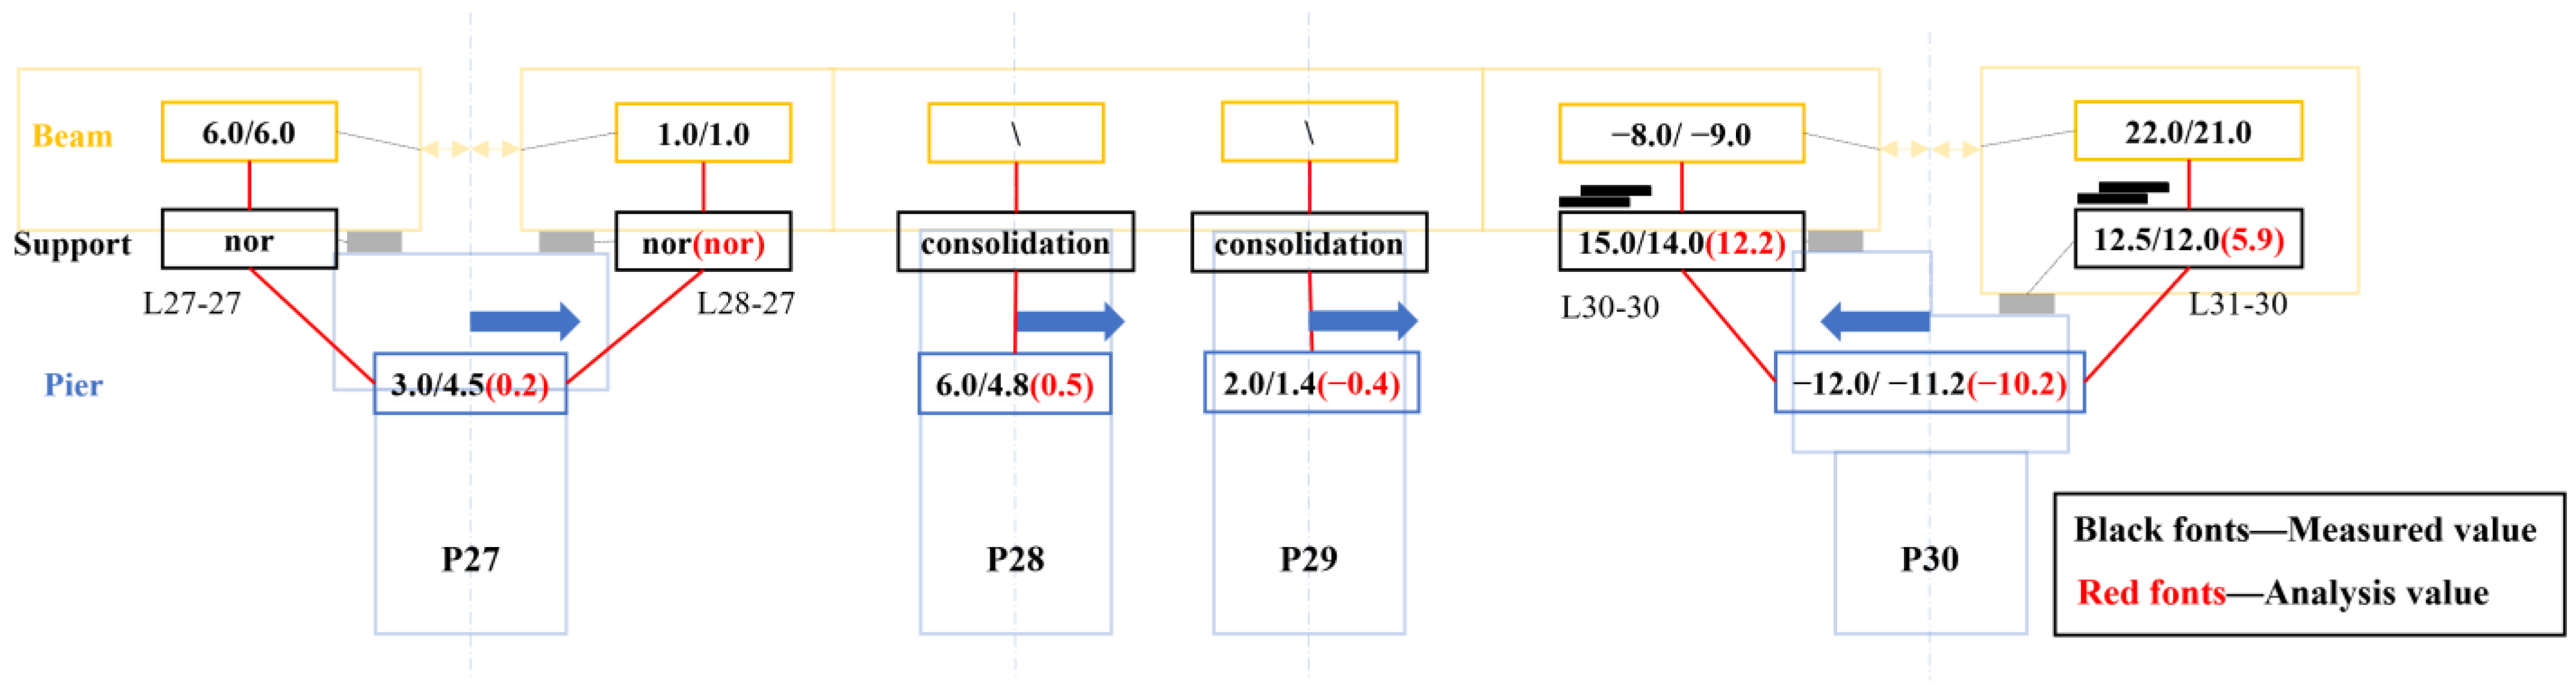
The forensic engineering investigation shows that the inclination of the top of Pier P30 is −12.0/−11.2 cm, while the superstructure does not move. It was concluded that the inclination of Pier P30 occurred after the superstructure was constructed. In the critical region of P30 (as shown in
Figure 22), the girder end of the superstructure is −8.0/−9.0 cm away from the centerline of the cap, and the L30-30 support slipping is 15.0/14.0 cm, allowing us to deduce that the girder end is about 7.0/5.0 cm away from the centerline of the cap before the support slipped, which is within a reasonable error compared with the design value of 4 cm. Therefore, Pier P30 deformed after the superstructure was constructed.
6.4. Discussion of Difference between Numerical Results and Field Data
In general, the numerical results of pier inclination and support slipping are consistent with the forensic field investigation data. However, for the inclination of Piers P27, P28, P29, P33, P34, and P35, the difference between the numerical results and the field investigation data were from −1.8 cm to 12.2 cm, which indirectly indicates the likelihood of pier rigid body deformation caused by foundation deformation during construction.
The numerical results of the support slip mark length are smaller by 2~3 cm compared to that of the field investigation data, due to: (1) the structure temperature being a little lower than the atmospheric temperature during the field investigation; (2) the simulation of concrete shrinkage and creep not being simulated precisely, and as creep deformation in the early stage would be large, resulting in a smaller inclination of the pier after the superstructure was constructed.
6.5. Treatment Measures Based on Cause Analysis
Based on cause analysis, the appropriate treatment measures are proposed to repair the piers and supports that deformed severely. The inclination of Pier P34 is mainly rigid body deformation, and rectifying the consolidated pier would bring the risk of the girder falling. Thus, no rectification was carried out for Pier P34. The inclinations of Piers P30 and P33 are mainly due to the eccentric compression on the piers during construction and operation; meanwhile, the asymmetric foundation settlement caused by filling soil load during operation contributes to the status of Pier P30.
Based on the above, the treatment measures recommended and used on-site were: (1) the rectification of the deviation of Piers P30 and P33 after superstructure lift, and the adjustment of the eccentric distance of supports and replacement of the supports; (2) unloading the asymmetric filling soil at the bottom of Pier P30; (3) replacing the supports on Pier P35.
7. Conclusions
This study reproduces the process of disease occurrence in a ramp bridge in China. Combining forensic engineering field investigation and numerical analysis, the causes of disease (pier inclination and excessive support slipping) were determined. Then, the proposed appropriate treatment measures considering the cause of disease were applied in practical engineering to repair the piers and supports. According to the discussion, this case was a typical project management failure that resulted from several technical and ethical causes.
Combining a numerical simulation and forensic engineering investigation, the influence of various factors on the structure disease were considered quantitatively, and the occurrence time and amount of damage were discussed from a forensic engineering perspective. The major technical causes are summarized as follows:
(1) The improper reaction force and eccentricities of the support on the pier due to the design change and asynchronous construction of concrete and the steel girder brought about the eccentric compression of the pier during construction and operation, and resulted in the inclination and excessive support slip of the pier.
(2) Pier inclination is also influenced by the asymmetric foundation settlement caused by the filling soil load during the operation period.
(3) When the pier construction is completed when the superstructure is not, soft foundation deformation caused by the construction equipment and temporary load on-site will cause the deformation of piles, leading to the rigid body deformation of the pier.
The major ethical issues involved in this case can be divided into three aspects:
Firstly, in the design phase, the design unit did not perform the specified responsibilities and duties to adjust the design of piers when adopting a steel box girder, leading to the eccentric compression on piers during construction and operation.
Secondly, in the construction phase, although the construction standards are not specified, the construction plan failed to prepare and manage the construction equipment and temporary load strictly during construction, leading to the rigid body deformation of the pier and soft foundation deformation when the pier construction was completed and the superstructure was not.
Thirdly, in the operating phase, the filling soil load at the bottom of the pier was ignored during the operation.


