Article

Abdominal Adiposity Increases Lordosis and Doubles the Risk of Low Back Pain

by
Rebeca Saludes
1,
Paula Acevedo
1,
Ignacio Zaragoza García
2,
Álvaro Gómez Carrión
2,
Carlos Martínez Sebastián
2,
Almudena Núñez Fernández
2,
Isabel Seco-Armell
2 and
Rubén Sánchez-Gómez
2,*
1
Department of Biology, Autonomous University of Madrid, 28040 Madrid, Spain
2
Nursing Department, Faculty of Nursing, Physiotherapy and Podiatry, Universidad Complutense de Madrid, 28040 Madrid, Spain
*
Author to whom correspondence should be addressed.
Appl. Sci. 2022, 12(15), 7616; https://doi.org/10.3390/app12157616
Submission received: 11 June 2022 / Revised: 19 July 2022 / Accepted: 25 July 2022 / Published: 28 July 2022
(This article belongs to the Special Issue Skeletal Biomechanics)

Abstract

:
Vertebral disorders have significant health and economic impacts, and due to aging and current lifestyle habits, there is a trend toward their increase. Obesity and the alignment of vertebral curvatures can be associated with back pain. Objective: This study aims to analyze whether general and abdominal obesity are associated with cervical, dorsal, and lumbar vertebral pain as well as increased or decreased values of cervical, dorsal, and lumbar vertebral curvatures. Methodology: Body composition, degree of vertebral curvature, and the perception of cervical, dorsal, and lumbar pain were evaluated in a study population of 301 people (>18 years old). Linear and logistic regression analyses were performed to evaluate the influence of several variables of body composition on vertebral angles and cervical, dorsal, and lumbar pain. Results: Lumbar pain was the most prevalent (66.1%), mainly affecting women (70.9%). They were also shown to have greater lumbar angles (p < 0.001). The degrees of lumbar curvature increased, as did the BMI, waist circumference, and waist-to-height ratio. Cervical and dorsal curvatures were increased by all the variables of adiposity and abdominal adiposity. It was found that people with abdominal obesity carried twice the risk of lower back pain than those without abdominal obesity (OR = 2.172, p < 0.05). In addition, an increased lumbar angle was related to an increased risk of low back pain (OR = 1.031, p < 0.05). Cervical pain, on the other hand, was associated with the waist-height index (OR = 0.948, p <0.01). Conclusions: This study shows that increased lumbar curvature and abdominal obesity may be risk factors for lower back pain. In addition, it shows an association between the amount of body and abdominal fat in relation to the degree of curvature of the spine in the sagittal plane. Investigating the effect of obesity on vertebral morphology and musculoskeletal disorders makes it possible to prescribe interventions and therapeutic strategies.

1. Introduction

Painful musculoskeletal system processes, or musculoskeletal disorders, including vertebral disorders, are among the most prevalent problems affecting the health of the adult population [1]. Furthermore, they are one of the main reasons for medical consultation and work absenteeism [2,3,4]. There is a trend toward their increase mainly due to the aging of the population and a reduction in physical activity [5]. The health, social, and economic impacts caused by spinal disorders are similar to those produced by cardiovascular diseases and diabetes [6].
Obesity has been described as one of the morphologically originating etiological factors associated with back pain, although some studies state that there is insufficient evidence to determine whether adiposity is a risk factor [7,8]. According to other authors, obesity is a secondary cause and its effects are due to underlying muscle strain [9,10].
Vertebral deformities such as increased or decreased physiological curvatures of the spine, which can subsequently weaken the abdominal muscles, are other morphological elements that predispose back ailments [11]. These spinal curvature deformations are hyperkyphosis (increased dorsal curvature), a flat back (decreased dorsal curvature), and hyperlordosis (increased lumbar curvature). As such, these ailments are associated with an increase in sacral inclination [12]. However, results relating to hyperkyphosis and hyperlordosis with indicators of the quantity and distribution of body fat are not yet conclusive [11].
Therefore, the determination of risk factors for spinal pain symptomatology is a field of study that still requires a more precise analysis of body adiposity and its distribution. In this study, different anthropometric indicators such as excess weight and adiposity were used as possible risk factors. General obesity was estimated using the body mass index (BMI), fat percentage (BF%), the distribution of adiposity, waist circumference (WC), and the waist-to-hip ratio (WHR), as well as the waist-to-height ratio (W/HT), which are indicative factors of abdominal obesity.
The objective of this study was to determine the influence of general obesity and abdominal obesity on cervical, dorsal, and lumbar vertebral pain, as well as on the increased or decreased values of cervical, dorsal, and lumbar sagittal angles.

2. Subjects and Methods

2.1. Study Design and Sample Size
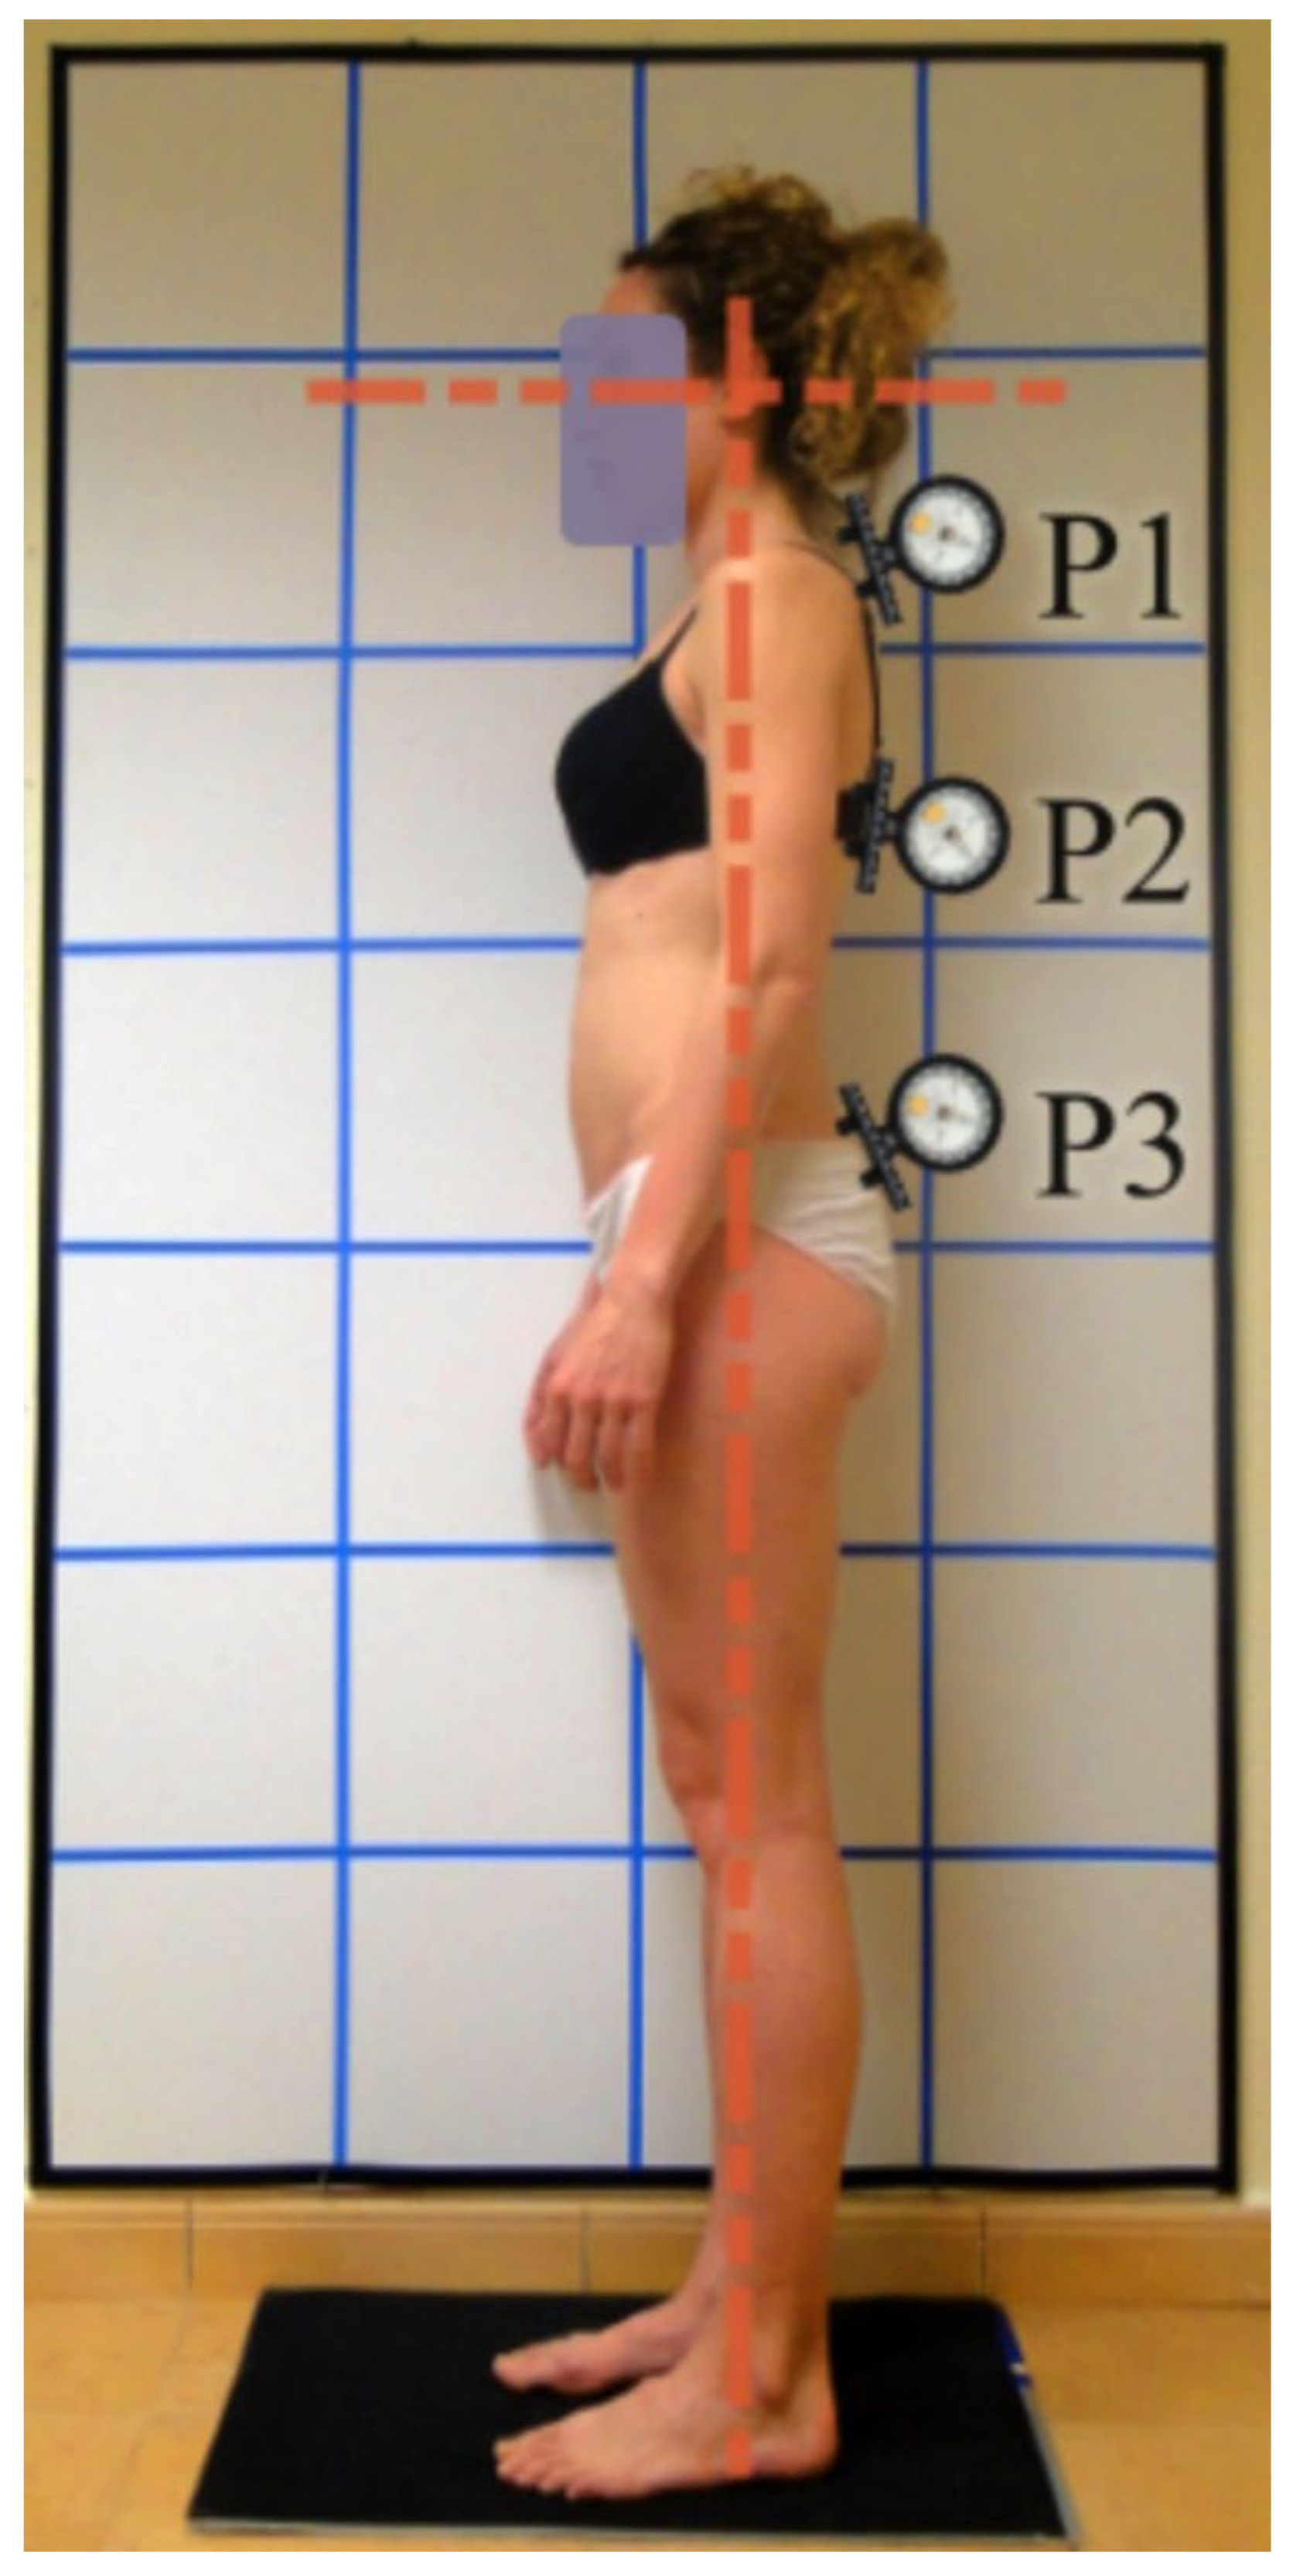
In 2019, an observational analytical study was carried out in different Spanish provincial and municipal locations as a health campaign. In total, 409 patients took part in this study. Participants with surgical interventions on the spine and/or hip, those who used technical assistance to walk, and those with incomplete data for the variables being studied were excluded. The final sample comprised 301 participants of both sexes aged 18 years or older.
This study was approved by the Ethics Committee of the Autonomous University of Madrid. All of the participants signed an informed consent form, which guaranteed voluntary participation and the anonymity of the study, in compliance with the provisions of the Declaration of Helsinki [13].
Body composition was assessed by anthropometric assessment and the degree of vertebral curvature. The perception of vertebral pain was also measured. Meanwhile, sociodemographic data (sex, age, and educational level) and data regarding physical activity data were collected using a standardized test. All of the tests estimating the participants’ physical condition were undertaken by a trained person to ensure statutory compliance and uniform application of the procedure as well as to avoid any errors in measurement.

2.2. Measurements

A physical examination was conducted to ascertain the anthropometric and angular evaluation of the vertebral curvatures. This was performed by placing the subject in an upright position, barefoot, while dressed in light clothing. The angular quantification of the vertebral curvatures was performed with the subject in a sagittal vertebral posture (Figure 1).
Anthropometric measurements and body composition indexes: Weight (kg) was measured using a Tanita© BF 350 scale (Madrid, Spain). Height (cm) was measured with the subject in a standing position and with the heels placed together, while the head position was maintained in the Frankfurt plane. Waist and hip circumferences were measured using a Seca® (Hamburg, Germany) brand tape measure. The waist circumference (WC) was measured at the midpoint between the lower border of the last palpable rib and the upper portion of the iliac crest. The hip circumference was measured at the trochanter level according to the criteria established by the World Health Organization [14]. In order to evaluate the percentage of body fat (BF%), subcutaneous, tricipital, bicipital, subscapular, and supra-iliac fat folds (mm) were measured on the left side of the body by using a Holtain caliper, in accordance with Lohman standards [15]. Based upon these measurements, the indicators of general obesity (namely, BMI and BF%) and abdominal obesity (WC, WHR, and W/HT) were readily calculated.
The subjects were classified according to BMI (weight -kg-/height -m2-), and the values of normal weight were considered to be <24.99 kg/m2, while overweight was >25 and <29.99 kg/m2 while obesity was classified at >30 kg/m2 [16]. The BF% was calculated from subcutaneous fat folds using the body density formula and the Siri equation [17,18]. The following limitation cut-off points were used: 21–25% in men and 31–33% in women, while values for obesity were: >25.01% in men and >33.01% in women [19]. Abdominal obesity was defined with WC values > 88 cm for women and >102 cm for men [16]. The WHR risk values for obesity were >1 for men and >0.85 for women [20]. The risk category of the W/HT was considered at values >0.51 for both sexes [21].
Angular quantification of vertebral curvatures: A Unilevel inclinometer (ISOMED, Inc., Portland, OR, USA) was used after identifying the position of the cervical, thoracic, and lumbar angle postural markers as described by Bullock-Saxton [22]. This procedure presents a simple, noninvasive, objective, and low-cost methodology that correlates well with magnetic X-rays for evaluation of the spine [23]. For the results to be valid and reproducible, it was necessary to perform the subjects’ measurements in a standardized anatomical position (Figure 1). The points of reference were P1: the inclination of the cervical section, P2: maximum kyphosis of the thoracic section, and P3: sacral inclination. The inclinometer was reset to 0°, and the inclinometer is supported on the seventh cervical vertebra, which corresponds to the cervical angle. From P1, with the device at 0°, it slides caudally to the point of greatest inclination, which is P2. In order to measure lumbar lordosis, the inclinometer was reset to 0° from P2 and slid caudally to P3, which corresponds to the second vertebra of the sacrum. Normal values for dorsal curvature fall within the range of 20° to 45°, and for cervical and lumbar curvature, they are in the range of 20° to 40° (for measurements made with an inclinometer) [24].
Assessment of back pain: The self-perception of cervical, dorsal, and lumbar vertebral pain (yes/no) was collected over the last year, including both radicular and non-radicular pain, even if such pain occurred intermittently.
Covariates: Participants’ sex, age, educational level, and physical activity. The educational levels were coded as either low (complete or incomplete elementary studies) or high (secondary studies or higher). Physical activity was assessed using the International Reduced Physical Activity Questionnaire for Adults (IPAQ) [25], which quantifies physical activity by using the metabolic equivalents index (METs) [26].

2.3. Statistical Analysis

The parametric tests were used according to the Central Limit Theorem. In large enough samples (n > 30), the shape of the sampling distribution will approximate the normal distribution. [27].
The means (m) and standard deviations (sd) were provided for quantitative variables, and the Student’s t-test was used for comparison between the men and women. Frequencies (n) with percentages (%) were reported for qualitative variables, and the χ2 test was used for comparison between the men and women.
Linear regression analyses were performed to assess the influence of abdominal adiposity (WC, WHR, W/HT) and the indicators of general obesity (BMI, BF%) on vertebral angles, and logistic regression analyses were performed to assess the influence of abdominal adiposity (WC, WHR, W/HT) and the indicators of general obesity (BMI, BF%) and degrees of vertebral curvature on cervical, dorsal, and lumbar pain. Both analyses allowed us to estimate the independent effect of variables while controlling the effects of covariates. The estimates of β regression coefficients for linear regression and an odds ratio (OR) for logistic regression were provided together with a 95% confidence interval (95% CI).
Statistical significance was predetermined as p < 0.05. The R statistical software was used for all statistical analyses.

3. Results

3.1. Baseline Characteristics

The characteristics of the study population were classified by sex (Table 1). Low back pain was the most prevalent ailment, affecting 66.1% of the population, whereas cervical pain affected 57.1%, and dorsal pain affected 33.6%. Women were more affected than men by the three types of back pain: 70.9% of the female participants experienced lumbar pain (vs. 59.0%, p = 0.032), and 65.9% suffered from cervical pain (vs. 44.3% in men, p < 0.001), while 38.0% suffered from dorsal pain (vs. 27.0%, p = 0.048). Only the dorsal vertebral angles presented mean values above the normal values in both men (50.5°, SD = 11.2) and women (53.0°, SD = 11.6). The only significant difference between the sexes was obtained in lumbar lordosis, with a greater angle of curvature in women (38.5°, SD = 11.5, vs. 33.3°, SD = 12.0, p < 0.001).
The study population fell within the overweight category for BMI, both men (25.6 kg/m2, SD = 3.7) and women (25.6 kg/m2, sd = 4.5). Considering the BF%, men had borderline values (22.9%, SD = 7.5) while women participants achieved obesity values (35.6%, SD = 6.4) (p < 0.001). The prevalence of abdominal obesity was also significantly higher among women for both WC (27.9% vs. 16.4%, p = 0.020) and WHR (39.7% vs. 21.3%, p = 0.001). No significant differences were observed between the sexes in the W/HT ratio, but in both cases, most of the population presented risk values.
MET, metabolic equivalent; BMI, body mass index; BF%, body fat percentage; WC, waist circumference; WHR, waist-hip ratio; W/HT, waist-to-height. p-values were obtained by Student’s t-test for quantitative variables and by χ2 test for qualitative variables.

3.2. Association between Obesity and Abdominal Obesity with Vertebral Curvatures

The effects of general and abdominal obesity on the vertebral angles estimated by linear regression (Table 2), show that the cervical and dorsal curvature increased due to the variables of excess weight, adiposity, and abdominal adiposity. The control variables were sex, age, educational level, and physical activity. However, the greatest modifying effect occurred with an increase in W/HT. Lumbar curvature was only affected by BMI, WC, and W/HT ratio.

3.3. Association between Adiposity and Vertebral Curvatures with Vertebral Pain

The variables associated with cervical, dorsal, and lumbar pain (Table 3) show that WC and the angle of lumbar curvature are predictive variables of lumbar pain, controlled for the effects of sex, age, educational level and physical activity. People with abdominal obesity were twice as likely to suffer from lower back pain as people without abdominal obesity (OR = 2.172, 95% CI = 1.067–4.419, p < 0.05), regardless of sex, age, education level, and physical exercise. In addition, an increase in the lumbar angle was associated with an increased risk of suffering from low back pain (OR = 1.031, 95% CI = 1.007–1.055, p < 0.05). Neck pain has been associated with W/HT, and W/HT risk values acted as a protective factor against neck pain (OR = 0.552, 95% CI = 0.307–0.993, p < 0.01). Dorsal pain has not been associated with body composition or vertebral angle.

4. Discussion

This study aimed to evaluate the influence of excess weight, adiposity, and body fat distribution on back pain and physiological vertebral angles.
The results showed a high prevalence of low back and neck pain, especially in women, and showed the relationship between adiposity and increased angles of vertebral curvatures, as well as an association between abdominal obesity and low back pain.

4.1. Sagittal Spinal Posture

Previous studies have described differences in the measurements of sagittal curvatures of the spine between men and women, as well as differences associated with age [28,29,30]. However, few studies have evaluated the influence of body adiposity on the degree of kyphosis, cervical and dorsal kyphosis, as well as lordosis among the adult population.
After controlling the effect of variables associated with adiposity, the results of this study show how all the indicators of excess weight and adiposity provide a significant influence on cervical and dorsal kyphosis [31]. A greater modifying effect of the WHR was observed, while a weak effect was shown for the rest of the indicators. The modification of lumbar lordosis appears to be solely associated with the accumulation of abdominal fat. However, other studies have shown that excessive body weight increases the risk of developing lumbar hyperlordosis [32]. An increase in curvature angles associated with the increase in the values of adiposity does not necessarily reflect pathological situations since there is great variability of values in the measurements of the vertebral curvatures, and only extreme values are useful for describing curves as excessive, insufficient, or invested [33,34].

4.2. Back Pain

Epidemiological studies have found a strong relationship between low back pain and pathological angular values, both for below-normal, kyphosis, and lumbar rectification [34] and for increased degrees of lumbar curvature [35]. In this study, LBP was associated with increased lumbar curvature and abdominal obesity regardless of the subjects’ age, sex, and level of physical activity. Furthermore, low back pain has been associated with increased lumbar curvature and abdominal obesity. An excessive accumulation of abdominal fat may be indicative of disharmony in the control of abdominal muscles, which would explain the association with low back pain [36].
The relationship between excess weight and general back pain has also been explained by the effects of mechanical loading [37]. The connection between abdominal obesity and low back pain may be explained by the biomechanical tension exerted by the weight of the abdomen on the lower part of the spine [37]. The weight and expansion of the abdomen cause a change in the position of the center of gravity and the positioning of the spine, which implies multiplying the force required in carrying out the efforts of daily activities and postural changes. This repeated increase in effort on the lower area of the spine may increase episodes of pain. In subjects with abdominal obesity, the effects of overload are cumulative and are further influenced by behaviors and habits associated with lifestyle [38].
Regarding neck and dorsal pain, the results did not show an association with vertebral curvatures or with indicators of weight and adiposity, except for W/HT risk values, which seem to have a protective effect against neck pain. This opens up new questions for future work regarding the effects of the relationship between height and abdominal obesity on neck pain.
By advancing research on the effects of obesity on vertebral morphology and musculoskeletal disorders, health professionals are learning which types of intervention are advisable and how to advance toward other therapeutic strategies [37]. Therefore, in clinical practice, anthropometric monitoring is preferred in place of repeated radiographic exposure in treating postural attitudes, such as kypholordosis or lumbar rectification.
This study serves to provide useful data in this regard and contributes toward a better understanding of the association between obesity, sagittal alignment, and back pain. However, in the face of a diagnosis, it must be considered that there is no consensus on the critical values or standard references of vertebral curvatures and that only the extreme limits are useful for the appreciation of curves as excessive, insufficient, or inverted [33]. One potential cause of these limitations may be that currently, not a single non-invasive postural test is professionally recognized as the gold standard, which is the reason why the evidence provided is often incomparable. The procedure used in this study constitutes a simple, practical, objective, and low-cost tool for a noninvasive evaluation of postural analysis of the spine.
According to previous transversal studies, which evaluate a characteristic that had accumulated in the past, it is possible to establish reference tables of the sagittal plane curve for standing subjects examined from the side [7,8,9,10,11,12,13,14,15,16,17,18,19,20,21,22,23,24,25,26,27,28,29,30,31,32]. In this way, an easily replicable standard posture is determined. However, it is relevant for future projects to carry out longitudinal studies to observe the evolution of sagittal curves over time.

5. Conclusions

This study showed a statistical association between the amount of body and abdominal fat and the physiological curves of the spine in the sagittal plane. In addition, the results showed a positive association that links increased lumbar curvature and abdominal obesity as risk factors for the development of low back pain, which may be explained, in part, by biomechanical tension and postural relaxation of the abdominal muscles.

Future Lines of Research

The present results obtained in this paper must be investigated deeply in future studies to establish whether this observation is due to a true biomechanical association.
This study presents interesting results that may be useful in the design of future studies concerning vertebral health. However, to advance research on the effects of obesity on spinal morphology and musculoskeletal disorders, a consensus on non-invasive posture testing to be recognized as the gold standard is necessary.
Regarding neck pain, the results showed an association of vertebral curvature with W/HT risk values, which seem to have a protective effect against neck pain. In future publications, it would be desirable to delve into the association between these variables.

Author Contributions

Conceptualization, P.A.; data curation, R.S. and I.S.-A.; formal analysis, R.S., C.M.S., A.N.F. and I.S.-A.; investigation, R.S. and R.S.-G.; methodology, P.A. and I.Z.G.; project administration, Á.G.C. and R.S.-G.; resources, I.Z.G., C.M.S., A.N.F. and R.S.-G.; software, P.A. and I.Z.G.; supervision, Á.G.C.; writing—original draft, R.S.; writing—review & editing, P.A., I.Z.G., Á.G.C., C.M.S., A.N.F., I.S.-A. and R.S.-G. All authors have read and agreed to the published version of the manuscript.

Funding

This work was carried out under the doctoral program in Biology of the Autonomous University of Madrid. The author Rebeca Saludes received the support of the Madrid City Council (Madrid, Spain) and received the support of the Camarena City Council (Toledo, Spain).

Institutional Review Board Statement

The study was conducted in accordance with the Declaration of Helsinki and approved by the Ethics Committee) of Autonomous University of Madrid (protocol code: 20 18000 10391 and date of approval: 30/05/2018 13:29:13), for studies involving humans.

Informed Consent Statement

Informed consent was obtained from all subjects involved in the study.

Data Availability Statement

Research data supporting this publication are available previous petition mailing to corresponding author.

Conflicts of Interest

The authors declare no conflict of interest.

References

  1. Safiri, S.; Kolahi, A.A.; Smith, E.; Hill, C.; Bettampadi, D.; Mansournia, M.A.; Collins, G. Global, regional and national burden of osteoarthritis 1990–2017: A systematic analysis of the Global Burden of Disease Study 2017. Ann. Rheum. Dis. 2020, 79, 819–828. [Google Scholar] [CrossRef] [PubMed]
  2. Hoy, D.; March, L.; Brooks, P.; Blyth, F.; Woolf, A.; Bain, C.; Buchbinder, R. The global burden of low back pain: Estimates from the Global Burden of Disease 2010 study. Ann. Rheum. Dis. 2014, 73, 968–974. [Google Scholar] [CrossRef] [PubMed] [Green Version]
  3. Hartvigsen, J.; Hancock, M.J.; Kongsted, A.; Louw, Q.; Ferreira, M.L.; Genevay, S.; Woolf, A. What low back pain is and why we need to pay attention. Lancet 2018, 391, 2356–2367. [Google Scholar] [CrossRef] [Green Version]
  4. Nestares, T.; Salinas, M.; de Teresa, C.; Díaz-Castro, J.; Moreno-Fernández, J.; López-Frías, M. Factores de riesgo relacionados con los hábitos de vida en pacientes con patología osteomuscular. Nutr. Hosp. 2017, 34, 444–453. [Google Scholar] [CrossRef]
  5. Blyth, F.M.; Briggs, A.M.; Schneider, C.H.; Hoy, D.G.; March, L.M. The global burden of musculoskeletal pain—Where to from here? Am. J. Public Health 2019, 109, 35–40. [Google Scholar] [CrossRef]
  6. Norberg, M.; Norberg, M.A. Lumbalgias comunes: Discapacidad y técnicas de evaluación, incidencias socioeconómicas. EMC Apar. Locomot. 2016, 49, 1–7. [Google Scholar] [CrossRef]
  7. Onyemaechi, N.O.; Anyanwu, G.E.; Obikili, E.N.; Onwuasoigwe, O.; Nwankwo, O.E. Impact of overweight and obesity on the musculoskeletal system using lumbosacral angles. Patient Prefer. Adherence 2016, 10, 291. [Google Scholar] [CrossRef] [Green Version]
  8. Raza, A.; Jamshaid, M.; Riaz, T.; Bashir, I.; Majeed, I.; Akram, W. Correlation of back pain with obesity and posture among teenagers. Anaesth. Pain Intensive Care 2019, 2019, 112–116. [Google Scholar]
  9. Pagnotti, G.M.; Haider, A.; Yang, A.; Cottell, K.E.; Tuppo, C.M.; Tong, K.Y.; Chan, M.E. Postural Stability in Obese Preoperative Bariatric Patients Using Static and Dynamic Evaluation. Obes. Facts 2020, 13, 499–513. [Google Scholar] [CrossRef]
  10. Yelmaiza, M.; Susanti, R.; Indra, S. The Risk Factors Affecting Disability Level of Lumbar Disc Herniation. Biosci. Med. J. Biomed. Transl. Res. 2022, 6, 1275–1280. [Google Scholar] [CrossRef]
  11. Brito-Hernández, L.; Espinoza-Navarro, O.; Díaz-Gamboa, J.; Lizana, P.A. Evaluación postural y prevalencia de hipercifosis e hiperlordosis en estudiantes de enseñanza básica. Int. J. Morphol. 2018, 36, 290–296. [Google Scholar] [CrossRef] [Green Version]
  12. Tatsumi, M.; Mkoba, E.M.; Suzuki, Y.; Kajiwara, Y.; Zeidan, H.; Harada, K.; Aoyama, T. Risk factors of low back pain and the relationship with sagittal vertebral alignment in Tanzania. BMC Musculoskelet. Disord. 2019, 20, 1–5. [Google Scholar] [CrossRef] [Green Version]
  13. World Medical Association. World Medical Association Declaration of Helsinki. Ethical principles for medical research involving human subjects. Bull. World Health Organ. 2001, 79, 373. [Google Scholar]
  14. World Health Organization. Waist Circumference and Waist-Hip Ratio: Report of a WHO Expert Consultation; World Health Organization: Geneva, Switzerland, 2008. [Google Scholar]
  15. Lohman, T.G.; Roche, A.F.; Martorell, R. (Eds.) Anthropometric standardization reference manual. In Human Kinetics Books; Agris: Rome, Italy, 1991; Available online: https://agris.fao.org/agris-search/search.do?recordID=US201300683431 (accessed on 2 July 2022).
  16. World Health Organization. Obesity: Preventing and Managing the Global Epidemic; Technical Report Series 894; World Health Organization: Geneva, Switzerland, 2000. [Google Scholar]
  17. Durnin, J.V.; Womersley, J.V.G.A. Body fat assessed from total body density and its estimation from skinfold thickness: Measurements on 481 men and women aged from 16 to 72 years. Br. J. Nutr. 1974, 32, 77–97. [Google Scholar] [CrossRef] [Green Version]
  18. Siri, W.E. Body composition from fluid spaces and density: Analysis of methods. Tech. Meas. Body Compos. 1961, 61, 223–244. [Google Scholar]
  19. Aranceta, J.; Foz, M.; Moreno, B.; Gil, B.; Jover, E.; Millán, J.; Monereo, S. Documento de consenso: Obesidad y riesgo cardiovascular. Clín. Investig. Arterioscler. 2003, 15, 196–232. [Google Scholar] [CrossRef]
  20. Han, T.S.; Seidell, J.C.; Currall, J.E.P.; Morrison, C.E.; Deurenberg, P.; Lean, M.E.J. The influences of height and age on waist circumference as an index of adiposity in adults. Int. J. Obes. 1997, 21, 83–90. [Google Scholar] [CrossRef] [Green Version]
  21. Hsieh, S.D.; Yoshinaga, H.; Muto, T. Waist-to-height ratio, a simple and practical index for assessing central fat distribution and metabolic risk in Japanese men and women. Int. J. Obes. 2003, 27, 610–616. [Google Scholar] [CrossRef] [Green Version]
  22. Bullock-Saxton, J. Postural alignment in standing: A repeatability study. Aust. J. Physiother. 1993, 39, 25–29. [Google Scholar] [CrossRef] [Green Version]
  23. Saur, P.M.; Ensink, F.B.M.; Frese, K.; Seeger, D.; Hildebrandt, J. Lumbar range of motion: Reliability and validity of the inclinometer technique in the clinical measurement of trunk flexibility. Spine 1996, 21, 1332–1338. [Google Scholar] [CrossRef]
  24. Santonja, F.; Pastor, A.; Andújar, P. Cifosis y lordosis. Cirugía Menor Proced. Med. Fam. 2000, 1, 783–792. [Google Scholar]
  25. Craig, C.L.; Marshall, A.L.; Sjöström, M.; Bauman, A.E.; Booth, M.L.; Ainsworth, B.E.; Oja, P. International physical activity questionnaire: 12-country reliability and validity. Med. Sci. Sports Exerc. 2003, 35, 1381–1395. [Google Scholar] [CrossRef] [PubMed] [Green Version]
  26. Haskell, W.L.; Lee, I.M.; Pate, R.R.; Powell, K.E.; Blair, S.N.; Franklin, B.A.; Bauman, A. Physical activity and public health: Updated recommendation for adults from the American College of Sports Medicine and the American Heart Association. Circulation 2007, 116, 1081. [Google Scholar] [CrossRef] [PubMed] [Green Version]
  27. Orozco, C.A.T.; Sánchez, J.R.B. Influencia de la asimetría en el tamaño de la muestra para el cumplimiento del teorema central del límite en distribuciones continúas. Sci. Tech. 2017, 22, 398–402. [Google Scholar]
  28. Damasceno, L.H.F.; Catarin, S.R.G.; Campos, A.D.; Defino, H.L.A. Lumbar lordosis: A study of angle values and of vertebral bodies and intervertebral discs role. Acta Ortop. Bras. 2006, 14, 193–198. [Google Scholar] [CrossRef]
  29. Takeda, N.; Kobayashi, T.; Atsuta, Y.; Matsuno, T.; Shirado, O.; Minami, A. Changes in the sagittal spinal alignment of the elderly without vertebral fractures: A minimum 10-year longitudinal study. J. Orthop. Sci. 2009, 14, 748–753. [Google Scholar] [CrossRef]
  30. Araújo, F.A.; Simões, D.; Silva, P.; Alegrete, N.; Lucas, R. Sagittal standing posture and relationships with anthropometrics and body composition during childhood. Gait Posture 2019, 73, 45–51. [Google Scholar] [CrossRef]
  31. Tatsumi, Y.; Watanabe, M.; Kokubo, Y.; Nishimura, K.; Higashiyama, A.; Okamura, T.; Miyamoto, Y. Effect of age on the association between waist-to-height ratio and incidence of cardiovascular disease: The Suita study. J. Epidemiol. 2013, 23, 351–359. [Google Scholar] [CrossRef] [Green Version]
  32. Jankowicz-Szymańska, A.; Bibro, M.; Wodka, K.; Smola, E. Does excessive body weight change the shape of the spine in children? Child. Obes. 2019, 15, 346–352. [Google Scholar] [CrossRef]
  33. Stagnara, P.; De Mauroy, J.C.; Dran, G.; Gonon, G.P.; Costanzo, G.; Dimnet, J.; Pasquet, A. Reciprocal angulation of vertebral bodies in a sagittal plane: Approach to references for the evaluation of kyphosis and lordosis. Spine 1982, 7, 335–342. [Google Scholar] [CrossRef] [Green Version]
  34. Zaina, F.; Atanasio, S.; Ferraro, C.; Fusco, C.; Negrini, A.; Romano, M.; Negrini, S. Review of rehabilitation and orthopedic conservative approach to sagittal plane diseases during growth: Hyperkyphosis, junctional kyphosis, and Scheuermann disease. Eur. J. Phys. Rehabil. Med. 2009, 45, 595–603. [Google Scholar]
  35. Chun, S.W.; Lim, C.Y.; Kim, K.; Hwang, J.; Chung, S.G. The relationships between low back pain and lumbar lordosis: A systematic review and meta-analysis. Spine J. 2017, 17, 1180–1191. [Google Scholar] [CrossRef]
  36. Segarra, V.; Heredia, J.R.; Peña, G.; Sampietro, M.; Moyano, M.; Mata, F.; Silva-Grigoletto, M.E.D. Core y sistema de control neuro-motor: Mecanismos básicos para la estabilidad del raquis lumbar. Rev. Bras. Educ. Fís. Esporte 2014, 28, 521–529. [Google Scholar] [CrossRef] [Green Version]
  37. Perera, R.S.; Chen, L.; Hart, D.J.; Spector, T.D.; Arden, N.K.; Ferreira, M.L.; Radojčić, M.R. Effects of body weight and fat mass on back pain–direct mechanical or indirect through inflammatory and metabolic parameters? In Seminars in Arthritis and Rheumatism; WB Saunders: Amsterdam, The Netherlands, 2022; Volume 52, p. 151935. [Google Scholar]
  38. Ávila-Ramírez, J.; Reyes-Rodríguez, V.A. La obesidad y el sobrepeso, su efecto sobre la columna lumbar. Rev. Mex. Neurocienc. 2009, 10, 220–223. [Google Scholar]
Figure 1. Vertebral curve quantification in the sagittal plane using an inclinometer. P1: Inclination of the cervical section, P2: Maximum kyphosis of the thoracic section, P3: Sacral inclination.
Applsci 12 07616 g001
Table 1. Descriptive characteristics of the total population and according to sex.
Total Population
(n = 301)
Men
(n = 122)
Women
(n = 179)
p Value
Age m(sd)47.0 (20.5)41.9 (20.7)50.5 (19.7)<0.001
Studies level m (%) 0.063
Low105 (34.9)35 (28.7)70 (39.1)
High196 (65.1)87 (71.3)109 (60.9)
METs m (sd)2647.7 (2402.1)3449.2 (3073.7)2101.5 (1600.6)<0.001
BMI (kg/m2) m (sd)25.6 (4.2)25.6 (3.7)25.6 (4.5)0.986
n (%)Normal148 (49.2)56 (45.9)90 (50.3)0.586
Overweight106 (35.2)47 (39.3)60 (33.5)
Obesity47 (15.6)18 (14.8)29 (16.2)
BF% m (sd)30.4 (9.2)22.9 (7.5)35.6 (6.4)<0.001
n (%)Normal93 (30.9)49 (40.2)44 (24.6)<0.001
Limit38 (12.6)22 (18.0)16 (8.9)
Obesity170 (56.5)51 (41.8)119 (66.5)
WC (cm) m (sd)84.4 (12.3)88.7 (11.9)81.4 (11.8)<0.001
n (%)Normal231 (76.7)102 (83.6)129 (72.1)0.020
Abdominal obesity70 (23.3)20 (16.4)50 (27.9)
WHR (cm) m (sd)0.86 (0.10)0.92 (0.09)0.82 (0.09)<0.001
n (%)Normal204 (67.8)96 (78.7)108 (60.3)0.001
Risk value97 (32.2)26 (21.3)71 (39.7)
W/HT (cm) m (sd)0.51 (0.08)0.51 (0.07)0.51 (0.08)0.995
n (%)Normal144 (47.8)60 (49.2)84 (46.9)0.701
Risk value157 (52.2)62 (50.8)95 (53.1)
Cervical curvature (rad) m (sd)37.2 (8.9)37.1 (9.0)37,2 (8.9)0.964
Dorsal curvature (rad) m (sd)51.9 (11.4)50.5 (11.2)53.0 (11.6)0.066
Lumbar curvature (rad) m (sd)36.4 (11.9)33.3 (12.0)38.5 (11.5)<0.001
Neck pain n (%)
No129 (42.9)68 (55.7)61 (34.1)<0.001
Yes172 (57.1)54 (44.3)118 (65.9)
Dorsal pain n (%)
No200 (66.4)89 (73.0)111 (62.0)0.048
Yes101 (33.6)33 (27.0)68 (38.0)
Low back pain n (%)
No102 (33.9)50 (41.0)52 (29.1)0.032
Yes199 (66.1)72 (59.0)128 (70.9)
Table 2. Linear regression models for the evaluation of the effect of body composition variables on the degrees of the cervical, dorsal, and lumbar vertebral angles.
Cervical Curvature
β (95% CI)
Dorsal Curvature
β (95% CI)
Lumbar Curvature
β (95% CI)
BMI (kg/m2)0.376 (0.136–0.617) **0.599 (0.274–0.924) ***0.336 (0.003–0.670) *
BF%0.260 (0.072–0.448) **0.459 (0.206–0.712) ***0.175 (−0.086–0.435)
WC (cm)0.187 (0.100–0.274) ***0.264 (0.146–0.382) ***0.143 (0.021–0.265) *
WHR17.192 (6.058–28.325) **21.525 (6.354–36.697) **3.324 (−12.228–18.877)
W/HT0.298 (0.151–0.446) ***0.447 (0.247–0.646) ***0.215 (0.008–0.422) *
All models were adjusted for sex, age, educational level, and physical activity measured in METs. * p < 0.05, ** p < 0.01, *** p < 0.001.
Table 3. Logistic regression models for the evaluation of predictive variables of cervical, dorsal, and lumbar pain.
Neck Pain
OR (95% CI)
Dorsal Pain
OR (95% CI)
Low Back Pain
OR (95% CI)
BMI (kg/m2) (ref: normal)
overweight0.659 (0.376–1.157)0.855 (0.4817–1.520)0.864 (0.483–1.546)
obesity0.544 (0.262–1.132)1.466 (0.710–3.026)1.507 (0.662–3.428)
BF% (ref: normal)
limit1.319 (0.552–3.150)1.434 (0.596–3.451)1.646 (0.683–3.966)
obesity0.889 (0.425–1.860)1.433 (0.675–3.042)1.761 (0.826–3.757)
WC (cm) (ref: normal)
abdominal obesity0.595 (0.326–1.085)1.139 (0.621–2.088)2.172 (1.067–4.419) *
WHR (ref: normal)
Risk0.932 (0.532–1.616)0.840 (0.481–1.467)0.995 (0.554–1.787)
W/HT (ref: normal)
Risk0.552 (0.307–0.993) *1.082 (0.670–1.747)0.923 (0.505–1.687)
Cervical curvature (rad)0.998 (0.968–1.028)1.004 (0.974–1.035)1.002 (0.971–1.034)
Dorsal curvature (rad)0.990 (0.969–1.012)1.009 (0.987–1.032)1.004 (0.981–1.028)
Lumbar curvature (rad)1.006 (0.985–1.028)0.997 (0.975–1.019)1.031 (1.007–1.055) *
All models were adjusted for sex, age, educational level, and physical activity measured in METs. * p < 0.05, ** p < 0.01, *** p < 0.001.
Publisher’s Note: MDPI stays neutral with regard to jurisdictional claims in published maps and institutional affiliations.

