Article

Skeletal Muscles of Patients Infected with SARS-CoV-2 Develop Severe Myofiber Damage upon One Week of Admission on the Intensive Care Unit

1
Rehabilitation Research Center, Faculty of Rehabilitation Sciences and Physiotherapy, Hasselt University, 3590 Diepenbeek, Belgium
2
Department of Human Biology, NUTRIM School of Nutrition and Translational Research in Metabolism, Faculty of Health, Medicine and Life Sciences, Maastricht University, 6229 ER Maastricht, The Netherlands
3
Department of Anaesthesiology, Jessa Hospital, 3500 Hasselt, Belgium
4
Biomedical Research Institute, Faculty of Medicine and Life Sciences, Hasselt University, 3590 Diepenbeek, Belgium
5
Department of Human Anatomy and Embryology, Faculty of Health, Medicine and Life Sciences, Maastricht University, 6229 ER Maastricht, The Netherlands
*
Authors to whom correspondence should be addressed.
These authors contributed equally to this work.
Appl. Sci. 2022, 12(14), 7310; https://doi.org/10.3390/app12147310
Submission received: 24 June 2022 / Revised: 14 July 2022 / Accepted: 19 July 2022 / Published: 20 July 2022
(This article belongs to the Special Issue Skeletal Biomechanics)

Abstract

:
Many critically ill patients infected with SARS-CoV-2 have been submitted to an intensive care unit (ICU). Patients with a SARS-CoV-2 infection that survive critical illness are confronted with months of physical impairments. To maximize recovery, it is important to understand the musculoskeletal involvement in critically ill patients infected with SARS-CoV-2. The aim of the present study was to assess the myocellular changes in SARS-CoV-2 patients that occur throughout the first week of ICU admission. In n = 22 critically ill patients infected with SARS-CoV-2, a biopsy sample from the vastus lateralis muscle was obtained at day 1–3 and day 5–8 following ICU admission. Fluorescence microscopy was used to assess type I and type II muscle fiber size and distribution, myonuclear content, and muscle tissue capillarization. Transmission electron microscopy was used to support quantitative data at an ultrastructural level. Changes in type I and type II muscle fiber size showed large inter-individual variation. The average change in type I fiber size was +309 ± 1834 µm2, ranging from −2129 µm2 (−31%) to +3375 µm2 (+73%). The average change in type II fiber size was −224 ± 1256 µm2, ranging from −1410 µm2 (−36%) to +2592 µm2 (+48%). Ultrastructural observations showed myofibrillar and hydropic degeneration, and fiber necrosis. This study shows that ICU patients admitted with SARS-CoV-2 suffer from substantial muscle fiber damage during ICU admission. These results are a call for action towards more specialized rehabilitation programs for patients admitted to the ICU with SARS-CoV-2 infection.

1. Introduction

The severe outbreak of a new coronavirus, in China and the rest of the world, has proven a huge health problem, with an enormous socioeconomic impact worldwide, and was declared a pandemic by the World Health Organization (WHO). This new virus was named Severe Acute Respiratory Syndrome Coronavirus 2 (SARS-CoV-2) [1]. The disease induced by SARS-CoV-2 was officially named COVID-19 by the WHO. SARS-CoV-2 mainly causes mild symptoms but can lead to severe acute respiratory distress syndrome (ARDS), hypoxemia, septic shock, and multiple organ dysfunction, which result in hospital and/or intensive care unit (ICU) admission [2,3]. Besides respiratory symptoms, patients with COVID-19 often exhibit musculoskeletal symptoms, including muscle aches, muscle fatigue, and weakness [4]. Patients hospitalized with severe SARS-CoV-2 infection are more likely to develop skeletal muscle injury with myalgia [5]. Survivors of moderate and severe SARS-CoV-2 infection have been shown to suffer from musculoskeletal dysfunction for more than 2–3 months after discharge from the hospital, which impedes rehabilitation and strongly reduces functional capacity and quality of life [6]. To date, the understanding of post-COVID-syndrome remains unclear, due to a lack of knowledge [7].
Critically ill patients commonly develop ICU-acquired weakness (ICUAW), which affects limb and respiratory muscles and adversely affects both short- and long-term clinical outcomes [6]. Critical illness myopathy (CIM) and critical illness polyneuropathy (CIP) are both considered ICUAW [8]. In SARS-CoV-2 infected patients, CIM can accelerate age-related muscle loss and results in poor prognosis and worsens the clinical outcome and rehabilitation capacity [9]. So far, there is no evidence that the muscle tissue of SARS-CoV-2 positive patients shares unique features, other than those previously reported in critically ill patients.
Like many different diseases, SARS-CoV-2 enters cells by binding to the angiotensin-converting enzyme 2 (ACE2) receptor. Skeletal muscle tissue expresses ACE2 on different cell types (e.g., satellite cells, fibroblasts, endothelial cells), which allows a possible pathway for viral destruction of skeletal muscle tissue [10,11,12]. However, until now, SARS-CoV-2 has not been identified in skeletal muscle tissue, suggesting that other pathways may be involved in COVID-19-related myopathy [13]. Infection with SARS-CoV-2 is known to increase circulating pro-inflammatory cytokine levels [14]. These elevated cytokine levels induce systemic inflammation, exacerbating the viral pathogenesis, and causing sepsis, ARDS, and multiple organ damage, including skeletal muscle loss [14,15].
Until now, there have been few data on the impact of SARS-CoV-2 infection on skeletal muscle tissue. The aim of this study was to explore muscle fiber characteristics throughout the first week of ICU admission in critically ill patients infected with SARS-CoV-2.

2. Materials and Methods

2.1. Patients and Study Design

After approval by the medical ethical committee of the University of Hasselt and of the Jessa Hospital, Hasselt, Belgium on 13 November 2020 and registration on clinicaltrials.gov (NCT04698798), twenty-two adult, consecutive patients, admitted to the ICU of the Jessa Hospital (Hasselt, Belgium) with a diagnosis of COVID-19 pneumonia between January and March 2021 were enrolled in this mono-center, investigator-initiated, longitudinal, prospective observational cohort study. According to the World Health Organization (WHO) protocol, laboratory confirmation of COVID-19 infection was defined as a positive result on polymerase chain reaction (PCR) assays of nasopharyngeal swab samples or on bronchoalveolar lavage. Patients were only included in the study after informed consent was obtained from the patient or their legal representative. Patients had to be 18 years of age or older and have an expected ICU stay of more than seven days to be included in the study.
Baseline measurements (T0) were taken as soon as possible after ICU admission, with an interval of 0 to a maximum 3 days after admission. The post measurements were collected 6–8 days after ICU admission. A time interval of 3 days for baseline measurement was used, to allow flexibility towards patient readiness, family approval, and staff availability. In the baseline clinical characteristics, demographic data of the patients and severity of disease were recorded. These data included acute physiology and chronic health evaluation II (APACHE II) score [16], sequential organ failure assessment (SOFA) score [17], and the presence of acute respiratory distress syndrome (ARDS) and sepsis. ARDS diagnosis was based on the Berlin Definition [18]. Sepsis was diagnosed according to the 2016 Third International Consensus Definition for Sepsis and Septic Shock. Multiple fine needle biopsies were taken from the right vastus lateralis during the pre-and post-measurements. After administering a local anesthetic, multiple biopsies were taken using a 14G semi-automated Bard® Mission® Core Biopsy, using the technique described by Agten et al. [19]. Samples for immunostaining were immediately frozen using isopentane cooled in liquid nitrogen. Samples for transmission electron microscopy (TEM) were fixed in glutaraldehyde 2%. All muscle samples were stored in a clinical biobank until further analyses. Standard medical care was not altered during the study period. This study was conducted in accordance with the principles of the Declaration of Helsinki and reported according to the STROBE statement.

2.2. Muscle Analyses

Immunofluorescent staining was performed using the protocol of Betz et al. [20]. Frozen muscle biopsies were cut into 5-μm thick cryosections using a cryostat at −20 °C and thaw mounted on uncoated pre-cleaned glass slides. Samples were stained with antibodies against CD31 (1:50, endothelial cell mouse IGg1 Dako M0823), myosin heavy chain I (clone A4.840 (slow isoform), 1:25; DSHB, Iowa City, IA, USA), and laminin (1:1000, Abcam ab11575, Abcam, Cambridge, MA, USA). For immunofluorescent detection, the secondary antibodies used were as follows: myosin heavy chain type I (cloneA4.840) (goat anti-mouse Alexa Fluor 488, 1:500, Invitrogen, Waltham, MA, USA); laminin (goat anti-rabbit Alexa Fluor 647, 1:500, Invitrogen); and CD31 (goat anti-rabbit Alexa Fluor 555, 1:500, Invitrogen, Molecular Probes, Carlsbad, CA, USA). Nuclei were labelled with DAPI (4′,6-diamidino-2-phenylindole) (1:20,000, Sigma-Aldrich, Oakville, ON, Canada) prior to cover slipping slides with fluorescent mounting media (DAKO, Burlington, ON, Canada). Slides were viewed and automatically captured using 10× objective on a modified Olympus BX51 fluorescence microscope with a customized spinning disk unit (DSU, Olympus), computer-controlled excitation and emission filter wheels (Olympus), 3-axis high-accuracy computer-controlled stepping motor specimen stage (Grid Encoded Stage, Ludl Electronic Products, Hawthorne, NY, USA), ultra-high sensitivity monochrome electron multiplier CCD camera (C9100-02, Hamamatsu Photonics, Hamamatsu City, Japan), and controlling software (StereoInvestigator; MBF BioScience, Williston, VT, USA). Quantitative images were analyzed using imageJ version 1.52a, National Institutes of Health, USA. All image recordings and analyses were performed by an investigator blinded to subject coding. Type I and type II muscle fiber distribution, size, central nuclei, myonuclear content, and domain size were analyzed using a mean of 319 ± 136 and 280 ± 135 fibers for pre-and post-analyses, respectively. For cross-sectional area (CSA) measurements, each myofiber was traced along its laminin-stained border. Fiber circularity was calculated as perimeter2/4πCSA [21]. The mean circularity was 0.66 ± 0.03 and 0.65 ± 0.04 for pre- and post-measurements. No differences in fiber circularity were observed over time. Quantification of capillary content per fiber type was based on the work of Hepple et al. [22]. Quantification comprised (i) capillary contacts (CC), (ii) the capillary-to-fiber ratio (C/Fi), (iii) capillary-to-fiber perimeter exchange (CFPE) index, and (iv) capillary density (CD). A mean of 63 ± 14 and 57 ± 15 muscle fibers were analyzed for pre- and post-measurements.
To analyze the ultrastructural characteristics of the skeletal muscle fibers, a muscle biopsy sample from each of the first 11 consecutive patients was dissected in 1-mm blocks and immediately fixed by immersion in a solution of 2% glutaraldehyde in 0.05 M sodium cacodylate buffer (pH 7.3) at 4 °C. Following fixation, samples were post-fixed with 2% osmium tetroxide in 0.05 M sodium cacodylate buffer (pH 7.3) for 1 h at room temperature and subsequently dehydrated through ascending concentrations of acetone. Dehydrated samples were impregnated overnight in a 1:1 mixture of acetone and araldite epoxy resin at room temperature, followed by impregnation in 100% Araldite epoxy resin at 40 °C for 3 h, and finally embedded in Araldite epoxy resin at 60 °C for 24 h. Semithin sections (0.5 µm) were cut on a Leica EM UC6 microtome and stained with a solution of thionin and methylene blue (0.1% aqueous solution) for light microscopic examination, to identify skeletal muscle fibers. Representative pictures of longitudinally and transversally cut myofibers were scanned with an Axioscan Z1 (Carl Zeiss Microscopy GmbH, Jena, Germany) and analyzed with Zen 3.3 (Blue edition) software (Carl Zeiss Microscopy GmbH, Jena, Germany). Ultrathin sections (70 nm) from selected tissue blocks were mounted on 0.7% Formvar-coated copper grids (Aurion, Wageningen, The Netherlands), contrasted with 0.5% uranyl acetate and a stabilized solution of 3% lead citrate using a Leica EM AC20 (Leica Microsystems, Diegem, Belgium), and examined in a transmission electron microscope EM 208 (Philips, Eindhoven, The Netherlands) operated at 80 kV. Representative digital images were obtained using a Morada Soft Imaging System camera with corresponding ITEM-FEI software (Olympus SIS, Münster, Germany).

2.3. Statistics

Continuous data are expressed as mean ± standard deviation and categorical data as frequencies and percentages. Data for muscle fiber characteristics were analyzed using a repeated measurements analysis of variance with time (pre vs. post) and fiber type (type I vs. II) as within-subject factors. When significant “time × type” interactions were found, a post hoc paired samples t-test was used to assess the effect of time in type I and type II muscle fibers separately. Spearman rank (ρ) correlation was used to assess the association between the change in muscle fiber size over time and white blood cell counts. Statistical significance was set at p < 0.05. All calculations were performed using SPSS Statistics (Version 25.0; IBM Corp., Armonk, NY, USA). Sample size calculation was performed on data obtained from previous studies on ICU patients.

3. Results

3.1. Patients’ Characteristics

Patient characteristics are displayed in Table 1. A first biopsy was obtained in 22 consecutive patients (69 ± 14 y, BMI 28 ± 5 kg/m2). The second biopsy was obtained in 18 patients. Three patients died during the study. Eighteen out of the 22 patients were male. ARDS was diagnosed in 20/22, and sepsis in 15/22 of the patients. All patients received oxygen therapy, of whom 8/22 needed invasive mechanical ventilation (IMV) during the trial. We were forced to implement a critical care triage system to allocate the scarce mechanical ventilators to patients most likely to benefit. Therefore, 7/22 patients received a do-not-intubate (DNI) code at admission to the ICU. One patient received extracorporeal membrane oxygenation (ECMO). Eighteen out of 22 patients had co-morbidities. The mean duration from disease onset until ICU admission was 7 ± 4 days. Four out of 22 patients developed their symptoms during hospital admission for a cause other than infection with SARS-CoV-2. The mean duration from ICU admission until study inclusion was 1.5 ± 1.0 day, the mean time between pre- and post-measurements was 7 ± 1 days. Three patients died during the study and did not have their final measurements at T1 (=drop-outs). Twelve patients died during ICU admission; however, these patients had their final measurements at T1 and completed the study. All patients received corticosteroids, analgesics, and anticoagulant treatment throughout their ICU stay; 21/22 patients received antibiotics, 13/22 patients received vasopressors, and 7/22 patients received neuromuscular blocking agents.

3.2. Immunofluorescent Analysis

Seventeen full datasets were used in the statistical analyses to assess immunofluorescence outcomes. Three patients died during the study and one patient refused the second biopsy. From one patient, the T0 muscle sample for immunofluorescence was of insufficient quality.

3.3. Muscle Fiber Type Composition and Size

At baseline, the average proportion of type I muscle fibers was 43 ± 13%, which remained unchanged over time (Table 2). For muscle fiber size there was a tendency (p = 0.059) for a time x fiber type interaction, but no main effect of time was observed (Figure 1A). Interestingly, however, individual data showed a large intra-individual variation in the change in muscle fiber size in response to the 7-day ICU admission. The average change in type I fiber size was +309 ± 1834 µm2, ranging from −2129 µm2 (−31%) to +3375 µm2 (+73%). The average change in type II fiber size was −224 ± 1256 µm2, ranging from −1410 µm2 (−36%) to +2592 µm2 (+48%). Individual data are displayed in Figure 1B.

3.4. Myonuclear Content

No significant time × fiber type interactions were found for central myonuclei or myonuclear content (Table 2). Myonuclear content remained unchanged in response to the 7 days of ICU admission (Table 2). The percentage of type I and type II muscle fibers holding a central myonuclei declined over time (main effect of time p = 0.043, Table 2).

3.5. Muscle Fiber Capillarization

No significant fiber type × time interaction was observed for any of the muscle fiber capillarization indices. Muscle fiber capillarization expressed as CC, C/Fi, and CFPE-index was significantly lower in type II compared with type I muscle fibers (for all main effect of fiber type, p < 0.05; See Table 2). In addition, muscle fiber capillarization expressed as CC, C/Fi, CFPE-index, or CD remained unchanged in response to the 7-day ICU admission in our COVID-19 patients (Table 2).

3.6. Histology

Muscle fiber atrophy and focal necrosis could be observed on hematoxylin and eosin staining in the majority (30% T0 vs. 71% T1) of the COVID-19 patients, both at admission and, more prominently, after 7 days of ICU stay (Figure 2A,B). Nearly all patients (80% T0 vs. 100% T1) showed perivascular fibrosis, without signs of inflammation (Figure 2C). No abnormal luminal obliterations nor micro-thrombi could be observed within the arterioles and venules. In some patients (30% T0), interstitial fibrosis could be observed, which seemed to progressively worsen (76% T1) over the 7-day period (Figure 2D).

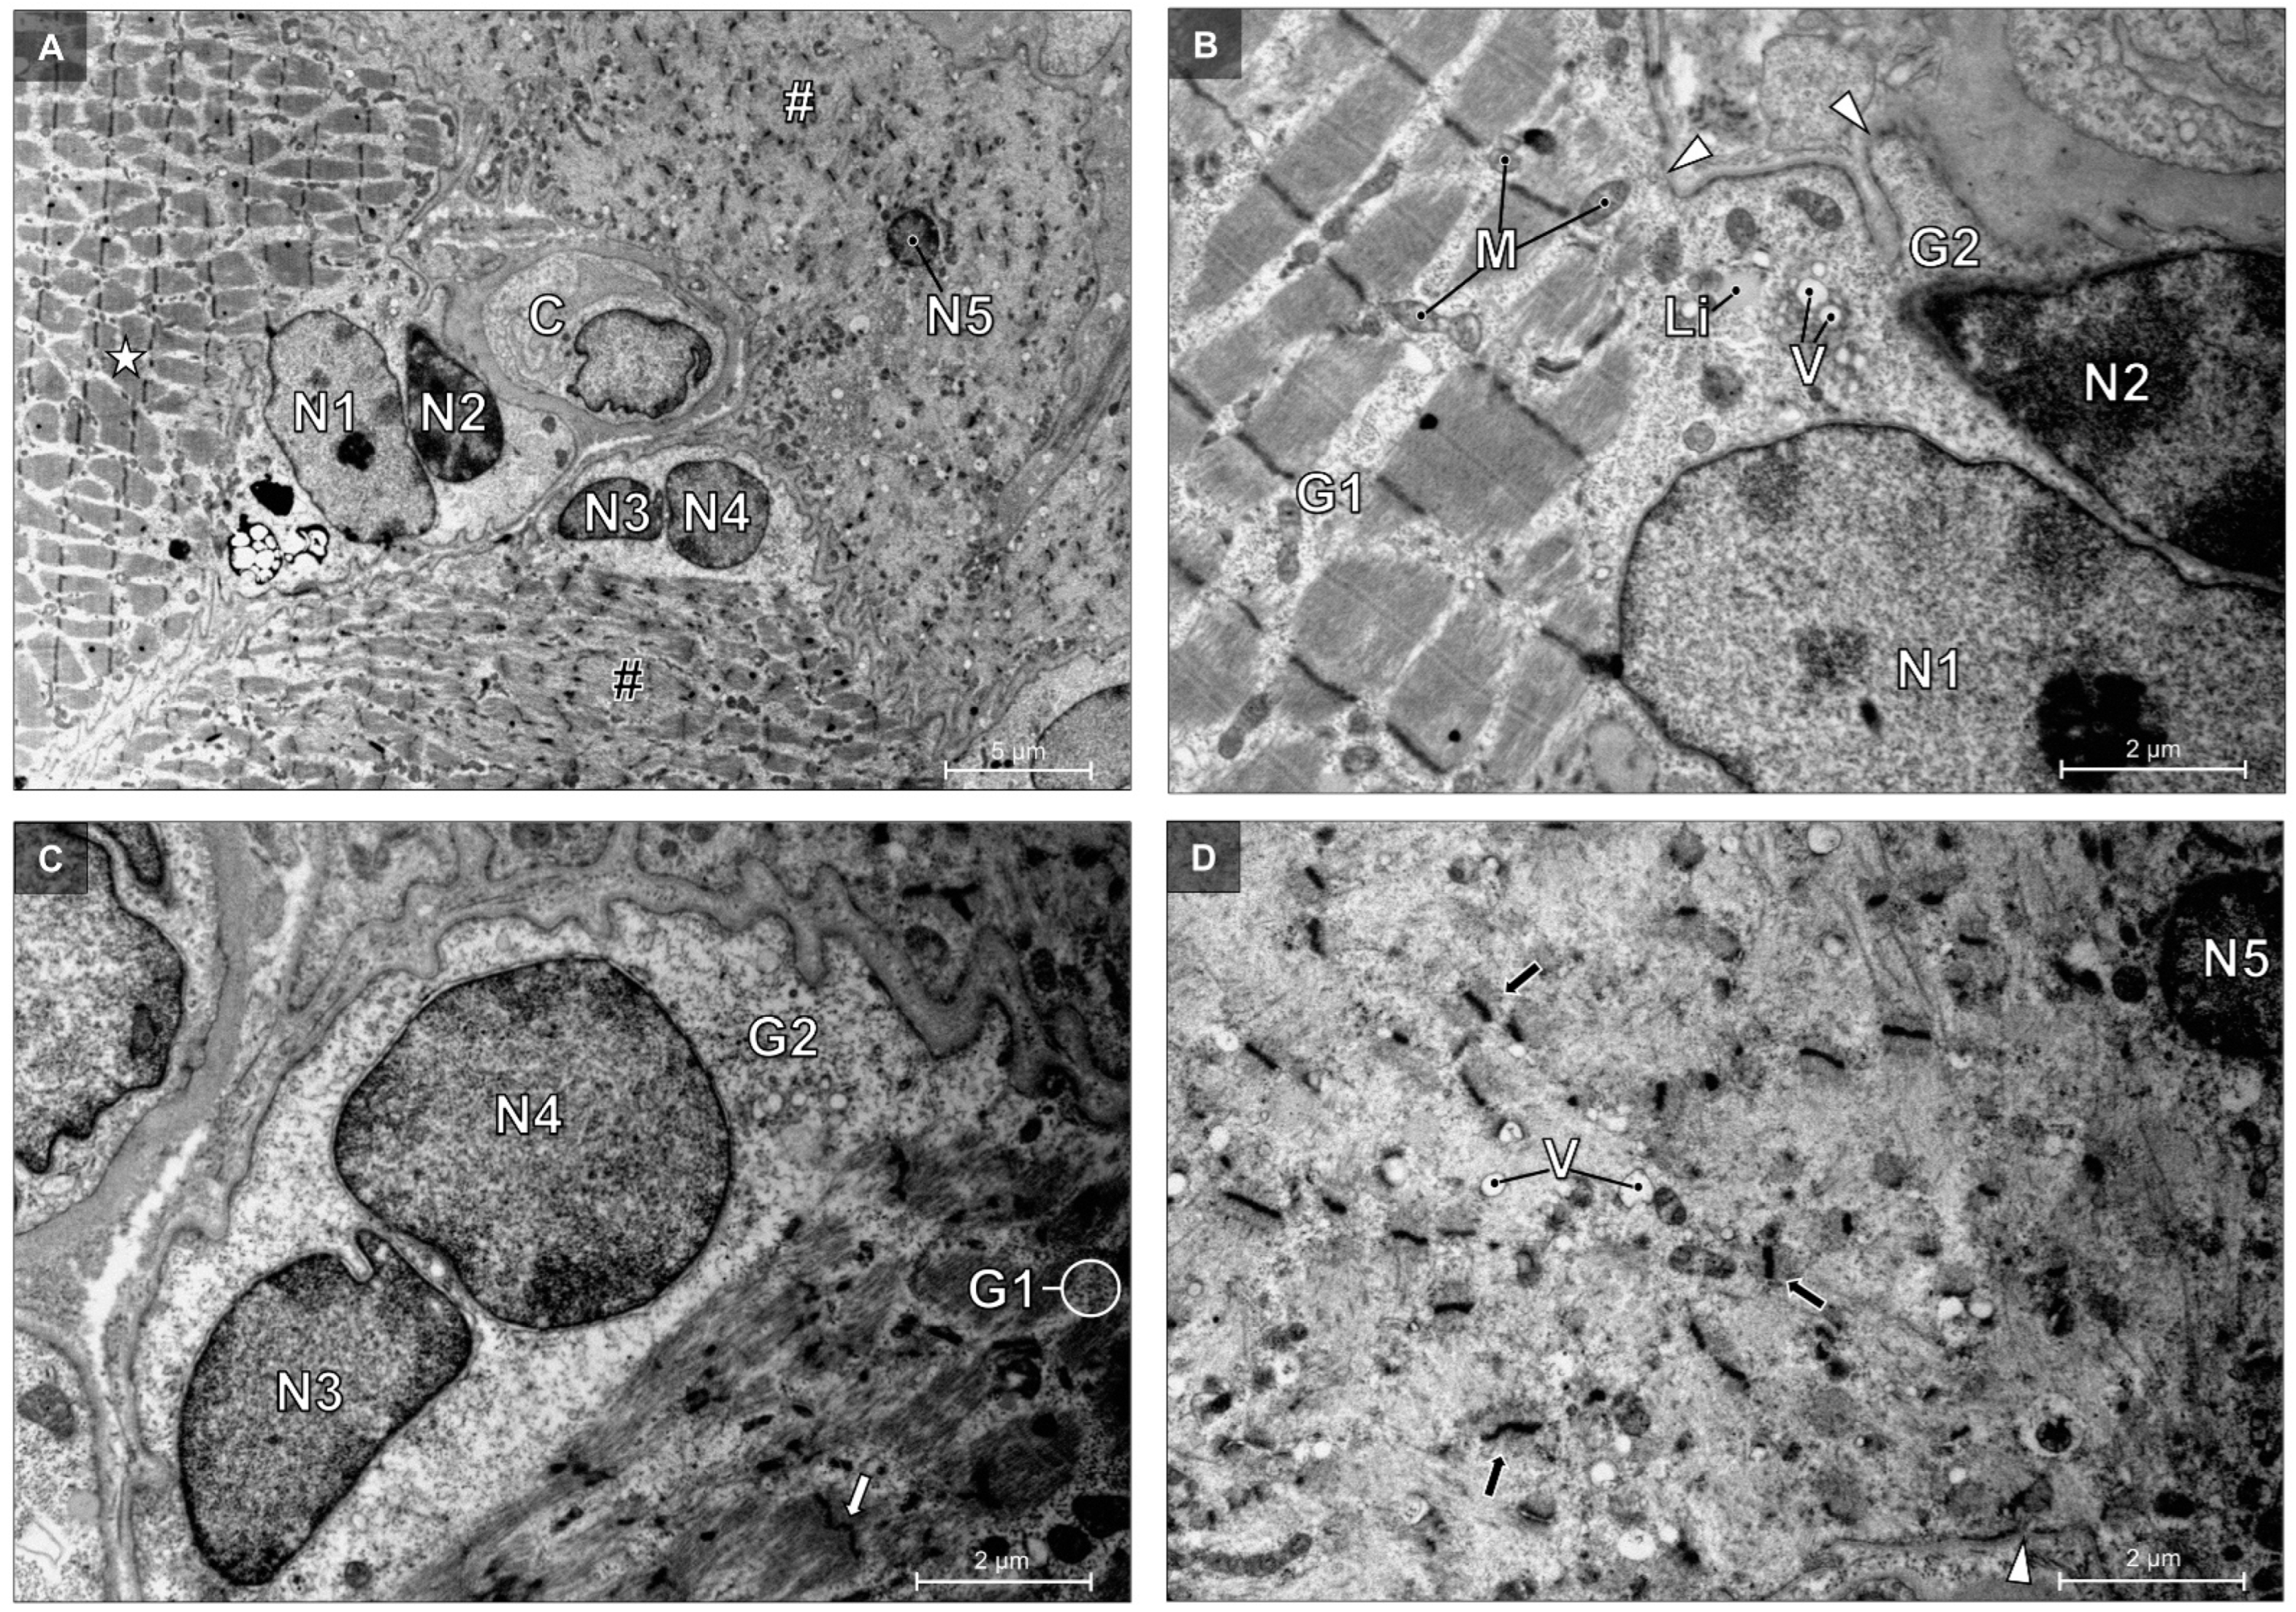
3.7. Transmission Electron Microscopy

Electron microscopy was performed in the first half of the patients (n = 11), to further refine the morphological analyses. Ultrastructural examination by TEM showed skeletal muscle damage, with marked focal pathological alterations affecting the myofibers, the surrounding endomysium, and the capillaries. No “virus-like particles” could be observed by TEM in the muscle samples investigated.
Muscle fibers showed typical pathological ultrastructural characteristics attributed to myofibrillar degeneration (Figure 3A–C), hydropic degeneration (Figure 3D–F), and necrosis (Figure 3G–I). These muscle fiber alterations were observed in all examined biopsy specimens, among healthy myofibers. These abnormalities were observed in muscle samples collected, both upon admission, as well as after 7 days of ICU stay. The alterations were present to variable degrees and severities and were visible in the entire myofiber or in parts of it. Ultrastructural characteristics of these abnormalities were often observed in the same muscle fiber. Figure 4 and Figure 5 show representative TEM images of the different degrees of these three abnormalities in neighboring muscle fibers. Ultrastructural signs of myofibrillar degeneration were most obvious at T0. Hydropic degeneration and severe necrosis were more pronounced at T1, and especially in “swollen” muscle fibers. Figure 6 shows representative images of two patients, one with ultrastructural characteristics of myofibrillar degeneration and decreased muscle fiber size on immunofluorescence (Figure 6A–C), and one patient showing hydropic degeneration at the ultrastructural level and an increase in muscle fiber size (Figure 6D–F). The ultrastructural alterations of degenerating myofibers (Figure 3A–C) varied, from narrowing and splitting of the myofibrils with preserved sarcomere structure and normal intermyofibrillar architecture, to more marked changes, including focal loss of myofibrils over one or more sarcomere lengths. The space vacated by the focal myofibrillar loss, contained large glycogen accumulations and numerous dark, elongated mitochondria that were mostly transversely oriented, in register with the Z line. In addition to myofilament loss, variable degrees of focal myofibrillar disorganization and disruption of sarcomeric myofilaments and Z-lines were observed. Myofibers altered by hydropic degeneration (Figure 3D–F) were characterized by vacuoles and membrane blebs. The mitochondria were swollen and vacuolated. Triads were displaced and showed swollen cisternae of the sarcoplasmic reticulum. The intermyofibrillar space, as well as the perinuclear space, contained large accumulations of glycogen. The nucleus was often located in a large membrane bleb and oriented towards a neighboring capillary. Necrotic fibers (Figure 3G–I) were characterized by segmental extensive loss of myofibrils, focal defects of plasma membrane, and irreversible nuclear changes, including condensation of chromatin (pyknosis) and fragmentation (karyorrhexis). Most necrotic cells were electron-dense. Their myofilament structure was lost completely and replaced by an amorphous granular material. The cytoplasm of these fibers usually showed numerous vacuolized mitochondria, autophagic vacuoles, and lysosomes. Some of these necrotic cells were characterized by hypercontraction of myofibrils. Other, less common, necrotic fibers, were electron-lucent and showed extensive myosin loss with preserved and misoriented Z-line material and related actin filaments. Sometimes, extrusion of the nucleus was observed.
In addition to the pathological alterations affecting the myofibers, the capillaries showed various degrees of damage (Figure 7). Active macrophages were found in the immediate vicinity of the capillaries and often in intimate contact with degenerative myofibers. There was no evidence of fibrin deposits within capillaries on TEM.

4. Discussion

In this study, skeletal muscle fiber characteristics were investigated at a cellular and subcellular level throughout the first week of ICU admission in critically ill patients infected with SARS-CoV-2. We observed a large variation in muscle fiber size changes, with some patients showing a substantial increase, as opposed to a decline, in muscle fiber size following one week of ICU stay. Ultrastructural muscle tissue analyses showed evidence of myofibrillar degeneration at T0 and hydropic degeneration and necrosis at T1. This shows that the skeletal muscles of critically ill patients infected with SARS-CoV-2 are degenerative, which could indicate the presence of CIM. CIM in patients with sepsis (diagnosed in 15/22 of the patients) and/or systemic inflammatory response syndrome (SIRS) is often called sepsis induced myopathy (SIM). This myopathy is characterized by atrophy, fibrosis, scattered myofiber necrosis, vacuolization, and phagocytosis, with focal myosin loss [23], which is in accordance with our observations.
Muscle samples of critically ill patients infected with SARS-CoV-2 showed no significant changes in type I and type II muscle fiber size, due to large interindividual variation (Figure 1B). In the present study patients had already been suffering from SARS-CoV-2 infection prior to the need for ICU admission (on average 7 days after the start of symptoms). Therefore, we assume that some level of atrophy had already occurred prior to ICU admission. Interestingly, we observed large increases in muscle fiber size during the 7-day ICU admission in a subset of the patients. As myocyte swelling has been suggested to be part of a degenerative cascade, this may explain the lack of an overall decline in muscle fiber size within our patient sample. Myocyte swelling may be induced by several mechanisms [24]. Ultrastructural observations of patients who displayed a large increase in muscle fiber size showed signs of hydropic degeneration. If not halted, hydropic degeneration will result in lysis and cell death [24]. In the present study 13 out of 17 patients had one or more comorbidities when admitted to the ICU (see Table 1). It is interesting to observe that the post hoc analysis between the group of SARS-CoV-2 infected patients with (n = 13) and without (n = 4) comorbidities showed significant differences in the level of muscle fiber atrophy. Whereas, on average, the patients with comorbidities showed no significant changes in fiber size, patients without comorbidities revealed a significant decline in both type I (−14%) and type II (−26%) muscle fiber size following 7 days of ICU admission (see Table A1 in Appendix A). Although observed in a small subpopulation, the increase in muscle fiber size due to swelling may be prevalent in many ICU patients. Whether this is specific for ICU patients with a SARS-CoV-2 infection remains to be assessed.
To further elucidate the effects of critical illness due to SARS-CoV-2 on skeletal muscle fiber characteristics, ultrastructural analyses were performed. Degenerative muscle damage observed by TEM was consistent, but variable in degree and severity at the different time points. Ultrastructural features were diffuse or focal, confined to individual muscle fibers or sarcomeric units. The sarcomeric myofilament loss and disorganization, is suggestive of myofibrillar degeneration and in line with the well-established ultrastructural criteria described in the literature [25,26,27]. Myofibrillar degeneration is a typical hallmark of skeletal muscle fiber atrophy [28] and myofibrillar myopathy [29,30]. These results are in line with previous studies on CIM, who also reported ultrastructural evidence of myosin loss and myofibrillar disorganization [31,32,33]. A subset of myofibers showed ultrastructural signs of intracellular edema compatible with hydropic degeneration [34]. Hydropic degeneration is referred to as a reversible cell injury process, indicative of relatively mild cell injury, but it can also be a phase of swelling prior to myonecrosis [34].
Major muscle alterations could be observed within the necrotic segments of muscle fibers, showing typical ultrastructural pathological changes in sarcomeric myofilaments and cellular organelles, resulting in irreversible myofiber lysis. The nuclear and cytoplasmic condensation, nuclear fragmentation, sarcolemmal defects, myofibrillar loss and hypercontraction, and cell organelle destruction and autophagy are typical hallmarks of myofiber necrosis and necrotizing myopathy [26,27]. Interestingly, whereas some studies reported [32,33] ultrastructural evidence of necrosis in patients with CIM, others did not [31]. Infection with SARS-CoV-2 is known to induce a cytokine storm, which leads to SIRS, sepsis, and ARDS, possibly aggravating muscle tissue damage.
Although the muscle fiber capillarization remained unchanged in response to 7 days of ICU admission, TEM analyses of the muscle sections revealed ultrastructural capillary damage, similarly to the previously described alterations in skeletal muscle capillaries [15,35,36] of COVID-19 patients. The advanced stage of COVID-19 is often complicated by sepsis and ARDS, indicating an overactive immune response as being responsible for endothelial damage [37,38]. Our ultrastructural findings, showing a combination of scattered necrosis and intra- and extracellular edema and endothelial damage, are in agreement with Hauptmann et al. [39], supporting the role of sepsis in SARS-CoV-2 infection. However, one should keep in mind that in contrast to myocytes, endothelial cells exhibit ACE-2 receptors, by which the virus is able to directly affect endothelial cells [10,11,12]. However, we were not able to provide conclusive morphological evidence of SARS-CoV-2 viral particles in the damaged muscle tissue.

Perspectives, Significance, and Limitations

In this study we clearly demonstrated skeletal muscle involvement in critically ill patients who were infected with SARS-CoV-2. Since many of the manifestations and outcomes of severe SARS-CoV-2 infection seem similar to the sepsis caused by other pathogens, many COVID-19 survivors can expect similar long-lasting morbidity [40]. As we did not include a control group of ICU patients without SARS-CoV-2 infection, we were unable to assess the impact of the SARS-CoV-2 infection per se on skeletal muscle fiber characteristics. The causality between SARS-CoV-2 infection and the observed skeletal muscle abnormalities during ICU admission remain to be determined. Based on our current findings, the musculoskeletal consequences from critical illness with SARS-CoV-2 infection seem to be severe and are probably long-lasting, since patients are left with severely damaged myofibers, combined with mitochondrial and capillary damage. Recent literature showed that 64% of COVID-19 patients suffer from long-term consequences of SARS-CoV-2 infection. The most common symptoms are muscle related, such as chronic muscle fatigue and weakness [41]. The severe muscle fiber degeneration and necrosis observed in this study can be a possible cause of long-term muscular consequences and impaired rehabilitation after a SARS-CoV-2 infection. Whether patients with a SARS-CoV-2 infection who were not admitted to an ICU show similar skeletal muscle fiber features remains to be determined. If similar alterations were observed, this could potentially explain the difficult recovery, even after a mild SARS-CoV-2 infection [42]. Although many factors, such as comorbidities, medication use, bedrest, and others, likely have a profound impact on the morphological changes observed, the present study indicates that all these changes occur in COVID-19 patients admitted to the ICU. This study is an important step in identifying the skeletal muscle morphological alterations during ICU admission and will be of importance to improve the existing, or develop new, nutrition, exercise, and/or pharmacological interventions to support ICU patient rehabilitation following discharge. Despite the limited data specific to the recovery after COVID-19, additional studies are warranted to specify the specific exercise modality, intensity, and frequency required to optimize skeletal muscle mass and functional recovery in patients with a SARS-CoV-2 infection.

5. Conclusions

The present study shows severe myofiber damage in critically ill patients infected with SARS-CoV-2 upon admission to ICU. This muscle fiber damage will likely compromise clinical outcomes and impact the subsequent recovery. Our results are a call for action towards more research, regarding the development of more specialized rehabilitation programs for critically ill patients with a SARS-CoV-2 infection.

Author Contributions

S.S.: conceptualization, data curation, formal analysis, investigations, methodology, project administration, writing original draft; P.H.: data curation, investigations, project administration, writing—review and editing; T.S.: conceptualization, data curation, formal analysis, investigations, methodology, writing—review and editing; I.L. conceptualization, formal analysis, investigations, writing—review and editing; B.S.: conceptualization, data curation, formal analysis, investigations, writing—review and editing; J.D.: data curation, formal analysis, investigations, writing—review and editing; L.J.C.v.L. conceptualization, data curation, formal analysis, investigations, writing—review and editing, supervision; F.V. conceptualization, data curation, formal analysis, investigations, methodology, writing—review and editing, supervision; A.A.: conceptualization, data curation, formal analysis, investigations, methodology, project administration, writing original draft, writing—review and editing, supervision. All authors have read and agreed to the published version of the manuscript.

Funding

This research received no external funding.

Institutional Review Board Statement

This study was conducted using the ethical standards laid down in the Declaration of Helsinki and was approved by the medical ethical committee of the University of Hasselt and of the Jessa Hospital, Hasselt, Belgium on 13 November 2020 and registration on clinicaltrials.gov (NCT04698798). Informed consent from the patient or legal representative was always obtained before study inclusion.

Informed Consent Statement

Informed consent was obtained from all subjects involved in the study.

Data Availability Statement

The data presented in this study are available on request from the corresponding author.

Acknowledgments

We would like to thank all patients who suffered from a severe SARS-CoV-2 infection, requiring ICU admission, and their families, for their contributions to our knowledge on COVID-19. We would like express our thanks to the staff of the intensive care unit (ICU) of the Jessa Hospital Hasselt. We would like to express our gratitude to Erika Wisanto (pathologist, Jessa Hospital), Marc Jans (lab technician, Hasselt University), and Janneau van Kranenburg (lab technician, Maastricht University).

Conflicts of Interest

The authors declare no conflict of interest.

Appendix A

Table A1. Type I and Type II Muscle Fiber Characteristic at Day 0 (T0) and Day 7 (T1) of Intensive Care Unit Admission in SARS-CoV19 Patients with and without Comorbidities.
Patients with
Comorbidities (n = 13)
Patients without
Comorbidities (n = 4)
TypeT0T1T0T1
Muscle fiber size (µm2)I5176 ± 12355834 ± 21426048 ± 7955221 ± 679
II4212 ± 13014297 ± 1524 *4729 ± 9633499 ± 1275 †
Fiber type distribution (%)I43 ± 1446 ± 1544 ± 1151 ± 18
II57 ± 1454 ± 1556 ± 1149 ± 18
Myonuclear content (number/fiber)I4.50 ± 0.955.12 ± 1.444.07 ± 0.864.45 ± 0.93
II4.25 ± 0.944.59 ± 1.453.76 ± 0.573.66 ± 0.23
Myonuclear domain (µm2)I1165 ± 2321132 ± 2381514 ± 1841193 ± 160
II987 ± 161941 ± 179 *1257 ±152961 ± 356
Proportion of fibers containing central nuclei (%)I5.0 ± 3.06.0 ± 4.210.5 ± 8.05.4 ± 5.9
II6.3 ± 5.13.6 ± 3.4 †5.0 ± 3.63.7 ± 2.4
CCI3.30 ± 0.503.42 ± 0.613.34 ± 0.702.80 ± 0.71
II2.80 ± 0.302.88 ± 0.64 *3.02 ± 0.701.94 ± 0.47
C/FiI1.14 ± 0.261.13 ± 0.421.20 ± 0.421.28 ± 0.51
II0.84 ± 0.250.76 ± 0.27 *0.84 ± 0.440.75 ± 0.29 *
CFPE index (capillaries·1000 µm−1)I5.35 ± 0.925.09 ± 0.774.77 ± 0.844.44 ± 0.76
II4.26 ± 0.643.92 ± 0.76 *3.76 ± 1.173.13 ± 0.81 *
CD (capillaries per mm2)I355 ± 100315 ± 106276 ± 59273 ± 281
II342 ± 102327 ± 123288 ± 118280 ± 81
Data are expressed as mean ± SD. I: type I muscle fiber; II: type II muscle fiber. CC: capillary contacts: C/Fi: capillary to fiber ratio. CFPE index: capillary to fiber perimeter exchange index. CD: capillary density. * significantly different compared with type I muscle fibers (p < 0.05). † significantly different compared with T0 (p < 0.05).

References

  1. Zhou, P.; Yang, X.L.; Wang, X.G.; Hu, B.; Zhang, L.; Zhang, W.; Si, H.R.; Zhu, Y.; Li, B.; Huang, C.L.; et al. A pneumonia outbreak associated with a new coronavirus of probable bat origin. Nature 2020, 579, 270–273. [Google Scholar] [CrossRef] [PubMed] [Green Version]
  2. Busetto, G.M.; Porreca, A.; Del Giudice, F.; Maggi, M.; D’Agostino, D.; Romagnoli, D.; Musi, G.; Lucarelli, G.; Palmer, K.; Colonna di Paliano, A.; et al. SARS-CoV-2 Infection and High-Risk Non-Muscle-Invasive Bladder Cancer: Are There Any Common Features? Urol. Int. 2020, 104, 510–522. [Google Scholar] [CrossRef]
  3. Zhang, H.; Zhou, J.; Chen, R.; Ren, Y.; Cai, J.; Zhao, L.; Fei, X.; Liu, Z.; Zhang, Y.; Yuan, L.; et al. Autopsy and Histologic Findings of Patients with New Coronavirus Pneumonia: The Pathologic Associations with Hypoxemia. Med. Sci. Monit. 2021, 27, e928837. [Google Scholar] [CrossRef] [PubMed]
  4. Baj, J.; Karakuła-Juchnowicz, H.; Teresiński, G.; Buszewicz, G.; Ciesielka, M.; Sitarz, E.; Forma, A.; Karakuła, K.; Flieger, W.; Portincasa, P.; et al. COVID-19: Specific and Non-Specific Clinical Manifestations and Symptoms: The Current State of Knowledge. J. Clin. Med. 2020, 9, 1753. [Google Scholar] [CrossRef] [PubMed]
  5. Mao, L.; Jin, H.; Wang, M.; Hu, Y.; Chen, S.; He, Q.; Chang, J.; Hong, C.; Zhou, Y.; Wang, D.; et al. Neurologic Manifestations of Hospitalized Patients With Coronavirus Disease 2019 in Wuhan, China. JAMA Neurol. 2020, 77, 683–690. [Google Scholar] [CrossRef] [PubMed] [Green Version]
  6. Ali, A.M.; Kunugi, H. Skeletal Muscle Damage in COVID-19: A Call for Action. Medicina 2021, 57, 372. [Google Scholar] [CrossRef] [PubMed]
  7. Scaturro, D.; Vitagliani, F.; Di Bella, V.E.; Falco, V.; Tomasello, S.; Lauricella, L.; Letizia Mauro, G. The Role of Acetyl-Carnitine and Rehabilitation in the Management of Patients with Post-COVID Syndrome: Case-Control Study. Appl. Sci. 2022, 12, 4084. [Google Scholar] [CrossRef]
  8. De Carvalho, M. Intensive Care Unit-Acquired Weakness: Introductory Notes. J. Clin. Neurophysiol. 2020, 37, 195–196. [Google Scholar] [CrossRef]
  9. Wang, P.Y.; Li, Y.; Wang, Q. Sarcopenia: An underlying treatment target during the COVID-19 pandemic. Nutrition 2021, 84, 111104. [Google Scholar] [CrossRef]
  10. Motta-Santos, D.; Dos Santos, R.A.; Oliveira, M.; Qadri, F.; Poglitsch, M.; Mosienko, V.; Kappes Becker, L.; Campagnole-Santos, M.J.; Penninger, J.M.; Alenina, N.; et al. Effects of ACE2 deficiency on physical performance and physiological adaptations of cardiac and skeletal muscle to exercise. Hypertens. Res. 2016, 39, 506–512. [Google Scholar] [CrossRef]
  11. Hoffmann, M.; Kleine-Weber, H.; Schroeder, S.; Krüger, N.; Herrler, T.; Erichsen, S.; Schiergens, T.S.; Herrler, G.; Wu, N.H.; Nitsche, A.; et al. SARS-CoV-2 Cell Entry Depends on ACE2 and TMPRSS2 and Is Blocked by a Clinically Proven Protease Inhibitor. Cell 2020, 181, 271–280.e278. [Google Scholar] [CrossRef]
  12. Riquelme, C.; Acuña, M.J.; Torrejón, J.; Rebolledo, D.; Cabrera, D.; Santos, R.A.; Brandan, E. ACE2 is augmented in dystrophic skeletal muscle and plays a role in decreasing associated fibrosis. PLoS ONE 2014, 9, e93449. [Google Scholar] [CrossRef] [PubMed] [Green Version]
  13. Disser, N.P.; De Micheli, A.J.; Schonk, M.M.; Konnaris, M.A.; Piacentini, A.N.; Edon, D.L.; Toresdahl, B.G.; Rodeo, S.A.; Casey, E.K.; Mendias, C.L. Musculoskeletal Consequences of COVID-19. J. Bone Jt. Surg. Am. 2020, 102, 1197–1204. [Google Scholar] [CrossRef]
  14. Ferrandi, P.J.; Alway, S.E.; Mohamed, J.S. The interaction between SARS-CoV-2 and ACE2 may have consequences for skeletal muscle viral susceptibility and myopathies. J. Appl. Physiol. 2020, 129, 864–867. [Google Scholar] [CrossRef] [PubMed]
  15. Aschman, T.; Schneider, J.; Greuel, S.; Meinhardt, J.; Streit, S.; Goebel, H.H.; Büttnerova, I.; Elezkurtaj, S.; Scheibe, F.; Radke, J.; et al. Association Between SARS-CoV-2 Infection and Immune-Mediated Myopathy in Patients Who Have Died. JAMA Neurol. 2021, 78, 948–960. [Google Scholar] [CrossRef]
  16. Knaus, W.A.; Draper, E.A.; Wagner, D.P.; Zimmerman, J.E. APACHE II: A severity of disease classification system. Crit. Care Med. 1985, 13, 818–829. [Google Scholar] [CrossRef]
  17. Vincent, J.L.; Moreno, R.; Takala, J.; Willatts, S.; De Mendonça, A.; Bruining, H.; Reinhart, C.K.; Suter, P.M.; Thijs, L.G. The SOFA (Sepsis-related Organ Failure Assessment) score to describe organ dysfunction/failure. On behalf of the Working Group on Sepsis-Related Problems of the European Society of Intensive Care Medicine. Intensive Care Med. 1996, 22, 707–710. [Google Scholar] [CrossRef]
  18. Ranieri, V.M.; Rubenfeld, G.D.; Thompson, B.T.; Ferguson, N.D.; Caldwell, E.; Fan, E.; Camporota, L.; Slutsky, A.S. Acute respiratory distress syndrome: The Berlin Definition. JAMA 2012, 307, 2526–2533. [Google Scholar] [CrossRef]
  19. Agten, A.; Verbrugghe, J.; Stevens, S.; Boomgaert, L.; Eijnde, O.B.; Timmermans, A.; Vandenabeele, F. Feasibility, accuracy and safety of a percutaneous fine-needle biopsy technique to obtain qualitative muscle samples of the lumbar multifidus and erector spinae muscle in persons with low back pain. J. Anat. 2018, 233, 542–551. [Google Scholar] [CrossRef] [PubMed]
  20. Betz, M.W.; Aussieker, T.; Kruger, C.Q.; Gorissen, S.H.M.; van Loon, L.J.C.; Snijders, T. Muscle fiber capillarization is associated with various indices of skeletal muscle mass in healthy, older men. Exp. Gerontol. 2021, 143, 111161. [Google Scholar] [CrossRef]
  21. Kosek, D.J.; Kim, J.S.; Petrella, J.K.; Cross, J.M.; Bamman, M.M. Efficacy of 3 days/wk resistance training on myofiber hypertrophy and myogenic mechanisms in young vs. older adults. J. Appl. Physiol. 2006, 101, 531–544. [Google Scholar] [CrossRef]
  22. Hepple, R.T. A new measurement of tissue capillarity: The capillary-to-fibre perimeter exchange index. Can. J. Appl. Physiol. 1997, 22, 11–22. [Google Scholar] [CrossRef] [PubMed]
  23. Friedrich, O.; Reid, M.B.; Van den Berghe, G.; Vanhorebeek, I.; Hermans, G.; Rich, M.M.; Larsson, L. The Sick and the Weak: Neuropathies/Myopathies in the Critically Ill. Physiol. Rev. 2015, 95, 1025–1109. [Google Scholar] [CrossRef] [Green Version]
  24. Stanley, M.; Chippa, V.; Aeddula, N.R.; Quintanilla Rodriguez, B.S.; Adigun, R. Rhabdomyolysis; StatPearls Publishing: Treasure Island, FL, USA, 2022. [Google Scholar]
  25. Heffner, R.R., Jr. Electron microscopy of disorders of skeletal muscle. Ann. Clin. Lab. Sci. 1975, 5, 338–347. [Google Scholar]
  26. Lauritzen, F.; Paulsen, G.; Raastad, T.; Bergersen, L.H.; Owe, S.G. Gross ultrastructural changes and necrotic fiber segments in elbow flexor muscles after maximal voluntary eccentric action in humans. J. Appl. Physiol. 2009, 107, 1923–1934. [Google Scholar] [CrossRef] [PubMed]
  27. Park, H.J.; Lee, J.E.; Choi, G.S.; Koo, H.; Han, S.J.; Yoo, J.H.; Choi, Y.C.; Park, K.D. Electron Microscopy Pathology of ADSSL1 Myopathy. J. Clin. Neurol. 2017, 13, 105–106. [Google Scholar] [CrossRef] [Green Version]
  28. Ghadially, F.N. Ultrastructural Pathology of the Cell. A text and Atlas of Physiological and Pathological Alterations in Cell Fine Structure. Med. J. Aust. 1976, 2, 28. [Google Scholar]
  29. Fernandez, C.; Figarella-Branger, D.; Meyronet, D.; Cassote, E.; Tong, S.; Pellissier, J.F. Electron microscopy in neuromuscular disorders. Ultrastruct. Pathol. 2005, 29, 437–450. [Google Scholar] [CrossRef]
  30. Selcen, D.; Ohno, K.; Engel, A.G. Myofibrillar myopathy: Clinical, morphological and genetic studies in 63 patients. Brain 2004, 127, 439–451. [Google Scholar] [CrossRef] [PubMed]
  31. Helliwell, T.R.; Wilkinson, A.; Griffiths, R.D.; McClelland, P.; Palmer, T.E.; Bone, J.M. Muscle fibre atrophy in critically ill patients is associated with the loss of myosin filaments and the presence of lysosomal enzymes and ubiquitin. Neuropathol. Appl. Neurobiol. 1998, 24, 507–517. [Google Scholar] [CrossRef]
  32. Stibler, H.; Edström, L.; Ahlbeck, K.; Remahl, S.; Ansved, T. Electrophoretic determination of the myosin/actin ratio in the diagnosis of critical illness myopathy. Intensive Care Med. 2003, 29, 1515–1527. [Google Scholar] [CrossRef]
  33. Wollersheim, T.; Woehlecke, J.; Krebs, M.; Hamati, J.; Lodka, D.; Luther-Schroeder, A.; Langhans, C.; Haas, K.; Radtke, T.; Kleber, C.; et al. Dynamics of myosin degradation in intensive care unit-acquired weakness during severe critical illness. Intensive Care Med. 2014, 40, 528–538. [Google Scholar] [CrossRef]
  34. Miller, M.A.; Zachary, J.F. Mechanisms and Morphology of Cellular Injury, Adaptation, and Death. Pathol. Basis Vet. Dis. 2017, 2, 43.e19. [Google Scholar]
  35. Hooper, J.E.; Uner, M.; Priemer, D.S.; Rosenberg, A.; Chen, L. Muscle Biopsy Findings in a Case of SARS-CoV-2-Associated Muscle Injury. J. Neuropathol. Exp. Neurol. 2021, 80, 377–378. [Google Scholar] [CrossRef]
  36. Mageriu, V.; Zurac, S.; Bastian, A.; Staniceanu, F.; Manole, E. Histological findings in skeletal muscle of SARS-CoV2 infected patient. J Immunoass. Immunochem. 2020, 41, 1000–1009. [Google Scholar] [CrossRef] [PubMed]
  37. Perico, L.; Benigni, A.; Casiraghi, F.; Ng, L.F.P.; Renia, L.; Remuzzi, G. Immunity, endothelial injury and complement-induced coagulopathy in COVID-19. Nat. Rev. Nephrol. 2021, 17, 46–64. [Google Scholar] [CrossRef]
  38. Amraei, R.; Rahimi, N. COVID-19, Renin-Angiotensin System and Endothelial Dysfunction. Cells 2020, 9, 1652. [Google Scholar] [CrossRef]
  39. Hauptmann, S.; Klosterhalfen, B.; Weis, J.; Mittermayer, C.; Kirkpatrick, C.J. Skeletal muscle oedema and muscle fibre necrosis during septic shock. Observations with a porcine septic shock model. Virchows Arch. 1994, 424, 653–659. [Google Scholar] [CrossRef] [PubMed]
  40. Prescott, H.C.; Girard, T.D. Recovery From Severe COVID-19: Leveraging the Lessons of Survival From Sepsis. JAMA 2020, 324, 739–740. [Google Scholar] [CrossRef]
  41. Ma, Y.; Deng, J.; Liu, Q.; Du, M.; Liu, M.; Liu, J. Long-Term Consequences of COVID-19 at 6 Months and Above: A Systematic Review and Meta-Analysis. Int. J. Environ. Res. Public Health 2022, 19, 6865. [Google Scholar] [CrossRef]
  42. Greenhalgh, T.; Knight, M.; A’Court, C.; Buxton, M.; Husain, L. Management of post-acute covid-19 in primary care. BMJ 2020, 370, m3026. [Google Scholar] [CrossRef] [PubMed]
Figure 1. Graph of muscle fiber size at baseline and after 7 days of ICU admission. Type I and type II muscle fiber size in µm2 (n = 17) assessed at day 0 (T0, white bars) and day 7 (T1, black bars). Results are displayed as mean ± SD (A). Small black dots represent individual percentage change in type I and type II muscle fiber size over a 7-day period (B). Black squares represent the average percentage change in type I and type II muscle fiber size over a 7-day period (B).
Applsci 12 07310 g001
Figure 2. Representative images of muscle biopsy samples analyzed by light microscopy. Skeletal muscle biopsies showing (A) fiber atrophy and interstitial fibrosis. (B) Focal necrotic fibers being phagocyted by macrophages (black arrow). (C) Perivascular fibrosis without thrombi or inflammatory infiltrates. (D) Early stage of intramuscular fibrosis.
Applsci 12 07310 g002
Figure 3. Representative electron micrographs of longitudinally sectioned myofibers. These myofibers show myofibrillar degeneration (AC), hydropic degeneration (DF), and necrosis (GI). (AC) Narrowed and split myofibrils (white #) with preserved sarcomere structure, glycogen accumulation (G), dark elongated mitochondria (M), and displaced triads (circle) in widened intermyofibrillar spaces. The myofibers show Z-line smearing (black arrow), “zig-zag” appearance of the Z-line (white arrow), focal disorganization, and disruption of sarcomeric myofilaments and Z-line material over multiple sarcomere lengths is visible in B. (DF) The myofibers show myosin loss (black *) and glycogen accumulation (G) in widened edematous intermyofibrillar spaces containing vacuoles (V), swollen vacuolized mitochondria (M), and displaced triads with swollen terminal cisternae (TC). (GH) Electron-dense necrotic myofibers with hypercontraction of myofibrils (white *), amorphous granular material (black #), numerous vacuolized mitochondria (M), autophagic vacuoles (V), lysosomes (Ly), and lipid droplets (Li). Extrusion of the nucleus and surrounding sarcoplasm is visible in H. (I) Electron-lucent necrotic myofiber with fragmented nucleus (N), extensive myosin loss with preserved but misoriented Z-line material, and related actin filaments (rectangle).
Applsci 12 07310 g003
Figure 4. Electron micrographs of two longitudinally-sectioned degenerative myofibers. (A) The cytoplasm of an active macrophage (Ma) is in intimate contact with the nucleus (N2) of the necrotic fiber on the right. The nucleus of the macrophage (N4) is in contact with another nucleus of the necrotic myofiber (N3). Note the satellite cell (SC) at the periphery of the myofiber on the left, from which the nucleus is indicated by N1. Endomysium (E). (B,C) Higher magnifications of the degenerative muscle fiber with areas of myofibrillar and hydropic degeneration, with myofilament loss (white *) and narrowed myofibrils (white #). The sarcoplasm of the widened intermyofibrillar spaces contains vacuolized mitochondria (M), lipid droplets (Li), accumulations of glycogen (G1), and displaced triads (T). In some triads the central T-tubule is flanked by swollen terminal cisternae (circle). Accumulations of glycogen are also present subsarcolemmal (G2). Nucleus N5 is located in a large membrane bleb (white arrow), has several indentations (black arrow), and is surrounded by perinuclear glycogen accumulation (G3). Several sarcolemmal folds (F) are projecting into the extracellular space. The satellite cell (SC) is located within the basal lamina (small black arrows) of the muscle fiber, tightly associated with the sarcolemma. The nucleus of the necrotic fiber is indicated by N2. (D) Higher magnification of the necrotic fiber characterized by local hypercontraction of myofibrils (black *) and places where the myofilament structure is replaced by an amorphous granular material (black #).
Applsci 12 07310 g004
Figure 5. Electron micrograph of three myofibers, showing different degrees of degenerative changes. (A) Myofibers show different degrees of degenerative changes, from mild degeneration (white *), to moderate degeneration (black #), and towards necrosis (white #). Two myofibers have fragmented nuclei (N1 and N2; N3 and N4) located in a large membrane bleb that is oriented towards a neighboring capillary (C). The pyknotic nucleus (N5) of the third myofiber is centrally located. (B) Higher magnification of the mild degenerative myofiber, showing widened intermyofibrillar spaces with accumulated glycogen (G1) and swollen mitochondria (M). Lipid droplets (Li). Vacuoles (V). Subsarcolemmal accumulations of glycogen (G2). (C) Higher magnification of the moderate degenerative myofiber, showing myofibrillar disorganization and widened intermyofibrillar spaces with accumulated glycogen (G1). “Zig-zag” appearance of the Z-line (white arrow). Subsarcolemmal accumulations of glycogen (G2). (D) Higher magnification of the necrotic myofiber, showing extensive myosin loss with preserved but misoriented Z-line material and related actin filaments (black arrow), focal defects (white arrowhead) of the sarcolemma, and vacuoles (V).
Applsci 12 07310 g005
Figure 6. Combined immunofluorescence images and electron micrographs of a patient, showing a decrease in muscle fiber size and a patient showing an increase in muscle fiber size. Representative T0 image of patient 4, showing myosin heavy chain I in red and laminin in white (A). Representative T1 image of patient 4, showing a decrease in muscle fiber CSA (B). Representative transmission electron microscopy image of patient 4, showing myofibrillar degeneration (C). Representative T0 image of patient 9, showing myosin heavy chain I in red and laminin in white (D). Representative T1 image of patient 9, showing an increase in muscle fiber CSA (E). Representative transmission electron microscopy image of patient 9, showing hydropic degeneration (F).
Applsci 12 07310 g006
Figure 7. Electron micrographs of abnormalities of the endomysial capillaries. Abnormal capillaries are characterized by swollen endothelial cells, showing swollen mitochondria (M), numerous pinocytotic vesicles (white arrowhead), and thickened lamina (white arrow), sometimes accompanied by perivascular fibrosis (white #). (A) The adjacent degenerative myofiber shows narrowed myofibrils (black # ) with a preserved sarcomere structure, sarcolemmal folds (F), and additional layers of basal lamina (black arrowhead). (B) An active macrophage (Ma) is located between the capillary and the degenerative myofiber, showing myosin loss (white *), sarcolemmal folds (F), vacuoles (V), and swollen mitochondria (M). (C) This capillary shows proliferation (black arrow) of the endothelial cells, causing obliteration of the capillary lumen. The neighboring necrotic myofiber shows vacuoles (V), swollen mitochondria (M), and extensive myofilament loss (black *). (D) The lumen of this capillary contains degranulated platelets (P).
Applsci 12 07310 g007
Table 1. COVID-19 patient characteristics.
Demographics and AnthropometricsDisease SeverityBlood AnalysisComorbidities
Age (Years) BMI (kg/m2)Sex (M:F)Acute Physiology and Chronic Health Evaluation IISequential Organ Failure Assessment ScoreAcute Respiratory Distress Syndrome (Yes/No)Sepsis (Yes/No)Mode of Ventilation Extra Corporal Membrane Oxygenation (Yes/No)Died during the Study (†)Died on ICU (†) after T1 (End of Study)Acute Respiratory Failure (PO2/FiO2 <300)Acute Kidney Failure (Yes/No) Acute Heart Failure (Yes/No) White Blood Cells (×109/L)C-Reactive Protein (mg/L)Lactate Dehydrogenase (U/L)Troponin (ng/L)
8424.2M179YesYesHFNO, NIVNo 113Yes No3.14053039CVD, DM
83 *29.3F88YesYesNIVNo 107NoNo13.21871016.3CVD, HTN
8126.0M715YesYesNIV, IMVNo 75YesNo8.09664026.5DM
7326.0M106YesNoNIVNo 110NoNo9.026043017.9Cancer, CVA
8026.1M1611NoYesNIV, IMVNo 373NoNo8.2100320141CVD, CRD
73 *25.4M15N/AYesNoHFNONo 77NoNo4.75046020.6CRD
77 *22.6M128YesYesHFNO, NIVNo 178NoNo34.719450294HTN
7629.7M117NoNoHFNONo 224NoNo6.231240164CVD, DM, CKD
7526.3M2012YesYesIMVNo 114NoNo12.443370115CRD
40 *24.3M1111YesNoHFNO, NIVNo 152NoNo11.753460<5DM, CLD
7427.5F98YesYesHFNO, NIV, IMVNo 70NoNo6.110037012.2
8224.3M108YesYesHFNO, IMVNo 98NoNo4.49138019.3
4935.1M312YesYesHFNO, NIV, IMVYes 111NoYes9.7423708.3HTN, Obesity
5445.5F5N/AYesNoHFNO, NIVNo 80NoNo6.4513209DM, CRD, CVA Obesity
6831.4M914YesYesNIV, IMVNo 78YesNo6.114043033HTN, Obesity
6829.3M1310YesYesHFNO, NIVNo 57NoNo4.813057013.5DM
6923.0M911YesYesHFNONo 80NoNo4.314034010.6Cancer
7033.2F11N/AYesYesHFNONo 142NoNo7.69441020.6DM, Obesity
7222.5M169YesNoHFNO, NIVNo 88NoNo3.112067016.1
7027.7M98YesYesHFNONo 140NoNo7.222043022.3HTN, DM
33 *33.8M63YesNoHFNONo 136NoNo6.827820N/AObesity
6927.8M1210YesYesHFNO, NIV, IMVNo 53NoNo6.650N/AN/A
HFNO: high flow nasal oxygen, NIV: non-invasive ventilation, IMV: invasive mechanical ventilation, CVD: cardiovascular disease, DM: diabetes mellitus, HTN: hypertension; CVA: cerebrovascular accident, CRD: chronic respiratory disease, CKD: chronic kidney disease, CLD: chronic liver disease, N/A: not assessed, † died, * indicates if the patient was left out of the final immunofluorescent analysis.
Table 2. Type I and type II muscle fiber characteristic at day 0 (T0) and day 7 (T1) of intensive care unit admission in COVID-19 patients.
Fiber TypeT0
(n = 17)
T1
(n = 17)
Fiber type distribution (%)I43 ± 1347 ± 13
II57 ± 1553 ± 15
Myonuclear content (number/fiber)I4.40 ± 0.924.97 ± 1.35
II4.14 ± 0.88 *4.37 ± 1.32 *
Proportion of fibers containing a central nuclei (%)I6.4 ± 4.95.8 ± 4.5 †
II6.0 ± 4.73.6 ± 3.1 †
CCI3.31 ± 0.533.26 ± 0.67
II2.85 ± 0.41 *2.65 ± 0.72 *
C/FiI1.15 ± 0.291.16 ± 0.43
II0.84 ± 0.29 *0.76 ± 0.26 *
CFPE index (capillaries·1000 µm−1)I5.21 ± 0.914.93 ± 0.79
II4.13 ± 0.79 *3.73 ± 0.83 *
CD (Capillaries per mm2)I335 ± 97305 ± 94
II328 ± 105315 ± 114
Data are expressed as mean ± SD. I: type I muscle fiber; II: type II muscle fiber. CC: capillary contacts: C/Fi: capillary to fiber ratio. CFPE index: capillary to fiber perimeter exchange index. CD: capillary density. * significantly different compared with type I muscle fibers (p < 0.05). † significant difference compared with T0 (p < 0.05).
Publisher’s Note: MDPI stays neutral with regard to jurisdictional claims in published maps and institutional affiliations.

