Article

Analysis and Application of Lining Resistance to Water Pressure in Tunnel through Karst Cave

1
Key Laboratory for Urban Underground Engineering of Ministry of Education, Beijing Jiaotong University, Beijing 100044, China
2
School of Civil Engineering, Beijing Jiaotong University, Beijing 100044, China
*
Author to whom correspondence should be addressed.
Appl. Sci. 2022, 12(15), 7605; https://doi.org/10.3390/app12157605
Submission received: 21 June 2022 / Revised: 23 July 2022 / Accepted: 26 July 2022 / Published: 28 July 2022
(This article belongs to the Section Civil Engineering)

Abstract

:
Using RFPA software, the hydraulic pressure resistance and damage process of the grouted stone body of a tunnel in the high-pressure karst zone were analyzed, and the hydraulic pressure resistance of the composite surrounding rock and composite structure when the tunnel was expanded through the cavern under the effect of hydraulic coupling was investigated. Then, a new parallel heading expansion scheme for the New Yuanliang Mountain Tunnel was innovatively discussed, and the reliability of the results of the calculation model was verified by a field test. Lastly, the model calculation results guided the project to adopt a 5 m grouting range and advanced secondary lining to ensure that the composite structure’s water pressure resistance could reach 3 MPa; by adopting the improved technology of parallel heading expansion based on the CRD method, the safety of tunnel expansion through the cavity was effectively ensured, which can provide a reference for similar projects in the future.

1. Introduction

With the rapid development of the world economy, the limitations of the existing transportation network are increasingly being reflected. In order to meet the needs of people’s life, travel, and material transportation, more and more railway tunnels have been built. China is the country with the most vigorous karst geomorphic development in the world, with an area of 3.4 million square kilometers, and a considerable number of tunnels are inevitably built in mountainous areas with karst caves. The construction of tunnels in these areas often encounters high-pressure and water-rich karst strata, and the construction process often faces the threat of sudden water and mud hazards in the surrounding hidden cavities [1]. At present, the construction of long tunnels in high-pressure water-rich karst areas is still a challenge for the world engineering community, and the safety of tunnel structures in karst areas has become the focus of many scholars [2,3].
Damage to the tunnel lining in water-rich karst areas occurs under the action of water pressure, mostly related to people’s insufficient understanding of the ability of the lining to resist water inrush. For tunnels built-in high-water-pressure karst areas, as the depth of burial increases, the hydrogeological unit exposure and water pressure will increase, ultimately leading to a greater risk of sudden water gushing mud disaster, which can seriously affect the service life of the tunnel [4]. In order to effectively reduce the impact of cavities on tunnel excavation, some scholars have proposed a number of construction disposal measures on karst based on field measurements, and the use of artificial intelligence for the prediction of surrounding rock parameters is one of the key steps, which has effectively helped to reduce the occurrence of sudden flooding in tunnels [5,6,7,8,9]. Some scholars have also constructed mechanical response models for tunnels through caves using elastoplastic theory [10,11,12]. To evaluate the safety level of tunnel excavation in cavernous areas, Wu et al. [13] established a critical safety thickness criterion for the sudden water flow caused by palm face destabilization under the consideration of seepage conditions based on the Hoek–Brown damage criterion. Li et al. [14] derived the formula for the reserved safety thickness of the palm face of front-overhead cavern-filled tunnels by combining COMSOL and multiple linear regression methods. Using the above evaluation method, Li et al. [15] proposed a comprehensive pretreatment method for tunnels by optimizing the treatment of initial support and increasing the thickness of secondary lining, achieving good results.
A large number of scholars have conducted many studies on structural safety and disposal measures during tunnel construction, but there are fewer studies on the analysis of the fracture mechanism of tunnel composite structures under hydraulic pressure in karst areas, mostly focusing on the damage process of tunnel-surrounding rocks under different surrounding pressures [16,17,18,19], while lacking verification of relevant engineering examples. Therefore, relying on the New Yuanliang Mountain Tunnel Project, this study analyzed the hydraulic pressure resistance and damage process of tunnel-grouted stone bodies in karst areas through numerical calculations and field tests, before verifying the reliability of the calculation model through field measurements. By revealing the disaster-causing mechanism of inducing sudden water, the hydraulic pressure resistance of the composite surrounding rock structure under the action of hydraulic coupling when the tunnel was expanded through the hidden cavity was studied innovatively, which can provide a theoretical basis for the selection of structural design parameters of karst tunnels in the future.

2. Failure Mode of Grouting in Tunnels Crossing High-Pressure Karst Caves

RFPA (realistic failure process analysis) is an analysis software to simulate material fracture based on finite element stress analysis and statistical damage theory. Compared with the traditional finite element software to simulate macro nonlinear deformation, it can also reflect the microfracture process of a material in the deformation process, so as to simulate the whole process from progressive fracture to instability.
Using the numerical calculation model, the rupture mechanism of the grouted body under different working conditions was studied on the basis of the characteristics of the stratum and structural design parameters of the section, with the water pressure of the cavity, the location of the cavity, the grouting material, and the range of the grouted reinforcement area as the main influencing factors.

2.1. Failure Characteristics of Grouting in Tunnel Crossing the High-Pressure Karst Cave

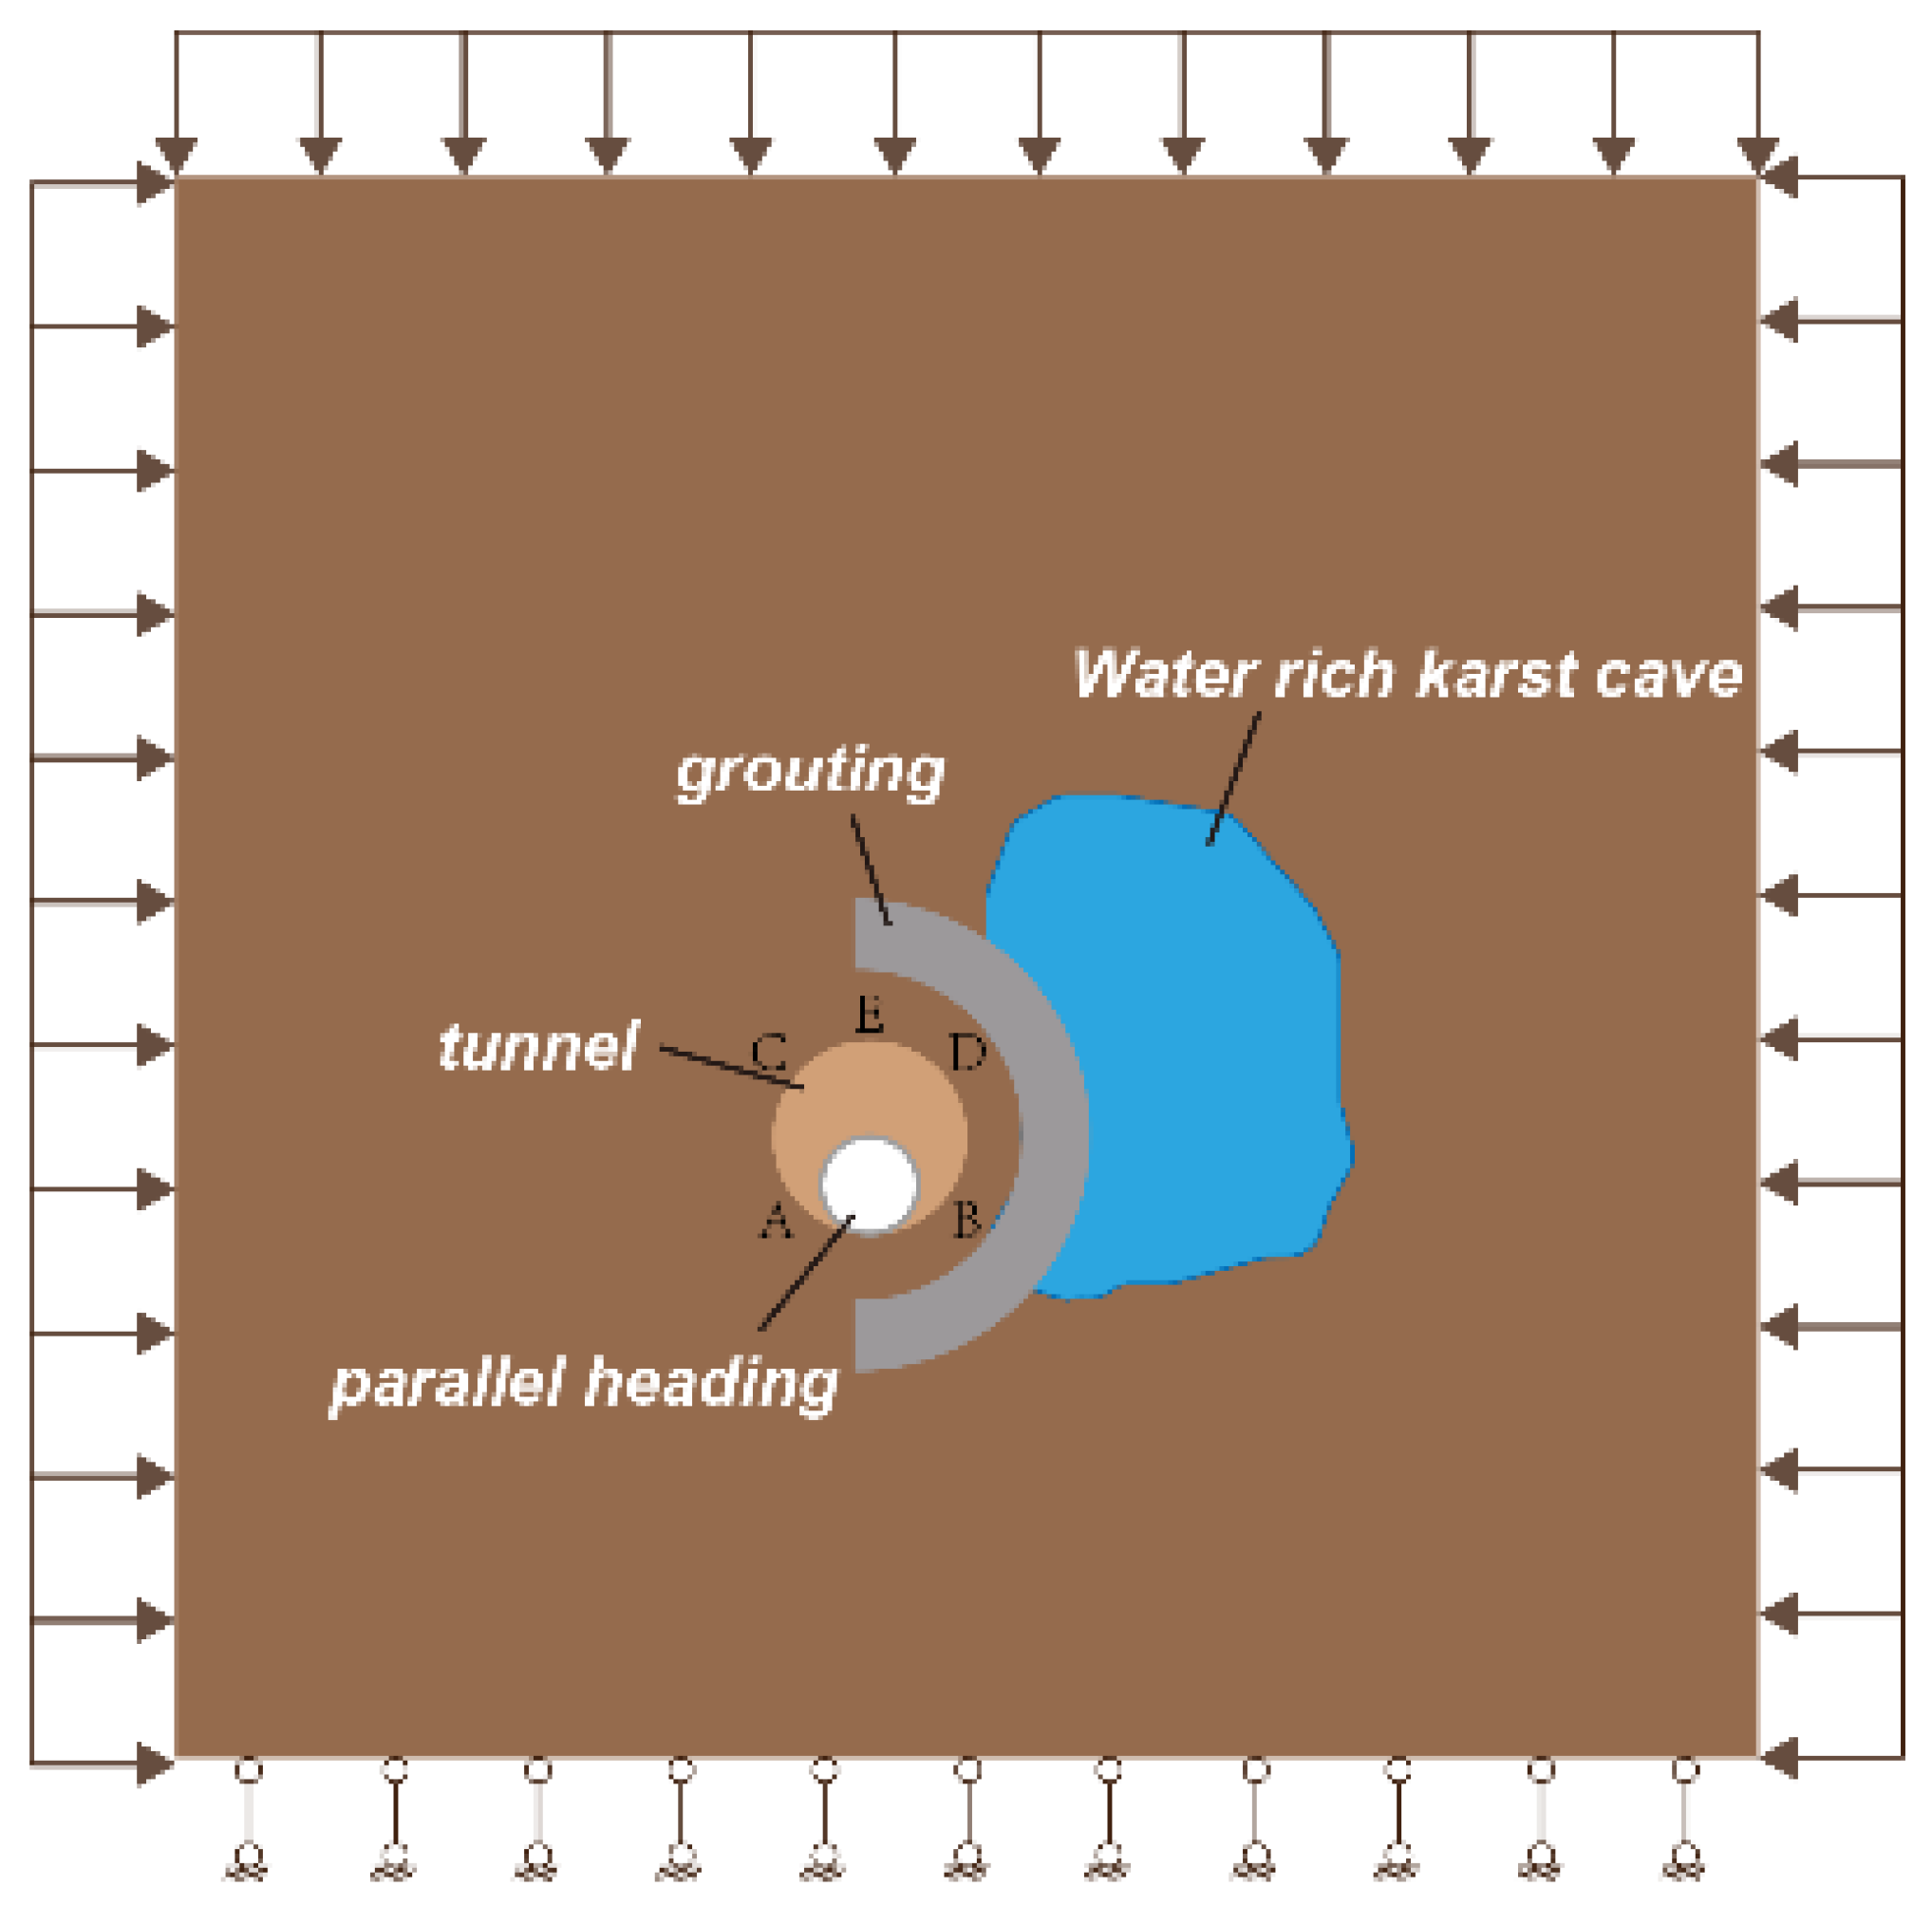
2.1.1. Establishment of the Numerical Calculation Model

Statistics on karst tunneling hazards show that most of the water-bearing cavities encountered in karst tunneling are in the near-horizontal direction, with only a few cavities in the near-vertical direction [20]. The near-vertical cavities are governed by the flow characteristics of dissolved water. The cavities are generally larger in size, and most of them have signs of surface exposure; thus, such geological structures are often avoided in tunnel surveys, and tunneling disasters caused by vertical cavities are not common. The RFPA software simplified the karst into a nearly horizontal water-bearing cavity to study the damage characteristics of the tunnel grouting circle under a high-pressure cavity. Taking a large lateral cavity as an example, it was assumed that the tunnel parallel heading expansion profile crossed the cavity, and the cavity fill needed to be reinforced by curtain grouting before expansion. The inner diameter of the tunnel was 10 m, the inner diameter of the parallel heading was 5 m, and the grouting reinforcement circle range was 5 m outside the tunnel expansion contour. Taking into account the influence of the parallel heading expansion range, the calculation model size had to be greater than three times the diameter of the hole, which was taken as 100 m × 100 m. The tunnel burial depth was 500 m, the average self-weight of the surrounding rock was 20 kN/m3, the applied vertical mean load was about 10 MPa, and the lateral pressure coefficient of rock was taken as 1.5. The calculation model is shown in Figure 1. The model was considered by the plane strain problem, and the modified Coulomb criterion including the tensile cutoff was used as the strength criterion for unit damage. The structural parameters of the surrounding rock level are shown in Table 1.
The calculation steps of all models in this paper were the same. The first step was a steady pressure after grouting for the existing parallel heading; the water pressure load was applied to the inner wall of the water-bearing cavity to simulate the water pressure effect in the cavity, and the initial water pressure in the water-bearing cavity was 0.1 MPa, with a single-step increment of 0.01 MPa. The second step was the construction of the existing parallel heading expansion, and the water pressure in the cavity was calculated to increase until the rupture of the grouted reinforcement circle bursts water.

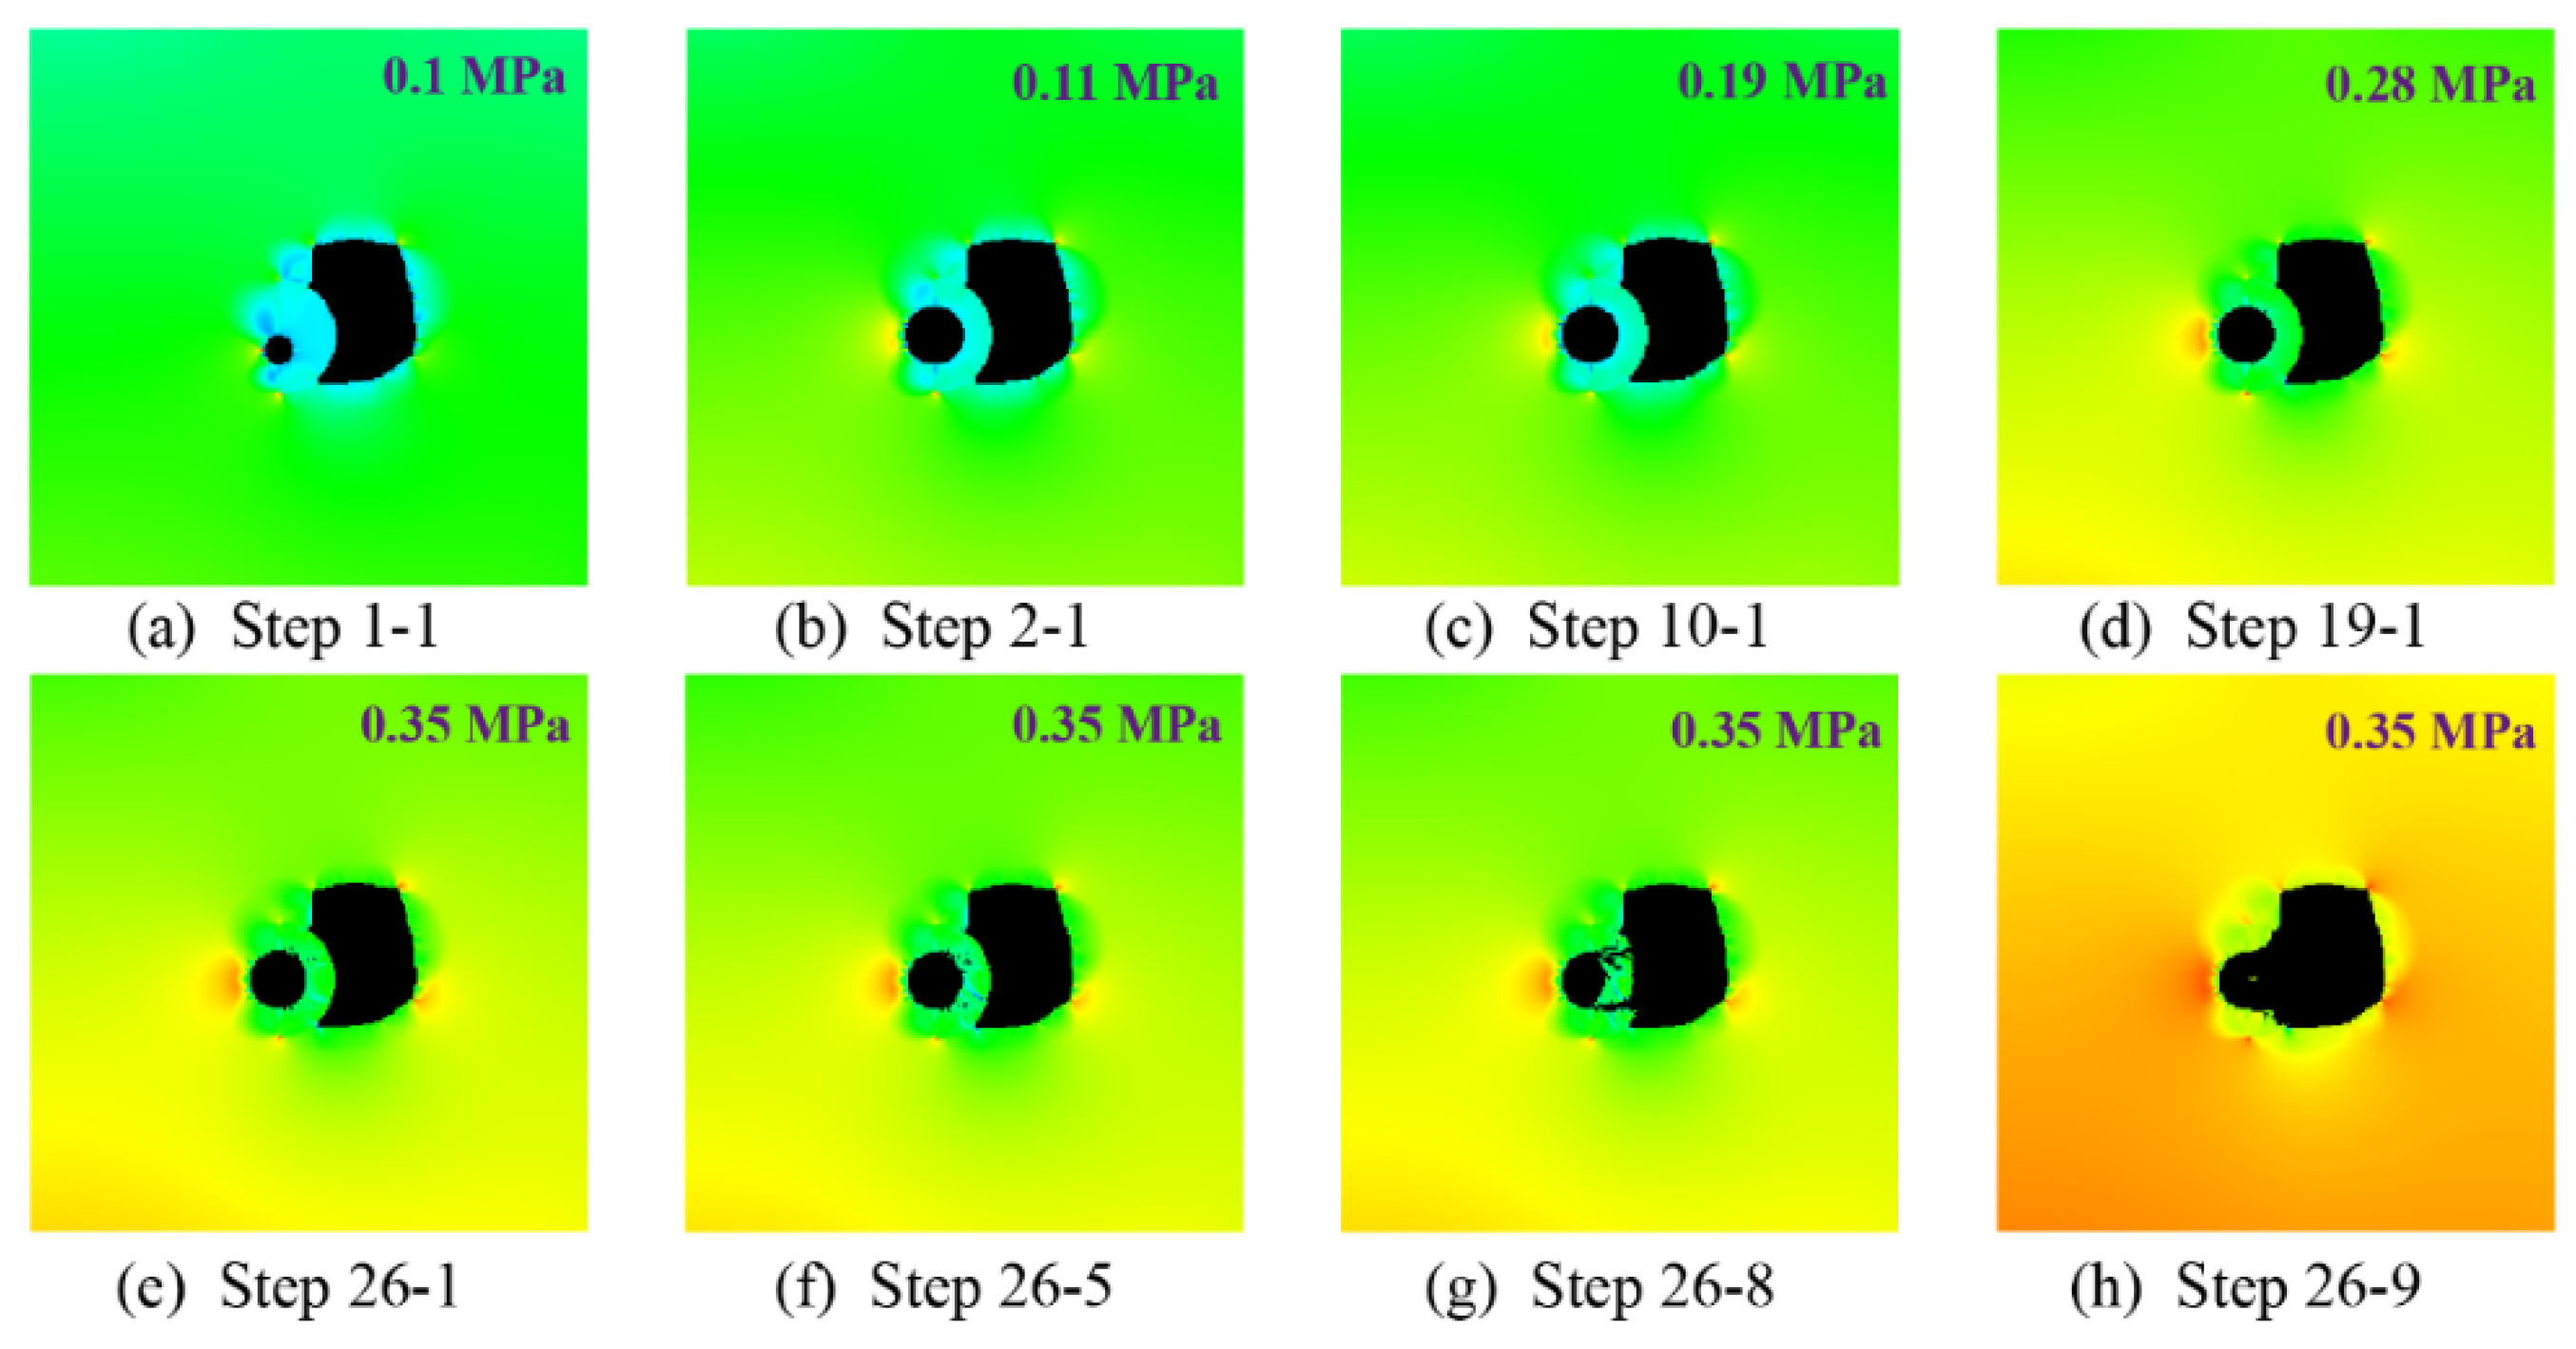
2.1.2. Results of Numerical Calculations

According to the numerical simulation calculation results, the damage pattern results of typical steps were extracted, as shown in Figure 2, corresponding to steps 1-1, 2-1, 10-1, 19-1, 26-1, 26-5, 26-8, and 26-9, with water pressures of 0.1 MPa, 0.11 MPa, 0.19 MPa, 0.28 MPa, and 0.35 MPa, respectively. It can be observed in Figure 2 that, because the initial state of the cavity had 0.1 MPa water pressure, a circular stress zone was distributed around the cavity before the excavation of the existing parallel heading, and no structural damage occurred in the grouted stone body between the cavity and the parallel heading at this time. After the excavation of the existing parallel heading, the original stress balance was broken, and stresses were redistributed around the tunnel, on both sides of the tunnel, as well as at the top and bottom of the arch. In addition, at this time, a very obvious stress concentration appeared in the grouted stone body, and a new stress equilibrium state was finally reached under the influence of the mutual coupling of force and flow fields. Then, with the increase in water pressure inside the cavity, microcracks began to be generated on one side of the grouted stone body inside the tunnel, and, as the stress concentration on both sides of the grouted stone body further increased, coupled with the minimum restraint on both sides of the grouted stone body, a macroscopic main crack connecting the bottom of the tunnel arch and the interior of the cavity was gradually extended through, and another main crack extending from the interior of the cavity to the right arch of the tunnel was also gradually extended. Eventually, the grouted stone body collapsed to the interior of the tunnel as a whole with the two main cracks as the slipping surface, and the stone body was completely destroyed.
When the surrounding rock unit underwent brittle damage, the elastic energy released from the rock body was released externally in the form of acoustic emission; hence, the acoustic emission characteristics of the rock could reflect the process of rock rupture. The calculated acoustic emission at a typical loading step is shown in Figure 3. A light color in the acoustic emission diagram indicates that the compression damage occurred in the rock unit, and a dark color indicates that the tensile damage occurred in the rock unit. From Figure 3, it can be seen that, after the parallel heading initially expanded the tunnel, as the water pressure in the cavity continued to rise, the grouted rock unit first appeared as a compression shear damage unit; then, as the water pressure in the cavity gradually increased, the compression shear damage unit gradually decreased. When the water pressure in the cavity rose to 0.35 MPa, the grouted rock unit presented cracks, which were mainly caused by tensile shear damage.

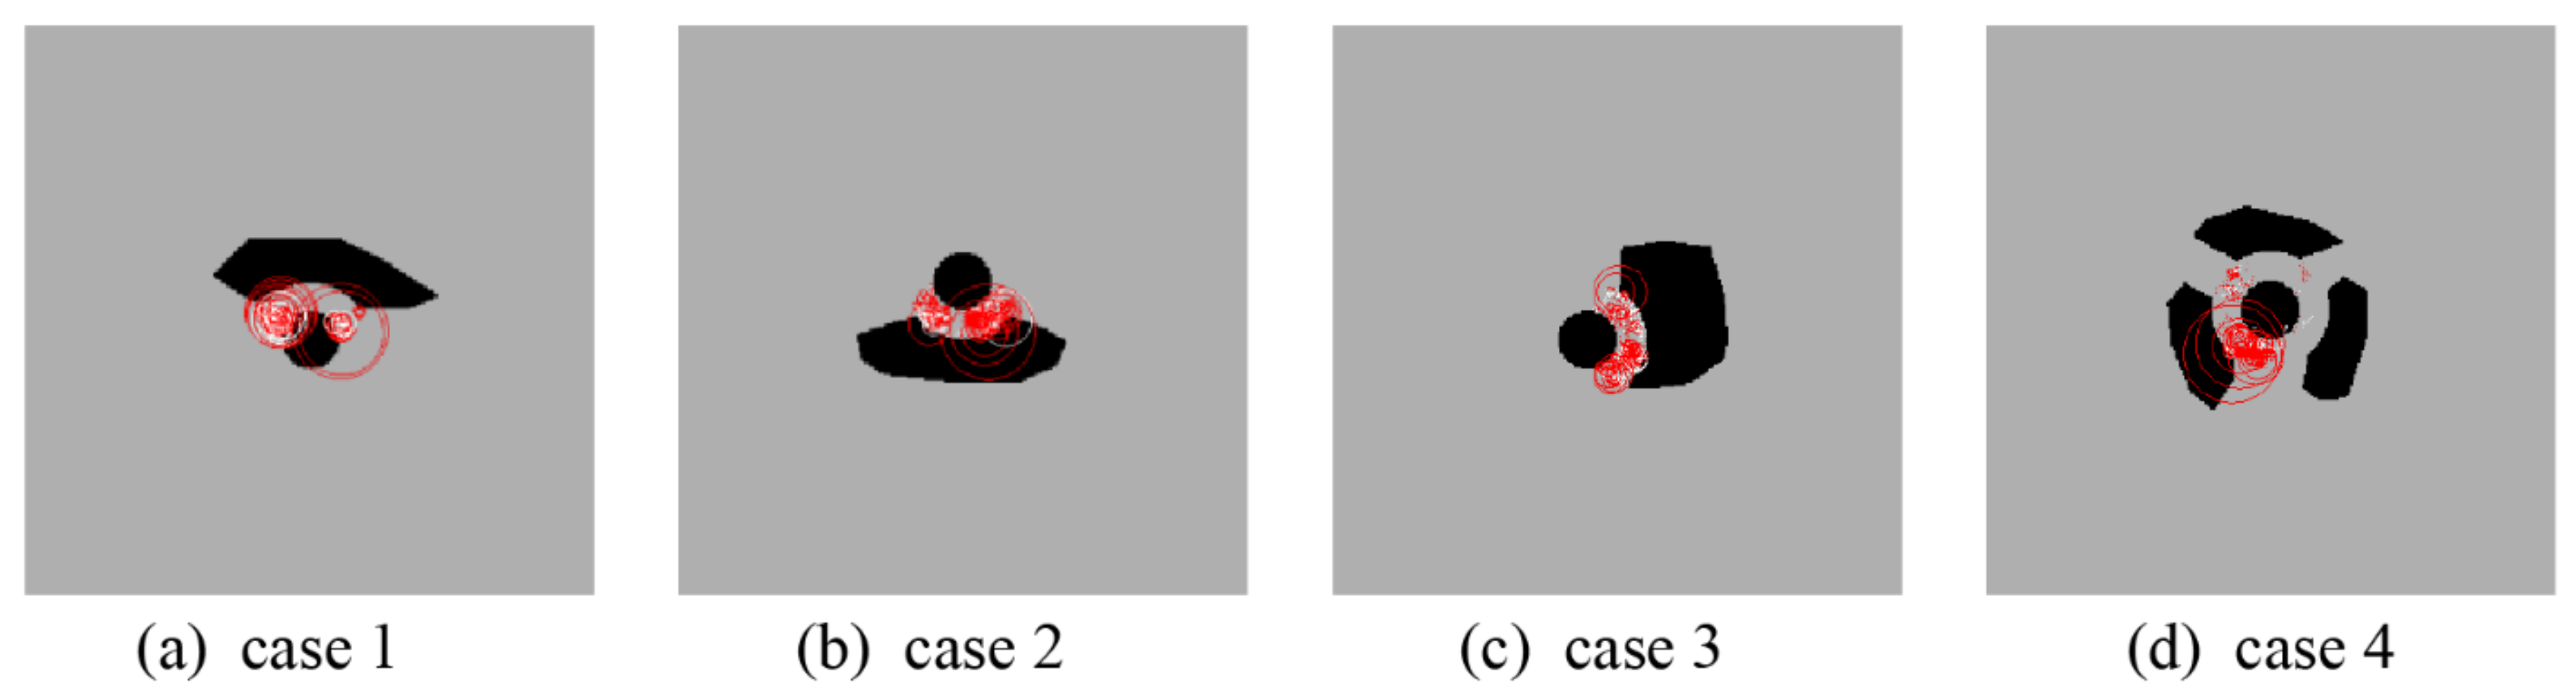
2.2. Influence of Cavity Location on the Effect of Grouting

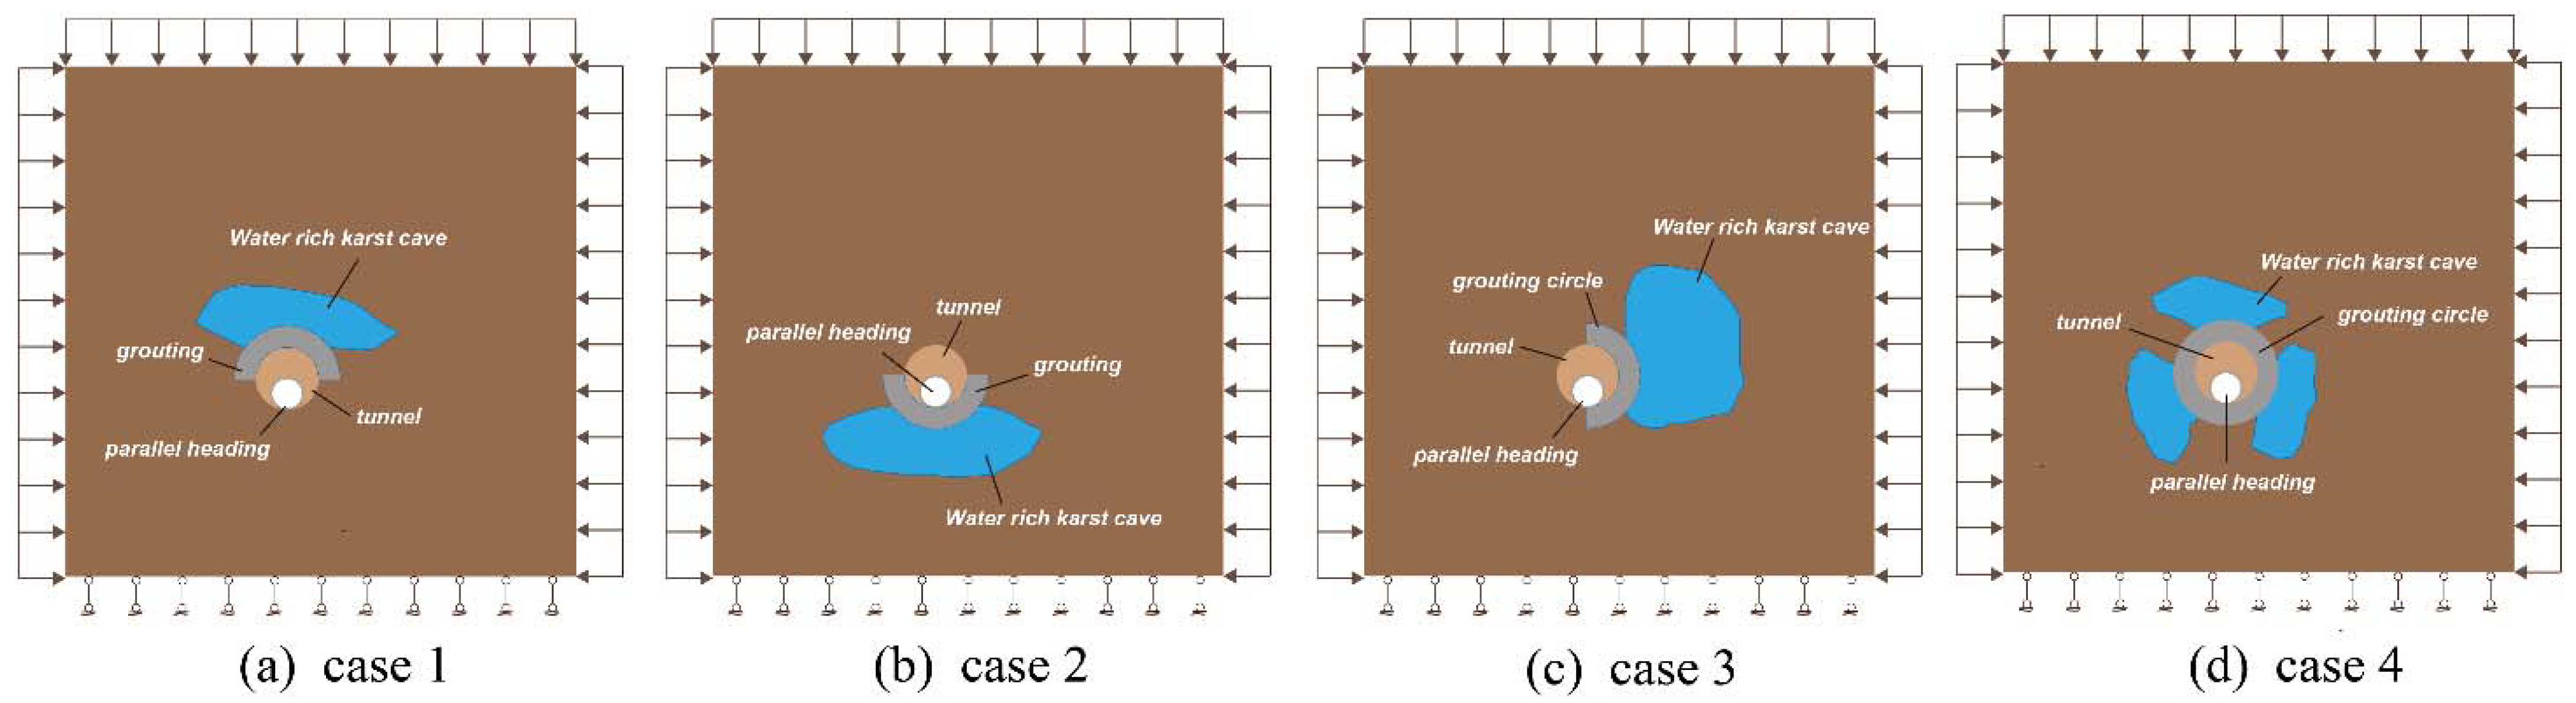
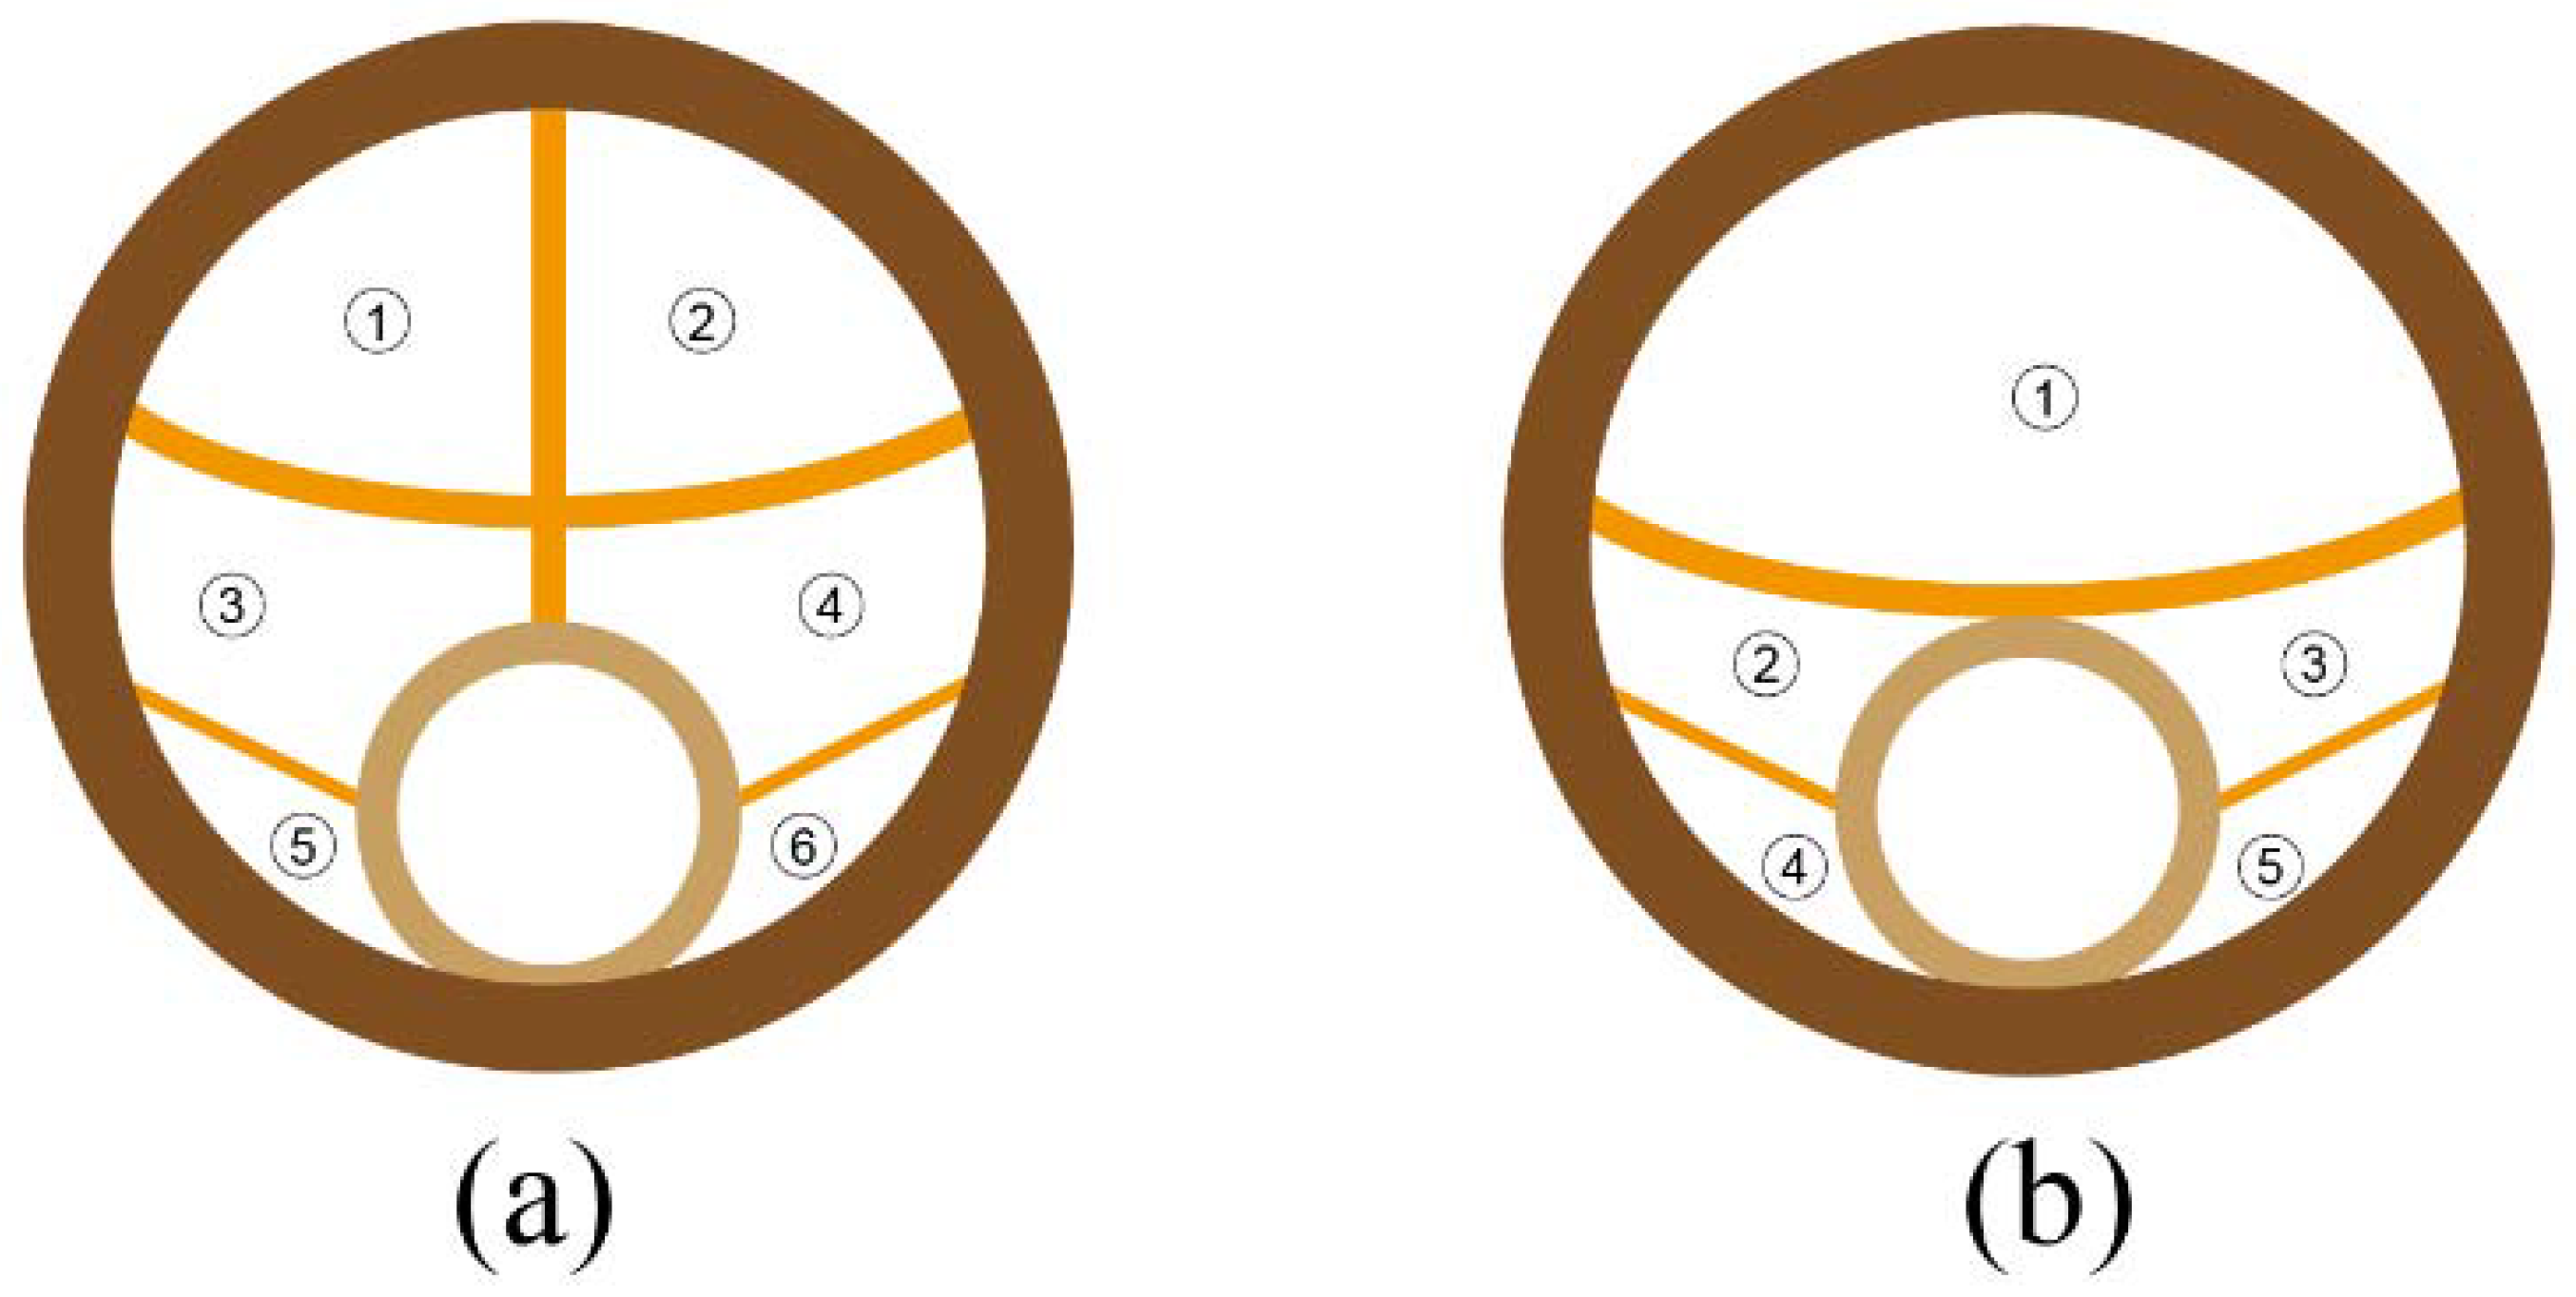
2.2.1. Establishment of Numerical Calculation Models

The effect of grouting and water plugging reinforcement in karst areas can be influenced by the relative position of the tunnel and the cavity. According to the typical spatial and temporal distribution of karst cavities, the four calculation cases shown in Figure 4 were summarized, and the grouting and water plugging effects were studied under these four tunnel-cavity relative positions. The water pressure resistance and damage mode of different thicknesses of the grouting were analyzed in each case, and the thickness of the grouting circle was taken as 3 m, 4 m, 5 m, 6 m, 7 m, 8 m, 9 m, and 10 m, respectively; the grouting material was superfine cement–water/glass double liquid. According to the numerical simulation results, the structural stability of the grouted body was compared and analyzed under different thicknesses of the grouted reinforcement circle, and the influence of karst morphology on the curtain grouting was investigated. The stratigraphic parameters, model excavation, and cavity water pressure application methods used in the calculations were as described above.

2.2.2. Results of Numerical Calculations

The calculated results of the water pressure resistance of the grouted stone body under different relative positions of the tunnel and the cave are shown in Figure 5. It can be found that, in all cases, the main cracks of the grouted rock mass basically sprouted from the two ends of the middle rock column, and then the cracks developed gradually with the increase in water pressure until penetration. Eventually, the grouted rock mass collapsed into the tunnel with complete damage. A further analysis of typical acoustic emission diagrams in various cases is shown in Figure 6. It can be found that the main cracks formed by the grouted stone body were all caused by tensile–shear damage. When traversing the cavern cluster, the grout ring damage was mainly generated and developed from the weakest point, as shown in Figure 6d, and the tensile shear damage was mainly generated at the closest relative distance to the cavern.
Comparing the water pressure resistance of the grout range in different cases, the graph of the water pressure resistance of the grout ring for the tunnel and the cavity at different relative positions was obtained, as shown in Figure 7. It can be seen from the figure that, with the same thickness of the grouted stone, the tunnel in case 4 had the least resistance to water pressure, the tunnel in case 1 had the greatest resistance to water pressure, and the tunnels in case 2 and case 3 had moderate resistance to water pressure. The results of the four calculated cases of the grouting circle showed a consistent trend. The numerical calculation also showed that, even when the thickness of the grout circle increased to 10 m, the hydraulic pressure resistance of the grouted stone body was only about 1 MPa, and the excessive cavern water pressure would also lead to more difficulties in slurry injection; hence, this type of cave is best constructed during the non-rainy season.

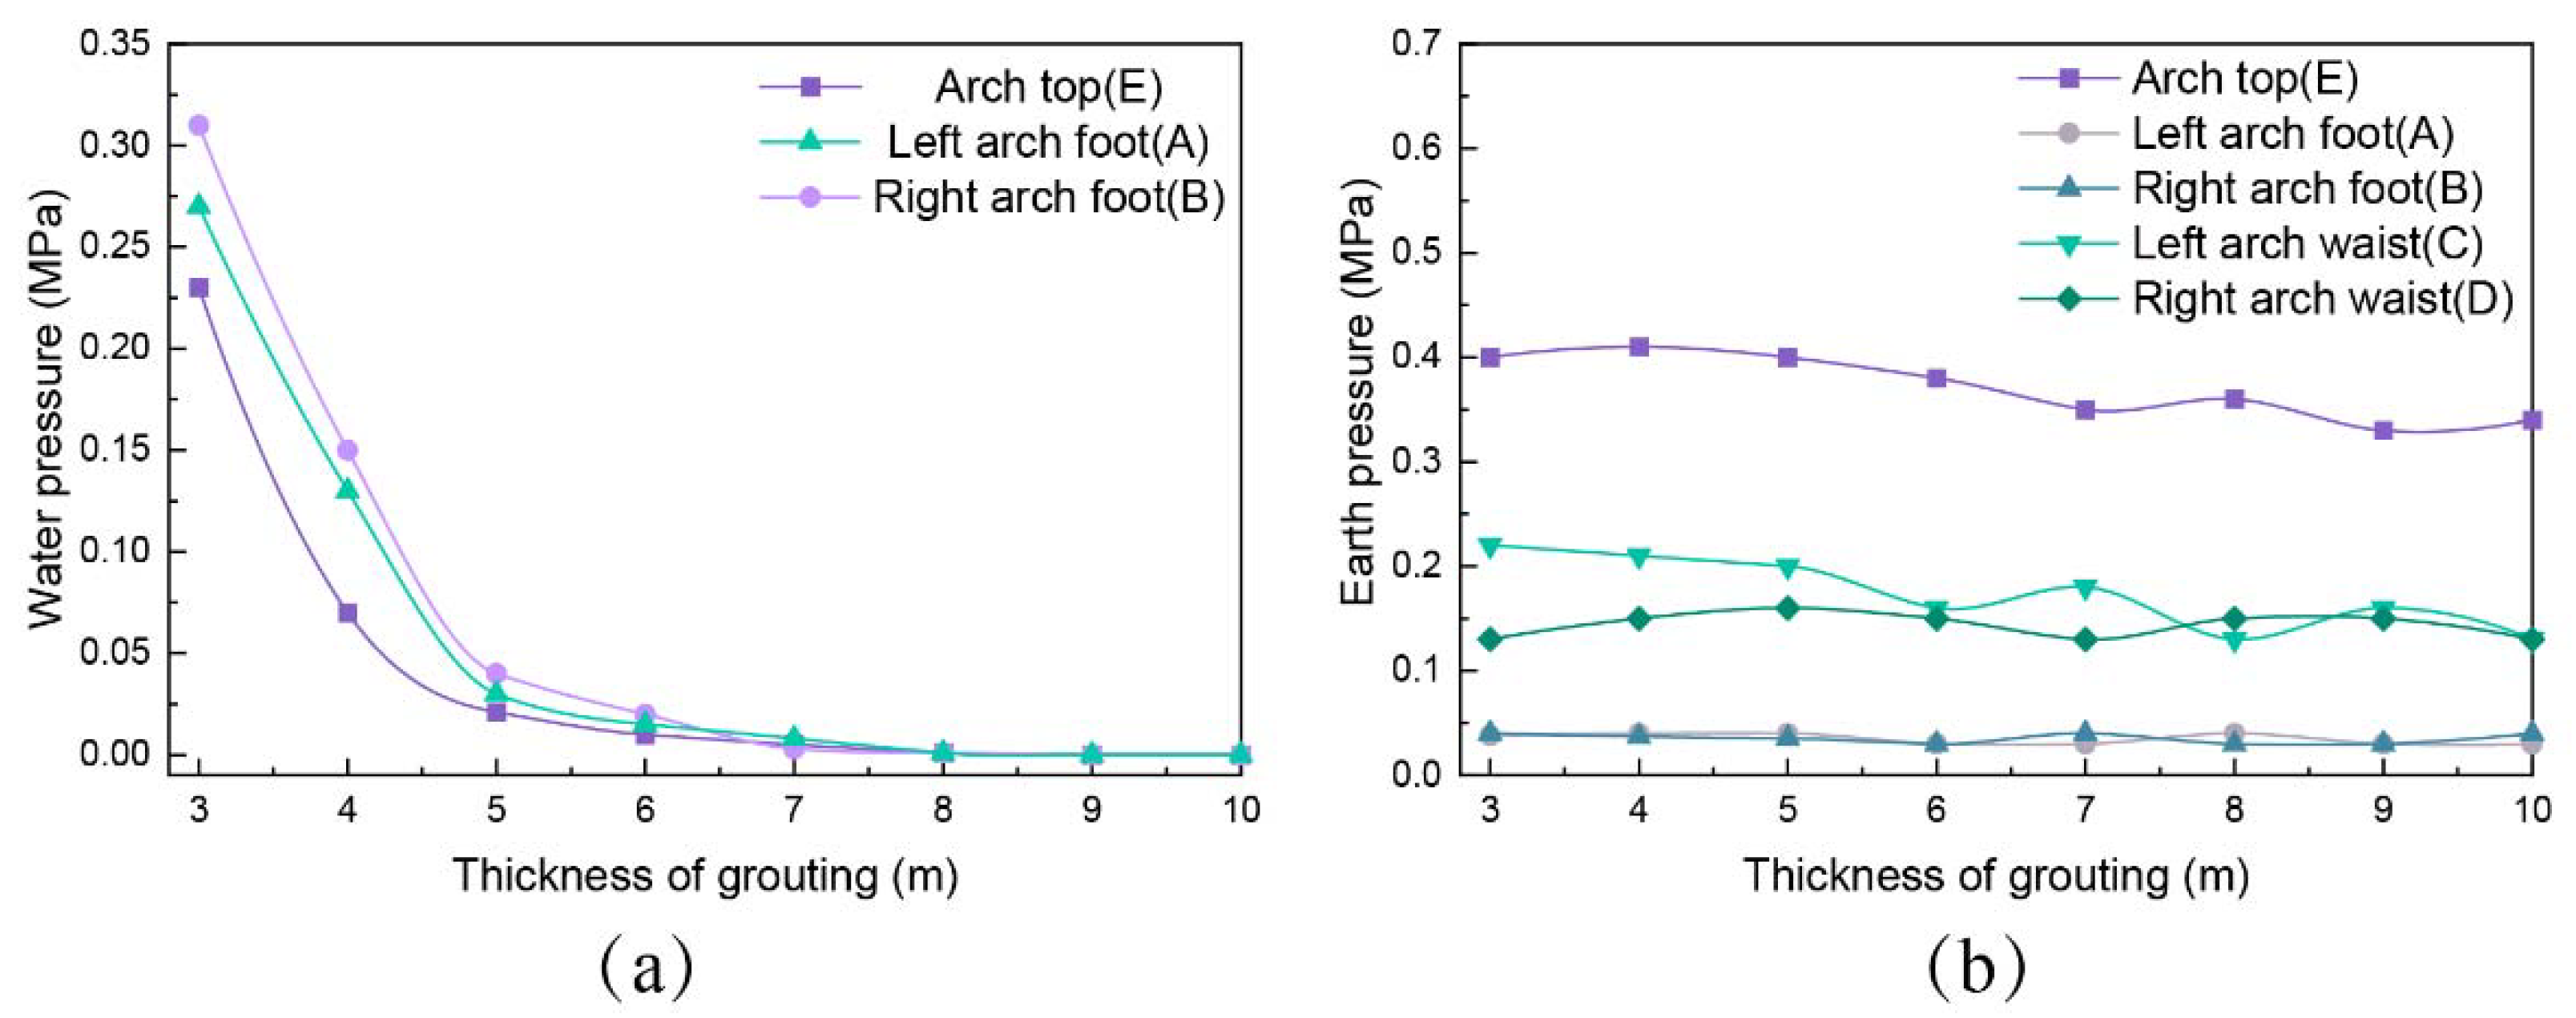
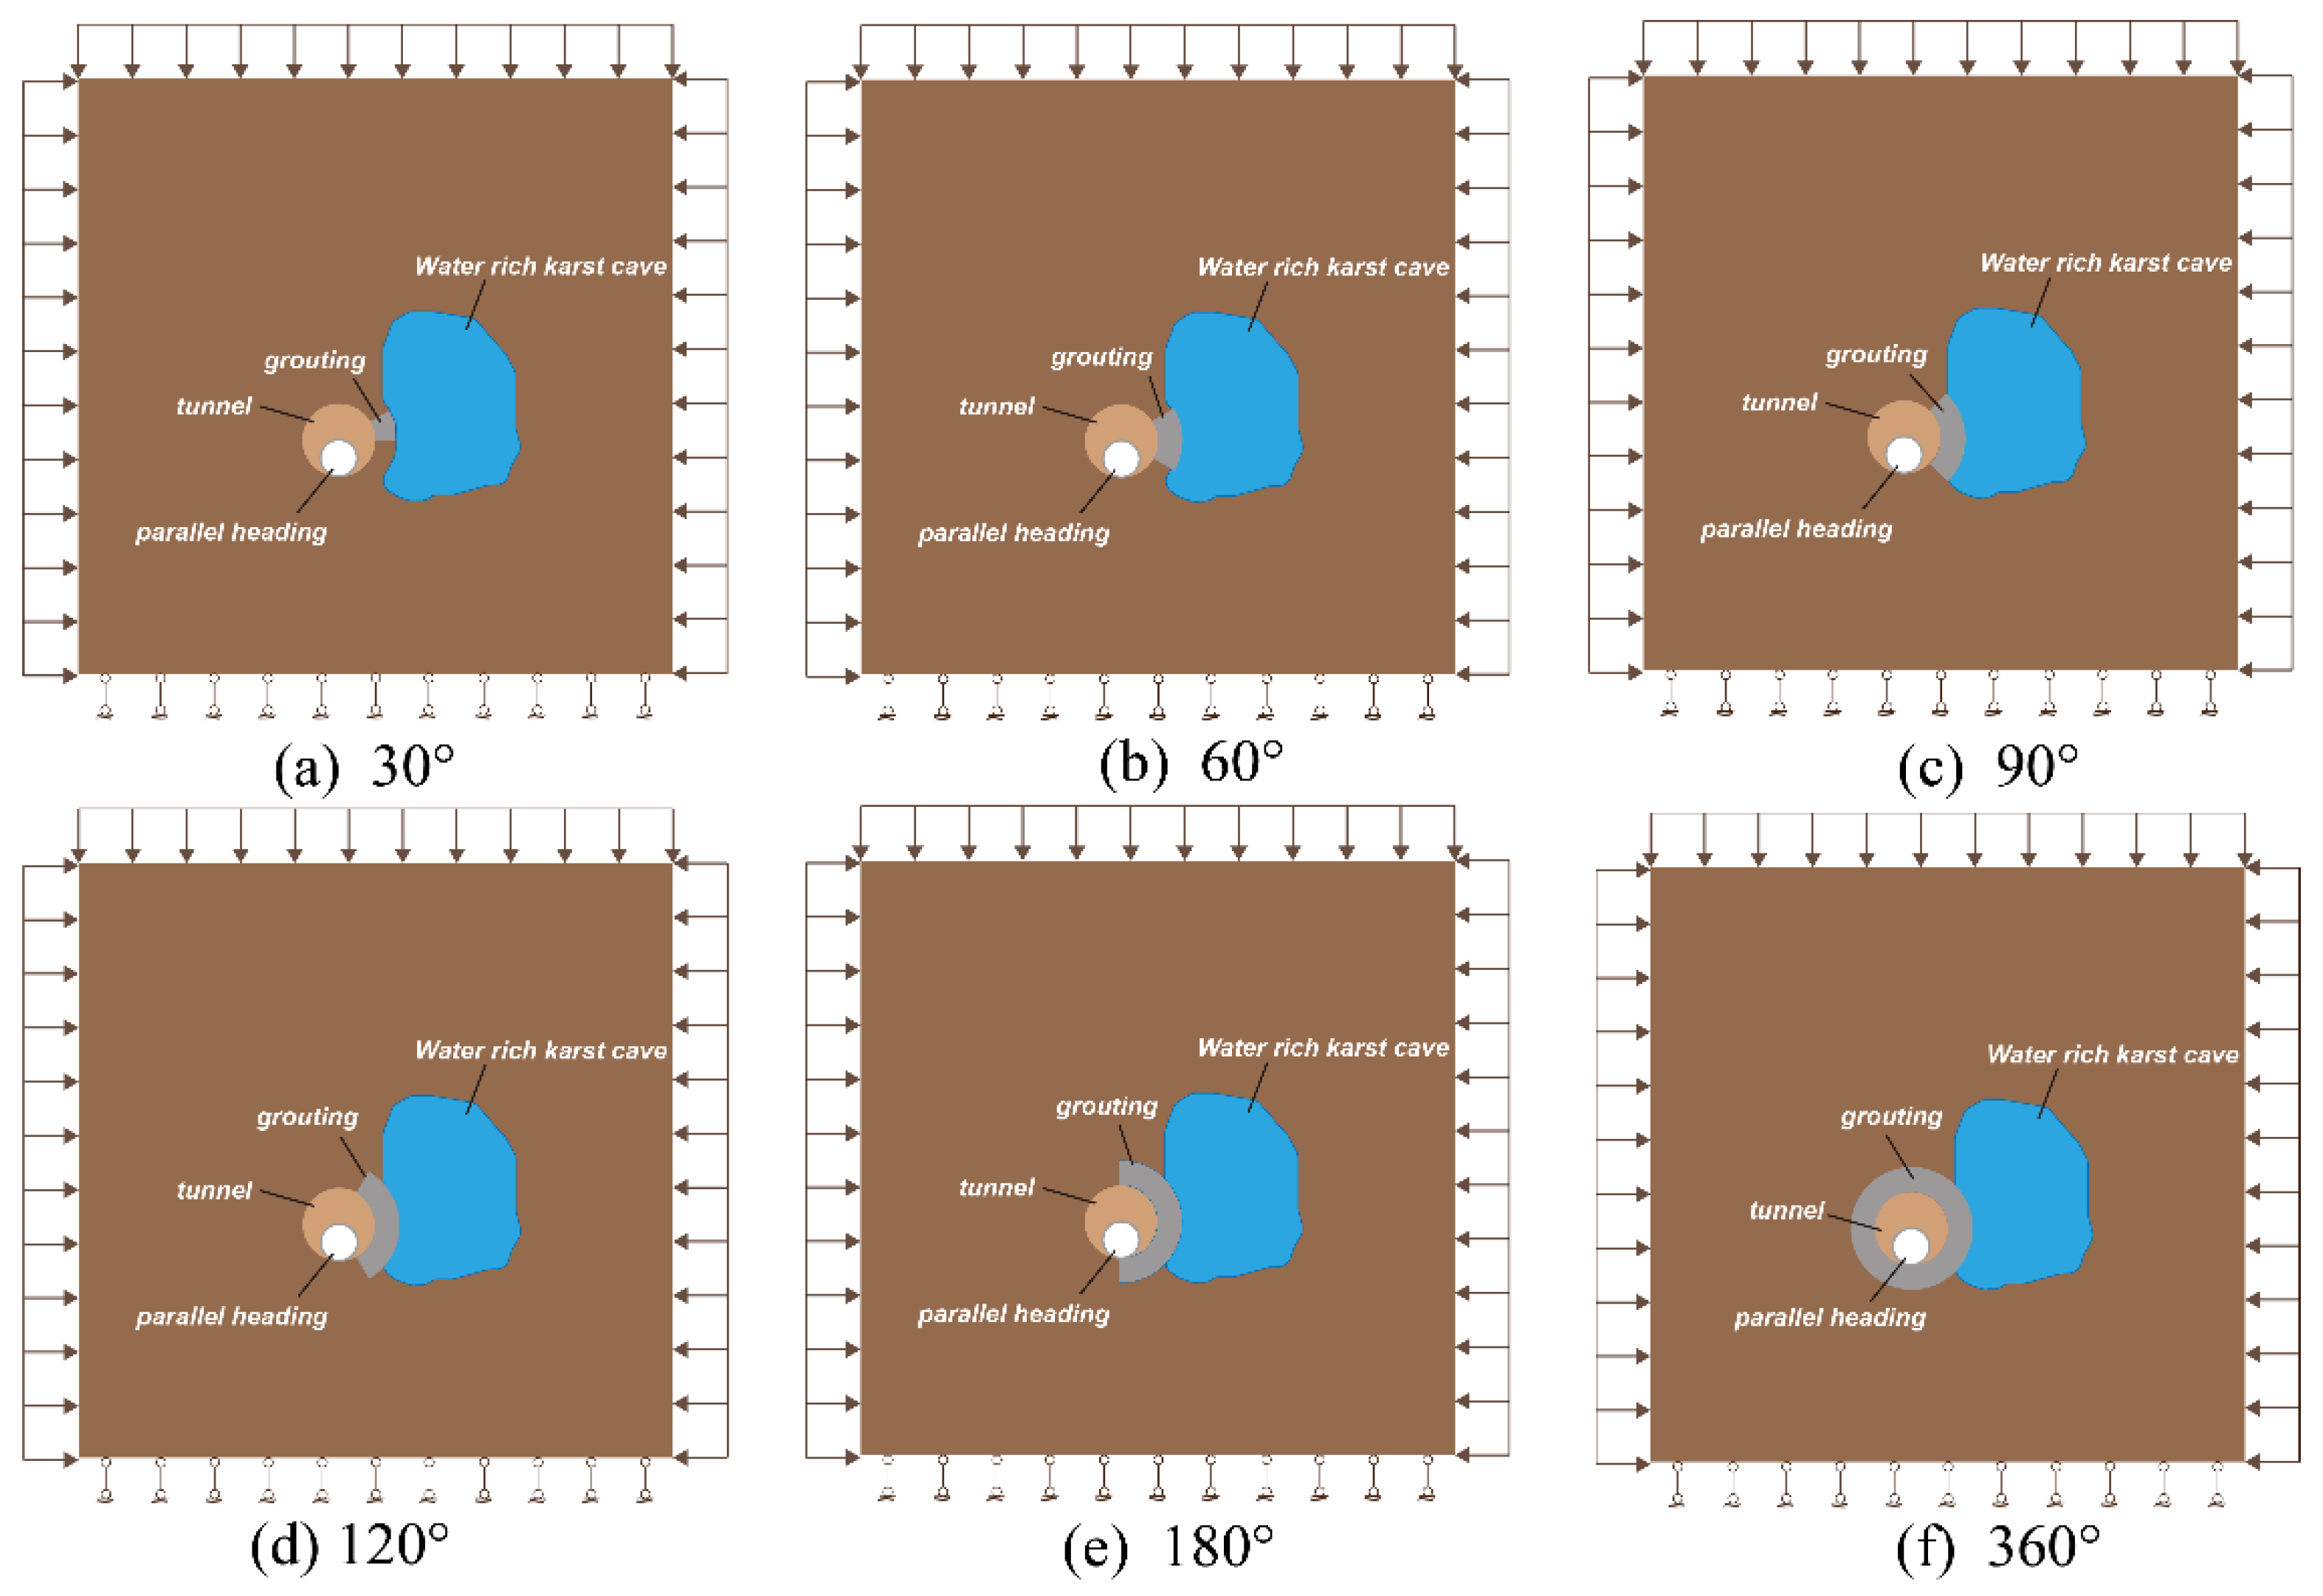
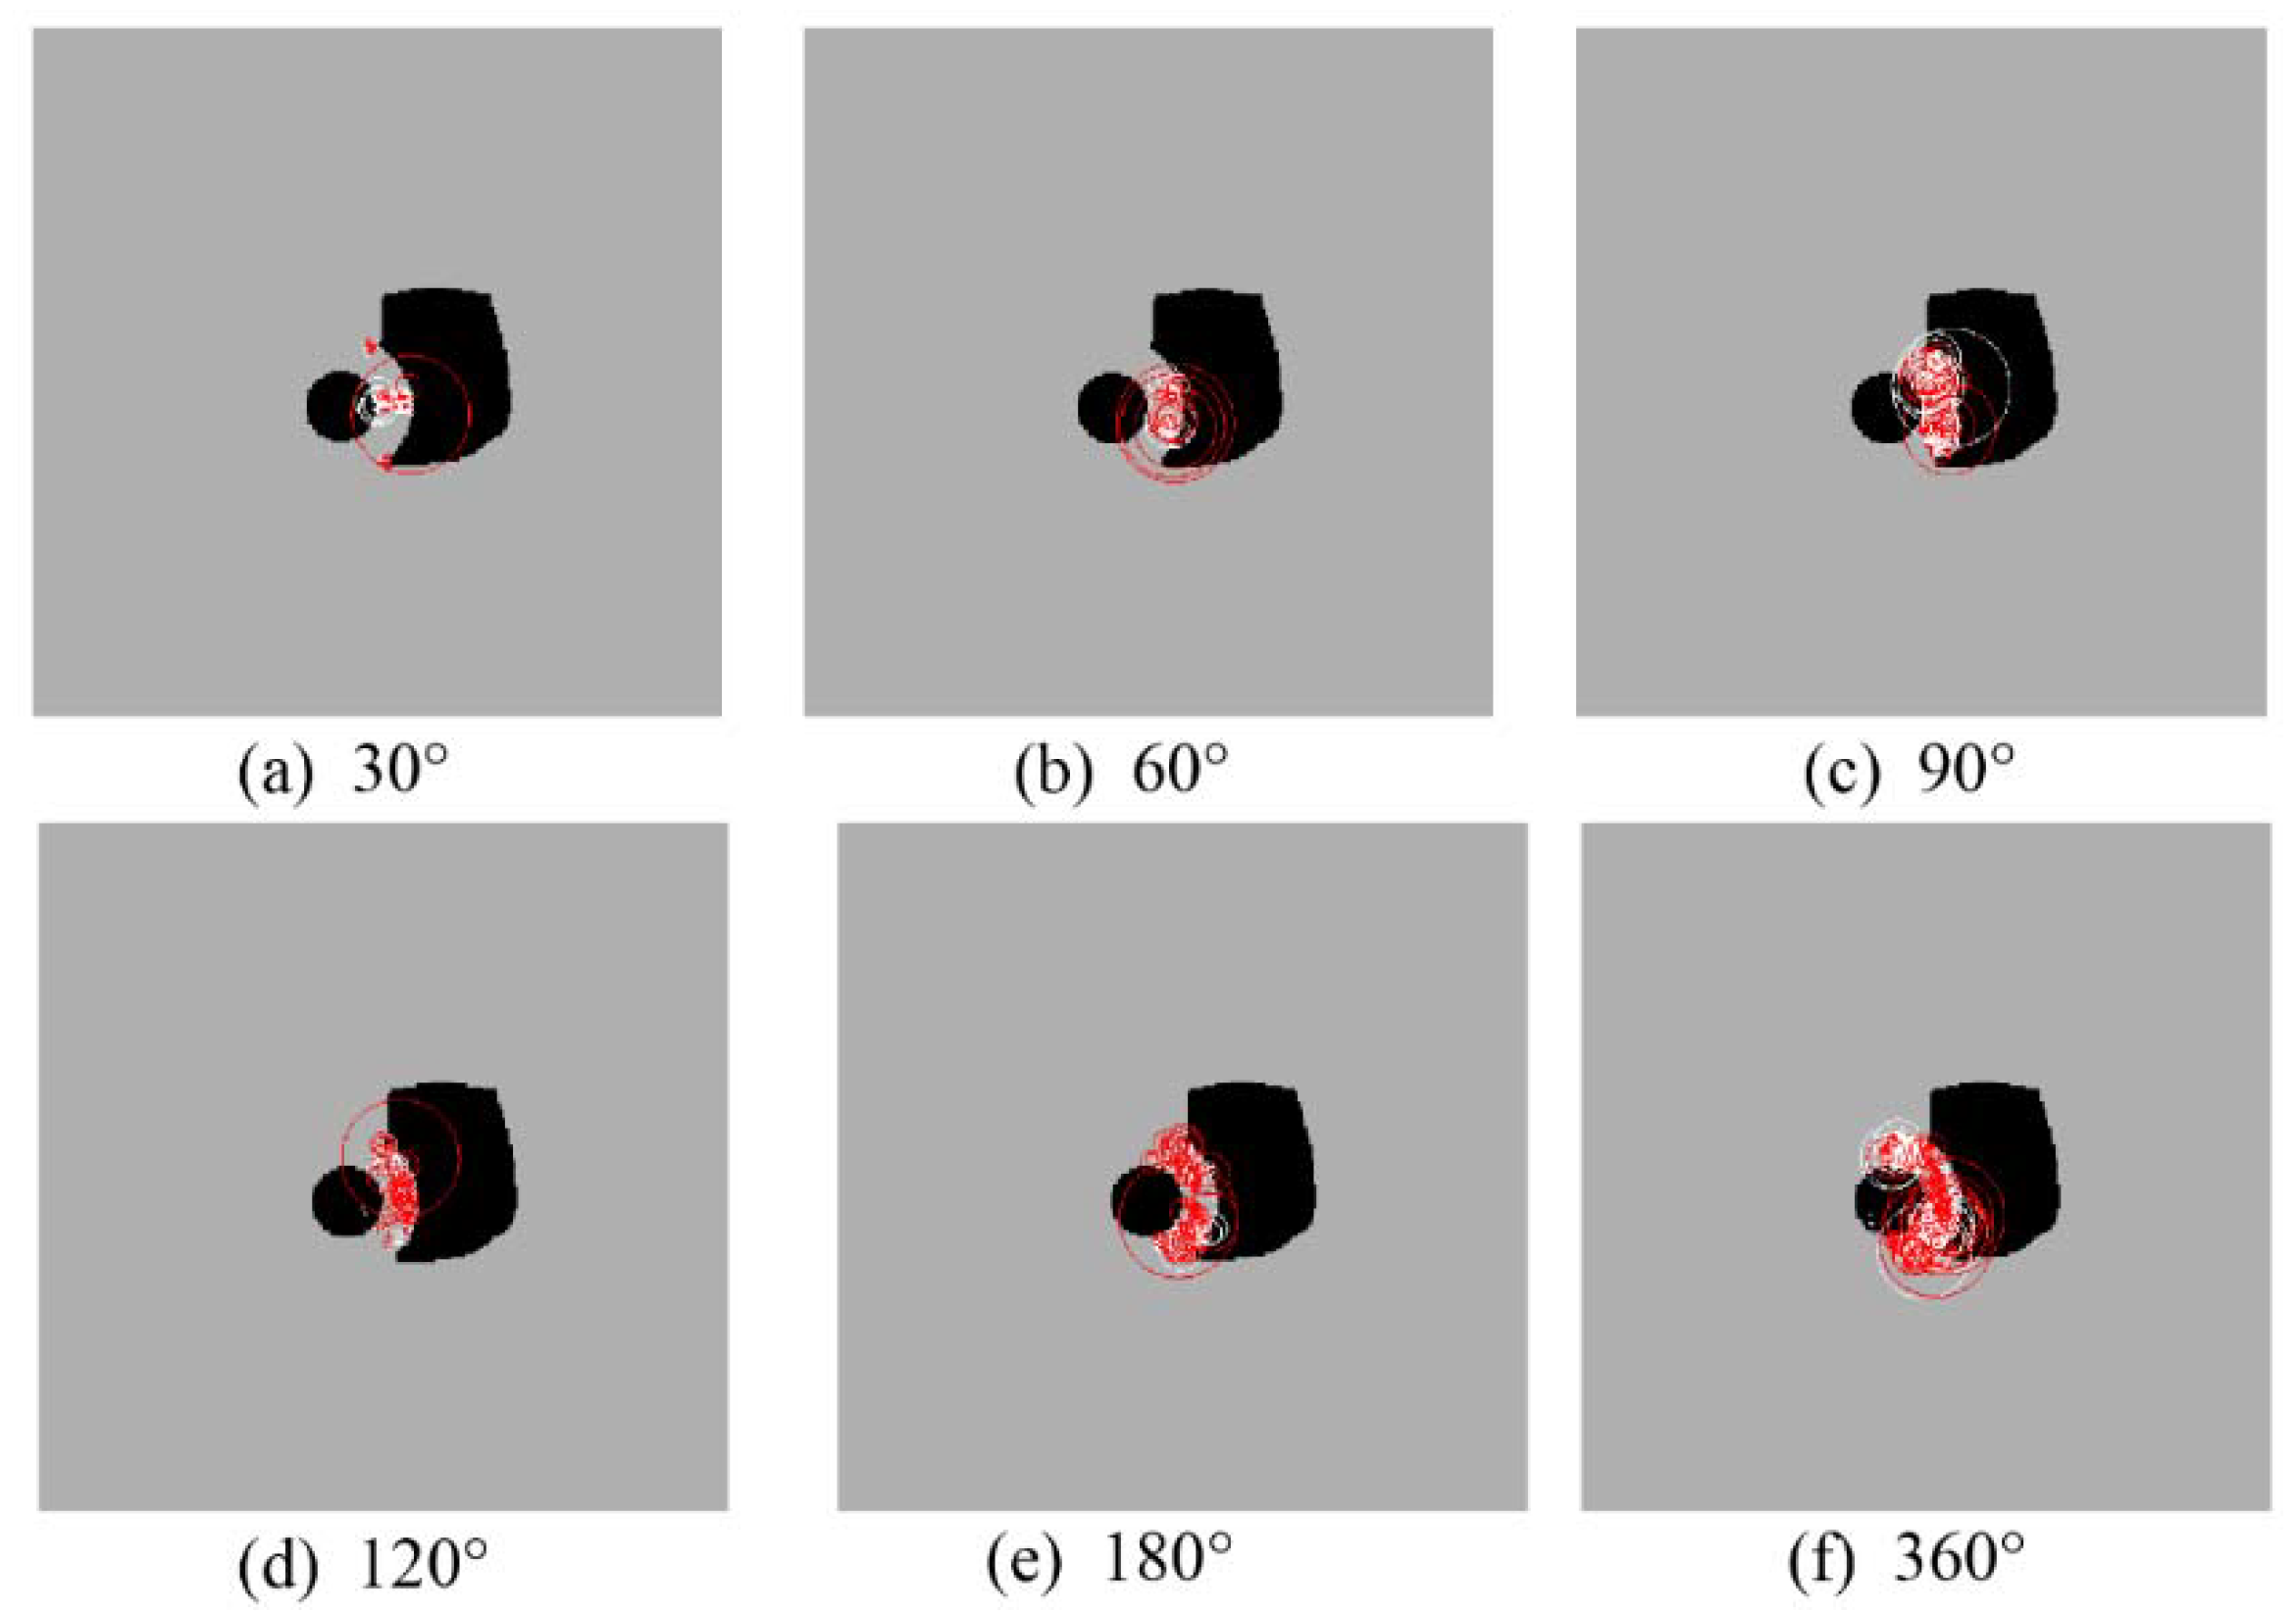
2.3. Influence of Grouting Range on the Effect of Grouting

2.3.1. Establishment of Numerical Calculation Models

Since the location of the cavity is more certain in the actual project, precise grouting can not only save resources but also improve the construction efficiency. Therefore, the calculation model took the circle angle of the grouting reinforcement circle as 30°, 60°, 90°, 120°, 180°, and 360° in order to study the influence of different grouting ranges on the water pressure resistance of the grouting circle. The thickness of the slurry reinforcement circle was taken as 5 m, and the corresponding model is shown in Figure 8. The stratigraphic parameters, model excavation, and cavity water pressure application methods used in the calculations were as described above.

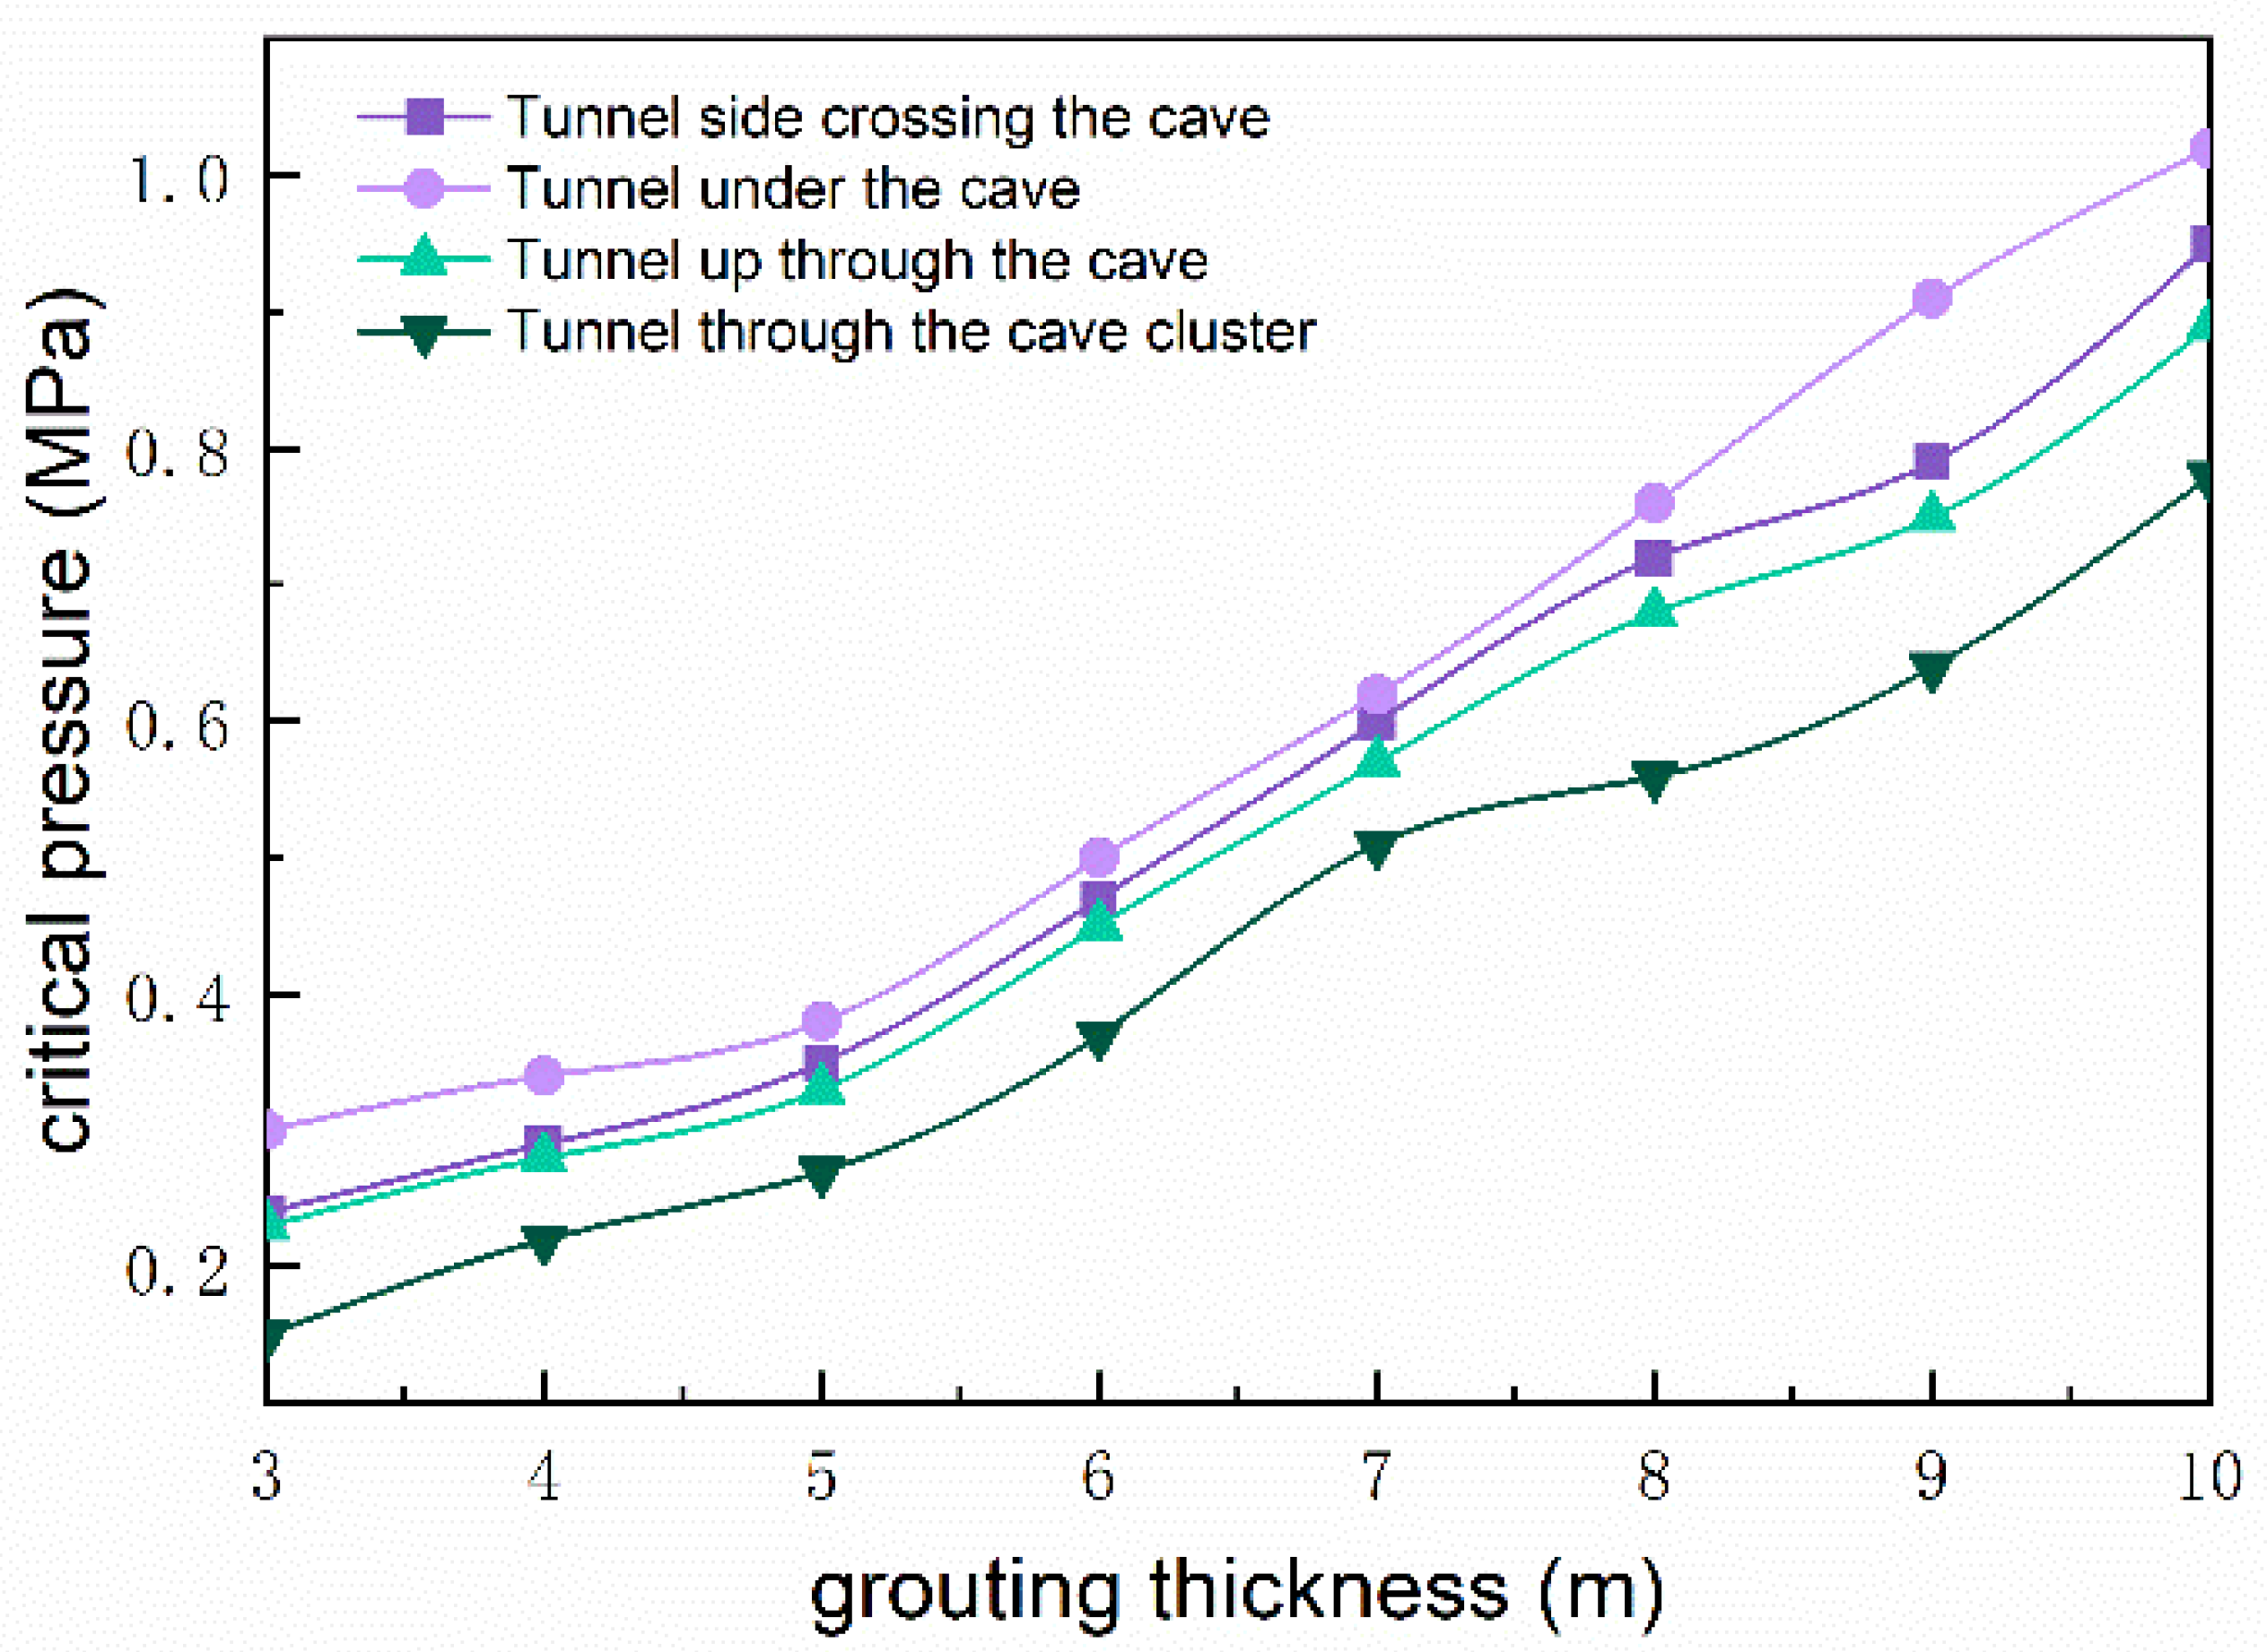
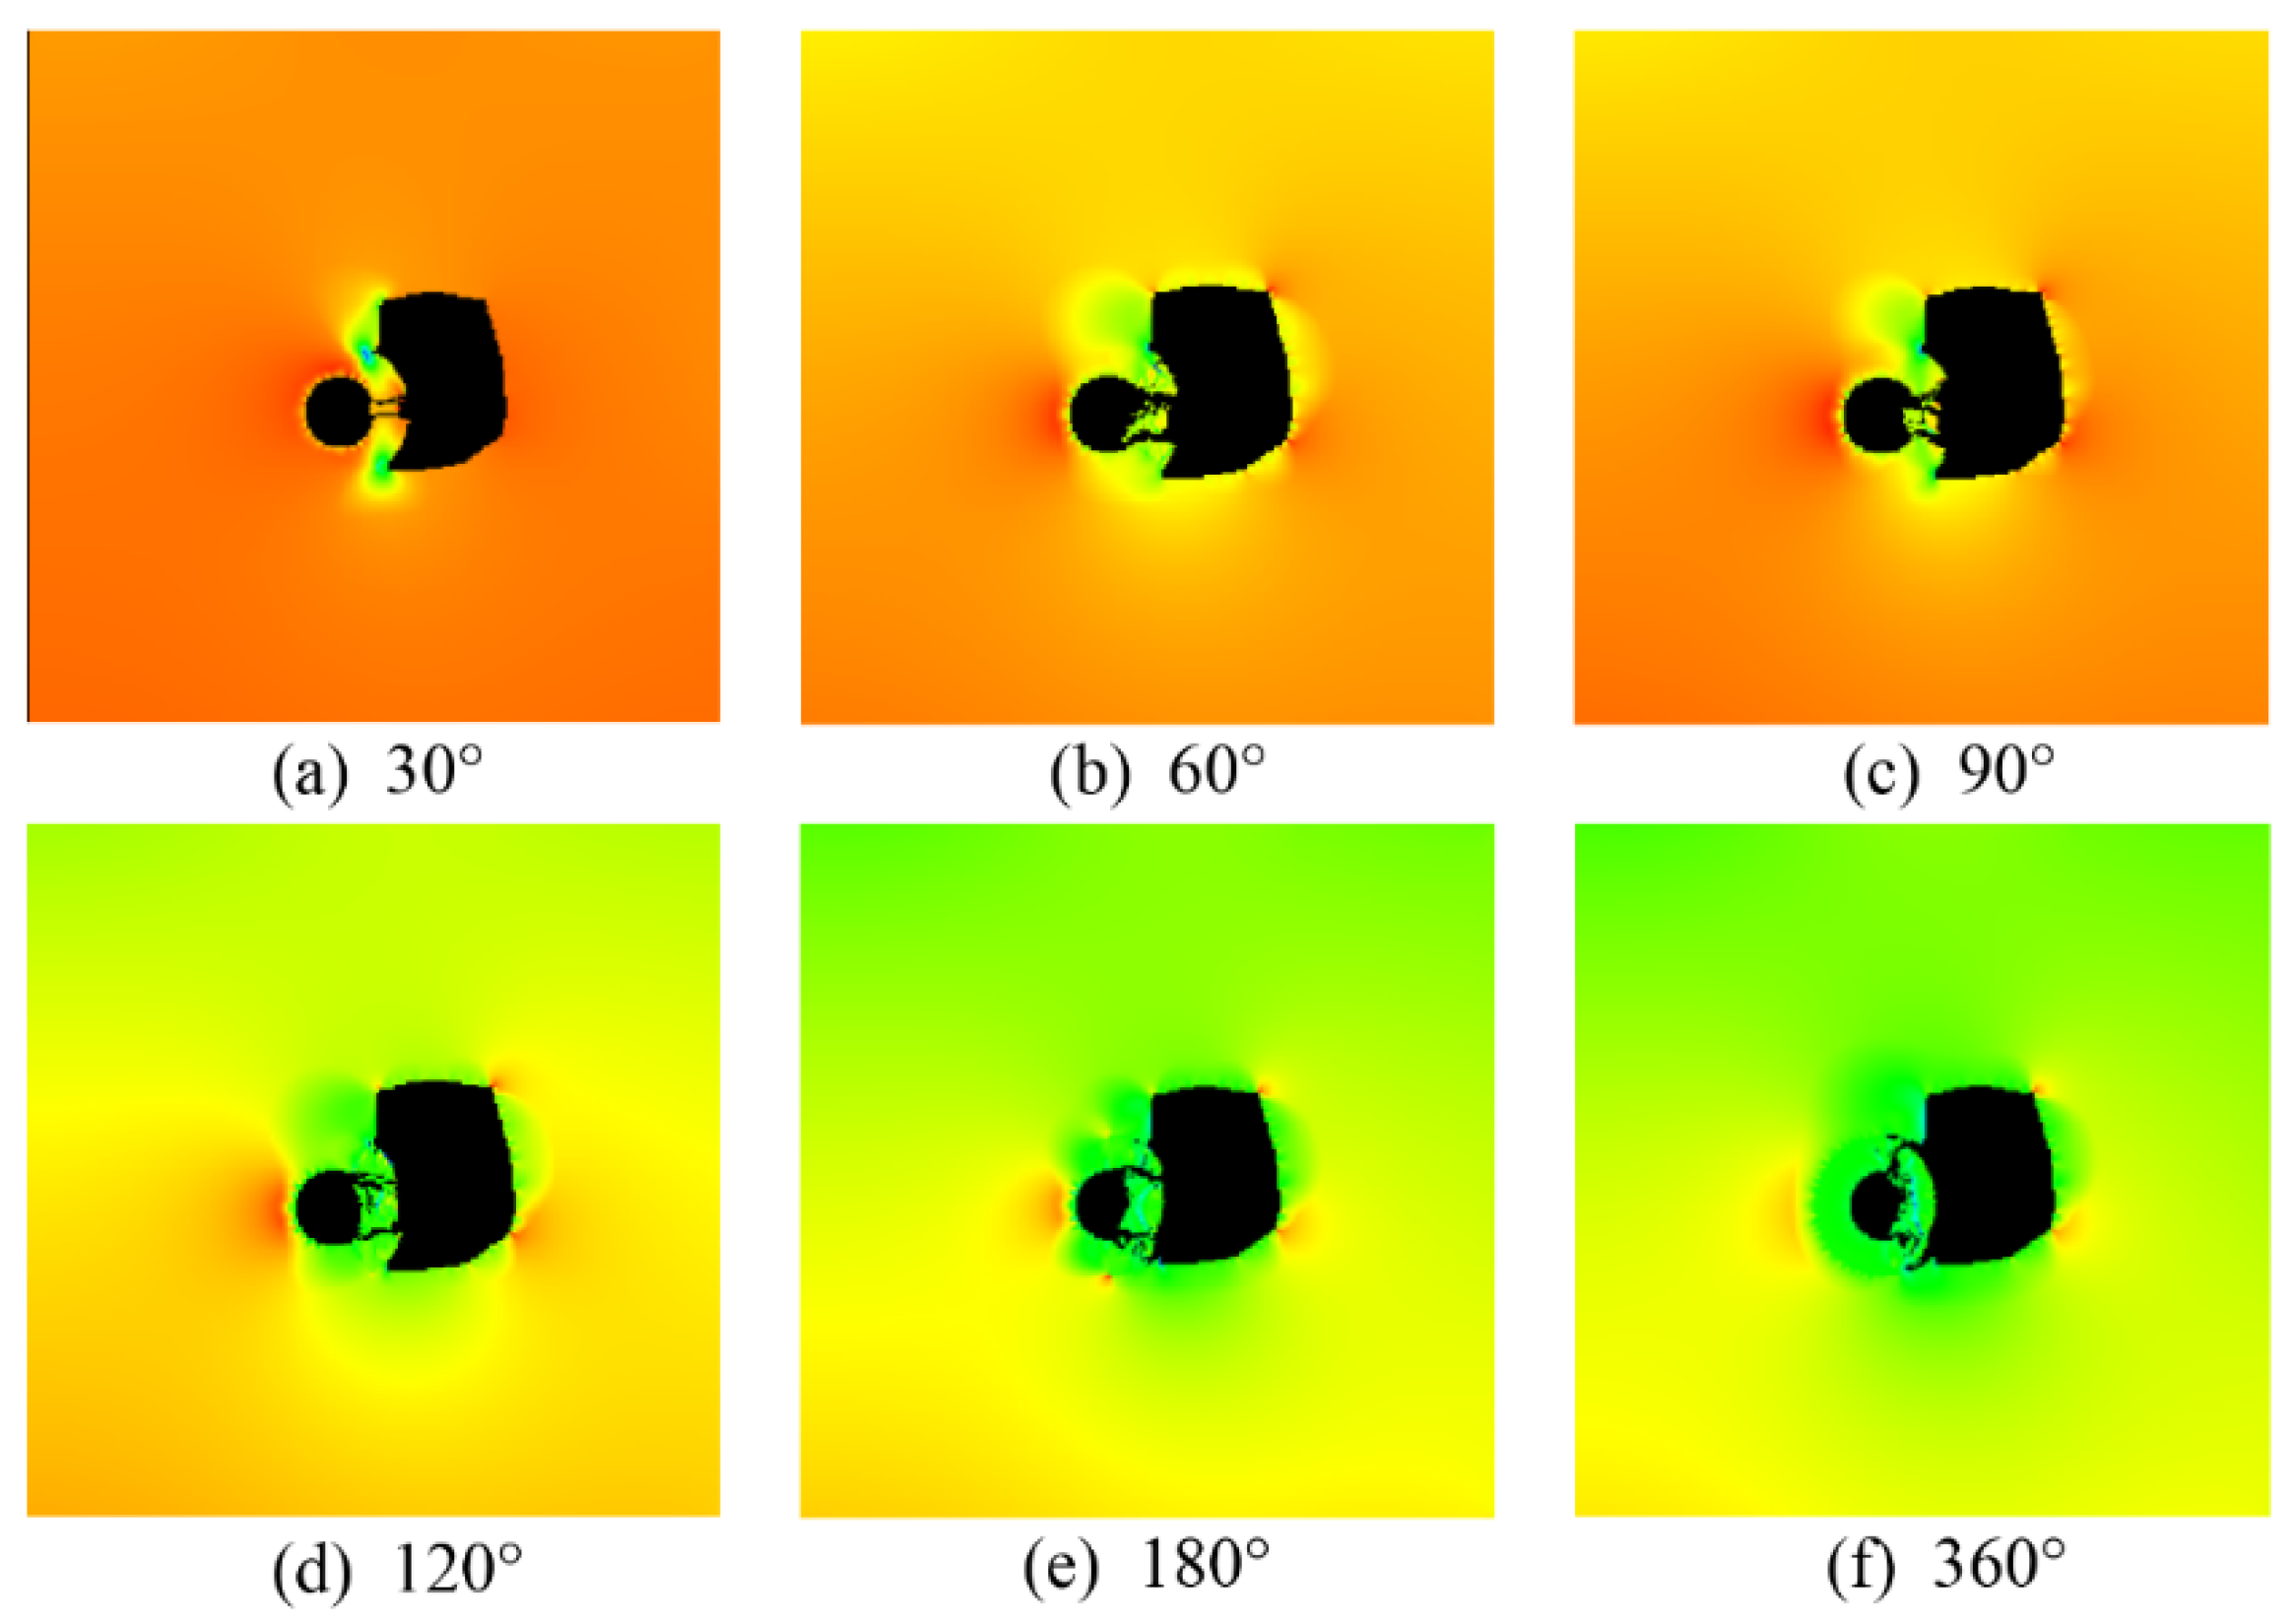
2.3.2. Results of Numerical Calculations

The effect of different grouting reinforcement zones on the hydraulic resistance of the grouted stone body during the tunnel side penetration of the cavern was calculated as shown in Figure 9. From the figure, it can be seen that the damage to the stone body at different grouting angles was dominated by tensile–shear damage, the main cracks of the grouted stone body were sprouted from both ends of the reinforcement circle, and the cracks penetrated the structure. With the increase in the grouting angle range, the location of the cracked stone body expanded to the outer side, and, when the grouting range reached 120°, the crack no longer penetrated, which can be considered as a significant weakening of the effect of cavern water pressure on tunnel safety after this time. From the calculation results of typical acoustic emission of different ranges shown in Figure 10, it can be seen that, as the grouting range increased, the energy generated when the stone body was destroyed under critical water pressure gradually increased, and there were more tensile and shear damage units. The damage of the grouting circle at this time tended to have a greater disturbance toward the stable surrounding rock, which indicated that the effect on the tunnel stability after the destruction of the grouted stone body with stronger resistance to water pressure is often greater and needs to be focused on during construction.
According to the calculation results, the water pressure resistance of different grouting reinforced areas was analyzed, and the water pressure resistance and damage characteristics of the stone body under various grouting reinforced areas were compared, as shown in Figure 11. It can be found that a larger extent of the grouting reinforcement zone led to a better the effect of grouting stone reinforcement. When the grouting range was enlarged to the extent that the tunnel was separated from the karst, while continuing to increase the range of the grouting reinforcement zone, the effect on improving the water pressure resistance of the grouted stone body was weak. Compared with the calculation results of the 180° grouting reinforcement area and 360° grouting reinforcement area, it can be seen that, for the case of the adopted side cavity calculation, the 180° grouting range and 360° grouting range had no significant effect on the improvement of the karst body’s hydraulic resistance. Therefore, in the actual project, there is no need to grout the side cavities of the tunnel without cavity distribution, and single-side grouting can meet the safety requirements.

3. Analysis of the Safety Thickness of Composite Surrounding Rock in Tunnels Crossing High-Pressure Karst Caves

In karst tunnel construction, when the tunnel crosses the cave influenced area, the safety distance between the tunnel and the hidden cave and the safety thickness of the rock plate in front of the palm face are the key issues to be solved in karst tunnel construction. In this study, in the existing parallel heading expansion construction, the safety thickness of the palm face in front of the rock pan was not considered; focusing on the safety of the surrounding rock structure between the tunnel and the cavity, a greater safety thickness of the surrounding rock would lead to a better stability. When the safety thickness of the surrounding rock between the tunnel and the surrounding cavity is not enough, the surrounding rock can be grouted and reinforced, and the surrounding rock and grouted stone body can act as a composite surrounding rock for the safety thickness of the anti-surge study.

3.1. Failure Characteristics of Surrounding Rock with Grouting in Tunnel Crossing the High-Pressure Karst Cave

3.1.1. Establishment of the Numerical Calculation Model

In order to study the hydraulic resistance of the composite structure formed by the grouting circle and the remaining surrounding rock near the tunnel, the following model was established: it was assumed that, after the parallel heading expansion, 3 m thick surrounding rock remained between the tunnel and the side hidden cavity. At this point, the safety thickness of the surrounding rock may not have been sufficient, and the cavity filling needed to be reinforced with grout before the parallel heading expansion. The thickness of grouting reinforcement was 5 m; hence, the 3 m thick surrounding rock and 5 m thick grouted rock body could be regarded as a composite surrounding rock after the parallel heading expansion, and the cavity could be simplified as a water-bearing cavity to carry out a simulation study of the composite surrounding rock’s resistance to water pressure. The model is schematically shown in Figure 12. The stratigraphic parameters, model excavation, and cavity water pressure application methods used in the calculations were as described above.

3.1.2. Results of Numerical Calculations

According to the numerical simulation calculation results, the damage pattern diagrams of typical steps were extracted as shown in Figure 13, corresponding to steps 1-1 (0.1 MPa), 2-1 (0.11 MPa), 90-2 (1.0 MPa), 110-1 (1.2 MPa), 210-1 (2.2 MPa), 210-2 (2.2 MPa), 210-6 (2.2 MPa), and 210-9 (2.2 MPa). Observing the figure, it can be found that, because the initial state of the cavity had 0.1 MPa water pressure, there were circular stress zones distributed before the excavation of the existing parallel heading and around the cavity, and no crack expansion of the composite surrounding rock between the cavity and the parallel heading occurred at this time. After the construction of the existing parallel heading expansion, the original stress balance around the tunnel was broken, and stress redistribution appeared around the tunnel. Furthermore, the composite surrounding rock showed a very obvious stress concentration and finally reached a new stress equilibrium state under the repeated coupling effect of force and flow fields. With the increased water pressure inside the cave, it can be found that a micro-crack had sprouted in the outer layer of the composite surrounding rock of the grouted stone body, and, with the further increase in the stress concentration in the grouted stone body, a macroscopic crack had extended through to the inner layer of the composite surrounding rock body. At this time, the cavity water pressure acted on the surrounding rock through the crack. Then, with the continuous increase in the water pressure in the cavity, the main crack connecting the bottom of the cavity and the bottom of the tunnel arch was extended through. Finally, the whole composite surrounding rock body collapsed to the interior of the tunnel.
The acoustic emission of the typical loading step obtained from the calculation is shown in Figure 14. As can be seen from the figure, after the parallel heading was just expanded to form the tunnel, the composite surrounding rock structure was intact, and the acoustic emission energy was weak. With the increasing water pressure in the cavity, the acoustic emission energy gradually accumulated. When the water pressure in the cavity rose to 1.0 MPa, the grouted stone body in the outer layer of the composite surrounding rock started to appear as a compression shear unit, and the distribution of the pressurized unit expanded along the cavity toward the tunnel. This feature was reflected in the minimum principal stress diagram as cracks started to appear in the grouted stone body and started to sprout from the inside of the cavity toward the tunnel. Then, as the water pressure in the cavity rose further, the number of compression–shear units on the grouted stone body increased dramatically, reflecting that the structure was being damaged at this time. Eventually, the grouted stone body was damaged, and the water pressure in the cavity acted on the inner layer of the composite surrounding rock body along the fracture of the grouted stone body, which appeared as a tensile–shear damage unit. For the above model, when the water pressure in the cavity reached 2.2 MPa, the surrounding rock body was damaged, and the crack at this time was mainly caused by the tensile–shear damage.

3.2. Analysis of Tunnel Safety Thickness for Different Calculation Cases

The New Austrian Tunneling Method believes in giving full play to the self-stabilizing ability of the surrounding rock and considers the surrounding rock as an integral part of the tunnel composite structure. Therefore, the structural safety thickness analysis should include the safety thickness analysis of the surrounding rock, the safety thickness analysis of the surrounding rock plus slurry body (composite surrounding rock), and the safety thickness analysis of the liner plus surrounding rock plus slurry body (composite structure).

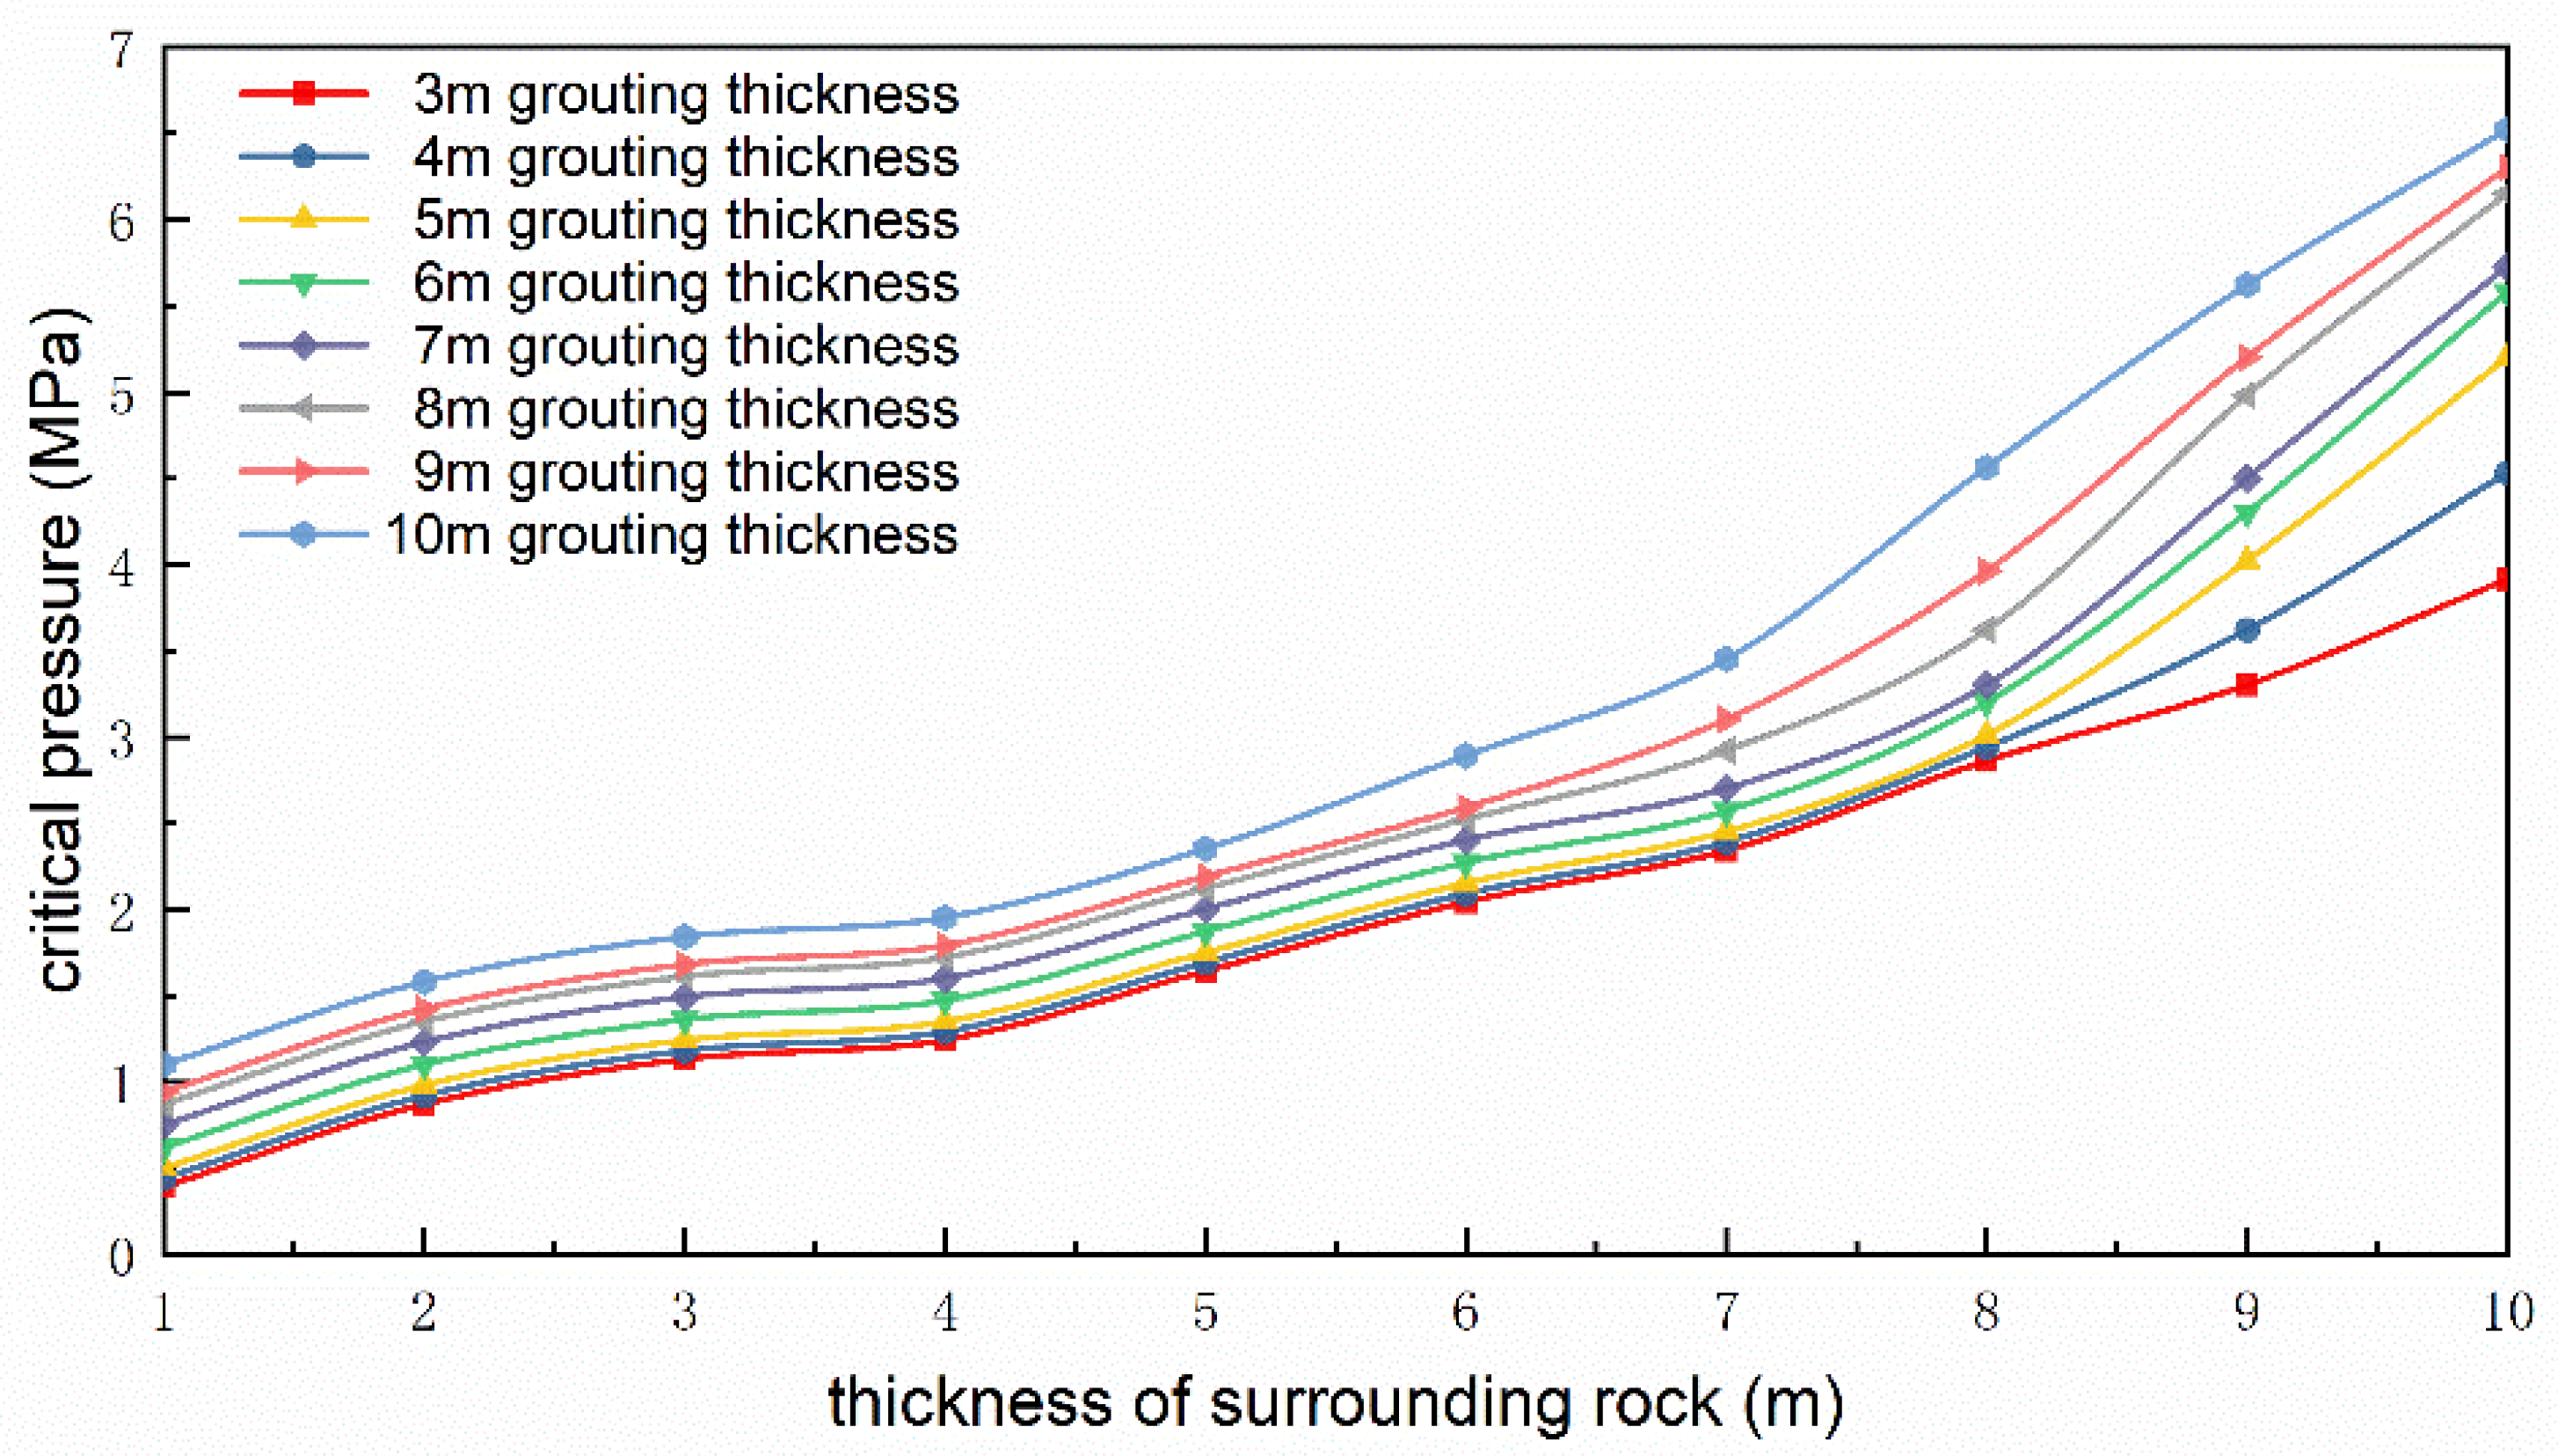
3.2.1. Analysis of Safety Thickness of the Surrounding Rock

For the case of the hidden cavity on the side of the tunnel, the safety thickness of the surrounding rock was analyzed by the above model. The calculation results are shown in Figure 15, from which it can be seen that the surrounding rock thickness of 1 m could only resist 0.2 MPa water pressure, and the surrounding rock thickness of 2 m could already resist 0.6 MPa water pressure, which doubled the thickness of the surrounding rock and increased the resistance to water pressure by three times. When the surrounding rock thickness increased to 10 m, the resistance to water pressure reached 3.1 MPa, compared with the surrounding rock thickness of 1 m, the surrounding rock thickness increased by 10 times, and the resistance to water pressure increased by 15.5 times. The water pressure resistance increased by 15.5 times compared with the 1 m thickness of the surrounding rock. It can be found that a thicker surrounding rock led to a stronger hydraulic resistance. The growth process of this showed a linear trend, and the growth rate was almost a constant. This is because, on the one hand, the thicker surrounding rock body had a greater bearing capacity; on the other hand, the influence range of the cavity would have been weakened with the increase in distance between the cavity and the tunnel.

3.2.2. Analysis of Safety Thickness of the Composite Surrounding Rock

From the research results in Figure 15, it can be seen that, if 3 MPa water pressure was required to be resisted, the surrounding rock thickness needed to reach 10 m, and, when the surrounding rock thickness was less than 10 m after parallel heading expansion, the cavity filling needed to be grouted and reinforced. At this time, the remaining surrounding rock after excavation and the grouted stone body were considered as a whole, the composite surrounding rock safety distance between the tunnel and the surrounding hidden cavity was studied, and the composite surrounding rock safety thickness was calculated together. The calculation model is shown in Figure 12, where the surrounding rock thickness was taken as 1 m, 2 m, 3 m, 4 m, 5 m, 6 m, 7 m, 8 m, 9 m, and 10 m. For each surrounding rock thickness, the numerical simulation calculation of grouting range was carried out separately, and the thickness of grouted cobble body was taken as 3 m, 4 m, 5 m, 6 m, 7 m, 8 m, 9 m, and 10 m, respectively.
The comparison of water pressure resistance of different composite rock thicknesses is shown in Figure 16. As can be seen from the figure, a greater thickness of the surrounding rock and a thicker grouted stone body led to a higher corresponding composite surrounding the rock’s resistance to water pressure capacity. When the thickness of the grouted stone body was certain, the trend of the composite surrounding rock’s resistance as a function of the water pressure capacity increased with the thickness of the surrounding rock, which could be divided into three stages: growth period, stable period, and accelerated period. When the thickness of the surrounding rock was less than 3 m, the composite surrounding rock’s resistance to water pressure capacity increased significantly with the thickness of the surrounding rock. When the thickness of the surrounding rock was 3–4 m, the growth rate of the water pressure resistance curve slowed down; when the thickness of the surrounding rock reached above 4 m, the slope of the water pressure resistance curve gradually increased. After analysis, it can be seen that a greater thickness of the composite surrounding rock led to a stronger water pressure resistance; as the thickness of the composite surrounding rock and the distance between the karst and tunnel increased, the influence of karst became weaker relative to the tunnel.
According to the five locations of observation points shown in the model of Figure 12, the calculated results of pressure at these observation points were extracted to analyze the trend of pressure values at different thicknesses of grouting, and the results are shown in Figure 17. From Figure 17a, it can be seen that with the increase in thickness of grouting, the overall trend of water pressure behind the second lining decreased first and then became stable. When the thickness of grouting increased from 3 m to 5 m, the maximum water pressure at the observation point behind the lining was reduced from 0.3 MPa to 0.04 MPa, after which the water pressure no longer decreased significantly with a further increase in the thickness of grouting. From Figure 17b, it can be seen that, for the earth pressure behind the second lining, the effect of the thickness of grouting on the earth pressure was not obvious. With the increase in thickness of grouting from 3 m to 10 m, the earth pressure at all observation points always fluctuated around a stable value, which may be due to the fact that the self-weight load generated by the rock was basically carried by itself after being reinforced, and the self-supporting capacity of the surrounding rock was given full play at this time. To summarize the results, it is recommended that a grouting thickness of 5 m selected for site construction can effectively reduce the pressure behind the second lining. At this time, the numerical calculation results showed that the water pressure behind the second lining of the arch was about 0.025 MPa, and the water pressure of the left and right arch foot was 0.03 MPa and 0.04 MPa, respectively, while the earth pressure at the top of the arch was about 0.4 MPa, the earth pressure at the left and right arch foot was about 0.04 MPa and 0.035 MPa, and the earth pressure at the left and right arch waist was about 0.2 MPa and 0.16 MPa, respectively.

3.2.3. Analysis of Safety Thickness of the Composite Structure

Unlike hydraulic tunnels, railroad and highway tunnels also need to maintain a dry and water-free operating environment. Taking the New Yuanliang Mountain Tunnel side-passing cavern as an example, when there is no remaining surrounding rock between the tunnel expansion and the cavity, only the grouted stone body resists the water pressure in the cavity; when the rainy season comes, the water pressure in the cavity may increase. In order to ensure the safety of construction, in addition to grouting reinforcement outside the outline of the tunnel expansion, it was also necessary to first apply a temporary second lining structure; at this time, the temporary second lining, the initial support, and the grouted stone body were considered as a composite structure, and the resistance to water pressure was studied. In the numerical calculation model, the thickness of the grouted stone body was 5 m, the thickness of the primary support was 0.2 m, and the thickness of the second lining was varied as 0 m, 0.4 m, 0.8 m, 1.0 m, and 1.2 m. The stratigraphic parameters, model excavation, and cavity water pressure application methods used in the calculations were as described above.
Numerical simulations were conducted to study the hydraulic pressure resistance of the composite structure at different secondary lining thicknesses, and the results are shown in Table 2. Comparing the new results with the old results, it can be found that the composite structure could be increased from 0.35 MPa to 0.68 MPa by applying only the initial support structure in the case of 5 m thickness of the grouted stone body at the tunnel periphery, which was 1.94 times higher than before. The application of initial support and secondary lining can greatly improve the water pressure resistance of the tunnel structure and grouting reinforcement circle. It can be found that a larger lining thickness led to a stronger composite structure resistance to water pressure; when the secondary lining thickness reached 1.2 m, the composite structure’s resistance to water pressure could be increased to 4.44 MPa.

4. Engineering Application

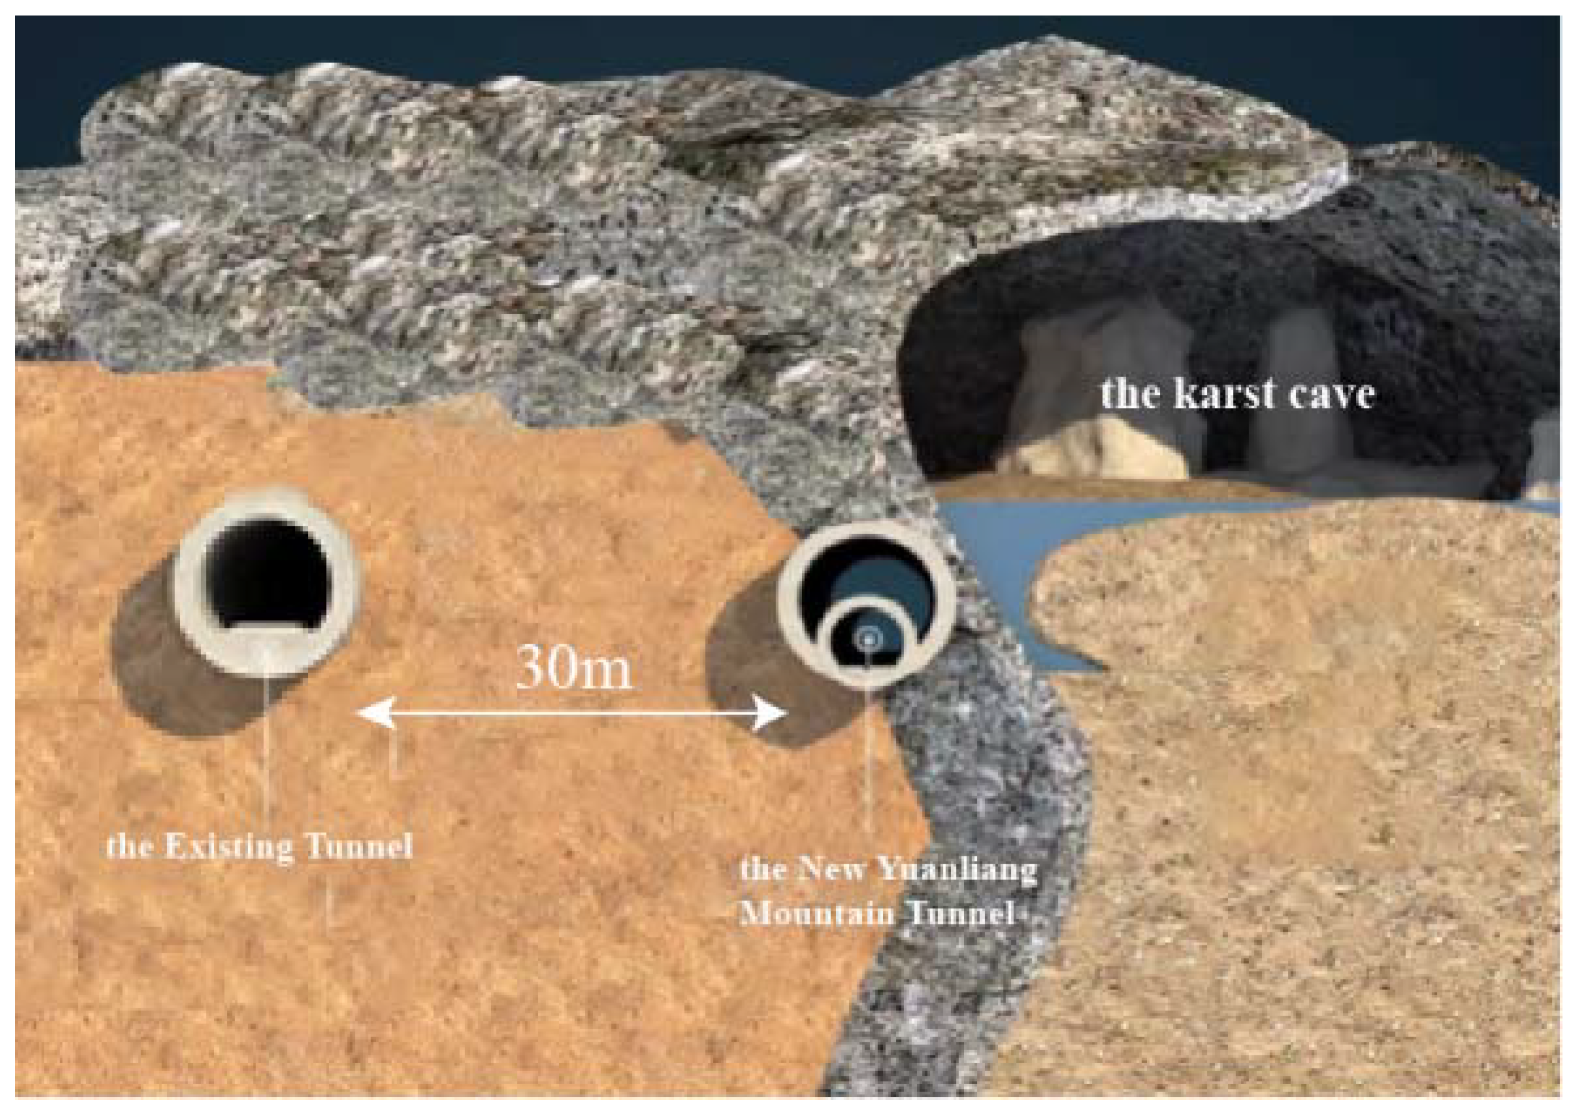
4.1. Project Overview

The New Yuanliang Mountain Tunnel is a tunnel project formed by expanding the existing parallel heading of the established Yuanliang Mountain Tunnel on the Yuhuai I-line. The maximum depth of burial is about 774 m, with a total length of 11.1 km. the clearance size of the parallel heading is 4 m × 4 m, and the size of the expanded tunnel section is 7 m × 10 m. The lithology of the strata in this section is mainly carbonated rocks and clastic rocks deposited in the Paleozoic and Mesozoic, with a loose accumulation of the Fourth Series accounting for some. The tunnel continuously crosses the Mao Ba slope and Tong Ma Ling back slope. The karst cave is located in the core of the Mao Ba slope, 3060 m from the entrance, 60 m long, and 579 m deep. The cave is characterized by obvious dissolution fissures and large water surges, with a strong correlation between water pressure and surface rainfall. The cavity filler is powder clay and clayey fine sand, with poor self-stabilization ability. The main difficulty of the project is that the tunnel main cavern suffers from a cavern water pressure of about 3.013 MPa, and the cavern area parallel heading expansion can lead to no remaining surrounding rock between the tunnel and the surrounding hidden cavern or an insufficient safety thickness of the surrounding rock. Therefore, there is a great risk of sudden water and mud. The cross-section of the tunnel and cave location is shown in Figure 18.

4.2. Construction Plan for Excavation Expansion

Through the above numerical calculation of the hydraulic resistance of the grouted stone body, the final determination of the thickness of the grouting circle in the high-pressure water-rich karst section of the New Yuanliang Mountain tunnel was 5 m, and, for the lateral cavities, only single-side curtain grouting was required. In order to improve the safety of the tunnel through the cavern section in the rainy season, a 0.4 m temporary secondary lining was applied to the core section of the tunnel through the karst cave before the onset of the rainy season.
In addition, in order to find a suitable solution for the parallel heading expansion, the settlement differences between the tunnel during the construction of the center cross diaphragm method (CRD) and center diaphragm method (CD) were compared and analyzed by numerical calculations, and the characteristics of the construction steps of both are shown in Figure 19. The calculation results are shown in Figure 20, revealing that the maximum amount of settlement deformation in the monitored section was 8.64 mm and the maximum horizontal convergence deformation was 2.52 mm when the CRD method was adopted for excavation expansion. However, the maximum amount of settlement deformation in the monitored section was 12.28 mm and the maximum horizontal convergence deformation was 5.86 mm when the CD method was adopted. It is obvious that the CRD method restricted the displacement of the surrounding rock and controlled the plastic zone of the surrounding rock more effectively by turning the excavation surface into zero and reducing the area of one excavation at the palm face. According to the characteristics of the New Yuanliang Mountain tunnel project, the CRD method was finally selected for the tunnel construction of the cavern section from a safety point of view.

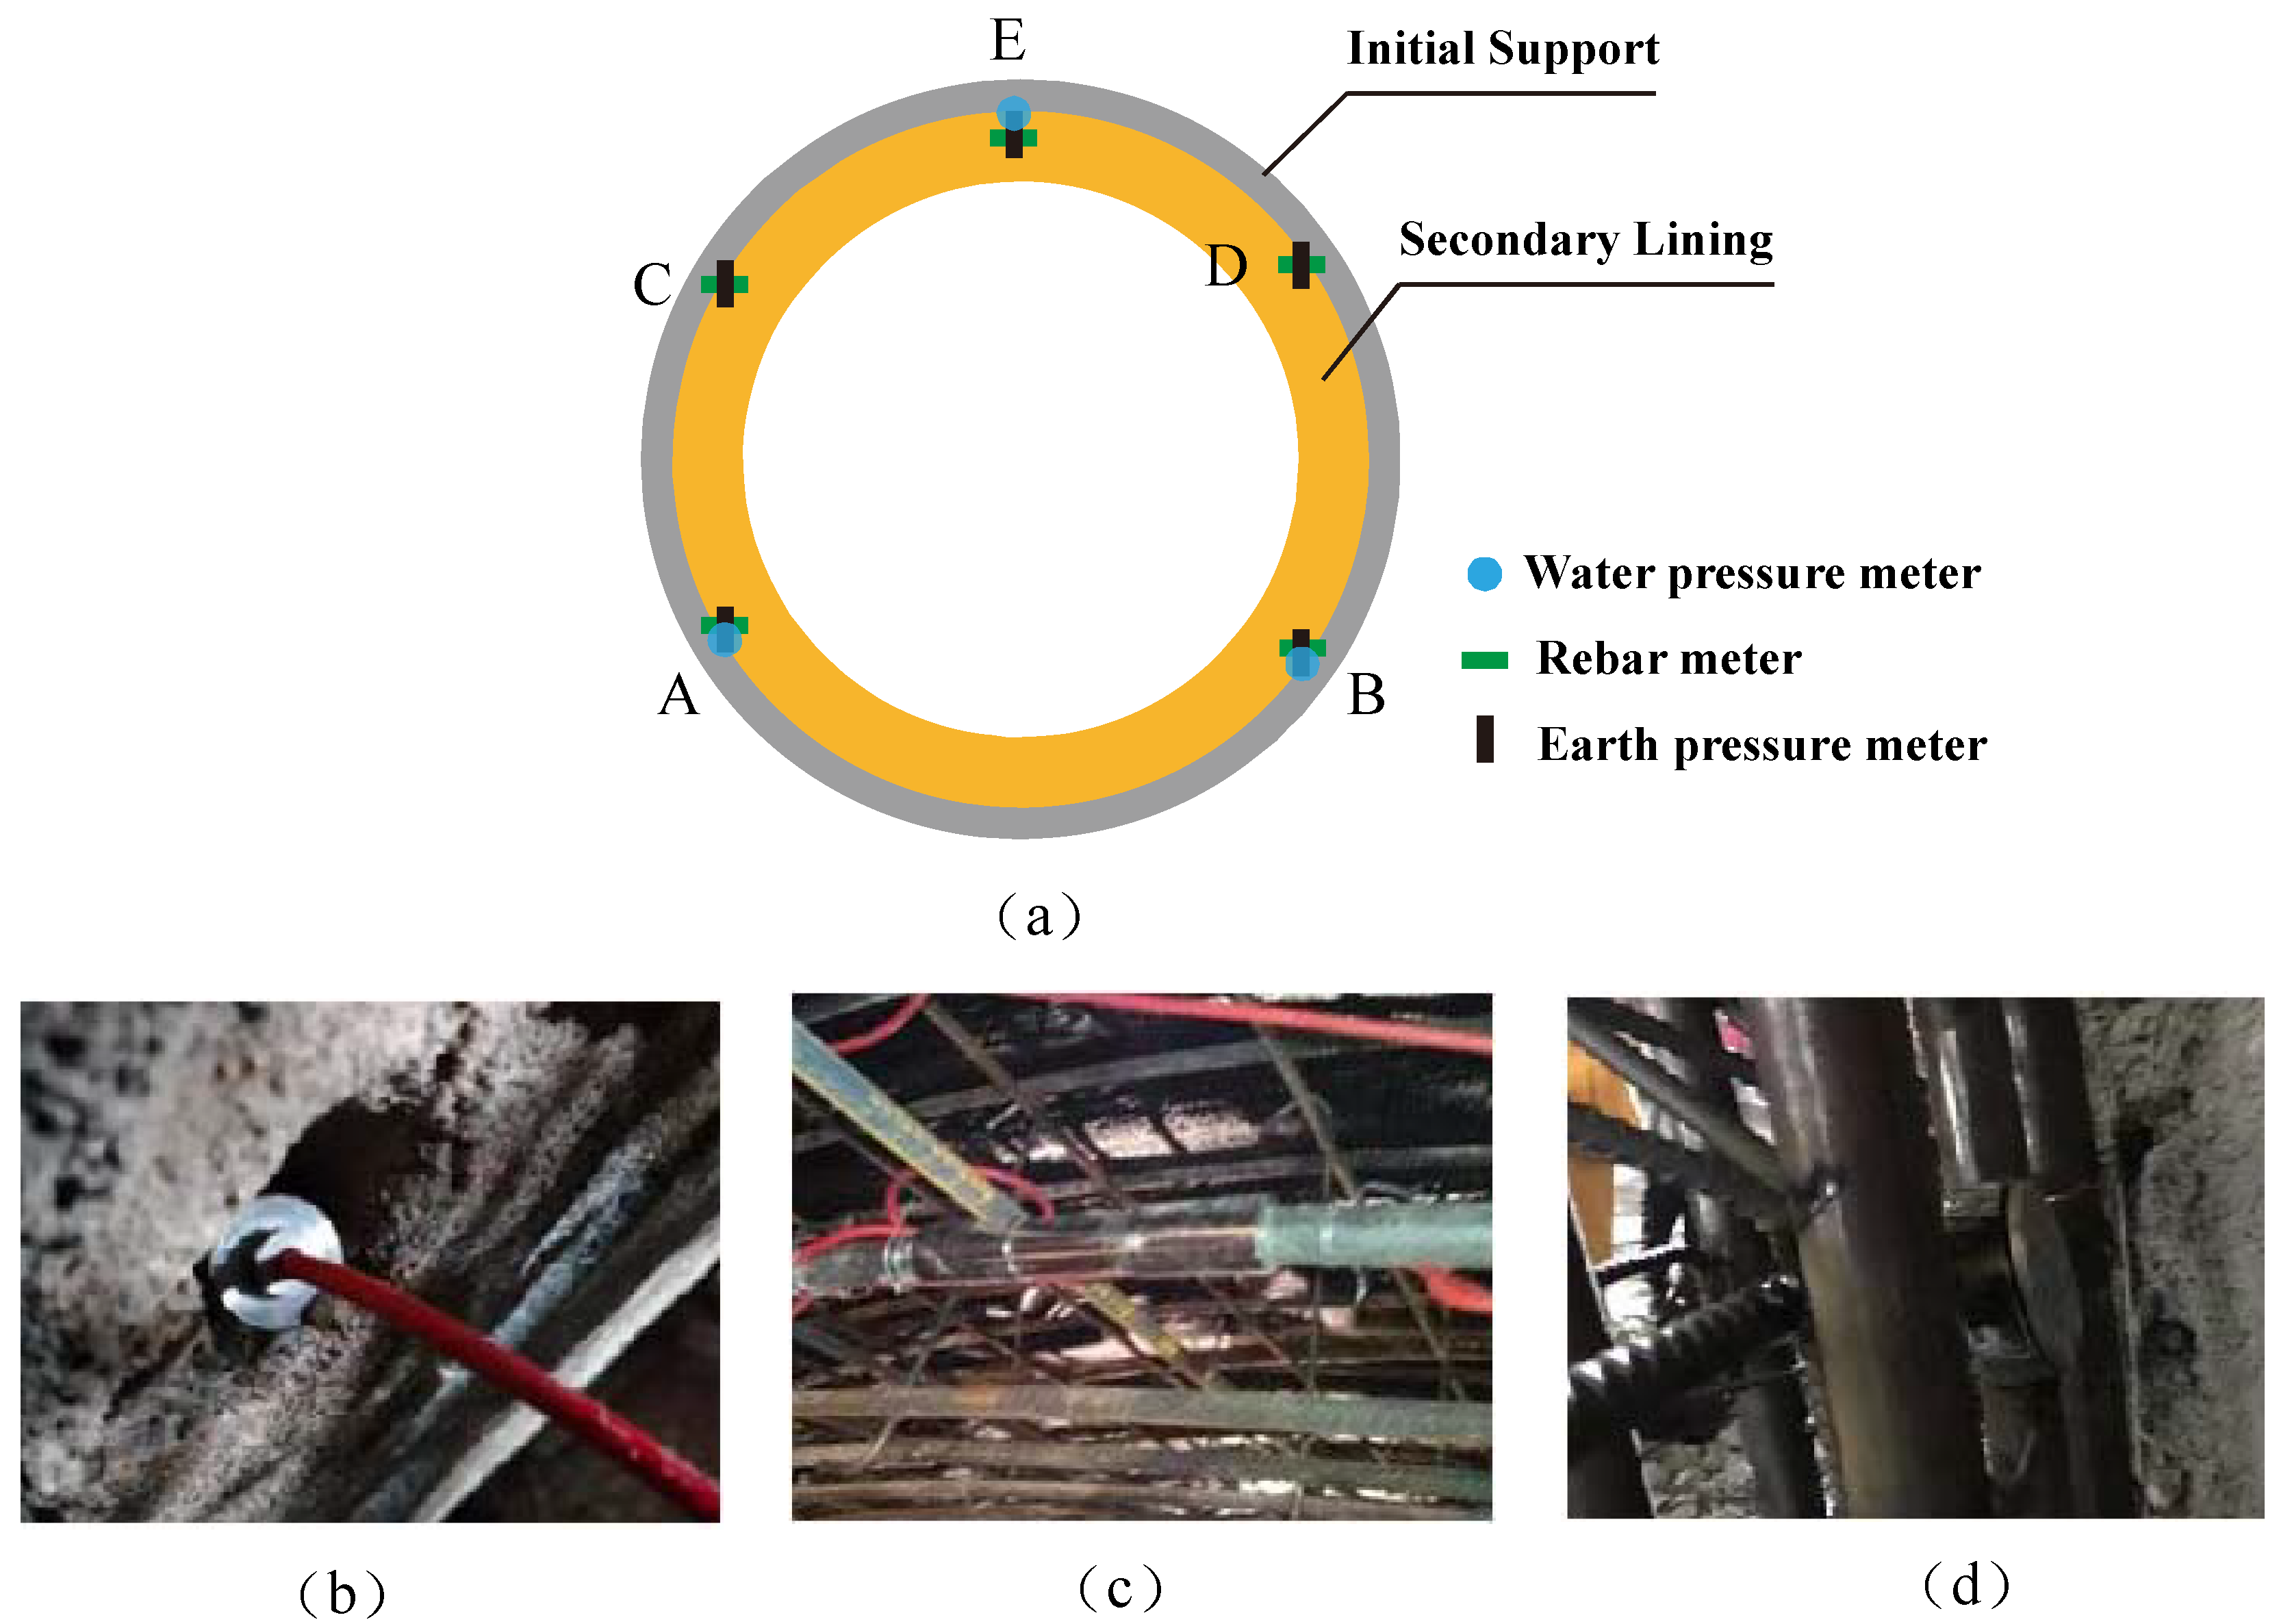
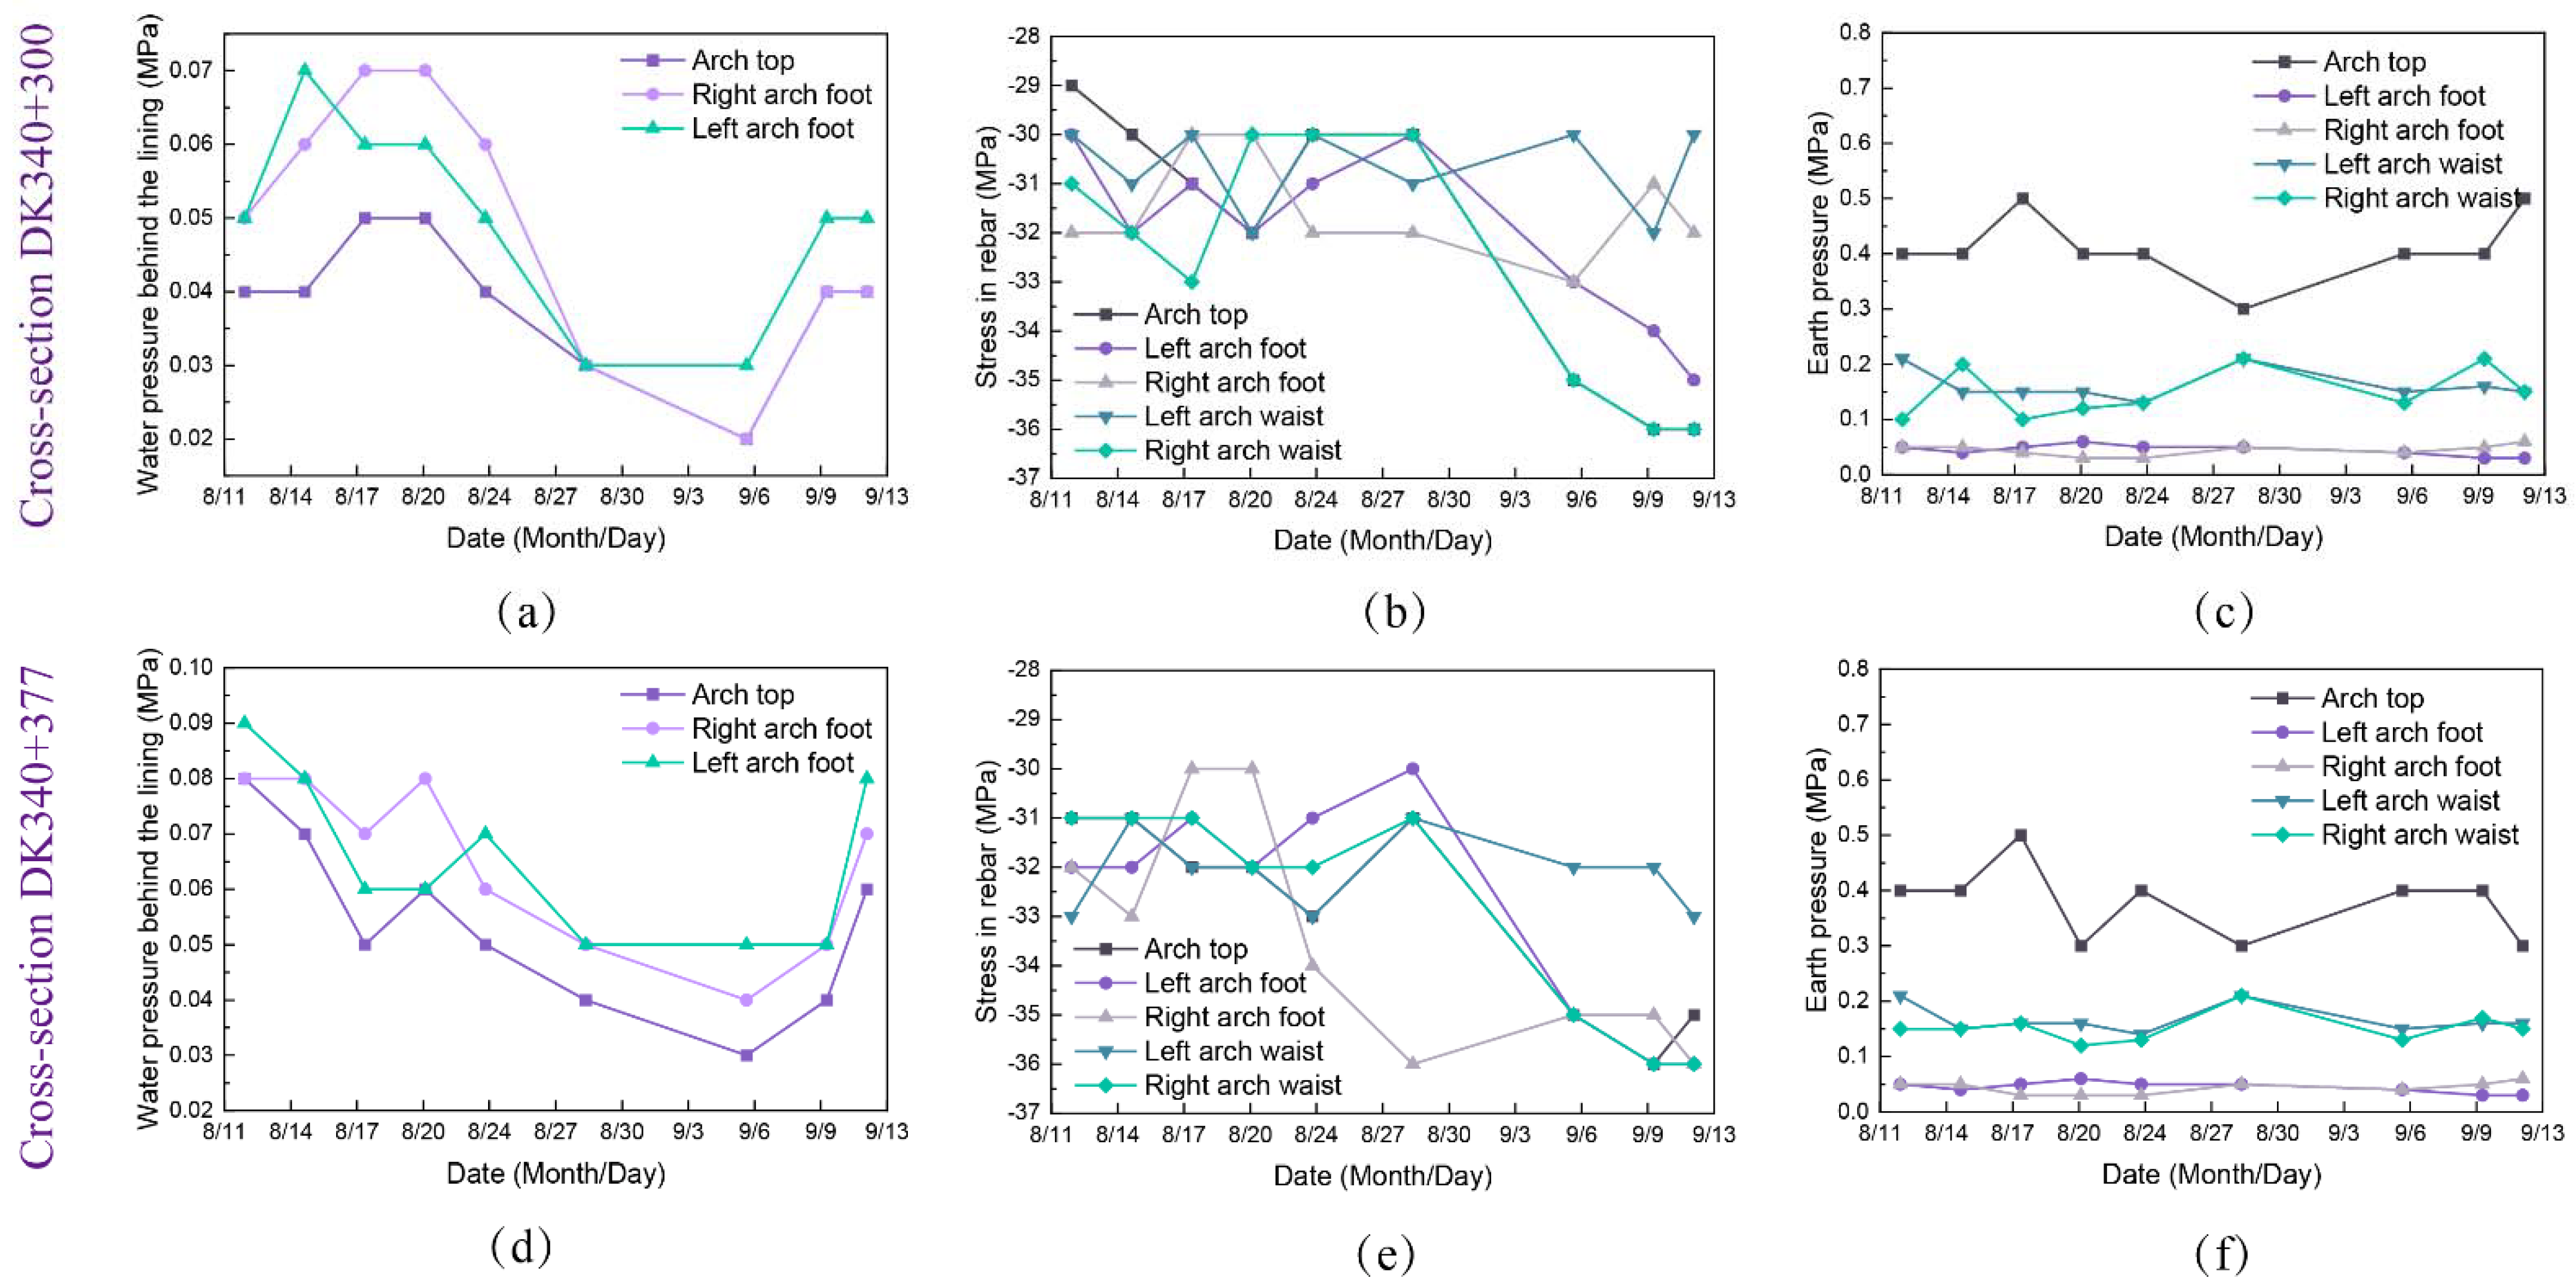
4.3. Field Test Verification

To verify the reliability of the above numerical calculations, relevant field tests were performed on the water resistance of the structure after the construction of the tunnel at the New Yuanliang Mountain. During the rainy season, the water pressure in the cavity section was monitored and measured, and the selected sections DK340+300 and DK340+377 were tested for the water pressure between the initial support and the secondary lining, the stress on the secondary liner rebar, the contact pressure between the initial support and the secondary lining, etc. The sensor arrangement and field installation of each monitoring section are shown in Figure 21.
The results of field monitoring are shown in Figure 22, which showed that, during the month-long monitoring at the rainy season, the results of all monitoring points of the two sections with respect to the water pressure behind the lining were lower than 0.1 MPa, reflecting the obvious efficiency of the above construction water resistance technology. The monitoring results of the rebar meter inside the second liner were all around 30 MPa, which indicated that the second liner was stable in force, and that the structure had good performance in resisting water pressure. As for the contact pressure between the initial support and the secondary lining, the pressure at the top of the arch was slightly larger than that at the foot and waist of the arch, about 0.5 MPa, and the pressure at the foot of the arch was the smallest, about 0.4 MPa, which was because the top of the arch featured vertical pressure, while the foot of the arch featured lateral pressure. The pressure at the waist of the arch was just between the two, consistent with the actual situation. Summarizing the results, it can be obtained that the actual construction using the abovementioned grouting excavation scheme allowed the grouted stone body and the lining structure to effectively meet the requirements of the project for the hydraulic pressure resistance, which qualitatively reflected the accuracy of the numerical results.

5. Discussion

5.1. Analysis of Damage Characteristics

In the tunnel construction process, the parallel heading expansion can cause stress redistribution and, thus, cause the tunnel to converge inward; thus, it is important to control and monitor the tunnel deformation during the study of the damage of grouted rock masses and composite surrounding rocks. It is also important to investigate the correlation between acoustic emission energy and damage to the surrounding rock, as a large amount of acoustic emission energy is released whenever there is large damage to the surrounding rock unit. In the numerical calculation model shown in Figure 1 and Figure 12, four monitoring points were set up inside the tunnel, labeled A, B, C, and D. During the calculation, the convergence deformation and acoustic emission energy in the tunnel were monitored and analyzed in the process of sudden water of the composite surrounding rock caused by the increased water pressure in the karst cave, and the displacement was in the positive direction to the right. The results are shown in Figure 23 and Figure 24, respectively.
From Figure 23, it can be seen that the unloading caused by the expansion of the parallel heading would cause the release of stress in the surrounding rock. When the parallel heading was first expanded, the four measurement points A, B, C, and D all experienced certain displacements, with the largest displacement at point B near the cavity, which remained the largest displacement until the final destruction. This indicates that, if the convergence deformation on one side of the tunnel construction is larger than the other side in the karst area, attention should be paid to the uneven stress distribution on that side of the site. At this point, a special geological environment was revealed on that side, such as the possible existence of hidden pressure cavities. For the A and C measurement points, due to their distribution being far from the cavity, the cavity water pressure was less affected. After the parallel heading extension, the measurements remained unchanged until the destruction of the grouted stone on the right side of the tunnel. For points B and D, it was obvious that their displacement curves could be roughly divided into three stages: growth period, stabilization period, and dramatic damage period. At the beginning of the parallel heading expansion, the displacement curve of the two points developed rapidly, and the acoustic emission energy accumulated slowly at this time. Then, the displacement of measurement points entered the stable period after reaching the peak, during which the displacement almost did not increase, and almost no acoustic emission energy was generated, indicating that the stone body finally reached a relatively stable state through the continuous redistribution of internal stress. When the water pressure in the cavity reached 0.28 MPa, the displacement of measurement points B and D increased dramatically, and the acoustic emission energy was also generated suddenly and increased rapidly. This stage corresponded to the destruction of the grouted stone body, which gradually dissipated during the destruction process. Finally, when the water pressure in the cavity reached 0.35 MPa, the grouted stone body was completely destroyed.
The changes in displacement and acoustic emission energy with the water pressure in the cavern in Figure 24 showed a consistent trend with Figure 23 as a whole. At the beginning of the parallel heading expansion, the displacement injection of B and D points increased; when the water pressure in the cavern reached 1 MPa, the displacement of the measurement points entered a stable period, after which the displacement hardly increased. When the water pressure in the cavern reached 1.5 MPa, the displacement curves of B and D measurement points presented an inflection point, and the curve entered a dramatic increase period. Finally, when the water pressure in the cavity reached 2.2 MPa, the surrounding rock was damaged. The difference between Figure 23 and Figure 24 is because the composite surrounding rock structure formed by the grouted stone body and the surrounding rock together had better resistance to water pressure, the displacement change curve was more gentle in the growth period, and the change in displacement did not cause the accumulation of acoustic emission energy immediately in the destruction period due to the better stability of the composite surrounding rock structure. This resulted in a certain lag effect in the peak of acoustic emission energy compared to the displacement variation curve. In summary, it can be seen that the damage to the surrounding rock can be predicted or judged by monitoring the acoustic emission energy of the structure in the actual project, and the results of field measurements also verified its reliability. In the construction of karst tunnels, if there is an accelerated development of displacement convergence on one side and the acoustic emission energy increases sharply, the focus should be on the force state of the structure, and one should remain alert to the possibility of sudden water and mud disasters to avoid generating subsequent disasters.

5.2. Verification of Model Reliability

In order to verify the reliability of the results of numerical simulation, the results of the numerical calculation were compared and analyzed with the results of the field measurements. The earth pressure and water pressure at the observation point when the thickness of grouting was 5 m in Figure 17 were extracted and compared with the earth and water pressure obtained from the field monitoring in Section 4.3; the results are plotted in Figure 25. From Figure 25a, it can be seen that the overall numerical calculation results were lower compared to the actual measured water pressure in the field, but the error was basically within 0.03 MPa. The reason for the lower calculation result is that the actual grouted stone was not homogeneous due to the limitation of the construction process on site; however, in the numerical calculation, the model was too idealized, resulting in the hydraulic pressure resistance being better than the actual situation. In Figure 25b, it is shown that, for earth pressure, the numerical simulation results were in good agreement with the field test results, and the average error was within 0.01 MPa. The above-discussed results reflect that the numerical calculation model of this paper has good reliability in general and can be used to guide field construction.

6. Conclusions

In this paper, on the basis of the Xin Yuanliang Mountain Tunnel Project, the hydraulic pressure resistance and damage process of composite structures in tunnels with karst area were analyzed using RFPA software to reveal the disaster-causing mechanism under high water pressure. The construction plan of the parallel heading expansion of the Xin Yuanliang Mountain tunnel was discussed and verified by field testing. The main research conclusions obtained were as follows:
(1) The rupture characteristics of grouted stone around the tunnel induced by tunnel expansion construction were explored from the perspectives of mechanics and acoustic emission. The results showed that the cracks were mainly caused by tensile–shear damage, and the whole damage process could be divided into three stages: the growth phase, stabilization phase, and violent damage phase.
(2) By comparing the field monitoring data with the model calculation results in the paper, it was found that the earth pressure obtained from the model calculation was similar to the actual monitoring results, with an average error of about 0.01 MPa; the water pressure was smaller than the actual results by about 0.03 MPa, due to the idealization of the model grouting parameters. Overall, the model has good reliability and can be used to guide the practical engineering applications.
(3) The New Yuanliang Mountain Tunnel was constructed through a high-pressure water-rich cave, which has a large volume, large water volume, and high water pressure, with a maximum water pressure of 3.0 MPa in the rainy season. According to the numerical model, the project finally adopted a 5 m grouting range and temporary secondary lining of the core section of the cavity. The monitoring results showed that the water pressure behind the lining was only 0.04 MPa at this time, ensuring the safety of the construction through the cavern.
(4) To address the problem of the high risk of expansion construction in the karst cave section of the new Yuanliang Mountain Tunnel, an improved construction technique of expansion of reserved core soil based on the CRD method was proposed. This method supports the lining structure of the existing parallel heading with a temporary steel frame, which makes full use of the support capacity of the existing parallel heading lining. After the deformation of the ring initial support steel frame is stabilized, and the existing lining and internal temporary steel frame are removed, the displacement of the surrounding rock can be reduced by about 50%, ensuring the safety of the tunnel expansion.

Author Contributions

Conceptualization, J.L.; methodology, M.H.; writing—review and editing, J.L. and Y.S.; funding acquisition, M.H.; formal analysis, Z.Y. and Z.Z. All authors have read and agreed to the published version of the manuscript.

Funding

This research was funded by the National Natural Science Foundation of China, grant number 51878037.

Institutional Review Board Statement

Not applicable.

Informed Consent Statement

Not applicable.

Data Availability Statement

Not applicable.

Acknowledgments

The authors would like to thank Bo Jiang and Qiang Guan for their help at the construction site. The authors would like to thank the anonymous reviewers, the academic editor, and the assistant editor for their valuable comments that helped improve the paper’s quality.

Conflicts of Interest

The authors declare no conflict of interest.

References

  1. Pan, X.D.; Fang, Y.C.; Lai, Y.; Sun, H.L.; Cai, Y.Q.; Shi, L.; Geng, X.Y. Three-dimensional numerical modeling of water distribution tunnels in karst area. Arab. J. Geosci. 2020, 13, 1242. [Google Scholar] [CrossRef]
  2. Liu, Y.; Feng, Y.; Xu, M.; Zhang, Y.; Long, H.; Zhu, H. Effect of an incremental change in external water pressure on tunnel lining: A case study from the Tongxi karst tunnel. Nat. Hazards 2019, 98, 343–377. [Google Scholar] [CrossRef]
  3. Yang, J.; Zhang, C.; Fu, J.; Wang, S.; Ou, X.; Xie, Y. Pre-grouting reinforcement of underwater karst area for shield tunneling passing through Xiangjiang River in Changsha, China. Tunn. Undergr. Space Technol. 2020, 100, 103380. [Google Scholar] [CrossRef]
  4. Zhao, H.; Zhang, F.; Yao, X. Hydromechanical Simulation of Tunnel Excavation in Rock Considering a Nearby Karst Cave. Math. Probl. Eng. 2021, 2021, 7875725. [Google Scholar] [CrossRef]
  5. Hasanipanah, M.; Jamei, M.; Mohammed, A.S.; Amar, M.N.; Hocine, O.; Khedher, K.M. Intelligent prediction of rock mass deformation modulus through three optimized cascaded forward neural network models. Earth Sci. Inform. 2022, 1–11. [Google Scholar] [CrossRef]
  6. Chen, H.; Sha, C. Stability Analysis of Surrounding Rock and Treatment Structures in Superlarge Karst Cave of Naqiu Tunnel. Adv. Civ. Eng. 2018, 2018, 4842308. [Google Scholar] [CrossRef]
  7. Tian, Q.; Zhang, J.; Zhang, Y. Similar simulation experiment of expressway tunnel in karst. Constr. Build. Mater. 2018, 176, 1–13. [Google Scholar] [CrossRef]
  8. Xie, Y.; Yang, J.; Zhang, C.; Fu, J. Structures and Settlement Control of Yujingshan High-Speed Railway Tunnel Crossing Massive Rockfill in a Giant Karst Cave. Transp. Res. Rec. 2022, 2676, 589–602. [Google Scholar] [CrossRef]
  9. Shi, Z.; Wang, Q.; Pang, C.; Yuan, Y.; Wang, F.; Song, H.; Liu, J.; Zhang, Z.; Sun, R.; Liu, Y. Establishment and Application of the Spatial Decomposition Method (SDM) for Tunnels Passing Through Large Karst Caves. Appl. Sci. 2020, 10, 7204. [Google Scholar] [CrossRef]
  10. Lv, J.; Li, X.; He, Y.; Fu, H.; Yin, Y. Analytical analyses of the effect of filled karst cavern on tunnel lining structure under complex geological conditions. AIP Adv. 2019, 9, 035148. [Google Scholar] [CrossRef] [Green Version]
  11. Guo, J.; Ren, L.; Wang, G. Stability analysis of rock pillar between tunnel and large-scale concealed cave on top of tunnel. In Proceedings of the 2nd International Conference on Civil Engineering and Transportation (ICCET 2012), Guilin, China, 27–28 October 2012; pp. 1325–1328. [Google Scholar]
  12. Guo, J.; Ren, L.; Liu, X. Study on Safe Thickness of Comparatively Intact Rock ahead of Karst Tunnel Face. In Proceedings of the International Conference on Civil Engineering and Transportation (ICCET 2011), Jinan, China, 14–16 October 2011; pp. 2456–2459. [Google Scholar]
  13. Wu, W.; Liu, X.; Guo, J.; Sun, F.; Huang, X.; Zhu, Z. Upper limit analysis of stability of the water-resistant rock mass of a Karst tunnel face considering the seepage force. Bull. Eng. Geol. Environ. 2021, 80, 5813–5830. [Google Scholar] [CrossRef]
  14. Li, L.P.; Xiong, Y.F.; Wang, J.; Gao, X.C.; Wang, K.; Sun, H.C.; Fang, Z.D. Comprehensive Influence Analysis of Multiple Parameters on the Safety Thickness against Water Inrush in Shield Tunnel. Int. J. Geomech. 2020, 20, 04020226. [Google Scholar] [CrossRef]
  15. Li, J.; Chen, Q.; Huang, X.; Zou, G.; Deng, J. Pretreatment for Tunnel Karst Cave during Excavation: A Case Study of Guangxi, China. Adv. Civ. Eng. 2021, 2021, 9013815. [Google Scholar] [CrossRef]
  16. Zhang, Q.; Huang, B.; He, M.; Guo, S.; Tinivella, U. A Numerical Investigation on the Hydraulic Fracturing Effect of Water Inrush during Tunnel Excavation. Geofluids 2020, 2020, 6196327. [Google Scholar] [CrossRef]
  17. Hu, J.; Xu, N. Numerical analysis of failure mechanism of tunnel under different confining pressure. In Proceedings of the 1st International Symposium on Mine Safety Science and Engineering (ISMSSE), Beijing, China, 26–29 October 2011. [Google Scholar]
  18. Wang, S.Y.; Sloan, S.W.; Tang, C.A.; Zhu, W.C. Numerical simulation of the failure mechanism of circular tunnels in transversely isotropic rock masses. Tunn. Undergr. Space Technol. 2012, 32, 231–244. [Google Scholar] [CrossRef]
  19. Tan, Z.H.; Tang, C.A.; Cao, W.A.; Yang, T.H. Influence of Karst cave’s position on wall rock long-term stability of tunnel. In Proceedings of the 5th International Conference on Nonlinear Mechanics (ICNM-V), Shanghai, China, 11–14 June 2007; pp. 493–497. [Google Scholar]
  20. Filipponi, M.; Jeannin, P.Y.; Tacher, L. Evidence of inception horizons in karst conduit networks. Geomorphology 2009, 106, 86–99. [Google Scholar] [CrossRef]
Figure 1. Diagram of the numerical calculation model for the damage of the grouted body.
Applsci 12 07605 g001
Figure 2. Numerical calculation results of the damage model of the grouted body under the influence of a water-rich cave: (ah).
Applsci 12 07605 g002
Figure 3. Acoustic emission diagram of the model shown in Figure 1 at different steps: (ah).
Applsci 12 07605 g003
Figure 4. Schematic diagram of the numerical calculation model for different relative positions of tunnel and cave: (a) tunnel under the cave; (b) tunnel up through the cave; (c) tunnel side crossing the cave; (d) tunnel through the cave cluster.
Applsci 12 07605 g004
Figure 5. Numerical calculation results of damage characteristics of grouting for different relative positions of the tunnel and the cave: (a) tunnel under the cave; (b) tunnel up through the cave; (c) tunnel side crossing the cave; (d) tunnel through the cave cluster.
Applsci 12 07605 g005
Figure 6. Acoustic emission diagram of grout damage for different relative positions of the tunnel and the cave: (a) tunnel under the cave; (b) tunnel up through the cave; (c) tunnel side crossing the cave; (d) tunnel through the cave cluster.
Applsci 12 07605 g006
Figure 7. Comparison of water pressure resistance of grouted stone bodies under different relative positions of the tunnel and the cave.
Applsci 12 07605 g007
Figure 8. Schematic diagram of the numerical calculation model for different grouting ranges: (a) grouting range of 30°; (b) grouting range of 60°; (c) grouting range of 90°; (d) grouting range of 120°; (e) grouting range of 180°; (f) grouting range of 360°.
Applsci 12 07605 g008
Figure 9. Numerical calculation results of damage characteristics of grouting for different grouting ranges: (a) grouting range of 30°; (b) grouting range of 60°; (c) grouting range of 90°; (d) grouting range of 120°; (e) grouting range of 180°; (f) grouting range of 360°.
Applsci 12 07605 g009
Figure 10. Acoustic emission diagram of grout damage for different grouting ranges: (a) grouting range of 30°; (b) grouting range of 60°; (c) grouting range of 90°; (d) grouting range of 120°; (e) grouting range of 180°; (f) grouting range of 360°.
Applsci 12 07605 g010
Figure 11. Comparison of water pressure resistance of stone bodies under different grouting ranges.
Applsci 12 07605 g011
Figure 12. Diagram of the numerical calculation model.
Applsci 12 07605 g012
Figure 13. Numerical calculation results of the damage model of the composite surrounding rock under the influence of a water-rich cave: (ah).
Applsci 12 07605 g013
Figure 14. Acoustic emission diagram of the model shown in Figure 12 at different steps: (ah).
Applsci 12 07605 g014
Figure 15. Comparison of water pressure resistance of different surrounding rock thicknesses.
Applsci 12 07605 g015
Figure 16. Comparison of water pressure resistance of different composite rock thicknesses.
Applsci 12 07605 g016
Figure 17. Trend of pressure with grout thickness at different locations in the numerical model: (a) characteristics of water pressure variation with grouting thickness; (b) characteristics of earth pressure variation with grouting thickness.
Applsci 12 07605 g017
Figure 18. The New Yuanliang Mountain Tunnel geological profile.
Applsci 12 07605 g018
Figure 19. Construction diagram of CRD method and CD method. (a) CRD method construction procedure diagram, in which excavation sequence installation ①–②–③–④–⑤–⑥ was carried out; (b) CD method construction procedure diagram, in which the excavation sequence installation ①–②–③–④–⑤ was carried out.
Applsci 12 07605 g019
Figure 20. Comparison of tunnel settlement caused by CRD method and CD method during excavation: (a) comparison of vertical settlement of archtop; (b) comparison of horizontal convergence of arch waist.
Applsci 12 07605 g020
Figure 21. Diagram of the layout of the monitoring section measurement points and the installation of instruments on site: (a) monitoring section measurement point layout diagram; (b) on-site water pressure meter installation diagram; (c) on-site rebar meter installation diagram; (d) on-site earth pressure meter installation diagram.
Applsci 12 07605 g021
Figure 22. Results of field measurements at monitoring sections: (a) results of water pressure monitoring at section DK340+300; (b) results of rebar stress monitoring at section DK340+300; (c) results of earth pressure monitoring at section DK340+300; (d) results of water pressure monitoring at section DK340+377; (e) results of rebar stress monitoring at section DK340+377; (f) results of earth pressure monitoring at section DK340+377.
Applsci 12 07605 g022
Figure 23. The relationship between the acoustic emission energy and the convergence deformation of the measurement point with the water pressure of the karst cave for model 1.
Applsci 12 07605 g023
Figure 24. The relationship between the acoustic emission energy and the convergence deformation of the measurement point with the water pressure of the karst cave for model 2.
Applsci 12 07605 g024
Figure 25. Comparison of numerical calculation results and field monitoring results for different locations: (a) water pressure results comparison graph; (b) earth pressure results comparison graph.
Applsci 12 07605 g025
Table 1. Calculation parameters of the RFPA model.
MaterialsElastic Modulus (GPa)Poisson’s RatioAngle of Internal Friction (°)Permeability Coefficient (m/Day)Cohesion (MPa)Gravity (kN/m3)
Rock0.480.3350.0440.0520
Grouting2.00.35350.004430.06524
Table 2. Water pressure resistance of composite structures with different second lining thicknesses.
Thickness of Secondary Lining (m)00.40.81.01.2
Critical water pressure (MPa)0.681.512.303.564.44
Publisher’s Note: MDPI stays neutral with regard to jurisdictional claims in published maps and institutional affiliations.

