Article

A pH Monitoring Algorithm for Orifice Plate Culture Medium

1
School of Mechanical and Electronic Engineering, Wuhan University of Technology, Wuhan 430070, China
2
Shanghai Institute of Technical Physics, Chinese Academy of Sciences, Shanghai 200083, China
3
China Innovation Instrument Co., Ltd., Ningbo 315000, China
4
The Research Institute of Advanced Technologies, Ningbo University, Ningbo 315211, China
*
Author to whom correspondence should be addressed.
Appl. Sci. 2022, 12(15), 7560; https://doi.org/10.3390/app12157560
Submission received: 15 June 2022 / Revised: 13 July 2022 / Accepted: 22 July 2022 / Published: 27 July 2022
(This article belongs to the Special Issue Computing and Artificial Intelligence for Visual Data Analysis II)

Abstract

:

Featured Application

Used in automatic cell culture equipment. For example, in vitro automated culture of stem cells as seed cells and the culture of iPS cells (induced pluripotent stem cells).

Abstract

Recently, there has been renewed interest in cell therapy, which plays a key role in the clinical research of genetic diseases, advanced blood disease, and other diseases. It shows considerable clinical application value and is known as “the new pillar of future medicine”. Automatic cell culture and operation technology is the key to ensuring scale, standardization, and stability between batches of therapeutic cells. The pH of the cell culture medium is vital for cell growth. Most cells are suitable for growth at pH 7.2~7.4. A pH of cell culture medium lower than 6.8 or higher than 7.6 is harmful to cells, and cells will degenerate or even die. At present, the monitoring method of cell culture medium pH of automatic cell culture equipment is mainly a visual observation method, which can not accurately or quickly reflect changes in the cell culture medium. To address the issue of monitoring of cell culture fluid pH for automated cell culture equipment and the inability to employ invasive sensors to measure pH during well plate culture, a pH monitoring method for orifice plate culture medium algorithm based on HSV (hue, saturation, value) model is proposed by studying the changes of cell culture medium in the process of cell culture. The research presented here reveals the laws of cell culture fluid pH change and its color moment, and the intelligent monitoring of cell culture fluid pH was successfully achieved. The problem of non-destructive monitoring of the pH of cell culture fluids in well plates is also addressed.

1. Introduction

Cell therapy transplants or imports normal or bioengineered human cells into patients. The newly imported cells can replace the damaged cells for the purpose of treating diseases. Along with the rapid development of cell engineering, stem cell biology, immunology, molecular technology, and tissue engineering technology, cell therapy technology is becoming more and more mature. While cell culture techniques are fundamental to cell therapy, previous techniques were based on artificial culture. Recent developments in cell therapy have heightened the need for automated cell culture in vitro. For example, the culture of iPS cells (induced pluripotent stem cells). Ensuring that high-quality cells are stable and prepared with culture methods amenable to scaling is the key to achieving a wide range of clinical applications in the future. Automated cell culture technology can solve problems such as apoptosis or degeneration of cells due to mistakes resulting from the external environment, technical operations, and so on, to which artificial culture is subjected. Therefore, automatic cell culture using cellular automata may play a vital role in development [1,2].
One of the important parameters of cell culture is the pH of the culture medium. The optimum growth pH of most animal cells is 7.2–7.4 [3,4,5,6,7,8]. In the process of cell culture, the metabolites produced by cell growth will cause a change in medium pH. Therefore, the culture environment needs to contain about 5% CO2, which acts as a buffer with NaHCO3 and hydroxyethyl piperazine ethylthiosulfonic acid (HEPES) in the culture medium. Its pH is 7.2–7.4, and the color is displayed by the phenol red indicator. However, with the growth of cells, their metabolites accumulate to a certain amount, and CO2 can no longer play a buffer role. The pH will decrease to 6.5–6.6, and the color will turn yellow, which seriously affects the growth of cells [9,10]. Therefore, it is necessary to monitor the change in pH. When the pH drops to a set value, fresh medium must be restored or an alkali supplement operation is required.
Due to the small amount of stem cells in vitro culture, well plates are generally used for culturing as seed cells. Consequently, the change in pH is faster and not easy to observe. The traditional method for measuring the pH of the cell culture medium is to observe the color change of phenol red in the cell culture medium with the naked eye [11], with pH change countermeasures relying on subsequent liquid change or alkali replenishment as informed by training experience. However, traditional methods present changes in the color of the culture fluid as a yellow hue at pH 6.8–7.2. It is difficult for the naked eye to judge the specific value of pH, which can only be determined empirically. It is easy to manually judge where situations such as failure to change the culture solution in time or conduct alkali supplementation occurred, which adversely affects the cells. For the costly stem cell culture process, the cell damage caused by pH determination mistakes can also cause economic losses. Therefore, the method of manually determining pH not only affects the cell culture quality but also demands too much of the operator. Some current cell automated culture devices involve methods of pH determination based on manual experience. In addition, there are parts of automated culture equipment for direct determination of pH by invasive sensors and also some by sampling assays. This may present the possibility of cell contamination, which is also not suitable for automated culture equipment for stem cells.
Our method takes advantage of the chromogenic properties of phenol red for pH and machine vision technology to achieve intelligent pH monitoring of cell culture fluids. This method can not only improve the stability of cell culture quality but also produce savings in human resources. Over the last 30 years, machine vision technology has developed rapidly, and it is increasingly used in transportation, agriculture, medicine, industry, and other fields [12,13]. However, its application in the automated preparation of cells is rare in China. Currently, most automated cell-preparation equipment employs monitoring modalities. This is primarily based on manual empirical observations regarding the need for fluid changes or alkali supplementation [2,14,15,16,17]. None of the traditional methods consider non-invasive monitoring of pH changes in cell culture fluids, which can affect the quality of cell culture.
In this paper, we propose an algorithm for pH monitoring of culture fluid in well plates to address the problem of accuracy in determining pH with traditional manual observation methods. The algorithm utilizes a machine vision technique to extract the color characteristics of cell fluids in culture plates. The images are then segmented under the RGB color space. Finally, the mathematical relationship between pH and HSV model is established to realize intelligent pH monitoring based on the HSV of the acquired images and the pH information of the experimental acquisition. In this paper, a method of pH monitoring based on cell fluid color is proposed for the first time, which provides a theoretical basis for follow-up operations on cell culture, such as accurate liquid change or alkali supplement, and promotes the improvement of cell culture quality.

2. Methods

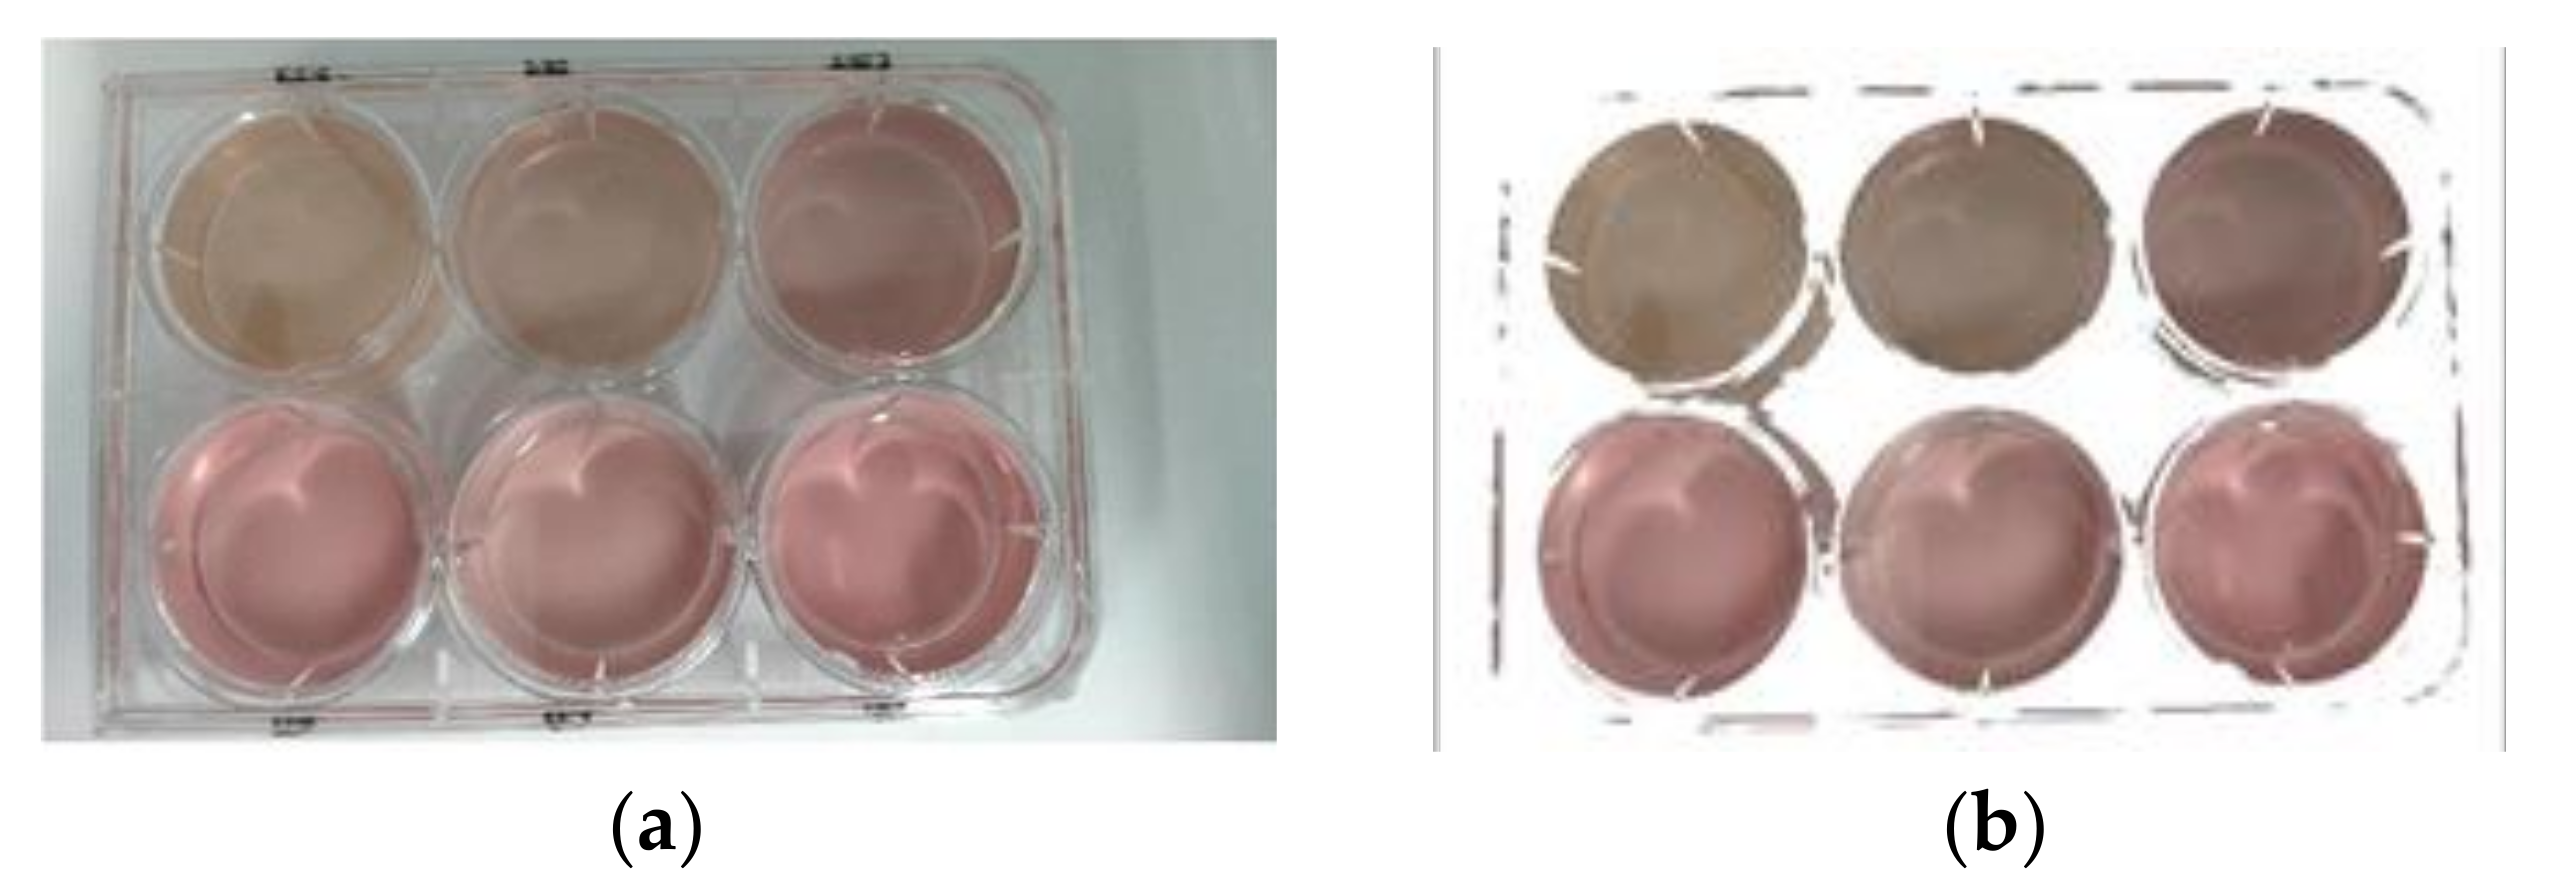
2.1. Image Acquisition

The equipment and materials used in this experiment include K562 cells, Costar3516 well plates (New York, NY, USA), cell culture medium (meilunbio RPMI1640 (1×) (Dalian, China), Sijiqing fetal bovine serum (Huzhou, China)), a Shanghai Tianda instrument pHS-3C-PH meter, an ATM industrial camera (China), a Philips LED white strip lamp (The Kingdom of the Netherlands), and a computer running Windows. The acquisition device was fixed above the incubator of the automatic cell culture equipment, 40 cm away from the orifice frame, connected to the computer by the data line, and the image acquisition was controlled by the software in the computer. After absorbing the cell fluid and injecting it into the well plate, the plate was placed on the well plate rack on the top layer of the incubator, as shown in Figure 1, for image acquisition.
In order to collect the image and pH value in the process of cell growth, different holes of a 6-well plate were inoculated with different concentrations of cell solution, and the image was collected after 2 days of culture. At the same time, the pH value of cell solution in different holes was measured by a pH meter, and the obtained image and pH value were used for subsequent analysis and calculation.

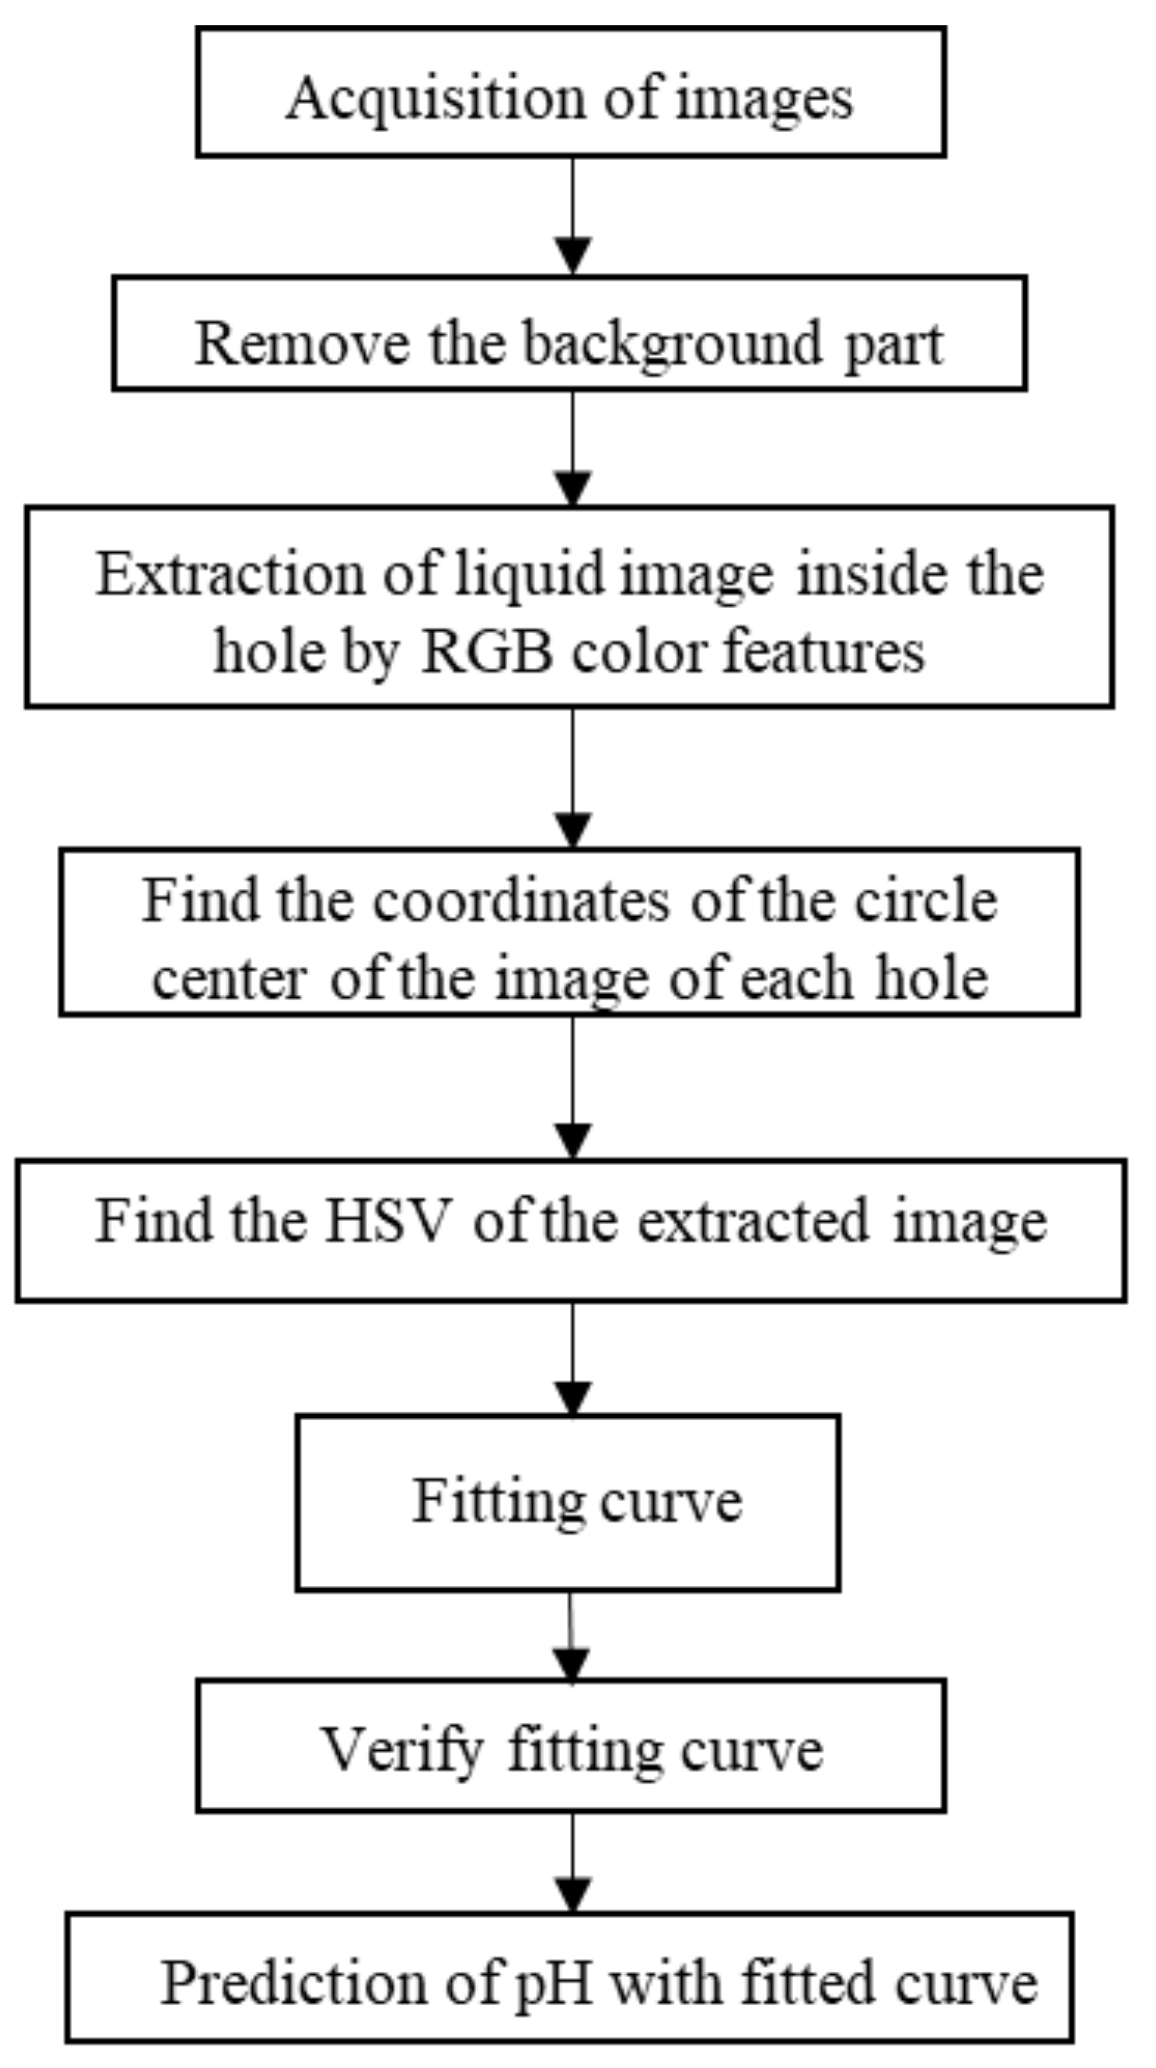
2.2. Image Processing Scheme

HSV is a representation of points in RGB color space in an inverted cone. HSV refers to hue, saturation, and value. Hue is the basic attribute of color and is identified by the name of the color, such as red, yellow, etc. Saturation(s) refers to the purity of color. The higher the saturation is, the purer the color is, and the lower it is, the closer it is to gray. Lightness (V) indicates the brightness of the color. For the light source color, the lightness value is related to the brightness of the illuminant; for the object color, this value is related to the transmittance or reflectance of the object.
First, the preprocessing algorithm to preprocess the collected image was selected in order to remove the background part and capture the liquid part in the hole. Then, the images of each hole were extracted separately and binarized, the centroid coordinates of the connected domain were obtained, and the image corresponding to each hole was obtained for holes 1–6. The model of HSV and pH of cell culture medium was established, and the relationship curve between HSV and pH of cell culture medium was fitted. The specific process is shown in Figure 2 below.

2.3. Scheme for pH Measurement

An amount of 50 mL of cell solution was cultured to a density of 1 × 10⁷ cells/mL, separated into quantities of 6 mL, 5 mL, 4 mL, 3 mL, 2 mL, and 1 mL of cell solution. A 6-bit orifice was added in left-to-right and top-to-bottom order. Fresh medium was added to each hole to the 10 mL mark. Cells were placed in the incubator for 48 h, and the liquid in the orifice plate was numbered according to the adding order, from hole 1 to hole 6. The orifice plate was placed under the camera for shooting.
After calibrating the pH meter, the pH value was measured in holes 1 to 6, as shown in Table 1.
To simulate the pH state of cell culture medium after fluid replacement or fluid supplementation or alkali supplementation, 2 mL and 1 mL of cell culture medium were added to hole 1. Then, fresh culture medium was added to 10 mL at the positions of hole 1 and hole 3. The aim was to simulate the orifice image after a period of reaction in a carbon dioxide incubator. Another 10 mL culture medium was taken in hole 5. The pH value of the cell fluid in the hole was measured by collecting the image of the hole plate. This was used to verify the accuracy of the model relationship between HSV and pH.

2.4. Regression Model Analysis of pH and HSV Curve

As in the above steps, after calculating the HSV model index, the appropriate index and its corresponding pH to draw the corresponding curve were selected. According to the curve, the appropriate function for model fitting was selected, and the model fitting was analyzed. The fitted curve model established was then analyzed to sum its sum and mean variance, respectively, to react to the fitted effect of the model established. The above procedure was repeated for image acquisition at different locations on the above three liquid-filled well plates. Hmean of well plates was calculated for each picture. The fitted curve was used to predict its pH, and its RMSE was calculated, which was used to assess the precision of the predicted values.

3. Algorithm Principle and Result Analysis

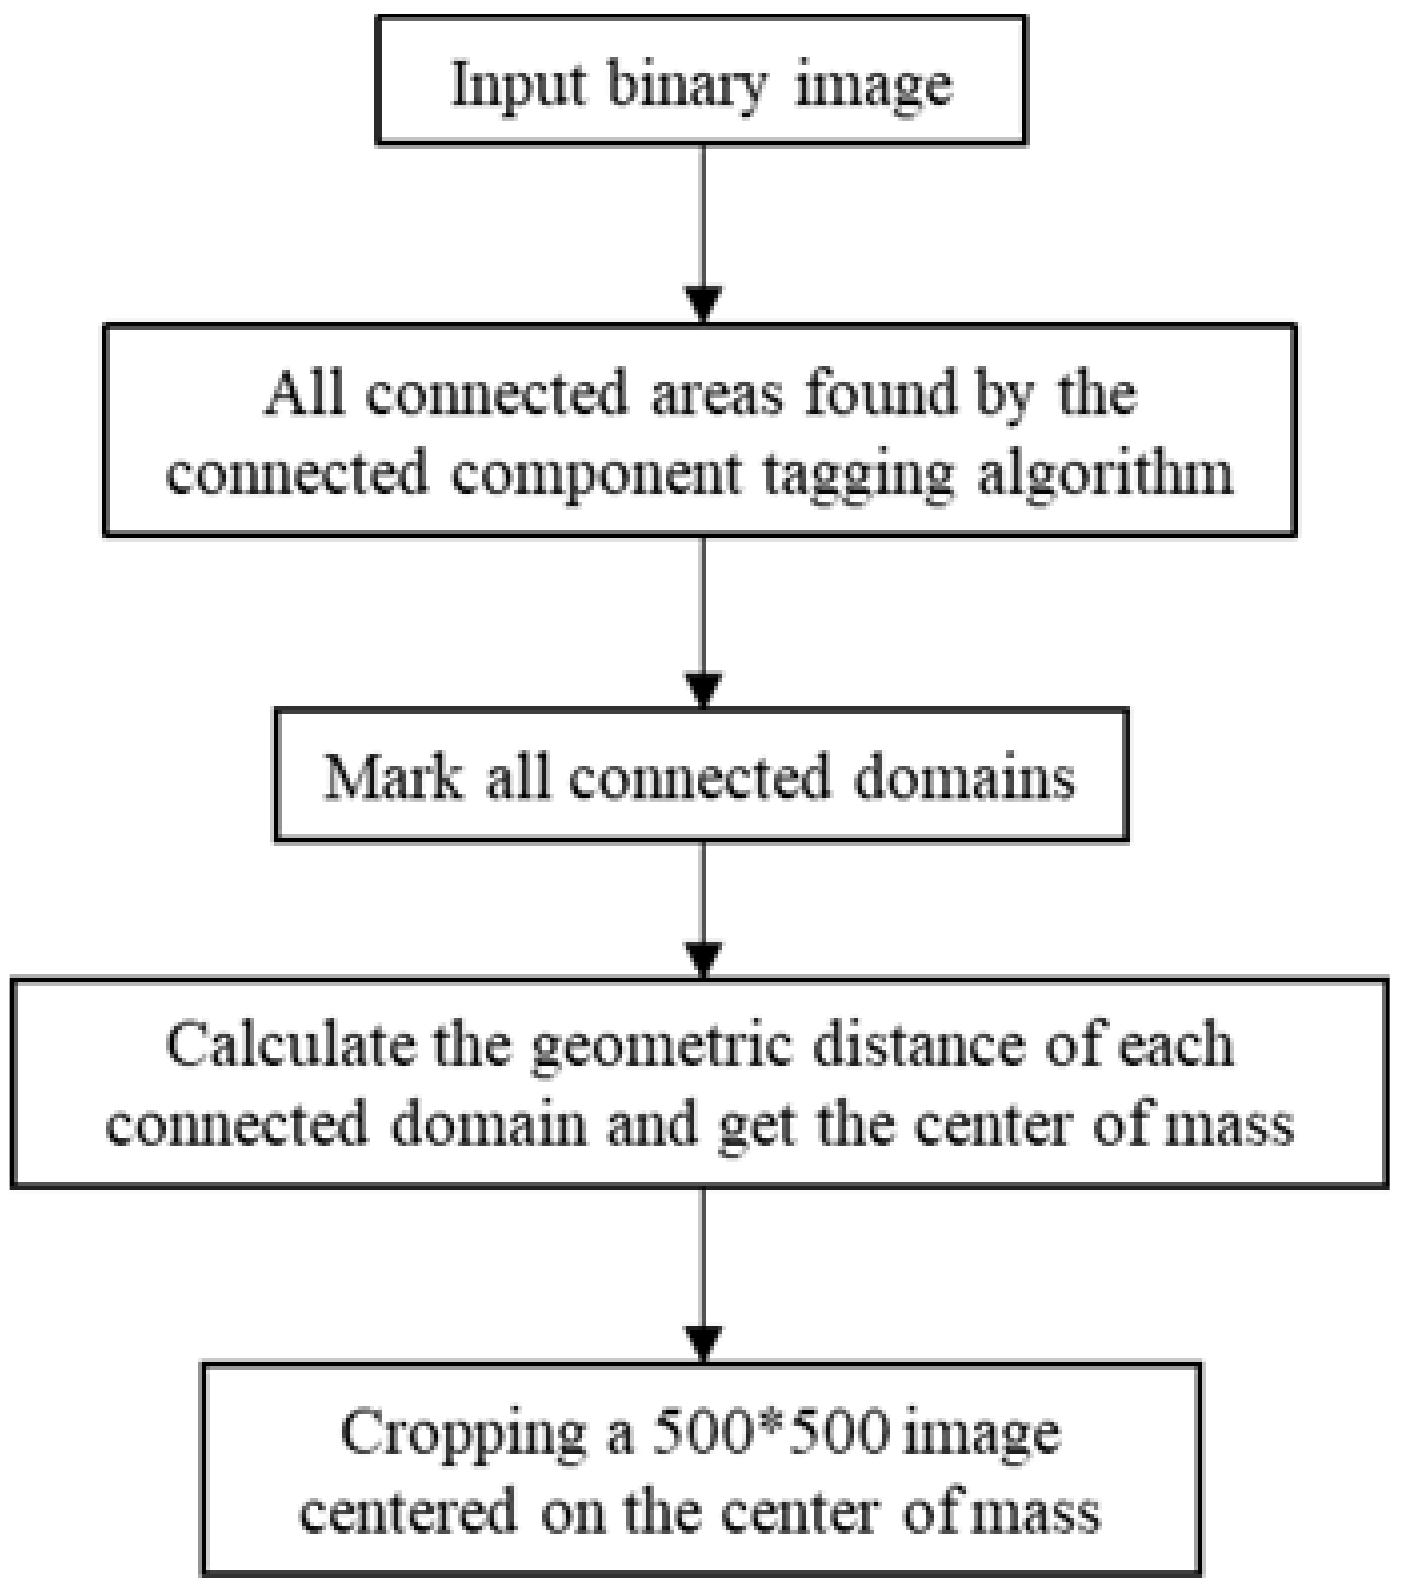
3.1. Algorithm Principle

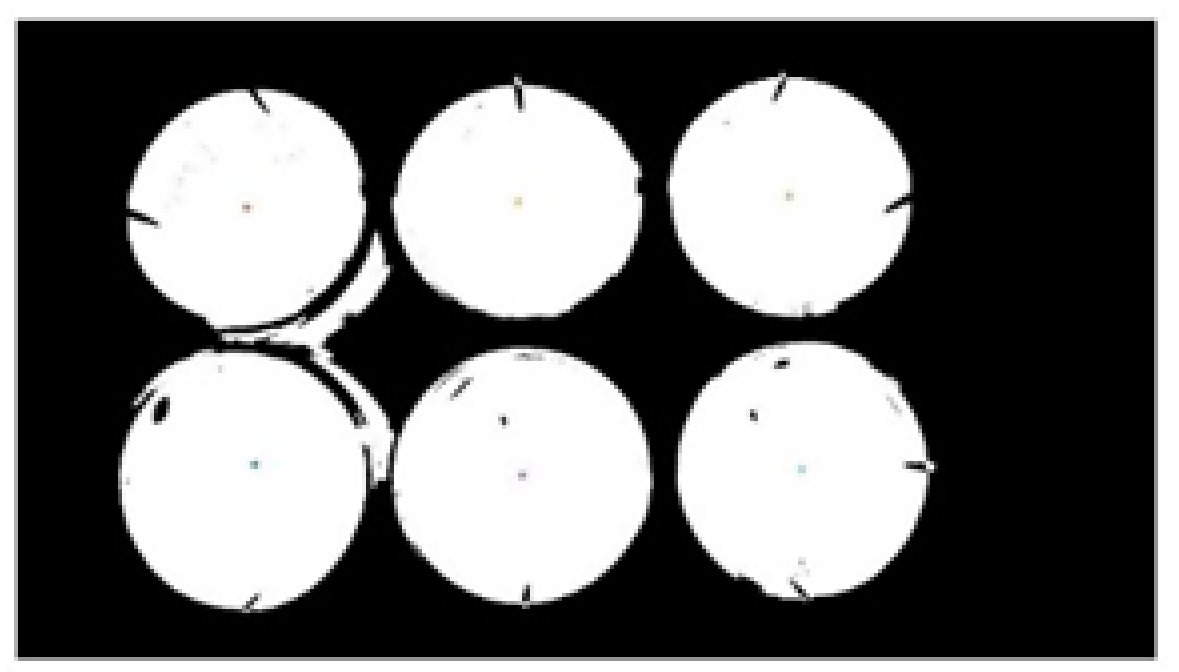
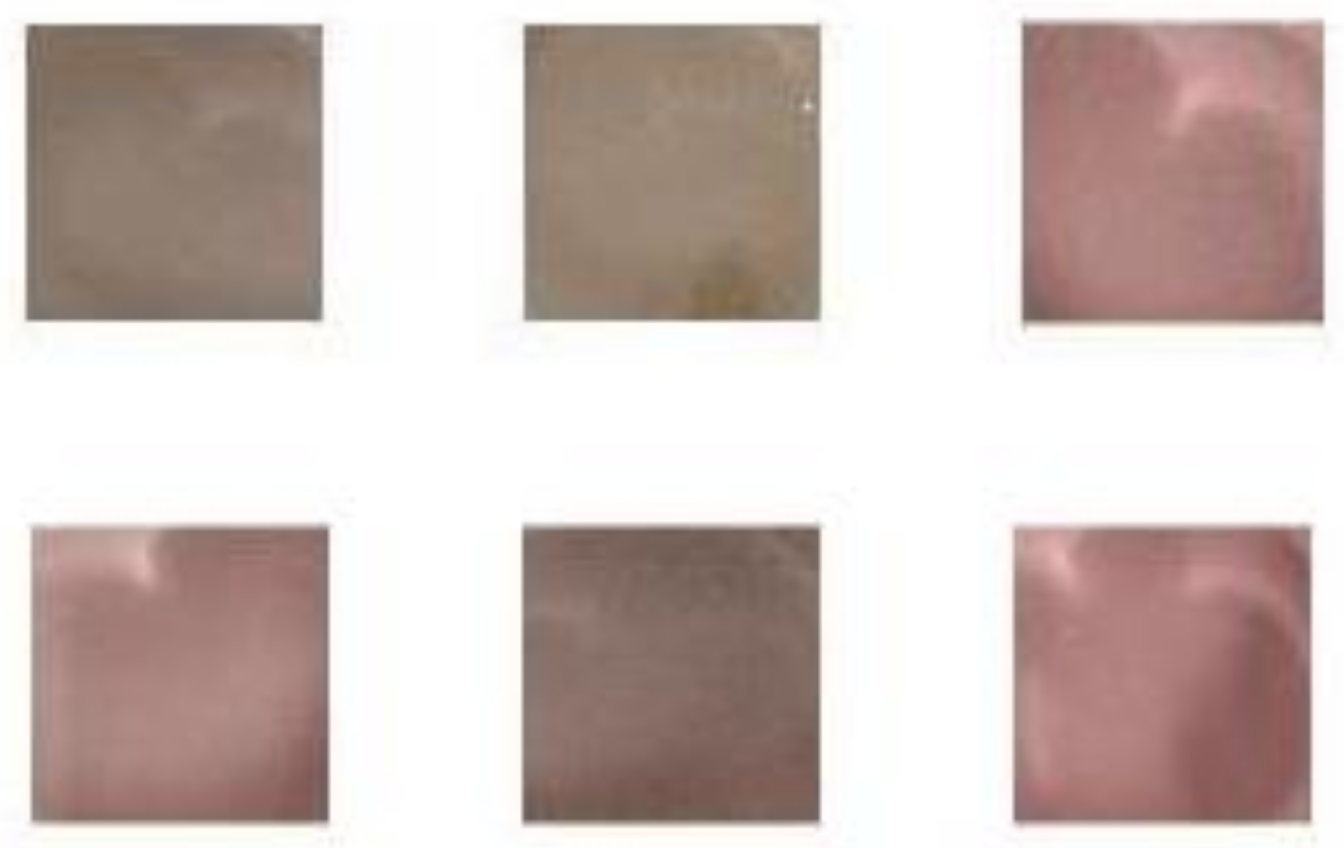
3.1.1. Target Image and Background Segmentation

To avoid color interference on the background part, the background part needed to be removed from the target image. As the background of the collected image is mainly white, the pore plate is transparent, and the cell culture medium is yellow, orange, and red. The method of extracting the red component was adopted based on the mechanism of the RGB color feature [18]. The extraction threshold of the red component was set at 15 while the other areas were set to white. The liquid in the hole was segmented by this method. The input image and the extracted image are shown in Figure 3.

3.1.2. Removal of Orifice Edge Profile

As the image after extracting the red component is still disturbed by the red light reflected by the transparent orifice plate, the edges of the transparent orifice plates were also segmented in the preprocessed image. According to the principle of binary image connectivity, the edge parts were removed and the image was binarized [19,20]. Then, the area of the connected domain was calculated, the area threshold of the connected domain was set, and the connected domain, which was smaller than the area threshold, was deleted. The area was opened and the object whose area was less than the threshold value in the binary image BW was deleted with eight neighbors. The processed image is shown in Figure 4.

3.1.3. Image after Cutting the Liquid in The Hole

Next, the centroid coordinates of the connected domain were obtained [21]. The position coordinates of the center of the liquid in each hole were determined in turn. Using this as the center, a 500 × 500 image was cut out. The HSV of the hole image was replaced by the HSV of the clipped image. The image center distance was used to locate the centroid, which was marked as ‘*’ for the liquid in the hole. The algorithm flow is shown in Figure 5.
The cropped liquid image in the hole is shown in Figure 6.

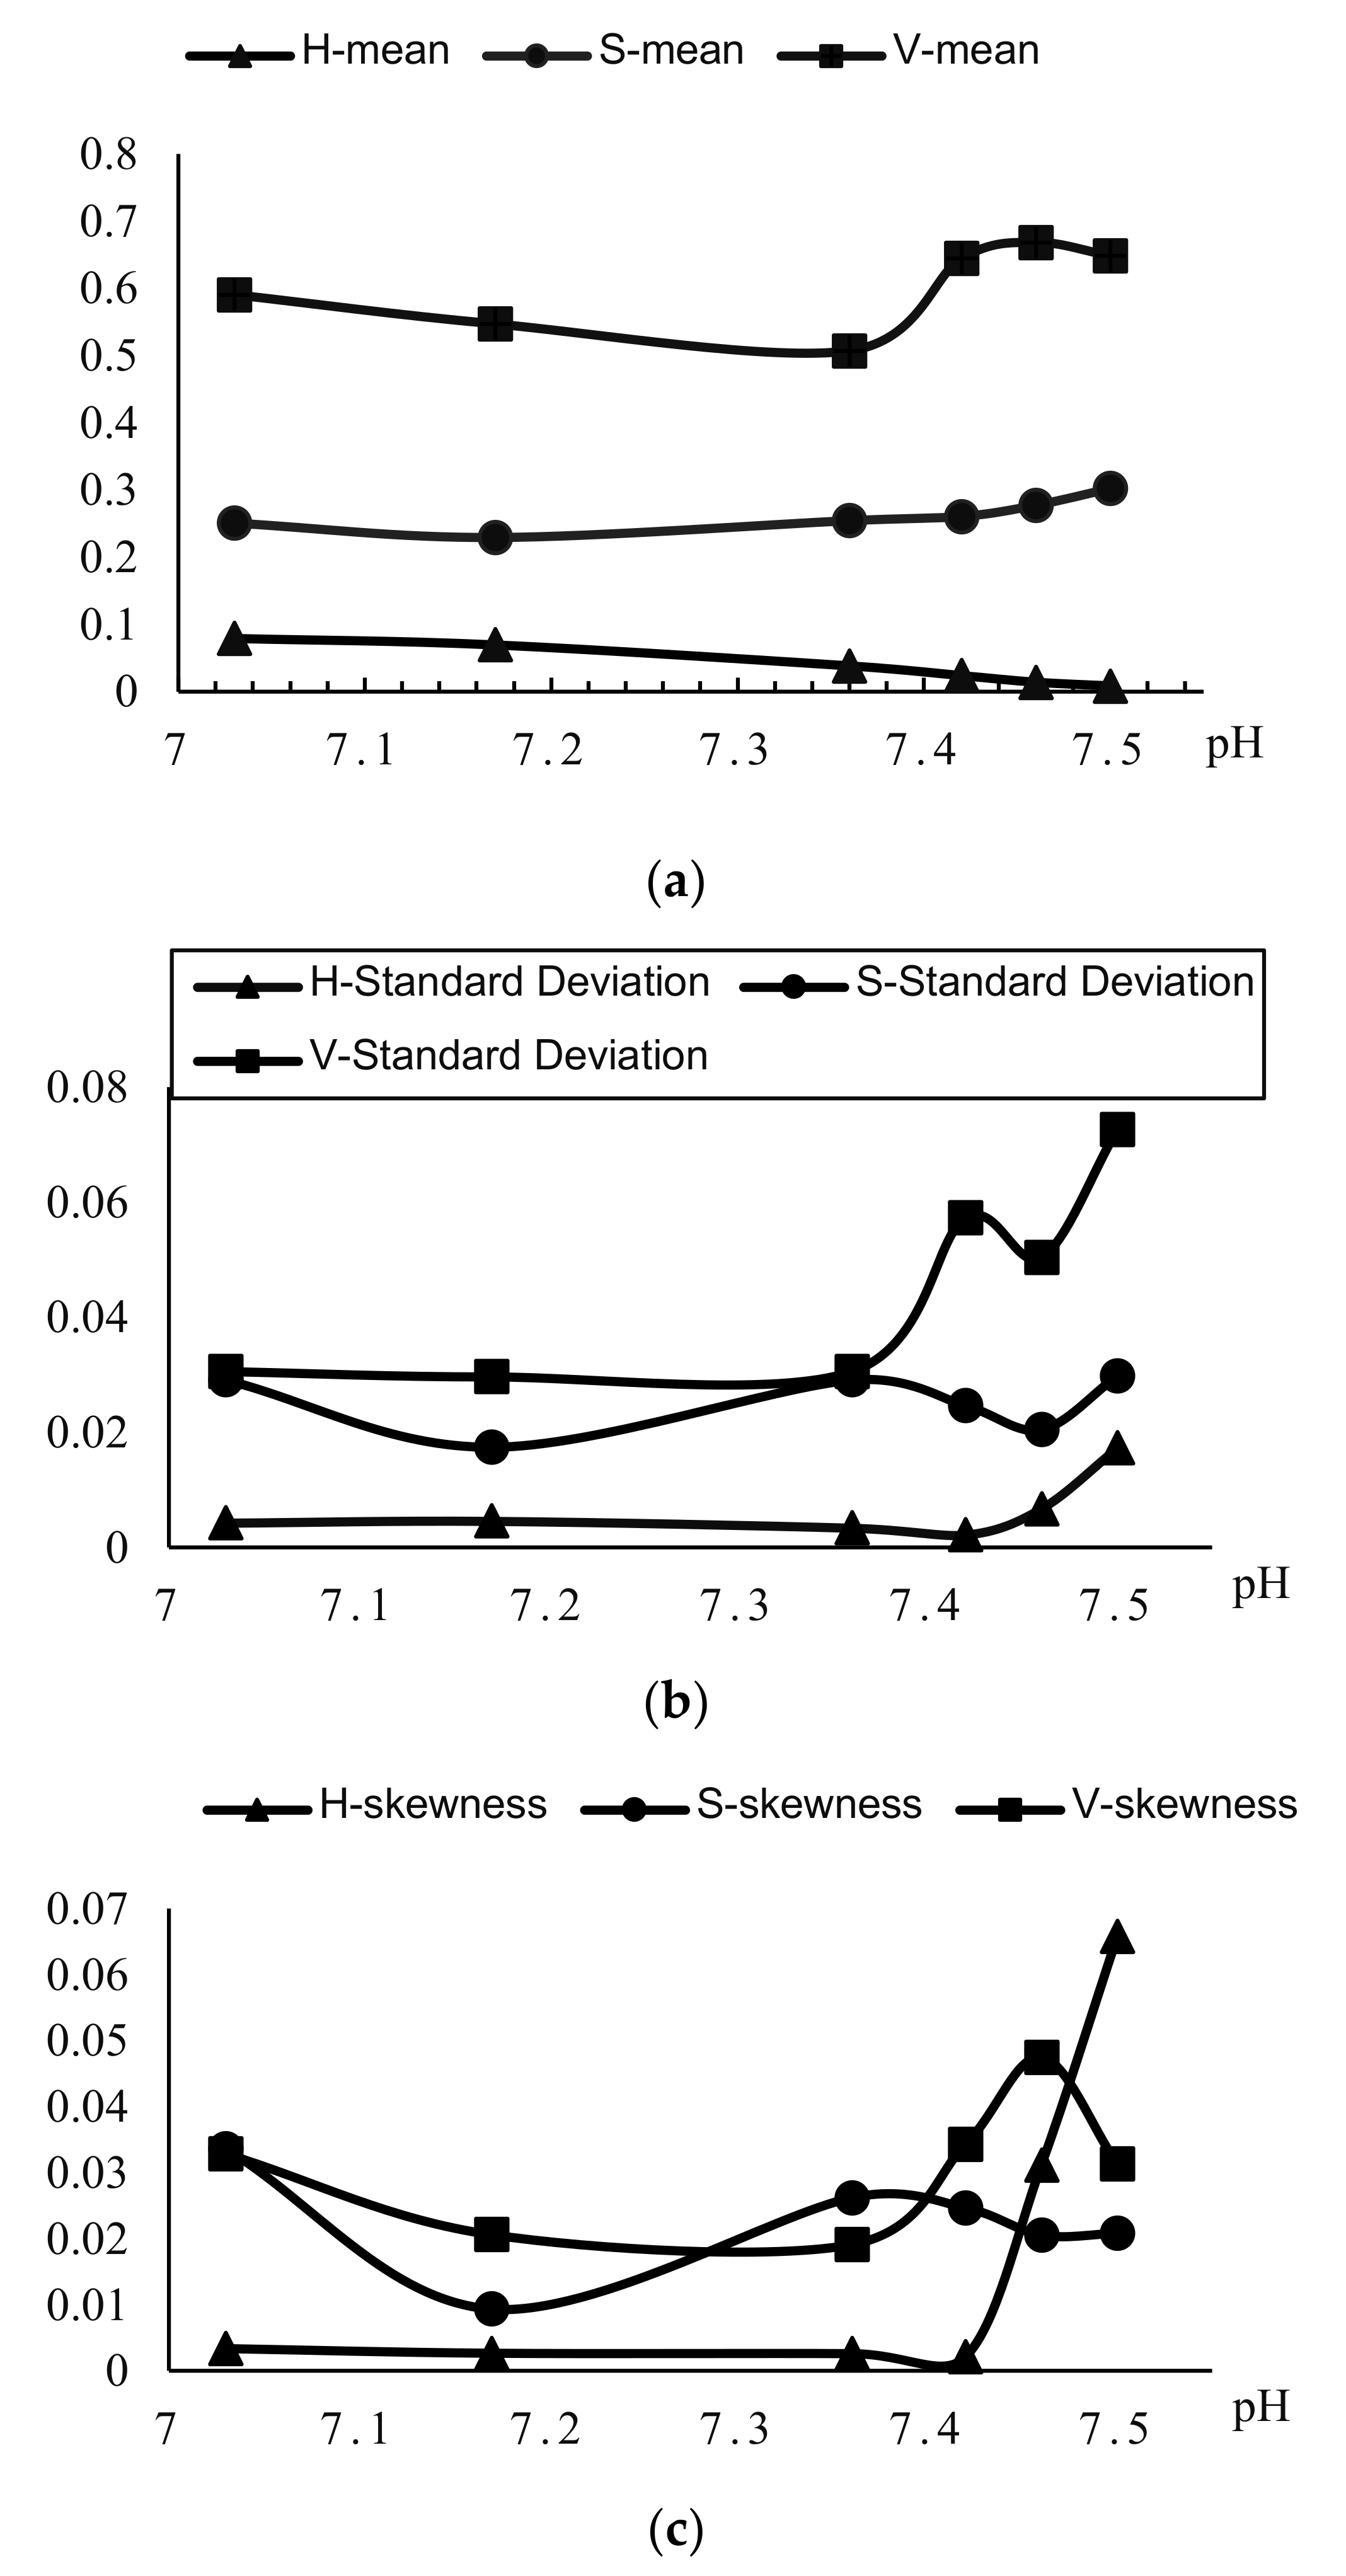
3.1.4. Color Moments in HSV Color Space

As the time in cell culture increases, carbon dioxide in the incubator undergoes a neutralization reaction with buffer substances in the culture fluid. The phenol red color development in the culture fluid gradually changes from red to orange and finally to yellow. Its color feature is often the standard to determine whether to change the liquid. The color feature is a global feature that describes the surface properties of the corresponding field within an image or image area. Color feature descriptions can be divided into color histograms, color moments (color distribution), color sets, color aggregation vectors, and color correlation plots [22,23]. A color moment in HSV color space was used as a color feature in this study [24,25,26]. As the color information is mainly distributed in low-order moments, the first, second, and third-order moments were sufficient to represent the color distribution of the image. The advantage of this method is that color space quantization is not required, and the dimension of the eigenvector is low. Its mathematical definition is:
Theorem 1.
Color moment eigenvalue [27].
μ i = 1 N j = 1 N p i , j σ i = 1 N j = 1 N p i , j μ i 2 1 2 s i = 1 N j = 1 N p i , j μ i 3 1 3
where, represents the i color component of the j pixel of a color image. N represents the number of pixels in the image. The first three-order color moments of RGB images form a 9-dimensional histogram vector. The color features of the image are expressed as:
F color = μ r , σ r , s r , μ a , σ a , s a , μ b , σ b , s b
The steps for establishing a fitting curve model are as follows:
(1)
Convert the image from RGB to HSV (hexconemodel) [28] format to obtain the HSV component of the image; calculate the number of image pixels;
(2)
Then, the average, variance, and skewness of HSV are obtained;
(3)
Coexist the obtained value with the measured pH value. For example, in the table file, the table is arranged according to the value of pH;
(4)
Find out the color characteristics that meet the linear relationship, establish a functional model, and analyze the functional relationship between HSV and pH.

3.2. Analysis of HSV and pH Function Model

3.2.1. HSV Characteristic Quantification Value Selection

After extracting the target image and removing the interference image processing, the centroid coordinates were obtained, the target image was clipped, and the HSV feature quantification value of the clipped image was calculated. The quantified values of HSV characteristics and corresponding pH values of the in-hole images in this experiment are shown in Table 2 below.
The trend graph corresponding to the color moment in the HSV color space is shown in Figure 7.
According to the relationship between the pH of the orifice plate and the color moment of the image shown in Figure 7, only the value of the average hue and pH are inversely related among the quantified values of color moments of images. The larger the pH value (the color of the culture fluid is biased towards red), the smaller the average hue of the solution image inside the well. The greater the pH value (the color of the culture fluid is biased towards yellow), the greater its average of hue. According to this law, the average hue as a function of pH is established.

3.2.2. Curve-Fitting Analysis between the Average of Hue and pH

Image acquisition of the 6-hole orifice plate was carried out at different placement positions. Upon calculating the first moment of h of 6-bit orifice image, the results were sorted into holes 1–6; the calculation results of the first moment of h of the captured image are shown in Table 3.
After fitting the above data, the resulting model formula is:
pH = 7.567 × e 0.860 × H m e a n
The fitting curve is shown in Figure 8. Since the pH value of cell culture fluid shows a tendency of step-down, Hmean does not change when it is in a certain range.
The sum of squares of the errors of the corresponding points of the fitted and original data were first calculated. The closer the SSE is to 0, the better the model selection and fit, and the more successful the data prediction is. The resulting SSE was calculated as follows:
SSE = i = 1 n w i y i y ^ i 2 = 0.024
When SSE was calculated, the values of SSE were smaller. This indicated that the model selection was appropriate, and the fit was quite good.
Next, the means of the sums of squares of the point errors corresponding to the predicted and original data are calculated. MSE was calculated as follows:
MSE = 1 n i = 1 n w i y i y ^ i 2 = 0.0008
The MSE is small, indicating that the fit data and the original data have less deviation from corresponding points.

3.3. Verification of Functional Model

3.3.1. Function Model Range Setting

The image of the orifice plate filled with three-holes liquid were input into the program. The average of hue and its corresponding pH are shown in Table 4 below.
The higher average hue of the images of well 5 was mainly due to the fact that the freshly removed culture medium was purple-red. However, the culture solution that had been incubated for a certain time in the 5% CO2 incubator reacted with the buffer system NaHCO3, and so on, in the culture solution. The culture gradually turned bright red [11,29].
Cells were cultured with 6-well plates, each containing different concentrations of cell fluid. During the incubation process, holes were collected at intervals to calculate the average hue. If the average of the hue of the calculated image in the hole was greater than 0.5, the calculation was made after a 12 h interval. The images collected after 12 h intervals were bright red or orange or yellow and had no effect on the pH calculation. If the average of hue was less than 0.07, the image was taken at an interval of 1 h, and the average hue was calculated to monitor the change in pH. When the pH set by the operator is reached, the operator is reminded to change fluids or perform alkaline recharge operations.

3.3.2. Error Analysis of Function Model

In order to verify the feasibility of the function model established by the experiment, pore 1 and pore 3 in Table 4 were utilized for model validation. We took pictures at different locations, then calculated Hee, as shown in Table 5 below.
The root means square error (RMSE) of the fitting curve is (does not contain well 5):
RMSE = 1 n i = 1 n y i y ^ i 2 RMSE = 0.1093
The above experiments show that the culture medium was initially purple-red. After neutralizing in a carbon dioxide incubator for some time, it appeared bright red. Its average hue was reduced to between 0.01 and 0.02. Therefore, the average hue value of the image in the hole was calculated after obtaining the image, and if it was greater than 0.1, the image was acquired after 12 h.
The averages of hue values were calculated from the hole plate images taken at different angles, and the pH values were predicted from the average of hue. The root means square error RMSE of the fitted curve was 0.1093. The error was small and the prediction accuracy was high. Therefore, the error of predicting the pH value of HSV using the average of hue was small, and the curve fitted satisfied the requirements of the F test and feasibility analysis. That is, it was feasible to use the average of the hue of HSV to monitor and predict its pH change.

4. Discussion

In the process of cell culture, in order to meet the environmental conditions of cell growth, it is necessary to reduce the effect of low pH on cell growth. Along with the growth of cells, the waste of cell metabolism increases gradually. This process changes from bright red to orange in the cell culture medium as shown by color indicators. Therefore, in the process of cell culture in vitro, it is necessary to monitor the change of pH—that is, the change of the color indicator. In image processing, this process can be shown by its tone.
To solve the problem of excessive cell metabolites affecting cell growth, we need to monitor the change of pH during culture. This paper establishes the relationship between color distance characteristic values and pH and shows that there is an inverse relationship between pH value and the average hue. The cubic fit curve between the average of hue and its pH meets the requirements of the F-test and feasibility analysis. The root means square error between the predicted pH value and the real pH value of the fitting curve was 0.01588. Based on the experimental data, the accuracy of the predicted pH values is high. The results showed that pH monitoring of cell culture medium based on HSV color space did not require operator observation and midway sampling. This method reduces the possibility of cell contamination during sampling and is a low-cost and high-efficiency non-destructive pH monitoring method for cell culture media.

5. Conclusions

To address the the poor quality of cultured cells caused by a lack of monitoring of cell culture medium pH and visual observation, this paper studied a monitoring algorithm of cell culture medium pH by combining machine vision technology and image processing technology. In order to solve the problem that traditional monitoring methods have in risking cell pollution and producing cells of unstable quality, this paper used the color moment method to propose that the average of hue of the cell fluid can be used as the image feature of its pH value. The experimental results show that the pH value of the cell culture medium can be obtained in real-time for perforated plates taken at different positions on the cell culture plate scaffold. The method makes up for the lack of pH monitoring in automatic cell culture equipment, which can not only improve the accuracy and objectivity of the measured pH value, but also overcome the irreversible damage to cells caused by prolonged destructive pH levels in cell culture media produced by manual observation and empirical judgment or by the failure to supplement alkali in time. Especially when stem cells are cultured as seed cells, this method can reduce the labor cost of the culture process and does not require professional experience in pH prediction. This monitoring method provides a reliable basis for the determination of subsequent fluid replacement and alkali supplement in the cell culture process and provides certain technical support for the pH monitoring of automatic cell culture equipment. It has good application prospects and important social and economic value.

Author Contributions

Conceptualization, Y.L. and A.H.; methodology, Y.L.; software, Y.L.; validation, Y.L., A.H. and L.S.; formal analysis, Y.L. and T.Z.; investigation, Y.L.; resources, Y.L.; data curation, Y.L.; writing—original draft preparation, Y.L.; writing—review and editing, L.S.; project administration, L.W. and Z.S.; funding acquisition, L.S. All authors have read and agreed to the published version of the manuscript.

Funding

This research was funded by Preferred Postdoctoral Research Projects Foundation of Zhejiang Province, grant number ZJ2021003, Zhejiang Provincial Key Research and Development Program of China (2020C03026) and the Innovative Teams of “3315 Plan” in Ningbo(2020A-17-C).

Institutional Review Board Statement

Not applicable for this study.

Informed Consent Statement

Not applicable.

Data Availability Statement

Not applicable.

Acknowledgments

The authors extend their appreciation to Lulu Shi and Luhong Wen for funding this work through Preferred Postdoctoral Research Projects Foundation of Zhejiang Province, grant number: Zhejiang Provincial Key Research and Development Program of China (2020C03026) and the Innovative Teams of “3315 Plan” in Ningbo(2020A-17-C).

Conflicts of Interest

The authors declare no conflict of interest.

References

  1. Doulgkeroglou, M.-N.; Di Nubila, A.; Niessing, B.; König, N.; Schmitt, R.H.; Damen, J.; Szilvassy, S.J.; Chang, W.; Csontos, L.; Louis, S.; et al. Automation, Monitoring, and Standardization of Cell Product Manufacturing. Front. Bioeng. Biotechnol. 2020, 8, 811. [Google Scholar] [CrossRef] [PubMed]
  2. Cardona, A.; Ariza-Jiménez, L.; Uribe, D.; Arroyave, J.C.; Galeano, J.; Cortés-Mancera, F.M. Bio-EdIP: An automatic approach for in vitro cell confluence images quantificatio. Comput. Methods Programs Biomed. 2017, 145, 23–33. [Google Scholar] [CrossRef] [PubMed]
  3. Refresh cell culture. Nat. Biomed. Eng. 2015, 5, 783–784. [CrossRef]
  4. Trebinska-Stryjewska, A.; Swiech, O.; Opuchlik, L.J.; Grzybowska, E.A.; Bilewicz, R. Impact of Medium pH on DOX Toxicity toward HeLa and A498 Cell Lines. ACS Omega 2020, 5, 7979–7986. [Google Scholar] [CrossRef] [PubMed]
  5. Swiech, O.; Majdecki, M.; Opuchlik, L.J.; Bilewicz, R. Impact of pH and cell medium on the interaction of doxorubicin with lipoic acid cyclodextrin conjugate as the drug carrier. J. Incl. Phenom. Macrocycl. Chem. 2020, 97, 129–136. [Google Scholar] [CrossRef]
  6. Bertoncello, I. Optimizing the Cell Culture Microenvironment. In Mouse Cell Culture; Humana Press: New York, NY, USA, 2019; Volume 1940, pp. 23–30. [Google Scholar]
  7. Chen, W.T.; Zhao, P. Effect of different pH values on the growth of human embryonic lung diploid fibroblasts MRC-5. J. Shanxi Med. Univ. 2014, 45, 347–349. (In Chinese) [Google Scholar]
  8. Fan, P.S.; Zhu, D.F.; Chen, F.H.; Hu, B.; Zhuang, J.S.; Lin, X.M.; Hu, L.Y.; He, L.N. Effect of pH on the prolif eration of LAK cells and the combination with rIL-2 against malignant tumors. Chin. J. Microcirc. 2002, 12. [Google Scholar] [CrossRef]
  9. Xue, H.L.; Luo, N.; Yang, H.; Shen, X.F.; Ju, G. Effect of pH on the survival of adult rat olfactory sheath cells cultured in vitro. Chin. J. Neuroanat. 2006, 373–378. [Google Scholar] [CrossRef]
  10. Suo, Y.S.; Li, Y.M.; Hua, Y.F.; Xiao, X.; Liu, Z.W.; Jin, S.X. Effect of pH on vitro matura tion of porcine oocytes in culture. J. Anim. Sci. Vet. Med. 2005, 4–5. [Google Scholar] [CrossRef]
  11. Lewinska, A.; Wnuk, M.; Slota, E.; Bartosz, G. Total anti-oxidant capacity of cell culture media. Clin. Exp. Pharmacol. Physiol. 2007, 34, 781–786. [Google Scholar] [CrossRef] [PubMed]
  12. Cohen, J. Computers and biology. Commun. ACM 2001, 44, 76–77. [Google Scholar] [CrossRef]
  13. Lürig, M.D.; Donoughe, S.; Svensson, E.I.; Porto, A.; Tsuboi, M. Computer Vision, Machine Learning, and the Promise of Phenomics in Ecology and Evolutionary Biology. Front. Ecol. Evol. 2021, 9, 642774. [Google Scholar] [CrossRef]
  14. Hu, Z.W.; Liu, W. Fully automated cell culture based on FPGA. Digit. User 2019, 105–108. [Google Scholar]
  15. Guangzhou Institute of Biomedicine and Health; Chinese Academy of Sciences. Development of fully automated stem cell induction culture equipment. Bull. Chin. Acad. Sci. 2018, 33, 86–89. [Google Scholar]
  16. Korzynska, A.; Iwanowski, M.; Neuman, U.; Dobrowolska, E.; Hoser, P. Comparison of the methods of microscopic image segmentation. In Proceedings of the 11th International Congress of the IUPESM/World Congress on Medical Physics and Biomedical Engineering, Munich, Germany, 7–12 September 2009; Springer: Berlin/Heidelberg, Germany, 2009. [Google Scholar]
  17. Edlund, C.; Jackson, T.R.; Khalid, N.; Bevan, N.; Dale, T.; Dengel, A.; Ahmed, S.; Trygg, J.; Sjögren, R. LIVECell—A large-scale dataset for label-free live cell segmentation. Nat. Methods 2021, 18, 1038–1045. [Google Scholar] [CrossRef] [PubMed]
  18. Loesdau, M.; Chabrier, S.; Gabillon, A. Hue and Saturation in the RGB Color Space. In Proceedings of the International Conference on Image and Signal Processing (ICISP), Dubrovnik, Croatia, 12–15 May 2014; Volume 8509, pp. 203–212. [Google Scholar]
  19. Huang, Y.; Xiong, L.; Liu, Y.; Deng, P.; Dan, B. Image segmentation of argon blowing based on improved Otsu algorithm. In Proceedings of the 4th International Conference on Intelligent Autonomous Systems (ICoIAS), Wuhan, China, 14–16 May 2021; IEEE: Piscataway, NJ, USA, 2021. [Google Scholar]
  20. Tan, Z.Y.; Basah, S.N.; Yazid, H.; Safar, M.J.A. Performance analysis of Otsu thresholding for sign language segmentation. Multimedia Tools Appl. 2021, 80, 21499–21520. [Google Scholar] [CrossRef]
  21. Wan, M.; Ren, K.; Gu, G.; Zhang, X.; Qian, W.; Chen, Q.; Yu, S. Infrared Small Moving Target Detection via Saliency Histogram and Geometrical Invariability. Appl. Sci. 2017, 7, 569. [Google Scholar] [CrossRef] [Green Version]
  22. Li, J.; Feng, K.; Yu, J.; Gu, H. River Extraction of Color Remote Sensing Image Based on HSV and Shape Detection. In Proceedings of the 7th Symposium on Novel Photoelectronic Detection Technology and Applications, Kunming, China, 5–7 November 2020; SPIE: Bellingham, WA, USA, 2021. [Google Scholar]
  23. Liby, J.J.; Jaya, T. HSV model based data hiding in video for watermark applications. J. Intell. Fuzzy Syst. 2021, 41, 2731–2742. [Google Scholar] [CrossRef]
  24. Dandotiya, Y.; Atre, A. Image Retrieval using Edge Detection, RLBP, Color Moment Method for YCbCr and HSV Color Space. In Proceedings of the 2017 International Conference of Electronics, Communication and Aerospace Technology (ICECA), Coimbatore, India, 20–22 April 2017; Volume 2, pp. 662–668. [Google Scholar]
  25. Gupta, B.; Shrivastava, S.; Gupta, M. Optimization of Image Retrieval by using HSV Color Space, Zernike Moment &DWT Technique. In Proceedings of the 2015 IEEE International Conference on Computational Intelligence and Computing Research (ICCIC), Tamilnadu, India, 10–12 December 2015; pp. 522–526. [Google Scholar]
  26. Hamuda, E.; Mc Ginley, B.; Glavin, M.; Jones, E. Automatic crop detection under field conditions using the HSV colour space and morphological operations. Comput. Electron. Agric. 2017, 133, 97–107. [Google Scholar] [CrossRef]
  27. Stricker, M.A.; Orengo, M. Similarity of Color Images. In Storage and Retrieval for Image and Video Databases III; SPIE: Bellingham, WA, USA, 1970; Volume 2420, pp. 381–392. [Google Scholar]
  28. Chen, W.; Shi, Y.Q.; Xuan, G. Identifying Computer Graphics using HSV Color Model and Statistical Moments of Characteristic Functions. In Proceedings of the 2007 IEEE International Conference on Multimedia and Expo, Beijing, China, 2–5 July 2007; pp. 1123–1126. [Google Scholar]
  29. Krycer, J.R.; Lor, M.; Fitzsimmons, R.L.; Hudson, J.E. A cell culture platform for quantifying metabolic substrate oxidation in bicarbonate-buffered medium. J. Biol. Chem. 2021, 298, 101547. [Google Scholar] [CrossRef] [PubMed]
Figure 1. Schematic diagram of the orifice plate image acquisition device.
Applsci 12 07560 g001
Figure 2. Program design.
Applsci 12 07560 g002
Figure 3. (a) Input image; (b) extracted red components of the image.
Applsci 12 07560 g003
Figure 4. Binary image after edge filtering.
Applsci 12 07560 g004
Figure 5. Algorithm flow for cropping the liquid map in the hole.
Applsci 12 07560 g005
Figure 6. Cropped 500 × 500 images.
Applsci 12 07560 g006
Figure 7. (a) Trend graph of the average hue in HSV color space; (b) trend graph of variance in HSV color space; (c) trend graph of slope in HSV color space.
Applsci 12 07560 g007
Figure 8. Fitting diagram of H-Mean and pH cubic curve.
Applsci 12 07560 g008
Table 1. The pH values measured from Hole 1 to Hole 6.
Hole NumberpH
Hole 17.03
Hole 27.17
Hole 37.36
Hole 47.46
Hole 57.42
Hole 67.50
Table 2. Color moments in HSV color space and pH.
H-MeanH-Standard DeviationH-SkewnessS-MeanS-Standard DeviationS-SkewnessV-MeanV-Standard DeviationV-SkewnesspH
0.0791310.0042080.0033590.2507480.0290910.0336220.5906240.0305550.0328387.03
0.0695790.0045180.0026540.2293660.0174020.0093390.5471190.0296260.0206057.17
0.0383640.0033310.0025900.2544400.0290680.0262020.5072120.0305280.0191047.36
0.0239460.0021240.0021190.2605340.0245950.0246520.6444410.0572290.0343097.42
0.0140580.0066780.0311440.2773700.0204550.0205430.6685180.0503890.0474737.46
0.0086040.0172240.0657620.3021910.0297990.0208060.6484460.0725800.0313297.50
Table 3. Hmean and pH value measured by pH meter of orifice plate images of 6-well liquid, collected at different positions.
NumberpHHmean
Position 1Position 2Position 3Position 4Position 5
17.030.0791310.0791140.0790930.0779010.078625
27.170.0695790.0673550.0678780.0685420.066463
37.360.0383640.0301210.0388530.0356520.039785
47.420.0239460.0207220.0251500.0235900.026532
57.460.0140580.0119450.0152830.0130900.013878
67.500.0086040.0069500.0104570.0090350.010730
Table 4. The three wells of the well plate contain the pH of the liquid and its Hmean.
NumberHmeanpH
10.0134277.36
30.0106247.42
50.9652397.60
Table 5. Hmean and pH value measured by pH meter of orifice plate images of 6-well liquid collected at different positions.
NumberHmeanpH
10.0134270.0138180.0139140.0168040.0126180.012687.36
30.0106240.0061170.0084460.009160.007120.0029387.42
50.9652390.9684220.9745660.9740450.9693440.9612557.60
Publisher’s Note: MDPI stays neutral with regard to jurisdictional claims in published maps and institutional affiliations.

