
Effect of Sex-Specific Running Shoes on Female Recreational Runners

 and
and
Abstract
:1. Introduction
2. Materials and Methods
3. Results
4. Discussion
5. Conclusions
Author Contributions
Funding
Institutional Review Board Statement
Informed Consent Statement
Data Availability Statement
Conflicts of Interest
References
- Asplund, C.A.; Brown, D.L. The running shoe prescription: Fit for performance. Physician Sports Med. 2005, 33, 17–24. [Google Scholar] [CrossRef]
- Frederick, E.C. Physiological and ergonomics factors in running shoe design. Appl. Ergon. 1984, 15, 281–287. [Google Scholar] [CrossRef]
- Frederick, E.C. Kinematically mediated effects of sport shoe design: A review. J. Sports Sci. 1986, 4, 169–184. [Google Scholar] [CrossRef]
- Nigg, B.M.; Cigoja, S.; Nigg, S.R. Effects of running shoe construction on performance in long distance running. Footwear Sci. 2020, 12, 133–138. [Google Scholar] [CrossRef]
- Johnson, C.D.; Tenforde, A.S.; Outerleys, J.; Reilly, J.; Davis, I.S. Impact-Related Ground Reaction Forces Are More Strongly Associated with Some Running Injuries Than Others. Am. J. Sports Med. 2020, 48, 3072–3080. [Google Scholar] [CrossRef] [PubMed]
- Pohl, M.B.; Hamill, J.; Davis, I.S. Biomechanical and anatomic factors associated with a history of plantar fasciitis in female runners. Clin. J. Sport Med. 2009, 19, 372–376. [Google Scholar] [CrossRef] [PubMed]
- Milner, C.E.; Ferber, R.; Pollard, C.D.; Hamill, J.; Davis, I.S. Biomechanical factors associated with tibial stress fracture in female runners. Med. Sci. Sports Exerc. 2006, 38, 323–328. [Google Scholar] [CrossRef] [Green Version]
- Pohl, M.B.; Mullineaux, D.R.; Milner, C.E.; Hamill, J.; Davis, I.S. Biomechanical predictors of retrospective tibial stress fractures in runners. J. Biomech. 2008, 41, 1160–1165. [Google Scholar] [CrossRef]
- Richert, F.C.; Stein, T.; Ringhof, S.; Stetter, B.J. The effect of the heel-to-toe drop of standard running shoes on lower limb biomechanics. Footwear Sci. 2019, 11, 161–170. [Google Scholar] [CrossRef]
- Hannigan, J.J.; Pollard, C.D. Differences in running biomechanics between a maximal, traditional, and minimal running shoe. J. Sci. Med. Sport 2020, 23, 15–19. [Google Scholar] [CrossRef] [PubMed] [Green Version]
- Braunstein, B.; Arampatzis, A.; Eysel, P.; Brüggemann, G.-P. Footwear affects the gearing at the ankle and knee joints during running. J. Biomech. 2010, 43, 2120–2125. [Google Scholar] [CrossRef] [PubMed]
- Zhang, M.; Zhou, X.; Zhang, L.; Liu, H.; Yu, B. The effect of heel-to-toe drop of running shoes on patellofemoral joint stress during running. Gait Posture 2022, 93, 230–234. [Google Scholar] [CrossRef] [PubMed]
- Landorf, K.B.; Kaminski, M.R.; Munteanu, S.E.; Zammit, G.V.; Menz, H.B. Activity and footwear characteristics in people with and without plantar heel pain: A matched cross-sectional observational study. Musculoskelet. Care 2022. [Google Scholar] [CrossRef]
- Hunter, I.; McLeod, A.; Valentine, D.; Low, T.; Ward, J.; Hager, R. Running economy, mechanics, and marathon racing shoes. J. Sports Sci. 2019, 37, 2367–2373. [Google Scholar] [CrossRef] [PubMed]
- Whiting, C.S.; Hoogkamer, W.; Kram, R. Metabolic cost of level, uphill, and downhill running in highly cushioned shoes with carbon-fiber plates. J. Sport Health Sci. 2021, 11, 303–308. [Google Scholar] [CrossRef]
- Chumanov, E.S.; Wall-Scheffler, C.; Heiderscheit, B.C. Gender differences in walking and running on level and inclined surfaces. Clin. Biomech. 2008, 23, 1260–1268. [Google Scholar] [CrossRef]
- Ferber, R.; McClay Davis, I.; Williams, D.S., III. Gender differences in lower extremity mechanics during running. Clin. Biomech. 2003, 18, 350–357. [Google Scholar] [CrossRef]
- Nigg, B.M.; Baltich, J.; Maurer, C.; Federolf, P. Shoe midsole hardness, sex and age effects on lower extremity kinematics during running. J. Biomech. 2012, 45, 1692–1697. [Google Scholar] [CrossRef] [Green Version]
- Sinclair, J.; Selfe, J. Sex differences in knee loading in recreational runners. J. Biomech. 2015, 48, 2171–2175. [Google Scholar] [CrossRef] [Green Version]
- Krauss, I.; Grau, S.; Mauch, M.; Maiwald, C.; Horstmann, T. Sex-related differences in foot shape. Ergonomics 2008, 51, 1693–1709. [Google Scholar] [CrossRef]
- Krauss, I.; Langbein, C.; Horstmann, T.; Grau, S. Sex-related differences in foot shape of adult Caucasians—A follow-up study focusing on long and short feet. Ergonomics 2011, 54, 294–300. [Google Scholar] [CrossRef] [PubMed]
- Krauss, I.; Valiant, G.; Horstmann, T.; Grau, S. Comparison of Female Foot Morphology and Last Design in Athletic Footwear—Are Men’s Lasts Appropriate for Women? Res. Sports Med. 2010, 18, 140–156. [Google Scholar] [CrossRef] [PubMed]
- Luo, G.; Houston, V.L.; Mussman, M.; Garbarini, M.; Beattie, A.C.; Thongpop, C. Comparison of Male and Female Foot Shape. J. Am. Podiatr. Med. Assoc. 2009, 99, 383–390. [Google Scholar] [CrossRef] [PubMed]
- Croteau, J. Altra Designs Shoes for Women’s Feet—Here’s Why You Should Try Them. Forbes. Available online: https://www.forbes.com/sites/jeannecroteau/2019/10/11/altra-designs-shoes-for-womens-feet--heres-why-you-should-try-them/ (accessed on 15 October 2021).
- Women’s Torin 4 Plush Road Running Shoe|Altra Running. Altra United States. Available online: https://www.altrarunning.com/shop/women-39%3Bs-torin-4-plush-alw1937k (accessed on 15 July 2022).
- Barton, C.J.; Bonanno, D.; Menz, H.B. Development and evaluation of a tool for the assessment of footwear characteristics. J. Foot Ankle Res. 2009, 2, 10. [Google Scholar] [CrossRef] [PubMed] [Green Version]
- Mündermann, A.; Nigg, B.M.; Stefanyshyn, D.J.; Humble, R.N. Development of a reliable method to assess footwear comfort during running. Gait Posture 2002, 16, 38–45. [Google Scholar] [CrossRef]


| Female Shoe (C1) | Male Shoe (C2) | t-Test (α = 0.05) | |
|---|---|---|---|
| Kinetics | |||
| First Peak Vertical GRF (BW) | 971.99 ± 177.99 | 938.32 ± 202.19 | 0.1843 |
| Peak Anterior GRF (BW) | 135.70 ± 22.35 | 135.89 ± 22.11 | 0.8175 |
| Peak Posterior GRF (BW) | 156.12 ± 21.57 | 153.92 ± 20.29 | 0.1983 |
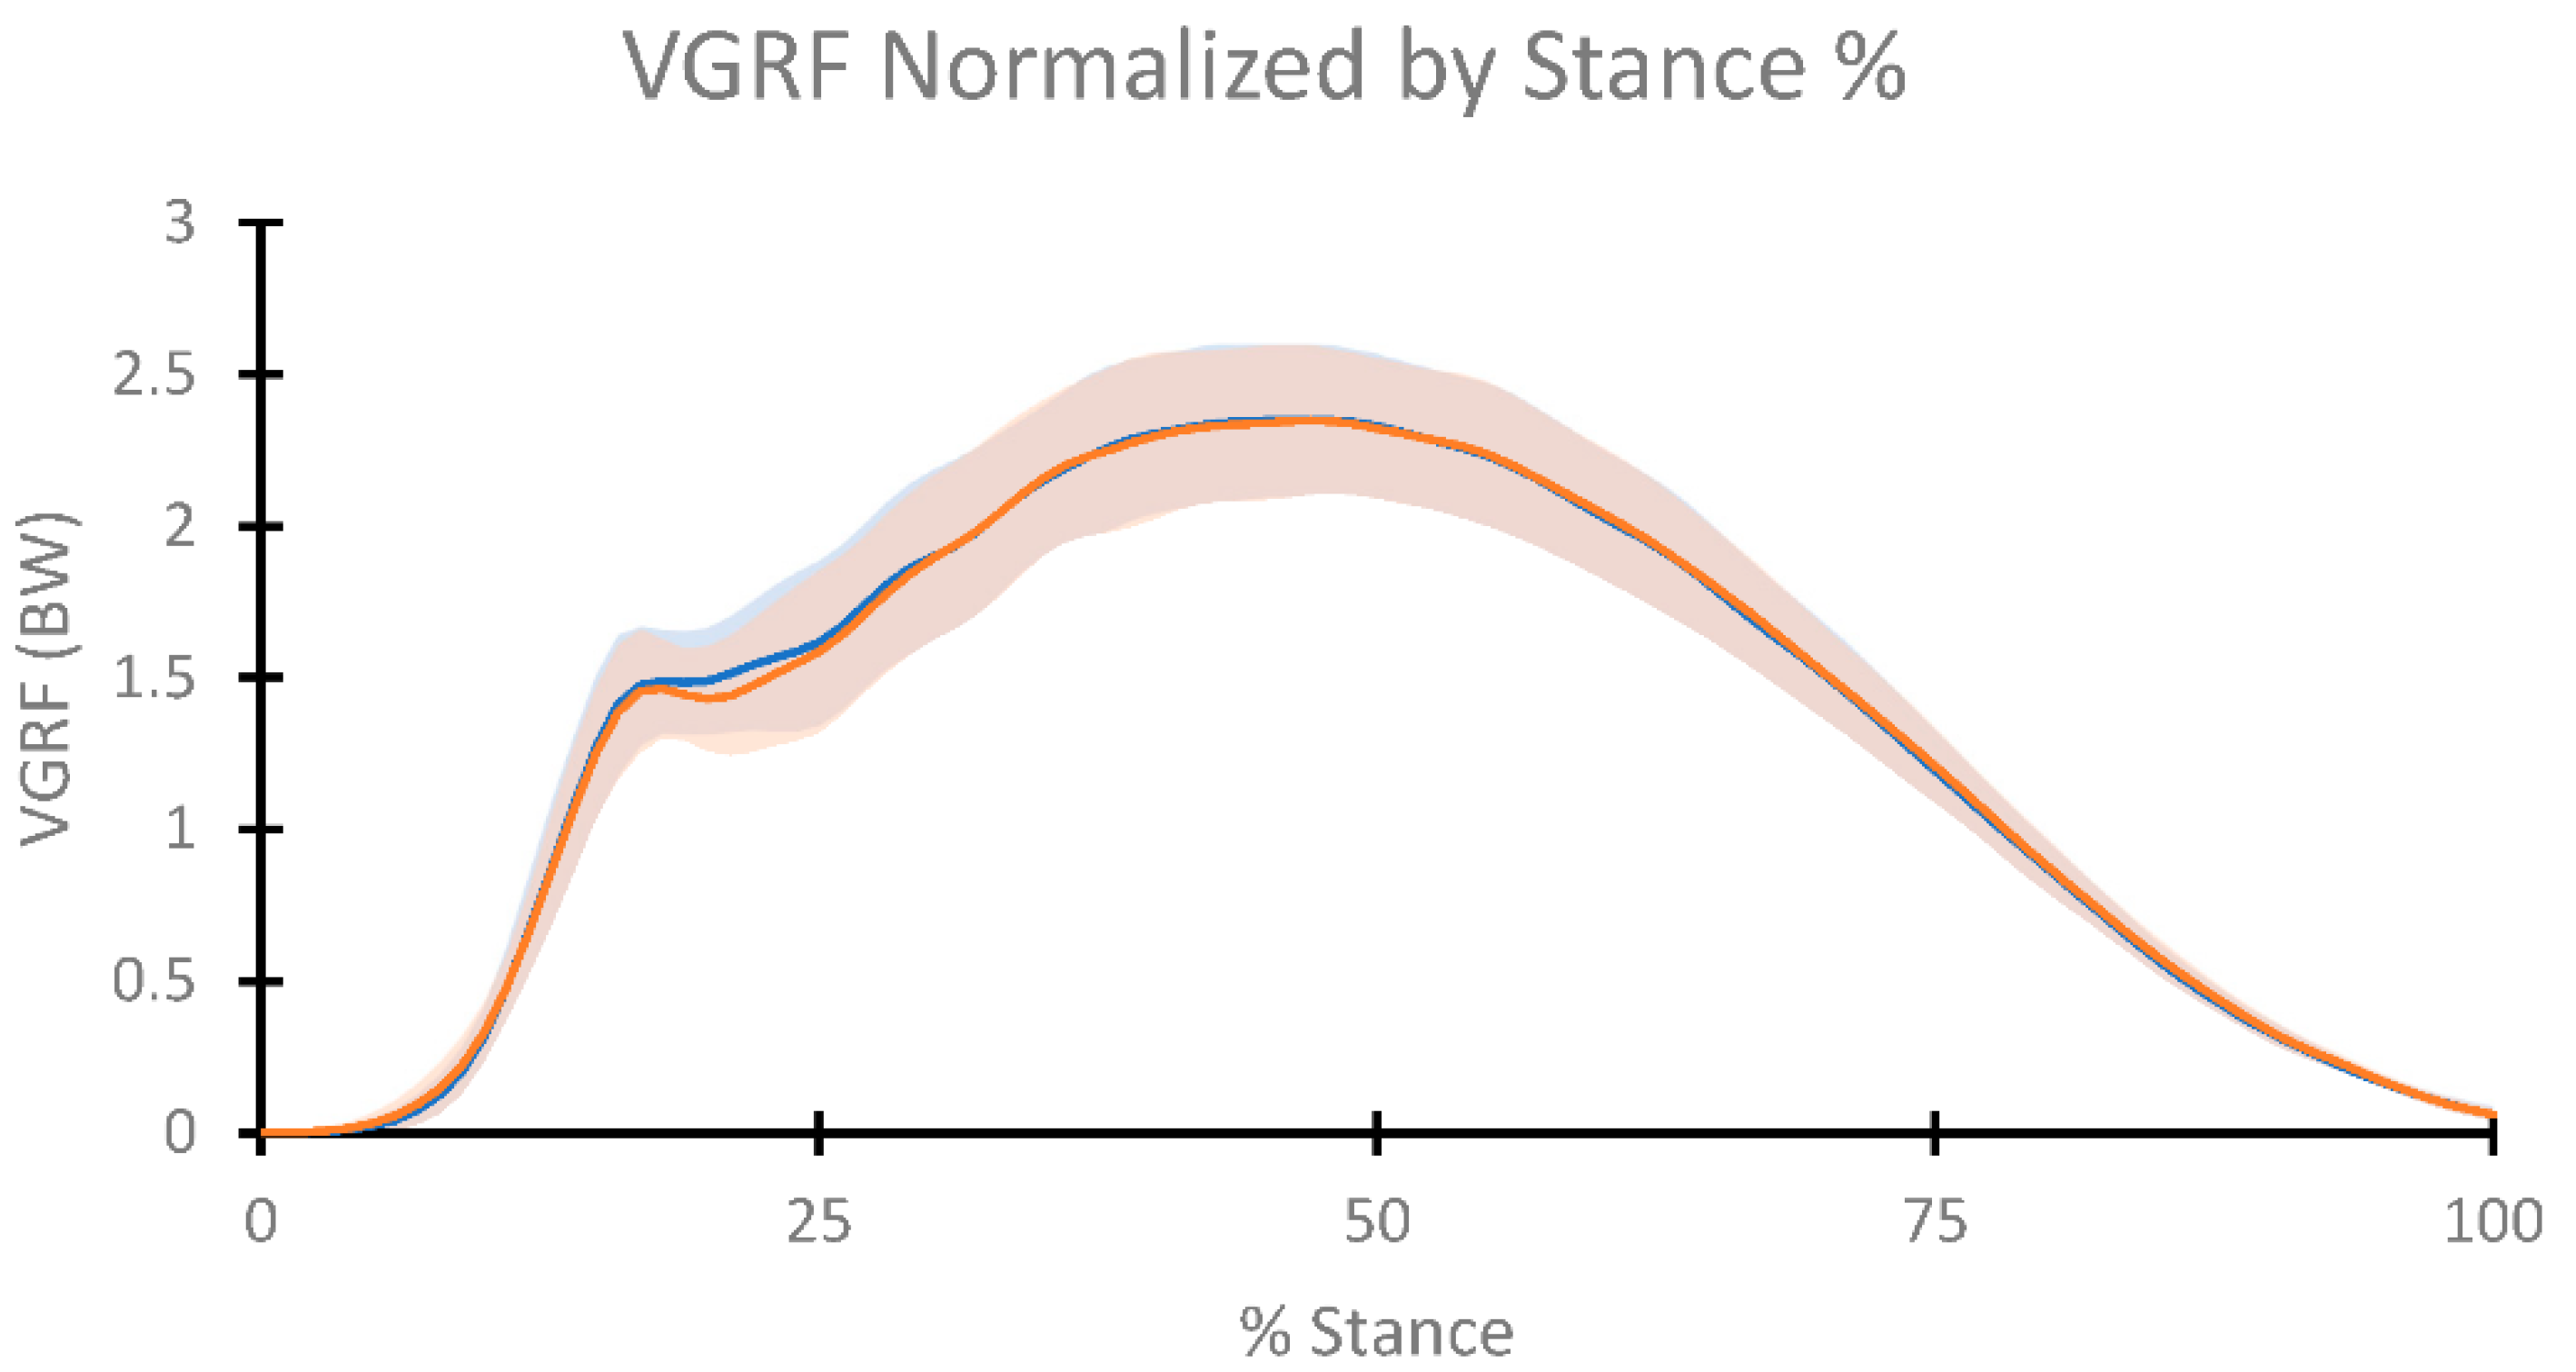
| Peak VGRF (BW) | 1396.59 ± 167.41 | 1394.31 ± 174.89 | 0.6825 |
| Angles | |||
| Hip | |||
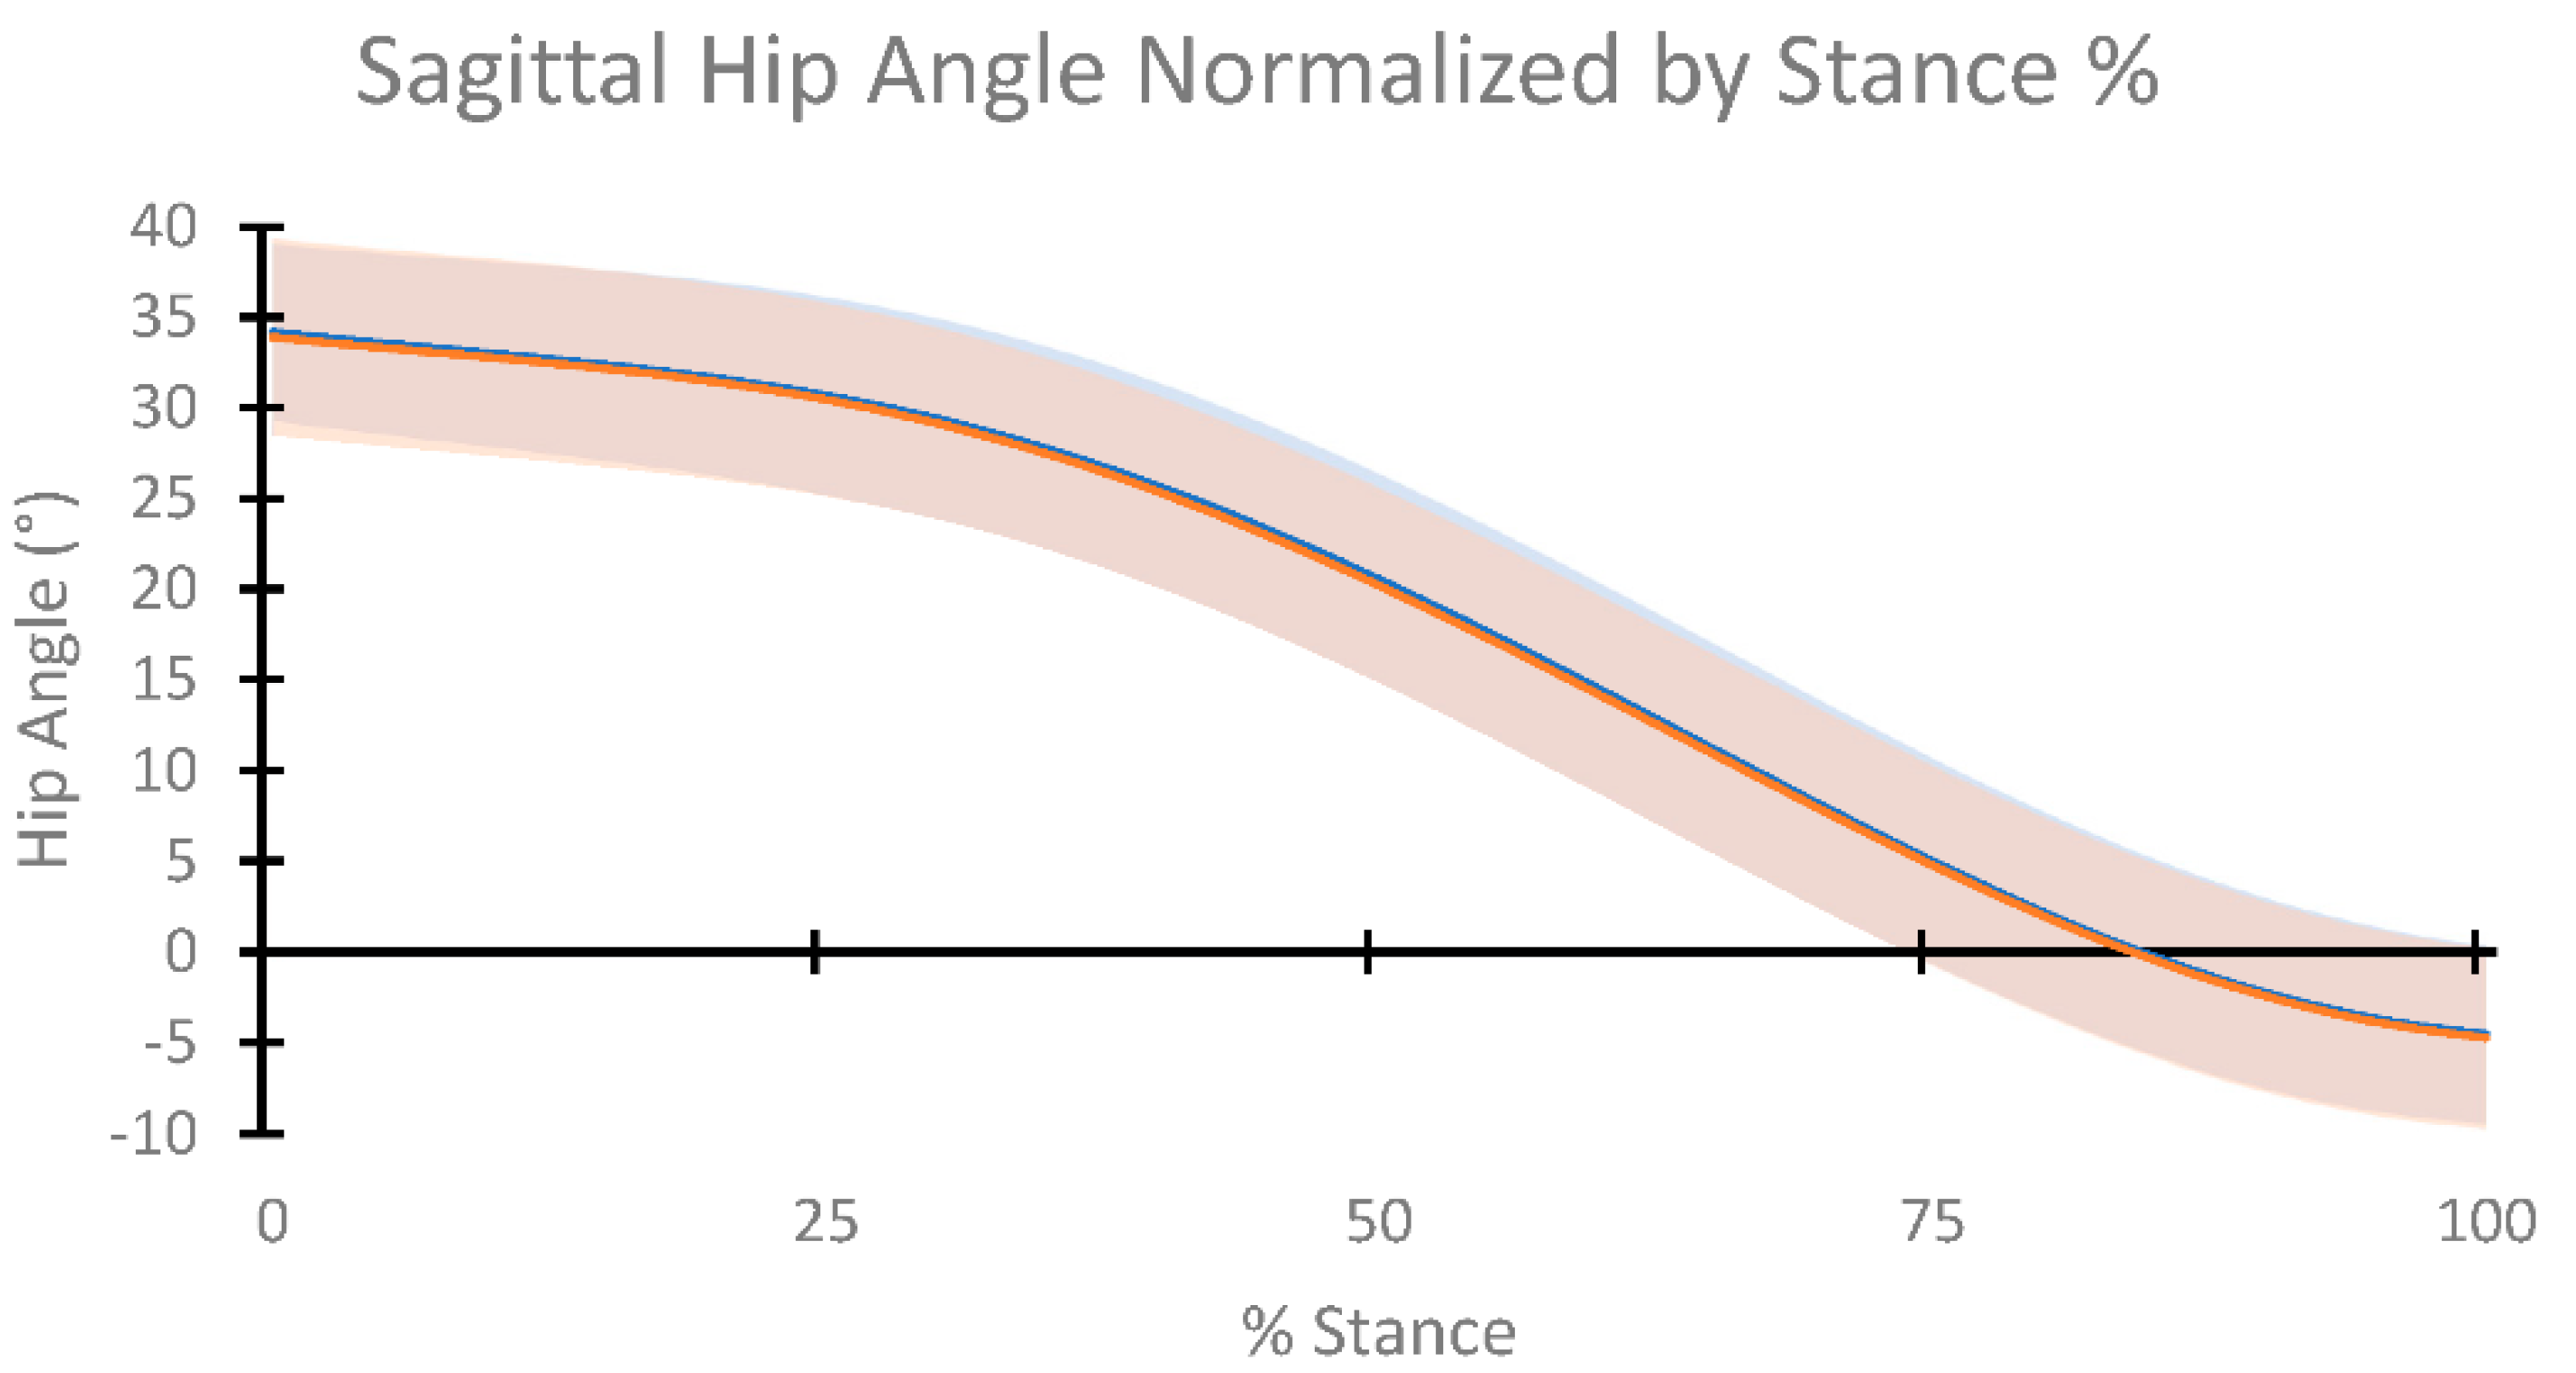
| Sagittal Contact (°) | 34.16 ± 4.80 | 34.29 ± 5.01 | 0.8500 |
| Sagittal Off (°) | −4.63 ± 4.94 | −4.51 ± 4.78 | 0.7646 |
| Peak Adduction (°) | 14.09 ± 4.28 | 14.34 ± 4.10 | 0.4901 |
| Sagittal ROM (°) | −38.79 ± 3.86 | −38.81 ± 3.74 | 0.6761 |
| Knee | |||
| Sagittal Contact (°) | −10.175 ± 3.99 | −9.92 ± 4.31 | 0.6671 |
| Flexion (°) | −37.28 ± 4.59 | −37.31 ± 4.40 | 0.8168 |
| Sagittal Off (°) | −15.24 ± 4.60 | −15.35 ± 5.20 | 0.4563 |
| Adduction (°) | 0.63 ± 3.12 | 0.45 ± 2.83 | 0.8206 |
| Loading ROM (°) | −27.10 ± 5.32 | −27.39 ± 5.30 | 0.5294 |
| Propulsion ROM (°) | 18.40 ± 14.85 | 18.01 ± 15.44 | 0.4816 |
| Ankle | |||
| Foot Strike (°) | 6.00 ± 5.80 | 6.86 ± 7.03 | 0.2561 |
| Peak Dorsiflexion (°) | 17.27 ± 4.39 | 17.60 ± 5.00 | 0.5208 |
| Peak Plantarflexion (°) | −18.77 ± 4.34 | −18.97 ± 4.87 | 0.8619 |
| Sagittal ROM (°) | −32.41 ± 14.86 | −32.63 ± 15.69 | 0.1747 |
| Moments | |||
| Hip | |||
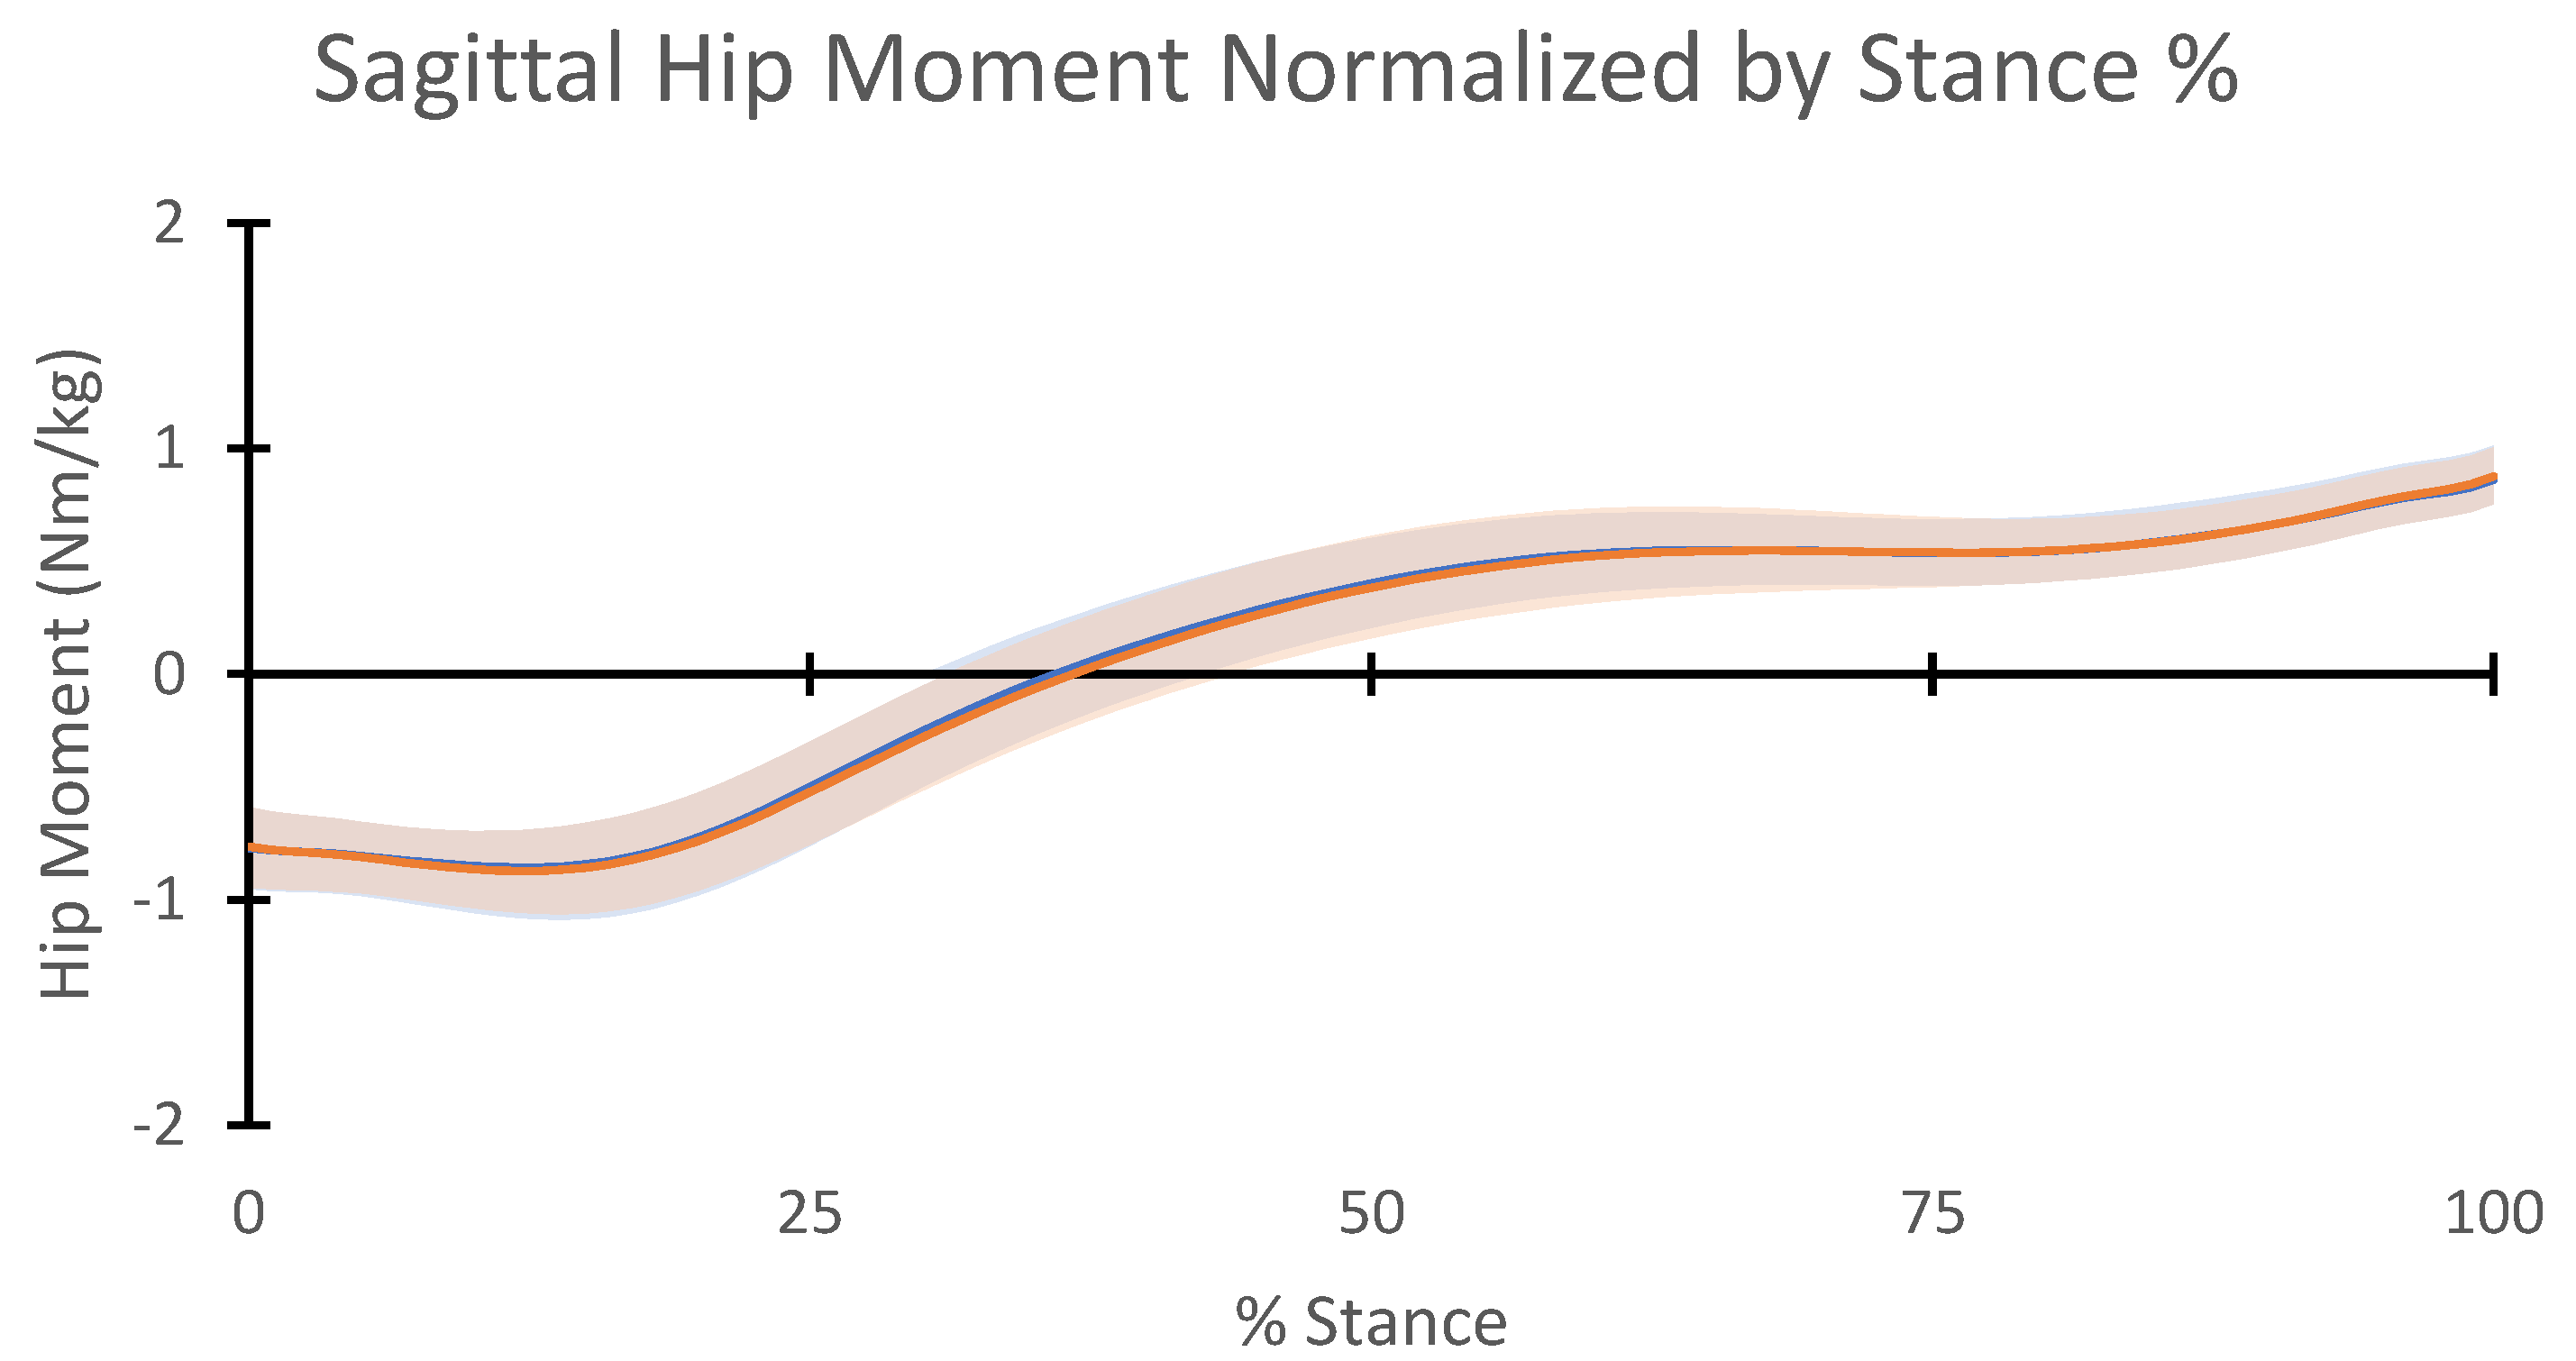
| Peak Extension (Nm/kg) | −0.93 ± 0.19 | −0.93 ± 0.17 | 0.8976 |
| Peak Flexion (Nm/kg) | 0.88 ± 0.14 | 0.89 ± 0.13 | 0.4914 |
| Peak Abduction (Nm/kg) | −1.81 ± 0.24 | −1.81 ± 0.21 | 0.9474 |
| Knee | |||
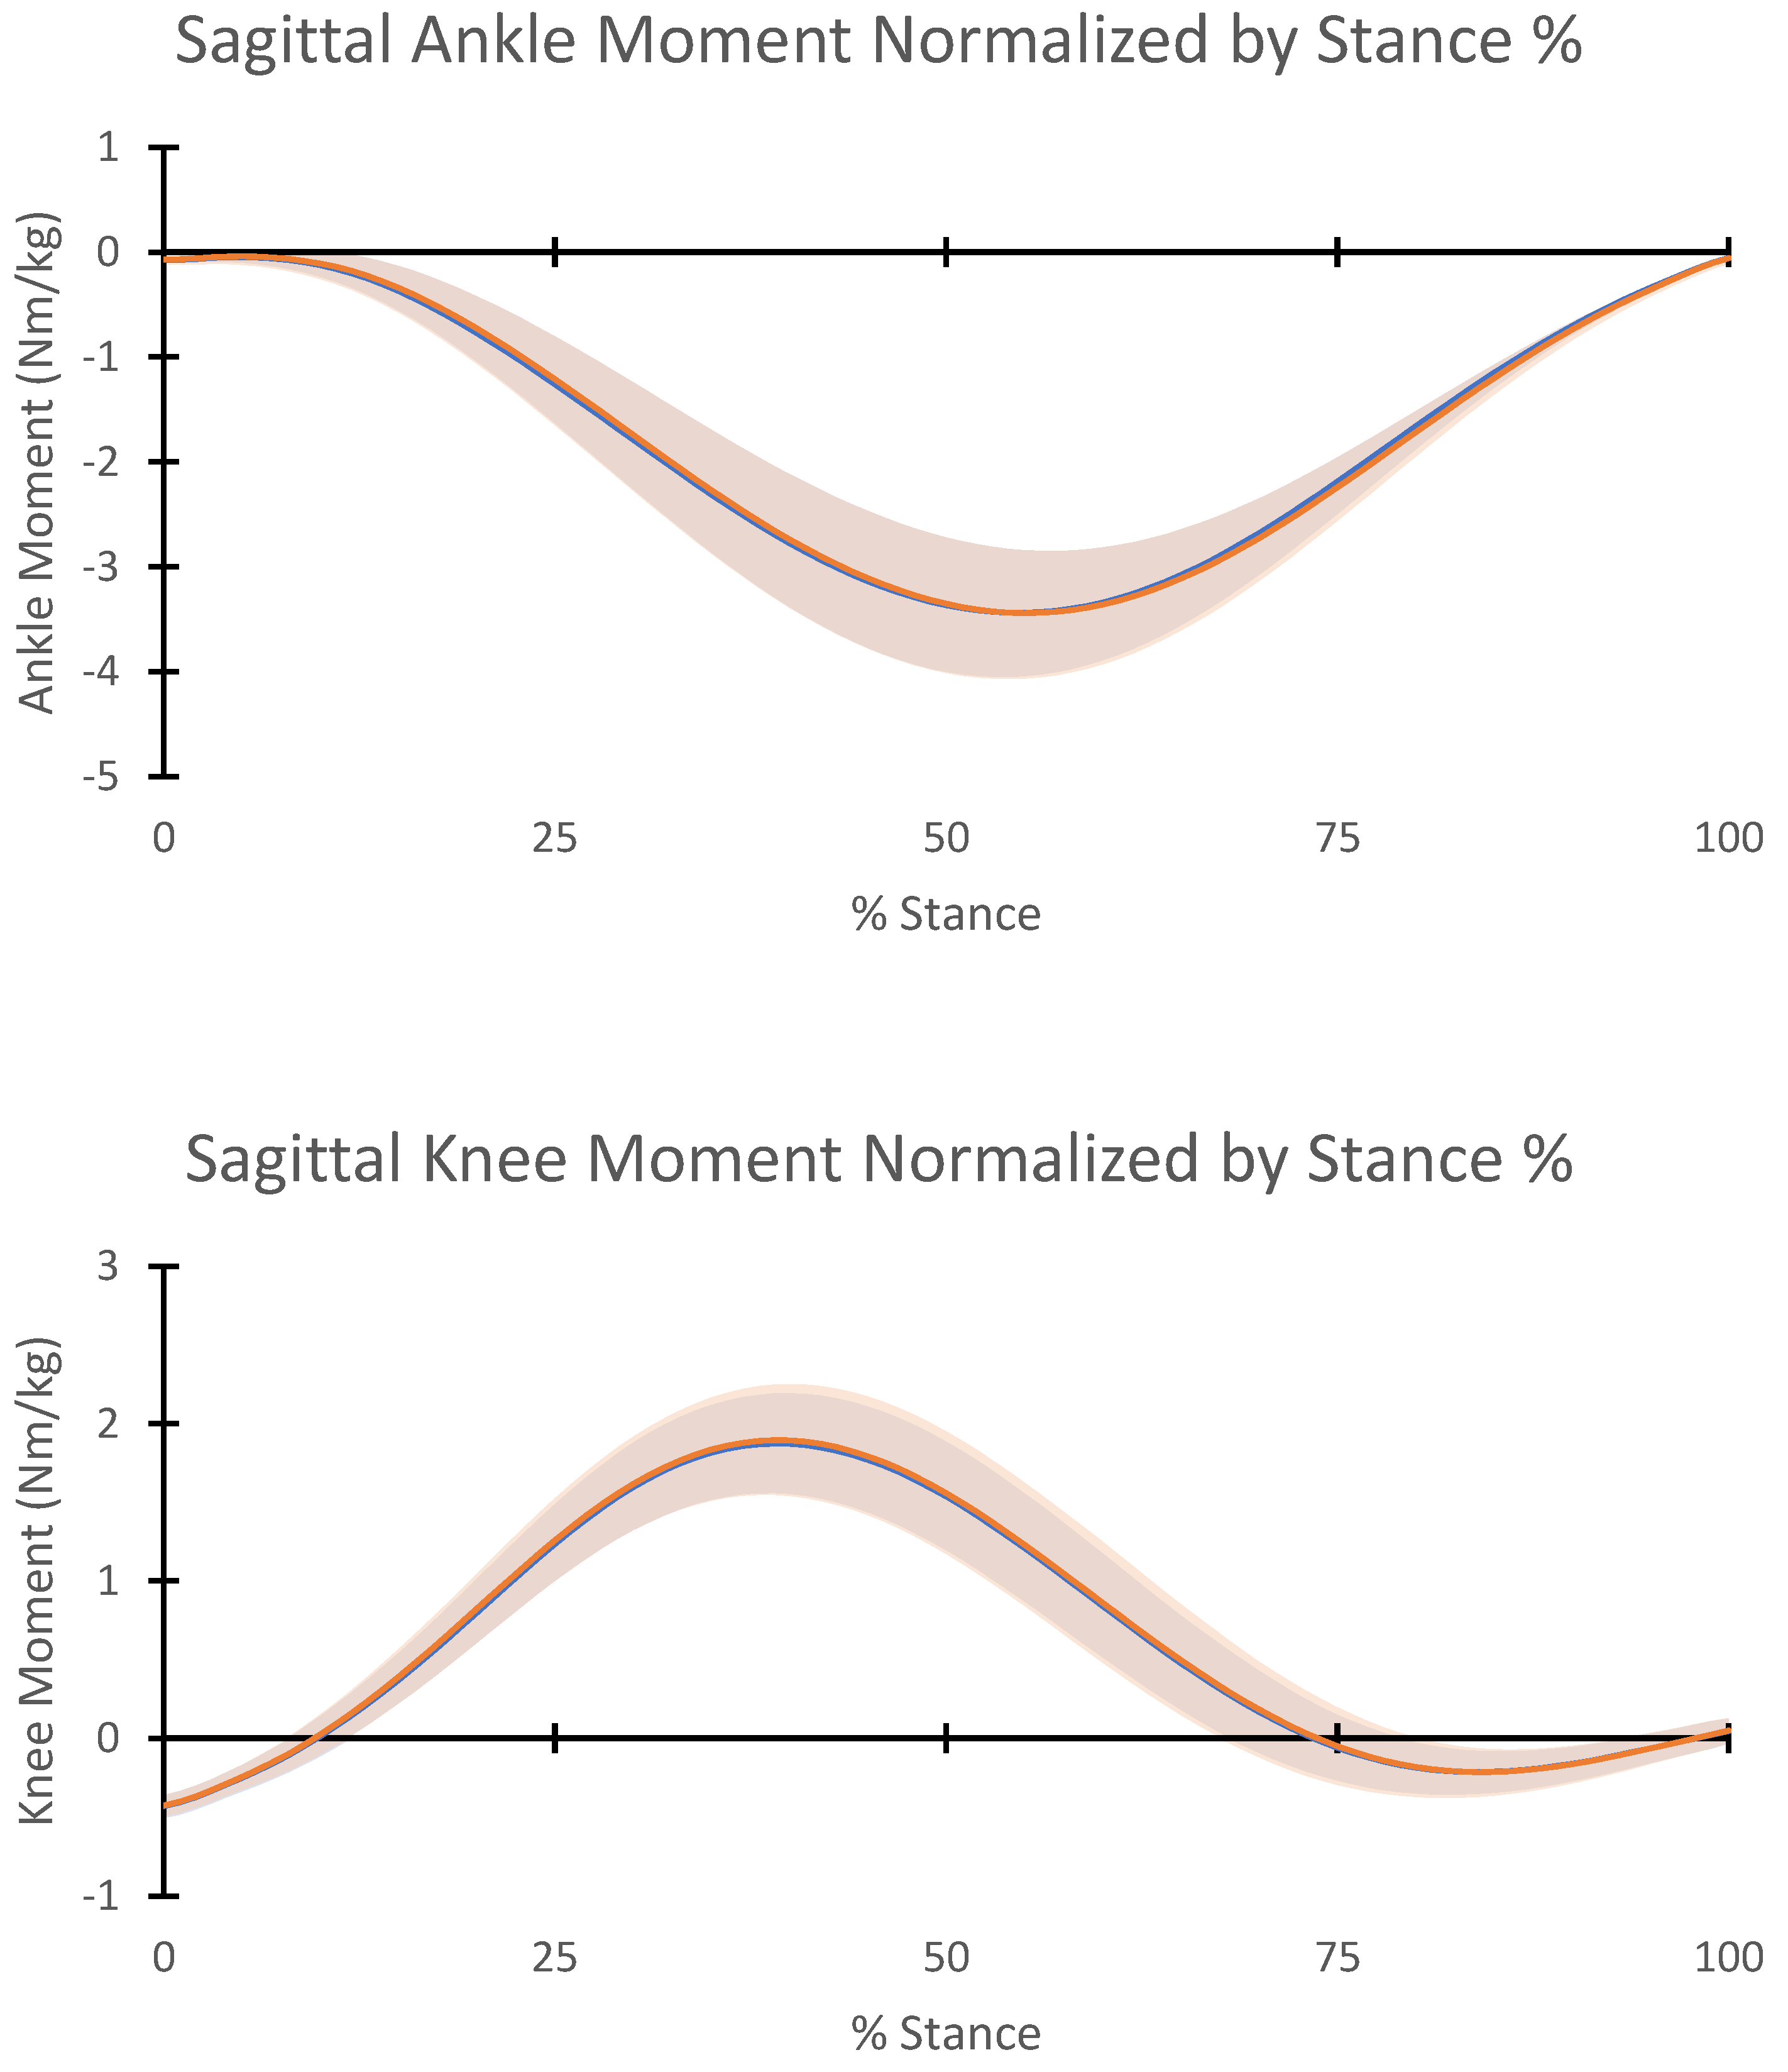
| Peak Extension (Nm/kg) | 1.91 ± 0.32 | 1.90 ± 0.36 | 0.7806 |
| Peak Abduction (Nm/kg) | −0.71 ± 0.22 | −0.72 ± 0.24 | 0.3796 |
| Ankle | |||
| Peak Plantarflexion (Nm/kg) | −3.47 ± 063 | −3.45 ± 0.63 | 0.5620 |
| Peak Inversion (Nm/kg) | 0.55 ± 0.25 | 0.53 ± 0.27 | 0.3352 |
| Peak Eversion (Nm/kg) | −0.08 ± 0.06 | −0.08 ± 0.06 | 0.6444 |
| Female Shoe (C1) | Male Shoe (C2) | p-Value (α = 0.05) | |
|---|---|---|---|
| VO2/kg (mL/kg/m) | 34.88 ± 4.43 | 34.94 ± 4.78 | 0.7090 |
| VO2 (L/min) | 2.13 ± 0.27 | 2.13 ± 0.30 | 0.6437 |
| VCO2 (L/min) | 2.00 ± 0.28 | 1.99 ± 0.30 | 0.4741 |
| RER | 0.94 ± 0.08 | 0.94 ± 0.09 | 0.5115 |
| VE (L/min) | 59.21 ± 7.85 | 58.71 ± 7.76 | 0.3384 |
| Female Shoe (C1) | Male Shoe (C2) | p-Value (α = 0.05) | |
|---|---|---|---|
| Shoe Comfort Perception | 7.37 ± 1.11 | 7.10 ± 1.44 | 0.5579 |
Publisher’s Note: MDPI stays neutral with regard to jurisdictional claims in published maps and institutional affiliations. |
© 2022 by the authors. Licensee MDPI, Basel, Switzerland. This article is an open access article distributed under the terms and conditions of the Creative Commons Attribution (CC BY) license (https://creativecommons.org/licenses/by/4.0/).
Share and Cite
Rasmussen, S.; Wilkes, B.; Poulton, L.; Roser, M.; Draper, S.; Creer, A.; Standifird, T. Effect of Sex-Specific Running Shoes on Female Recreational Runners. Appl. Sci. 2022, 12, 7537. https://doi.org/10.3390/app12157537
Rasmussen S, Wilkes B, Poulton L, Roser M, Draper S, Creer A, Standifird T. Effect of Sex-Specific Running Shoes on Female Recreational Runners. Applied Sciences. 2022; 12(15):7537. https://doi.org/10.3390/app12157537
Chicago/Turabian StyleRasmussen, Spencer, Baker Wilkes, Lily Poulton, Megan Roser, Shane Draper, Andrew Creer, and Tyler Standifird. 2022. "Effect of Sex-Specific Running Shoes on Female Recreational Runners" Applied Sciences 12, no. 15: 7537. https://doi.org/10.3390/app12157537
APA StyleRasmussen, S., Wilkes, B., Poulton, L., Roser, M., Draper, S., Creer, A., & Standifird, T. (2022). Effect of Sex-Specific Running Shoes on Female Recreational Runners. Applied Sciences, 12(15), 7537. https://doi.org/10.3390/app12157537