Featured Application
The article describes the results of a project that concerned the creation of a method of using big data to build traffic models in special periods (e.g., during a pandemic) when obtaining data in a traditional way is difficult or not possible. Then, based on the comparison between those models and the typical state of the transport system, it is possible to perform comparative analysis and impact analyses. For example, analyses of social cost related to travel restrictions can be estimated.
Abstract
During a pandemic, the mobility of people changes significantly from the normal situation (the number of trips made, the directions of travel and the modes of transport used). Changes in mobility depend on the scale of the pandemic threat and the scale of the restrictions introduced and assessing the impact of these changes is not straightforward. This raises the question of the social cost of changes in mobility and their impact on the environment, including air quality. The article shows that it is possible to determine this impact using big data from mobile operators’-SIM card movements and data from air quality monitoring stations. Data on SIM card movements allows for reconstructing the state of the transport system before and during the different phases of a pandemic. The changes in mobility of people determined in this way can be related to the results of measurements of pollutant concentrations in the air. In this way, it is possible to identify links between mobility changes and air quality. The article presents the extent (in relation to the state without the pandemic) of changes in the mobility of the population during the pandemic and the related impact on air quality using the example of Warsaw.
1. Introduction
1.1. Impact of Transport on Air Quality
Transport can contribute to the pollution of soil, groundwater and surface water by increasing the amount of waste, such as used vehicles, tyres, oils, electrolytes, coolants and other materials used for cleaning and maintaining vehicles. It may also expose a significant part of the population to excessive noise and vibration and, above all, to loss of life and health as a result of traffic accidents [1].
However, the greatest threat to human health from motor vehicles, particularly in metropolitan settings, is air pollution [2]. Fossil fuels (petrol and diesel) burnt in internal combustion engines of road vehicles (cars, trucks, buses, taxis, etc.) cause direct emissions of pollutants such as nitrogen oxides (NOx), carbon monoxide (CO), carbon dioxide (CO2), black carbon (BC), particulate matter (PM) and, to a lesser extent, non-methane volatile organic compounds (NMVOC), methane (CH4), ammonia (NH3) or sulphur dioxide (SO2), but also some metals (such as copper, chromium, zinc) [3]. A particularly large share of traffic-related emissions occurs in urban areas. Due to limited space, high traffic density and frequent congestion [4], with poor self-purification of air, the amount of pollution is much higher there than in less urbanised areas. For this reason, in the inner city of Warsaw, for example, the share of motor transport in emissions of harmful compounds into the atmosphere may reach 80% [5].
Air pollution data for 2019 show that motor transport (mainly passenger cars, light and heavy goods vehicles, buses, and motorbikes) is responsible for 40.20% of nitrogen oxides (Nox) emissions, 11.15% of PM2.5 emissions, 8.29% of PM10 emissions, and 25.16% of carbon monoxide (CO) emissions in Poland [6]. It is also worth bearing in mind that, despite its relatively small contribution to primary particle emissions, road transport also affects the occurrence of secondary particles due to its significant contribution to Nox and partly NMVOC emissions. As a result, the contribution of transport to particulate matter concentrations, especially in cities, is greater than that of direct emissions [7]. The impact of transport on poor air quality in Poland is due to, inter alia, the age and technical condition of vehicles, both persistent congestion of streets and excessively high traffic speeds, the practise of illegally removing particulate filters (DPF, FAP) from relatively new diesel vehicles, and insufficient control of exhaust emission levels [8]. Poland is characterised by a large, annually increasing number of vehicles per capita (motorised index 580 vehicles per 1000 inhabitants), twice as high as the indicators observed, e.g., in other highly developed countries. High motorisation rates are combined with one of the highest percentages in the European Union of cars over 10 years old (around 73%). As many as 35% of cars are over 20 years old [9]. The easy availability of cars has created unfavourable habits of their use for everyday, often short trips. This is connected with insufficient development of road infrastructure (e.g., roads with high traffic volumes passing through downtown and heavily urbanised areas), insufficient technical quality of this infrastructure, inadequate standard of roads and streets in relation to the transport functions they perform (e.g., too wide lanes of lower-class streets, long, wide straight sections). Urban and infrastructural solutions favouring car transport at the expense of public transport and the so-called active transport as follows: walking or cycling are also common [8]. All this contributes to high levels of traffic-related emissions.
High levels of air pollutants have been documented to cause significant social costs, resulting in increased rates of school and work absence, lower educational attainment, reduced labour productivity, increased infant mortality and reduced life expectancy [10]. There are studies showing an increased risk of myocardial infarction with exposure to pollutants generated by internal combustion engines [11]. There was also a significant correlation between the appearance of symptoms of dementia, including Alzheimer’s disease, with the level of various pollutants associated with motor transport (in addition to O3) in the place of residence [12]. Children are one of the groups most vulnerable to the adverse health effects of air pollution exposure. Its impact on the health of children includes the following: developmental disorders, disorders of the respiratory system, the cardiovascular system, the immune system, the locomotor system, the nervous system, skin diseases and mental health disorders [13,14,15].
1.2. Changes in Mobility and Air Quality under COVID-19 Conditions
The COVID-19 pandemic brought a huge change in the lifestyle of societies. For example, confinement at home, remote working and remote education are caused by “stay-at-home orders” and the shutdown of public facilities. This has caused major changes in transportation behaviour and associated environmental impacts. These issues have been analysed in numerous countries. Studies relating to the first wave of the pandemic (spring 2020) showed that the total mobility of the population decreased significantly during lockdowns, which were introduced in most European countries, which resulted in the closure of schools, universities, theatres, cinemas, restaurants and other service establishments and the transition of a large part of the population to working from home. In many countries, it was even forbidden to leave home, except in essential situations. The decrease in the number of trips observed in individual countries and European cities was at a similar level. In Rome and the Spanish city of Santander, it was 77% and 76%, respectively [16]. Swiss analysis shows that the overall number of trips in the country fell by around 60% [17]. In Sweden, on the basis of mobile phone travel data, it was found that the number of trips made on weekdays decreased by about 40% [18]. A similar decline has been reported in Germany [19].
Changes in mobility were measured in different ways. Data from intelligent transport systems (ITS) devices such as induction loops, surveillance cameras, metro gates, urban public bicycle systems, and public transport occupancy surveys were used [16,17,18]. Mobile phone movement data have become an important source of information [16,18]. In Poland, surveys have been carried out to determine the extent to which the pandemic has affected mobility [20]. Public transport in Gdansk was analysed in detail [21].
Changes in mobility have affected different transport sectors to varying degrees. With regard to car traffic, the impact was lower than for public transport. Car transport was returning much more quickly to the state seen before the lockdown. In the case of Switzerland, two months after the end of the biggest restrictions, private transport use returned to its 2019 level, while public transport remained at 50% [17]. In Rome, during the lockdown phase, the number of trips made by cars decreased by 40% and by trucks by 25%. In Germany, the proportion of people using cars (but not exclusively) has halved. However, there was an increase in car use from 53% to 66% among those who used only this mode of transport [22].
The pandemic has also influenced preferences regarding the choice of mode of transport. As public transport became less popular, the proportion of private transport users sometimes increased. In Santander, Spain, the share of trips made by private cars increased from 48.33% to 76.84%, with a decrease in public transport trips from 41.65% to 19.14% [16]. In Budapest, the share of people using public and private transport before the pandemic was at the same level (about 43%). After the restrictions were introduced, public transport users accounted for only 18% and car users 65% [23].
Due to the observed decrease in mobility, many regions have reported lower levels of air pollution, particularly in terms of NO2 concentrations [24,25,26]. Based on data from NASA (National Aeronautics and Space Administration, Washington, DC, USA) and ESA (European Space Agency, Paris, France), it was found that in places most struggling with the SARS-CoV-2 virus, such as Wuhan and cities in Italy, Spain and the USA, NO2 concentrations dropped by up to 30% [27]. Studies carried out in Puglia, Italy, in March and April 2020 showed significant differences in NO2 concentrations in the air compared to the previous year. In Bari, the average concentration of NO2 in the air was 48.2 μg/m3 during the lockdown, while one year before it was at 62.2 μg/m3, a decrease of more than 20%. In Barcelona, an even higher decrease of 45–50% was reported [25].
Lockdown was slightly less important for PM2.5 and PM10 in urban areas and cities, although the data on these types of emissions are not conclusive. A significant decrease in PM2.5 concentrations has been reported in Pakistan [28]. PM10 concentrations decreased significantly (by 28–31%) in Barcelona, however significantly less than NO2 concentrations [25]. In Puglia, there was no significant difference in PM10 concentrations during the first lockdown phase, while in April 2020, concentrations were higher than in April 2019. This could be due to other factors, unrelated to transport, affecting the levels of these particulates in the air, such as weather and climate conditions and desert dust deposition [24].
The manuscript presents the results of the research project entitled “Method of assessing the social impact of changes in personal mobility in an epidemic state together with tools to support transport management”, carried out at the Warsaw University of Technology under the “IDUB against COVID-19” research project (Excellence Initiative Research University—in Polish, Inicjatywa Doskonałości Uczelnia Badawcza). Using Warsaw Metropolitan Area (WMA) as a case study, the paper demonstrated the possibility to use data from SIM cards to assess the impact of the pandemic and associated restrictions on personal mobility and thus also the influence of the transportation system on the environment. We mostly focused on the influence of mobility changes on alterations in air quality, with a particular emphasis on nitrogen oxides and particulate matter (PM2.5 and PM10).
2. Materials and Methods
2.1. Mobility Data
In order to analyse the impact of changes in passenger mobility on air quality, a specific database was created. The database was created using mobile phone operator data on travel/movement of active SIM cards. Such data show the traffic potential of each zone in the form of a set of numbers of SIM cards, which users did not travel or travelled only within the zone. These data enable the analysis of zonal trip-end and movement data over any period, e.g., for consecutive hours in a day.
Mobile phone operator data on movements were acquired for 3 pandemic phases in 2020, for selected, representative working days in the periods 17–31 March 2020 (phase 1—when there were strong mobility restrictions mainly from concern for one’s health), 8–19 April 2020 (phase 2—when there were strong administrative mobility restrictions), 19 May–11 June 2020 (phase 3—when the gradual reducing of restrictions began). Data were obtained for weekdays (Tuesday, Wednesday, Thursday) because the impact of mobility restrictions was analysed in relation to the entire transport system (car traffic and public transport journeys) and in relation to do-called obligatory trips (to work, to school), which are most typically on these days. The data is purchased in the form of a completely anonymized (by the data supplier) trip matrix, containing information on the number of trips generated in each zone and the spatial distribution of these trips, i.e., the number of trips between each pair of zones. Before use, the data is checked. This applies, for example to size of the matrix, individual values of trips between pairs of zones, average trip distances, distribution of trip distances. In addition, the trip matrices provided for 2019 were compared with the trip matrices developed for Warsaw for the same year on the basis of comprehensive, origin-destination travel studies.
Estimated actual trip numbers were obtained in an augmented system, i.e., expanded to the whole population by using the so-called SIM multiplier. The multiplier is determined by the data supplier for each movement (trip) made between a pair of zones, taking into account each of the following zones: population (residents with more than 10 years of age), the operator’s share in the SIM card market, number of people owning more than one mobile phone and the number of SIM card users who provided their marketing consent. In this case, the average SIM card multiplier of 8.65 was applied.
2.2. Air Quality Data
Air quality in Warsaw is measured by seven air quality monitoring stations that are part of the State Environmental Monitoring and belong to the Chief Inspectorate of Environmental Protection (GIOŚ). Of these, nitrogen dioxide (NO2) concentrations are automatically measured at three locations. The results are given as 1-h averages. These are the following stations:
- Warsaw-al. Niepodległości (centre of Warsaw) (Figure 1);
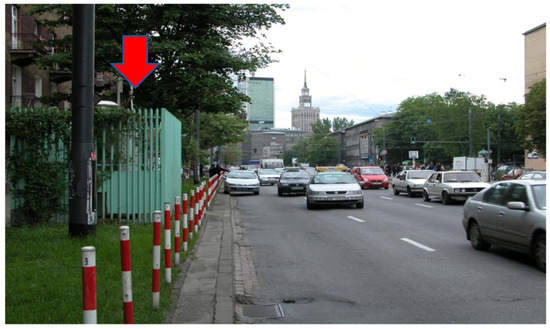 Figure 1. Traffic air quality monitoring station in Al. Niepodległości in Warsaw, located directly next to the roadway.
 - Warszawa-Kondratowicza (Targówek-north-east district);
- Warsaw-Wokalna (Ursynów-south district).
The station in the centre of Warsaw is a specialised station, the so-called traffic station, which reads concentrations of air pollutants coming directly from road transport. Stations in Targówek and Ursynów are so-called urban background stations, located at some distance from key sources of air pollutant emissions. In the research work, it was assumed that air quality data in 2020 would be compared to prior 3 years (2017–2019). This method has been used in previous studies for COVID-19 and air quality [29,30].
We used the t-Student test and the ANOVA test to identify statistically significant differences between the distributions of air pollutant concentrations. The results for which the significance level p < 0.05 were considered statistically significant.
3. Results
3.1. Changes in Mobility during COVID-19
The analysis of the trip matrices confirmed the noticeable impact of the pandemic on the number of trips made during its different phases and in comparison to the reference period (spring 2019). According to the scope of the IDUB research project, comparisons of mobility data were carried out for trips generated in Warsaw and between Warsaw and its metropolitan area (WMA), the region of the country of which Warsaw is a part (Mazovia), the rest of Poland and abroad (Figure 2).
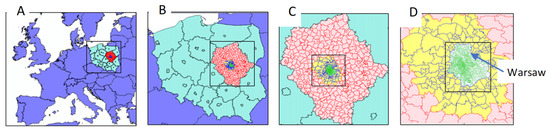
Figure 2.
Hierarchy of analysis of the trips related to Warsaw: (A)-from abroad, (B)-domestic, (C)-from the Mazovia region, (D)-from the Warsaw Metropolitan Area (WMA).
Compared to the average daily number of trips in the individual pandemic phases of 2020 against 2019 (Table 1), it was noted that the first and second phases saw a 24–25% reduction in the number of trips made within Warsaw. In the third phase, the reduction in the number of trips compared to 2019 was already much smaller at 9%, which means that after a period of severe mobility restrictions, in May it began to gradually return to its pre-pandemic state. The number of trips from Warsaw to the area around Warsaw (WMA) decreased in relation to the pre-pandemic period by 32%. In the second phase (in April), it decreased compared to the pre-pandemic period by 28%. So, comparatively, it can be seen that the reduction in mobility in March (self-limitation of society) was stronger than in April (administrative restrictions). In May, during the exit from the pandemic, the reduction was definitely less significant–4%, and indicates a need for pre-pandemic behaviour.

Table 1.
Average daily trip numbers by phase of year 2020 compared to baseline year 2019 (without pandemic).
In the first and second phases of the pandemic, a significant reduction in the number of long trips to Warsaw from the rest of the country (by 74–76%) and from abroad (by 60–61%) was observed. In the third phase, the reduction was smaller, at 53% for domestic trips and 56% for international trips, which also confirms the gradual return to pre-pandemic mobility.
The data indicate a strong reduction on mobility in a large city, inside Warsaw and in trips related to Warsaw. A different situation occurred in the case of trips made outside a large city. Society has not reacted so strongly and has not restricted mobility in the same way. For example, in none of the phases, there was a decrease in the number of regional trips made from the Mazovia province area to the WMA zone. Moreover, the second and third phases even saw an increase in this type of trip, with the third phase reaching 38%.
In the morning peak, in the WMA zone itself, slight differences in the number of any kind of trips generated in phases one and two were noted. It was only in the third phase that a clear increase in the number of trips was noticed compared to the earlier two pandemic phases (Figure 3).
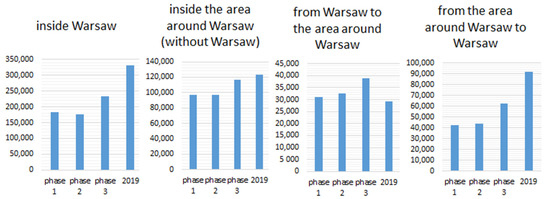
Figure 3.
Numbers of trips during the pandemic phases in 2020 and the 2019 baseline period.
During the morning peak, the number of trips within Warsaw was noticeably lower. In the first and second phases, it was 45–47%, and in the third phase, it was 30%. However, the biggest decline compared to 2019 was recorded in the number of trips made between the area around Warsaw and Warsaw, falling by as much as 52–54% in the first and second phases and by 32% in the third phase. At the same time, the reverse relations, i.e., from Warsaw to the area around Warsaw, identified an increase in the number of trips as compared to the reference period, respectively by 6–11% in the first and second phases and it was 32% in the third phase. In the area around Warsaw, the decrease in the number of trips was lower than in Warsaw itself by 21% in the first and second phases respectively and by 5% in the third phase (Table 2). The increase in the number of trips from Warsaw to the area around is noteworthy. This can be explained by changes in travel motivations. Travel to work and school has been replaced by weekend homes and recreation.
Table 2.
Decrease (-) or increase in the number of trips in the morning peak hour in the WMA zone itself in 2020 during the three pandemic phases with respect to 2019.
The analyses revealed that the volumes of traffic generated in phases one and two were similar to each other. This can be seen both in terms of daily traffic and in the morning rush hour. This means that the mobility restrictions and restrictions on the functioning of the economy introduced in the first two phases had a similar impact on changes in the mobility of the inhabitants. In contrast, the third phase saw a significant increase in the number of trips generated, confirming a direct link between the easing of restrictions and the availability of more destinations (e.g., opening of offices, retail, catering).
Restrictions had the strongest impact on reducing domestic and international travel. Domestic travel associated with Warsaw during the first and second phases of the pandemic decreased by more than 70% compared to 2019 (Table 1). The restrictions had a strong impact on the decrease in mobility in Warsaw, the central city of the metropolis, and on commuting to Warsaw. Much less so in the metropolitan area, where in some cases there even was an increase in mobility. This was due, among other things, to the reduction in traffic associated with trips to work and school, including those during the peak hour.
3.2. Changes in Air Quality in Warsaw
Over the past 15 years, nitrogen dioxide concentrations have slightly decreased compared to the beginning of the analysed period. There were, however, some fluctuations between the years. At the traffic station (Figure 4: blue), the average annual concentration was above 60 µg/m3 in 2006–2008 and 2010. Declines occurred in 2009 and 2011–2013. Since 2016, the concentrations have decreased, and in 2018 and 2019 they stabilised at a similar level close to 50 µg/m3. The minimum value was 45.4 µg/m3 in 2012, and the maximum value was 65.3 µg/m3 in 2006. Concentrations registered at the station located in the Targówek district (Figure 4: orange) ranged from 20 to 30 µg/m3. Only in 2006 was the concentration higher and exceeded 30 µg/m3. The minimum value was 22.9 µg/m3 and was registered in 2010, and the maximum value was 35.1 µg/m3 in 2006. The smallest differences between the years occurred at the station located in the district of Ursynów (Figure 4: grey). The minimum value was 20.7 µg/m3 in 2011, and the maximum was 27.1 µg/m3 in 2006. As can be seen, the highest value of the average annual concentration was recorded at all stations in the following same year: 2006.
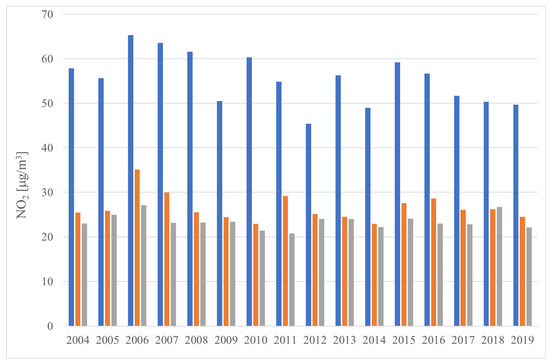
Figure 4.
Annual concentrations of NO2 in Warsaw 2004–2019. Measuring stations: blue bar–Al. Niepodległości (traffic station), orange bar–Targówek (urban background station), grey bar–Ursynów (urban background station) (developed by the author on the basis of GIOŚ data).
The t-Student and ANOVA tests results confirm that statistically significantly higher values (p < 0.05) are recorded at the station measuring impacts directly from transport in the centre of the capital city (Warsaw-Al. Niepodległości) compared with the situation at urban background stations. Due to the location of the station in the immediate vicinity of a busy arterial road (al. Niepodległości, two roadways with three lanes each), the limit level (40 µg/m3 for the annual average) is exceeded every year. At other measurement locations, the share of transport emissions is lower and hence the measured NO2 concentrations are also lower.
Readings were taken at the air quality monitoring station located in the centre of Warsaw near the intersection of al. Niepodległości and ul. Nowowiejska, which showed a fairly pronounced reduction in NO2 concentrations in the air during the pandemic (2020) compared to earlier years (2017–2019). Mean NO2 concentrations in consecutive months between March and June in 2017–2019 were in the range of 50–57 μg/m3, while in 2020 they were significantly lower (by 28–35%) and were in the range of 31–37 μg/m3 (Figure 5).
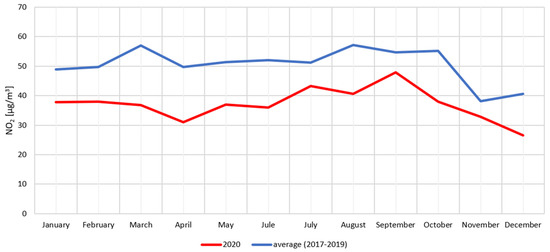
Figure 5.
Mean NO2 concentrations in al. Niepodległości in 2020 compared to the mean concentrations from 2017 to 2020. Calculation based on all days of the year (developed by the author).
At the same air quality monitoring station, comparisons of NO2 concentration data only on weekdays (all Tuesdays, Wednesdays, Thursdays), i.e., when the transport system is dominated by daily trips related to work and school, confirmed a decrease in air pollution in 2020 compared to the 2017–2019 average. However, during peak traffic hours, the difference between the periods compared was similar, with NO2 concentrations being 25–38% lower (Figure 6).
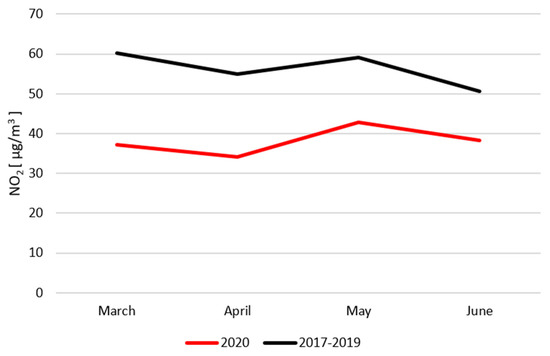
Figure 6.
Mean morning peak hour NO2 concentrations in al. Niepodległości for the period March–June 2020 compared to the averages for the same period 2017–2020. Calculation based on all Tuesdays, Wednesdays and Thursdays (developed by the author).
3.3. Impact of Mobility Changes on Air Quality
Table 3 with the results of the analysis of the 2020 data on SIM card movements on weekdays (Tuesday, Wednesday, Thursday) shows that traffic generation during the initial period of the pandemic (March–April) was significantly lower (daily average of 165,000 trips) compared to the May-June period (daily average of 203,000–206,000). It was similar during the peak traffic hours when most trips are made for work and school. During the initial pandemic period (March–April), traffic generation was significantly lower (peak hour average of 178,000–184,000 trips) compared to the May-June period (peak hour average of 220,000–226,000 trips).
Table 3.
Number of trips generated and NO2 concentration averaged over the 2020 peak hour (working days).
Against the background of the traffic generation data, the data on NO2 concentrations are also interesting. A comparison was made between changes in the number of trips generated and changes in the observed nitrogen dioxide concentrations (Table 3, Figure 7). The results of the t-Student and ANOVA tests confirmed that in 2020, NO2 concentrations observed in March-April (with a minimum of 34 μg/m3 in April) were statistically significantly lower (p < 0.05) in comparison to those registered in May-June (with a maximum of 43 μg/m3 in May). A relationship between the increase in trips generated and NO2 concentrations became apparent. An increase of approximately 25% in the number of trips generated (between April and May) was observed. Similarly, NO2 concentrations increased by 25%.
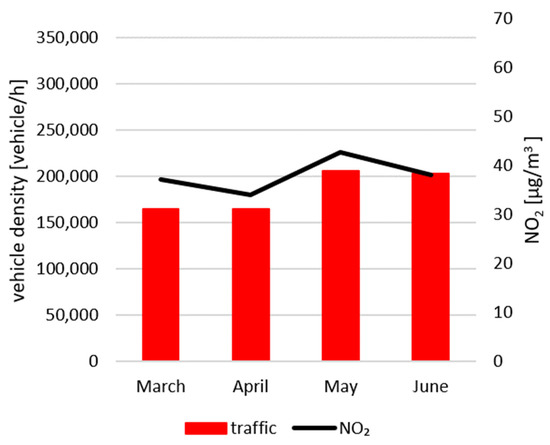
Figure 7.
Comparison of the average number of trips generated with the mean NO2 concentration, March–June 2020-al. Niepodległości in Warsaw.
The relationship between the increase in the number of trips and the increase in NO2 concentrations was not as clearly revealed during peak traffic hours (Figure 8). In 2020, similar NO2 concentrations were observed in the morning peak during March–May (range 49–51 μg/m3), i.e., differences in concentrations did not exceed 4%. Changes in NO2 concentrations were therefore significantly different to changes in the number of trips, which increased by 23% between March and May. This was different from the afternoon peak. The level of hourly NO2 concentrations in the March-May period increased from 37 to 59 μg/m3, which means an increase of 51%, while the number of trips increased by 28%. Thus, in the afternoon peak, the effect of the increase in the number of trips generated on the increase in NO2 concentrations was confirmed, with air pollution even higher (compared to the increase in traffic) than for the daily data.
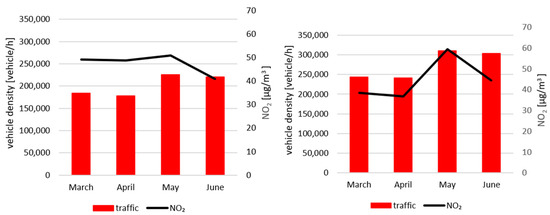
Figure 8.
Comparison of the average number of trips generated against NO2 concentrations calculated as the averages over the peak hours. 2020-al. Niepodległości.
A weak correlation between NO2 concentrations and the volume of traffic generated during the morning peak hours may be explained by the fact that the concentration of nitrogen dioxide in downtown Warsaw is lowest during the night hours (Figure 9) and only begins to rise during the morning peak hours, creating a sort of transition phase between the periods of lowest and highest concentrations. Concentrations begin to rise after 12 o’clock, reaching a peak in the afternoon and evening. Weak correlations most likely result from the fact that the air quality monitoring station at al. Niepodległości is the only station in Warsaw measuring concentrations of traffic-related air pollutants (TRAP). This station, located in the immediate vicinity of the road, is representative of the measurements of air pollutants arising from road traffic. The lack of other TRAP stations in Warsaw meant that we could only compare mobility data with the concentrations measured in the stations at al. Niepodległości. The mobility data, in turn, concerned the whole of Warsaw and not only the street where the monitoring station is located. Hence, the relationship between changes in mobility throughout the city and changes in NO2 concentrations at only one station is rather a weak relationship.
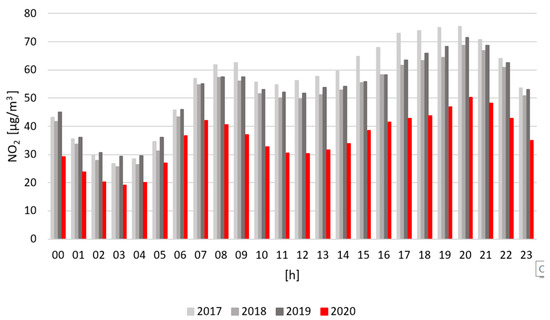
Figure 9.
Summary of the mean NO2 concentrations [μg/m3] at the air quality monitoring station at al. Niepodległości in Warsaw. Calculation for all days in the period 2017–2020.
4. Discussion
The four main sources of air pollutant emissions are the municipal and household sector (so-called surface sources or low-stack emissions), road transport, industry and energy production and distribution. In addition, agriculture can also be taken into account, but mostly in the case of ammonia emissions [6]) and the waste management sector, which do not play a dominant role in the emissions of the main types of pollutants. The energy production and distribution sector contributed to Poland in 2018 primarily to emissions of sulphur oxides (SOx), nitrogen oxides (NOx) and mercury (Hg), while industry (comprising heavy and light industry) was responsible mostly for the emissions of non-methane volatile organic compound (NMVOC) emissions, mercury (Hg) PM2.5, PM10 and sulphur oxides (SOx) [6].
More than 44% of PM2.5 and 41% of PM10 emissions in Poland in 2018 came from the municipal and household sector. It is also a very significant source of polycyclic aromatic hydrocarbon (PAH) emissions-85.05%, including 89.39% of benzo(a)pyrene emissions, carbon monoxide (CO) emissions-59.81% and dioxins and furans-58.71% [6]. In the municipal and household sectors, the main sources of air pollutant emissions are processes related to domestic heating. In its report, the Polish Smog Alert presented the results of its 2020 study, where it estimates that there are still nearly 3 million single-family houses heated with boilers and stoves that emit significant amounts of pollutants and do not meet the requirements of the anti-smog resolutions. Moreover, Poles in their houses burn more than 80% of the coal that is used in all households across the European Union [31]. Another problem is the thermal insulation of houses, as one-third of single-family buildings do not have any insulation (a slight decrease to 33% from 38% in 2014) [32].
Analysing the data for Warsaw, in 2020, in the first months of the pandemic (March-April), an increased impact of PM2.5 and PM10 emissions was noted despite the above-described significantly lower number of trips generated compared to 2019. The situation identified could therefore be an increased burning of solid fuels in households. The shift to remote learning and work has contributed to people staying at home. The need to ensure adequate thermal comfort in buildings throughout the day required burning more fuel than when the inhabitants of the buildings were at their places of work and study during the day. This, in turn, may have resulted in increased emissions of particulate pollutants and their higher concentrations in the air.
This situation was analysed in detail in the vicinity of the air quality monitoring station in Wawer in Warsaw, a district with predominantly single-family housing. In the case of PM2.5 and PM10 (Figure 10), in March and April 2020, concentrations on as many as 24 out of 61 days were higher compared to the corresponding period in 2019. This is particularly true in March, when outdoor air temperatures, under Polish climatic conditions, usually still require the heating of buildings.
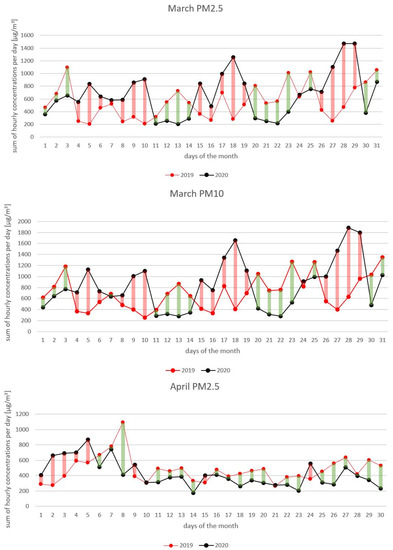
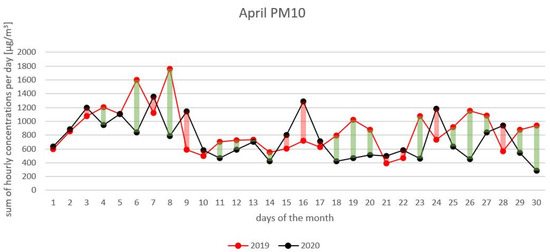
Figure 10.
Concentrations of PM2.5 and PM10 recorded at the air quality monitoring station in Wawer district in March and April 2020. Red colour indicates increase and green colour indicates decrease in relation to 2019.
A comparison of the data also indicates that in subsequent months (May, June), as the weather improved and the ambient air temperature rose, there was a reduction in concentrations of PM2.5 and PM10, with a concomitant increase in the volume of traffic generated (as lockdown restrictions were relaxed) (Figure 11).
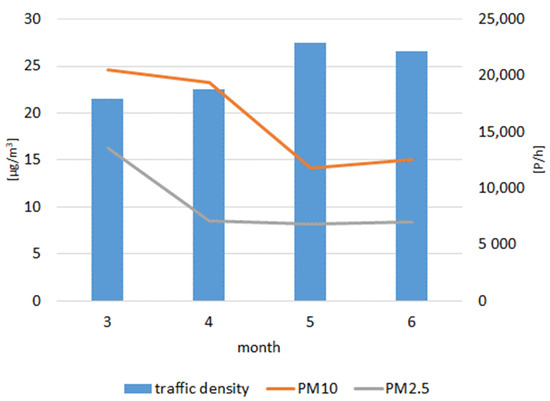
Figure 11.
Average number of trips generated in March, April, May and June in Wawer in relation to daily average hourly concentrations of PM2.5 and PM10.
A comparison of data on PM2.5 and PM10 concentrations during the initial period of the spring 2020 pandemic in relation to the situation in 2020 and in relation to the volume of traffic generated indicates that a reduction (in March and April) and then an increase (in May and June) in the mobility of people did not directly affect changes in particulate concentrations. However, it had an indirect impact. It is likely that, because a part of the population remained at home, the increased heating at home, with an unfavourable method of heating (with a significant share of coal but also wood as a heating fuel), contributed to increases in the pollutant concentrations, especially particulate matter, in the atmospheric air. Generally, in Poland, increases in the concentration of pollutants, especially PM, in winter, during the so-called heating season, are very common. Wide use of solid fuels for heating purposes causes those significant emissions of PM to arise, which also influences much higher concentrations of pollutants than in the non-heating period. During the COVID-19 pandemic restrictions, especially in the so-called first lockdown, a significant number of the inhabitants of Warsaw limited their mobility. While staying at home, however, 24 h a day, they had to maintain appropriate thermal conditions. In houses heated by burning solid fuels, it is associated with increased fuel consumption during, and thus with greater emissions of pollutants. In March and April 2020, when mobility decreased, also a decrease in emissions from road transport was noticed. At the same time, however, emissions from the municipal and household sectors increased. In turn, in May and June, when the restrictions began to be reduced, mobility started to increase. This was also related to the increase in pollutant emissions, but taking into account the end of the heating period, due to increasing air temperatures, the emissions from the municipal and household sectors dropped significantly. Hence, despite limitations in mobility, the concentrations of pollutants remained at relatively high levels, but when mobility started to increase, the concentrations began to decline noticeably. Due to the significant role in shaping air quality in Poland by the municipal and household sectors, such a situation is very likely.
5. Conclusions
In the IDUB project, a unique analysis was performed of the impact of the COVID-19 pandemic on the volume of traffic generated in Warsaw during the first months of lockdown, in the period March-June 2020. The data obtained were compared with data on nitrogen dioxide concentrations collected at the air quality monitoring station located in the immediate vicinity of the road and data on concentrations of PM2.5 and PM10 at a station located in a residential district of Warsaw with a predominant share of single-family housing.
The completed project confirmed the legitimacy and feasibility of effective use of big data (SIM card movements provided by mobile phone operators) in analysing the mobility of people and reconstructing behaviour (post factum) in very unusual situations (e.g., major changes in mobility due to restrictions imposed during the pandemic), with the possibility of comparing operating states of transport systems in pre- and post-event situations, was confirmed. This is a valuable conclusion from the work because, in the future, we should expect other situations in which it will not be possible to perform traditional, comprehensive traffic studies.
The analyses of individual mobility clearly confirmed the expectations regarding the effects of the restrictions introduced in subsequent phases of the pandemic. Thanks to the research work, significantly lower mobility of the population were observed in the following months of the lockdown compared to previous years. These values was quantified.
Similarly, as a result of the project, data on the reduction in NO2 concentrations resulting from changes in mobility were presented and compared to previous years. The March–April 2020 period saw a decrease of approximately 35–40% from the 2017 to 2019 averages.
A comparison of mobility data acquired from big data with data on concentrations of nitrogen dioxide, PM2.5 and PM10 revealed an interesting relationship between the increase in the number of trips generated and NO2 concentrations. A 25% increase in the average hourly (calculated on a daily basis) number of trips generated between April and May corresponded to a 25% increase in NO2 concentrations. Additionally, an even greater impact was recorded during the afternoon traffic peak period. With an increase in generated traffic of 28% (calculated on average during the peak hour in March-May), the increase in NO2 concentrations was 51%.
As a part of the research work, an interesting effect related to the reduction in mobility at the beginning of the year was also detected. There was an increase in daily concentrations of PM2.5 and PM10 in 2020 compared to the year 2019, especially in the first months of lockdown (March-April) with reduced mobility levels compared to previous years. This is attributed to increased emissions of air pollutants from households, which were associated with the population’s remaining isolated at home due to the pandemic-induced restrictions being implemented. It is worth emphasising that the mobility data obtained and used in this paper is an important source of knowledge about the transport behaviours of citizens and about changes that have occurred during pandemic restrictions. The possibility of linking this data with air quality data creates additional opportunities to draw interesting conclusions that may be important from the point of view of air quality management (including emission source control), health management, and possibly also in the field of crisis management. Although in Polish conditions, such solutions do not yet function fully, it can certainly be assumed that the role of big data in issues related to air (environment) and health protection and their relationships with the variability of pressure from various emission sources (including road traffic) will increase.
The pandemic effects for Warsaw determined in the study are comparable with the data obtained from the literature review. Both reduced mobility and lower levels of air pollution were confirmed. For example, a 30% reduction in NO2 emissions was indicated in the literature in studies carried out in Italy or the USA. The same is true for PM2.5 and PM10 concentrations. The much smaller impact of reduced mobility was also confirmed, mainly due to an increase in impacts from the municipal and household sectors.
Author Contributions
Conceptualization, A.B. (Andrzej Brzeziński) and A.B. (Artur Badyda); methodology, A.B. (Andrzej Brzeziński); software, A.B. (Andrzej Brzeziński) and T.D.; validation, P.O. and P.S.; formal analysis, A.B. (Andrzej Brzeziński), A.B. (Artur Badyda) and D.M.; investigation, A.B. (Andrzej Brzeziński), A.B. (Artur Badyda), P.S., T.D., K.J.-N. and D.M.; resources, A.B. (Andrzej Brzeziński), A.B. (Artur Badyda) and B.O.; data curation, A.B. (Andrzej Brzeziński) and A.B. (Artur Badyda); writing—original draft preparation, A.B. (Andrzej Brzeziński), A.B. (Artur Badyda), D.M. and K.J.-N.; writing—review and editing, A.B. (Andrzej Brzeziński), A.B. (Artur Badyda) and P.S.; visualization, A.B. (Andrzej Brzeziński), D.M. and K.J.-N.; supervision, A.B. (Andrzej Brzeziński) and A.B. (Artur Badyda); project administration, A.B. (Andrzej Brzeziński); funding acquisition, A.B. (Andrzej Brzeziński). All authors have read and agreed to the published version of the manuscript.
Funding
This research was funded by the project “Method of assessing the social impact of changes in personal mobility in an epidemic state together with tools to support transport management” as part of the “IDUB against COVID” research programme, Warsaw University of Technology, grant No 1820/53/Z01/2020.
Institutional Review Board Statement
Not applicable.
Informed Consent Statement
Not applicable.
Data Availability Statement
Data supporting reported results can be found: a.brzezinski@il.pw.edu.pl.
Conflicts of Interest
The authors declare no conflict of interest.
References
- Mysłowski, J. Air Pollution from Motor Vehicles (In Polish: Zanieczyszczenia Powietrza Przez Pojazdy Samochodowe); Księgarnia WKŁ: Warszawa, Poland, 2011; p. 33. [Google Scholar]
- Gronowicz, J. Environmental Protection in Land Transport (In Polish: Ochrona Środowiska w Transporcie Lądowym); Instytut Technologii Eksploatacji: Radom, Poland, 2003; p. 48. [Google Scholar]
- Kishimoto, P.; Karplus, V.J.; Zhong, M.; Saikawa, E.; Zhang, X.; Zhang, X. The impact of coordinated policies on air pollution emissions from road transportation in China. Transp. Res. Part D Transp. Environ. 2017, 54, 30–49. [Google Scholar] [CrossRef] [Green Version]
- Himanen, V.; Lee-Gosselin, M.; Perrels, A. Sustainability and the interactions between external effects of transport. J. Transp. Geogr. 2005, 13, 23–28. [Google Scholar] [CrossRef]
- Mazur, E. Transport and the Natural Environment of Poland (In Polish: Transport a Środowisko Przyrodnicze Polski); Uniwersytetu Szczecińskiego: Szczecin, Poland, 1998; p. 135. [Google Scholar]
- European Environment Agency. Air Pollutant Emissions Data Viewer. Available online: https://www.eea.europa.eu/data-and-maps/dashboards/air-pollutant-emissions-data-viewer-4 (accessed on 27 July 2021).
- Thunis, P.; Degraeuwe, B.; Pisoni, E.; Trombetti, M.; Peduzzi, E.; Belis, C.; Wilson, J.; Clappier, A.; Vignati, E. PM2.5 source allocation in European cities: A SHERPA modelling study. Atmos. Environ. 2018, 187, 93–106. [Google Scholar] [CrossRef]
- Jędrak, J.; Konduracka, E.; Badyda, A.; Dąbrowiecki, P. Health Effects of Air Pollution (In Polish: Wpływ Zanieczyszczeń Powietrza na Zdrowie), 2nd ed; Krakowski Alarm Smogowy: Krakow, Poland, 2021; ISBN 978-83-943065-3-3. [Google Scholar]
- Supreme Control Office Eliminating Vehicles that Excessively Emit Harmful Substances from Road Traffic [In Polish: Eliminowanie z Ruchu Drogowego Pojazdów Nadmiernie Emitujących Substancje Szkodliwe]. 2020. Available online: https://www.nik.gov.pl/plik/id,23218,vp,25925.pdf (accessed on 24 September 2021).
- Zhai, M.; Wolff, H. Air pollution and urban road transport: Evidence from the world’s largest low-emission zone in London. Environ. Econ. Policy Stud. 2021, 23, 721–748. [Google Scholar] [CrossRef]
- Peters, A.; von Klot, S.; Heier, M.; Trentinaglia, I.; Hörmann, A.; Wichmann, H.E.; Löwel, H. Exposure to Traffic and the Onset of Myocardial Infarction. N. Engl. J. Med. 2004, 351, 1721–1730. [Google Scholar] [CrossRef] [PubMed] [Green Version]
- Carey, I.M.; Anderson, H.R.; Atkinson, R.W.; Beevers, S.D.; Cook, D.; Strachan, D.P.; Dajnak, D.; Gulliver, J.; Kelly, F.J. Are noise and air pollution related to the incidence of dementia? A cohort study in London, England. BMJ Open 2018, 8, e022404. [Google Scholar] [CrossRef] [PubMed] [Green Version]
- Bulanda, M.; Michalak, W. Impact of Air Pollution from Transport on Children’s Health and Development [In Polish: Wpływ Zanieczyszczeń Powietrza z Transportu na Zdrowie i Rozwój Dzieci], Polish Ecological Club Mazowiecki Region. 2021. Available online: https://healpolska.pl/wp-content/uploads/2021/05/raport-zdrowie-dzeci-prev-12-05-1211.pdf (accessed on 6 October 2021).
- Ratajczak, A.; Badyda, A.; Czechowski, P.; Czarnecki, A.; Dubrawski, M.; Feleszko, W. Air Pollution Increases the Incidence of Upper Respiratory Tract Symptoms among Polish Children. J. Clin. Med. 2021, 10, 2150. [Google Scholar] [CrossRef]
- Jakubiak-Lasocka, J.; Lasocki, J.; Badyda, A.J. The Influence of Particulate Matter on Respiratory Morbidity and Mortality in Children and Infants. Adv. Exp. Med. Biol. 2014, 849, 39–48. [Google Scholar] [CrossRef]
- Aloi, A.; Alonso, B.; Benavente, J.; Cordera, R.; Echániz, E.; González, F.; Ladisa, C.; Lezama-Romanelli, R.; López-Parra, Á.; Mazzei, V.; et al. Effects of the COVID-19 Lockdown on Urban Mobility: Empirical Evidence from the City of Santander (Spain). Sustainability 2020, 12, 3870. [Google Scholar] [CrossRef]
- Molloy, J.; Schatzmann, T.; Schoeman, B.; Tchervenkov, C.; Hintermann, B.; Axhausen, K.W. Observed impacts of the COVID-19 first wave on travel behaviour in Switzerland based on a large GPS panel. Transp. Policy 2021, 104, 43–51. [Google Scholar] [CrossRef]
- Jenelius, E.; Cebecauer, M. Impacts of COVID-19 on public transport ridership in Sweden: Analysis of ticket validations, sales and passenger counts. Transp. Res. Interdiscip. Perspect. 2020, 8, 100242. [Google Scholar] [CrossRef] [PubMed]
- Schlosser, F.; Hinrichs, D.; Maier, B.; Brockmann, D.; Rose, A. Second Report: Mobility on the Rise; University of Oslo: Oslo, Norway, 2020. [Google Scholar]
- Borkowski, P.; Jażdżewska-Gutta, M.; Szmelter-Jarosz, A. Lockdowned: Everyday mobility changes in response to COVID-19. J. Transp. Geogr. 2021, 90, 102906. [Google Scholar] [CrossRef] [PubMed]
- Przybylowski, A.; Stelmak, S.; Suchanek, M. Mobility Behaviour in View of the Impact of the COVID-19 Pandemic—Public Transport Users in Gdansk Case Study. Sustainability 2021, 13, 364. [Google Scholar] [CrossRef]
- Eisenmann, C.; Nobis, C.; Kolarova, V.; Lenz, B.; Winkler, C. Transport mode use during the COVID-19 lockdown period in Germany: The car became more important, public transport lost ground. Transp. Policy 2021, 103, 60–67. [Google Scholar] [CrossRef]
- Bucsky, P. Modal share changes due to COVID-19: The case of Budapest. Transp. Res. Interdiscip. Perspect. 2020, 8, 100141. [Google Scholar] [CrossRef] [PubMed]
- De Maria, L.; Caputi, A.; Tafuri, S.; Cannone, E.S.S.; Sponselli, S.; Delfino, M.C.; Pipoli, A.; Bruno, V.; Angiuli, L.; Mucci, N.; et al. Health, Transport and the Environment: The Impacts of the COVID-19 Lockdown on Air Pollution. Front. Public Health 2021, 9, 637540. [Google Scholar] [CrossRef]
- Tobías, A.; Carnerero, C.; Reche, C.; Massagué, J.; Via, M.; Minguillón, M.C.; Alastuey, A.; Querol, X. Changes in air quality during the lockdown in Barcelona (Spain) one month into the SARS-CoV-2 epidemic. Sci. Total Environ. 2020, 726, 138540. [Google Scholar] [CrossRef]
- Wang, Q.; Su, M. A preliminary assessment of the impact of COVID-19 on environment—A case study of China. Sci. Total Environ. 2020, 728, 138915. [Google Scholar] [CrossRef]
- Muhammad, S.; Long, X.; Salman, M. COVID-19 pandemic and environmental pollution: A blessing in disguise? Sci. Total Environ. 2020, 728, 138820. [Google Scholar] [CrossRef]
- Khan, Y.A. The COVID-19 pandemic and its impact on environment: The case of the major cities in Pakistan. Environ. Sci. Pollut. Res. 2021, 28, 54728–54743. [Google Scholar] [CrossRef]
- Son, J.-Y.; Fong, K.C.; Heo, S.; Kim, H.; Lim, C.C.; Bell, M.L. Reductions in mortality resulting from reduced air pollution levels due to COVID-19 mitigation measures. Sci. Total Environ. 2020, 744, 141012. [Google Scholar] [CrossRef] [PubMed]
- Chen, K.; Wang, M.; Huang, C.; Kinney, P.L.; Anastas, P.T. Air pollution reduction and mortality benefit during the COVID-19 outbreak in China. Lancet Planet. Health 2020, 4, e210–e212. [Google Scholar] [CrossRef]
- Polish Economic Institute. Czas na Ciepłownictwo (In Polish: It Is Time for the Heating Industry); Polski Instytut Ekonomiczny: Warsaw, Poland, 2019; ISBN 978-83-66306-52-3. Available online: https://pie.net.pl/wp-content/uploads/2020/02/PIE-Ciepłownictwo.pdf (accessed on 21 February 2022).
- Polish Smog Alarm. Single-Family Houses in Poland. Heating Sources, Energy Status, Investment Priorities (In Polish: Domy Jednorodzinne w Polsce. Źródła Grzewcze, Stan Energetyczny, Priorytety Inwestycyjne). Institute of Environmental Economics. 2021. Available online: https://polskialarmsmogowy.pl/wp-content/uploads/2021/05/Raport_domy2020_final.pdf (accessed on 21 February 2022).
Publisher’s Note: MDPI stays neutral with regard to jurisdictional claims in published maps and institutional affiliations. |
© 2022 by the authors. Licensee MDPI, Basel, Switzerland. This article is an open access article distributed under the terms and conditions of the Creative Commons Attribution (CC BY) license (https://creativecommons.org/licenses/by/4.0/).