
A Vertiport Design Heuristic to Ensure Efficient Ground Operations for Urban Air Mobility


Abstract
:1. Introduction
Is it possible to predict the operational efficiency of a given vertiport based on limited knowledge of the proposed layout and expected demand?
2. Related Work
- Operations on gates (e.g., passenger boarding) can be a bottleneck to operations and, therefore, should be considered in vertiport capacity planning. This diverts from conventional airport planning where the runways are the main limiting factor considered in the capacity planning process (see for example [17,18]).
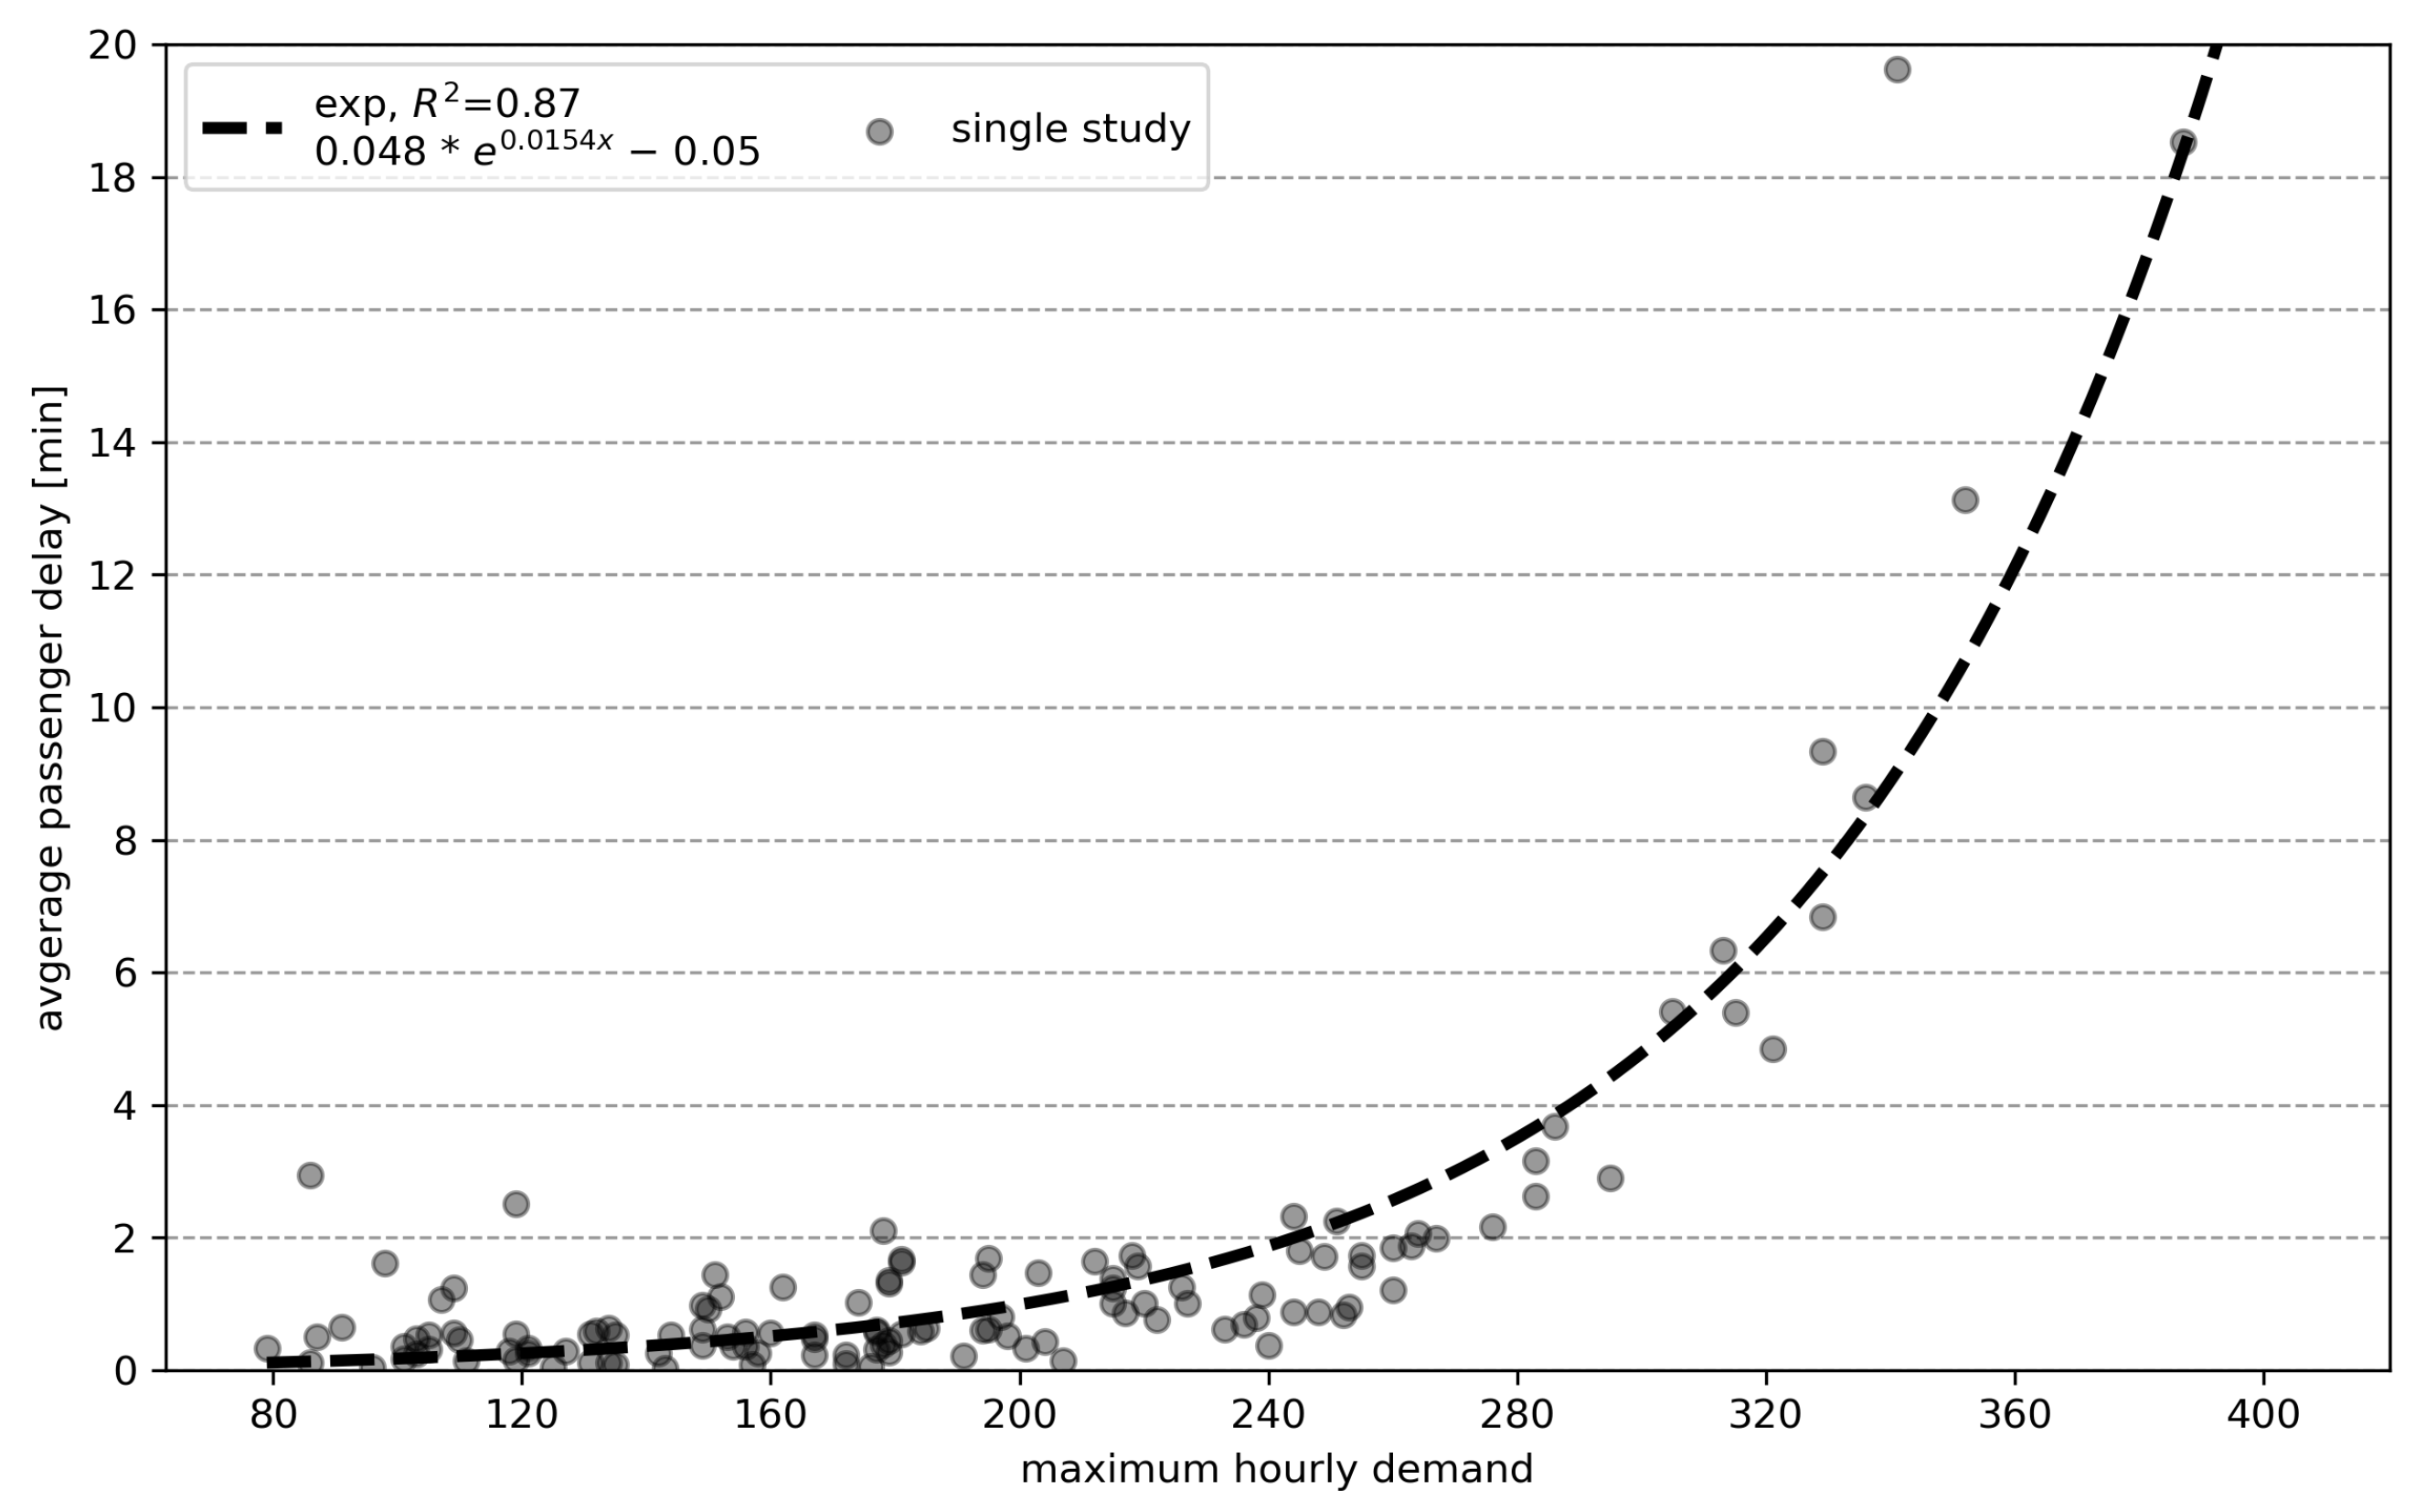
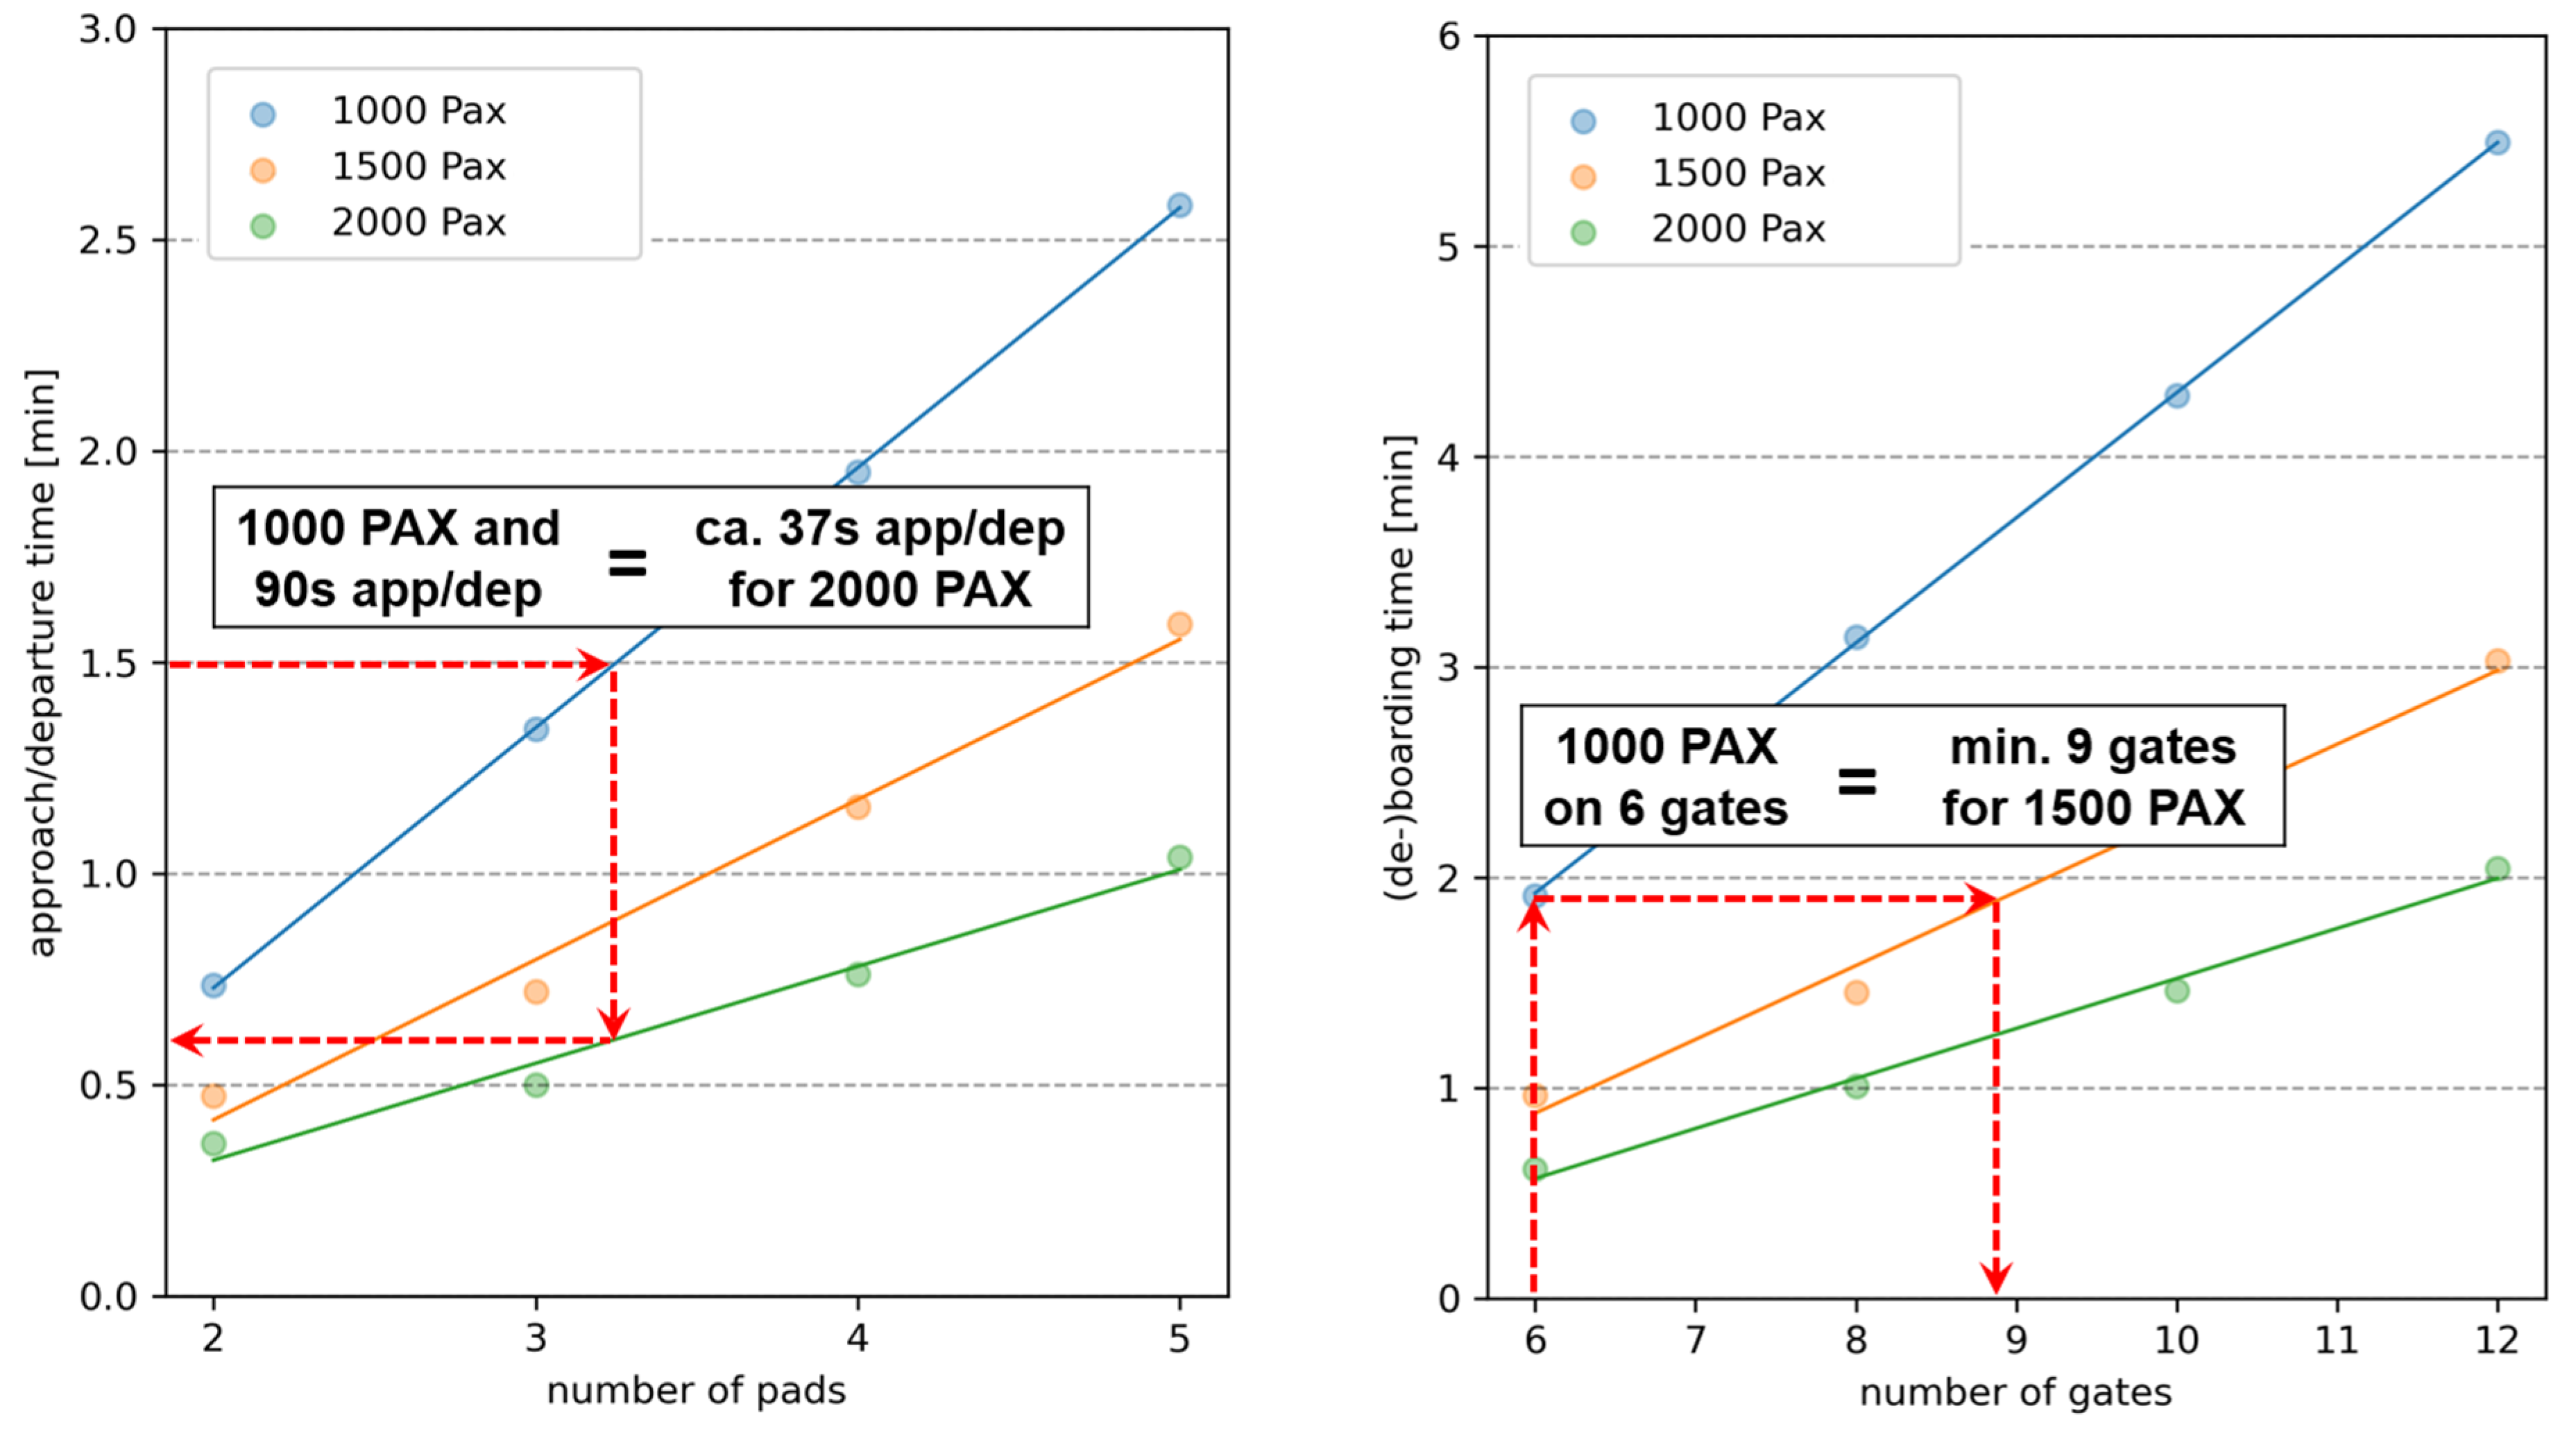
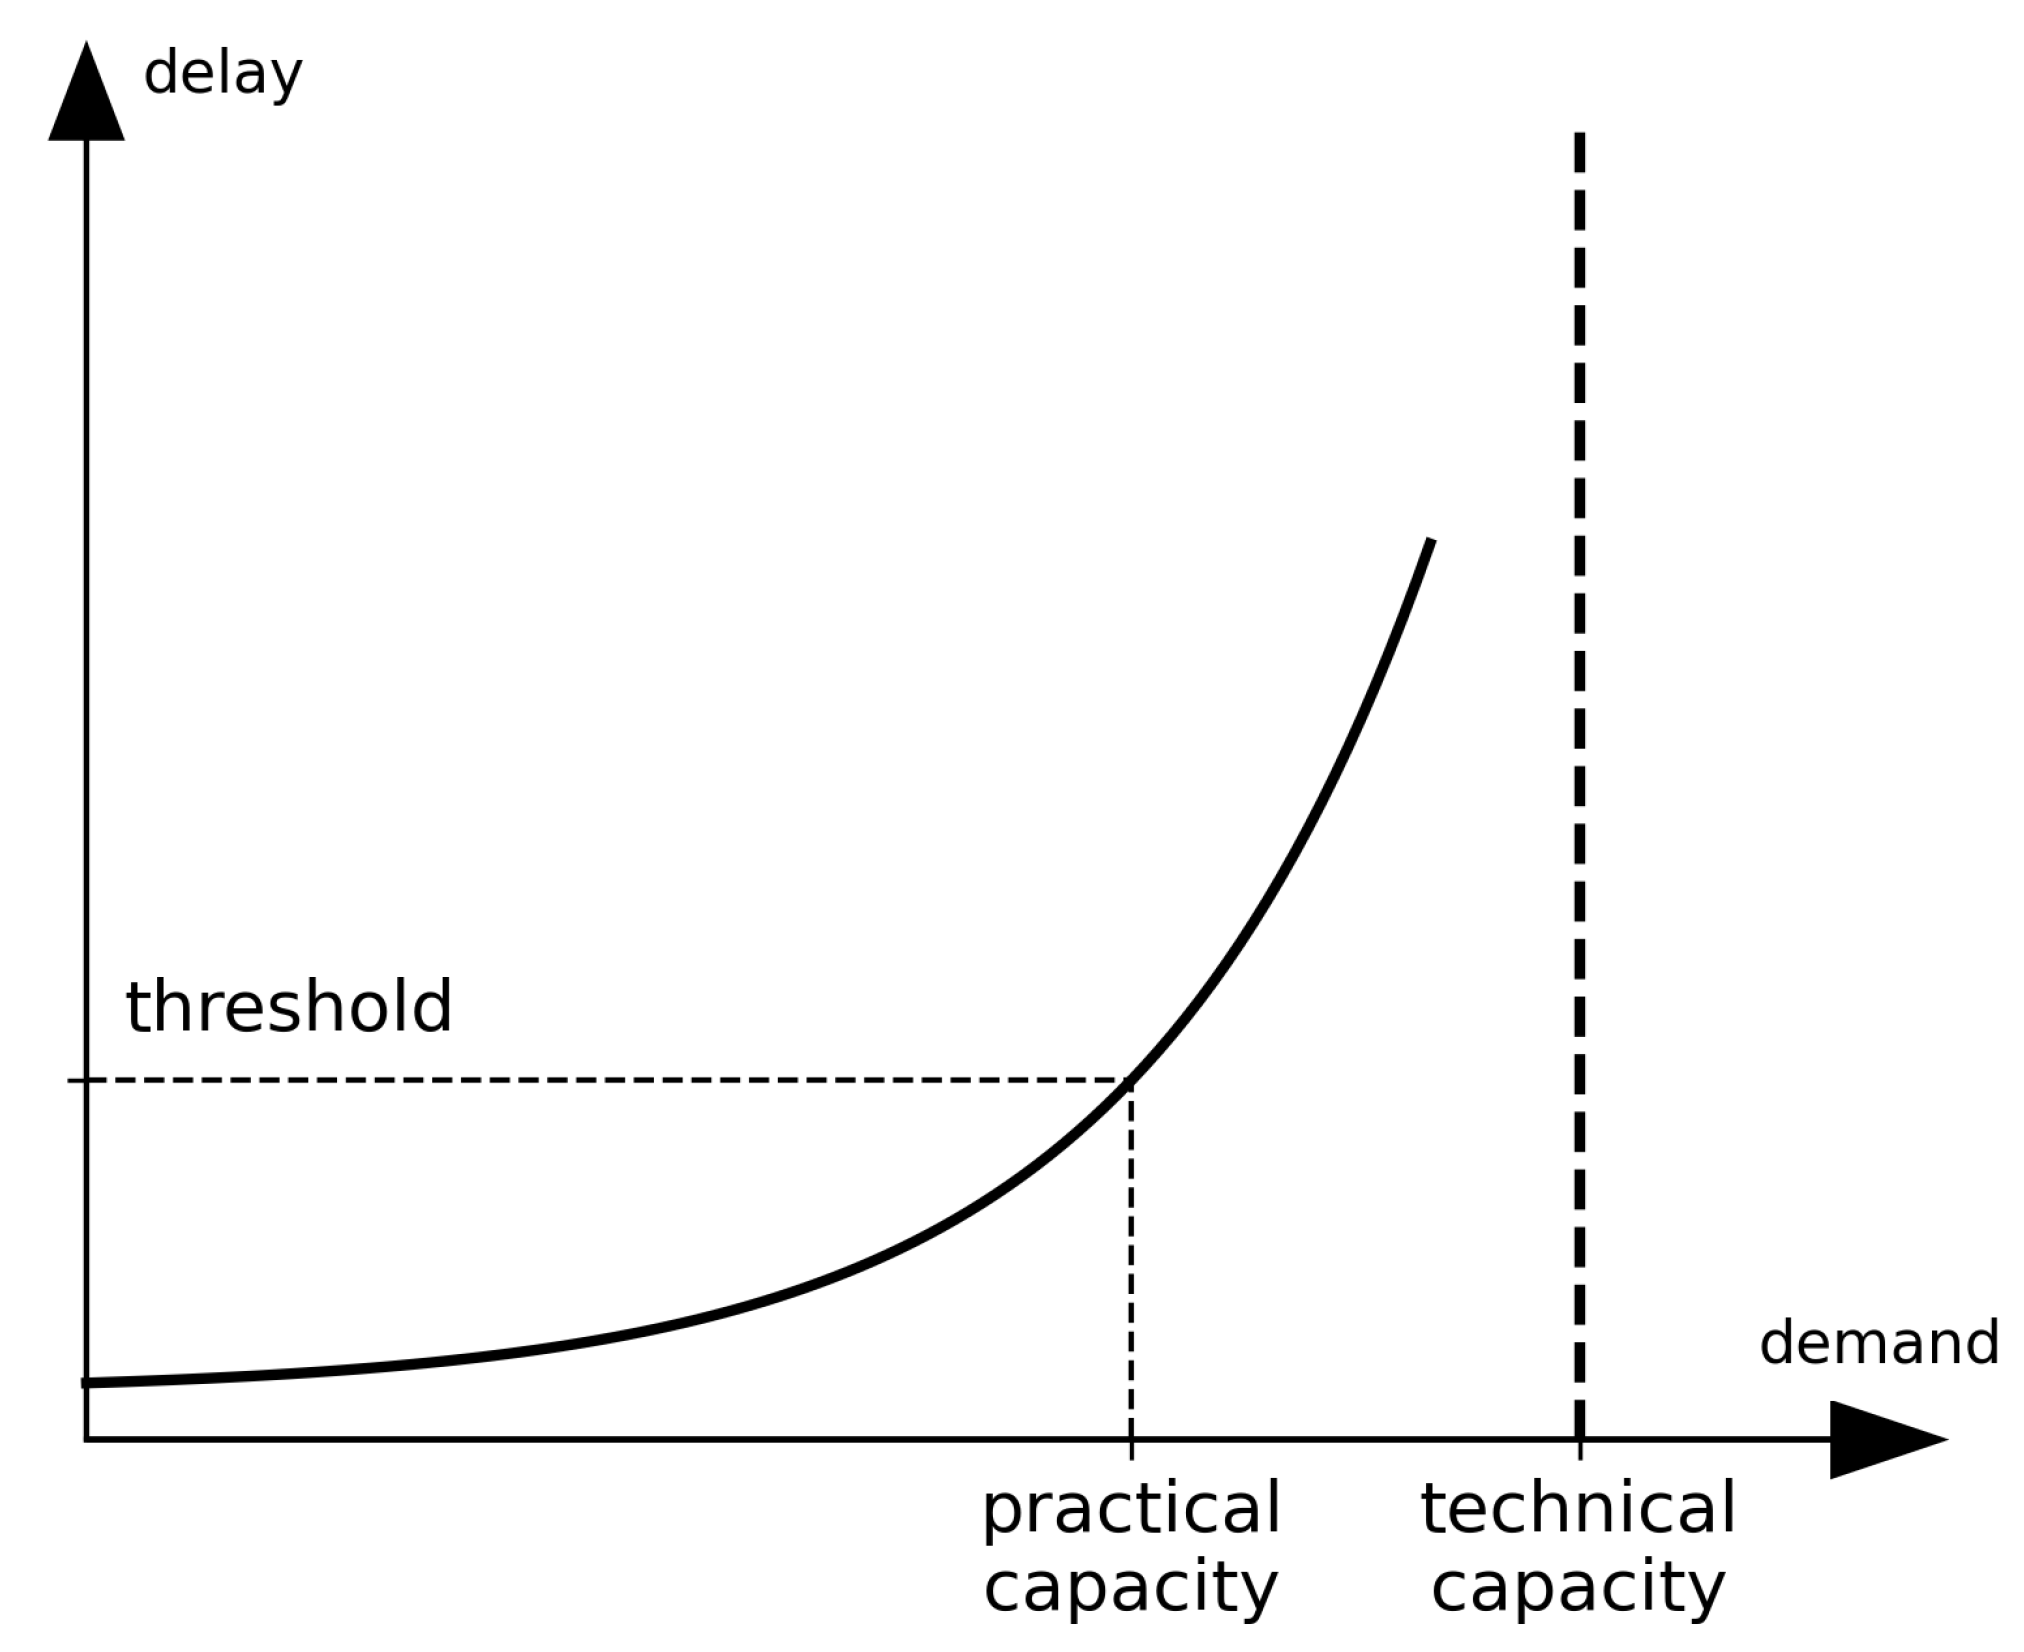
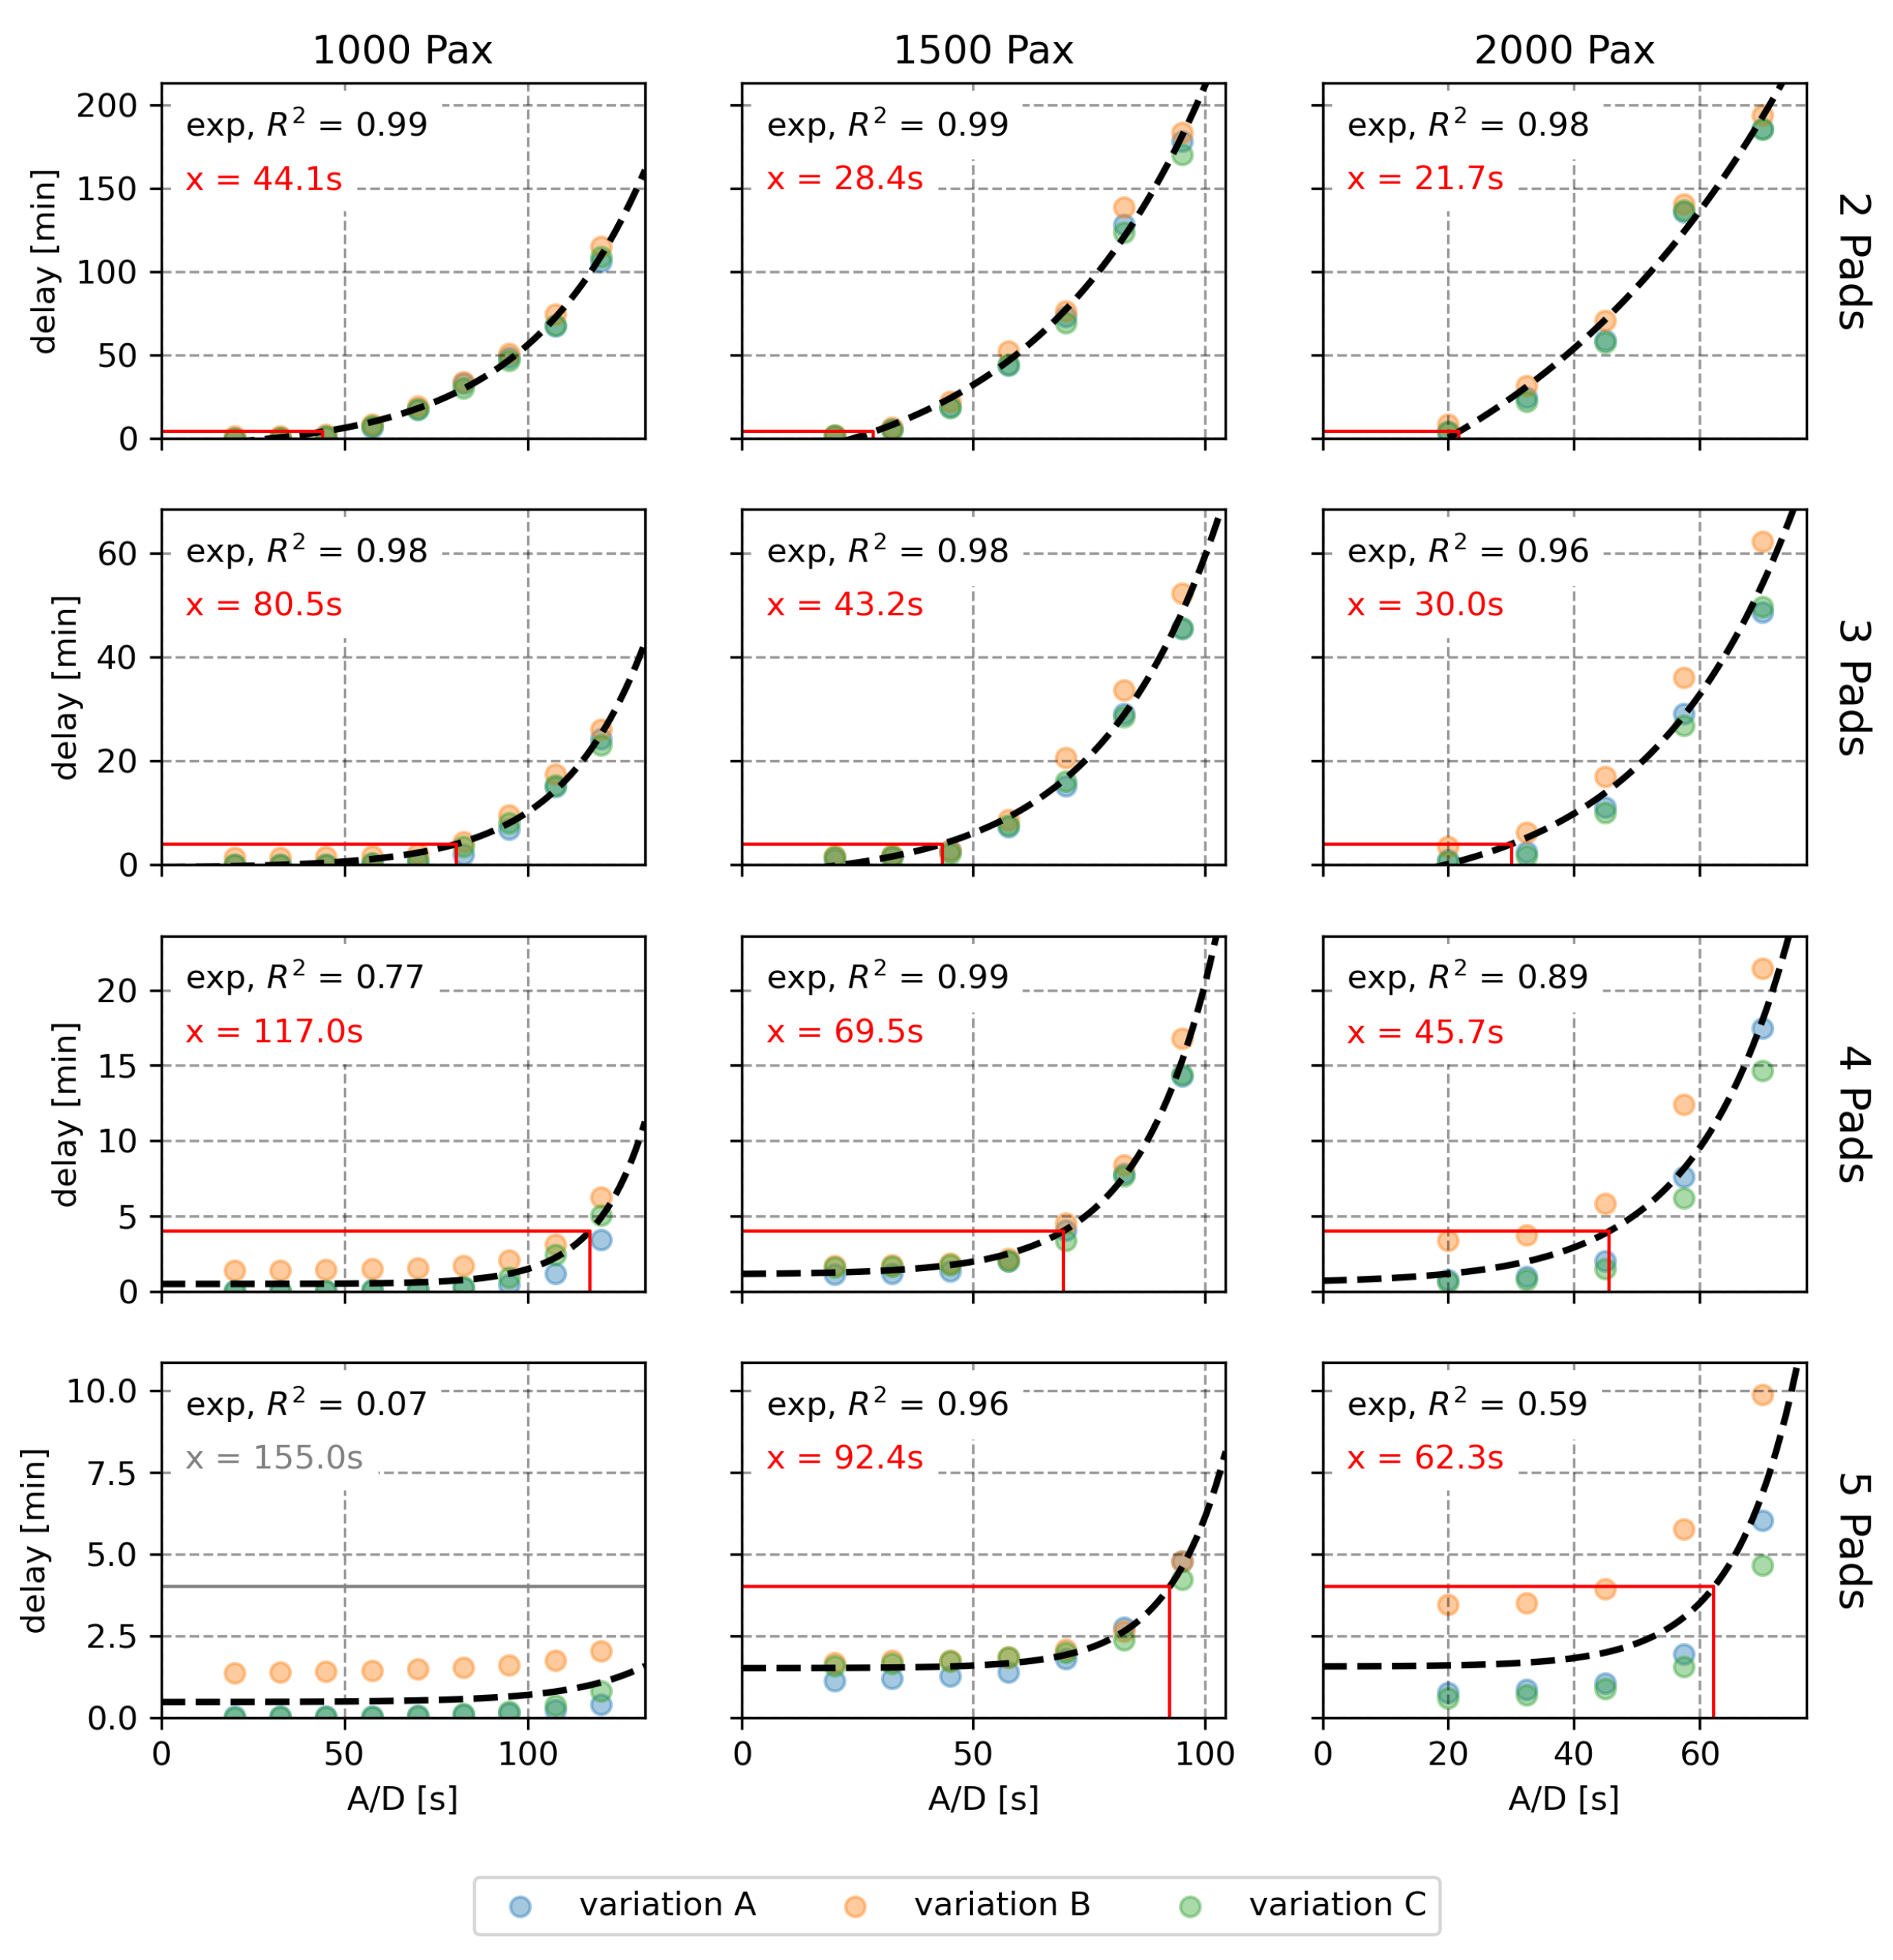
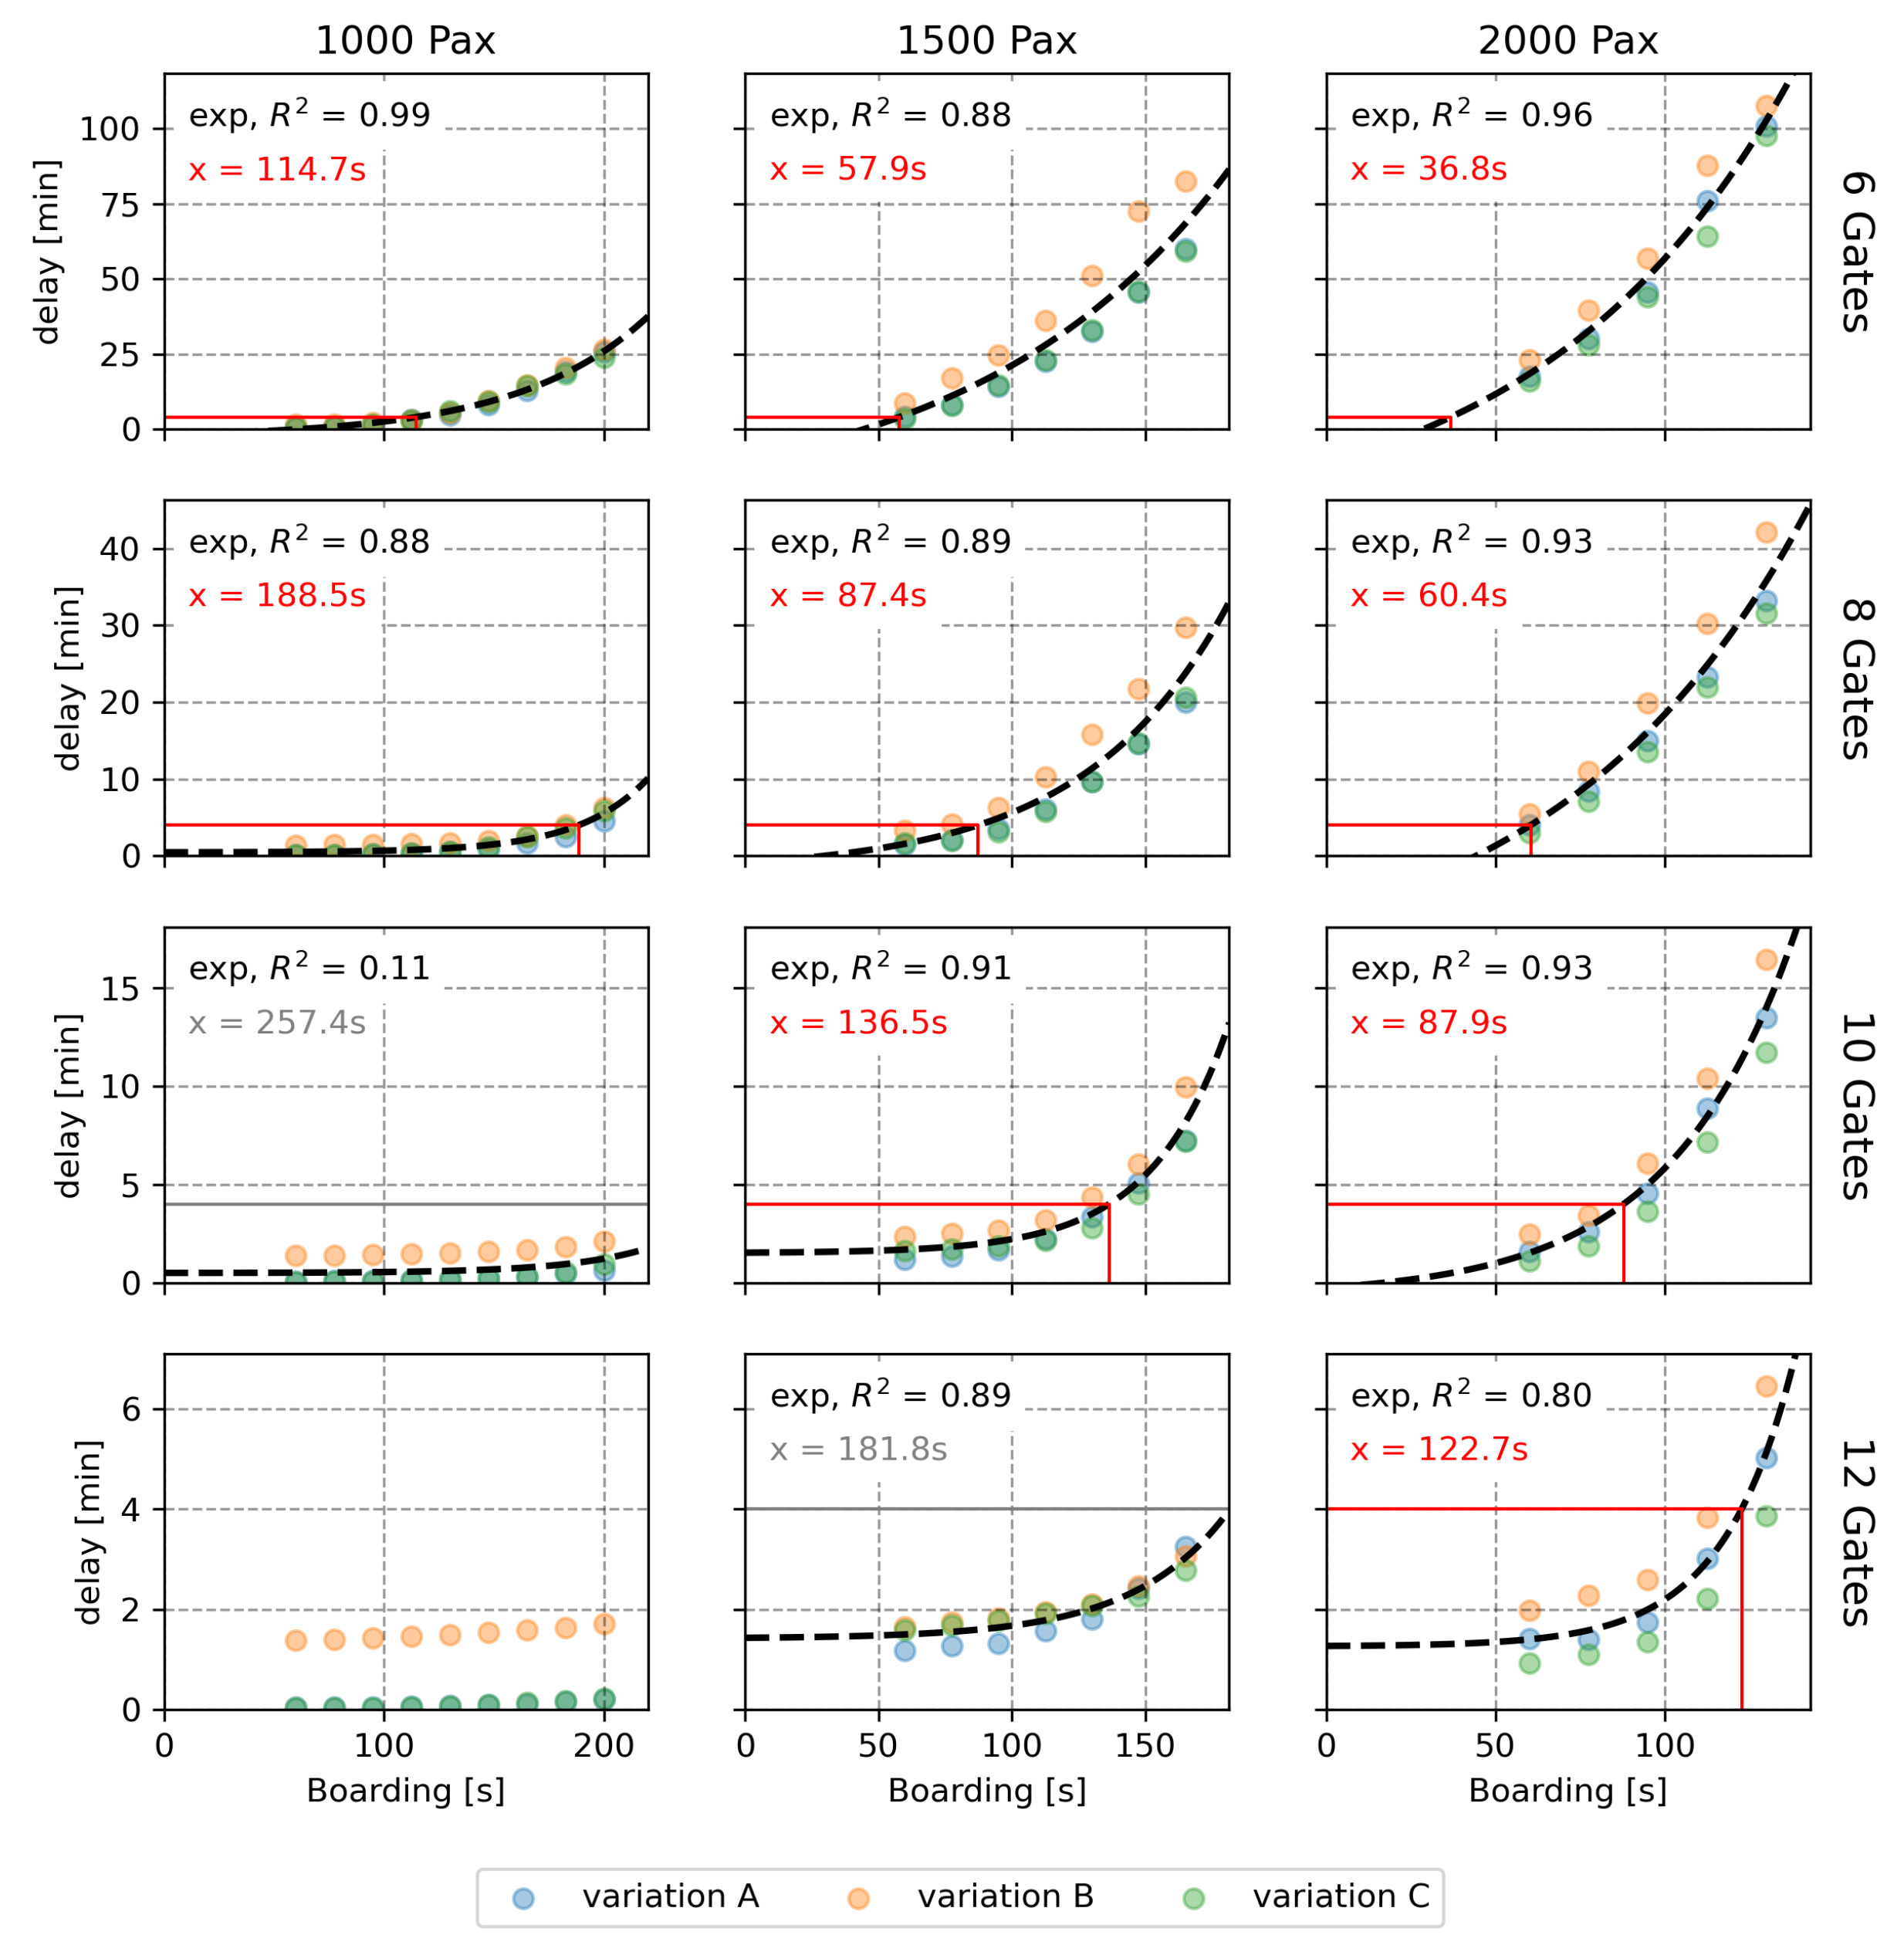
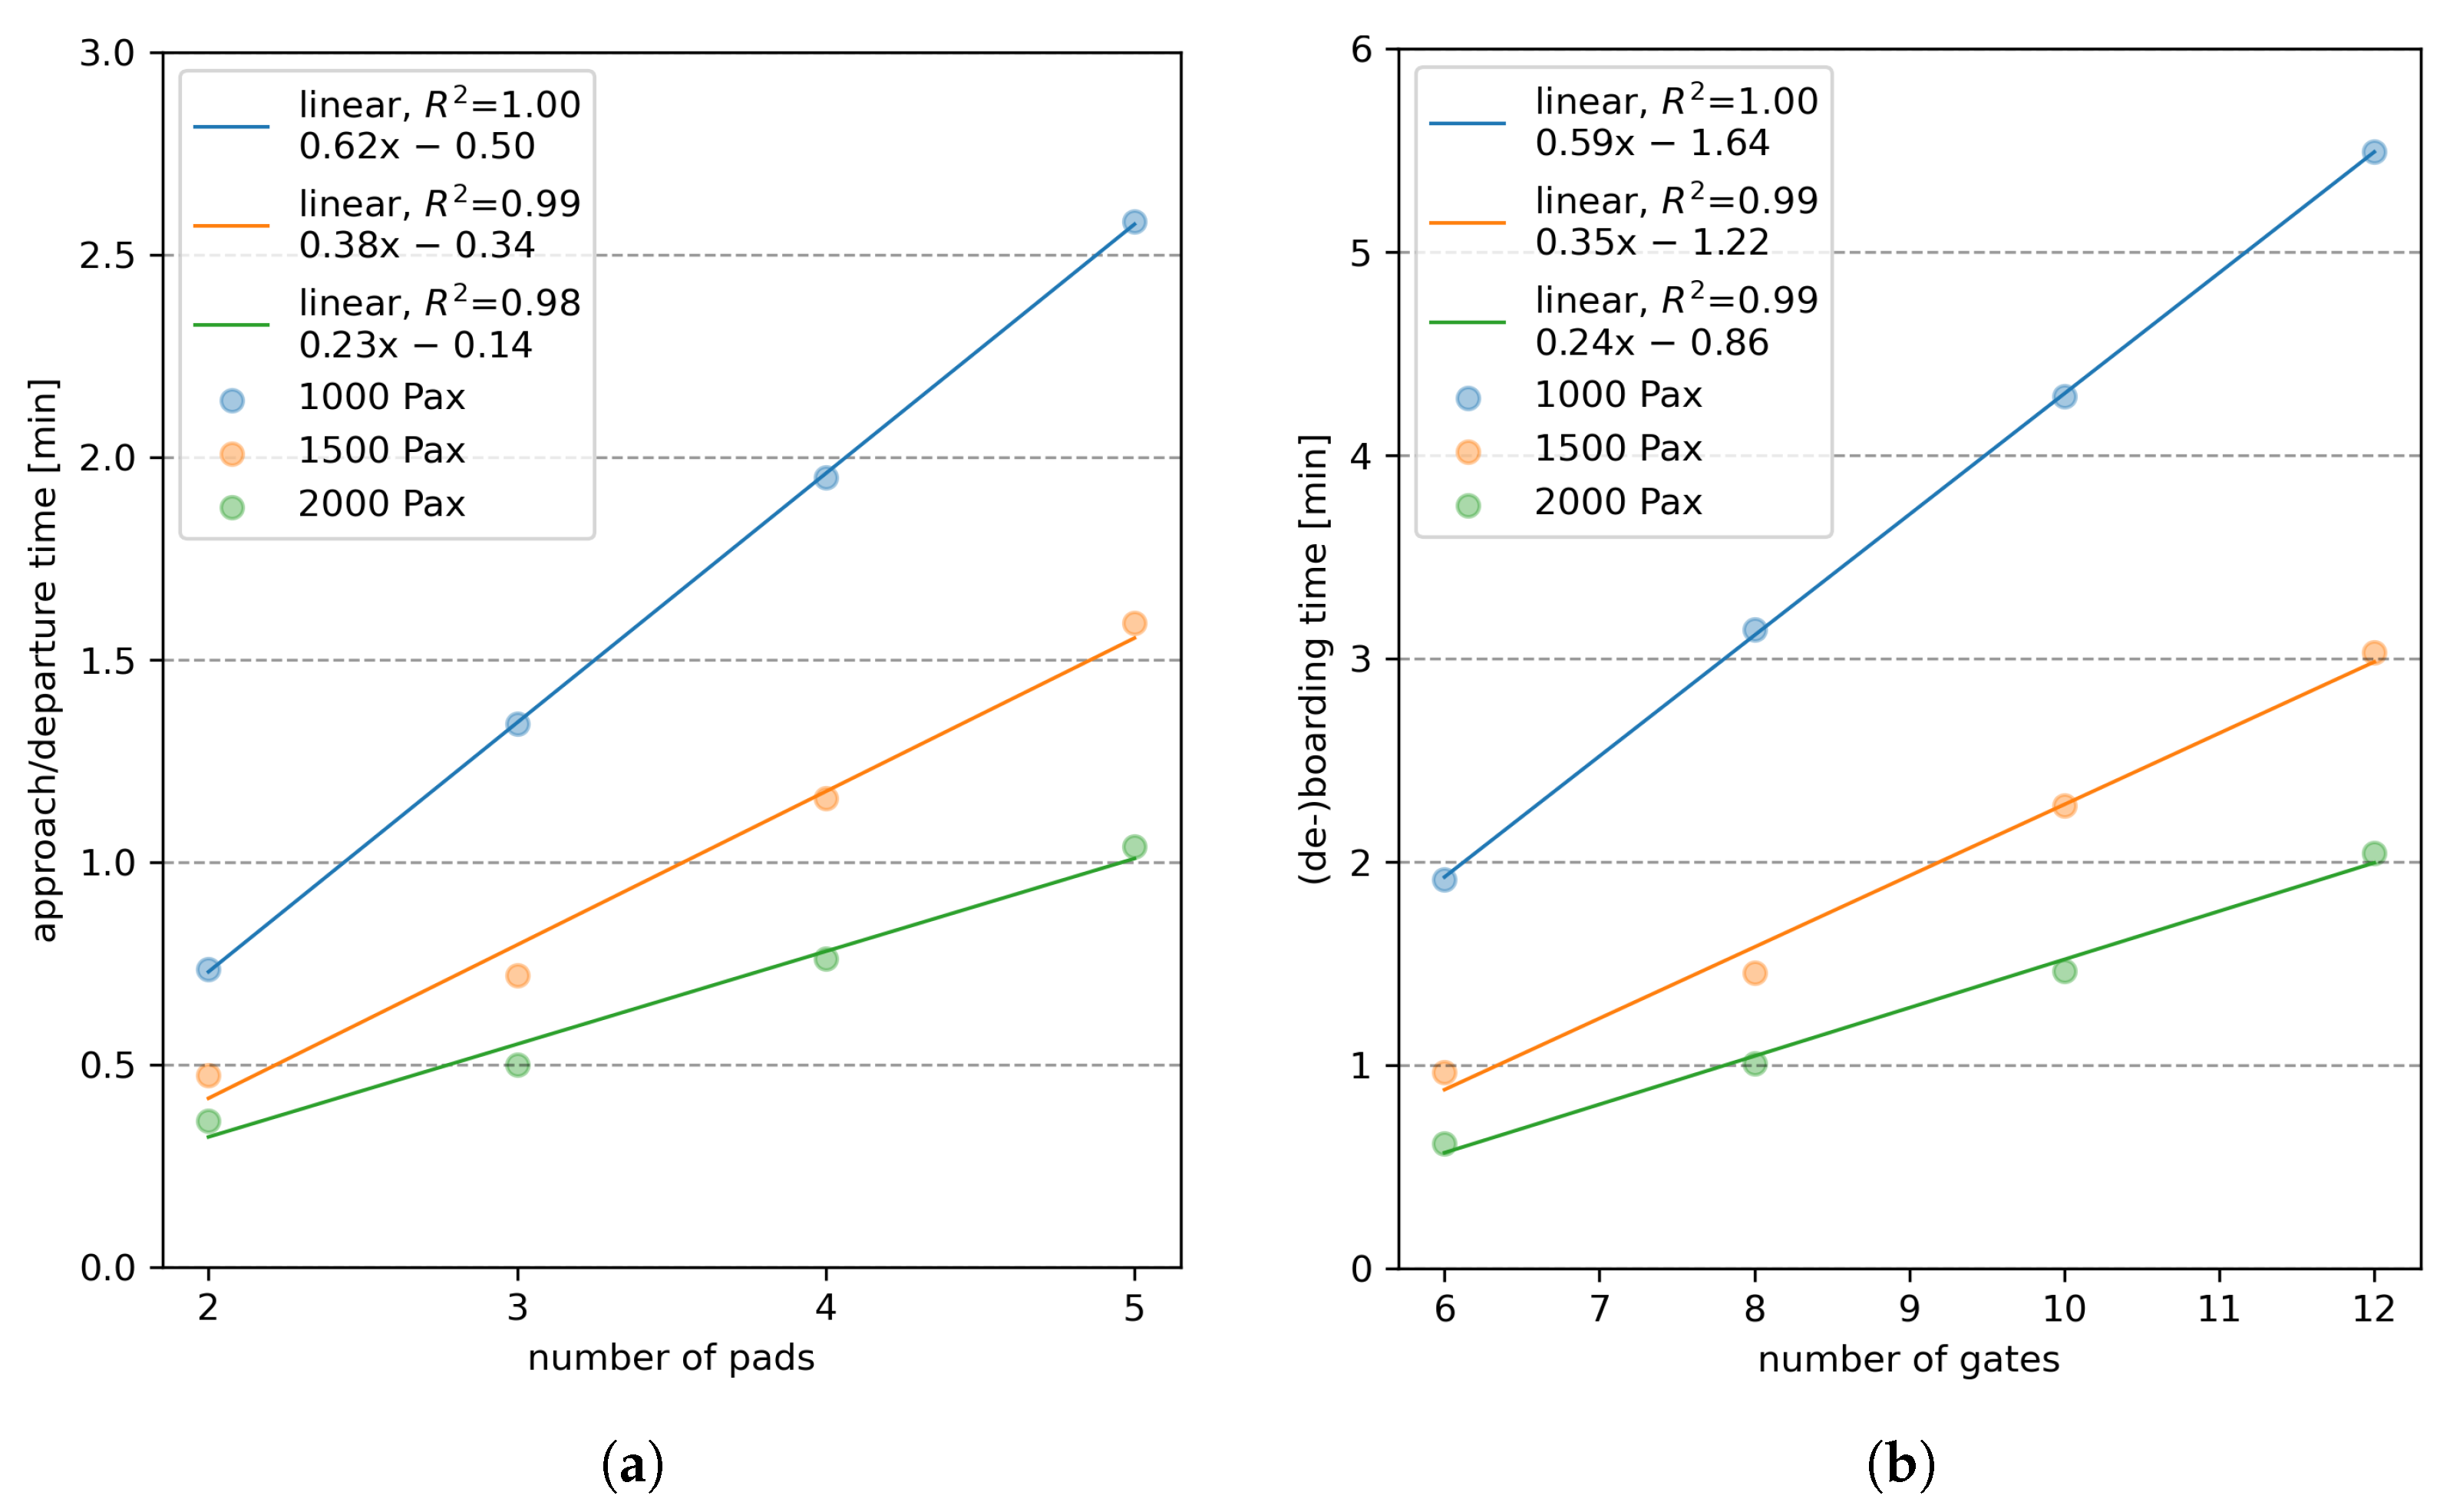
- Increasing/decreasing the time of processes on pads or gates (e.g., approach or boarding time, respectively) has a similar effect as reducing/expanding the number of pads or gates. Both increased process times and reduced number of elements beyond a certain threshold yield an exponential increase in delay.
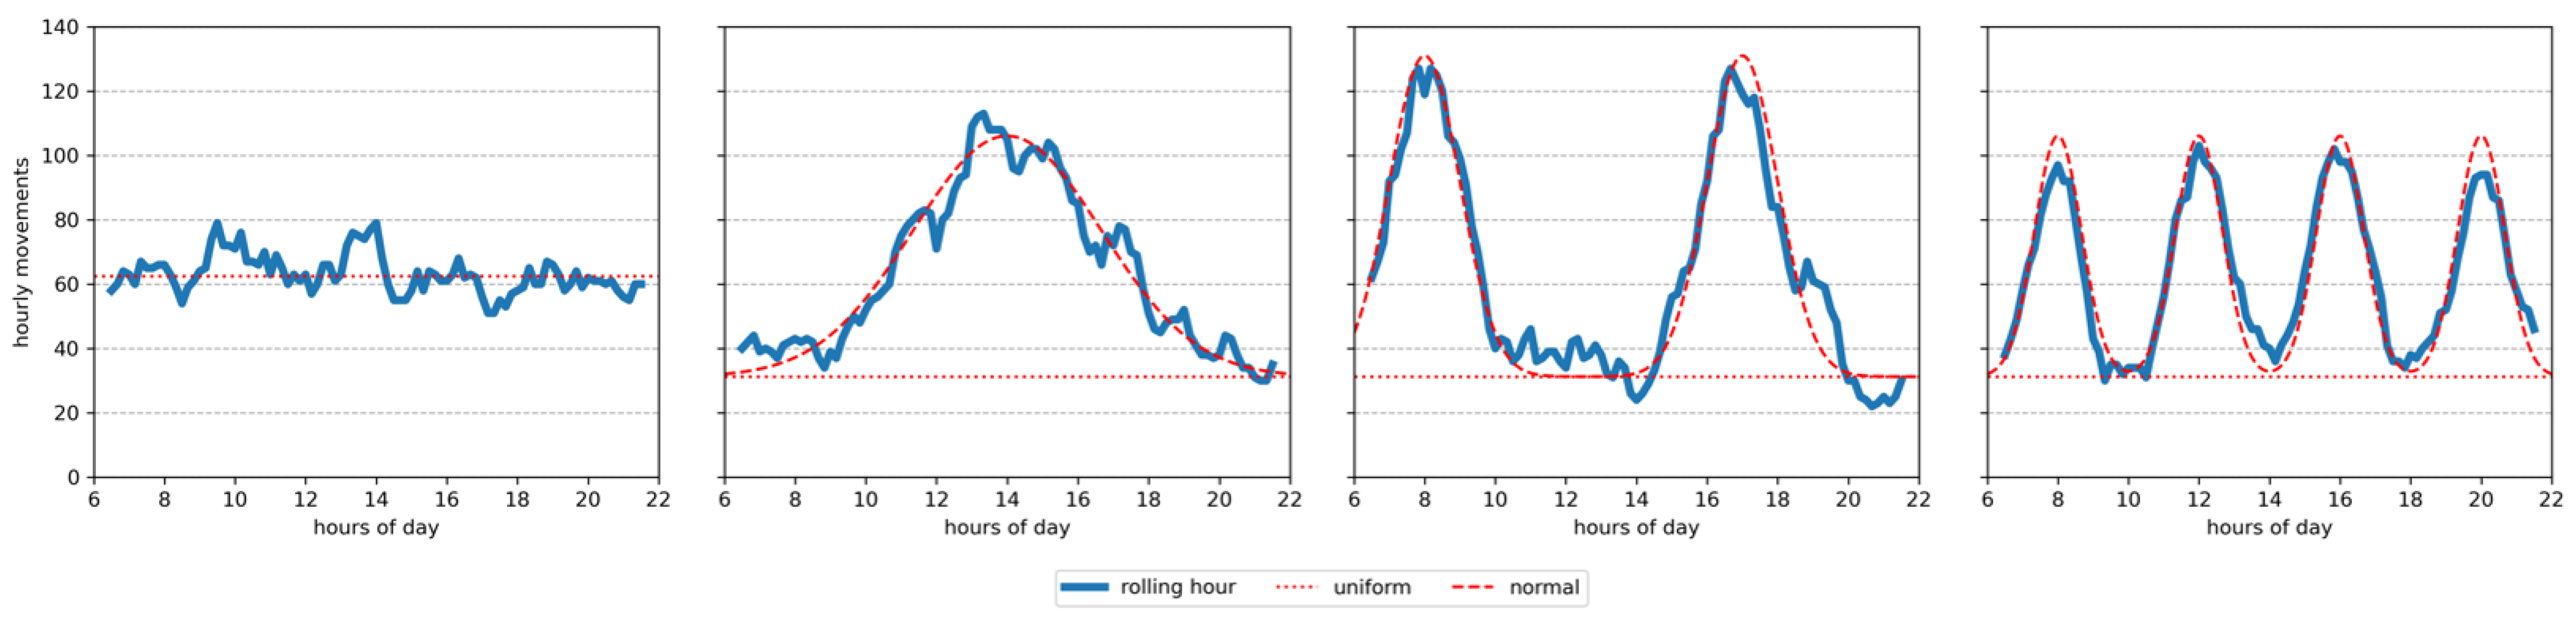
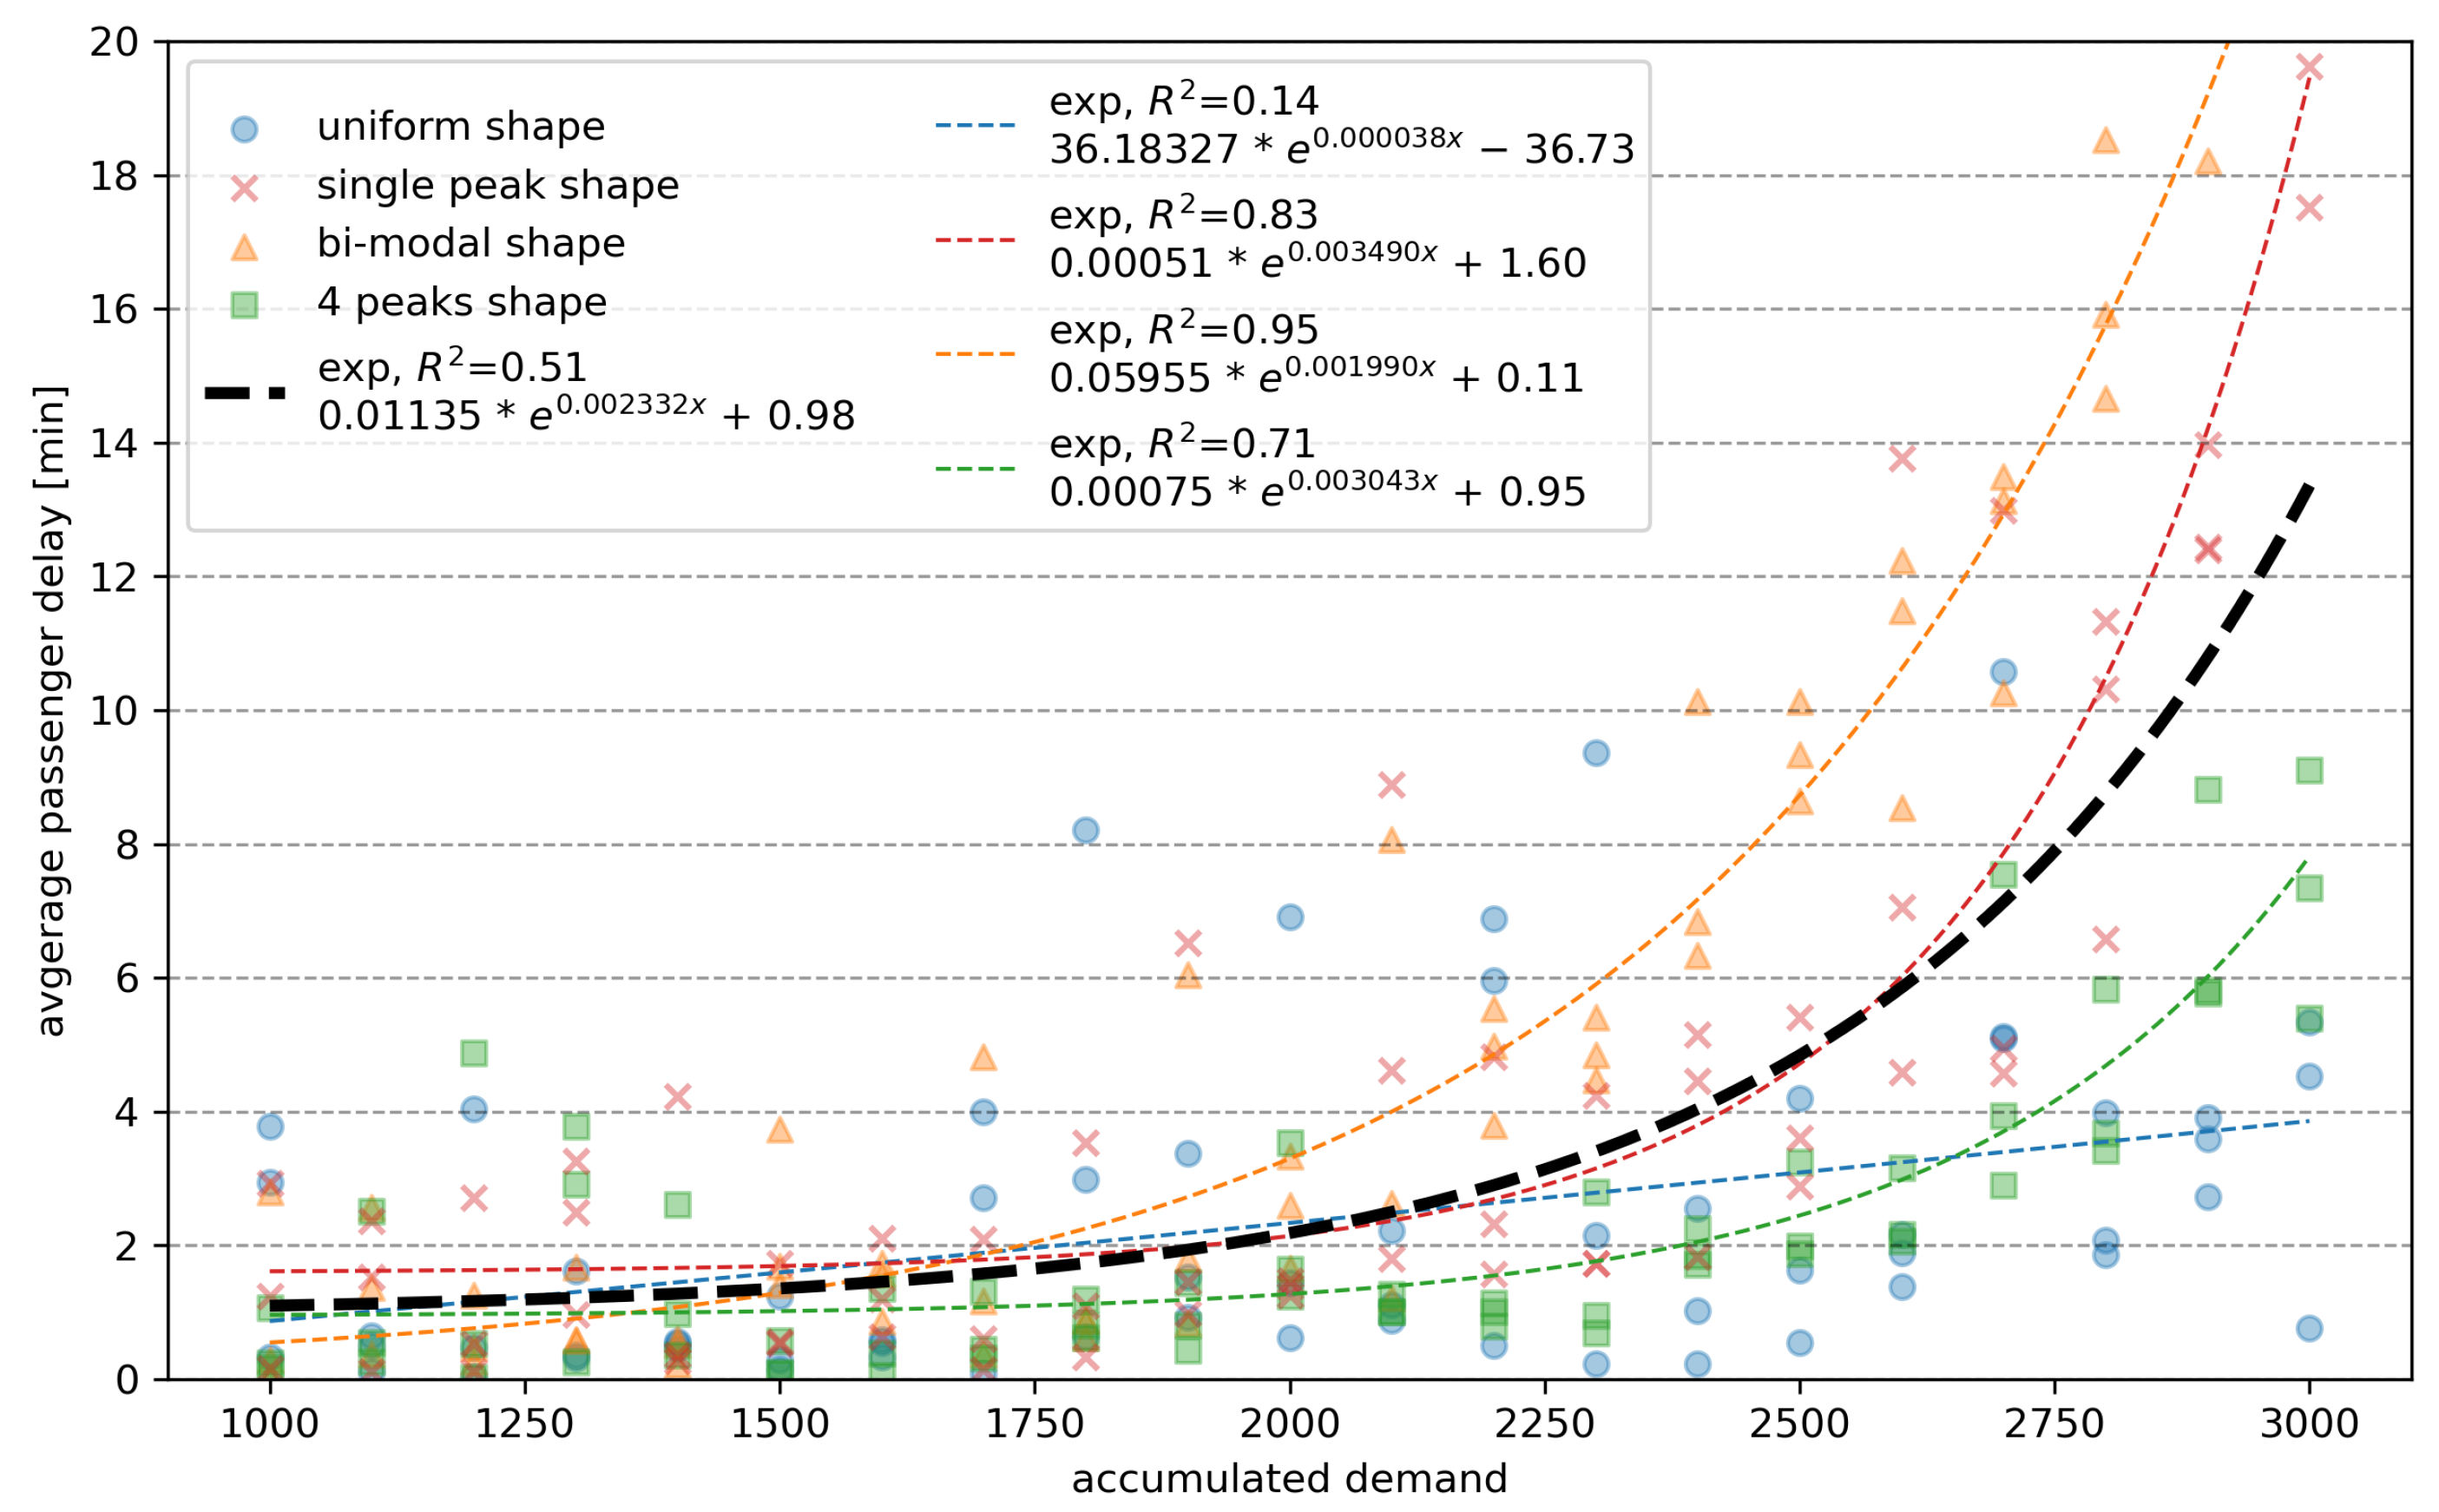
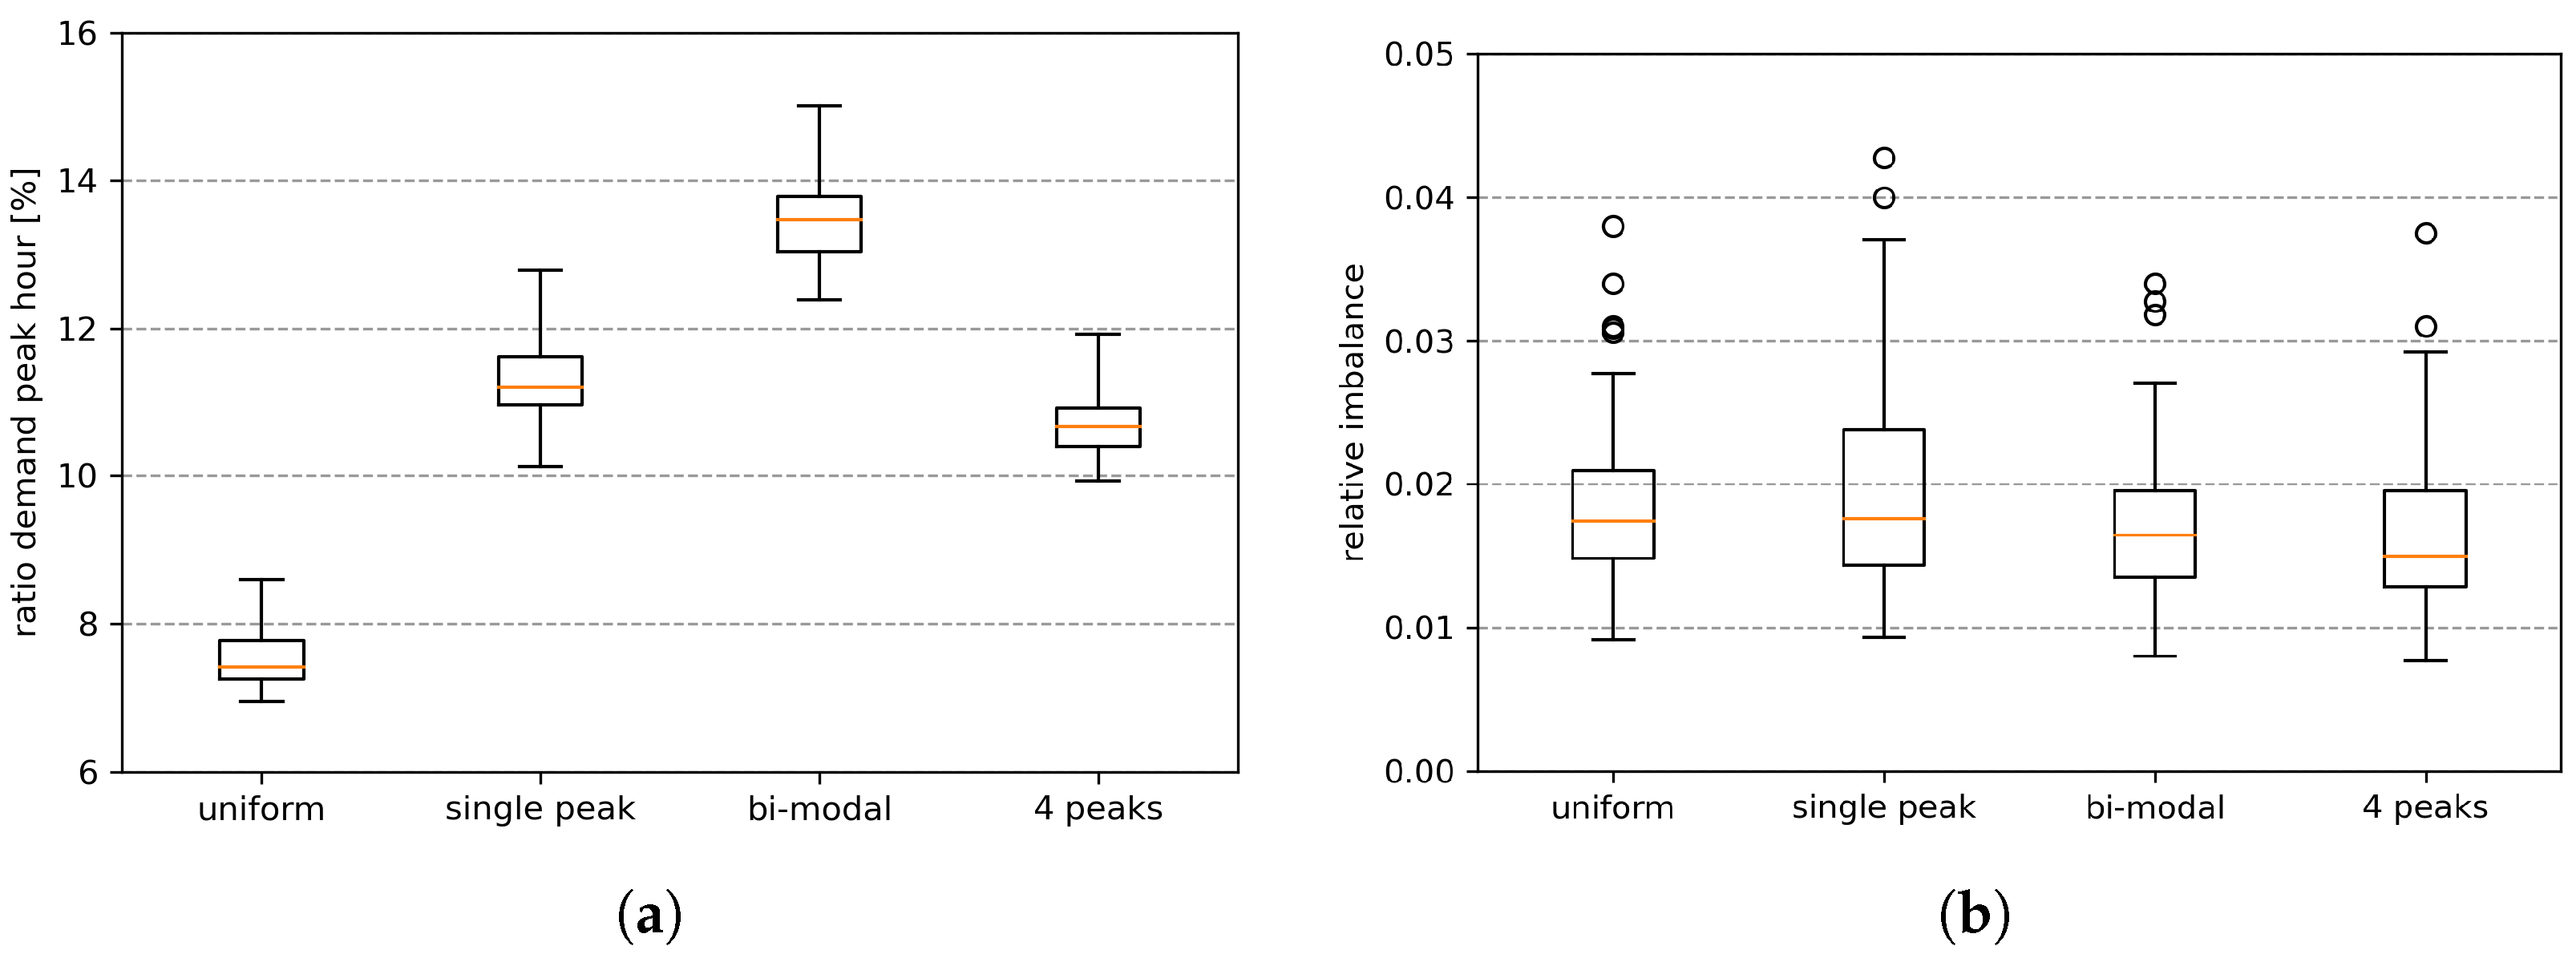
- The accumulated daily demand is generally not a reliable indicator for operational efficiency; instead, using the peak-hour demand yields more reliable predictions about delay. Analysis of peak-hour demand is typical for airports, but not for heliports. It can, therefore, be assumed that heliports do not operate at capacity limit. Previous simulations showed that the peak-hour demand is the strongest driver of delay.
- The imbalance of arrivals and departures has a substantial impact on passenger delay. This phenomenon can be explained by a state when a vertiport is either drained of all vehicles, forcing passengers to wait for arriving vehicles, or when the vertiport is fully stocked and arriving vehicles have no gates or stands they can taxi to.
3. Demand-Related Drivers of Vertiport Operations
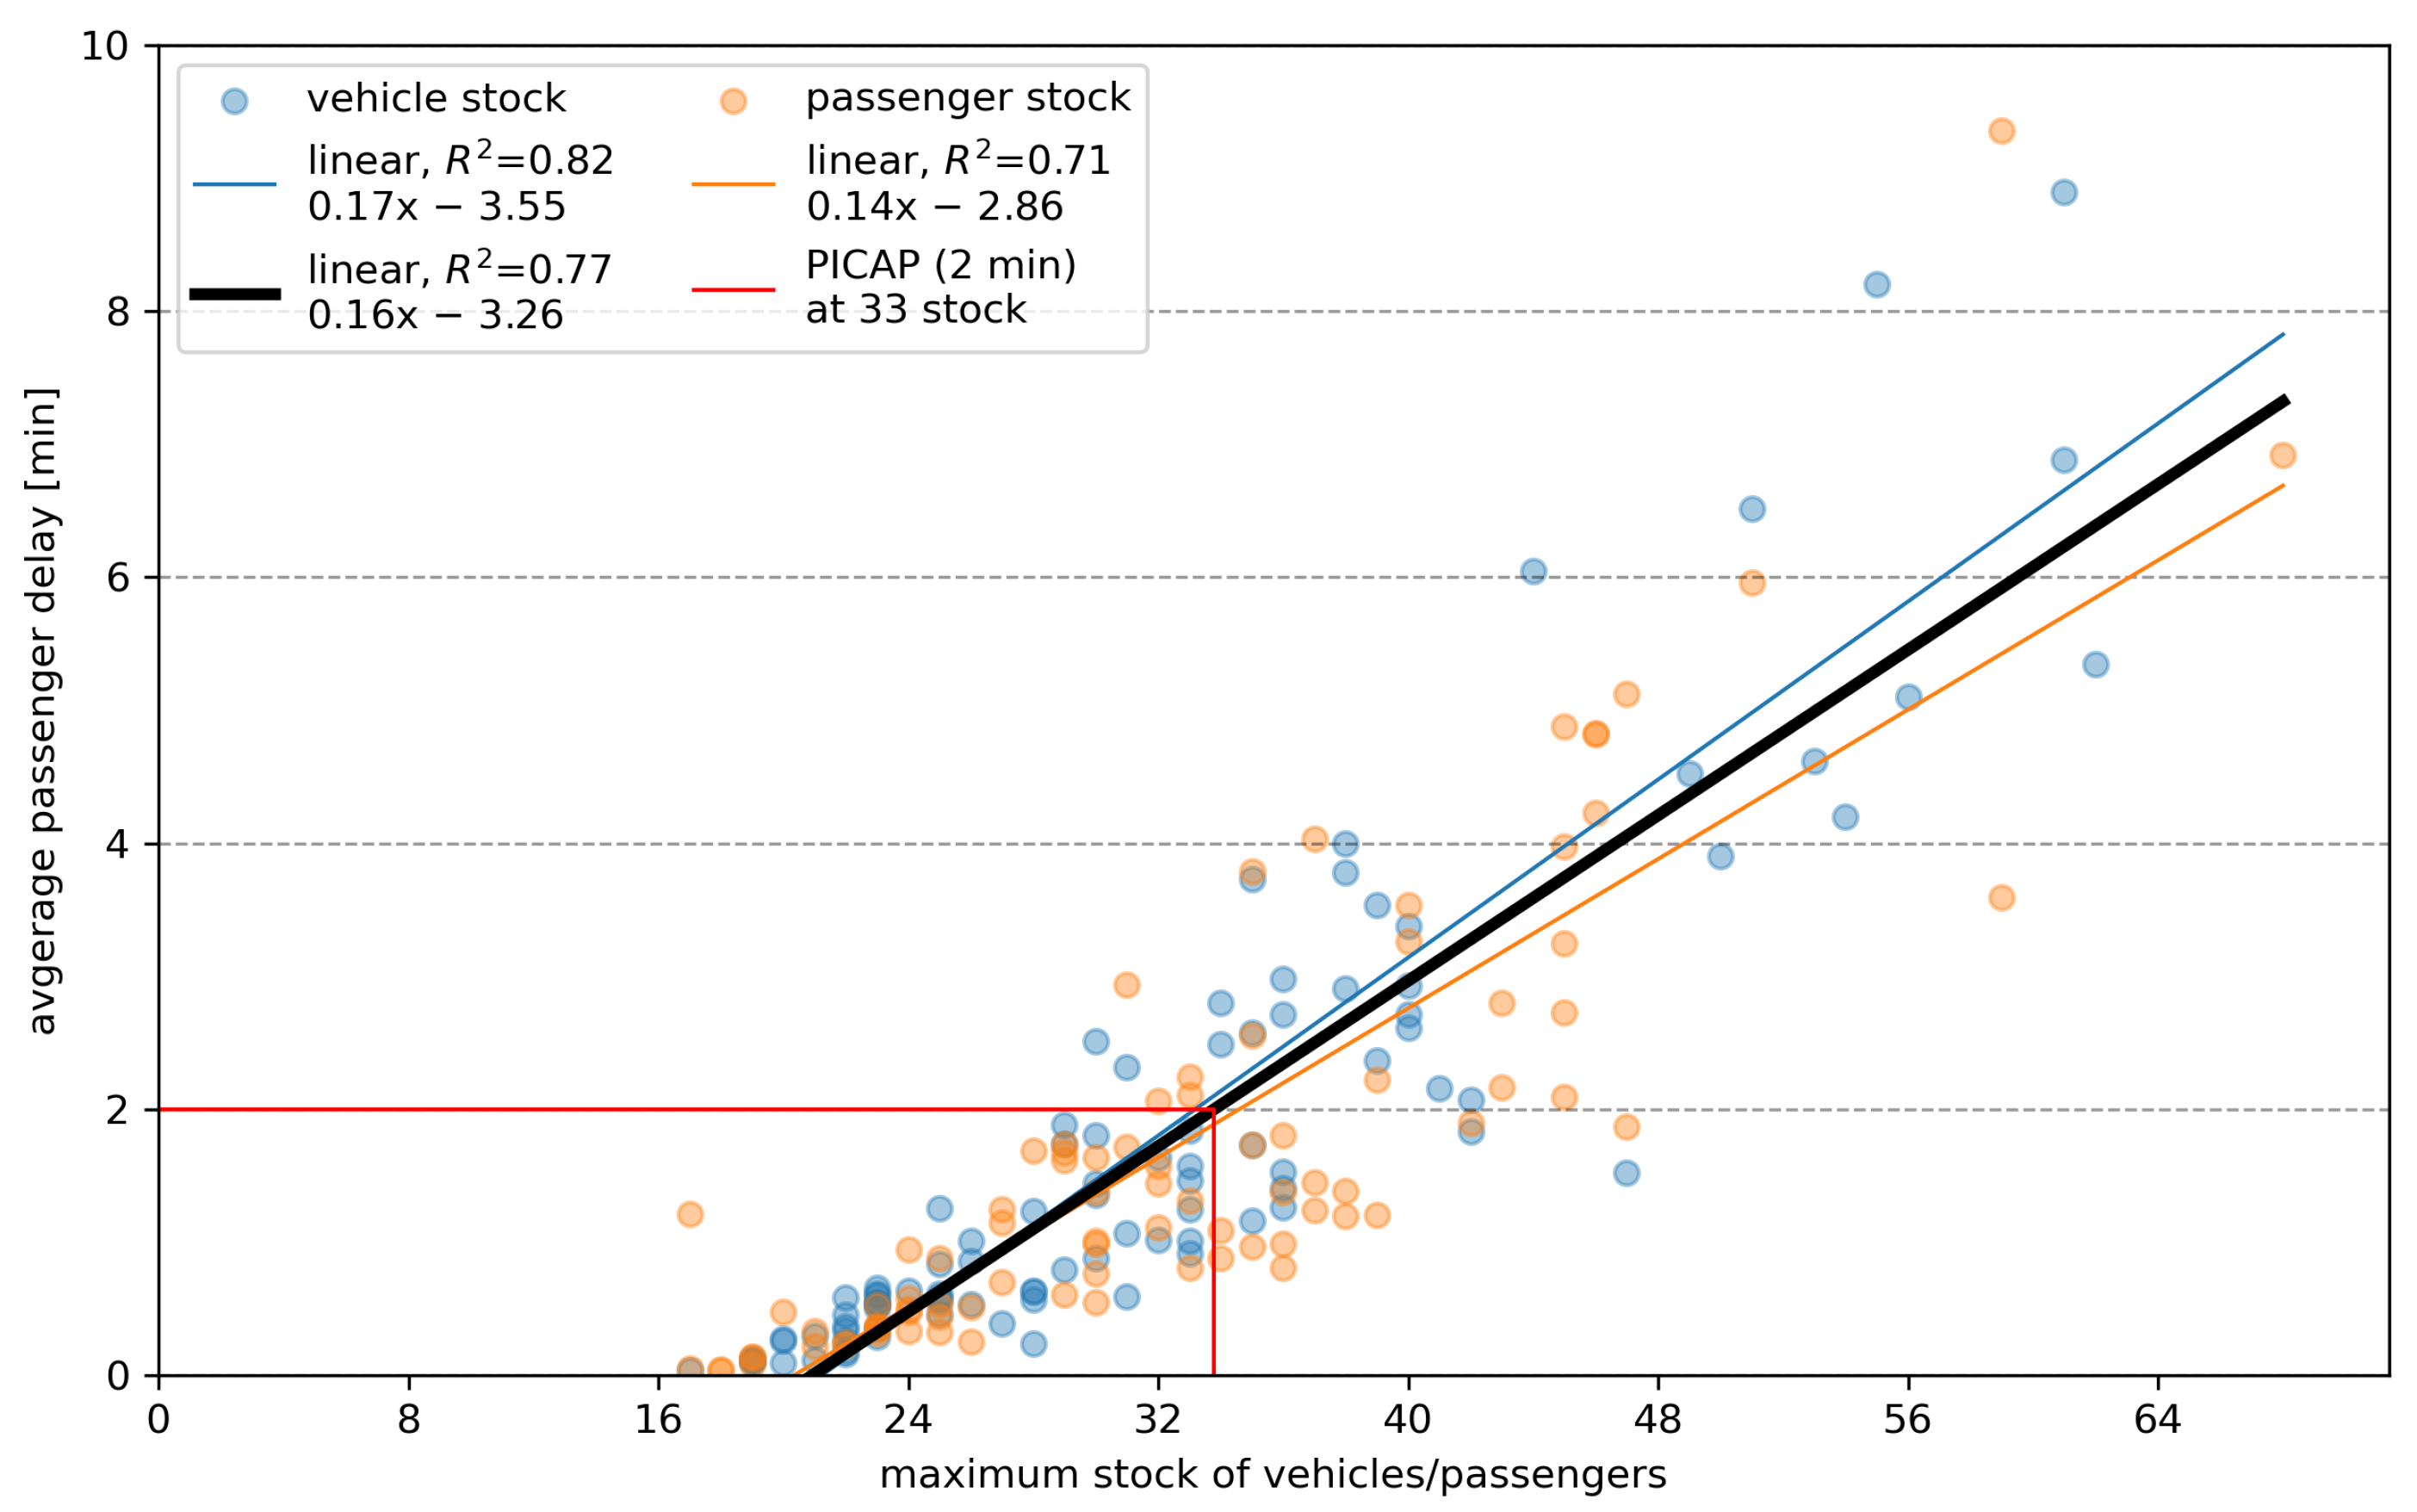
3.1. Practical Capacity
3.2. Study Design
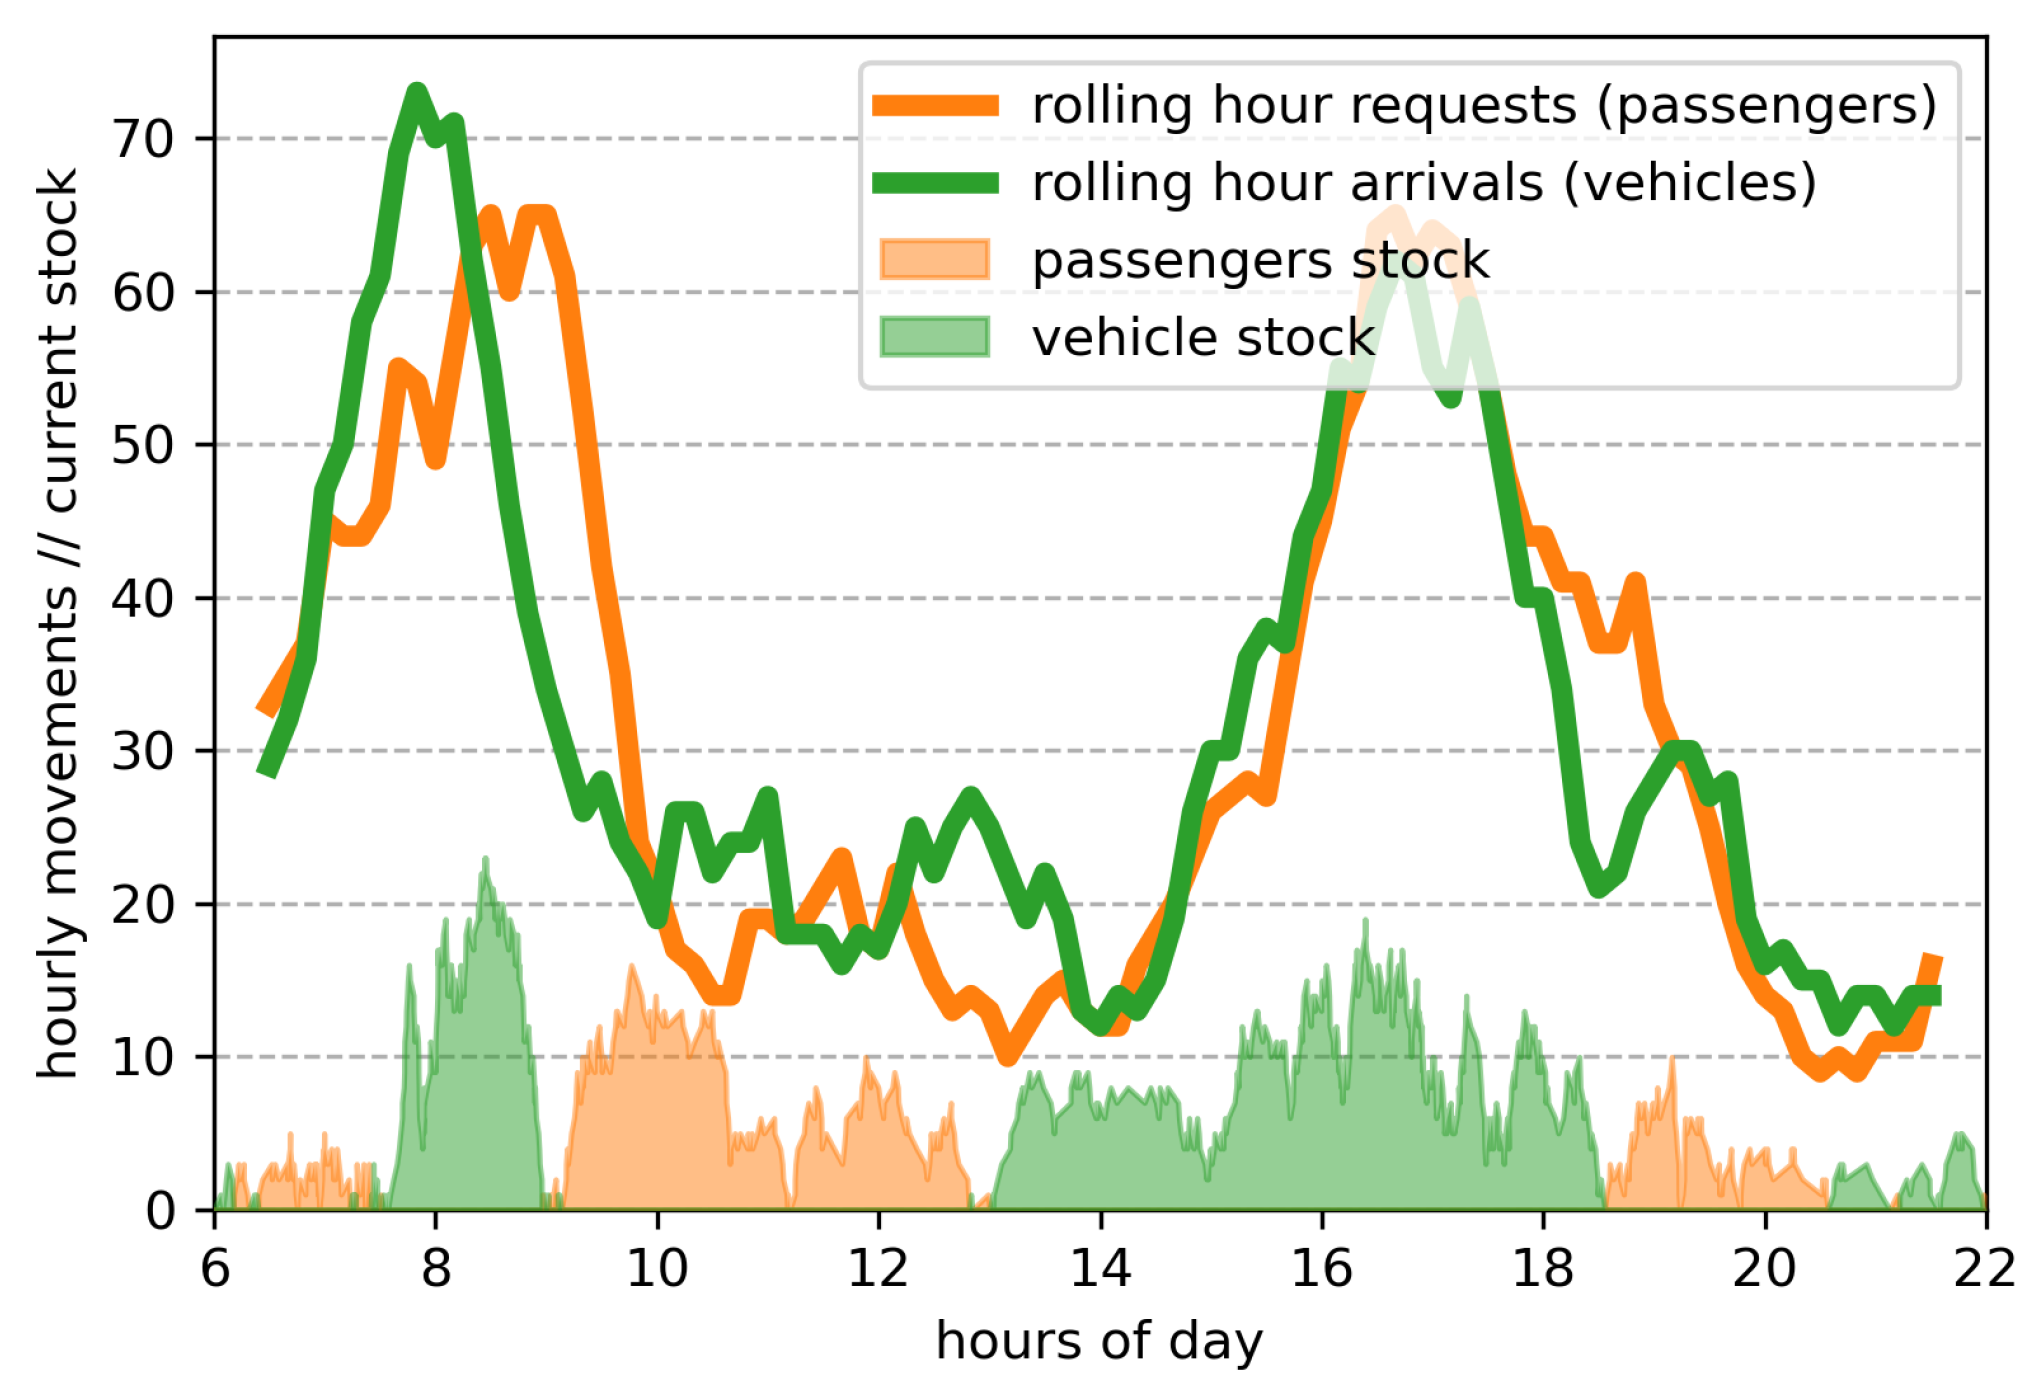
3.3. Analysis of Daily Demand
3.4. Drivers of Delay
3.5. Further Effects
4. Layout-Related Drivers on Vertiport Operations
4.1. Study Design
4.2. Analysis of Layout and Processes
4.3. Design Heuristic
5. Conclusions
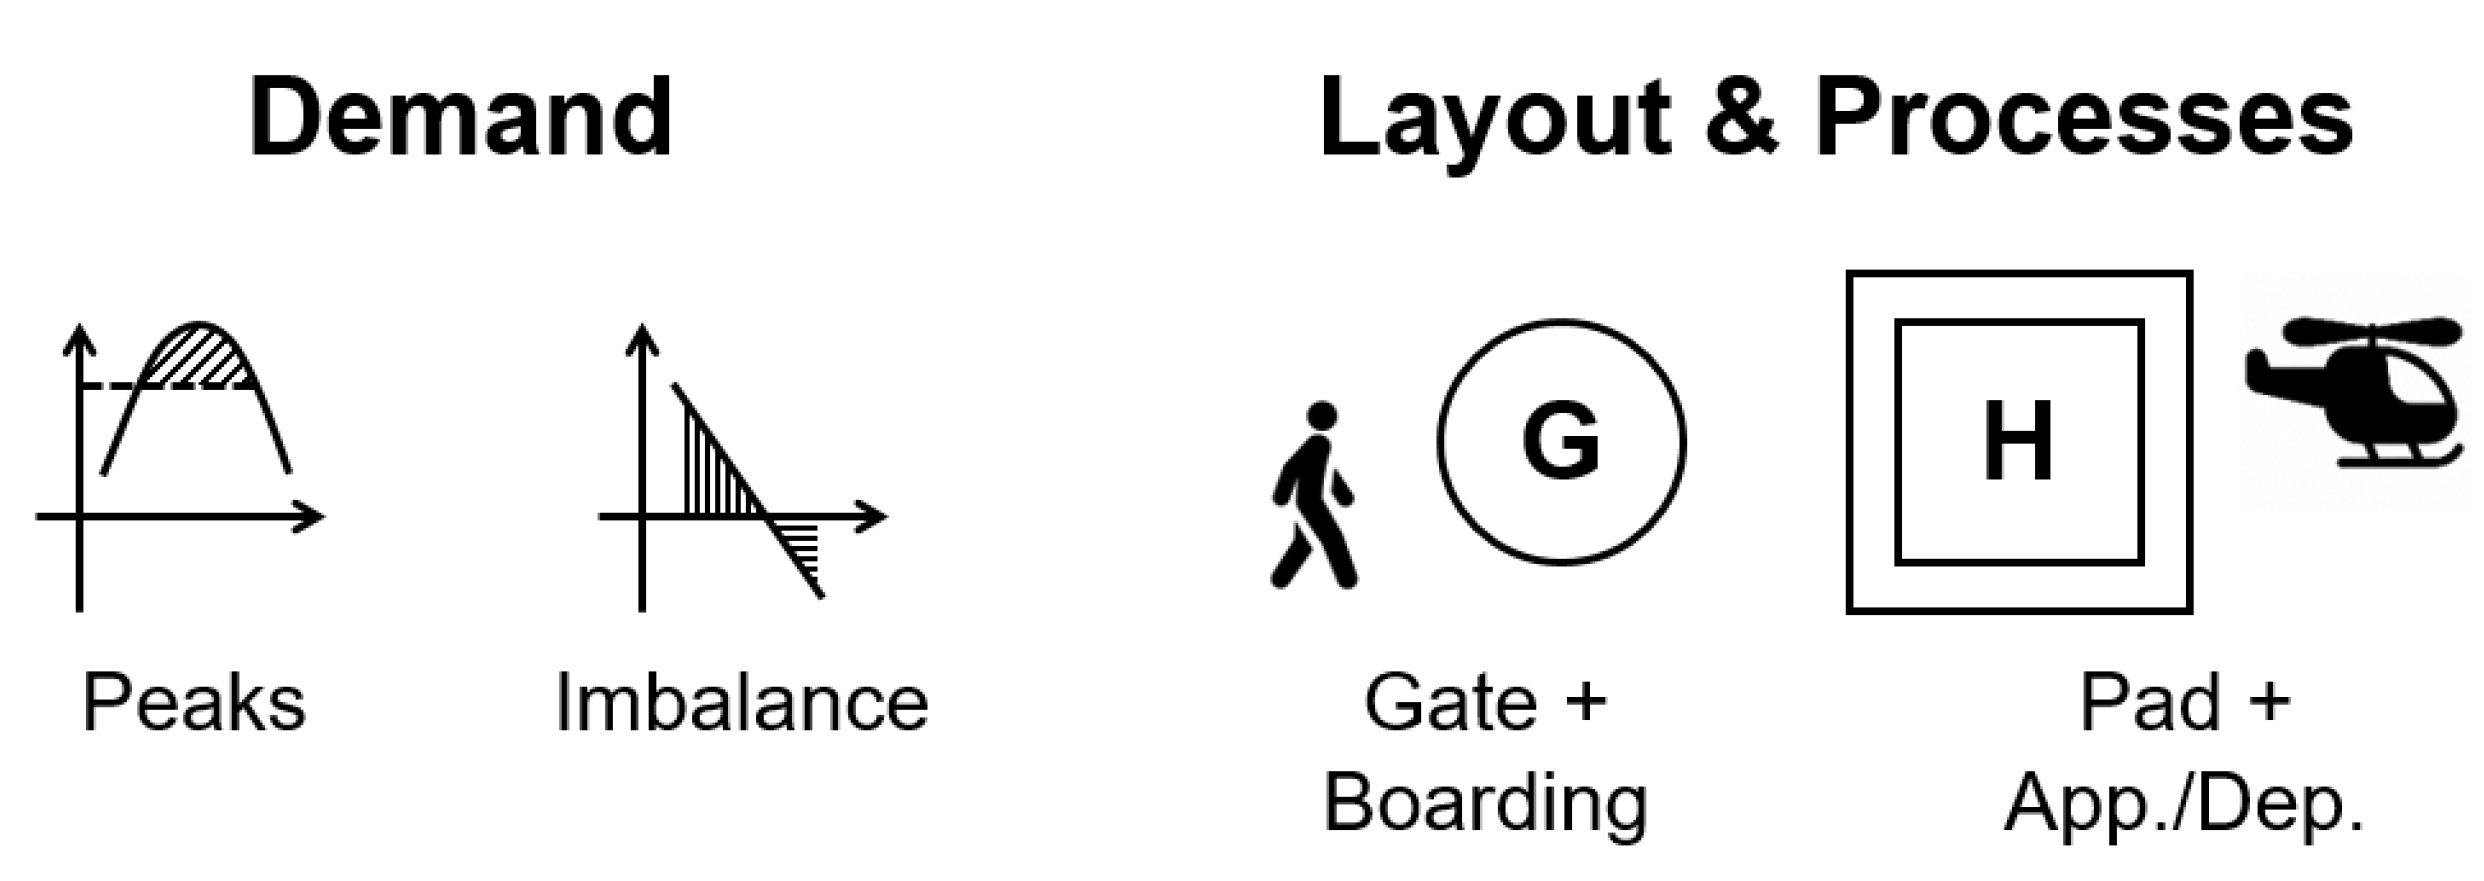
- Peak-hour demand;
- Maximum imbalance between arrivals and departures;
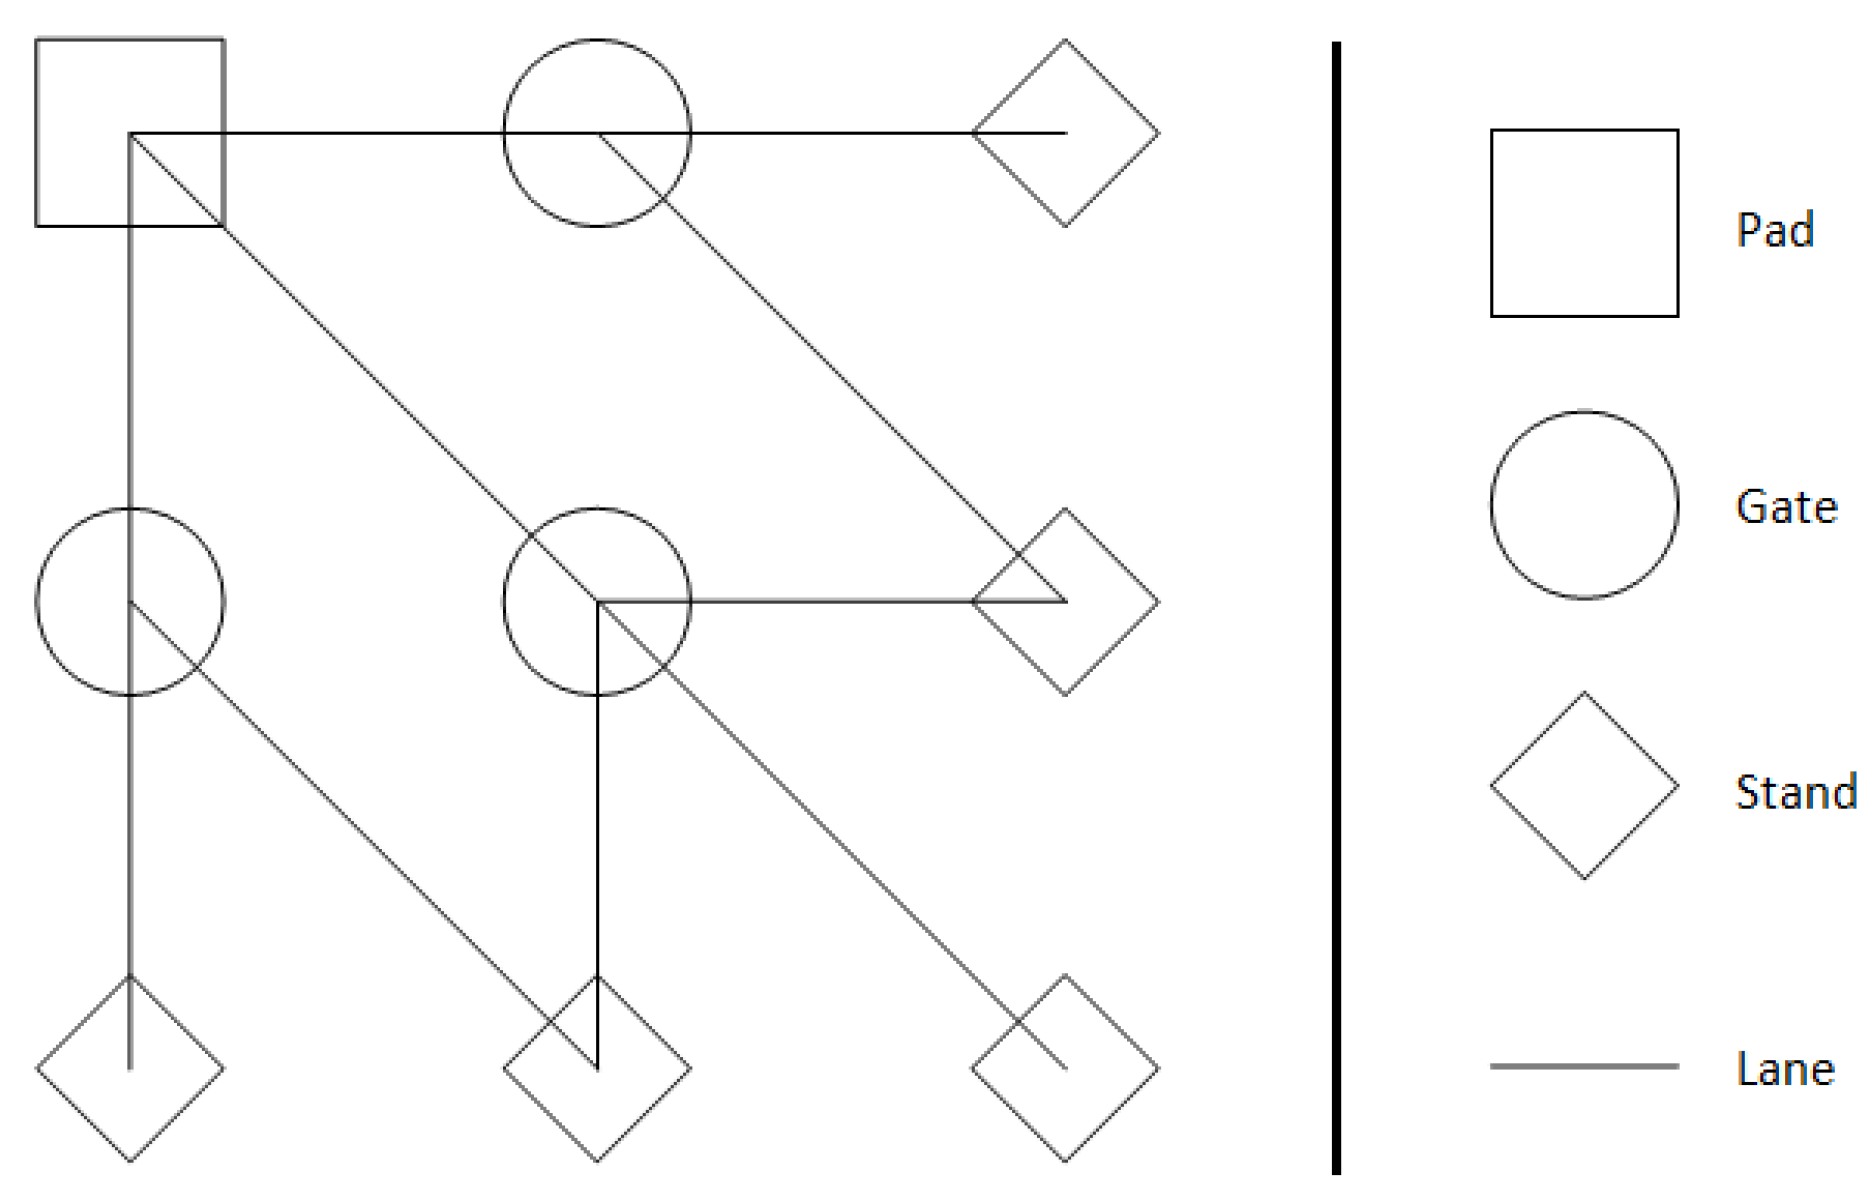
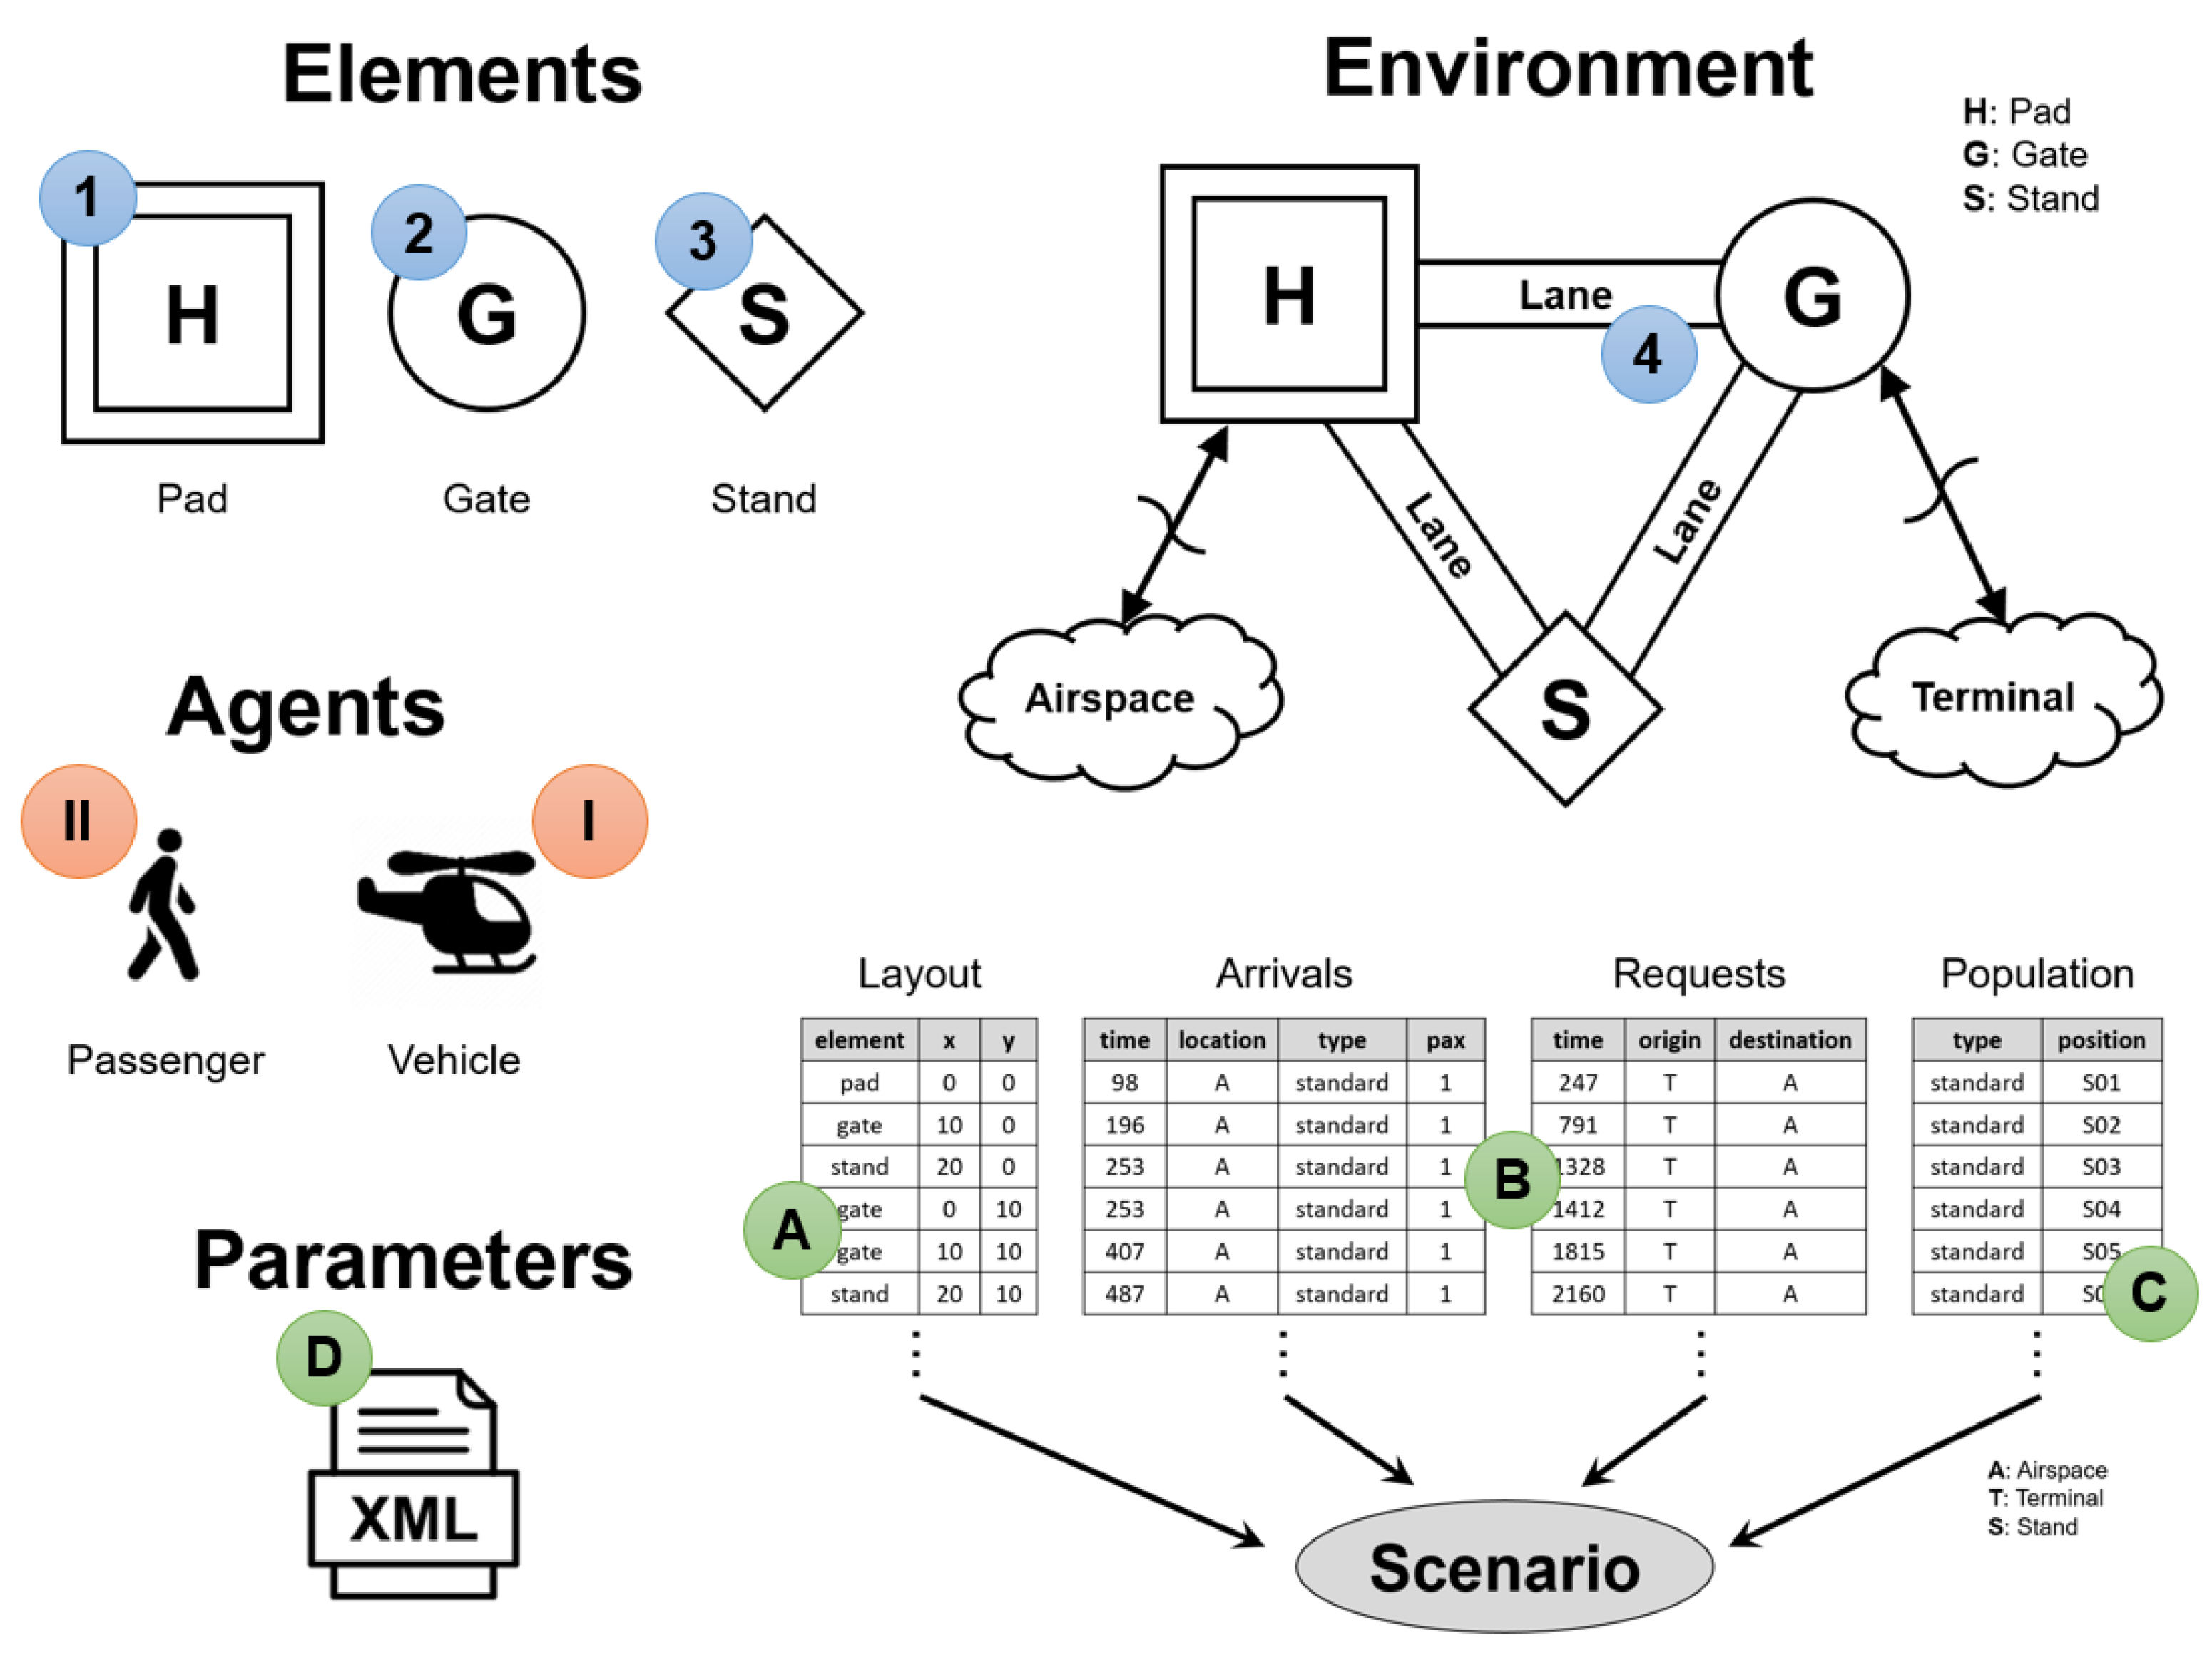
- Number of pads;
- Number of gates;
- Approach and departure time;
- Boarding and de-boarding time.
6. Limitations and Future Work
Author Contributions
Funding
Institutional Review Board Statement
Informed Consent Statement
Conflicts of Interest
Abbreviations
| ABMS | Agent-Based Modeling and Simulation; |
| ATM | Air Traffic Management; |
| PHCAP | Practical Hourly Capacity; |
| PICAP | Practical Imbalance Capacity; |
| UAM | Urban Air Mobility; |
| VTOL | Vertical Take-Off and Landing. |
Appendix A. Review of Vertiport Layouts

| Source | Publication Type | # of Pads | # of Gates/Stands |
|---|---|---|---|
| McKinsey [25] | report | 1–10 | 2–20 |
| Lilium [26] | website | 1–2 | 2–8 |
| Volocopter [27] | website | 1–4 | - |
| DLR [28] | journal article | 1/4 | 8/36 |
| NASA [11] | conference paper | 4 | 20–24 |
| Virgina Tech [13] | conference paper | 1–3 | 8–24 |
| Purdue [29] | conference paper | 4 | 14 |
Appendix B. Isolating Driver of Practical Hourly Capacity
Appendix C. How-To Apply the Design Heuristic
References
- Goyal, R.; Reiche, C.; Fernando, C.; Serrai, J.; Kimmel, S.; Cohen, A.; Shaheen, S.A. Urban Air Mobility (UAM) Market Study; Booz Allen Hamilton: McLean, VA, USA, 2018. [Google Scholar]
- Crown Consulting; Ascension Global; Georgia Institute of Technology; McKinsey and Company. Urban Air Mobility (UAM) Market Study; National Aeronautics and Space Administration (NASA): Hampton, VA, USA, 2018.
- Ploetner, K.O.; Al Haddad, C.; Antoniou, C.; Frank, F.; Fu, M.; Kabel, S.; Llorca, C.; Moeckel, R.; Moreno, A.T.; Pukhova, A.; et al. Long-term application potential of urban air mobility complementing public transport: An upper Bavaria example. CEAS Aeronaut. J. 2020, 11, 991–1007. [Google Scholar] [CrossRef] [PubMed]
- Fitzek, R.A. Lessons Gained in Helicopter Air Traffic Control from Federal Aviation Agency Activities. J. R. Aeronaut. Soc. 1962, 620, 499–502. [Google Scholar] [CrossRef]
- Crown Consulting; Deloitte Touche Tohmatsu Limited; Boeing; 5-Alpha; Mosaic ATM. High-Density Automated Vertiport Concept of Operations; Northeast UAS Airspace Integration Research Alliance (NUAIR): New York, NY, USA, 2021. [Google Scholar]
- Dempsey, G. Urban Air Mobility: Considerations for Vertiport Operation; National Air Transportation Association (NATA): Washington, DC, USA, 2019. [Google Scholar]
- Bertram, J.; Wei, P. An Efficient Algorithm for Self-Organized Terminal Arrival in Urban Air Mobility. In Proceedings of the AIAA Scitech 2020 Forum, Orlando, FL, USA, 6–10 January 2020. [Google Scholar]
- Kleinbekman, I.C.; Mitici, M.; Wei, P. Rolling-Horizon Electric Vertical Takeoff and Landing Arrival Scheduling for On-Demand Urban Air Mobility. J. Aerosp. Inf. 2020, 3, 150–159. [Google Scholar] [CrossRef]
- Lowry, M. Towards High-Density Urban Air Mobility. In Proceedings of the AIAA Aviation Technology, Integration, and Operations Conference, Atlanta, GA, USA, 25–29 June 2018. [Google Scholar]
- Vascik, P.D.; Hansman, J.R. Development of Vertiport Capacity Envelopes and Analysis of Their Sensitivity to Topological and Operational Factors. In Proceedings of the AIAA Scitech 2019 Forum, San Diego, CA, USA, 7–11 January 2019. [Google Scholar]
- Zelinski, S. Operational Analysis of Vertiport Surface Topology. In Proceedings of the Digital Avionics Systems Conference, Online, 11–16 October 2020. [Google Scholar]
- Schweiger, K.; Knabe, F.; Korn, B. An exemplary definition of a vertidrome’s airside concept of operations. Aerosp. Sci. Technol. 2021, 125, 107144. [Google Scholar] [CrossRef]
- Rimjha, M.; Trani, A. Urban Air Mobility: Factors Affecting Vertiport Capacity. In Proceedings of the Integrated Communications Navigation and Surveillance Conference, Dulles, VA, USA, 18–22 April 2021. [Google Scholar]
- Preis, L.; Hornung, M. Vertiport Operations Modeling, Agent-Based Simulation and Parameter Value Specification. Electronics 2022, 11, 1071. [Google Scholar] [CrossRef]
- Preis, L.; Amirzada, A.; Hornung, M. Ground Operation on Vertiports—Introduction of an Agent-Based Simulation Framework. In Proceedings of the AIAA Scitech 2021 Forum, Online, 11–21 January 2021. [Google Scholar]
- Preis, L.; Hornung, M. Identification of Driving Processes for Vertiport Operations Using Agent-Based Simulation. In Proceedings of the AIAA SciTech 2021 Forum, San Diego, CA, USA, 3–7 January 2022. [Google Scholar]
- Ashford, N.J.; Mumayiz, S.A.; Wright, P.H. Airport Engineering. Planning, Design and Development of 21st Century Airports, 4th ed.; Wiley: New Delhi, India, 2011; p. 236. [Google Scholar]
- Gentry, J.; Duffy, K.; Swedish, W. Airport Capacity Profiles; Federal Aviation Administration (FAA): Washington, DC, USA, 2014.
- Mensen, H. Planung, Anlage und Betrieb von Flugplätzen, 1st ed.; Springer: Berlin, Germany, 2007; p. 380. [Google Scholar]
- de Neufville, R.; Amedeo, O.R.; Belobaba, P.P.; Reynolds, T.G. Airport Systems: Planning, Design, and Management, 4th ed.; McGraw-Hill Education: New York, NY, USA, 2013. [Google Scholar]
- Wells, A.T.; Young, S.B. Airport Planning and Management, 5th ed.; McGraw-Hill Education: New York, NY, USA, 2004; p. 432. [Google Scholar]
- Bubalo, B.; Daduna, J.R. Airport capacity and demand calculations by simulation—The case of Berlin-Brandenburg International Airport. Netnomics 2011, 3, 161–181. [Google Scholar] [CrossRef]
- U.S. Congress. Airport System Developement; Office of Technology Assessment (OTA): Washington, DC, USA, 1984.
- Preis, L.; Cheng, S. Simulation of Individual Aircraft and Passenger Behavior and Study of Impact on Vertiport Operations. In Proceedings of the AIAA Aviation 2022 Forum, Chicago, IL, USA, 27 June–1 July 2022. [Google Scholar]
- Johnston, T.; Riedel, R.; Sahdev, S. To Take Off, Flying Vehicles First Need Places to Land; McKinsey and Company: New York, NY, USA, 2020. [Google Scholar]
- Designing a Scalable Vertiport. Available online: https://blog.lilium.com/designing-a-scalable-vertiport-c12e75be1ec5 (accessed on 18 May 2022).
- Air-Taxi Volo-Port. Available online: https://www.german-architects.com/de/graft-berlin/project/air-taxi-volo-ports?nonav=1 (accessed on 18 May 2022).
- Niklaß, M.; Dzikus, N.; Swaid, M.; Berling, J.; Lührs, B.; Lau, A.; Terekhov, I.; Gollnick, V. A Collaborative Approach for an Integrated Modeling of Urban Air Transportation Systems. Aerospace 2020, 7, 50. [Google Scholar] [CrossRef]
- Maheshwari, A.; Mudumba, S.; Sells, B.E.; DeLaurentis, D.A.; Crossley, W.A. Identifying and Analyzing Operations Limits for Passenger-Carrying Urban Air Mobility Missions. In Proceedings of the AIAA Aviation 2020 Forum, Online, 15–19 June 2020. [Google Scholar]


| Author | Description | Time |
|---|---|---|
| Ashford [17] | Hourly capacity | 3–10 min |
| Mensen [19] | Practical hourly capacity | - |
| Neufville [20] | Practical hourly capacity (PHCAP) | 4 min |
| Wells [21] | Maximum acceptable delay for practical capacity | 4–9 min |
| Bubalo [22] | Practical capacity under pre-defined Level-of-Service | 5 min |
| OTA [23] | Practical capacity | 5 min |
| Demand Profile Characteristic | # of Variations | Description |
|---|---|---|
| Shape of demand profile | 4 | Uniform, single peak, bi-modal, four peaks |
| Accumulated daily passenger demand | 21 | 1000 to 3000 in steps of 100 |
| Random samples | 3 | Variations A–C |
| Total simulation scenarios | 252 |
| Variation of Inputs | # of Variations | Description |
|---|---|---|
| Number of pads | 4 | 2–5 pads in steps of 1 |
| Approach and departure time | 9;7;5 | 20–120 s in steps of 12.5 s |
| Accumulated daily demand | 3 | 1000–2000 in steps of 500 |
| Random samples | 3 | Variations A–C |
| Total simulation scenarios | 252 |
| Variation of Inputs | # of Variations | Description |
|---|---|---|
| Number of gates | 4 | 6–12 pads in steps of 2 |
| Boarding and de-boarding time | 9;7;5 | 60–200 s in steps of 17.5 s |
| Accumulated daily demand | 3 | 1000–2000 in steps of 500 |
| Random samples | 3 | Variations A–C |
| Total simulation scenarios | 252 |
Publisher’s Note: MDPI stays neutral with regard to jurisdictional claims in published maps and institutional affiliations. |
© 2022 by the authors. Licensee MDPI, Basel, Switzerland. This article is an open access article distributed under the terms and conditions of the Creative Commons Attribution (CC BY) license (https://creativecommons.org/licenses/by/4.0/).
Share and Cite
Preis, L.; Hornung, M. A Vertiport Design Heuristic to Ensure Efficient Ground Operations for Urban Air Mobility. Appl. Sci. 2022, 12, 7260. https://doi.org/10.3390/app12147260
Preis L, Hornung M. A Vertiport Design Heuristic to Ensure Efficient Ground Operations for Urban Air Mobility. Applied Sciences. 2022; 12(14):7260. https://doi.org/10.3390/app12147260
Chicago/Turabian StylePreis, Lukas, and Mirko Hornung. 2022. "A Vertiport Design Heuristic to Ensure Efficient Ground Operations for Urban Air Mobility" Applied Sciences 12, no. 14: 7260. https://doi.org/10.3390/app12147260
APA StylePreis, L., & Hornung, M. (2022). A Vertiport Design Heuristic to Ensure Efficient Ground Operations for Urban Air Mobility. Applied Sciences, 12(14), 7260. https://doi.org/10.3390/app12147260