
Design Criteria and Accommodating Capacity Analysis of Vertiports for Urban Air Mobility and Its Application at Gimpo Airport in Korea


Abstract
:1. Introduction
2. Components of Vertiport
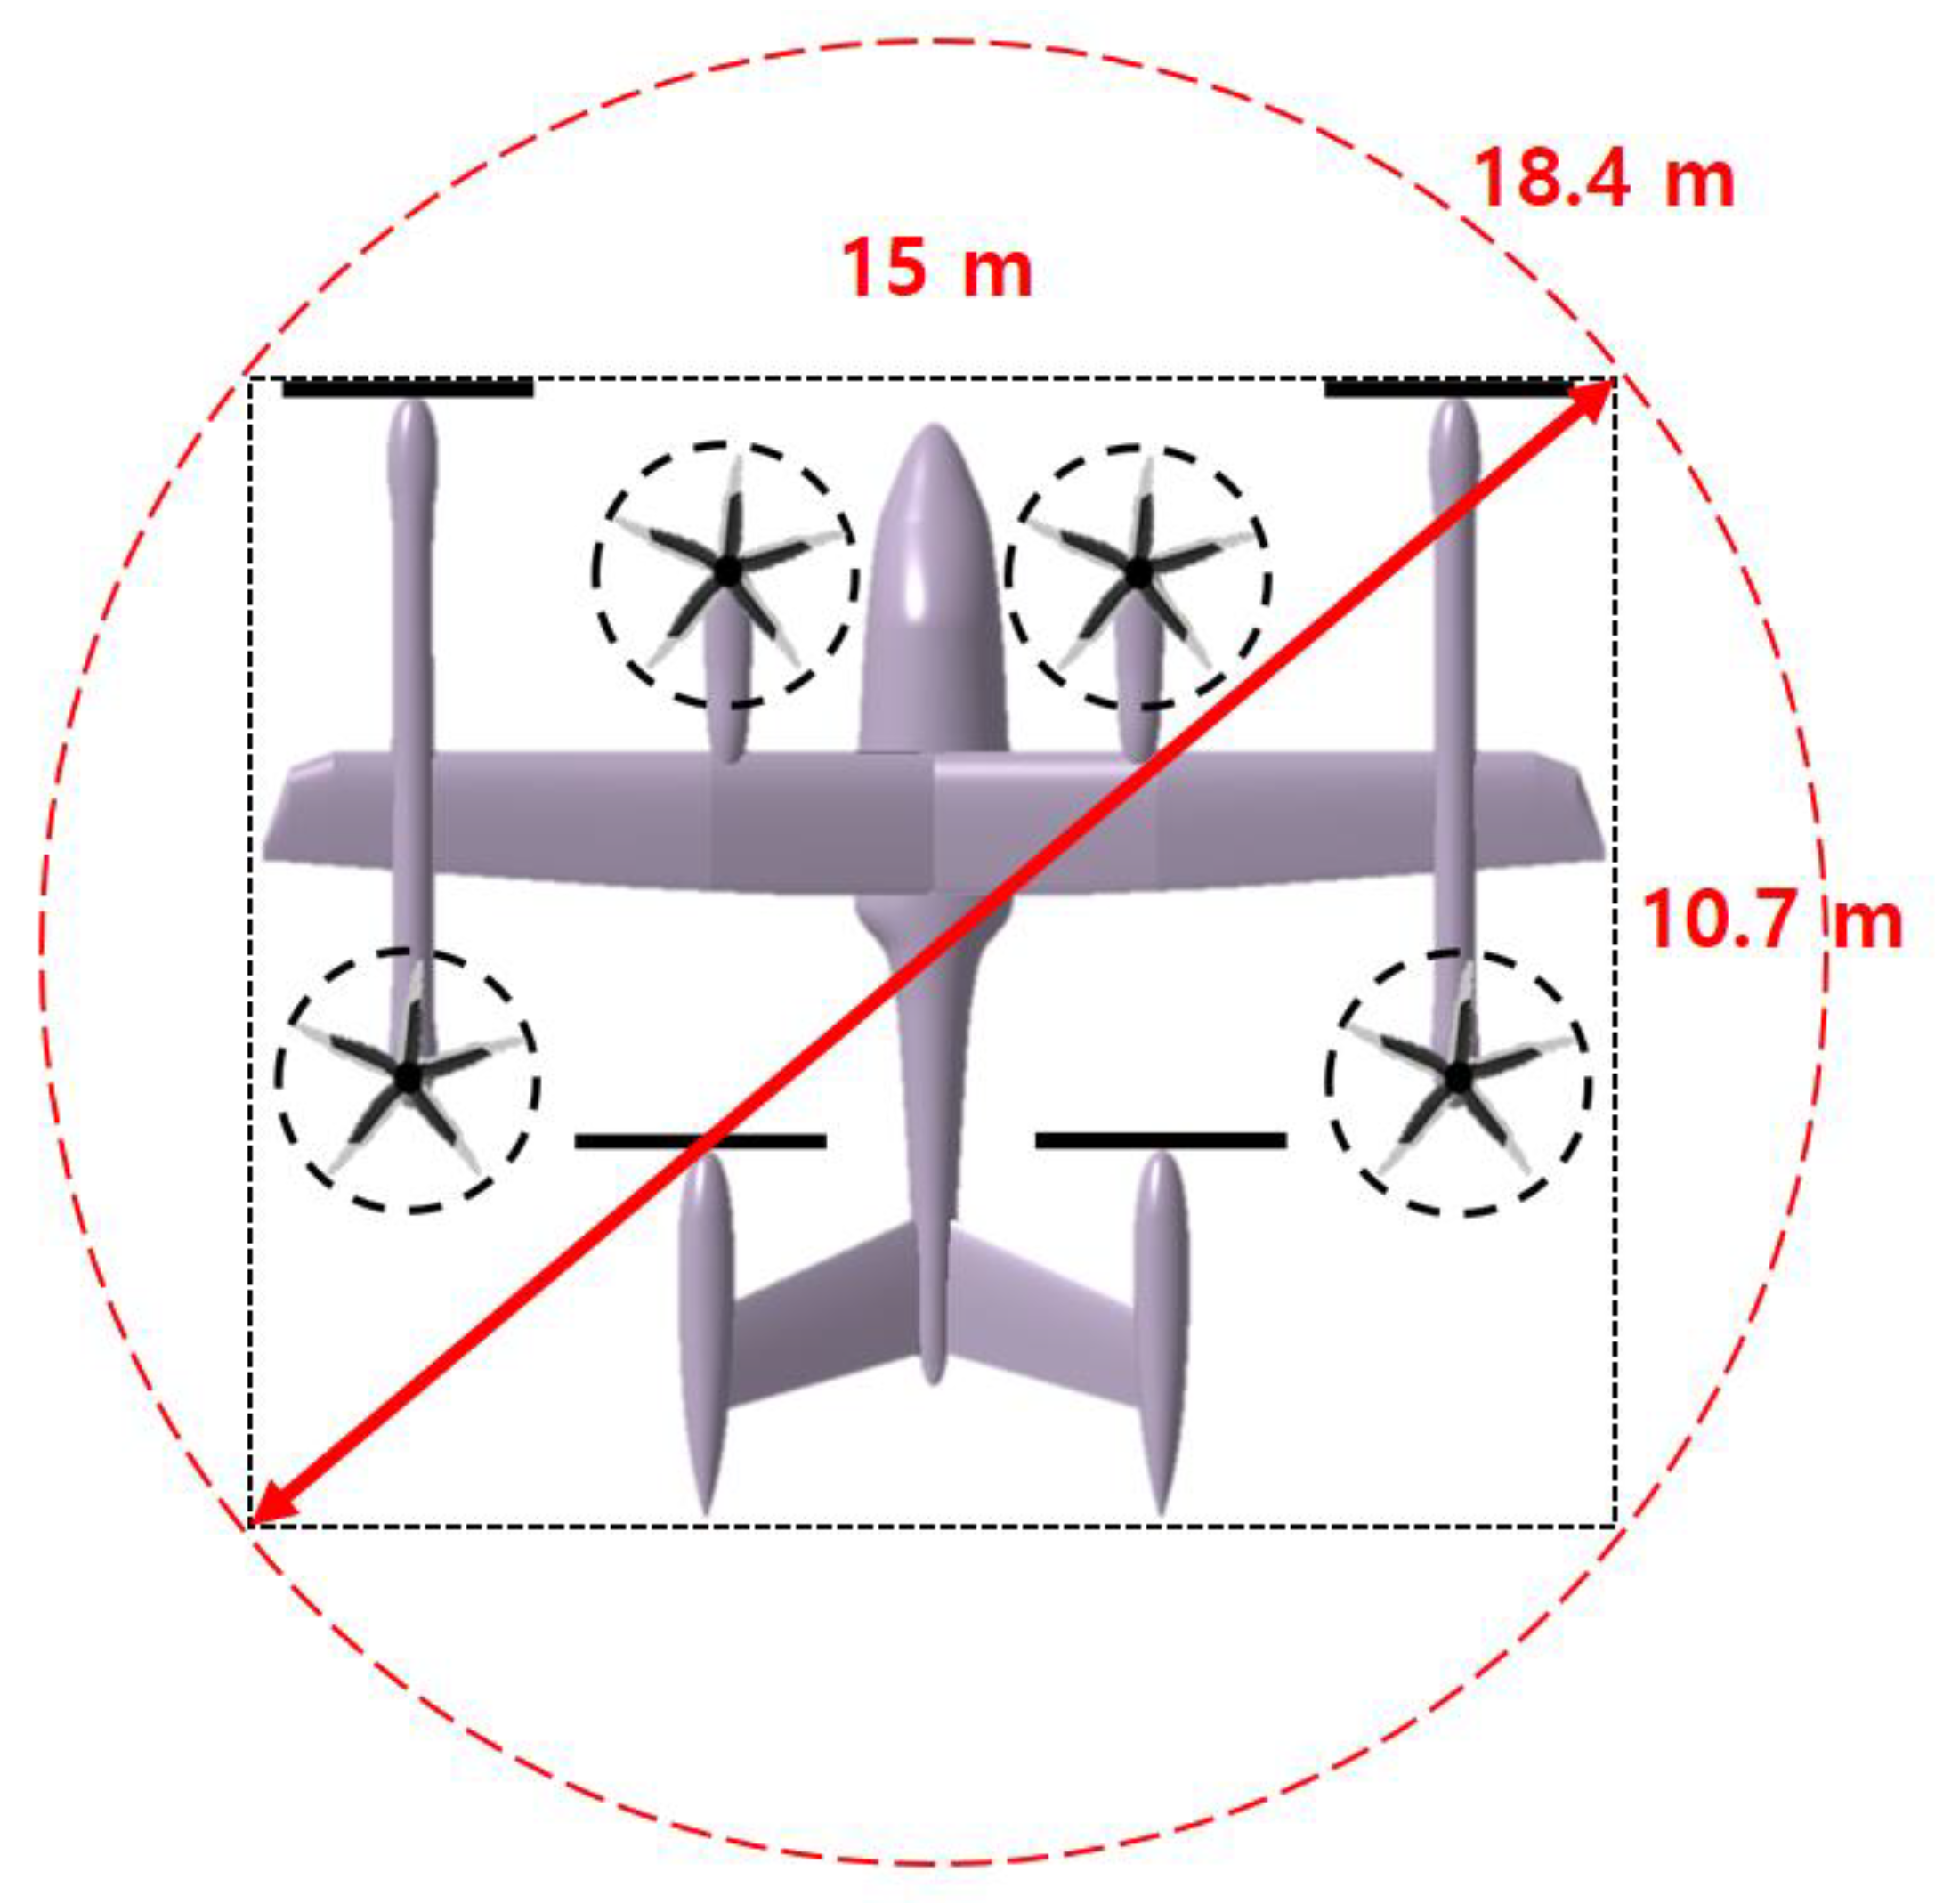
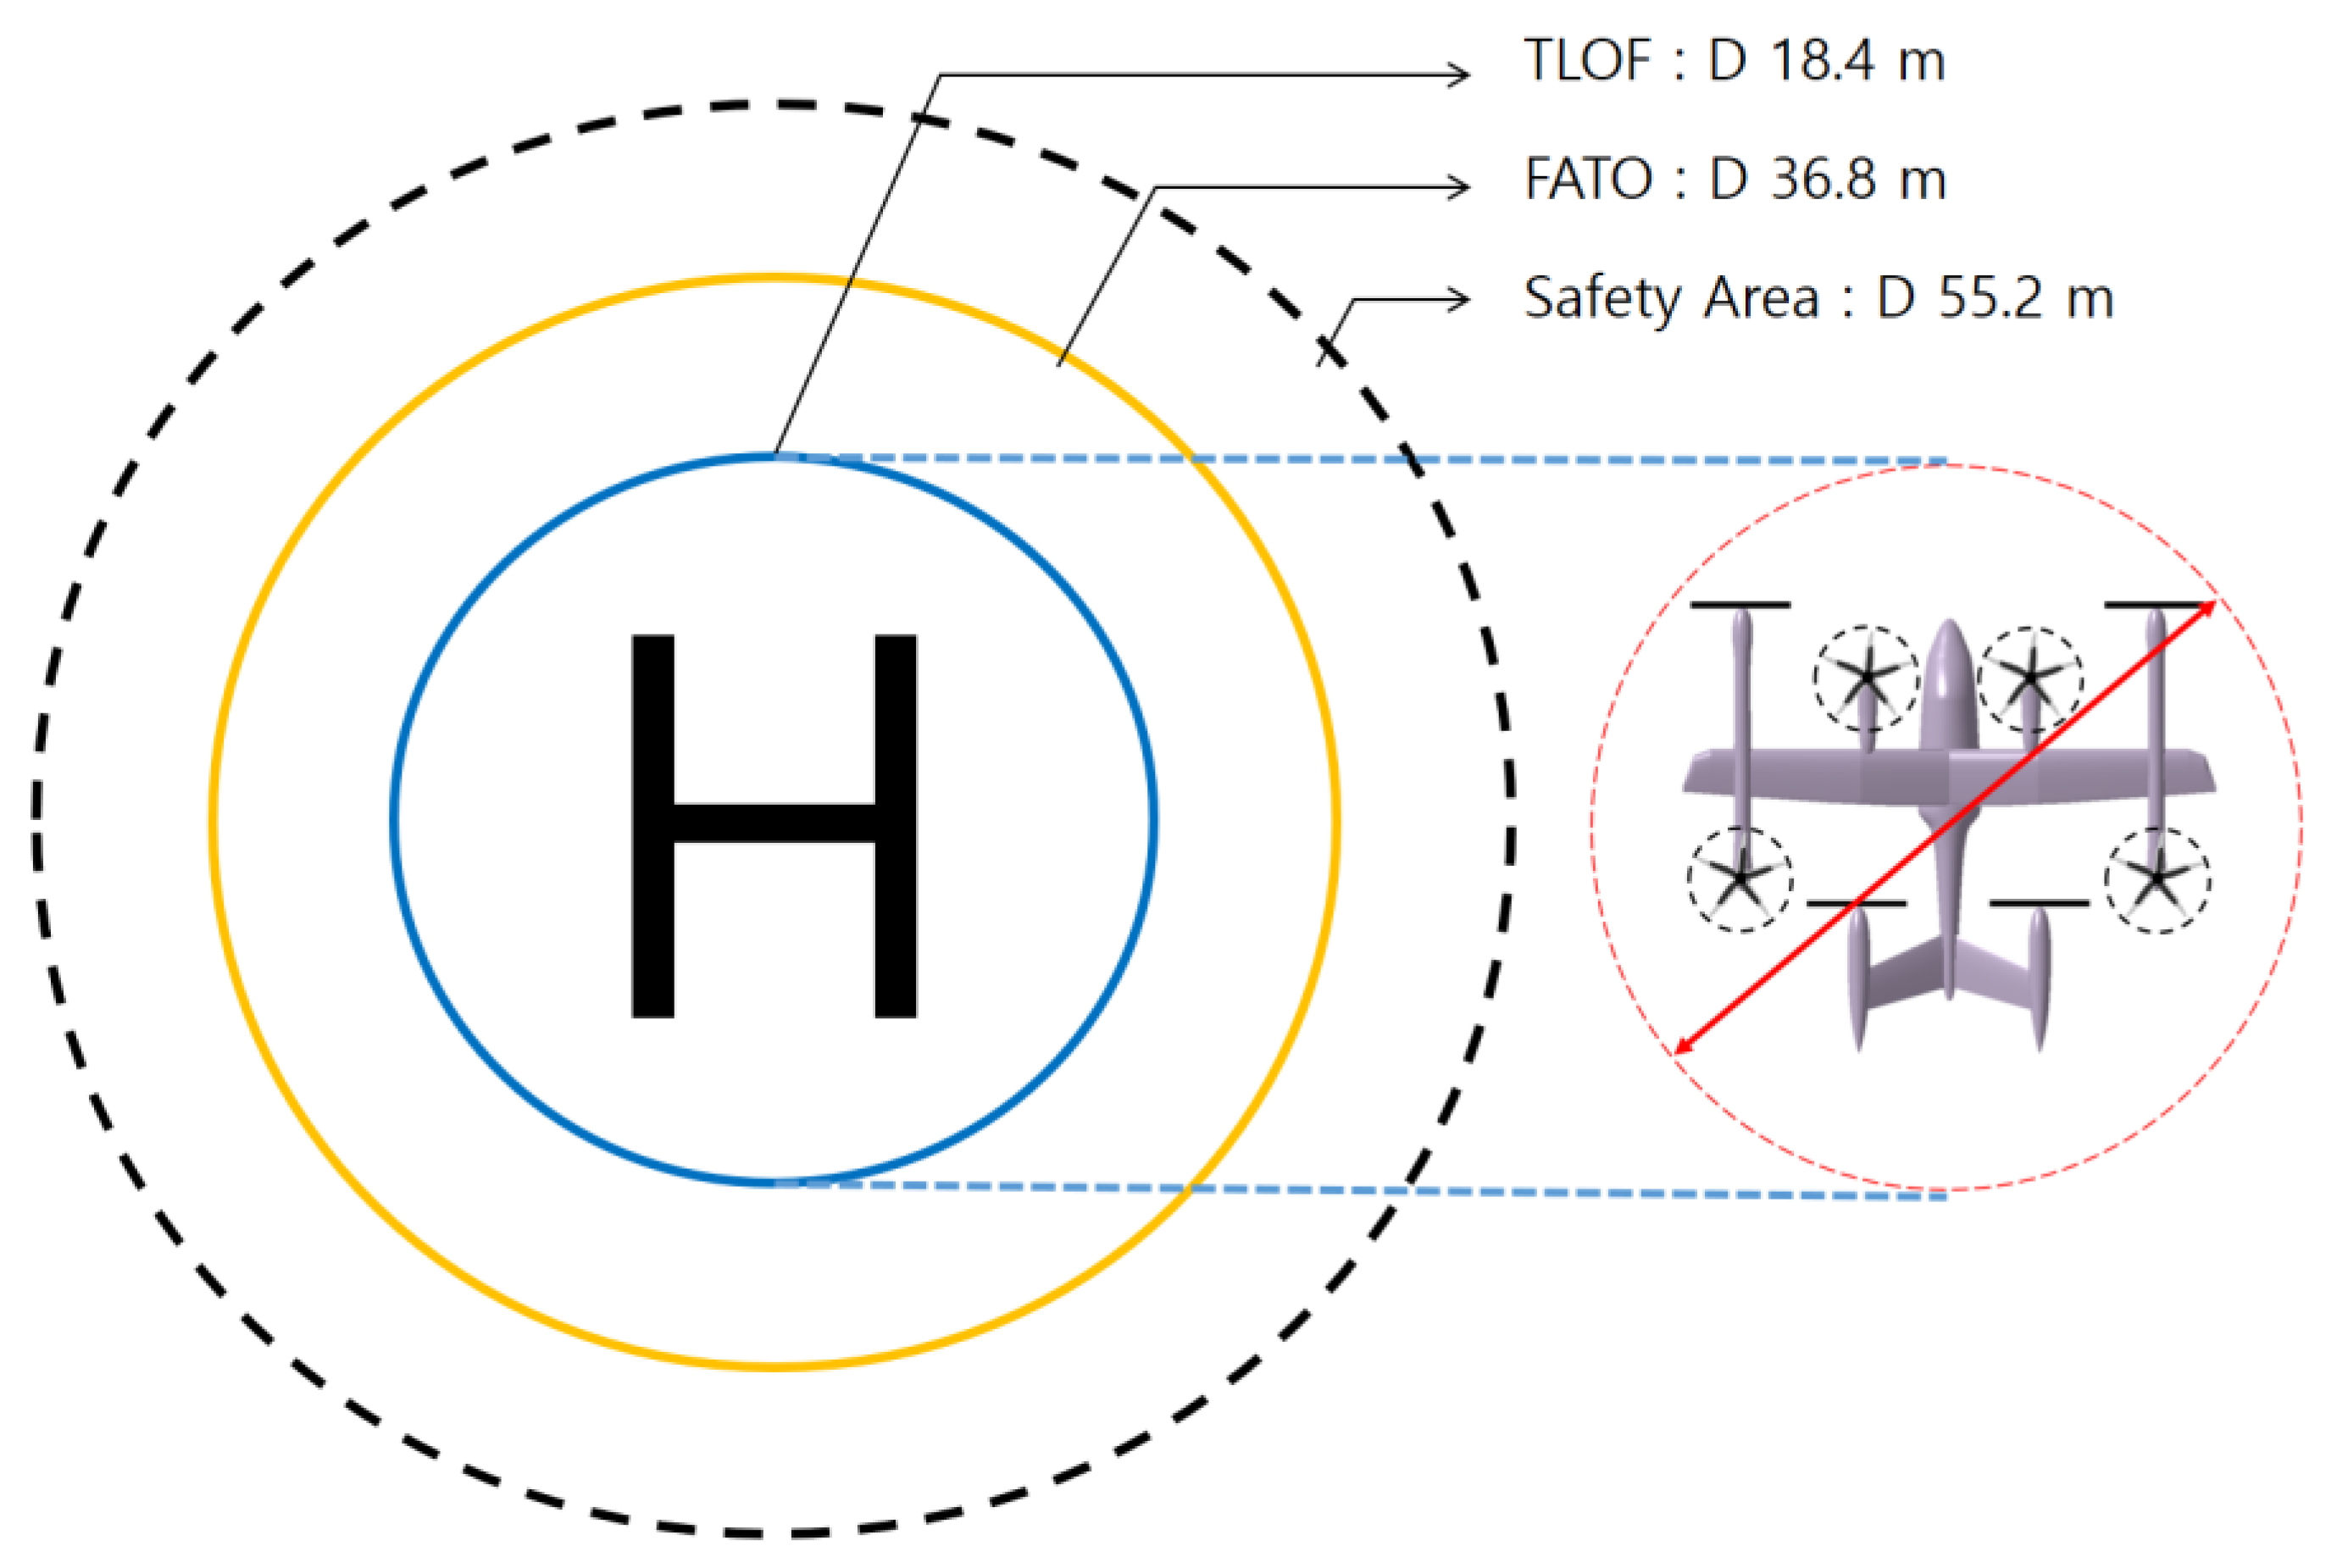
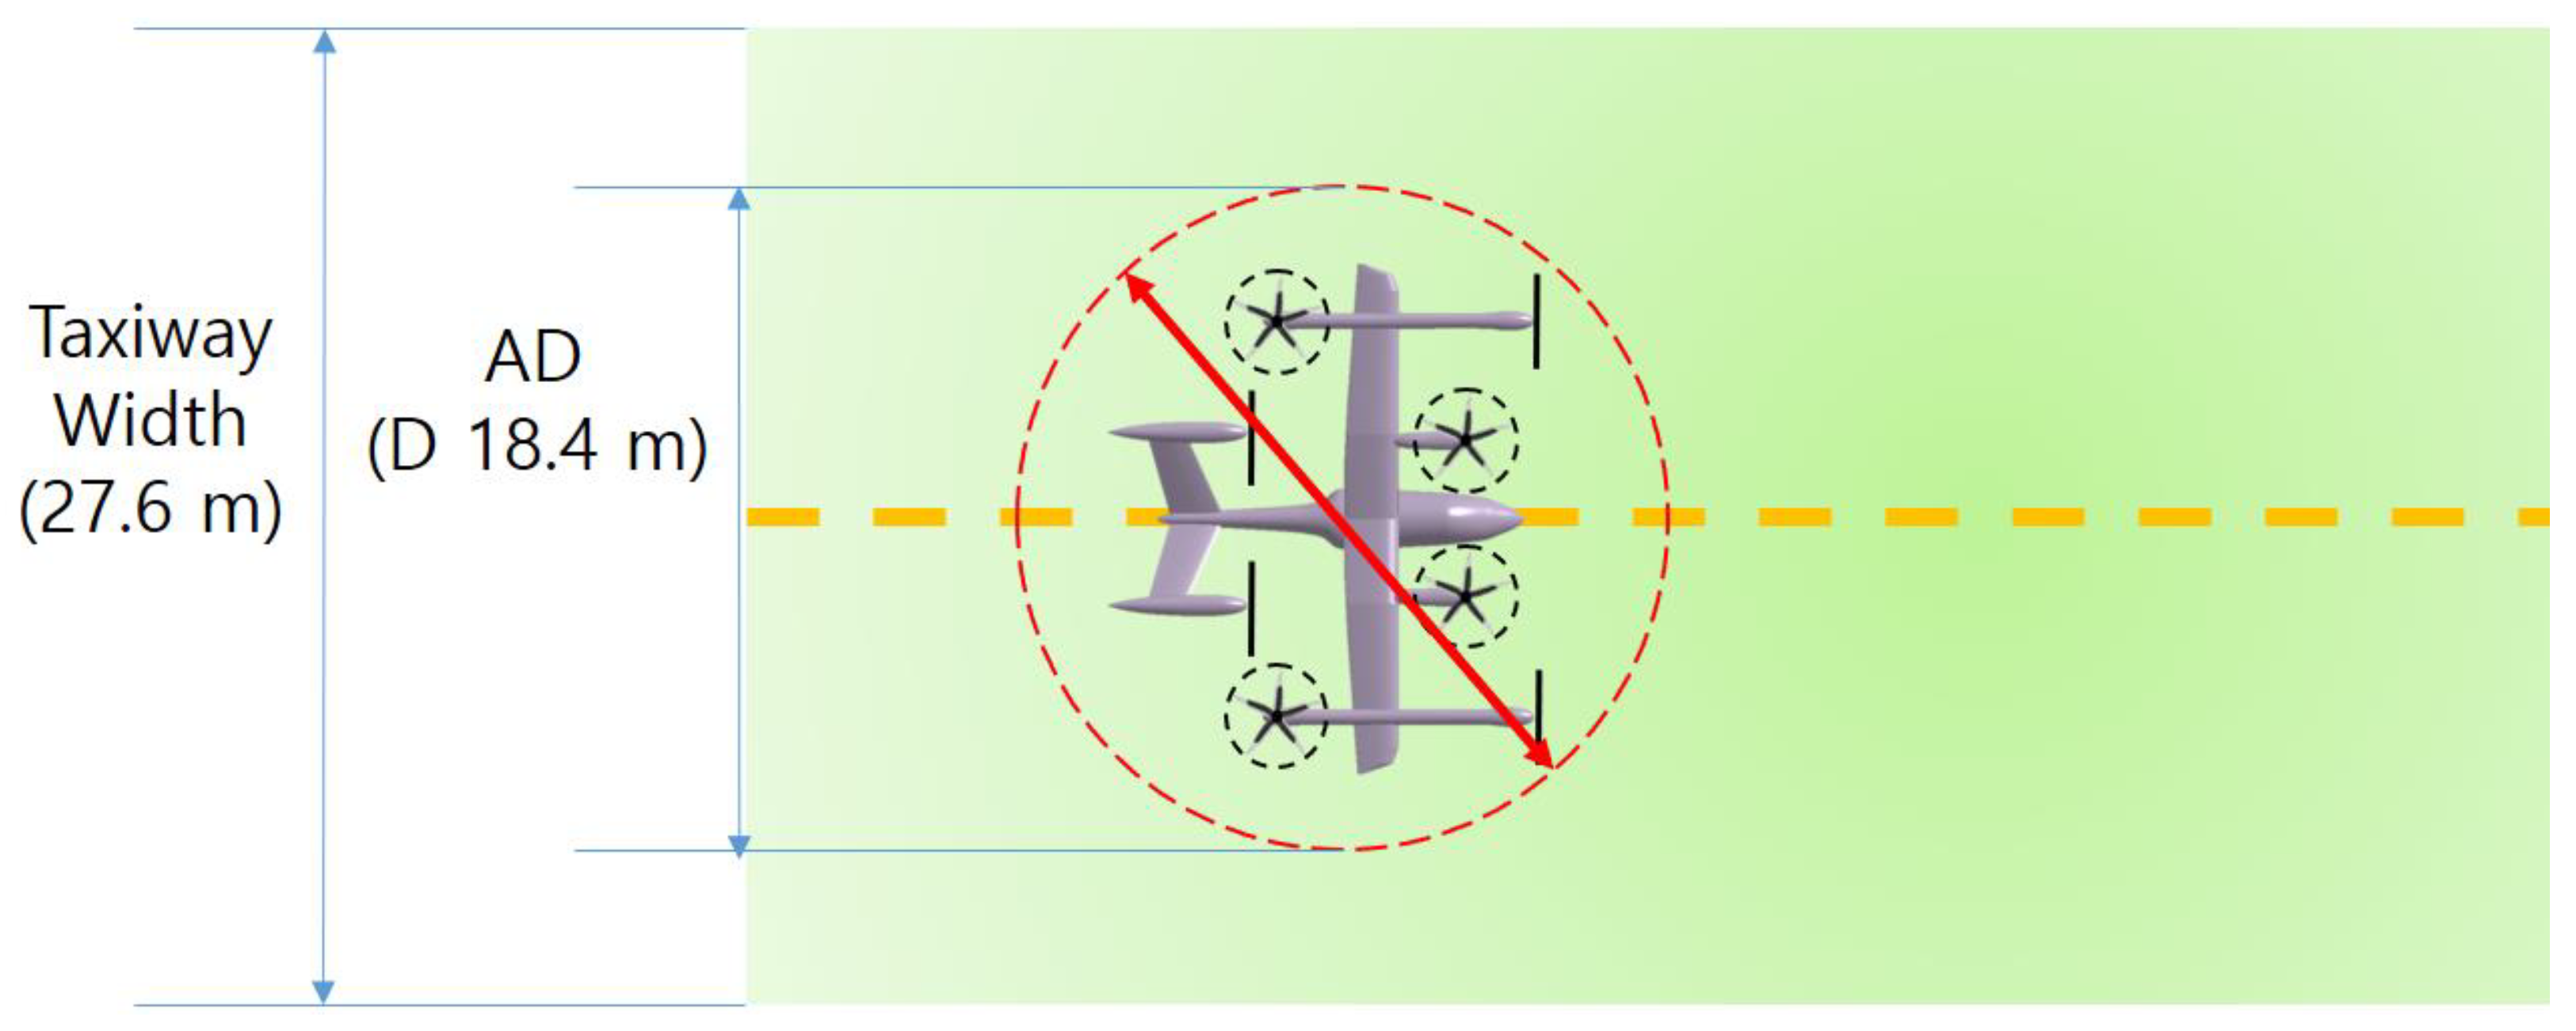
2.1. Vertiport Component Sizing
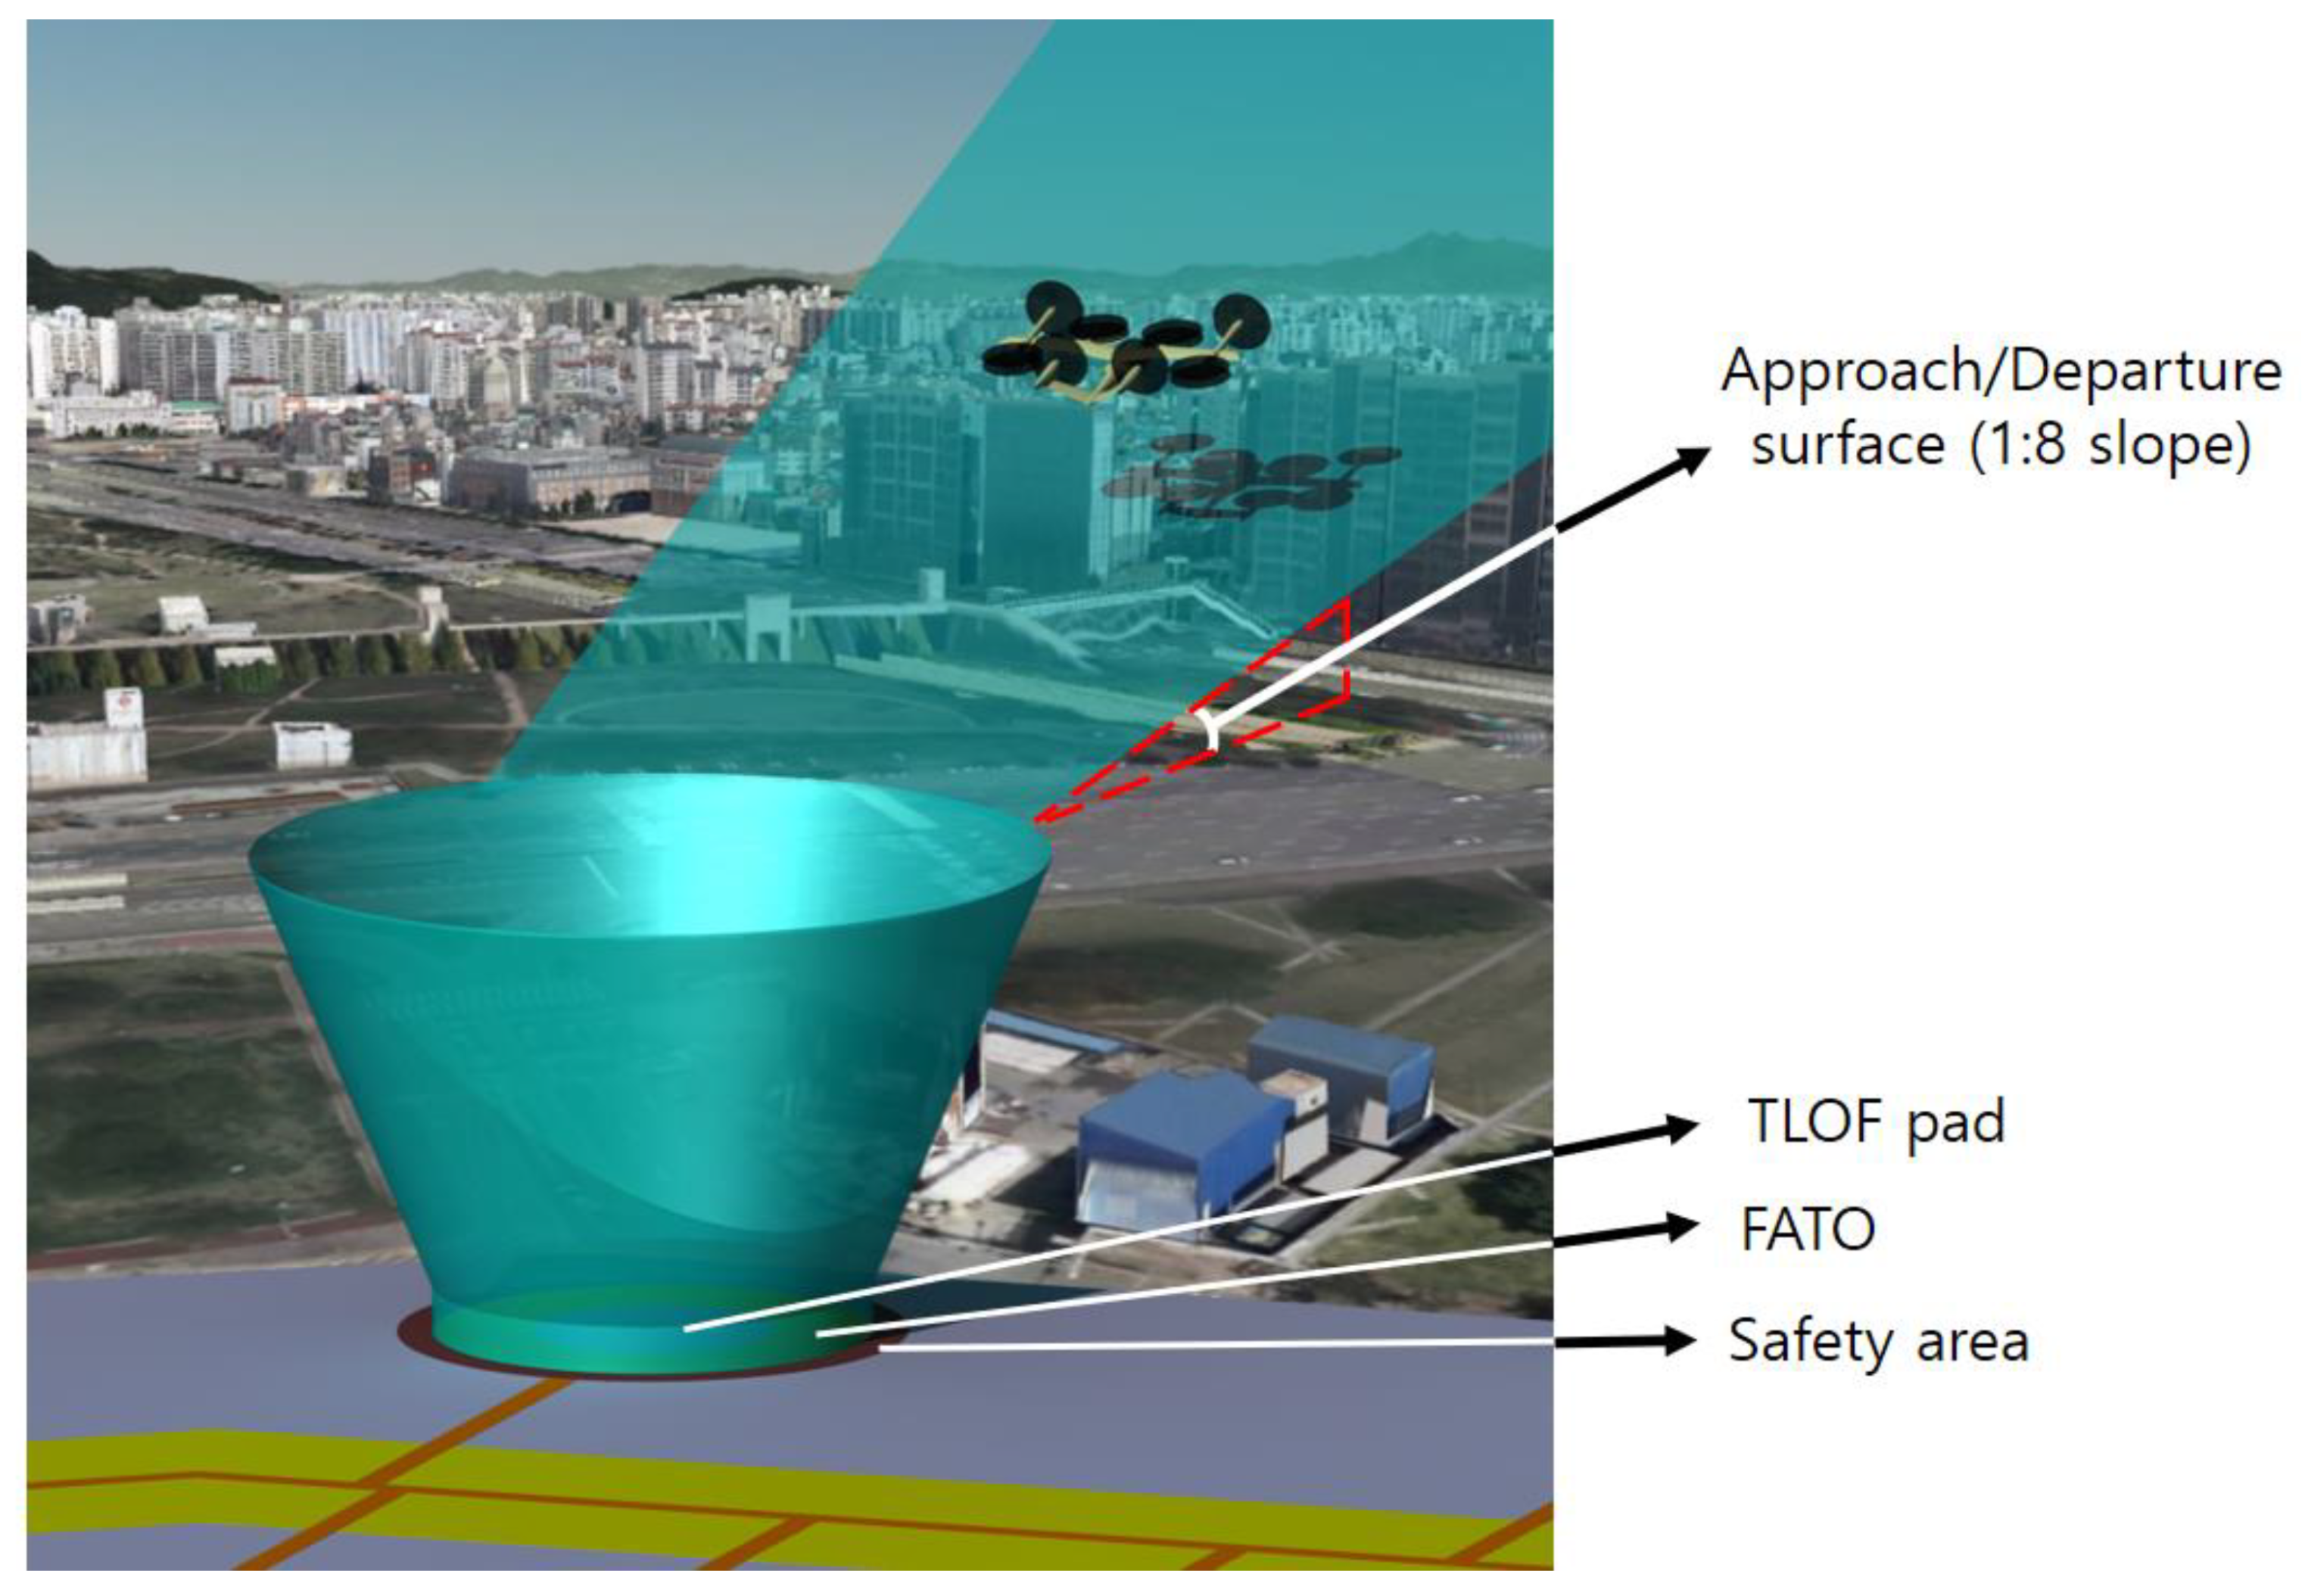
2.2. Other Constraints for Vertiport Components
2.3. Comparison of Topologies
3. Application to Gimpo Airport
3.1. Size of Gimpo Airport First Parking Lot
3.2. Three Types of Topology
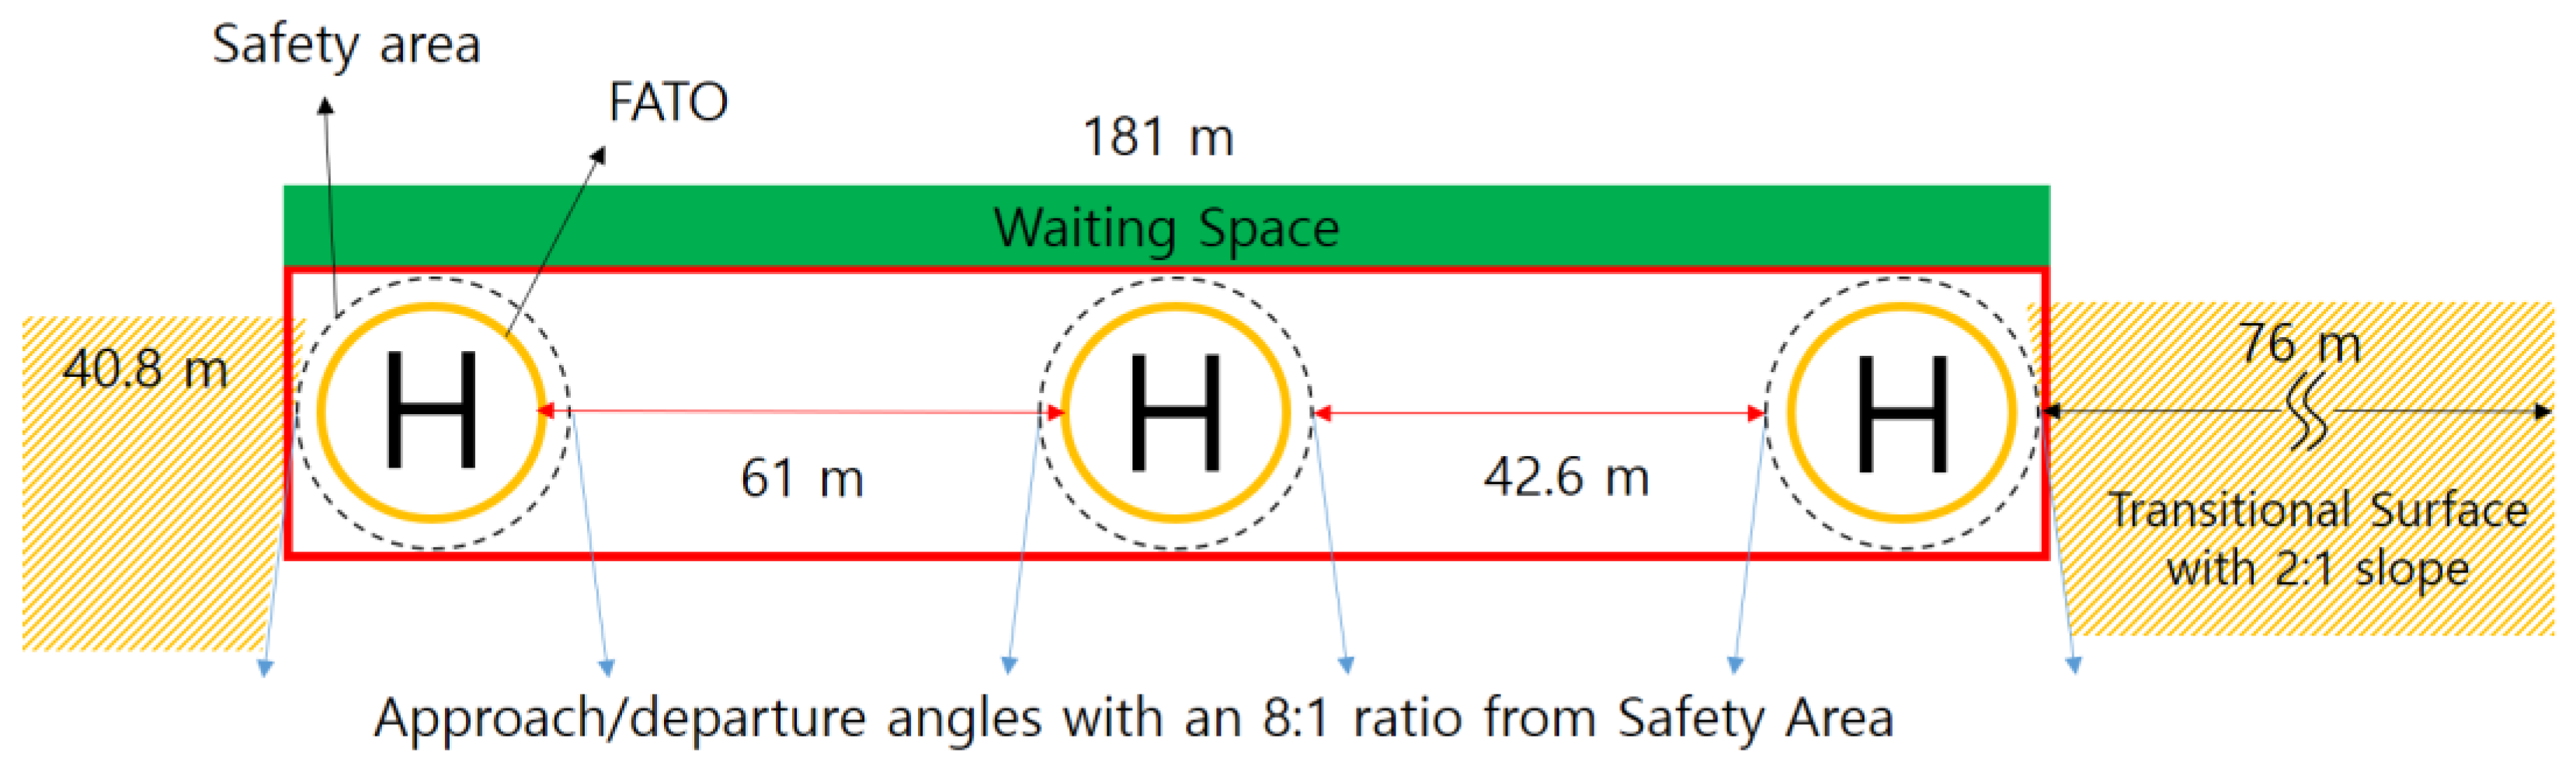
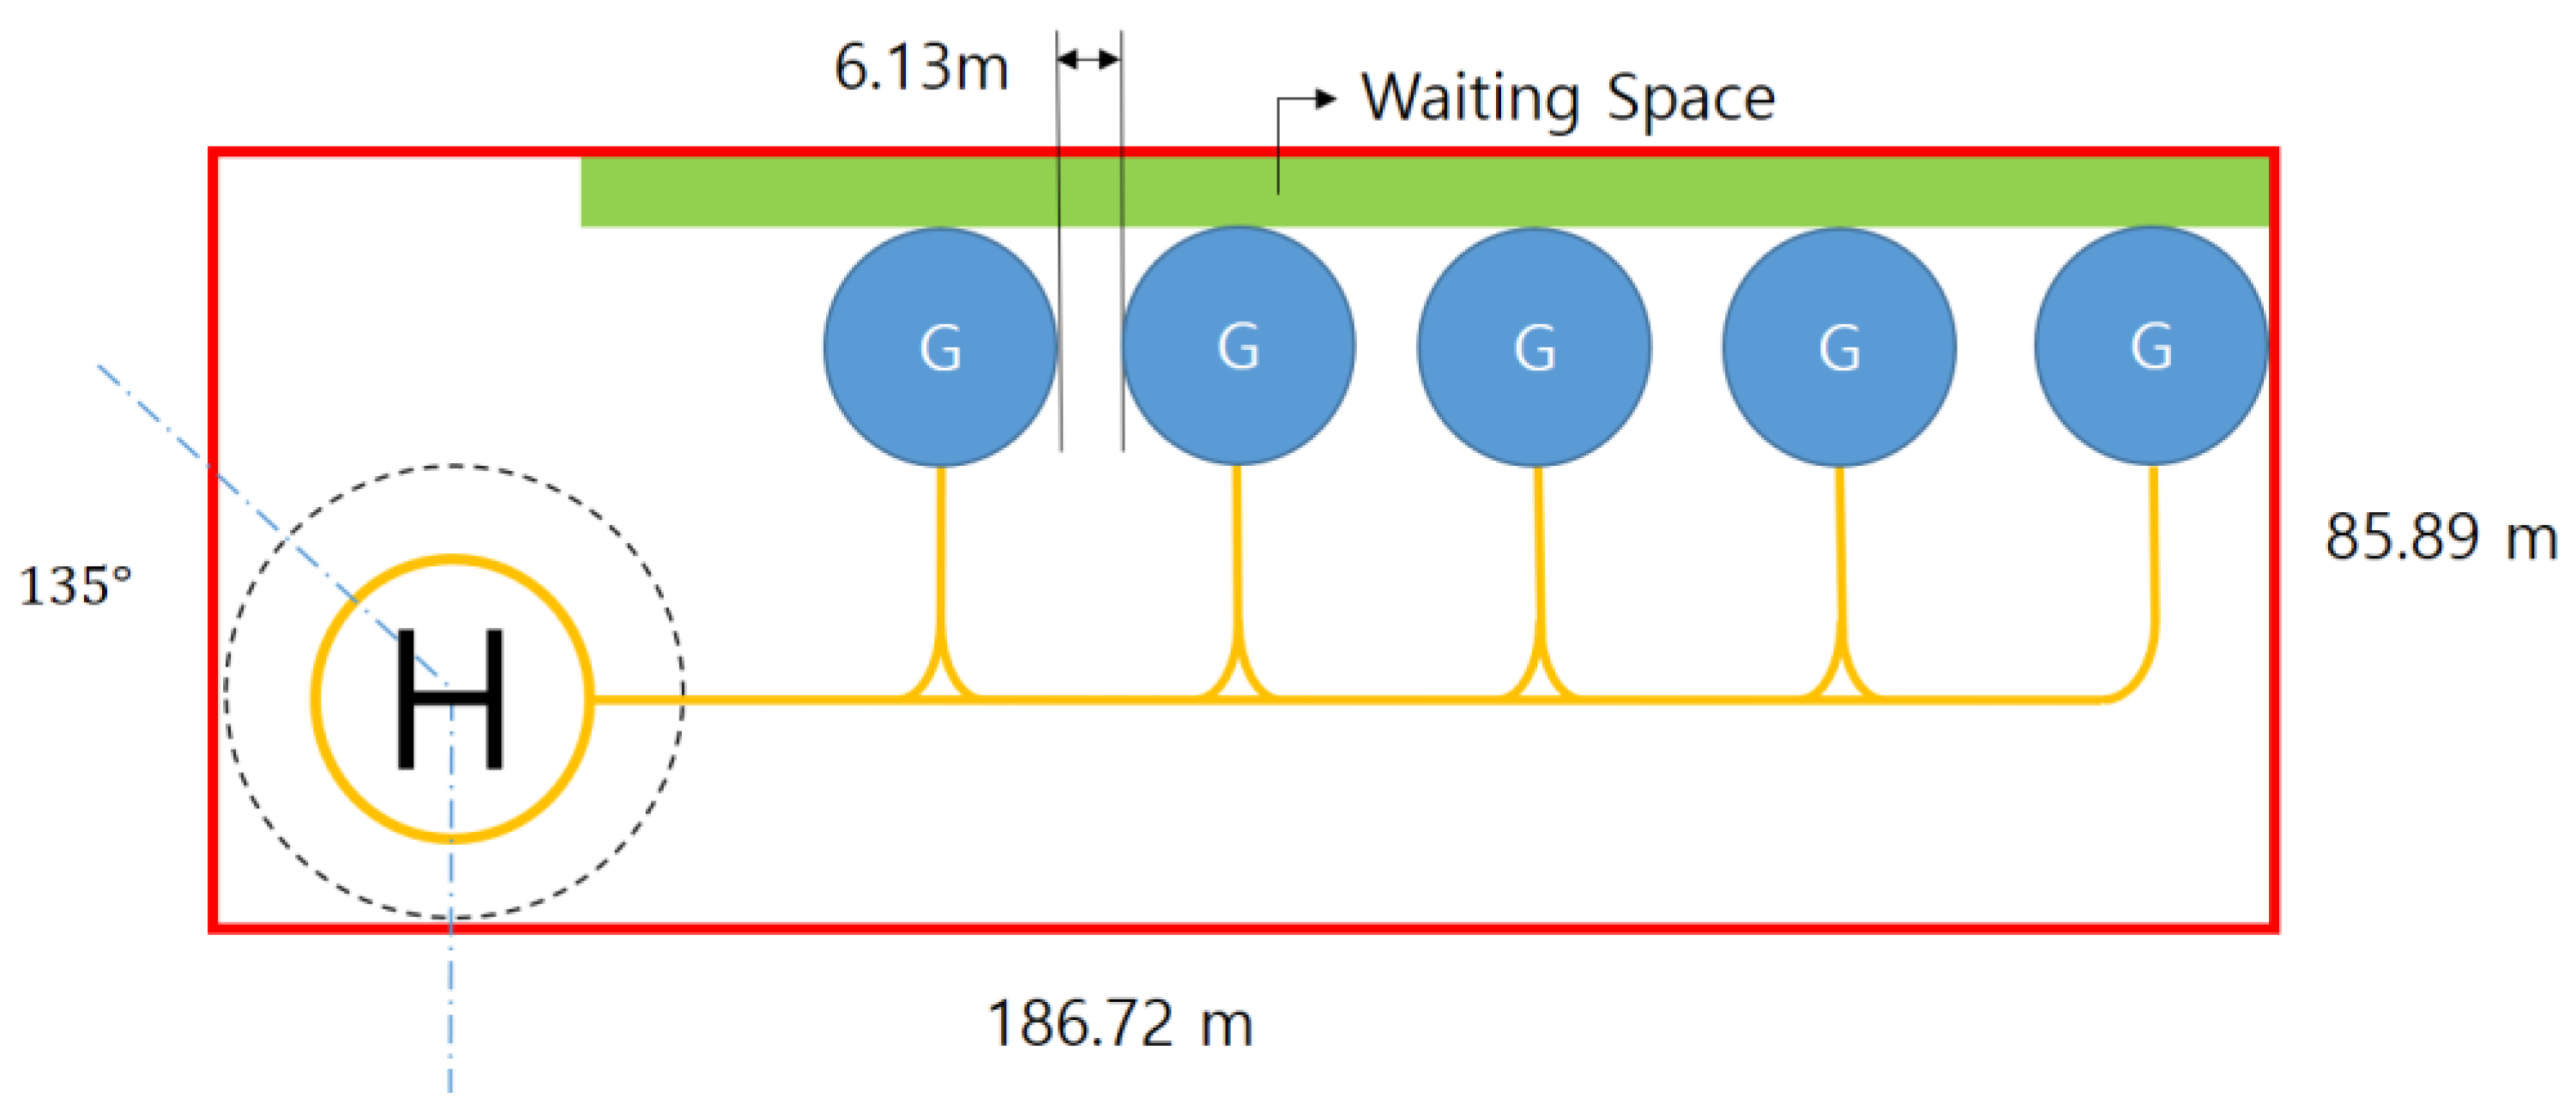
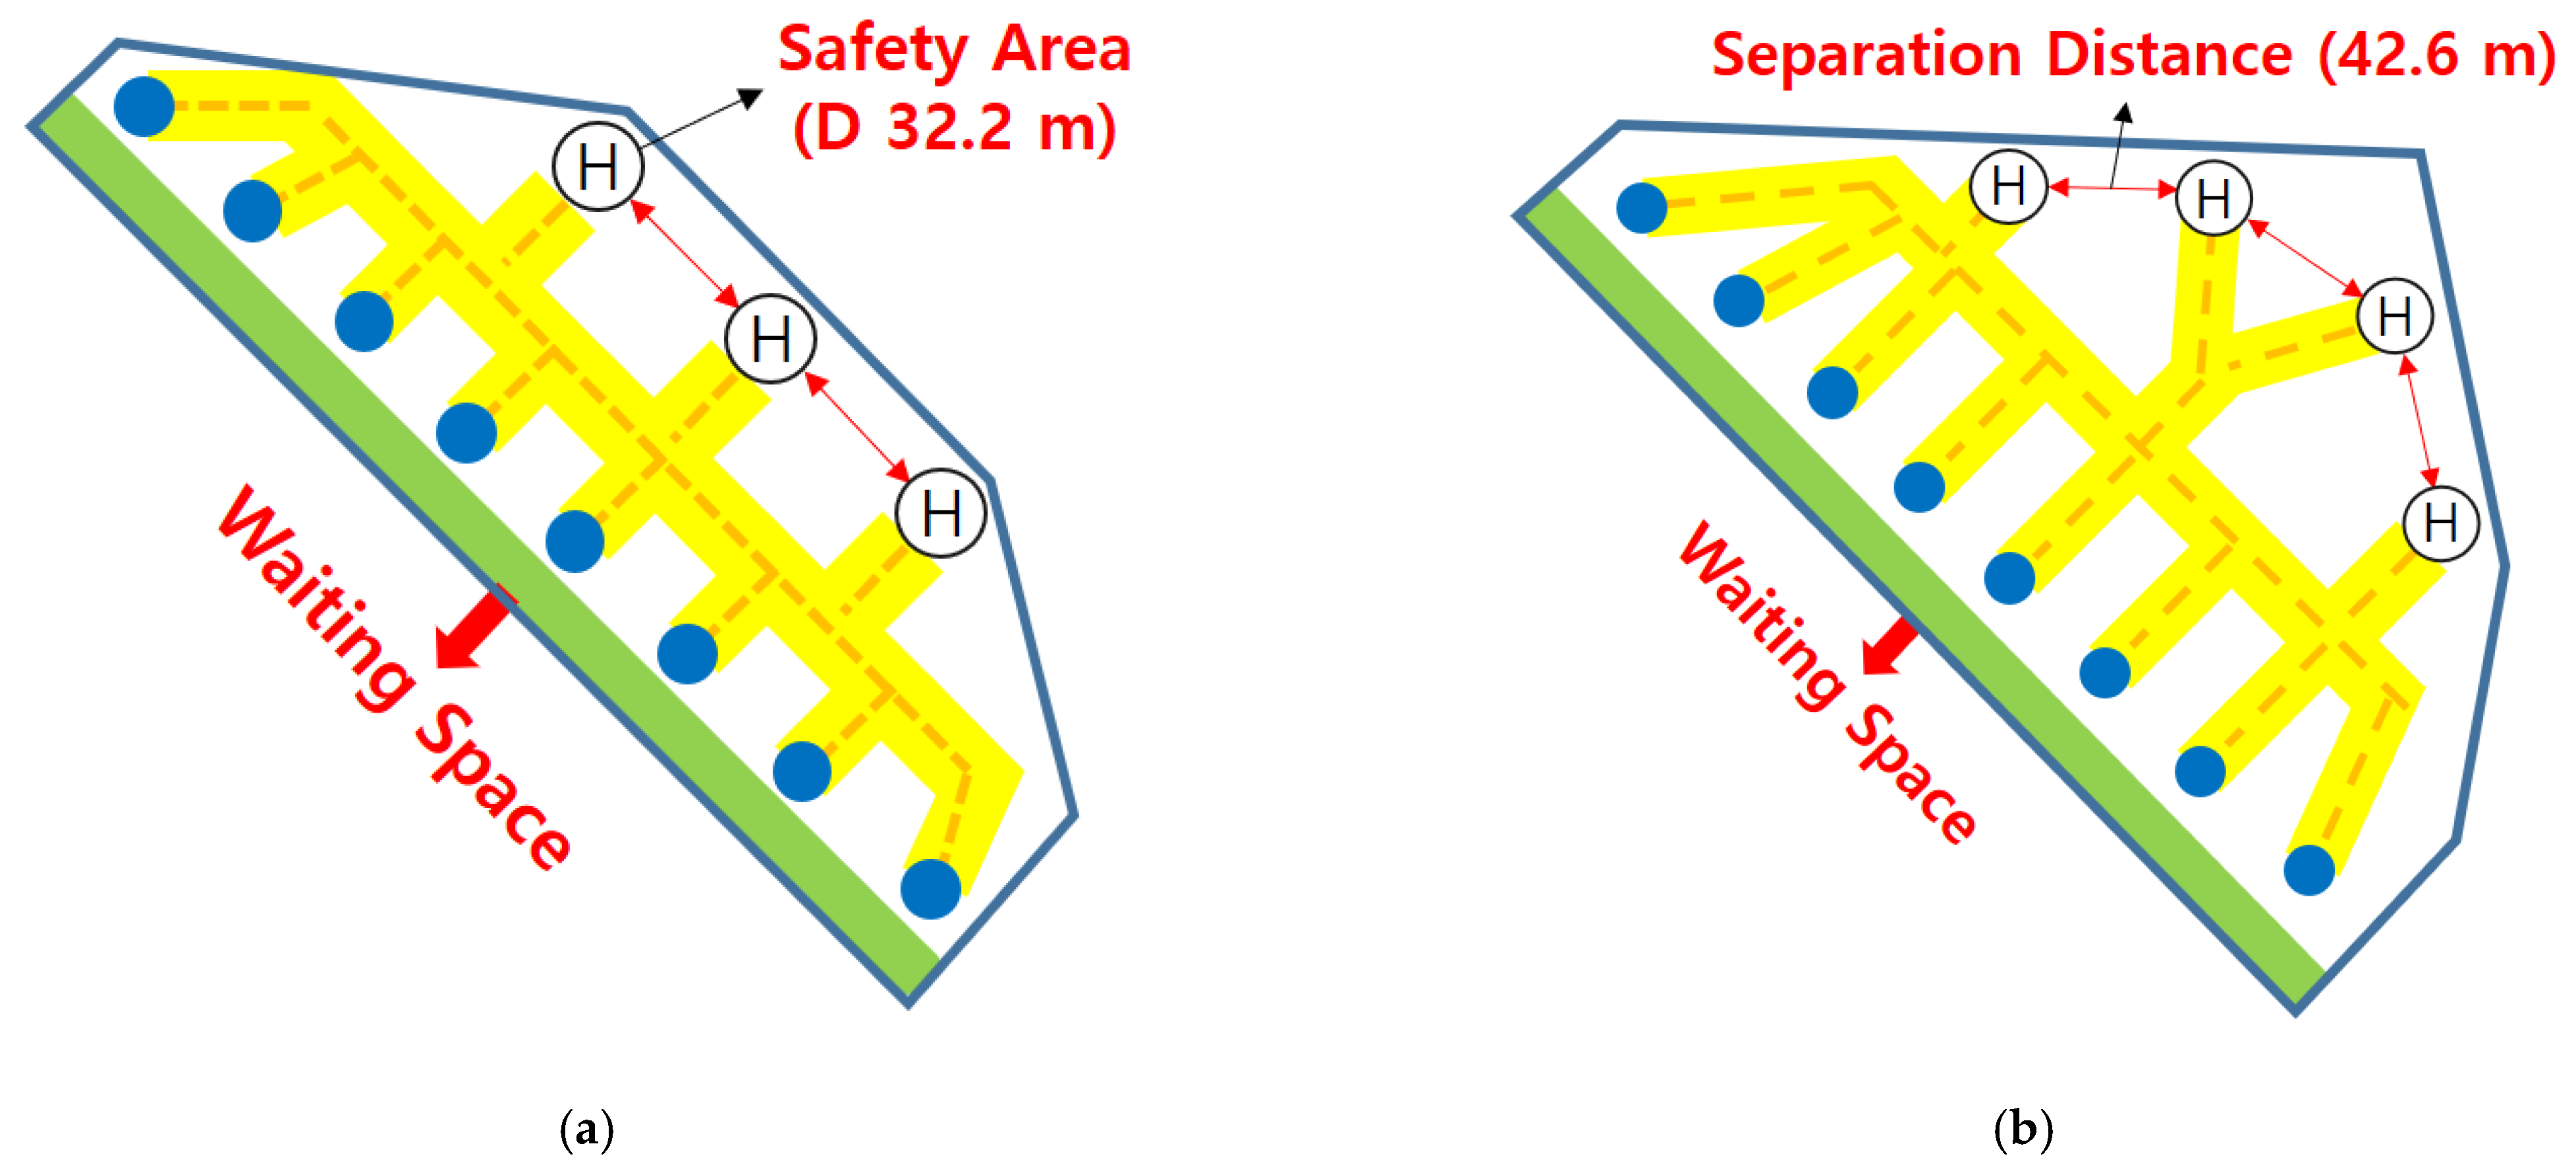
3.2.1. Linear Topology
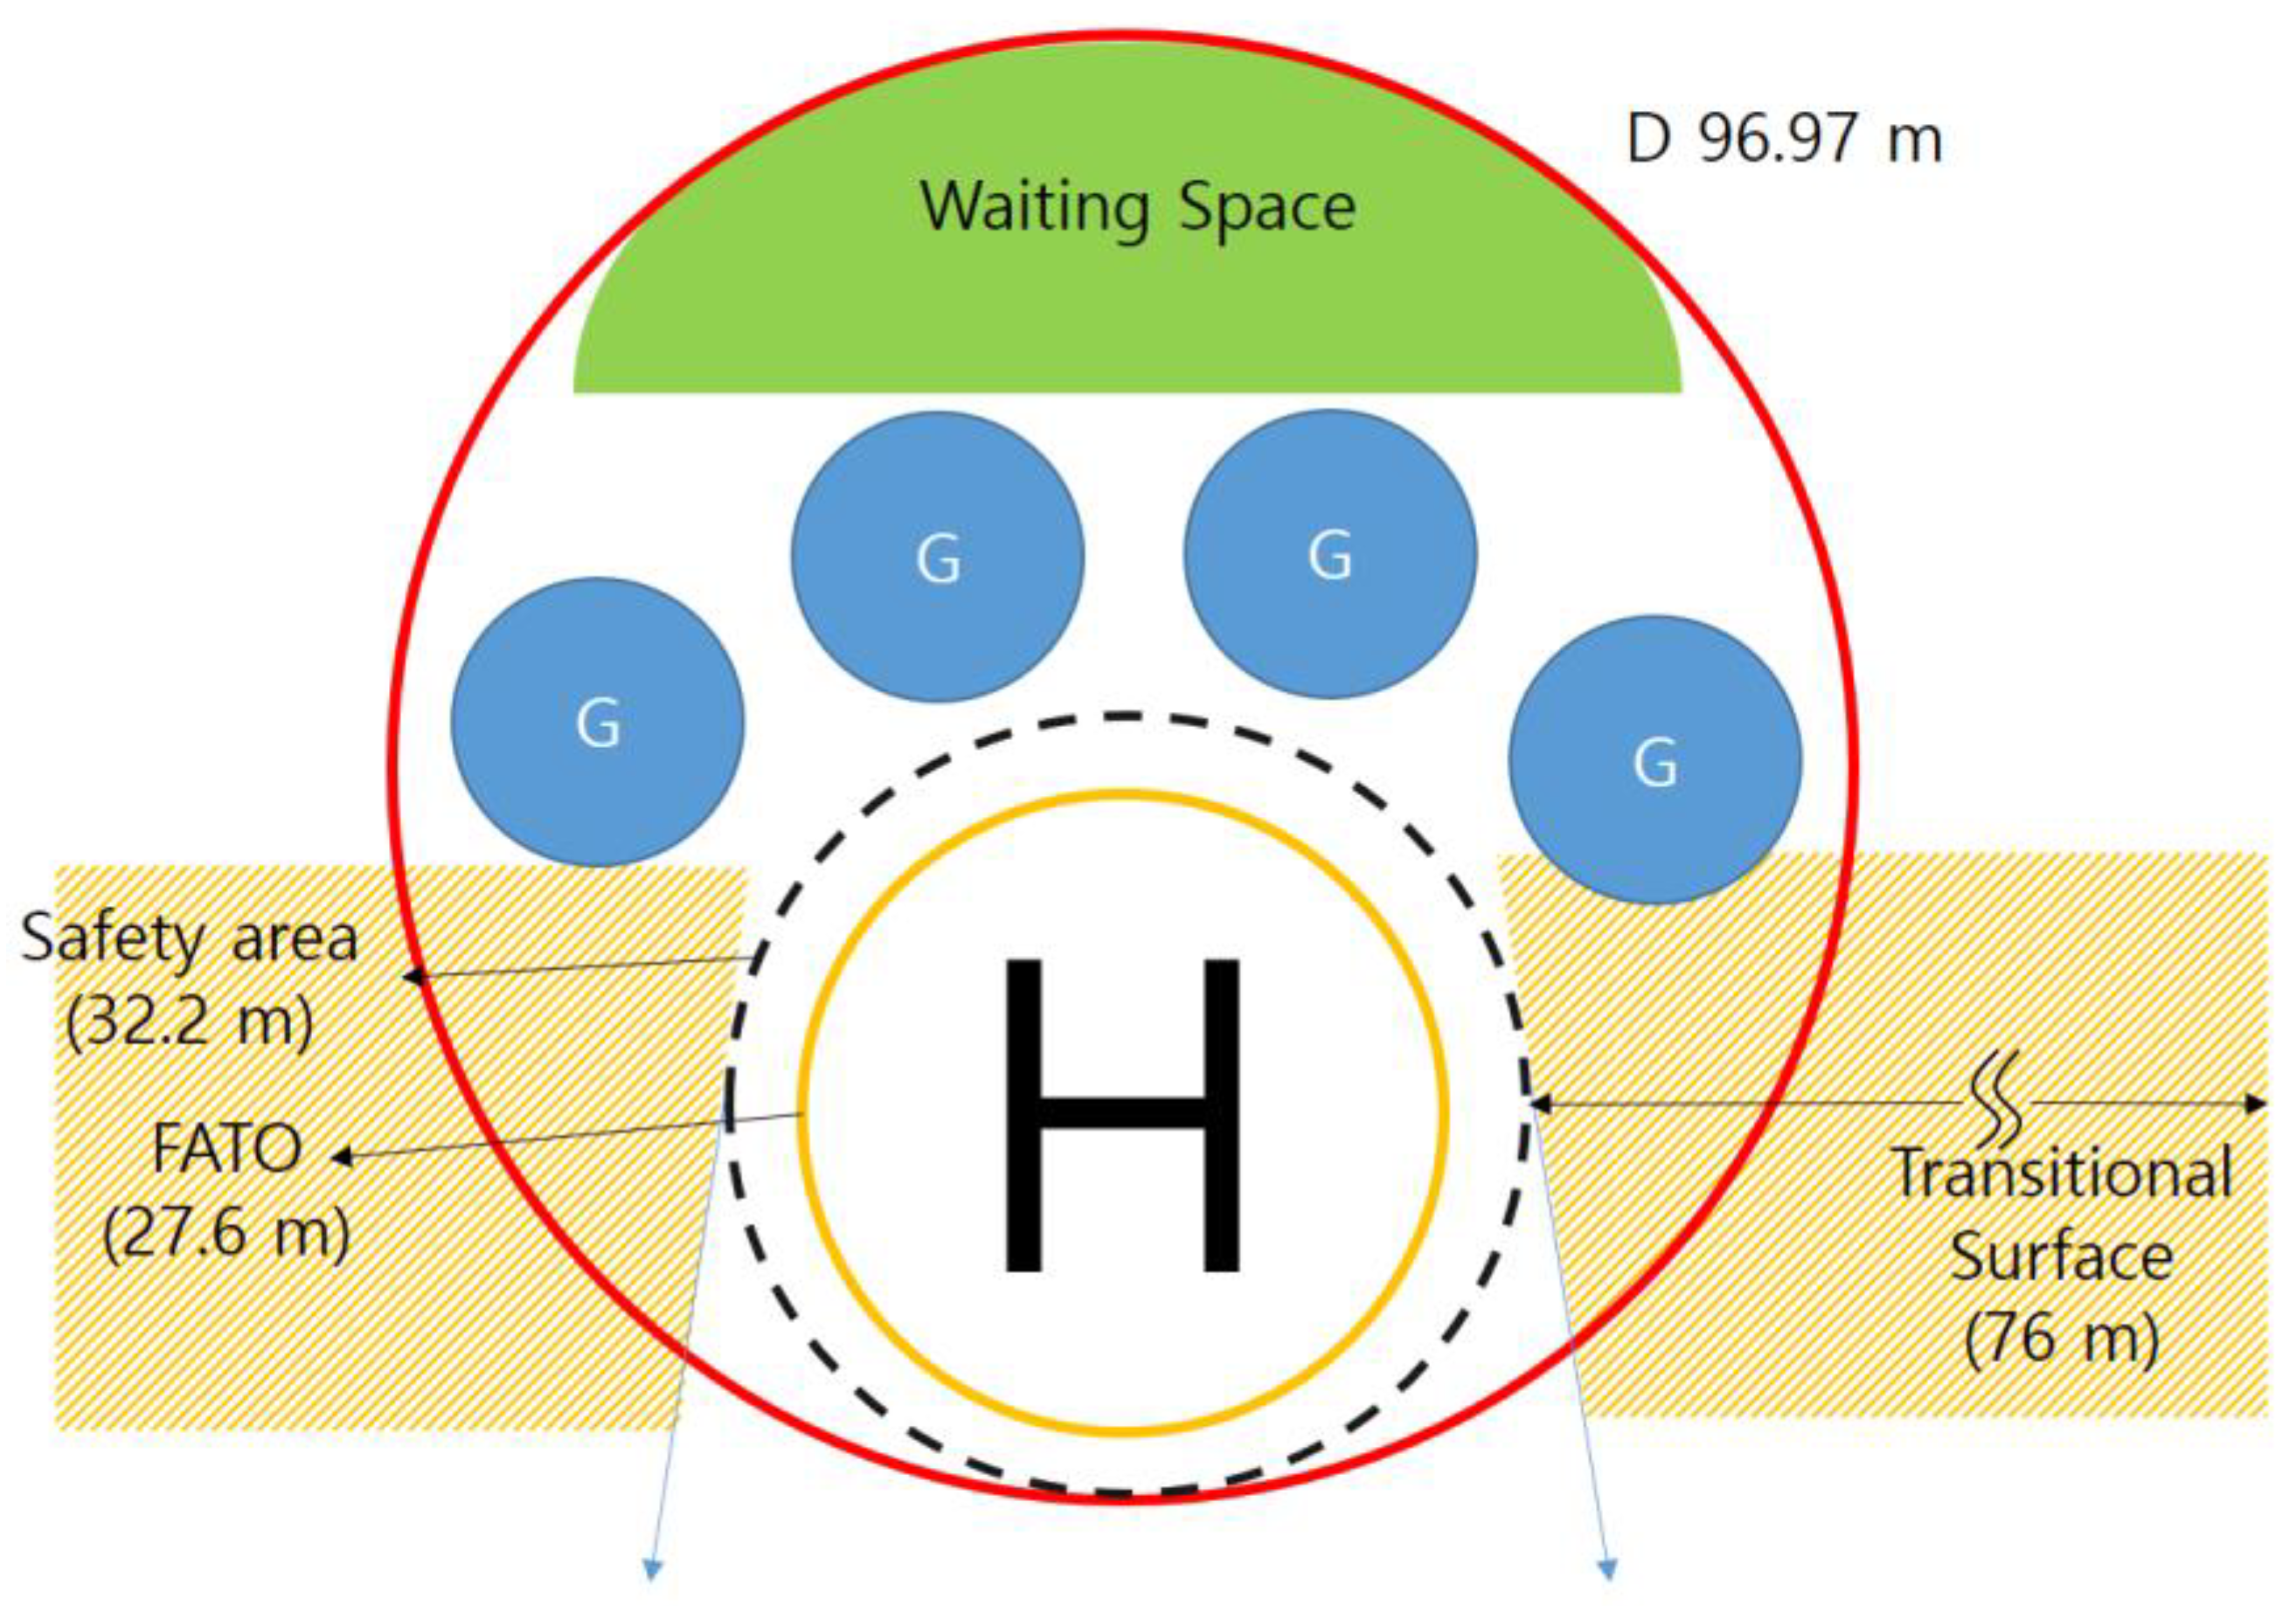
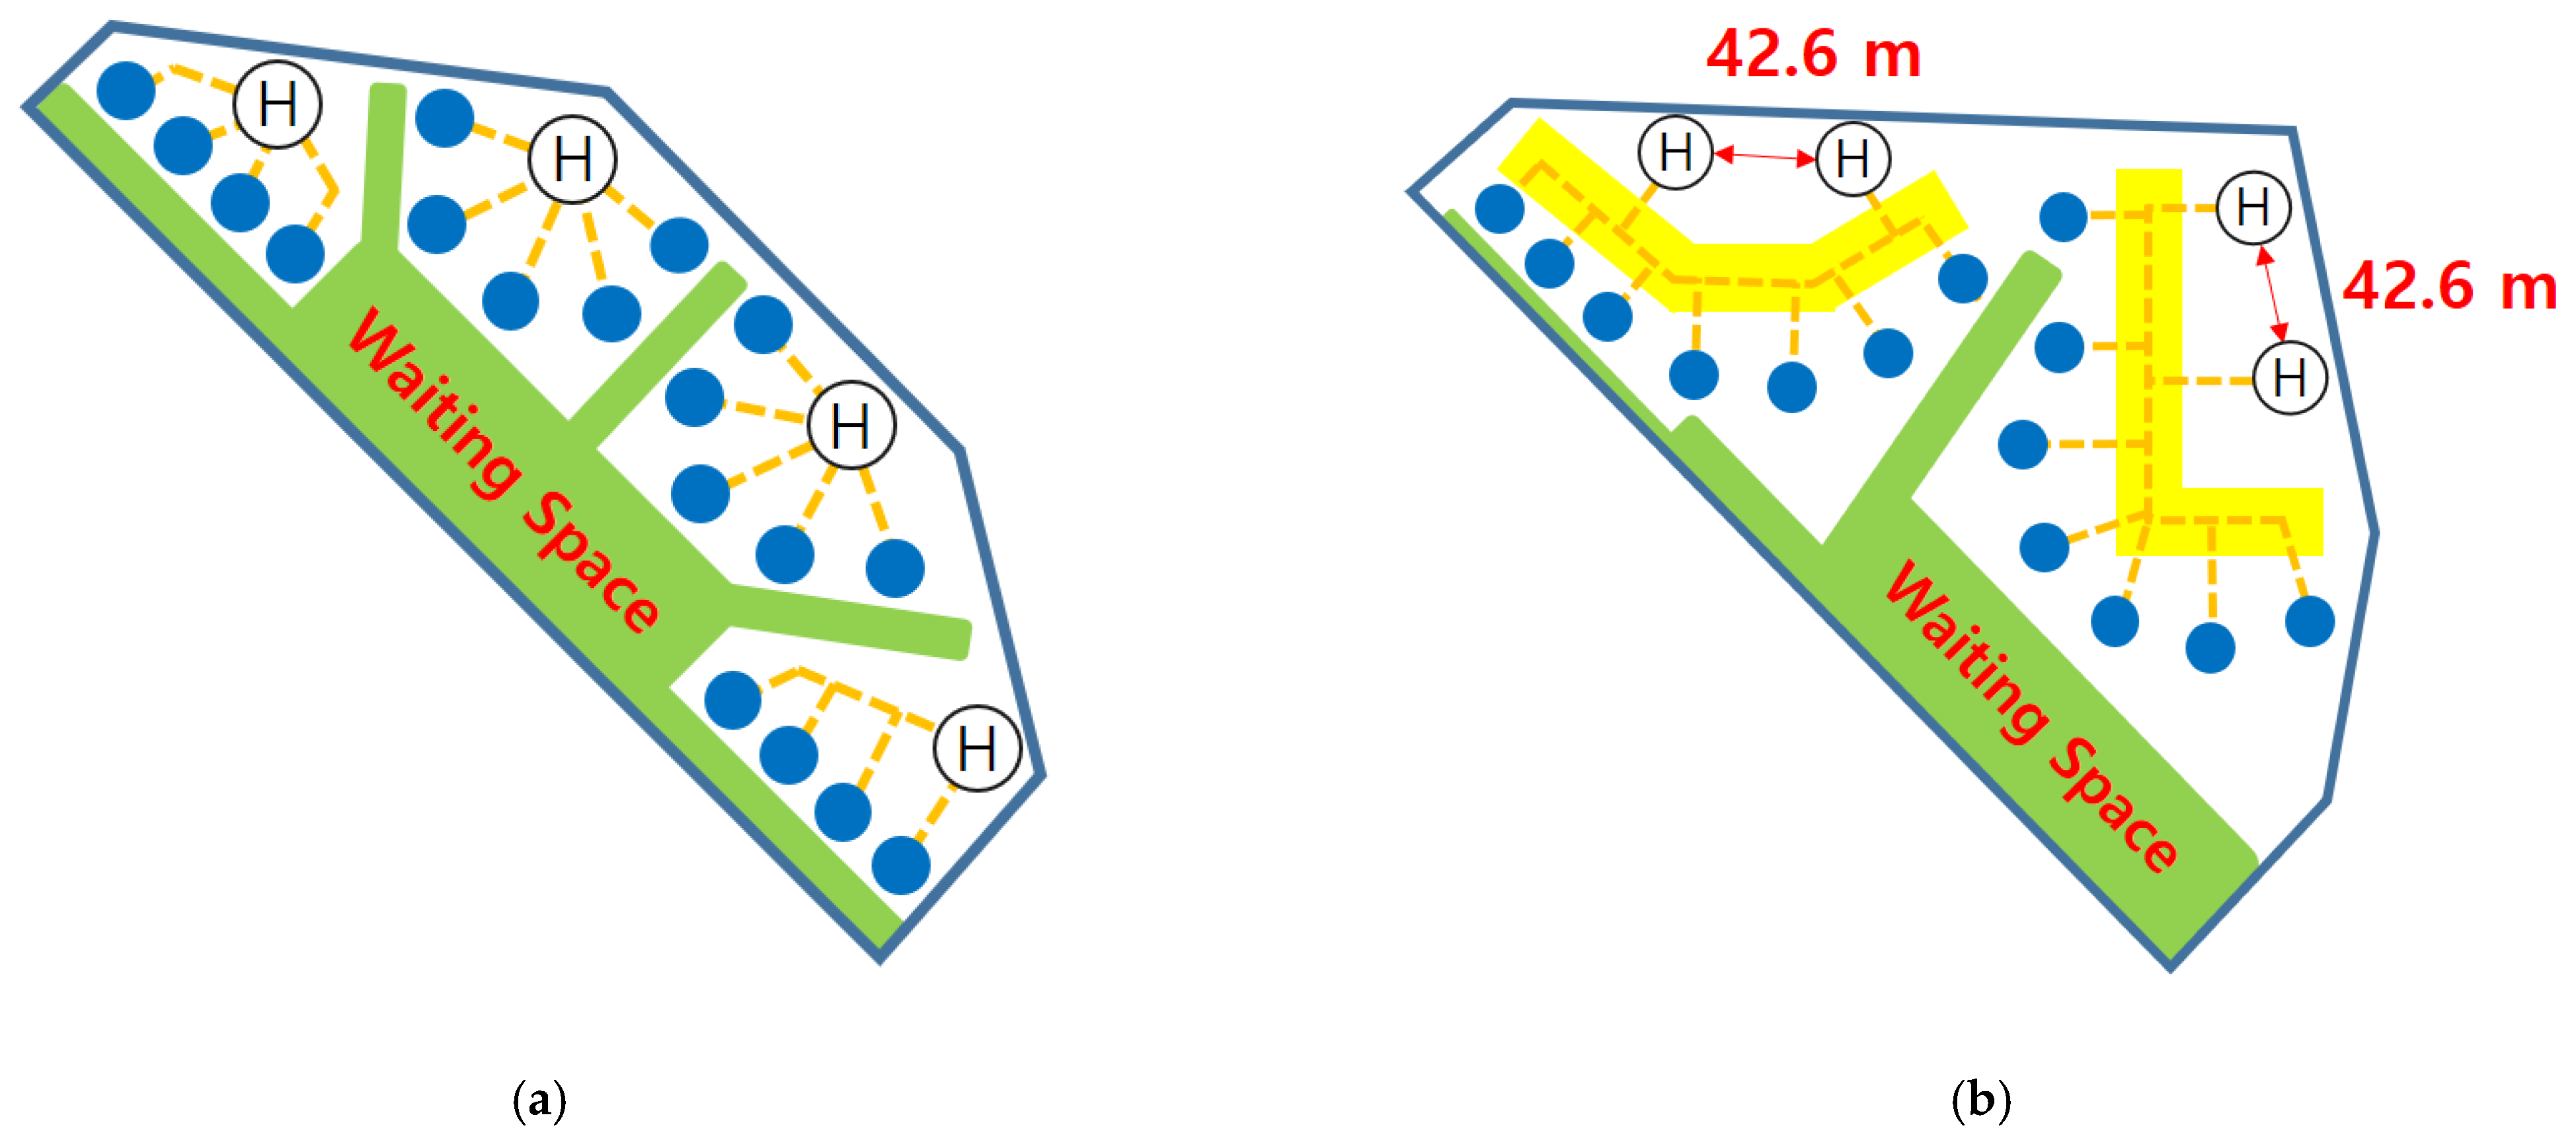
3.2.2. Satellite Topology
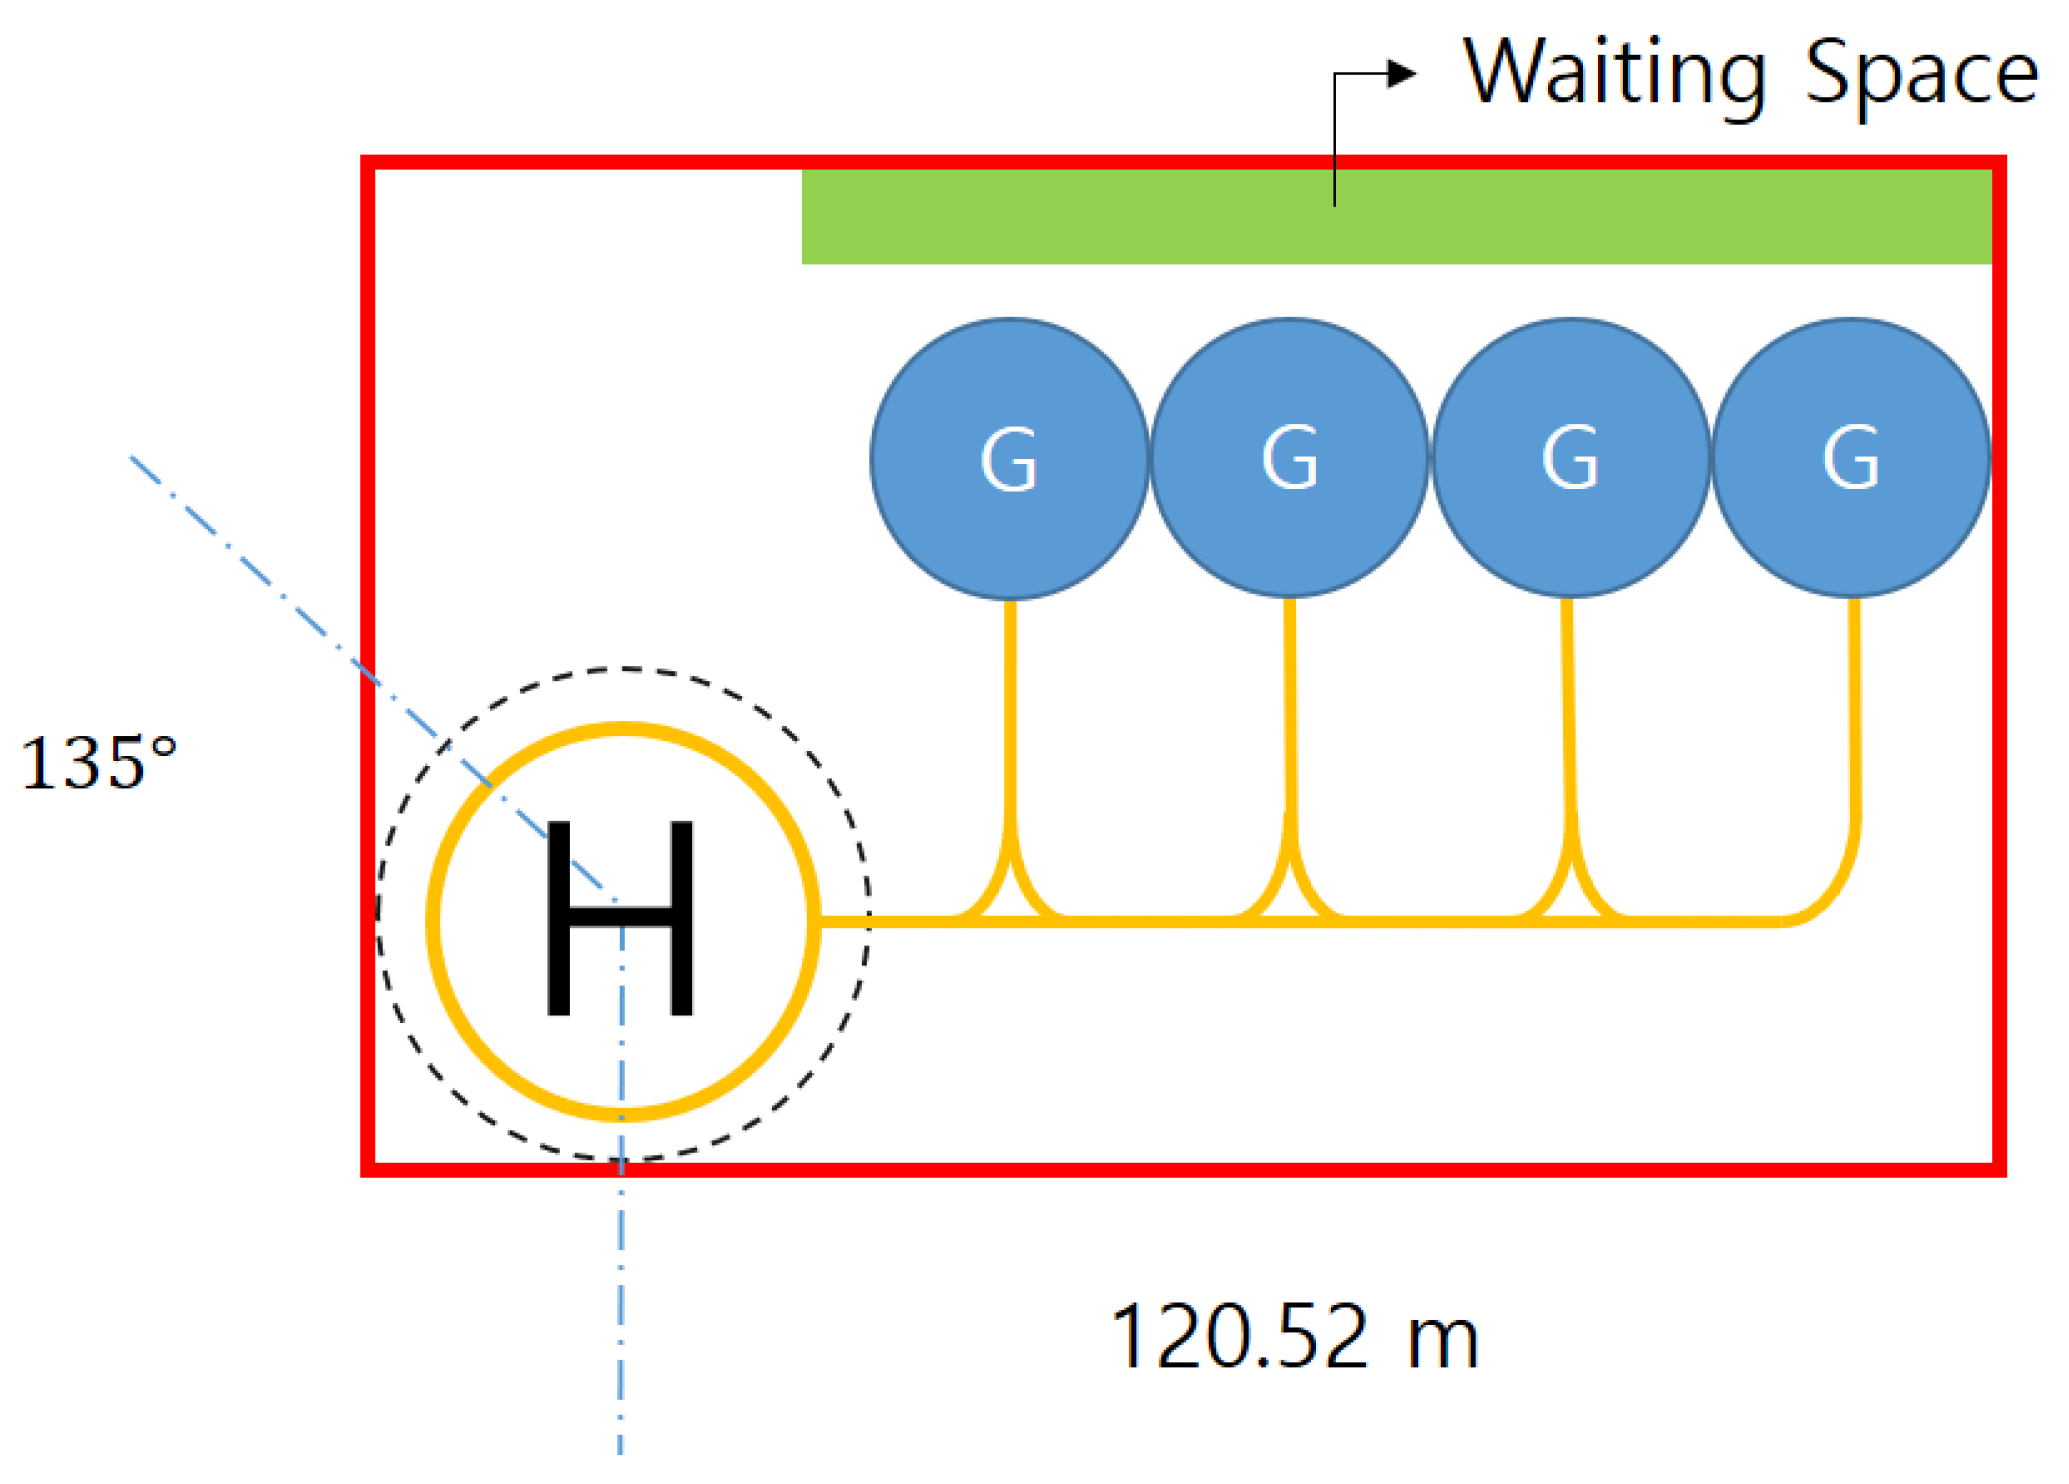
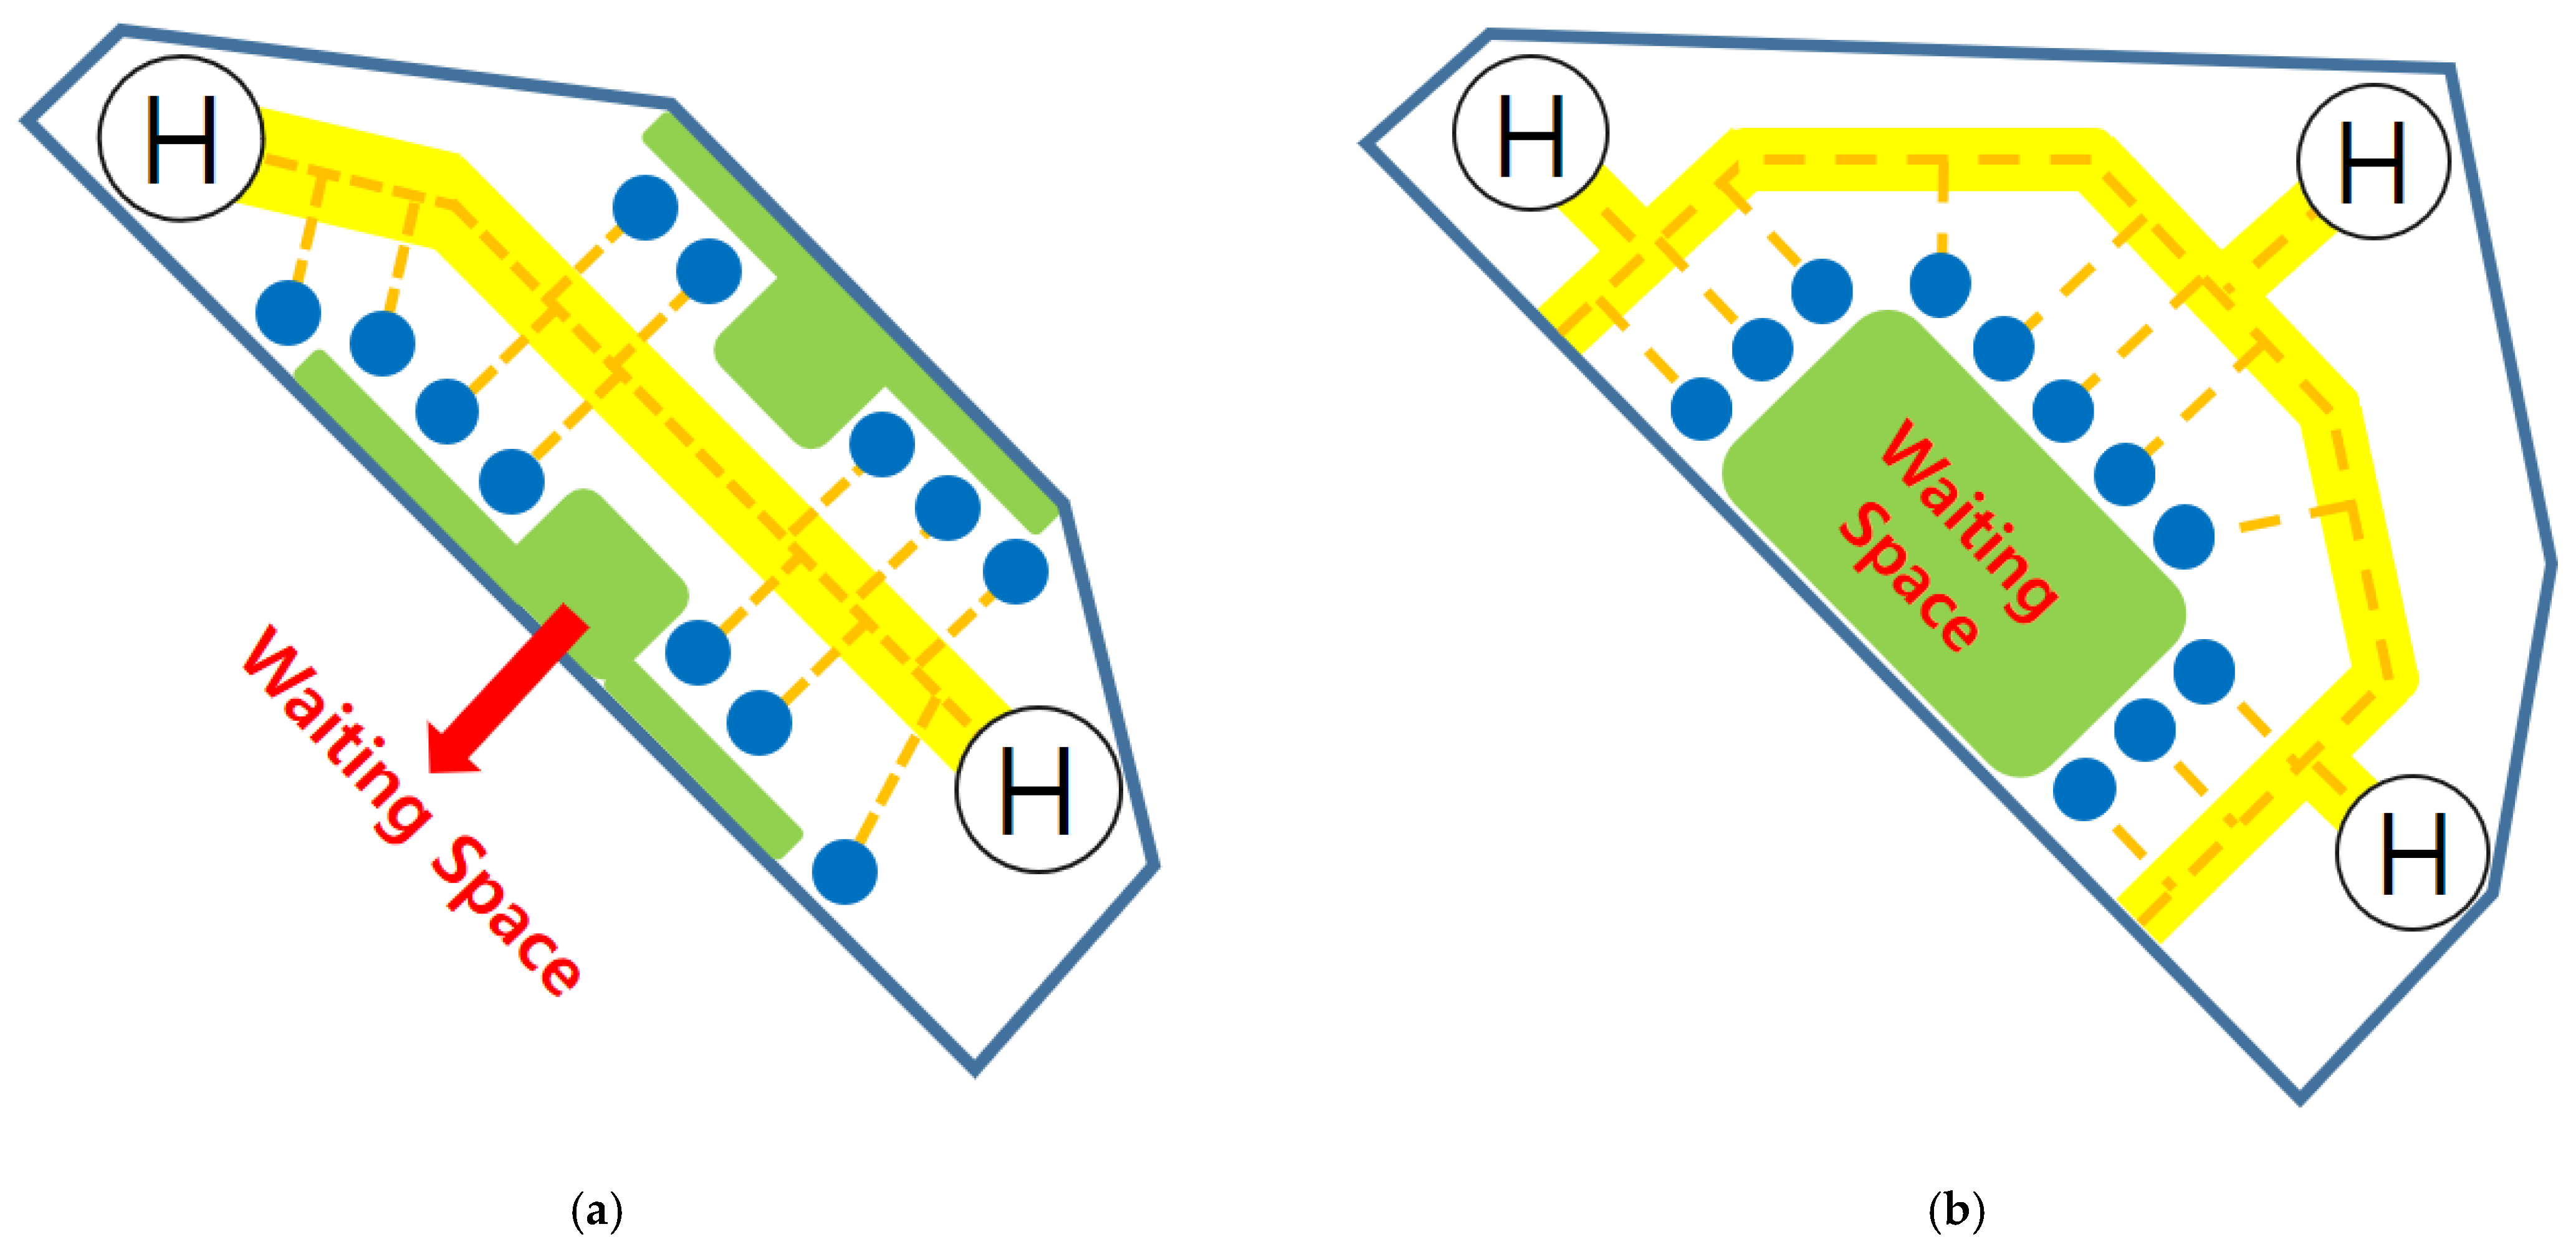
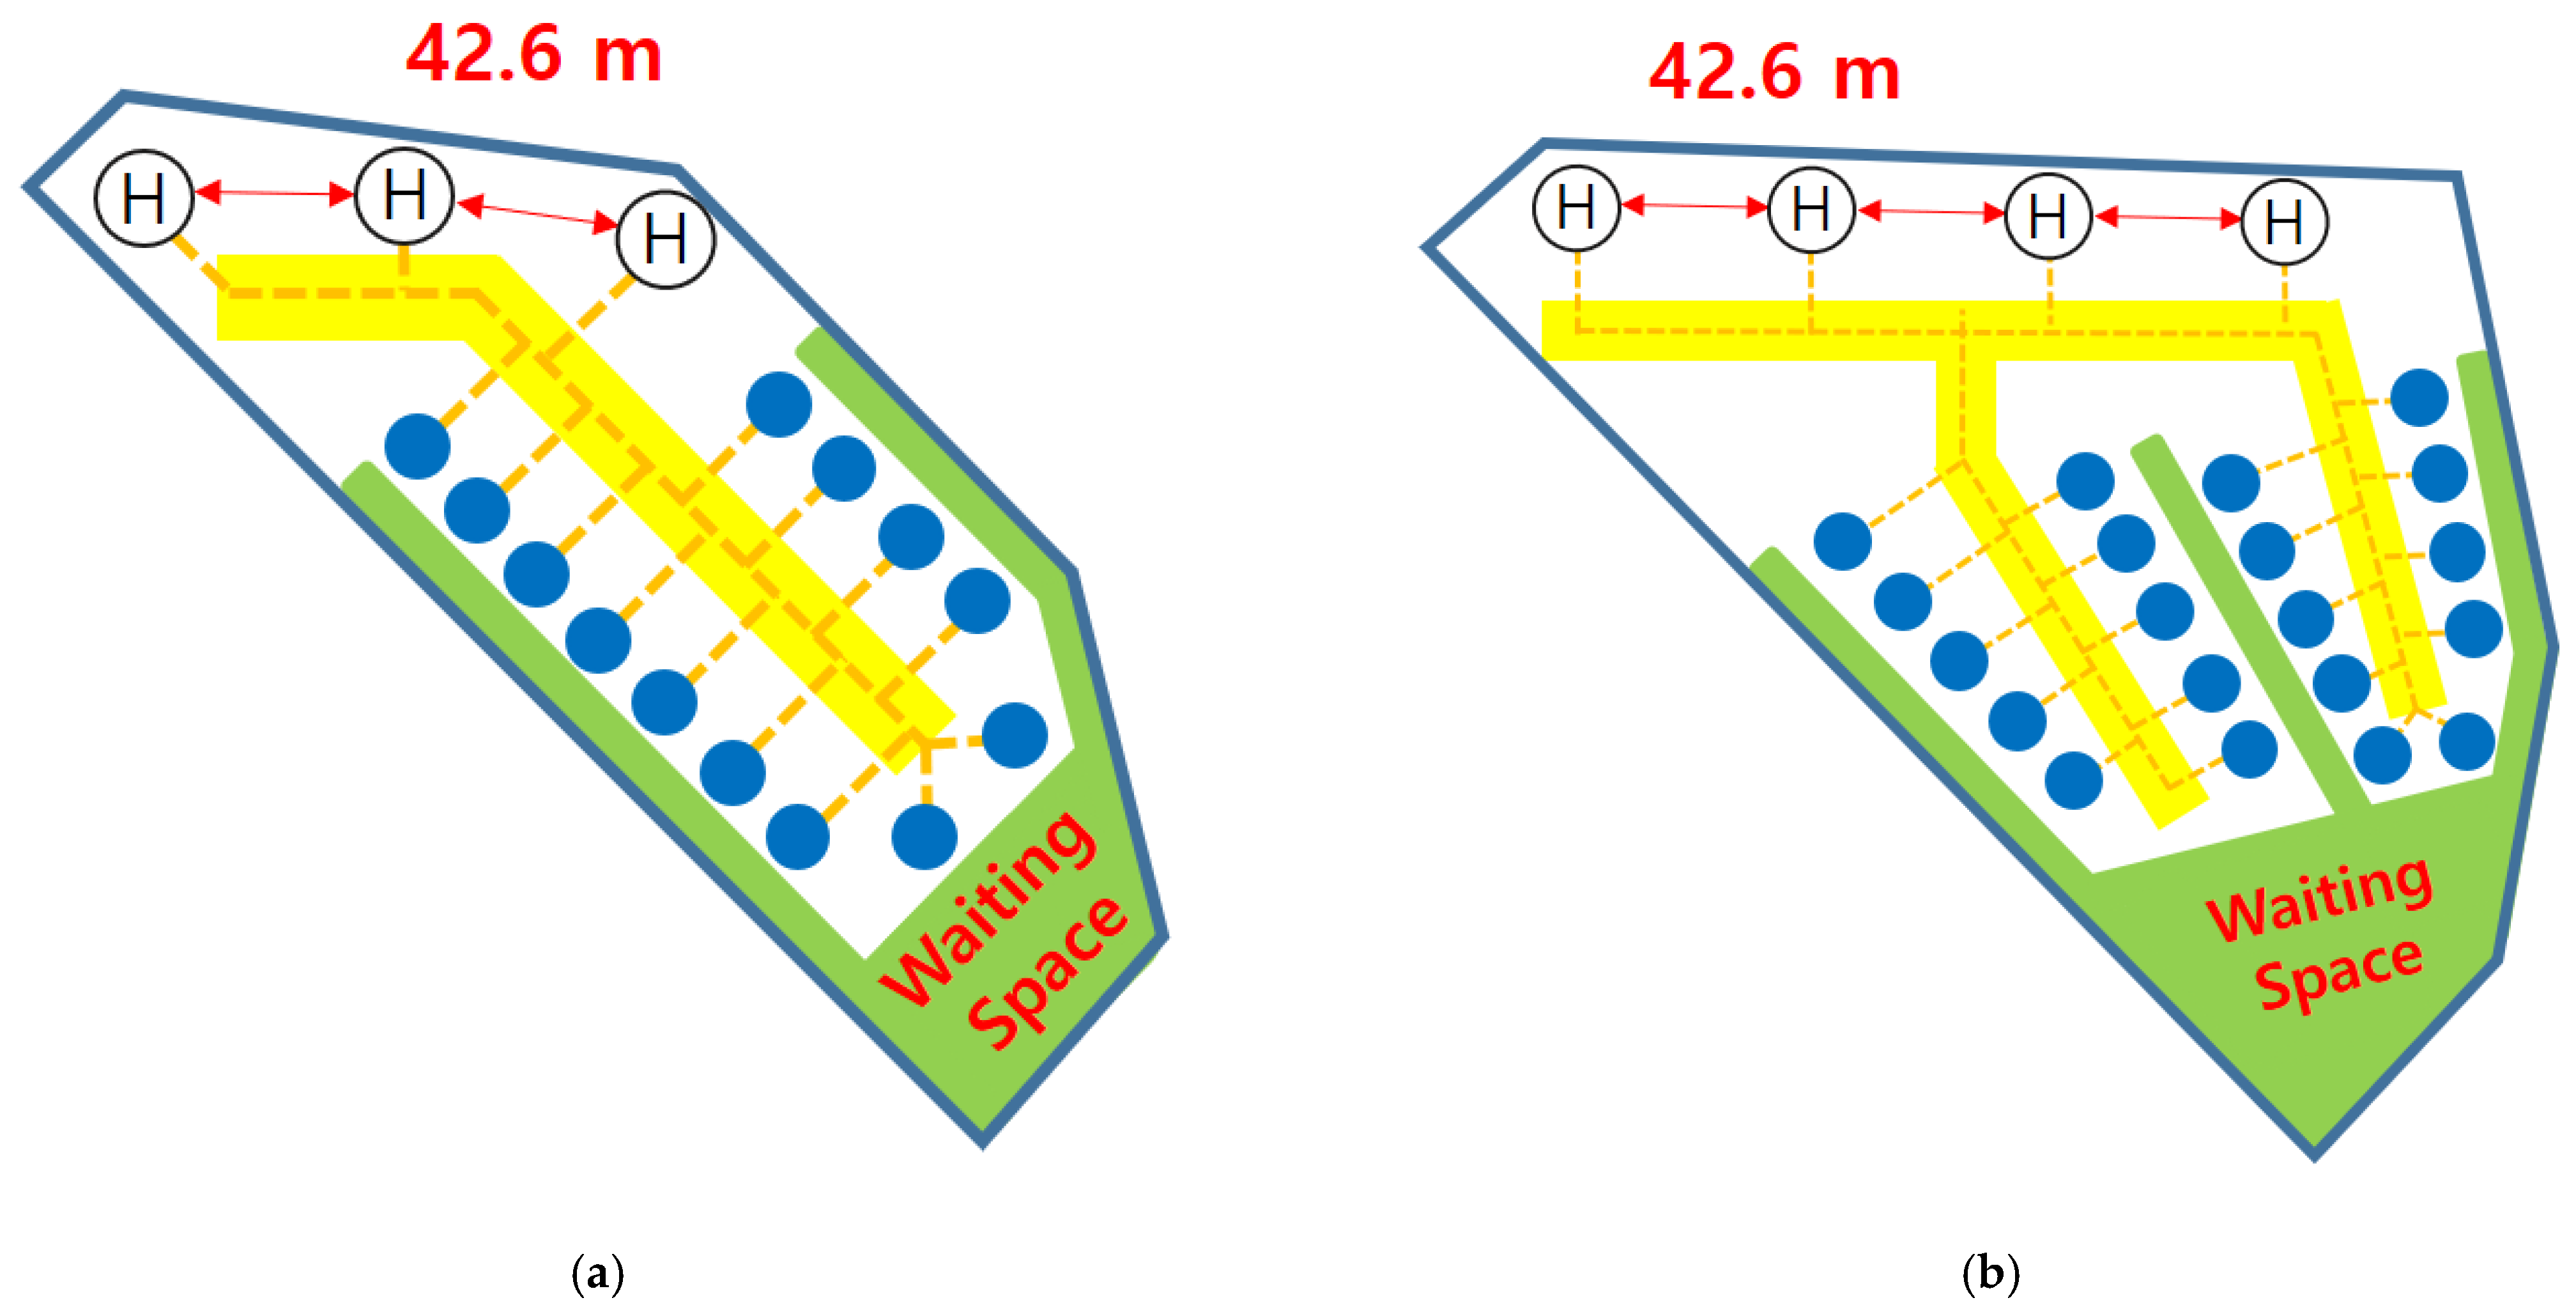
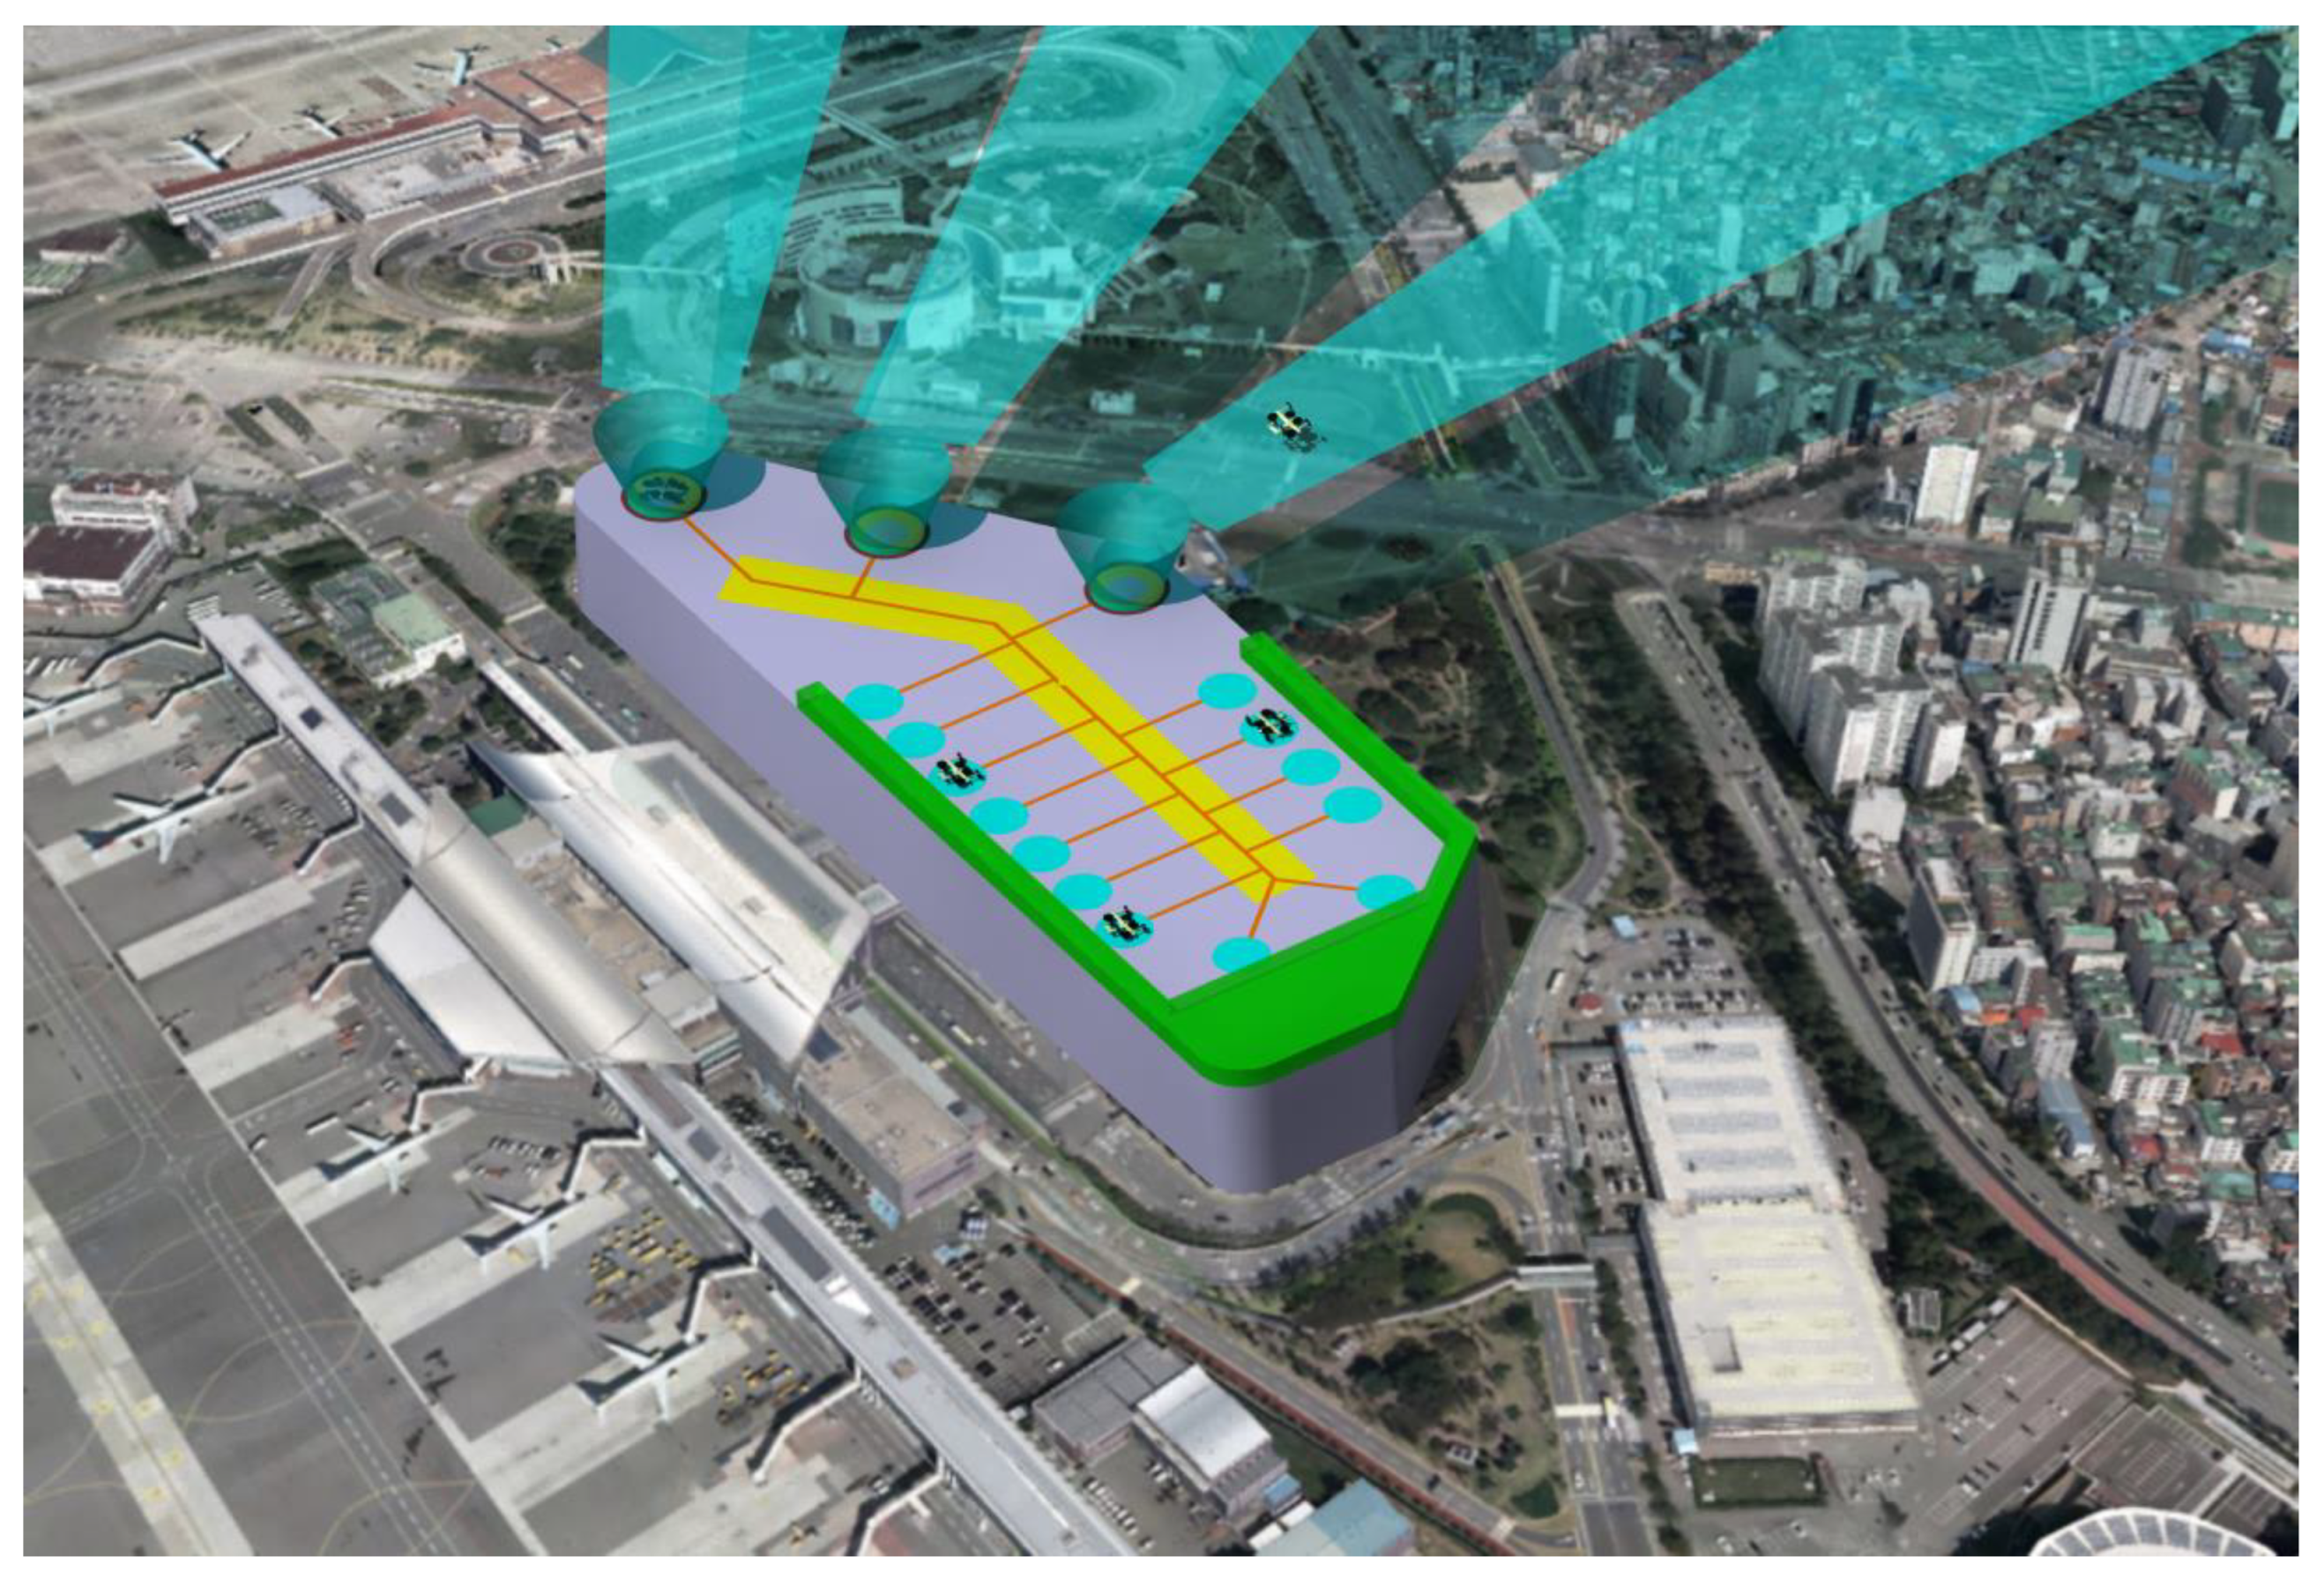
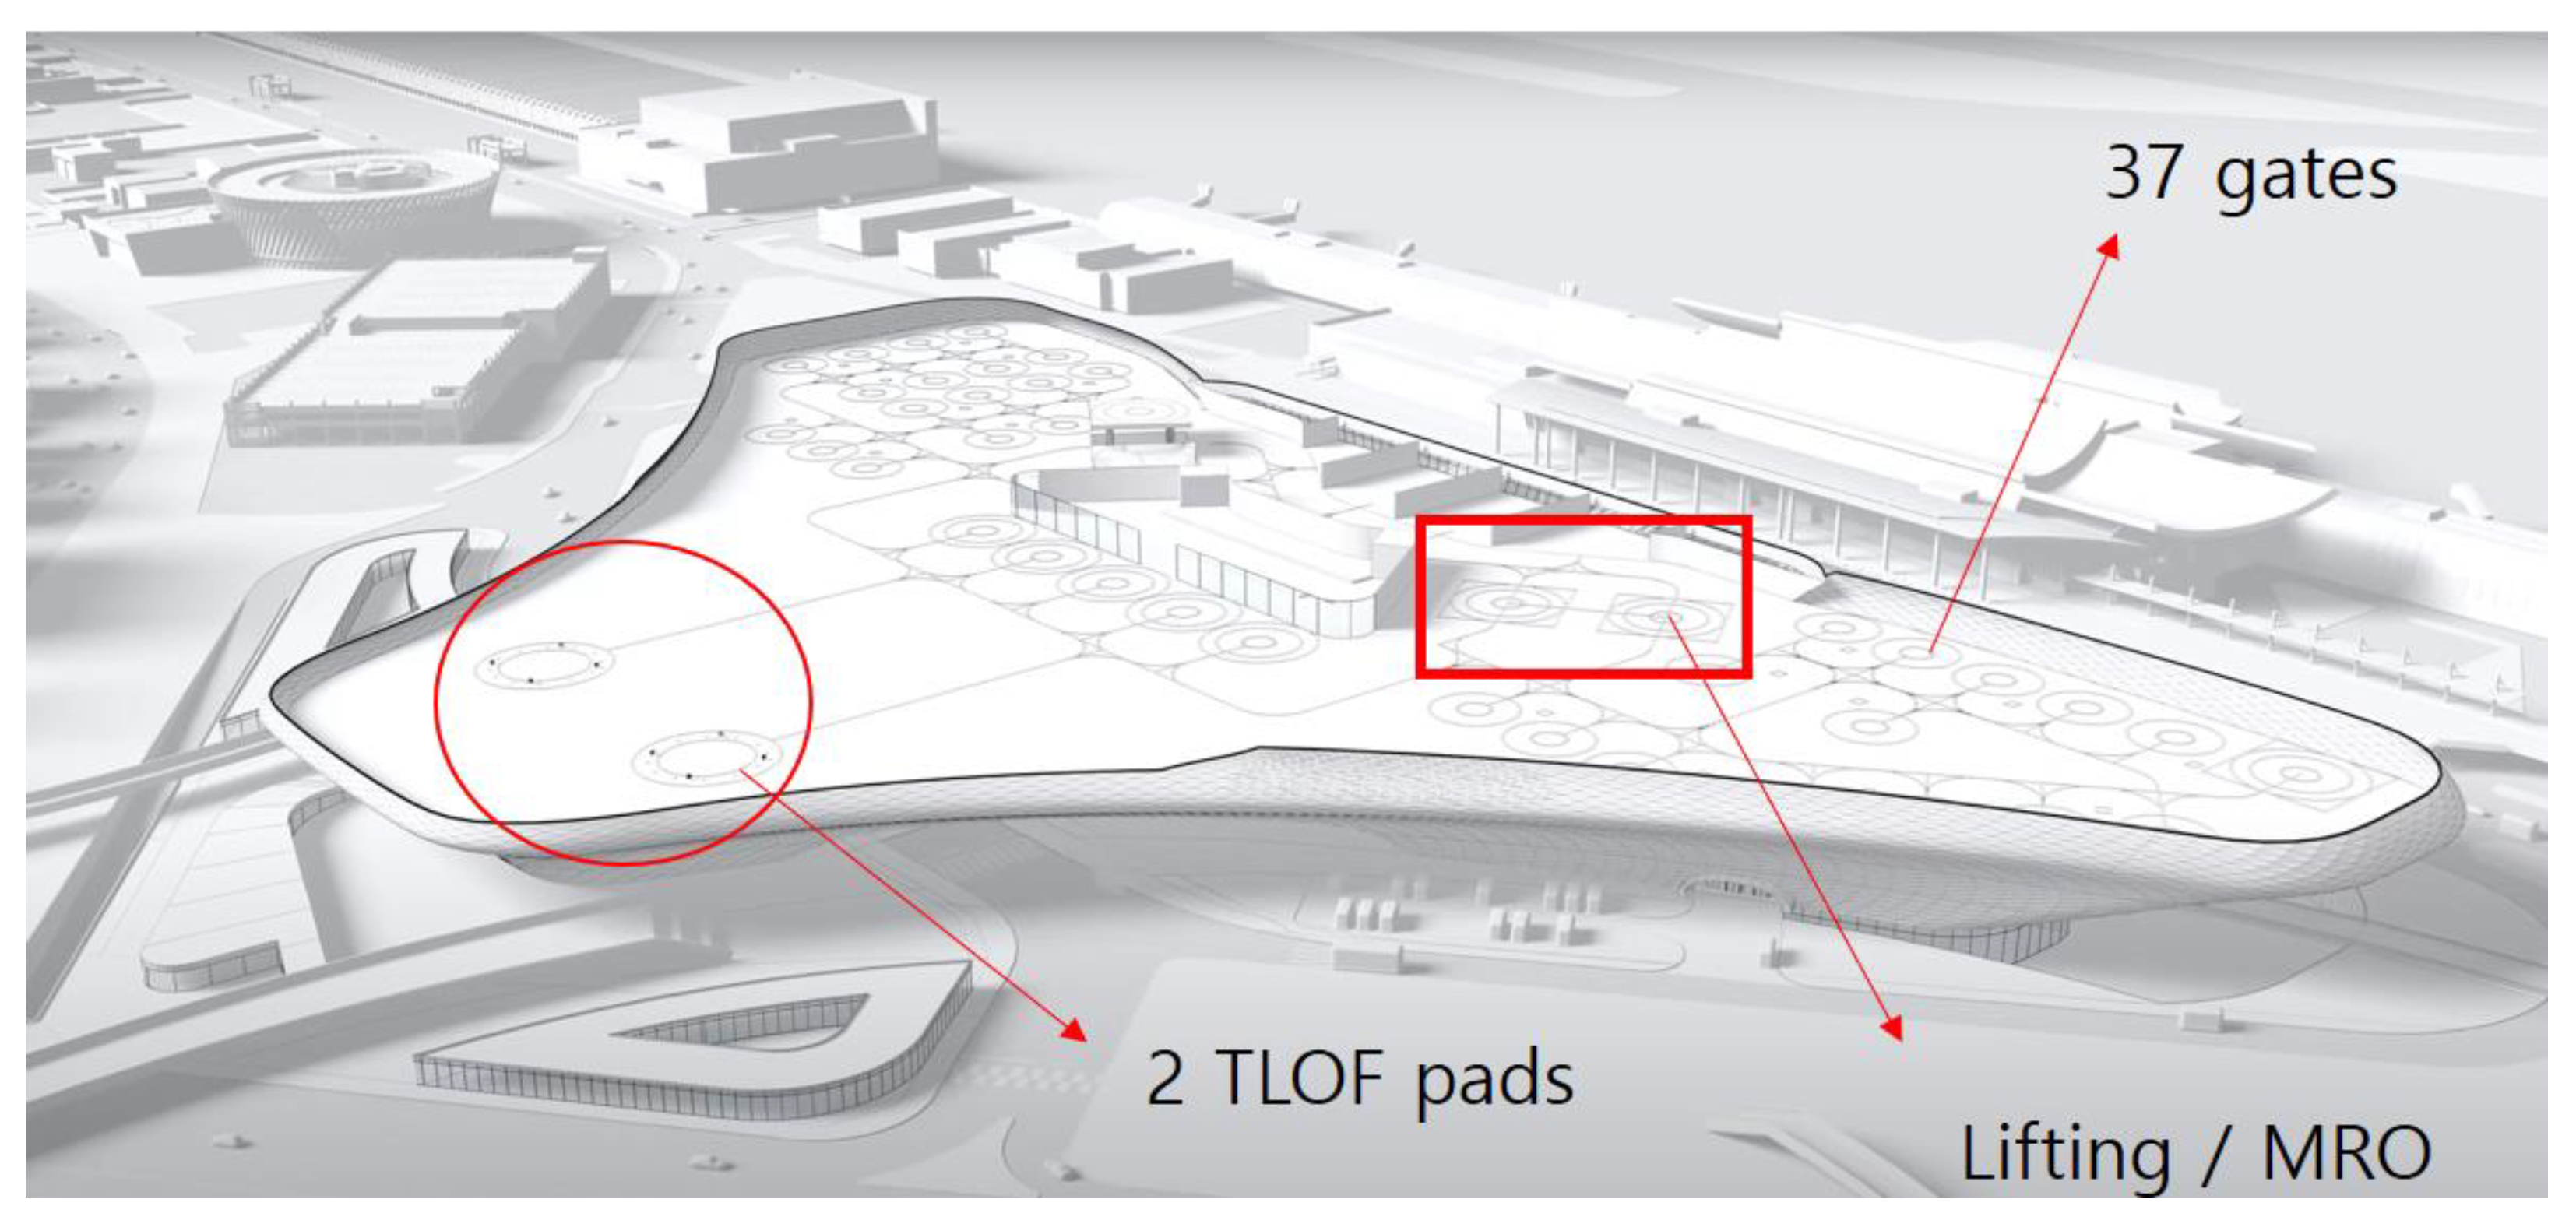
3.2.3. Pier Topology
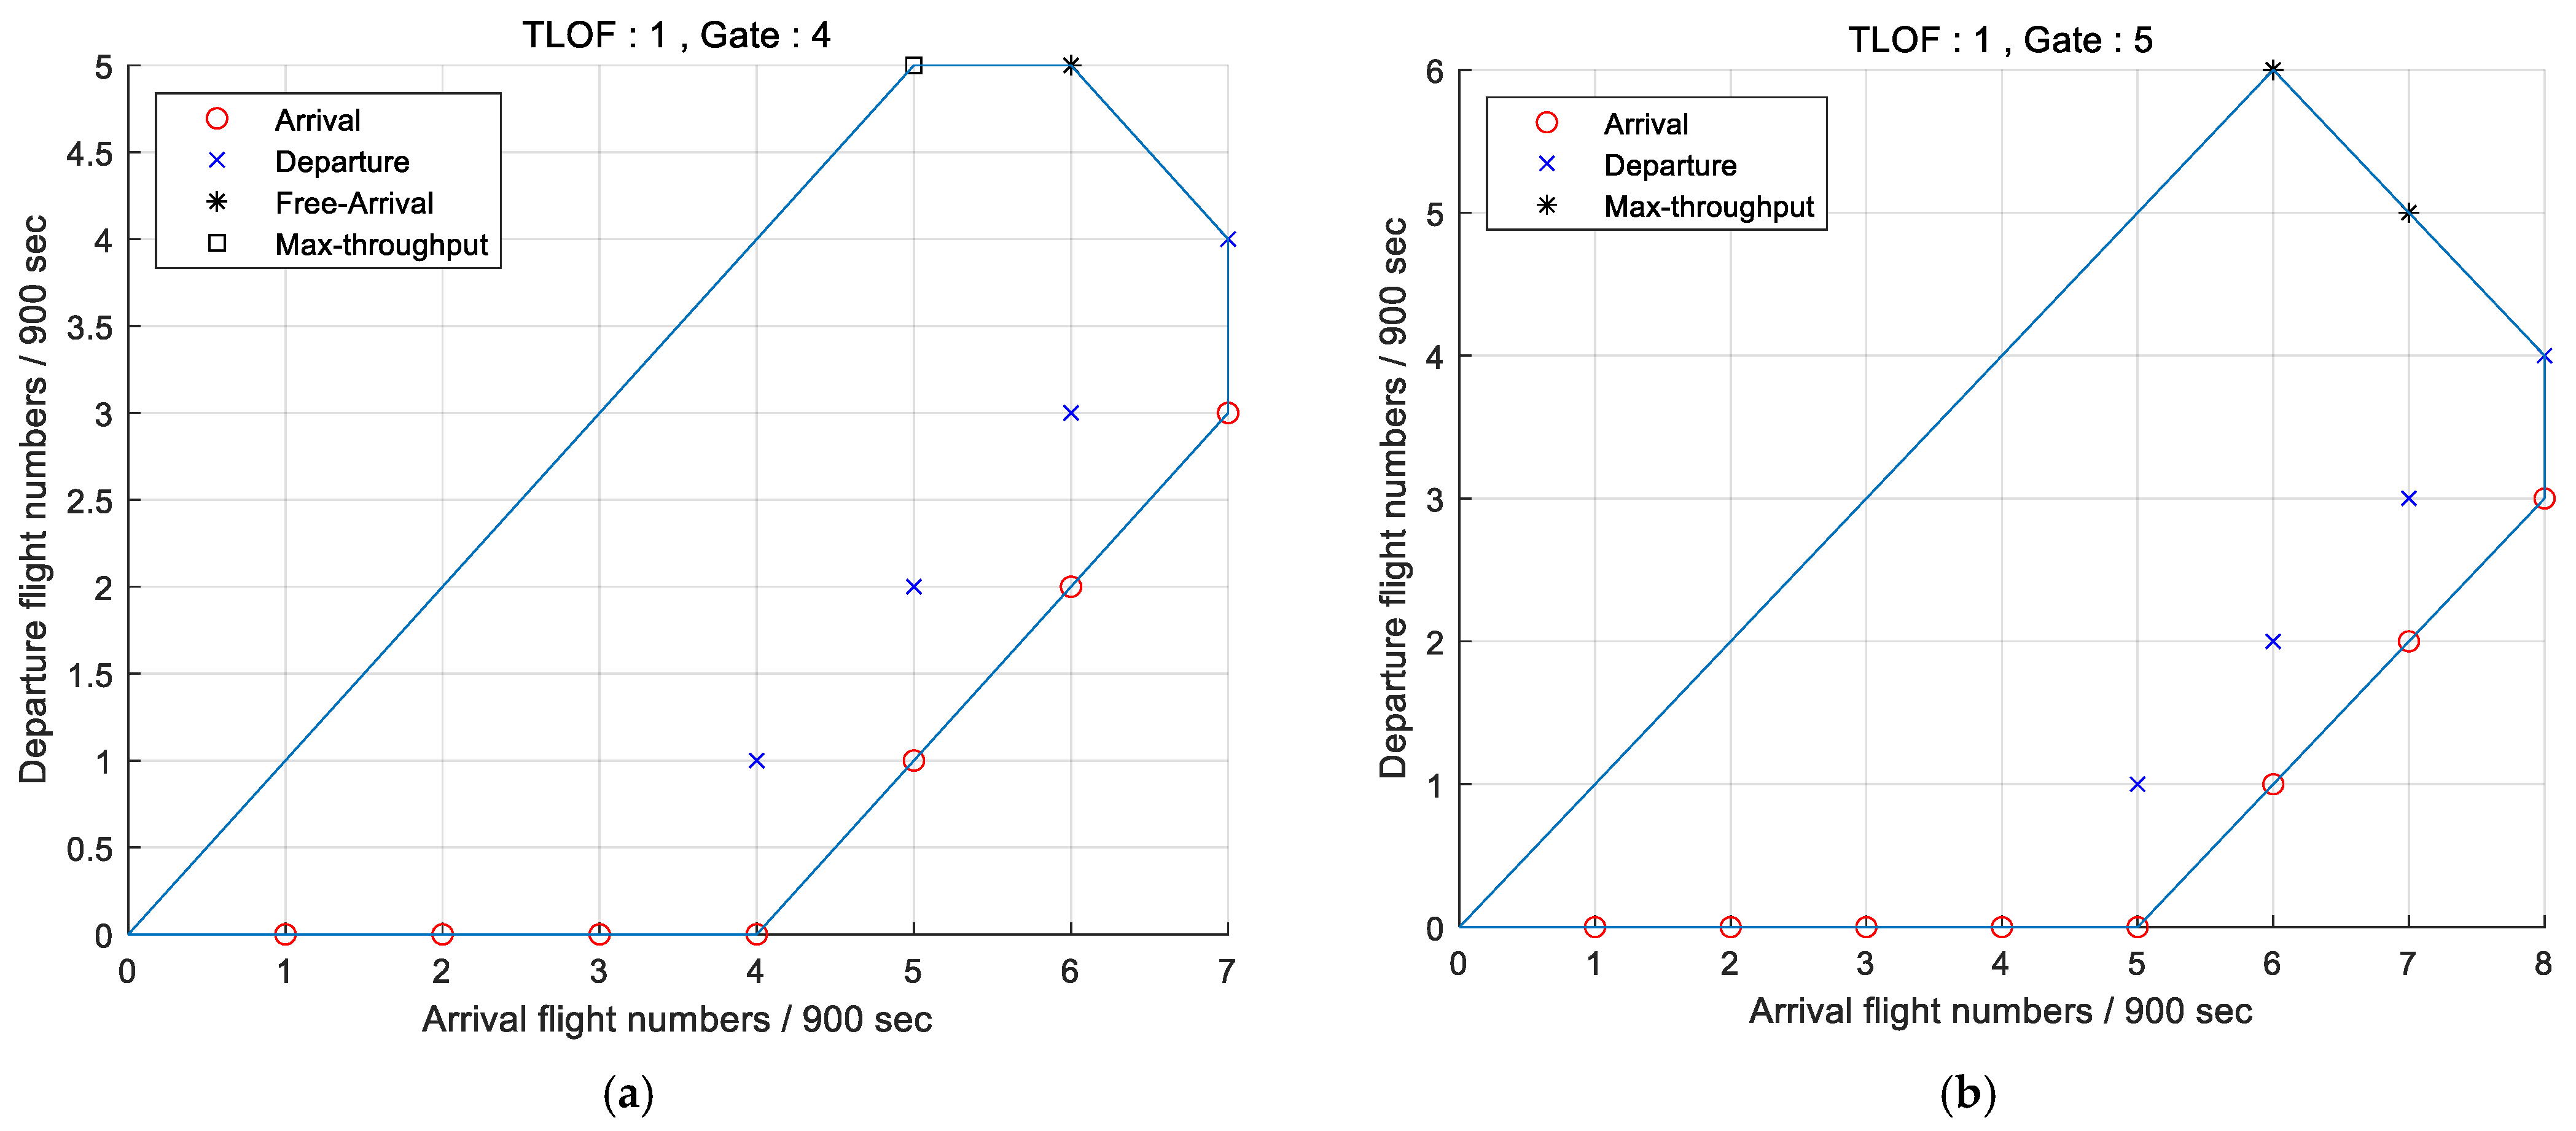
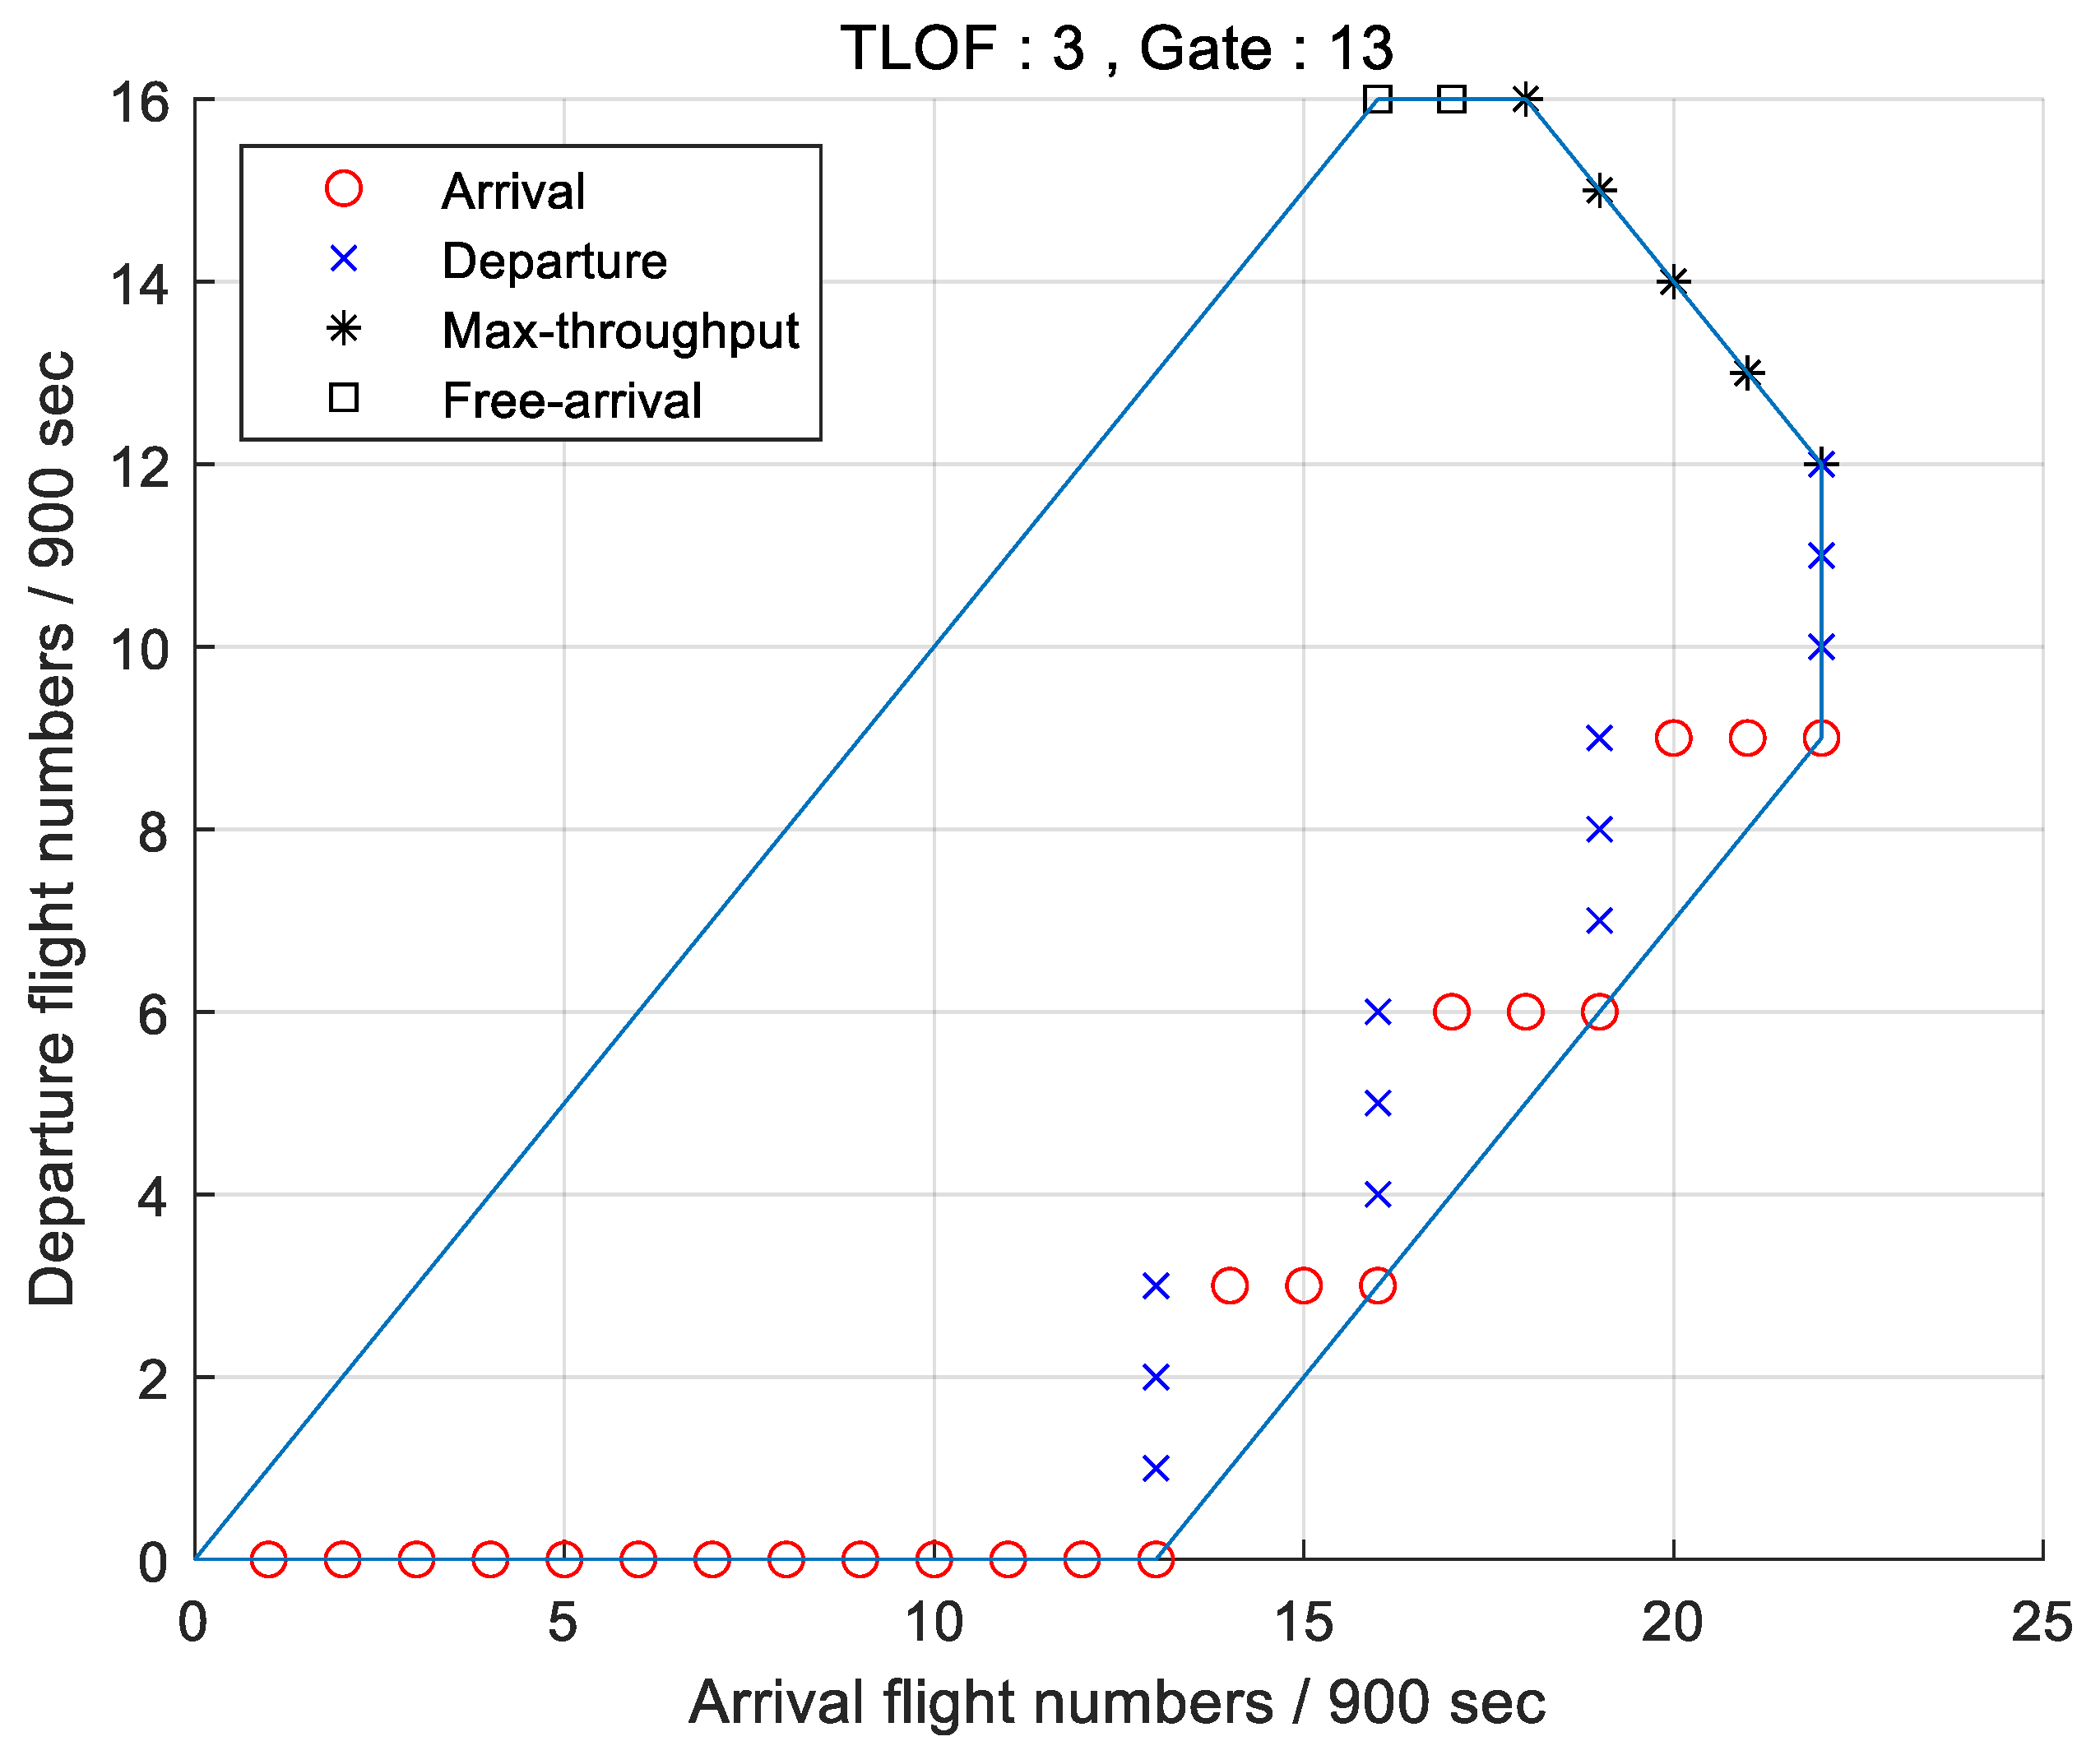
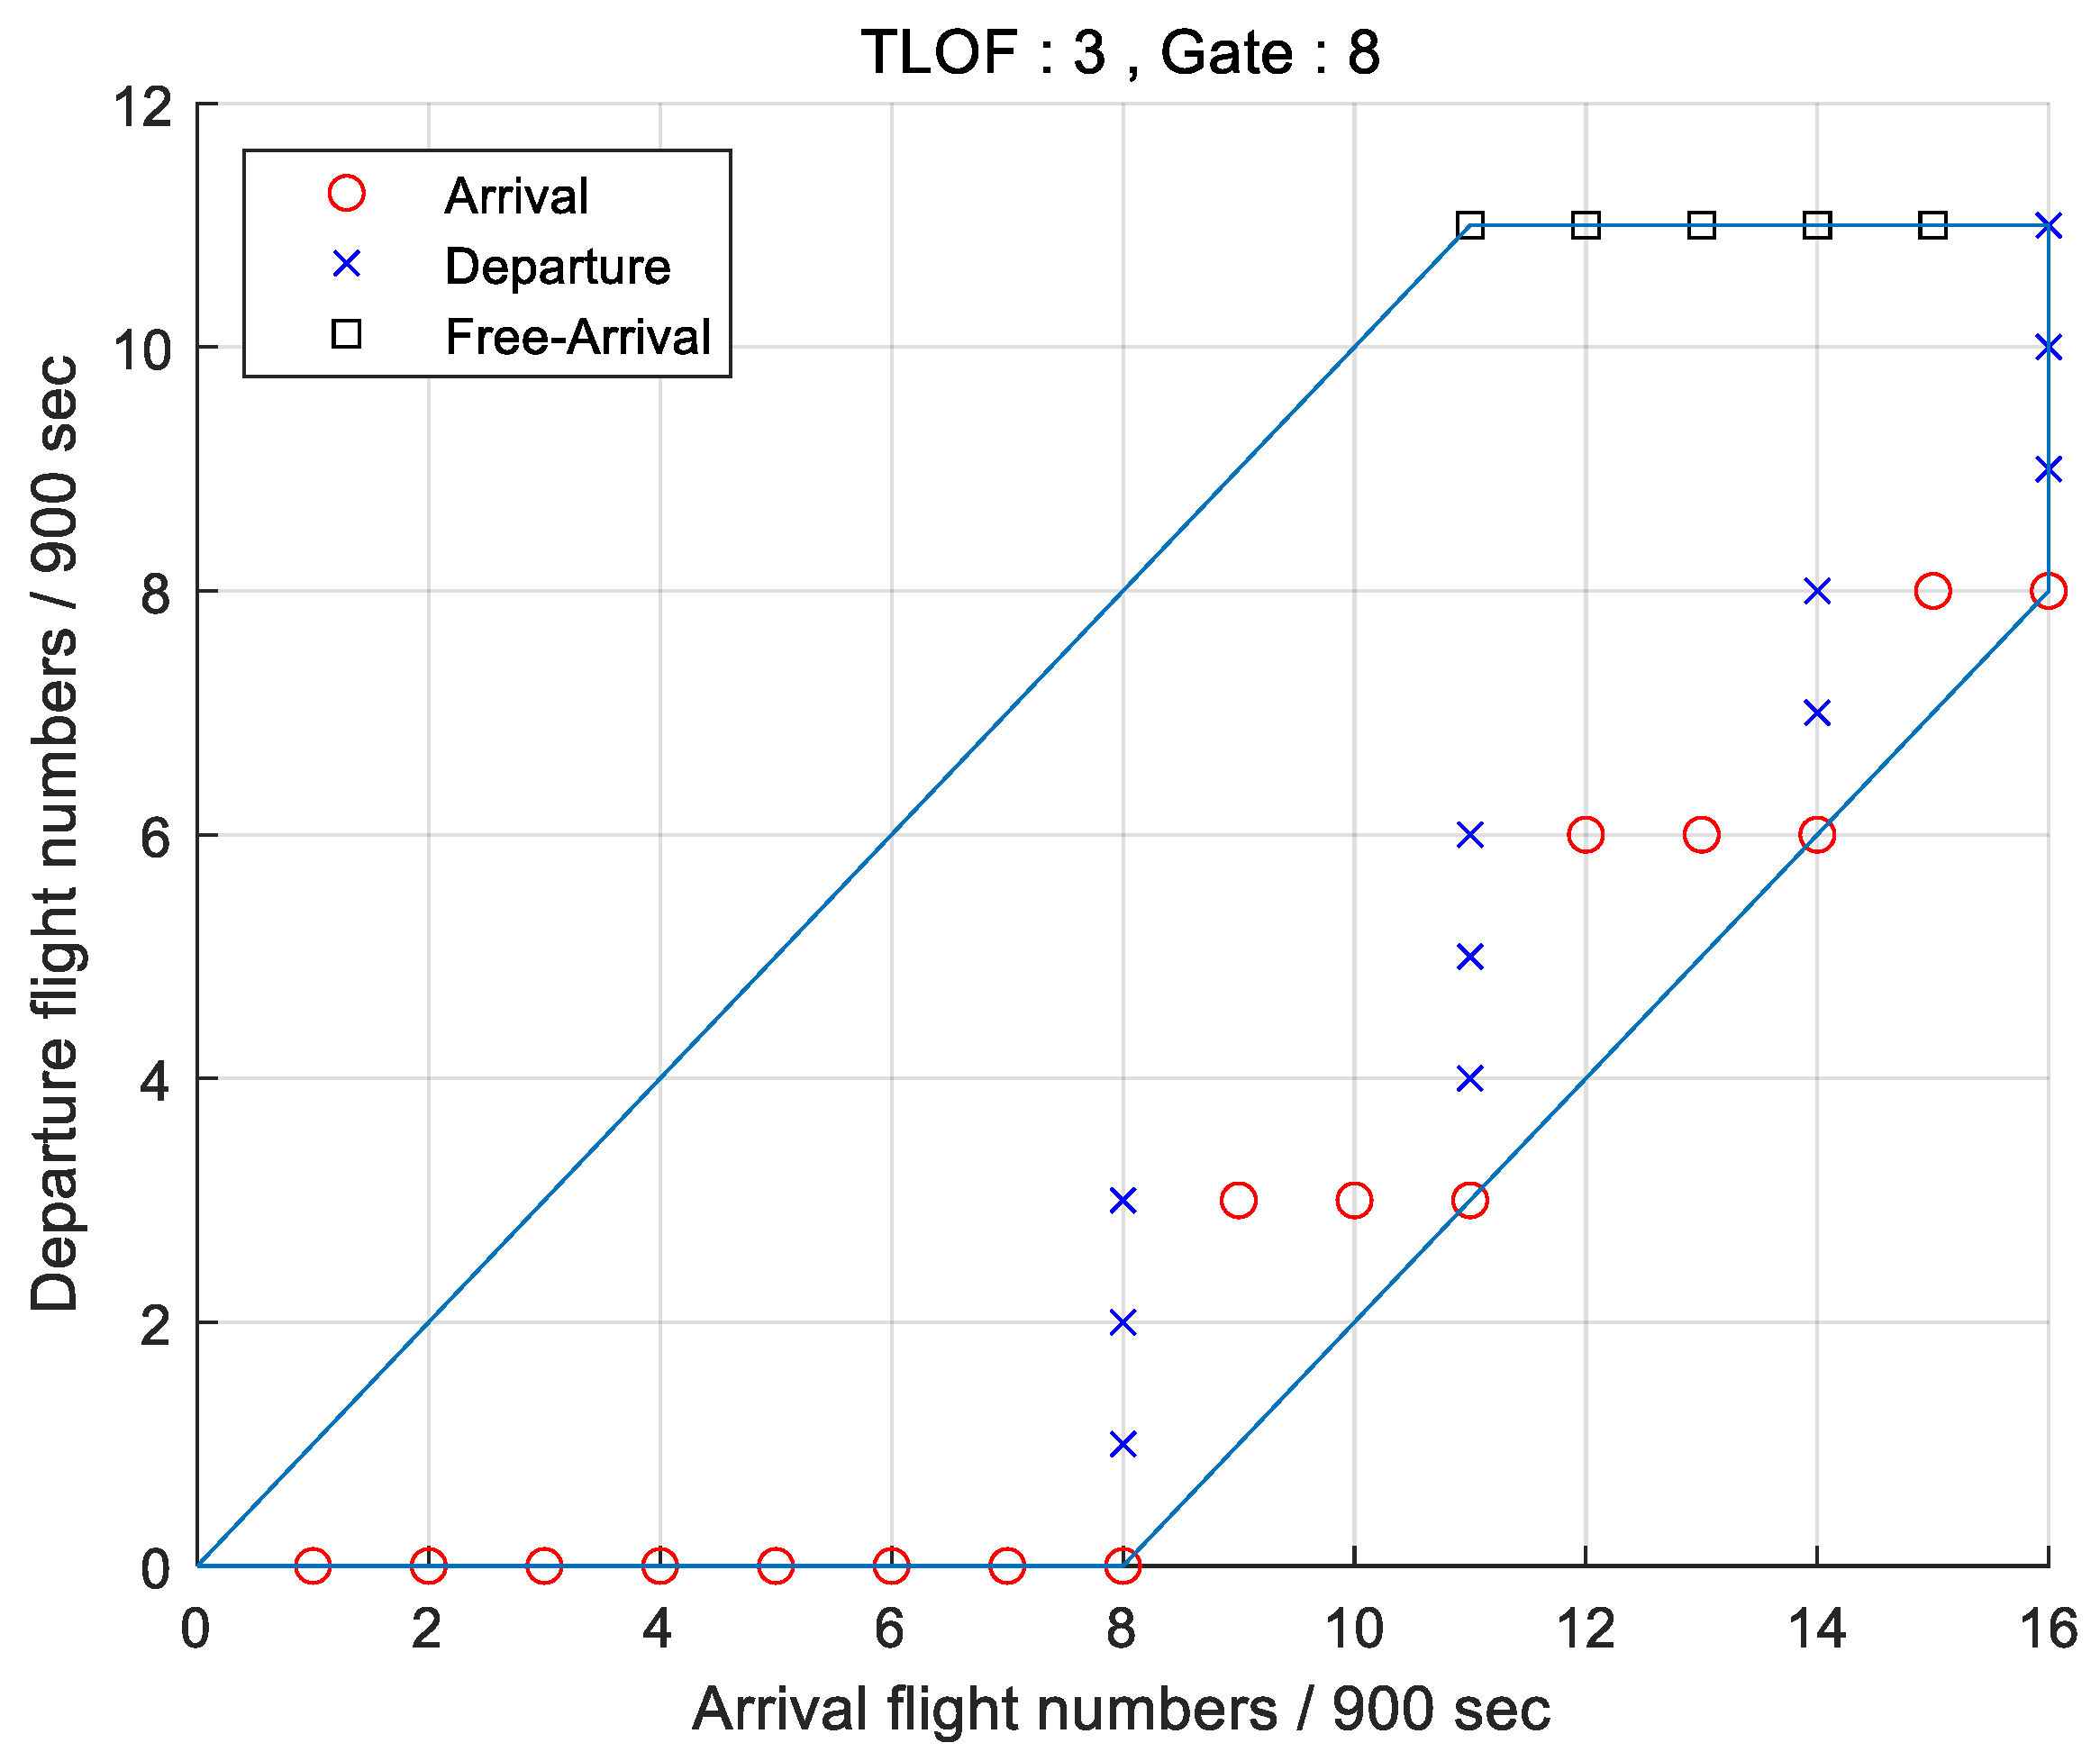
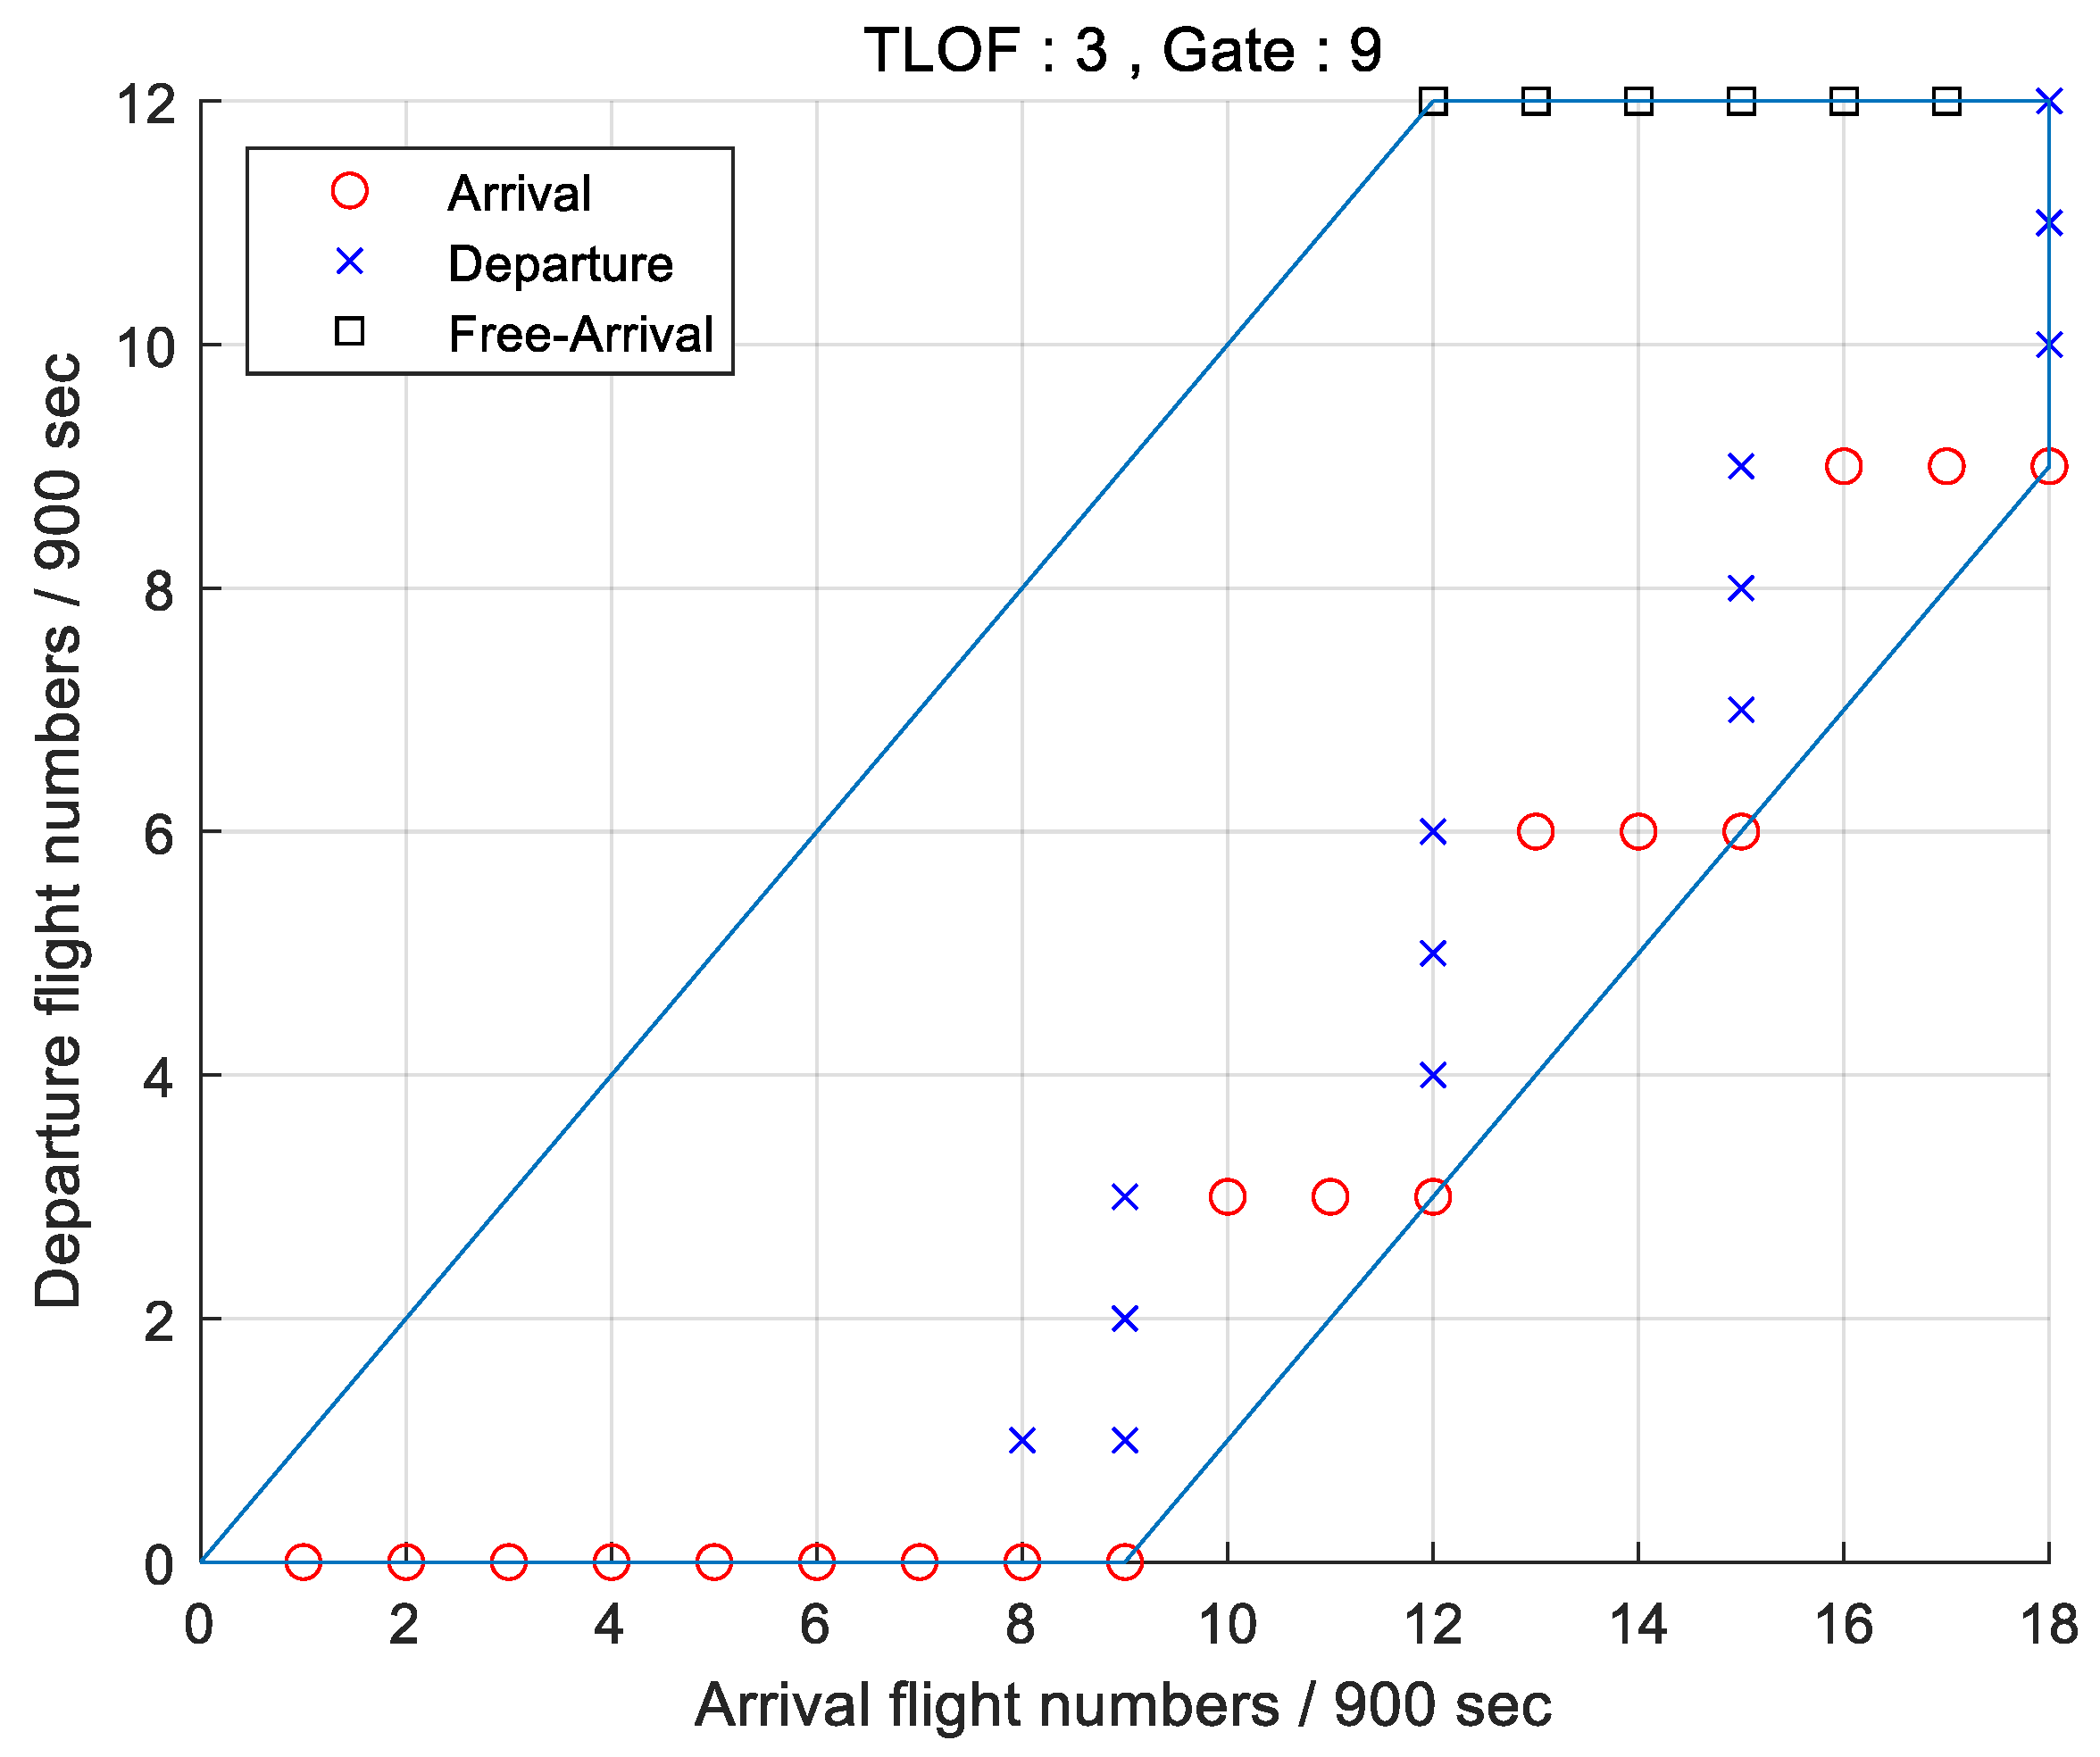
4. Capacity Analysis for Each Topology
4.1. Theoretical Background
4.2. Application to Three Kinds of Topologies
4.3. Application to Gimpo Airport
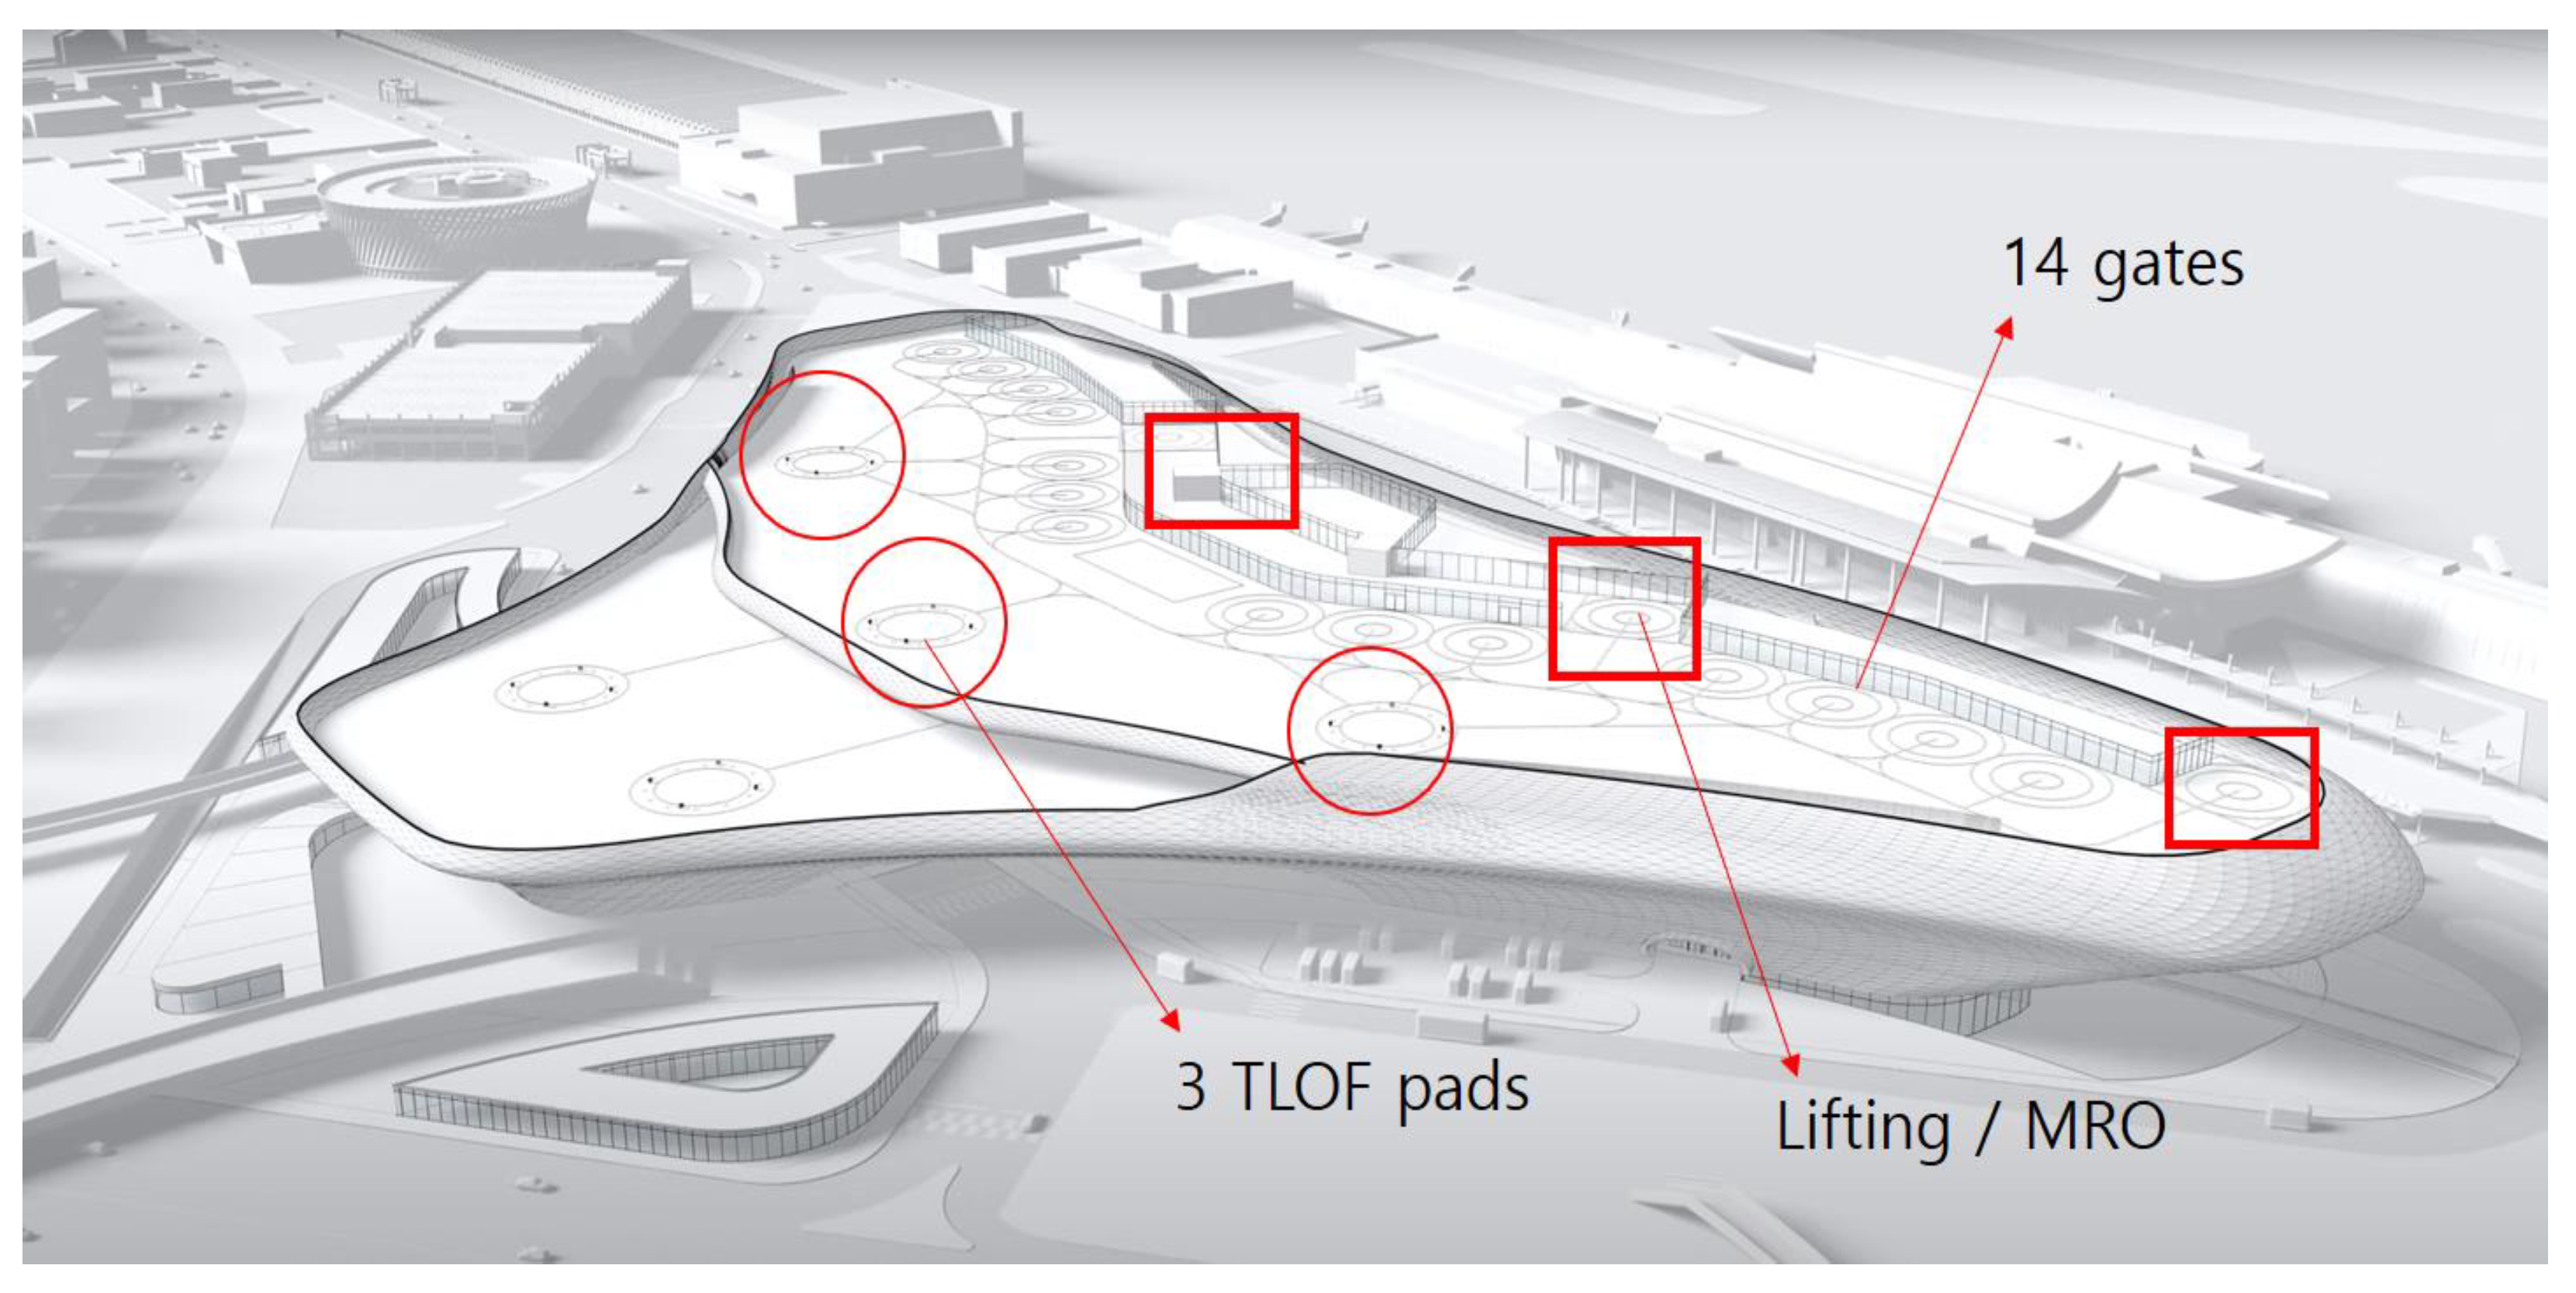
4.4. Application to the Design Proposed by Korea Airports Corporation
4.5. Results of Analysis
5. Conclusions
Author Contributions
Funding
Institutional Review Board Statement
Informed Consent Statement
Data Availability Statement
Conflicts of Interest
References
- Antcliff, K.R.; Moore, M.D.; Goodrich, K.H. Silicon Valley as an Early Adopter for On-Demand Civil VTOL Operations. In Proceedings of the 16th AIAA Aviation Technology, Integration, and Operations Conference, Washington, DC, USA, 13–17 June 2016. [Google Scholar]
- Uber Connect. Available online: https://www.corgan.com/story/uber-connect-evolved/ (accessed on 7 February 2022).
- Pickard Chilton. Available online: https://www.pickardchilton.com/work/uber-sky-tower (accessed on 7 February 2022).
- Gannett Fleming. Available online: https://archello.com/project/skyport (accessed on 7 February 2022).
- Humphreys & Partners Architects. Available online: https://humphreys.com/project/uber-elevate-2018/ (accessed on 7 February 2022).
- BOKA Powell. Available online: https://www.bokapowell.com/project/uber-air-2023-skyport-mobility-hub-concepts/ (accessed on 7 February 2022).
- Vascik, P.D.; Hansman, R.J. Development of Vertiport Capacity Envelopes and Analysis of their Sensitivity to Topological and Operational Factors. In Proceedings of the 16th AIAA Aviation Technology, Integration, and Operations Conference, San Diego, CA, USA, 7–11 January 2019. [Google Scholar]
- MATLAB. Available online: https://kr.mathworks.com/products/matlab.html (accessed on 7 February 2022).
- Zelinski, S. Operational Analysis of Vertiport Surface Topology. In Proceedings of the 2020 AIAA/IEEE 39th Digital Avionics Systems Conference (DASC), San Antonio, TX, USA, 11–15 October 2020. [Google Scholar]
- Federal Aviation Administration, Heliport Design, AC No: 150/5390-2C, 4/24/2012. Available online: https://www.faa.gov/airports/resources/advisory_circulars/index.cfm/go/document.current/documentnumber/150_5390-2 (accessed on 7 February 2022).
- Gurreiro, N.M.; Butler, R.W.; Maddalon, J.M.; Hagen, G.E. Capacity and Throughput of Urban Air Mobility Vertiports with a First-Come, First-Served Vertiport Scheduling Algorithm. In Proceedings of the AIAA Aviation Forum, Virtual Event, 15–19 June 2020. [Google Scholar]
- Vázquez, M.H. Vertiport Sizing and Layout Planning through Integer Programming in the Context of Urban Air Mobility. Master’s Thesis, Technical University of Munich, Munich, Germany, 2021. [Google Scholar]
- Schweiger, K.; Knabe, F.; Korn, B. An exemplary definition of a vertidrome’s airside concept of operations. Aerisp. Sci. Technol. 2021, 125, 107144. [Google Scholar] [CrossRef]
- Michael, A.P.; Meyers, P.E. Engineering Brief No. 105, Vertiport Design. Memorandum, Airport Engineering Division, AAS-100, Federal Aviation Administration, 2022. Available online: https://www.faa.gov/airports/engineering/engineering_briefs/drafts/media/eb-105-vertiport-design-industry-draft.pdf (accessed on 5 March 2022).
- European Union Safety Agency. Prototype Technical Specifications for the Design of VFR Vertiports for Operation with Manned VTOL-Capable Aircraft Certified in the Enhanced Category. Vertiports, PTS-VPT-DSN, Cologne Germany, March 2022. Available online: https://www.easa.europa.eu/document-library/general-publications/prototype-technical-design-specifications-vertiports (accessed on 5 March 2022).
- Smith, R.D. Heliport/Vertiport Design Deliberations 1997–2000; Federal Aviation Administration: Washington, DC, USA, 2001.
- Federal Aviation Administration. Standard Specifications for Construction of Airports, AC No: 150/5370-10H, 12/21/2018. Available online: https://www.faa.gov/airports/resources/advisory_circulars/index.cfm/go/document.current/documentnumber/150_5370-10 (accessed on 7 February 2022).
- Federal Aviation Administration. Air Traffic Control, ORDER JO 7110.65Z, 17 June 2021. Available online: https://www.faa.gov/regulations_policies/orders_notices/index.cfm/go/document.current/documentnumber/7110.65 (accessed on 7 February 2022).
- SHoP Architecs. Available online: https://www.shoparc.com/projects/uber-air/ (accessed on 7 February 2022).
- Naver Map. Available online: https://map.naver.com/v5/?c=14115800.6594852,4517340.1382280,16,0,0,0,dh (accessed on 7 February 2022).
- Korea Airports Corporation. Available online: https://www.youtube.com/watch?v=oFlb176OM5k&t=90s&ab_channel=%ED%95%9C%EA%B5%AD%EA%B3%B5%ED%95%AD%EA%B3%B5%EC%82%AC (accessed on 7 February 2022).
- Parker, D. Vascik, Systems Analysis of Urban Air Mobility Operational Scaling. Ph.D. Thesis, Massachusetts Institute of Technology, Cambridge, MA, USA, 2020. [Google Scholar]


| Components | Regulation | Dimension |
|---|---|---|
| TLOF pad | CD | 18.4 m |
| FATO | 2 × CD | 36.8 m |
| Safety Area | 3 × CD (1/2 CD added to edge of FATO) | 55.2 m |
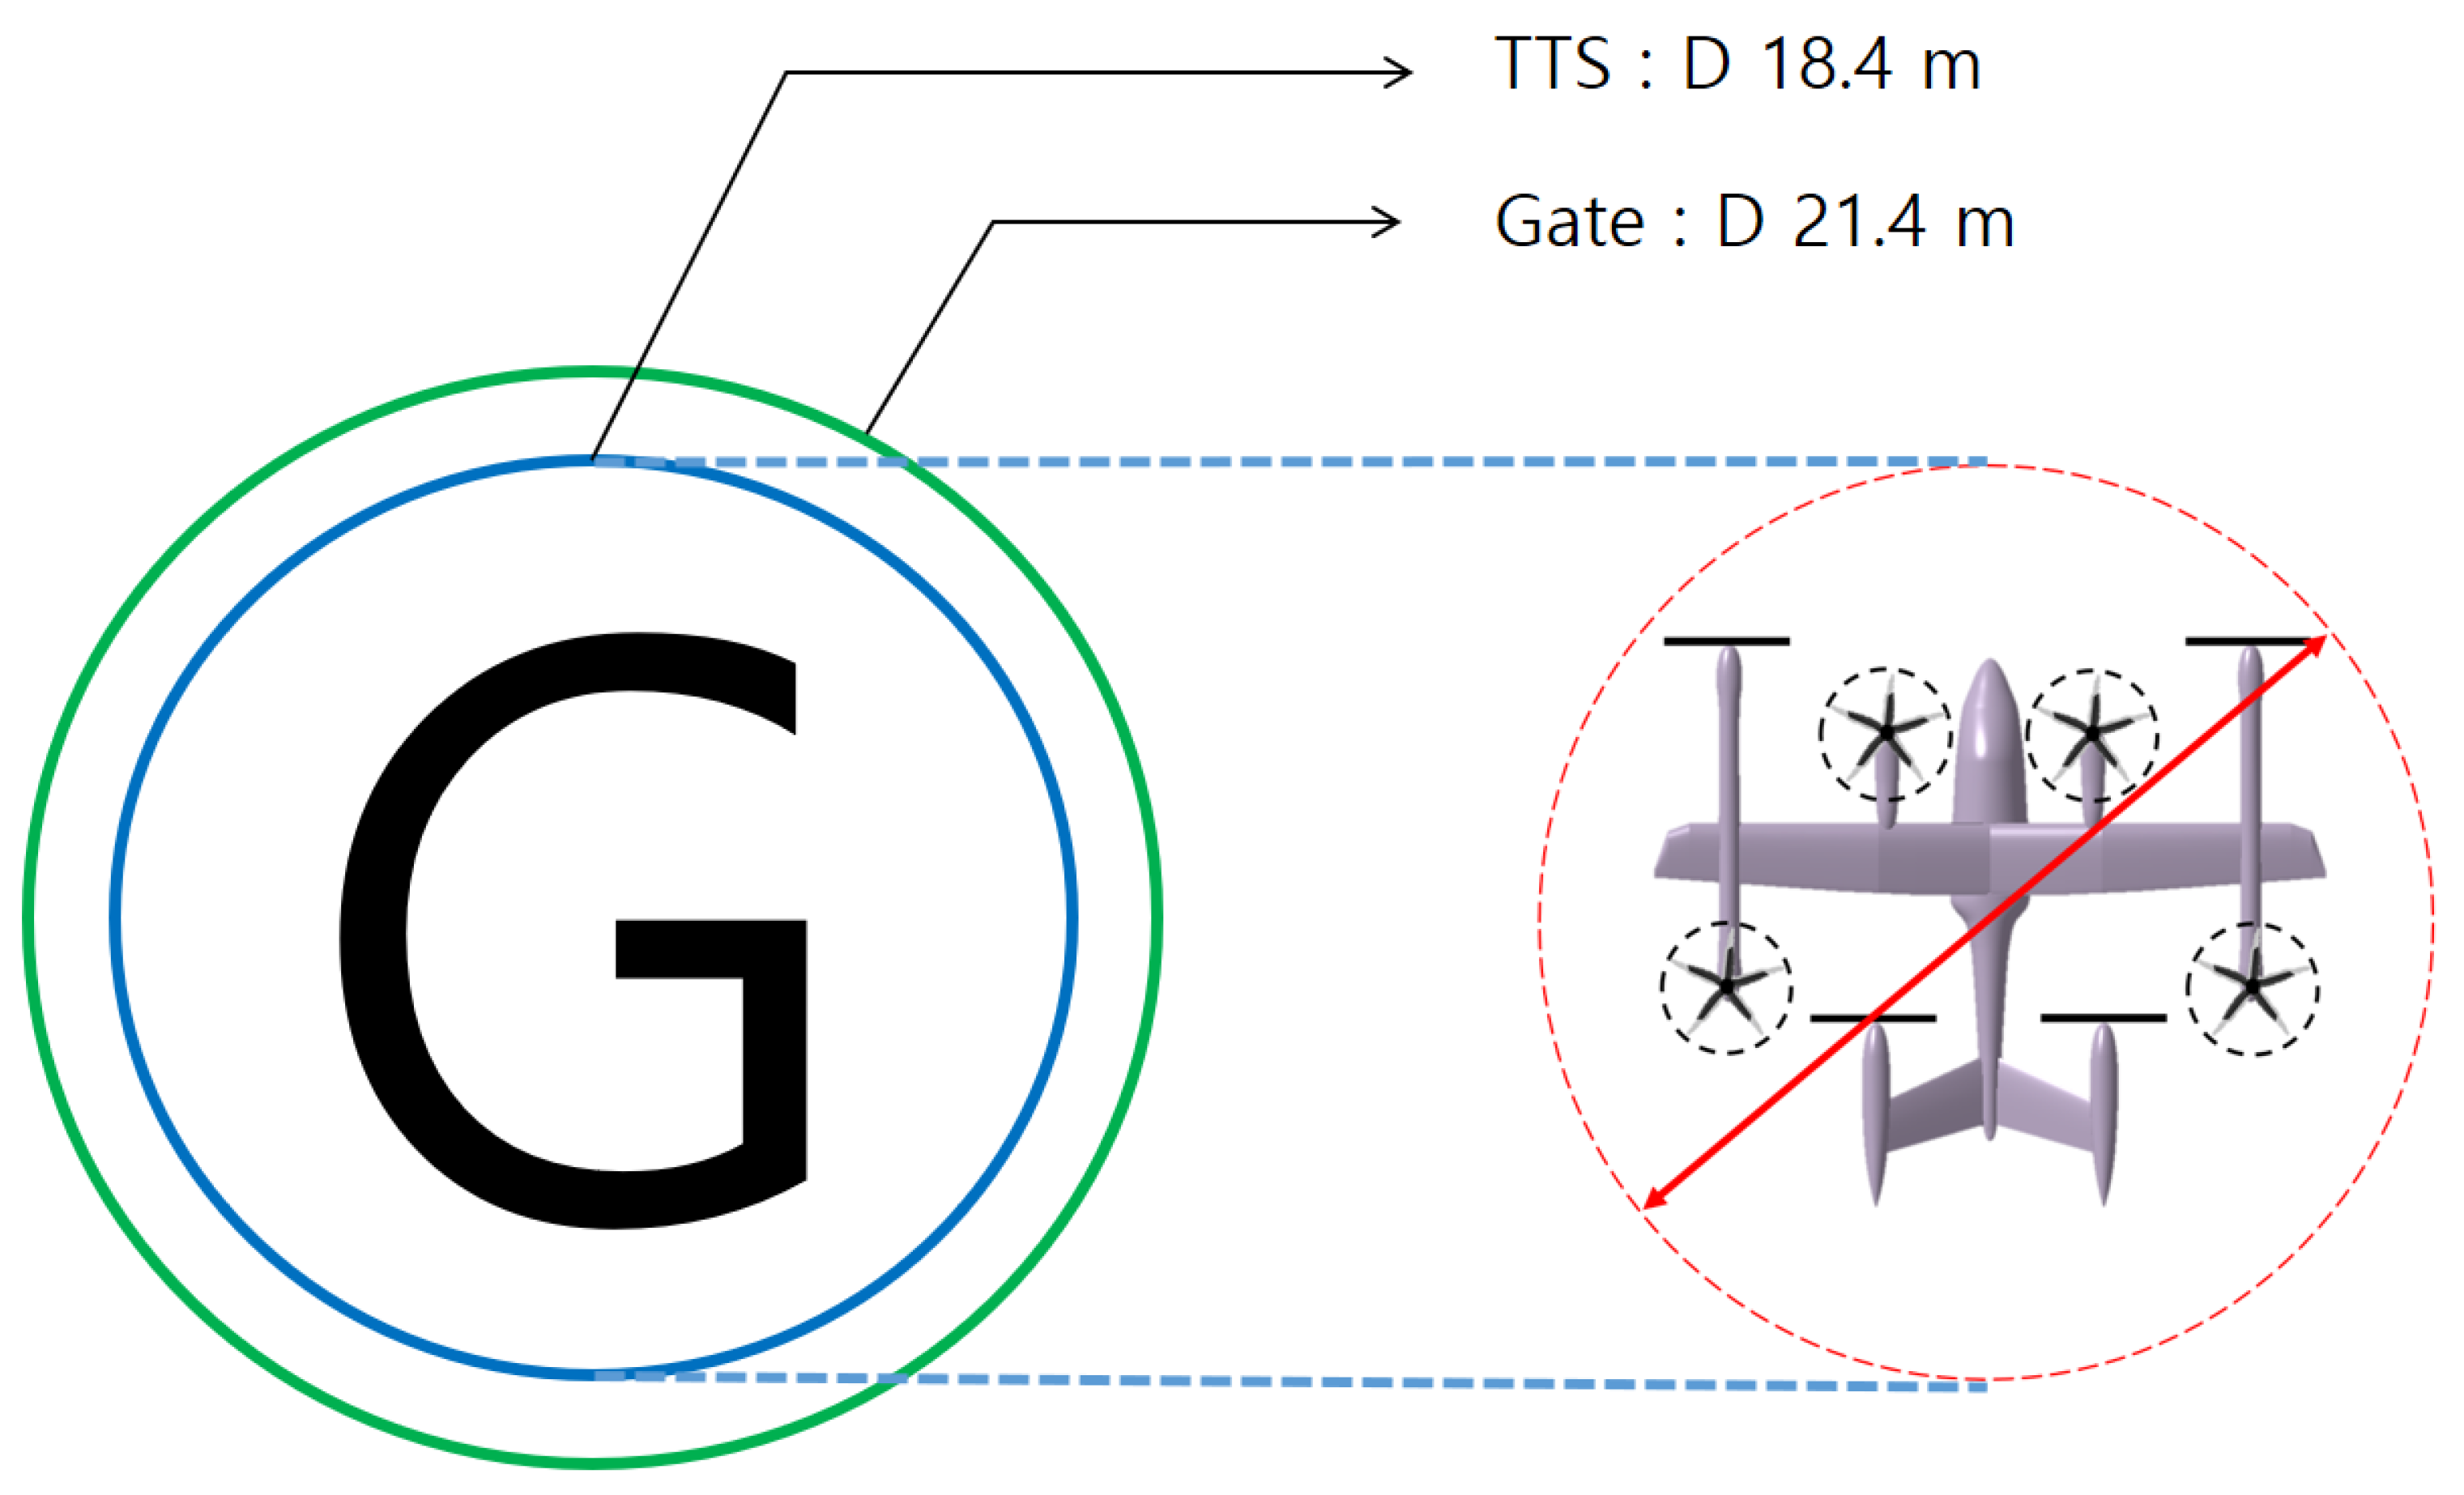
| Gate | CD + 10 ft | 21.4 m |
| Taxiway Width | CD + 1/2 CD | 27.6 m |
| Components | Regulation | Dimension |
|---|---|---|
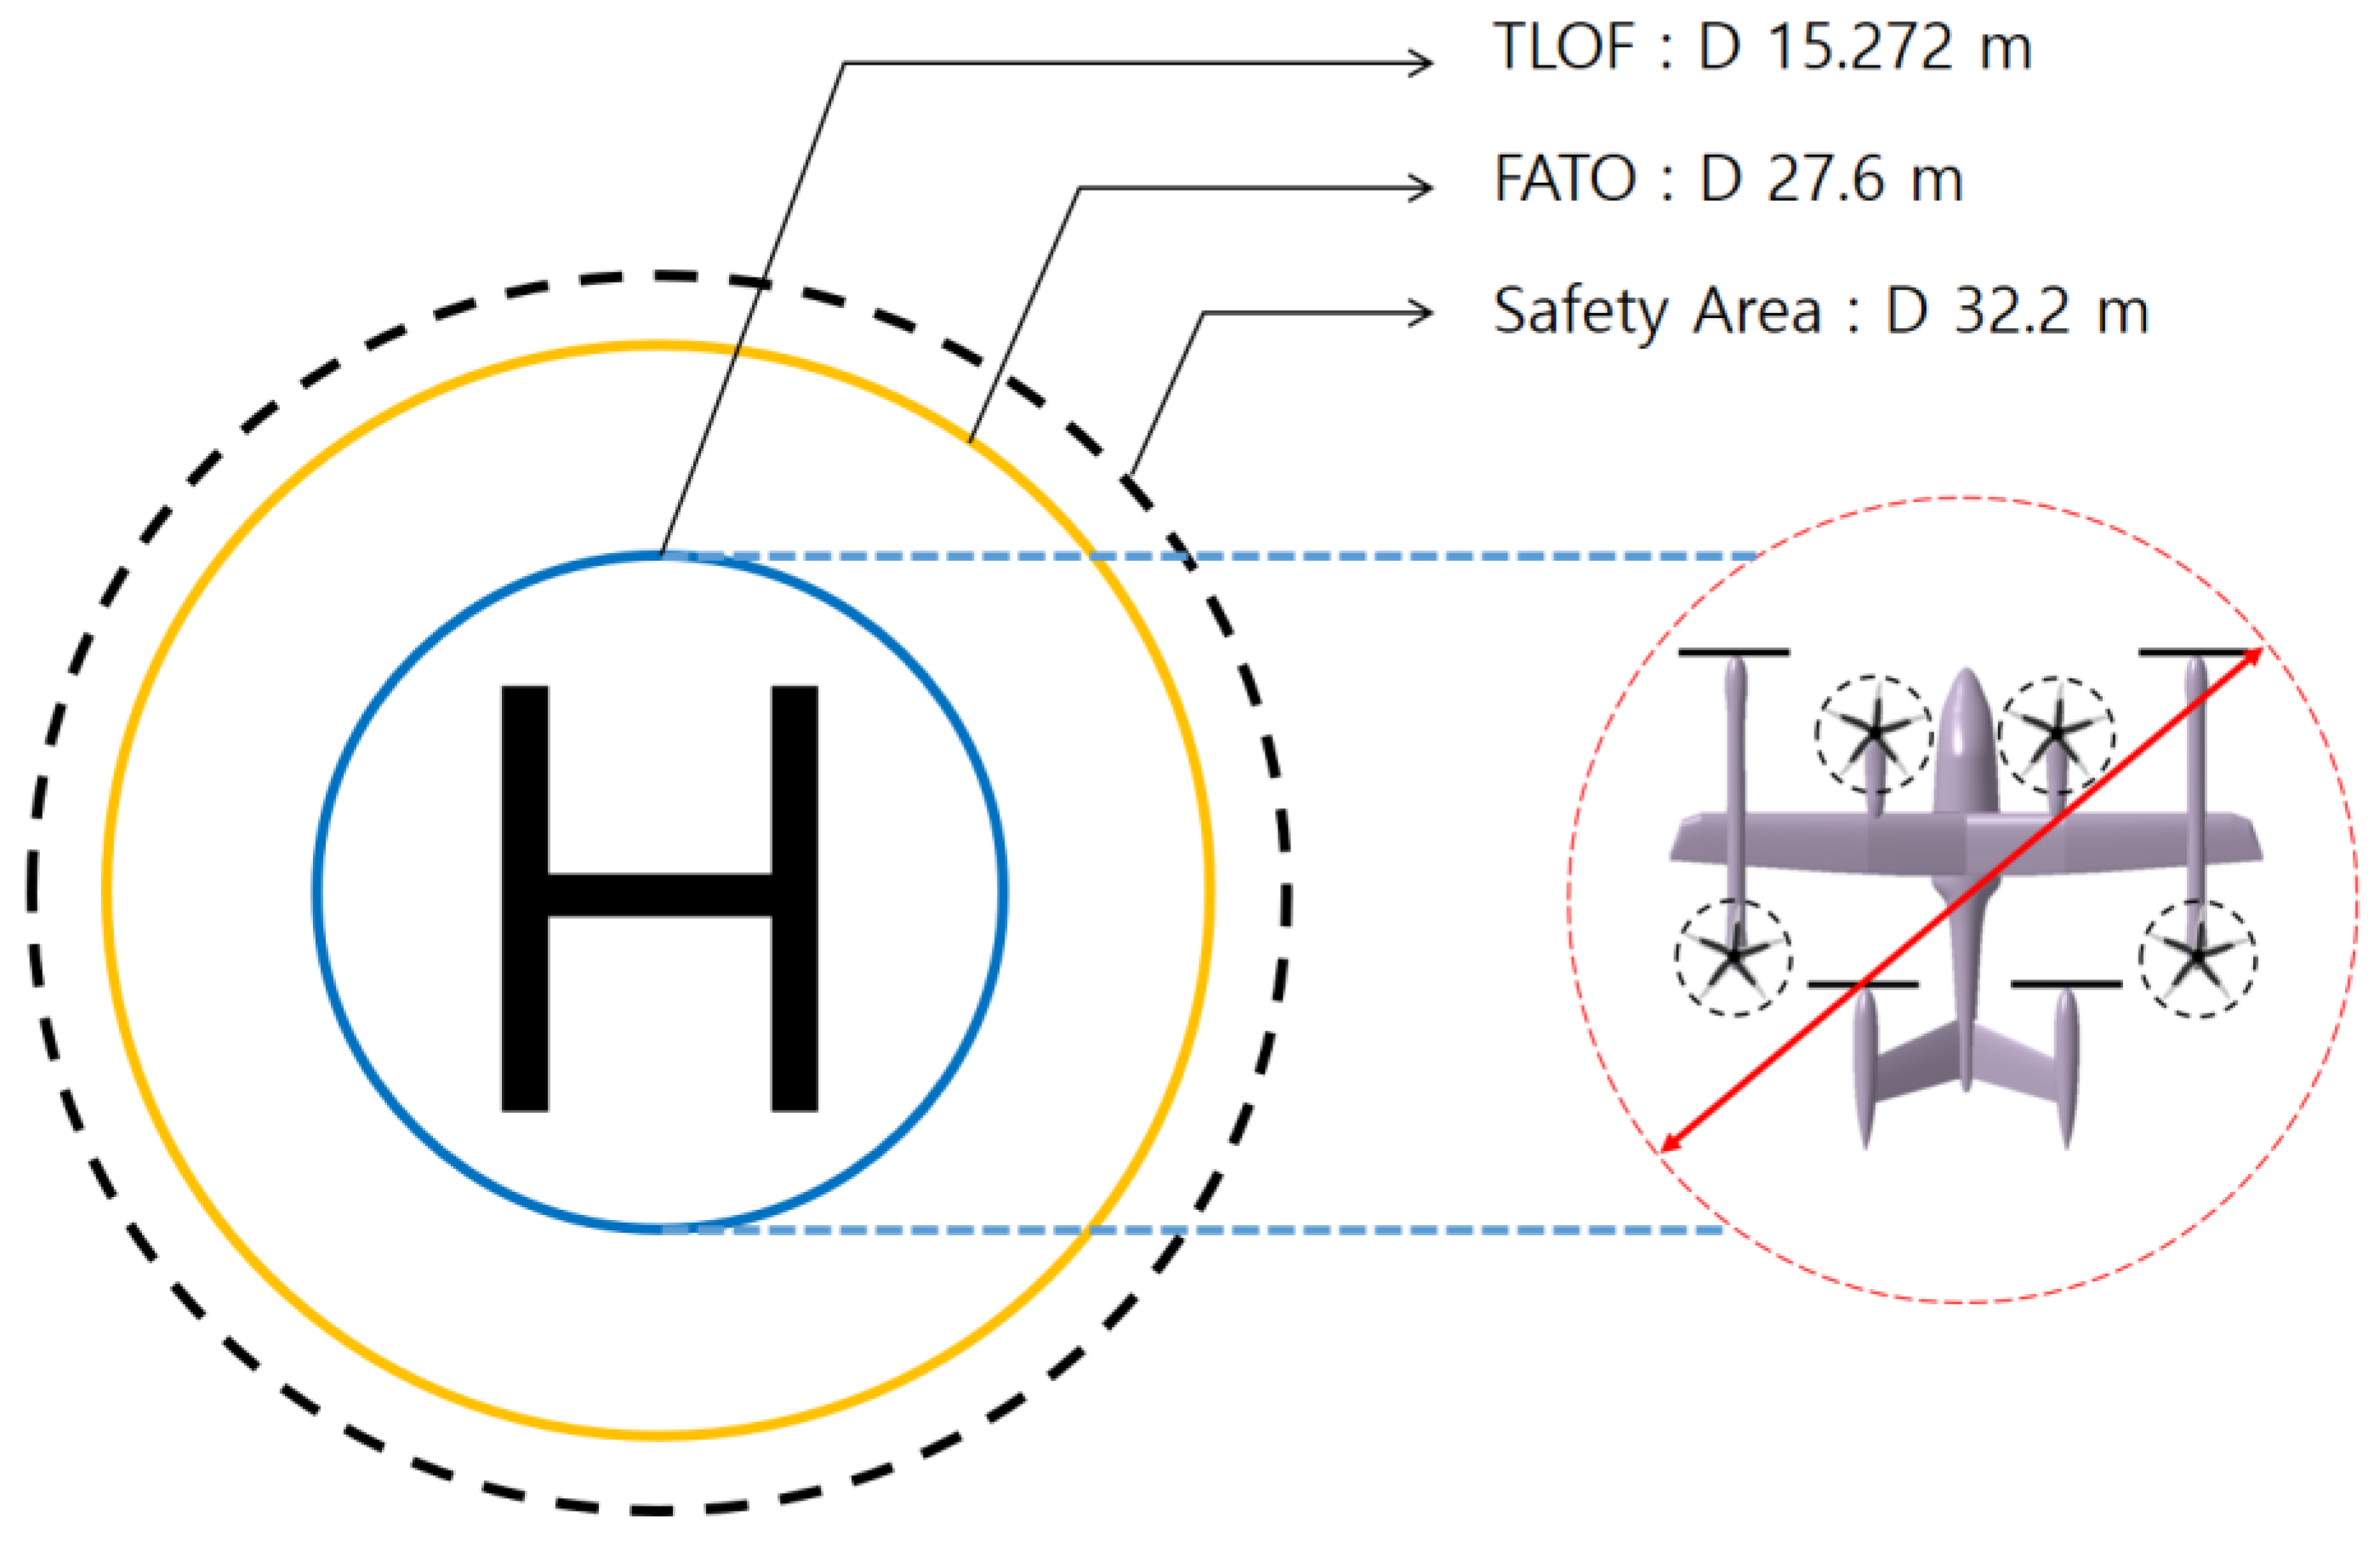
| TLOF pad | 0.83 × CD | 15.272 m |
| FATO | 1.5 × CD | 27.6 m |
| Safety Area | FATO + max(3 m, 0.25 × CD) | 32.2 m |
| Gate | 1.2 × CD | 22.08 m |
| Taxiway Width | 1.5 × CD | 27.6 m |
| Variable | Meaning |
|---|---|
| Capacity of TLOF pads | |
| Capacity of gates | |
| Capacity of taxiways | |
| Number of TLOF pads of vertiport | |
| Number of gates of vertiport | |
| Number of completed arrivals at n-th gate | |
| Number of completed departures at n-th gate | |
| Number of completed taxing operation | |
| Turnaround time at n-th gate | |
| Gate holding time at n-th gate | |
| Operation time |
| Components | Slope Design Categories | ||
|---|---|---|---|
| Length of inner edge | Width of Safety Area | Width of Safety Area | Width of Safety Area |
| Length | 3386 m | 245 m | 1220 m |
| Slope | 4.5% (1:22.2) | 8% (1:12.5) | 12.5% (1:8) |
| Transitional Surface Slope | 50% (1:2) | 50% (1:2) | 50% (1:2) |
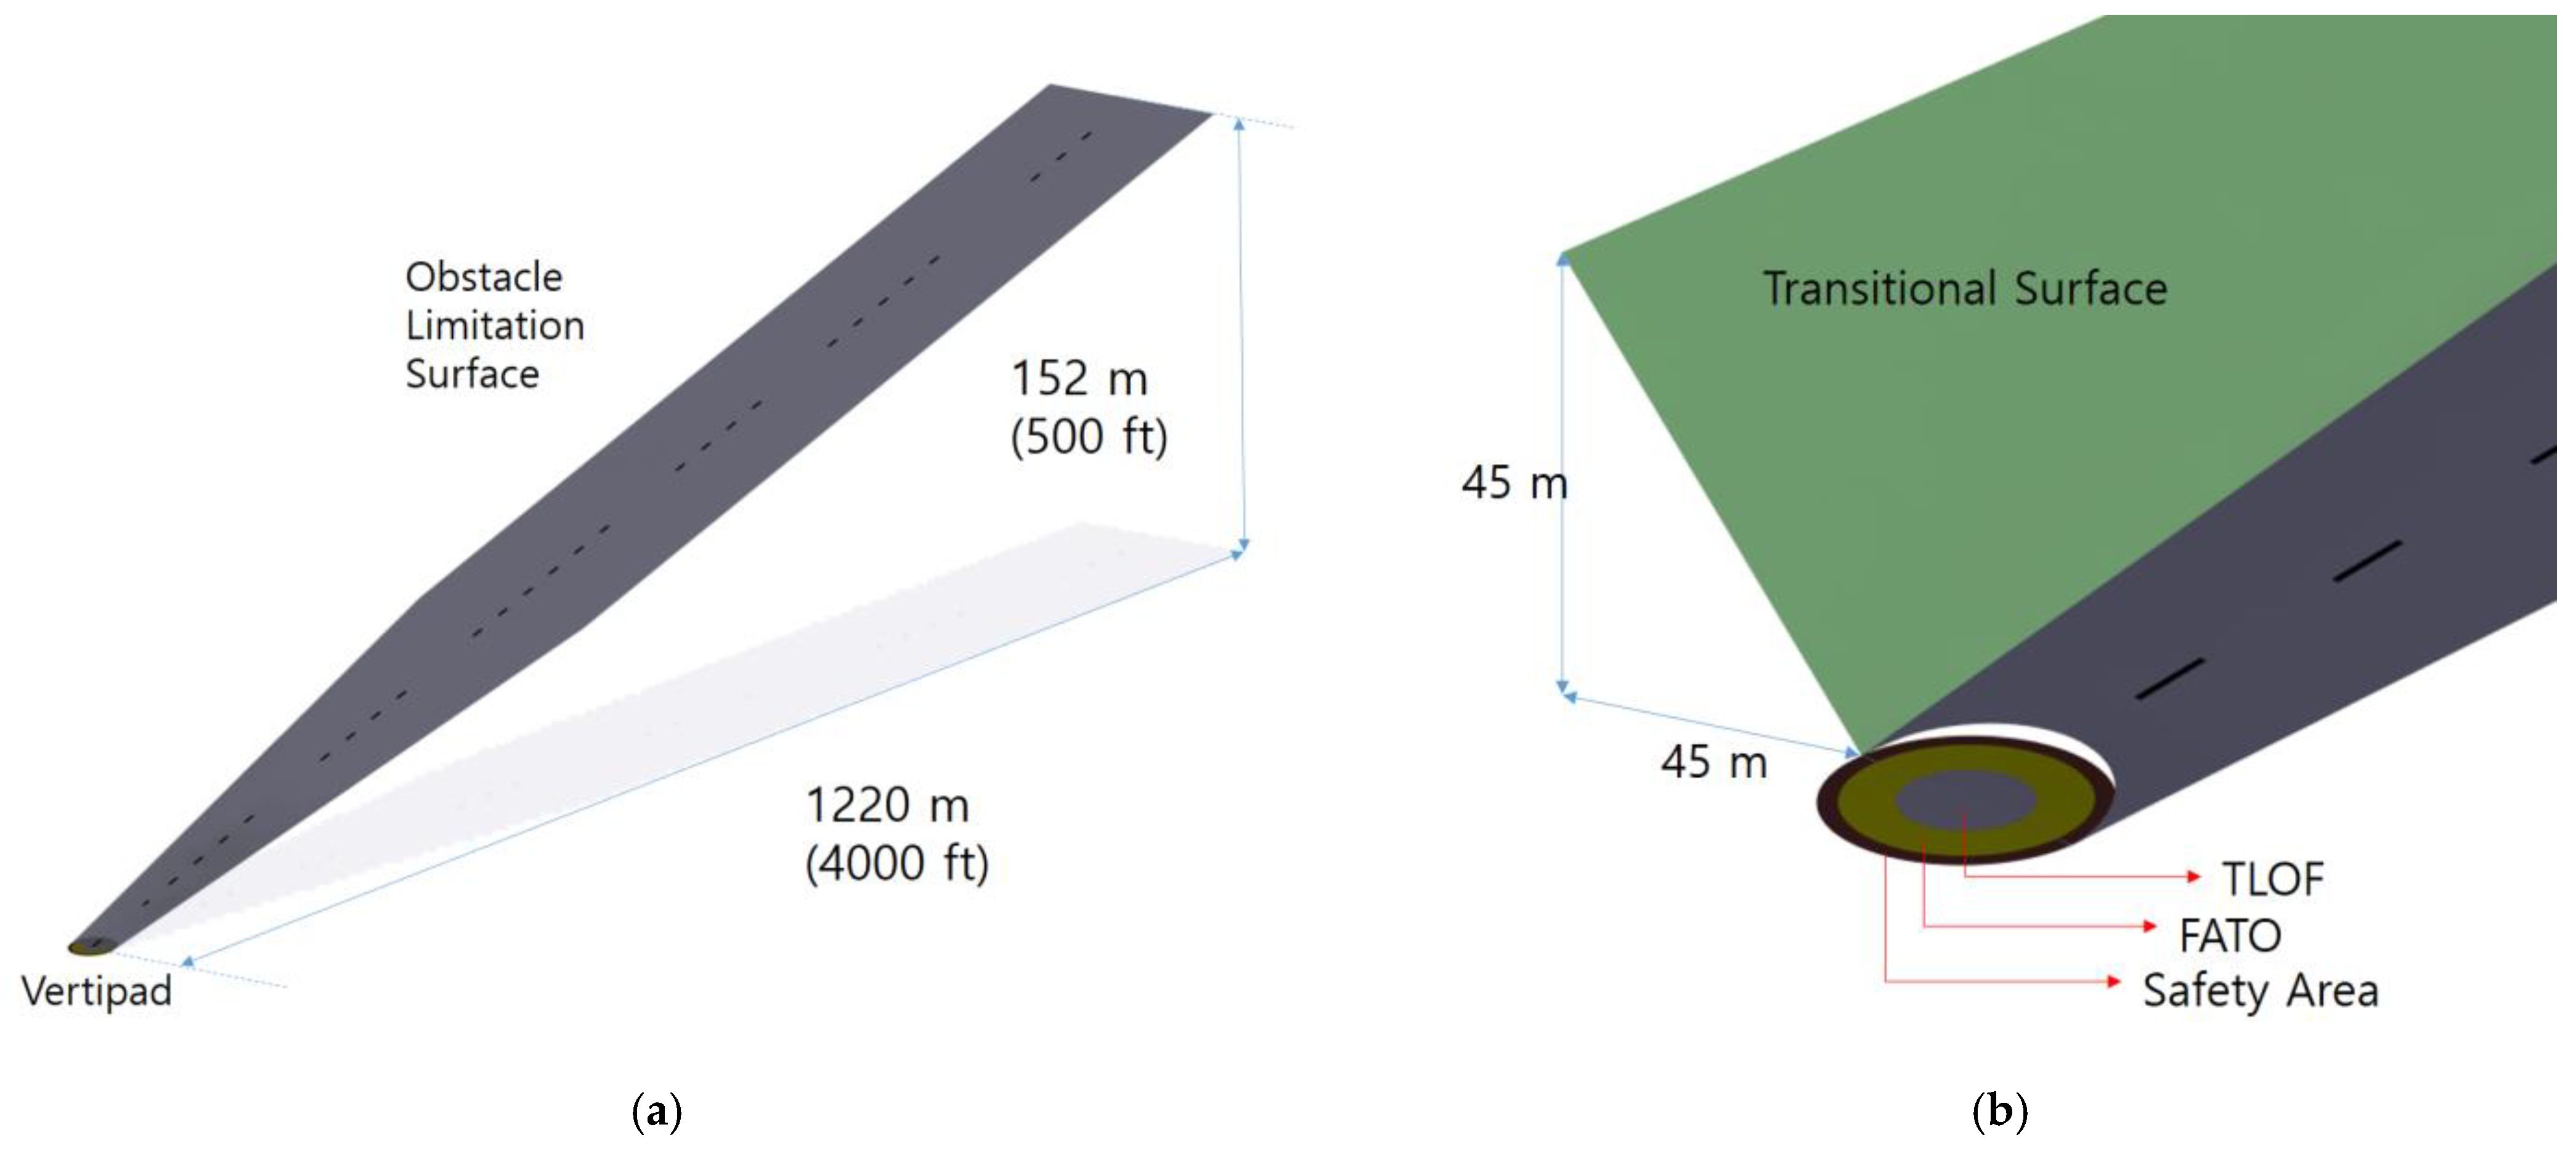
| Transitional Surface Height | 45 m | 45 m | 45 m |
| Time Spending | Time (s) |
|---|---|
| Arrival | 60 |
| Taxi-in | 15 |
| Turnaround | 300 |
| Taxi-out | 15 |
| Departure | 60 |
| Number of TLOF Pads | 1 |
|---|---|
| Number of gates | 4 |
| TLOF pad utilization (%) | 91.7 |
| Gate utilization (%) | 61.9 |
| Gate holding (%) | 8.3 |
| Maximum number of passengers per hour | 80 |
| Topology | Number of TLOF Pads | Number of Gates | TLOF Pad Utilization (%) | Gate Utilization (%) |
|---|---|---|---|---|
| Linear | 2 | 6 | 83.3 | 72.4 |
| Satellite | 4 | 16 | 91.7 | 43.4 |
| Pier | 2 | 12 | 100 | 55.5 |
| Topology | Number of TLOF Pads | Number of Gates | TLOF Pad Utilization (%) | Gate Utilization (%) |
|---|---|---|---|---|
| Linear | 3 | 8 | 75 | 53.6 |
| Satellite | 4 | 18 | 95.8 | 43.2 |
| Pier | 3 | 13 | 94.4 | 53.5 |
| Topology | Number of TLOF Pads | Number of Gates | TLOF Pad Utilization (%) | Gate Utilization (%) |
|---|---|---|---|---|
| Linear | 3 | 8 | 75 | 70.2 |
| Satellite | 3 | 9 | 83.3 | 69.4 |
| Pier | 3 | 11 | 88.9 | 54.2 |
| Topology | Number of TLOF Pads | Number of Gates | TLOF Pad Utilization (%) | Gate Utilization (%) |
|---|---|---|---|---|
| Linear | 4 | 8 | 58.3 | 54.8 |
| Satellite | 2 | 7 | 87.5 | 52.2 |
| Pier | 4 | 20 | 100 | 57.5 |
| Sections | Standard | Applied Value |
|---|---|---|
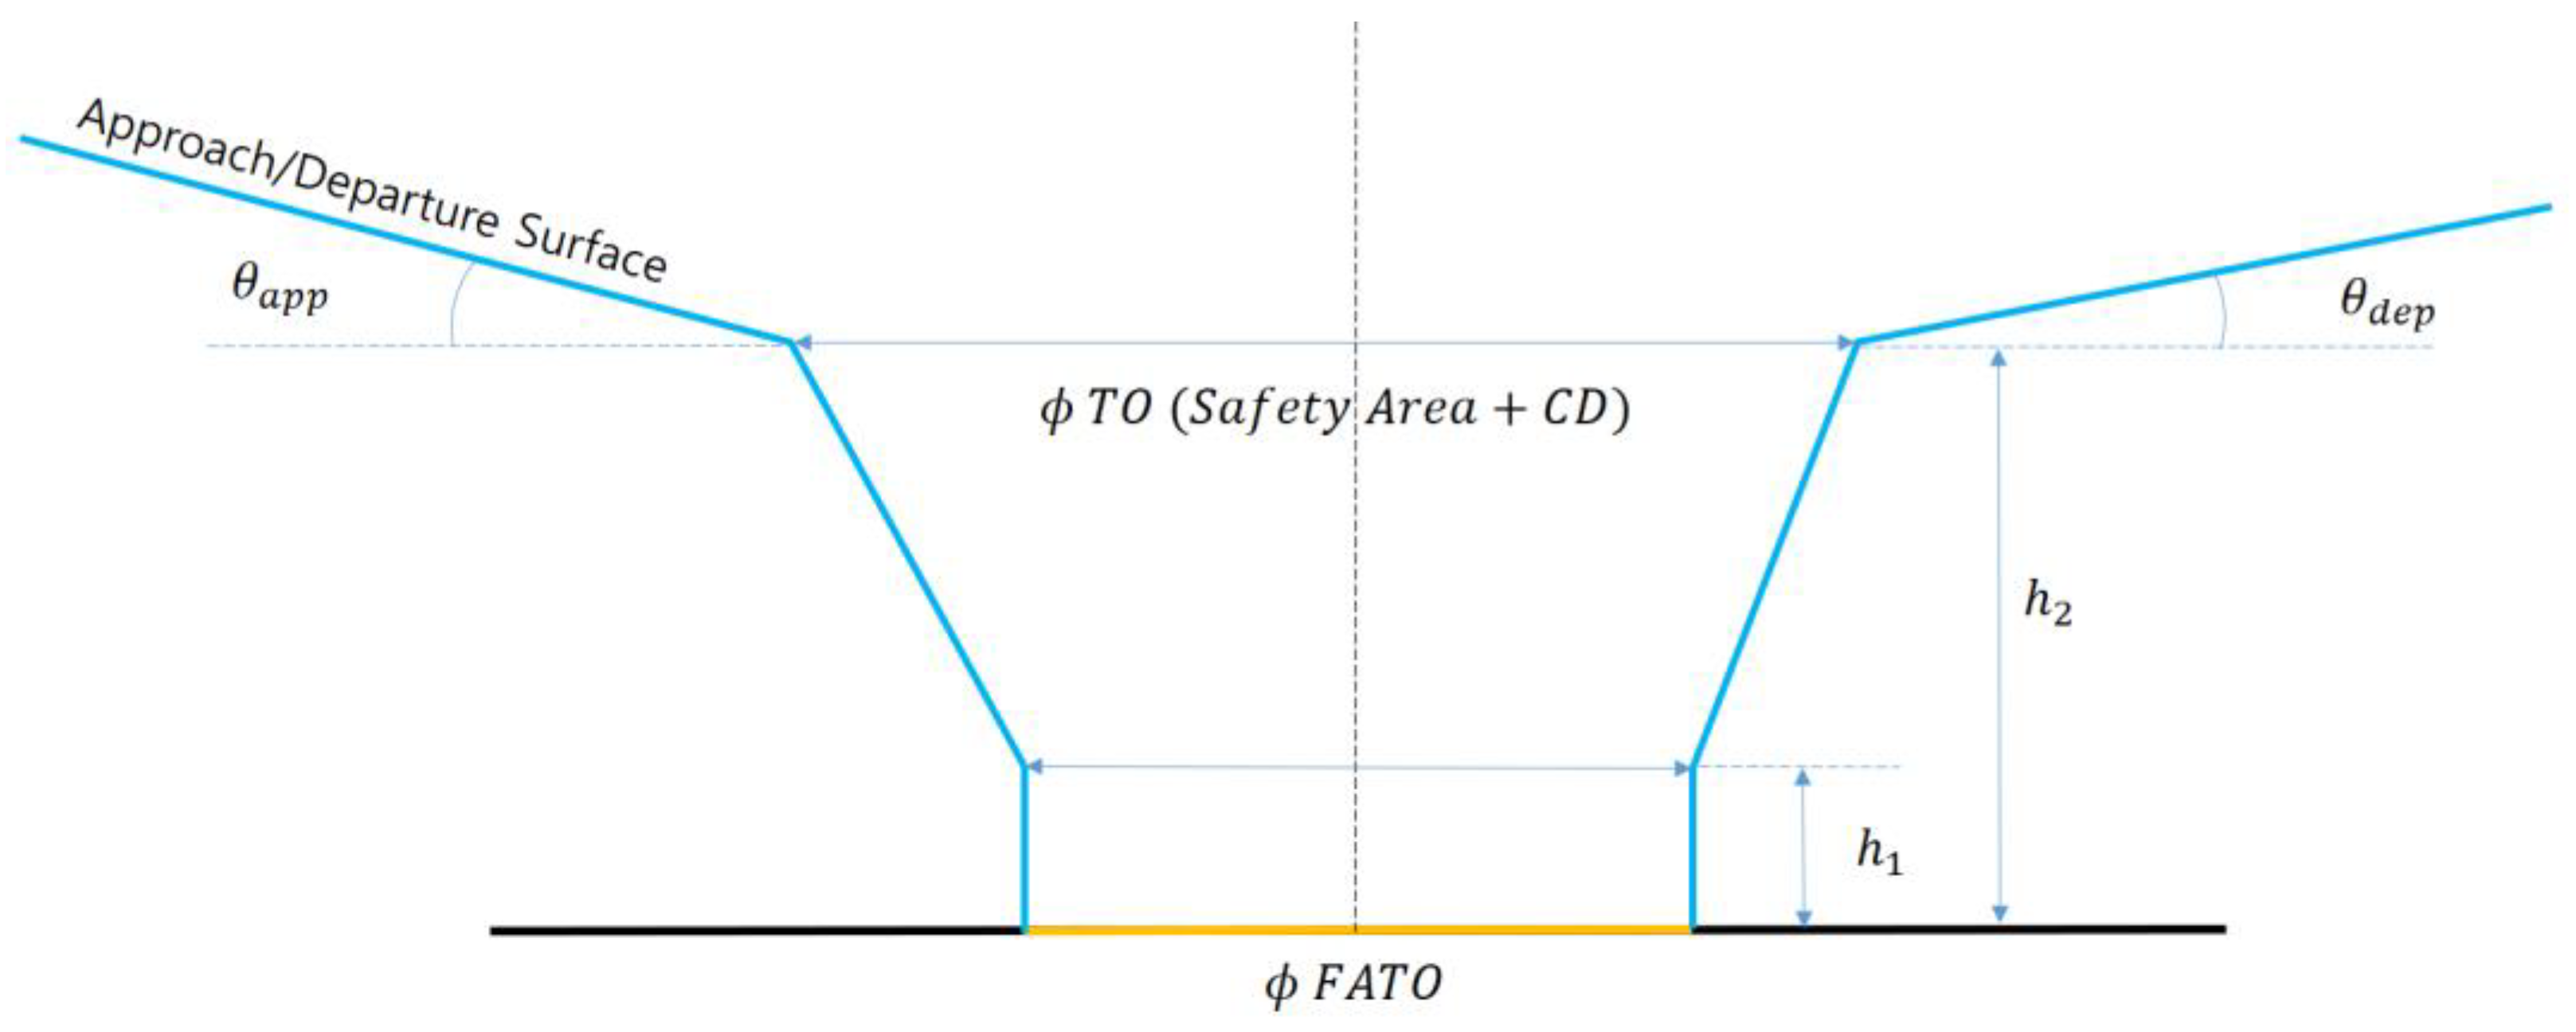
| Approach/departure surface | 1:8 (12.5%) | 1:8 (12.5%) |
| Safety area + CD | 50.6 m | |
| 2 × CD | 27.6 m | |
| - | 3 m | |
| 30.5 m |
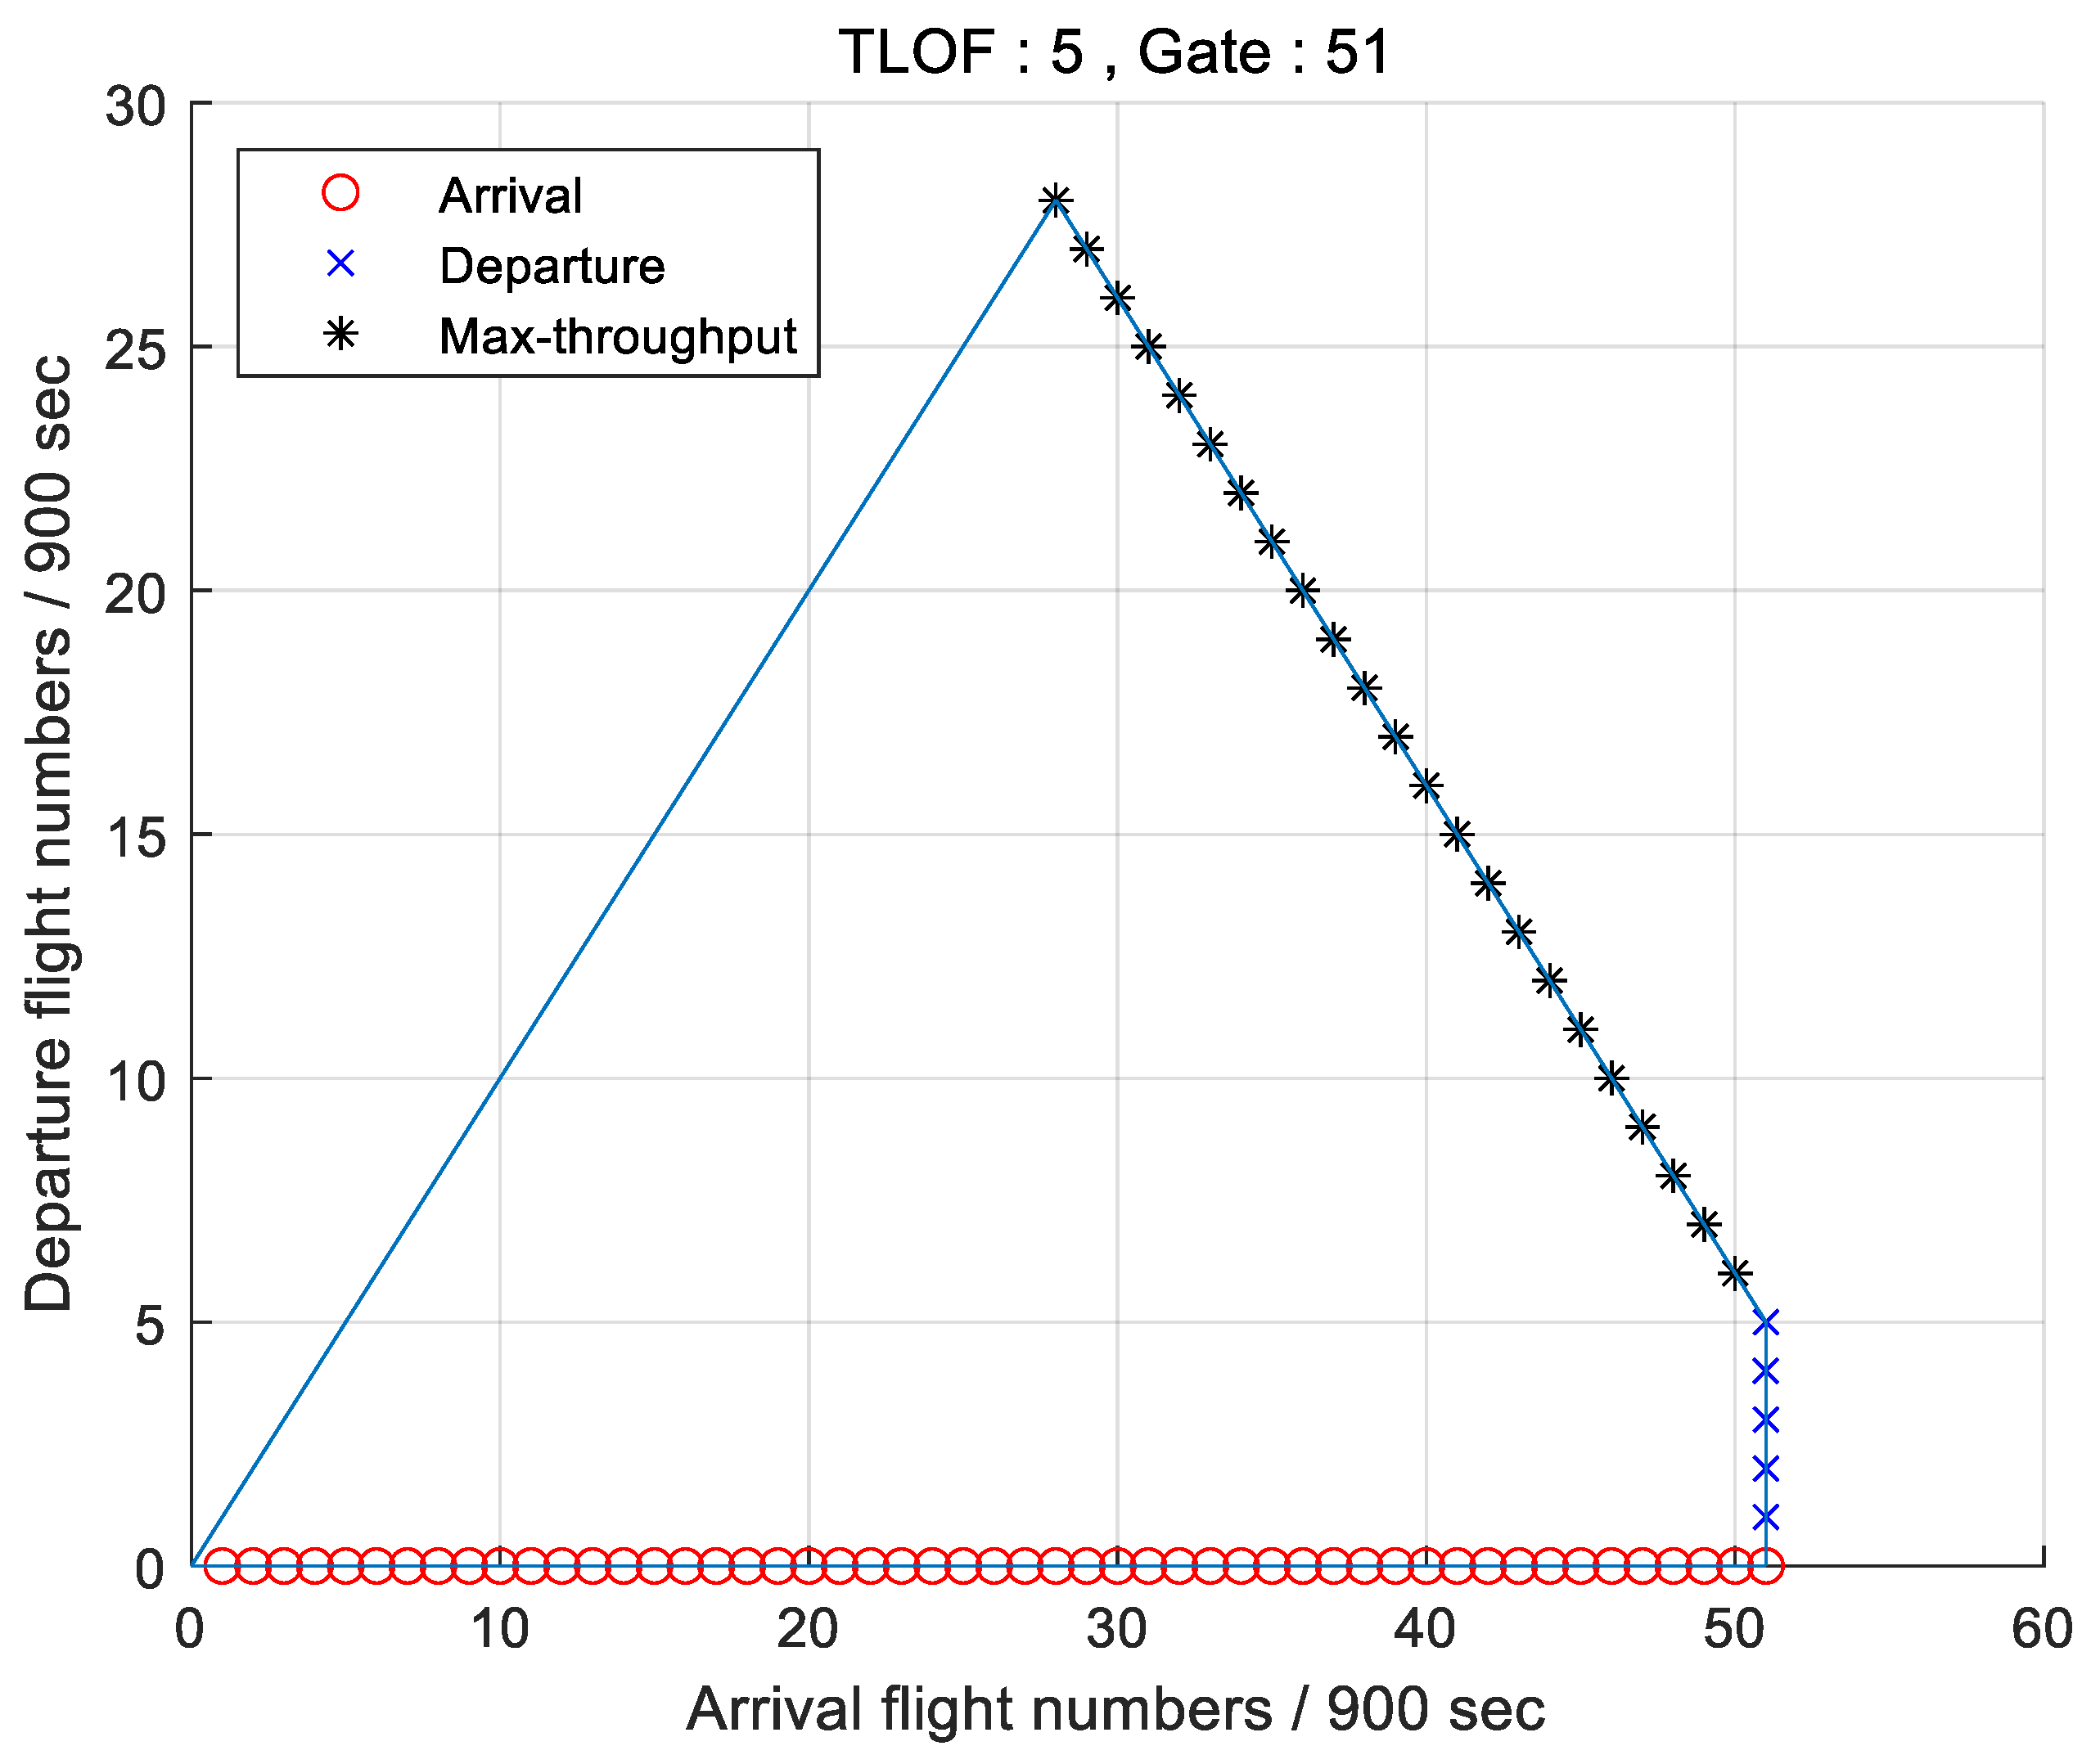
| Number of TLOF Pads | 5 |
|---|---|
| Number of gates | 51 |
| TLOF pad utilization (%) | 93.3 |
| Gate utilization (%) | 41.0 |
| Gate holding (%) | 0.8 |
| Maximum number of passengers per hour | 472 |
Publisher’s Note: MDPI stays neutral with regard to jurisdictional claims in published maps and institutional affiliations. |
© 2022 by the authors. Licensee MDPI, Basel, Switzerland. This article is an open access article distributed under the terms and conditions of the Creative Commons Attribution (CC BY) license (https://creativecommons.org/licenses/by/4.0/).
Share and Cite
Ahn, B.; Hwang, H.-Y. Design Criteria and Accommodating Capacity Analysis of Vertiports for Urban Air Mobility and Its Application at Gimpo Airport in Korea. Appl. Sci. 2022, 12, 6077. https://doi.org/10.3390/app12126077
Ahn B, Hwang H-Y. Design Criteria and Accommodating Capacity Analysis of Vertiports for Urban Air Mobility and Its Application at Gimpo Airport in Korea. Applied Sciences. 2022; 12(12):6077. https://doi.org/10.3390/app12126077
Chicago/Turabian StyleAhn, Byeongseon, and Ho-Yon Hwang. 2022. "Design Criteria and Accommodating Capacity Analysis of Vertiports for Urban Air Mobility and Its Application at Gimpo Airport in Korea" Applied Sciences 12, no. 12: 6077. https://doi.org/10.3390/app12126077
APA StyleAhn, B., & Hwang, H.-Y. (2022). Design Criteria and Accommodating Capacity Analysis of Vertiports for Urban Air Mobility and Its Application at Gimpo Airport in Korea. Applied Sciences, 12(12), 6077. https://doi.org/10.3390/app12126077