Article

Development of an Oxy-Fuel Combustion System in a Compression-Ignition Engine for Ultra-Low Emissions Powerplants Using CFD and Evolutionary Algorithms

by
José Ramón Serrano
,
Gabriela Bracho
*,
Josep Gomez-Soriano
and
Cássio Fernandes
CMT—Motores Térmicos, Universitat Politècnica de València, Camino de Vera, 46022 Valencia, Spain
*
Author to whom correspondence should be addressed.
Appl. Sci. 2022, 12(14), 7104; https://doi.org/10.3390/app12147104
Submission received: 13 June 2022 / Revised: 11 July 2022 / Accepted: 12 July 2022 / Published: 14 July 2022
(This article belongs to the Special Issue CFD Based Researches and Applications for Fluid Machinery)

Abstract

:
This study uses an optimization approach for developing a combustion system in a compression–ignition engine that is able to operate under oxy-fuel conditions, and produces mainly CO 2 and H 2 O as exhaust gases. This is achieved because the combustion concept uses pure oxygen as an oxidizer, instead of air, avoiding the presence of nitrogen. The O 2 for the combustion system can be obtained by using a mixed ionic–electronic conducting membrane (MIEC), which separates the oxygen from the air onboard. The optimization method employed maximizes the energy conversion of the system, reducing pollutant emissions (C x H y , particulate matter, and carbon monoxides) to levels near zero. The methodology follows a novel approach that couples computational fluid dynamics (CFD) and particle swarm optimization (PSO) algorithms to optimize the complete combustion system in terms of engine performance and pollutant generation. The study involves the evaluation of several inputs that govern the combustion system design in order to fulfill the thermo-mechanical constraints. The parameters analyzed are the piston bowl geometry, fuel injector characteristics, air motion, and engine settings variables. Results evince the relevance of the optimization procedure, achieving very low levels of gaseous pollutants (C x H y and CO) in the optimum configuration. The emissions of CO were reduced by more than 10% while maintaining the maximum in-cylinder pressure within the limit imposed for the engine. However, indicated efficiency levels are compromised if they are compared with an equivalent condition operating under conventional diesel combustion.

1. Introduction

Greenhouse gas (GHG) emission is a global problem that affects environmental and human health, and the industrial and transport sectors are responsible for 75% of the CO 2 emissions [1]. In this scenario, strict regulations have been imposed by governments in order to control and reduce these GHG emissions. The European Union has defined key targets for GHG emission reduction of at least 40% [2], promoting the use of renewable energy up to 32% of the total energy share by 2030. In addition to CO 2 , combustion systems used in industrial and transport applications are responsible for other hazardous emissions such as CO and NO x , resulting in the interaction of carbon-based fuels and the nitrogen present in air [3].
To attend to the regulations, one possible solution is to find new technologies that improve the performance of current compression–ignition (CI) engines, combining them with sustainable fuels (like bio-fuels or e-fuels) and new combustion strategies. In this situation, oxy-fuel combustion appears as a good alternative [4]. In the oxy-fuel combustion concept, the air supplied to the system is replaced by a mixture of high-purity oxygen. In a real engine this mixture should be diluted with high exhaust gas re-circulation (EGR) rates for reducing the combustion temperature [5]. The clear advantage is the absence of N 2 -rich atmosphere, then the NO x formation is theoretically eluded, but the practical implementation is difficult because the production of pure O 2 is expensive.
In a vehicle, the storage and transport cost of O 2 can negatively affect the application of this concept. A solution for the O 2 production can be cryogenic air separation (CAS), which can deliver oxygen with the acceptable purity level in a large-scale context [6]. However, the use of this CAS system has a high energy penalty combined with high costs [7]. Another possibility is to separate the O 2 from the air by using mixed ionic–electronic conducting membranes (MIEC). They appear as a potential alternative because they are around 10.5–17% cheaper and offer a reduction in energy consumption over 0.5–9% in comparison with the CAS technology [7].
Bauman et al. [8] developed a MIEC with high O 2 permeation and a production capacity around 62 mL/min/cm 2 of O 2 at 1000 °C made of Ba 0.5 Sr 0.5 Co 0.8 Fe 0.2 O 3 δ (BSFC). Catalán-Martinez et al. [9] experimentally and numerically studied the performance of the oxygen transport through a MIEC BSFC under several fluid dynamic conditions. Combining experimental results with one-dimensional models and CFD simulations it was possible to obtain a high-accuracy, specific permeation model that characterizes the O 2 transport phenomena in a MIEC. Their results show that is possible to improve the O 2 transport through a MIEC and its production rate with a temperature increment from 700 °C to 1000 °C.
The oxy-fuel combustion process has already been studied in different industry fields like power generation of the thermal industry [10,11], oil refineries [12], and cement production [13]. In the field of internal combustion engines (ICE), some studies using the oxy-fuel combustion strategy have been reported. Van Blarigan et al. [14] performed experiments in a spark-ignition engine under oxy-fuel combustion conditions by using methane with wet and dry EGR. Their objective was to determine the peak performance conditions for both EGR configurations and to make comparisons with methane-in-air engine conditions. Results showed that when the engine operates under oxy-fuel combustion, the engine efficiency was reduced due to the lower ratio of specific heats of the EGR if compared with regular air. Tan and Hu [15] studied the emissions from a CI engine with several volume proportions of N 2 , O 2 , and CO 2 in the working fluid. Their results show that NO x emissions increase and CO emissions decrease when the O 2 percentage changes from 21% to 60%, at the same time that the N 2 concentration moves from 79% to 40%. Even with low concentrations of N 2 , they show that the trade-off trend between NO x and soot is not easy to overcome. When the engine runs with volume proportions of 50% O 2 and 50% CO 2 , without N 2 , it is possible to solve the NO x -soot problems. The NO x emissions reach nearly zero levels in a CI engine; moreover, the study shows that the increase of O 2 concentration can improve the combustion performance of the engine. However, in the previous studies, the combustion system used is not specifically developed for the oxy-fuel combustion process. Consequently, a specific combustion configuration to the oxy-fuel combustion application can help to further reduce soot emissions and also compensate efficiency through the correct design of the combustion system.
To apply the oxy-fuel combustion concept in combination with the MIEC in ICE, the engine must meet the operating conditions of the membrane [16]. That is, the exhaust gases of the engine, which are used to heat up the membrane, should reach the pressure and temperature requirements for optimal operation of the MIEC. Serrano et al. [17] studied the potential of oxy-fuel combustion in ICE to eliminate NO x , CO, HC, and soot emissions. Additionally, their concept is synergistic with CO 2 -capture technology approaches. They proposed a 1D ICE model by using two EGR control strategies with different heat-exchanger and turbocharger disposals to recover the exhaust gas energy for the oxygen production. The oxygen production was obtained by implementing the BSCF MIEC model of Catalán–Martinez et al. [9]. In comparison with a conventional CI engine, at high engine speeds they found that the oxy-fuel combustion system provides similar brake power and indicated efficiency. For the low engine speeds, it was noticed that the specific break fuel consumption increases.
Other studies show the use of computational fluid dynamics (CFD) techniques to study oxy-fuel combustion, analyzing the combustion system performance when air is replaced by oxygen diluted in CO 2 [18,19]. Kang et al. [20] did a research focused on the improvement of the cycle efficiency in a CI by using the oxy-fuel combustion concept. They used CFD simulations to analyze the effect of the water injection through the injection temperature, timing and water amount on the cycle efficiency obtaining some relevant conclusions. They found that an oxy-fuel diesel engine has great potential in powertrains with high compression ratios, simultaneously delivering high efficiencies and, theoretically, zero emissions. This potential was compared against oxy-fuel HCCI and spark ignition engines performance. Moreover, the cycle efficiency and combustion process of the oxy-fuel engine can be optimized combining injection technology with waste heat recovery. Another study presented by Mobasheri et al. [21] was focused on the evaluation of the combustion characteristics of a CI engine using CFD simulations. In this work, a commercial high pressure bottle is used to supply the O 2 , while the CO 2 is captured by condensation and separation of the water vapor from the exhaust gases. The gas that was introduced to the cylinder was a mixture of CO 2 and pure O 2 , which was prepared in a premixing chamber. The other gases and the rest of CO 2 from the exhaust were compressed and stored in tanks designed for that purpose. From their simulations, they obtained a reduction in the engine power and in the thermal efficiency when the CO 2 concentration was increased. They attributed that behaviour to the increase of the of the heat capacity in the intake gas, decreasing the cylinder pressure and temperature.
Considering the advantages and disadvantages mentioned in the previous studies, the oxy-fuel combustion concept shows some potential in terms of emission reduction due to a nitrogen-free combustion. This new possibility motivates the exploration of this combustion system in the operating mode of an engine powered only with fuel, O 2 , and EGR. To the knowledge of the authors, all previous studies have been performed by using conventional combustion chambers architectures with only external modifications on the engine hardware, but unfortunately no work studying the influence of the combustion chamber design on the system performance has been done up to the moment. For this reason, this paper aims to study the potential of the oxy-fuel combustion process in CI engines searching for a suitable combustion system configuration through the application of an innovative optimization method coupled with CFD simulations, the main contributins of which are indicated as follows.
  • A computational engine model that reproduces a full load engine operating condition was developed and the model was validated. This model is then evaluated in oxy-fuel combustion operating mode, providing suitable thermodynamic conditions in the exhaust line.
  • A novel methodology that combines the CFD code with the Particle Swarm Optimization (PSO) algorithm was used to perform the optimization study in a reasonable period of time, thanks to the integration of tools for fast and accurate data post-processing.
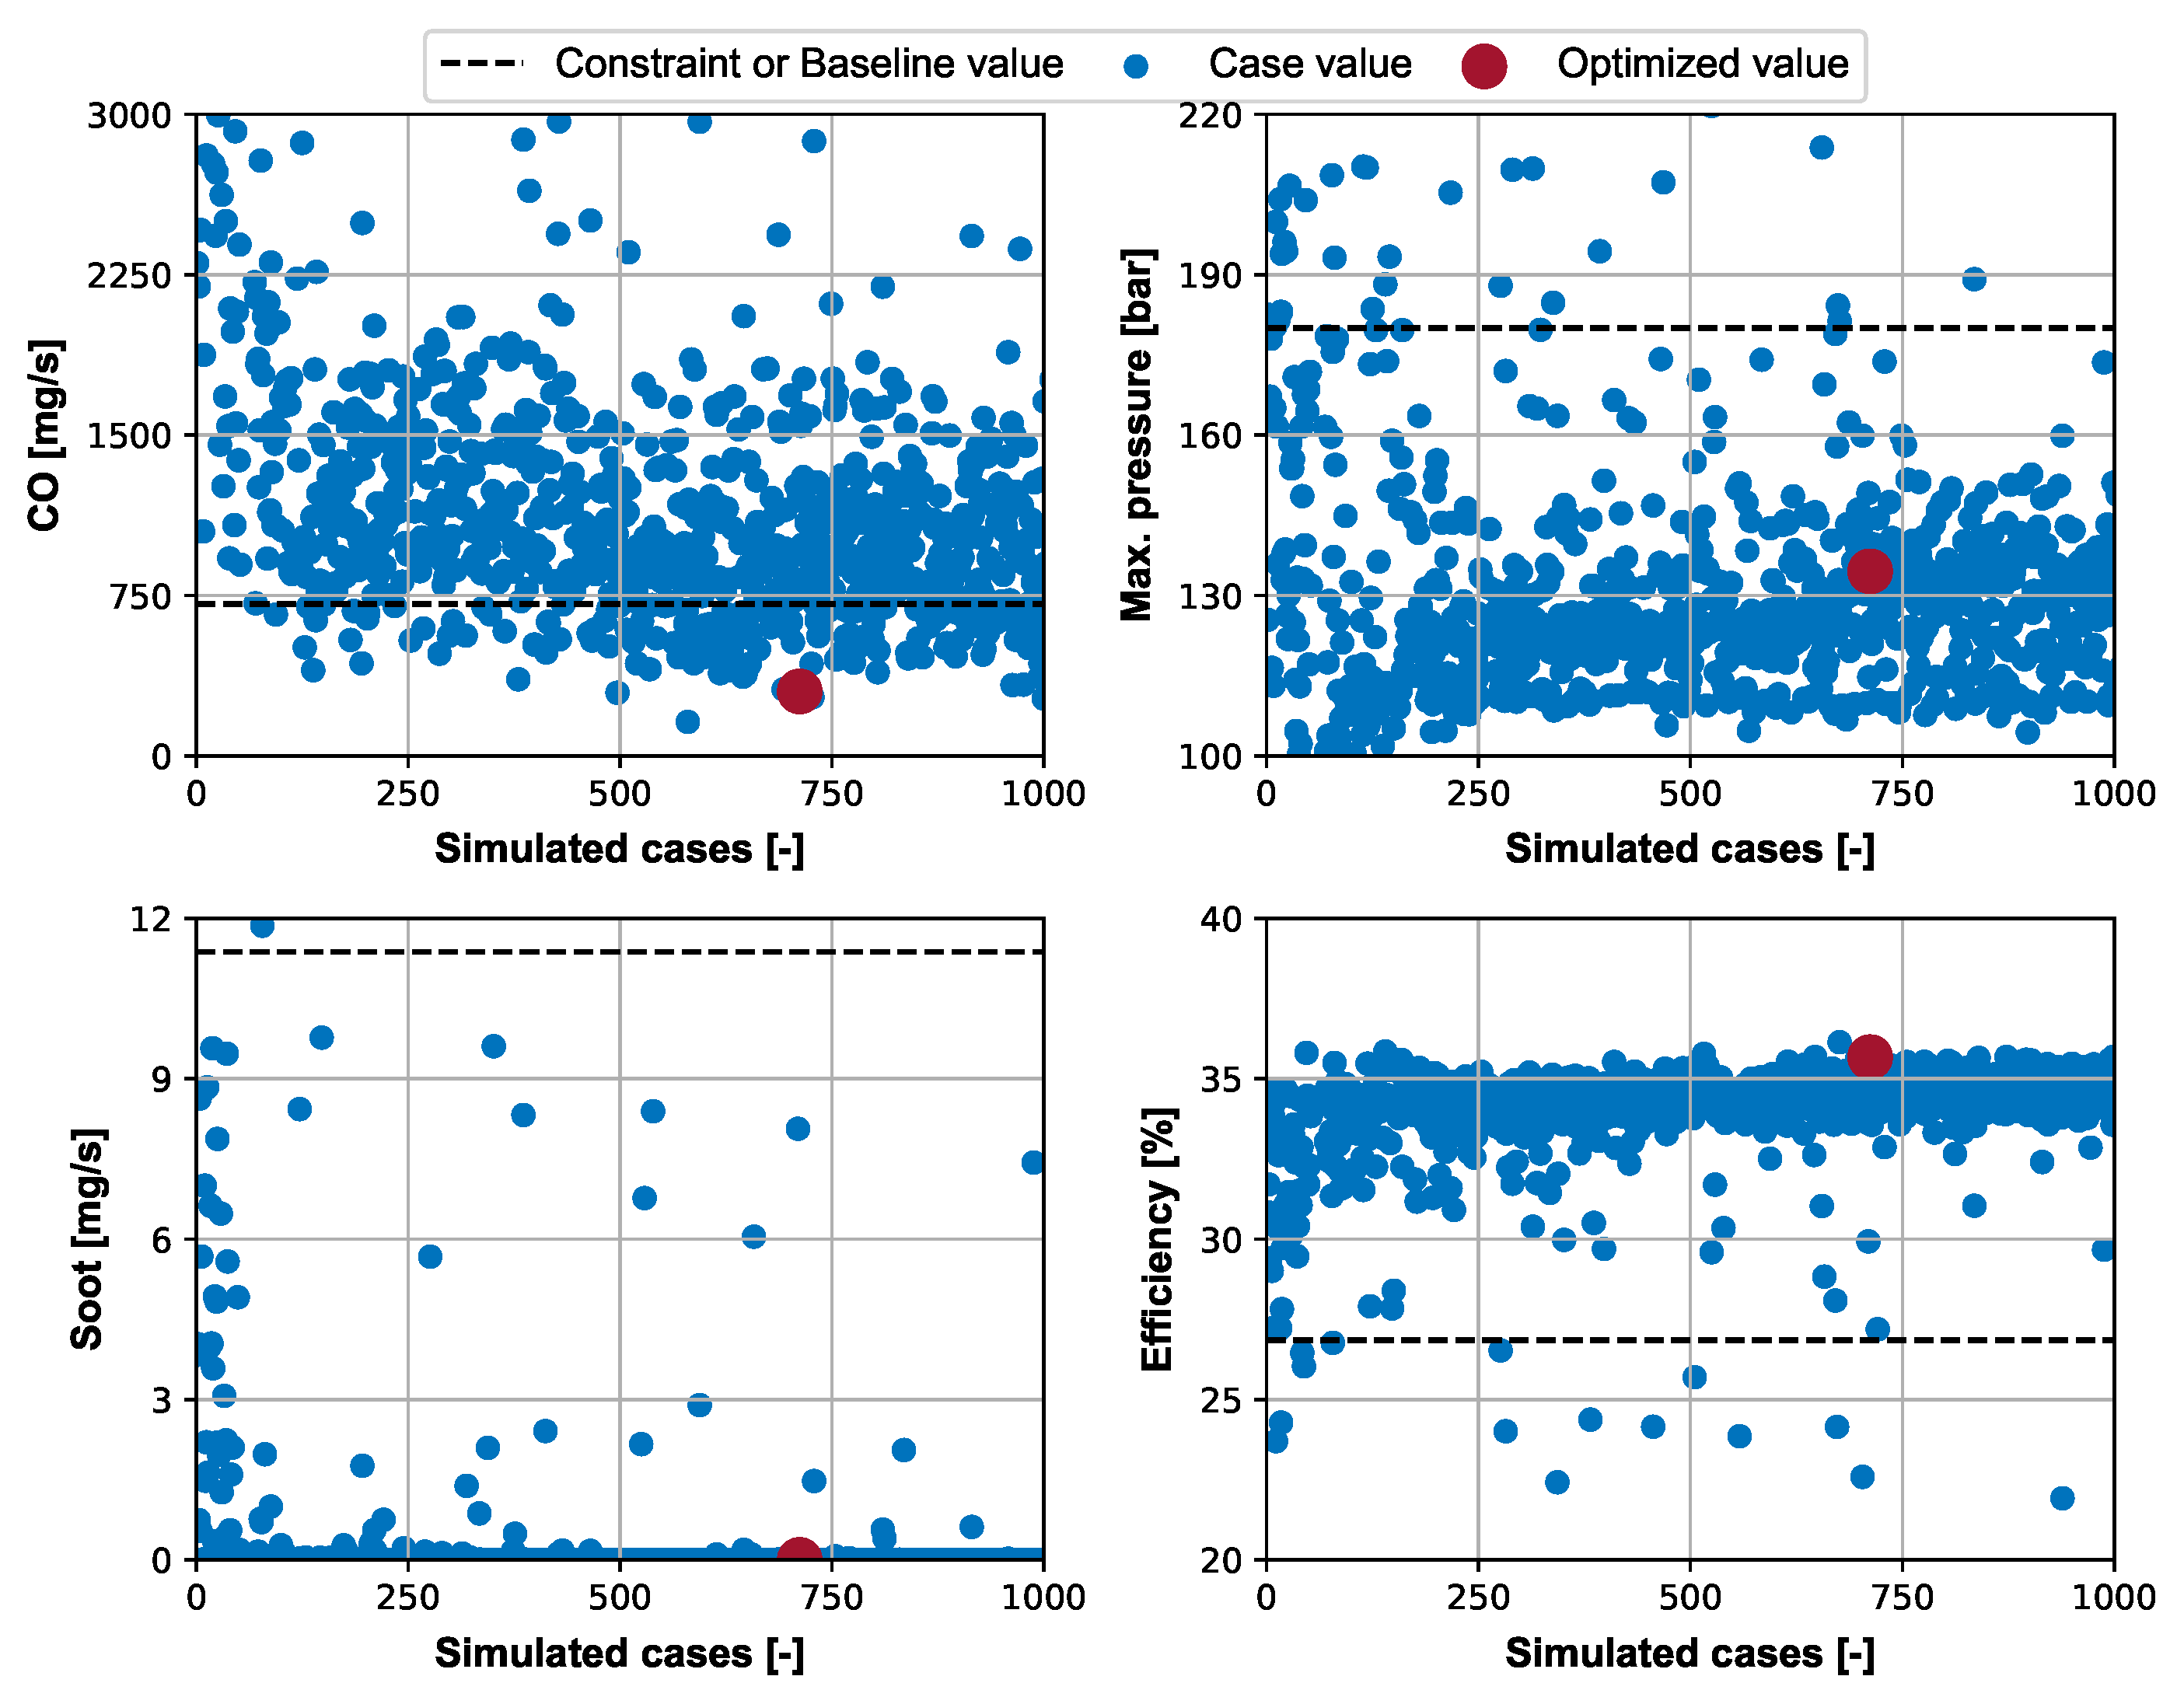
  • The study involves the analysis of several inputs (combustion chamber design and engine settings variables) to obtain the best set of parameters that reduces the soot emissions and maximizes the efficiency, considering the constraints of the CO emissions and the maximum pressure ( p m a x ) of the engine.
This article is structured as follows. Section 1 has presented a general overview of the work. Section 2 presents the methodology, the engine configuration, computational models, and the tools used in this work. In Section 3, the obtained results are presented and discussed. Section 4 presents the conclusions of the study.

2. Methodology

The tools and methods employed in this study are presented in this section. The explanation of each step corresponds to the sequence followed in the workflow.
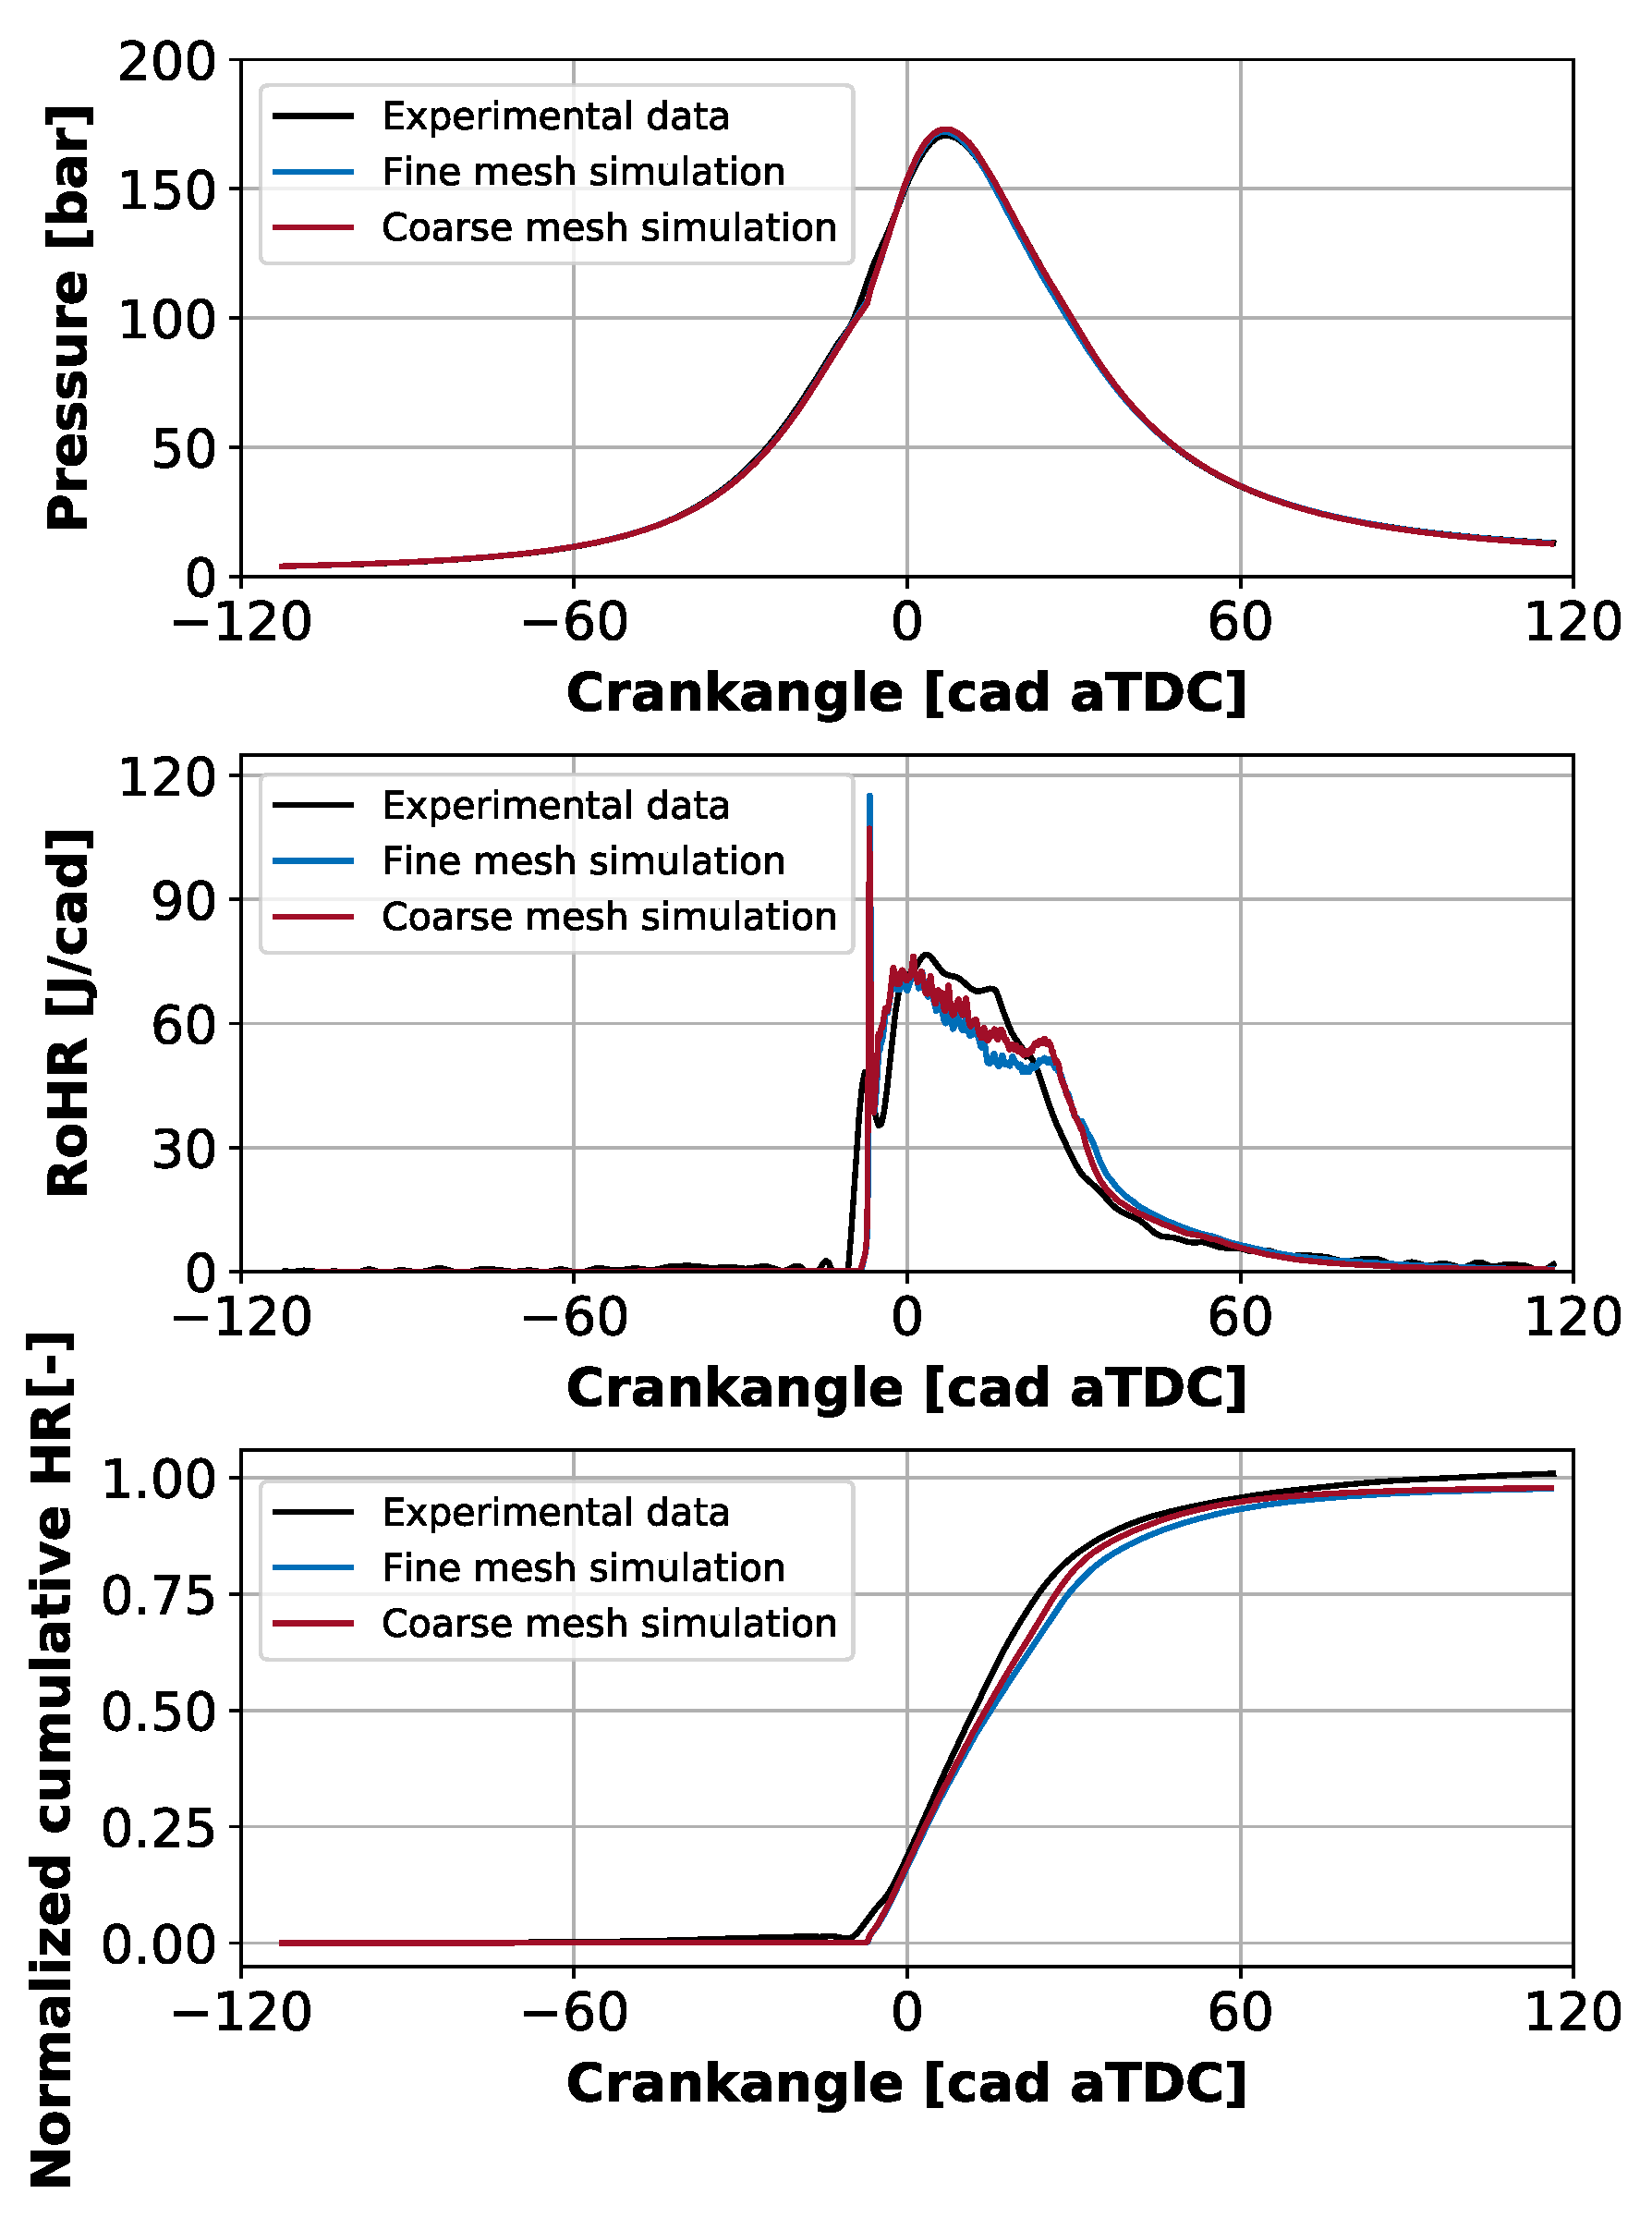
  • Initially, a CFD model was created and validated against experimental data from a CI engine with conventional fuel and air.
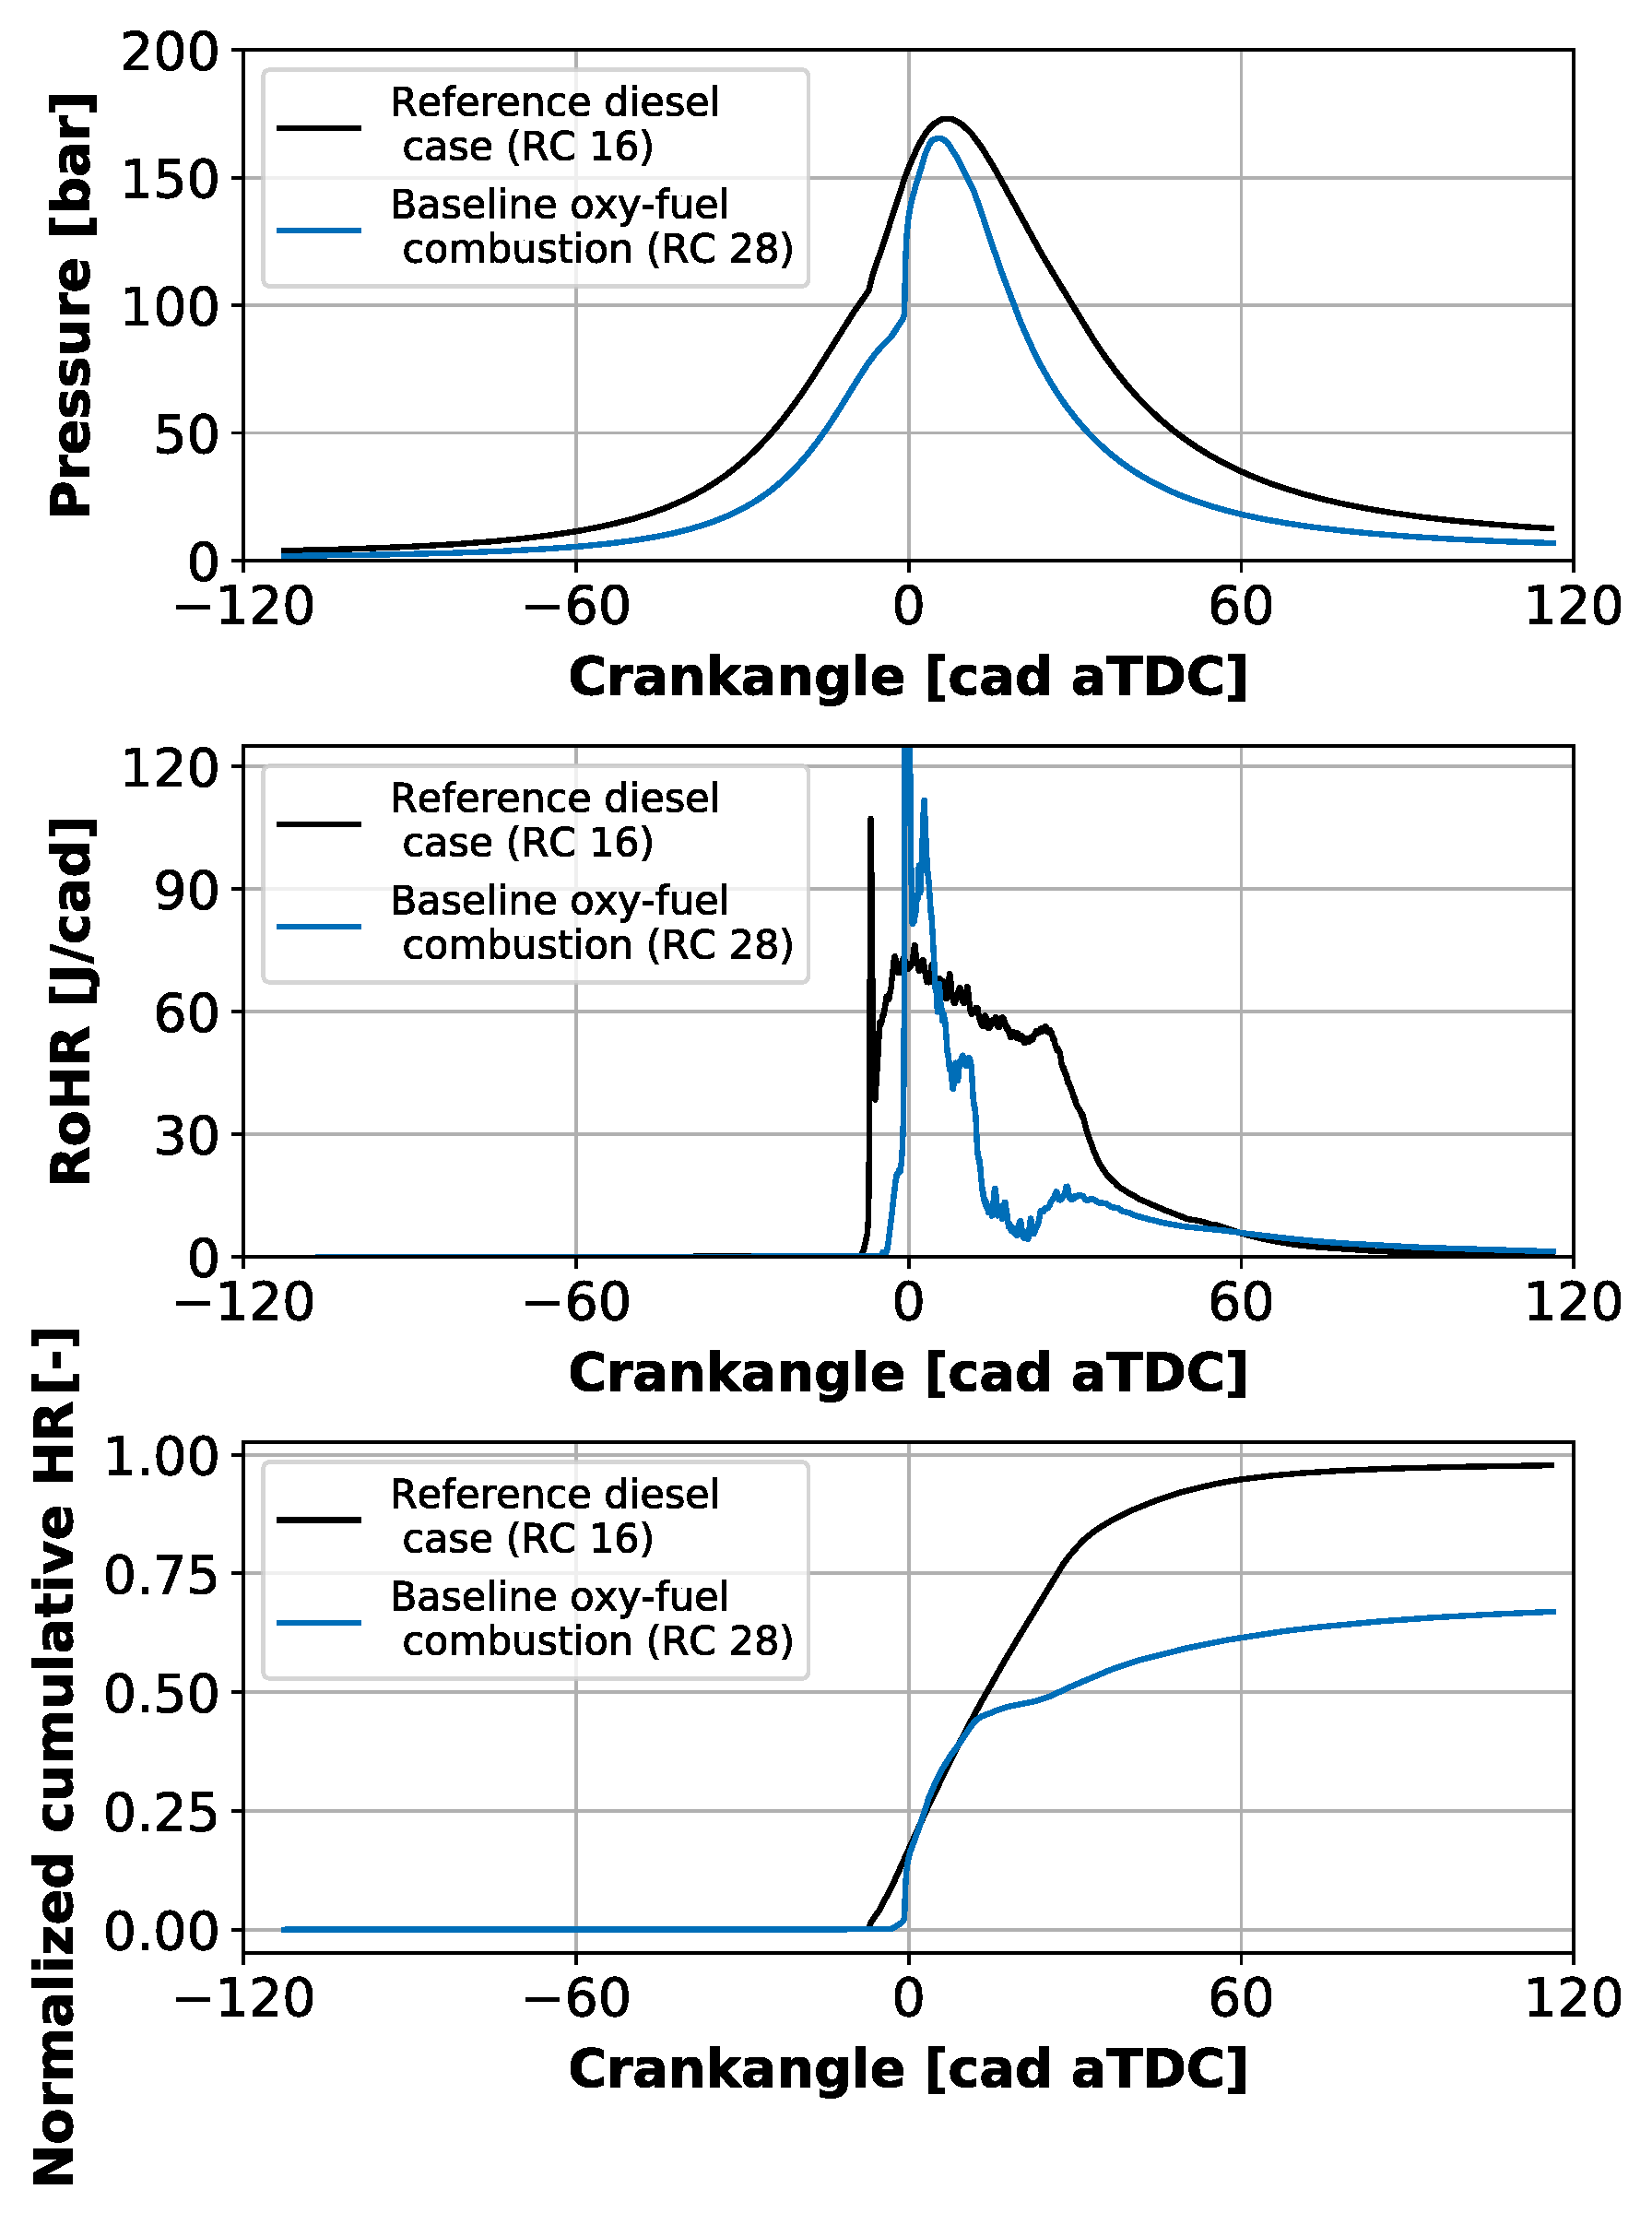
  • The second step is the implementation of the oxy-fuel combustion boundary conditions for the point of maximum power defined in a previous study of Serrano et al. [22].
  • Based on this study, it was observed the possibility to optimize the combustion system of the engine to improve the combustion process of this engine.
  • With this possibility an optimization process was carried out focusing in the combustion system by using CFD simulation coupled with an optimization algorithm in order to reduce soot emissions and improve efficiency.

2.1. Engine Configuration

In this work, a medium-duty CI engine was used. It was a 2.2 L, four-cylinder diesel engine equipped with a turbocharger and a common-rail injection system. The main specifications of the engine and the injector are summarized in Table 1. The engine was tested at the experimental facilities available at CMT Motores Térmicos at Universitat Politècnica de València. These experimental data were used for the calibration of the CFD engine model. During the experiments, the soot yield was evaluated with an AVL 415S smoke meter. The values were reported in filter smoke number (FSN) and then converted to specific soot emissions by using an in-house empirical correlation as proposed in [23].
The CFD simulation was carried out from the intake valve closing (IVC) and it finished at the exhaust valve opening (EVO), it means in closed cycle, considering the compression, combustion and part of the expansion stroke. The boundary conditions considered in this study are the gas temperature and pressure, the gas concentration, all the wall temperatures (piston, head and liner), and the fuel injection properties at the IVC instant.

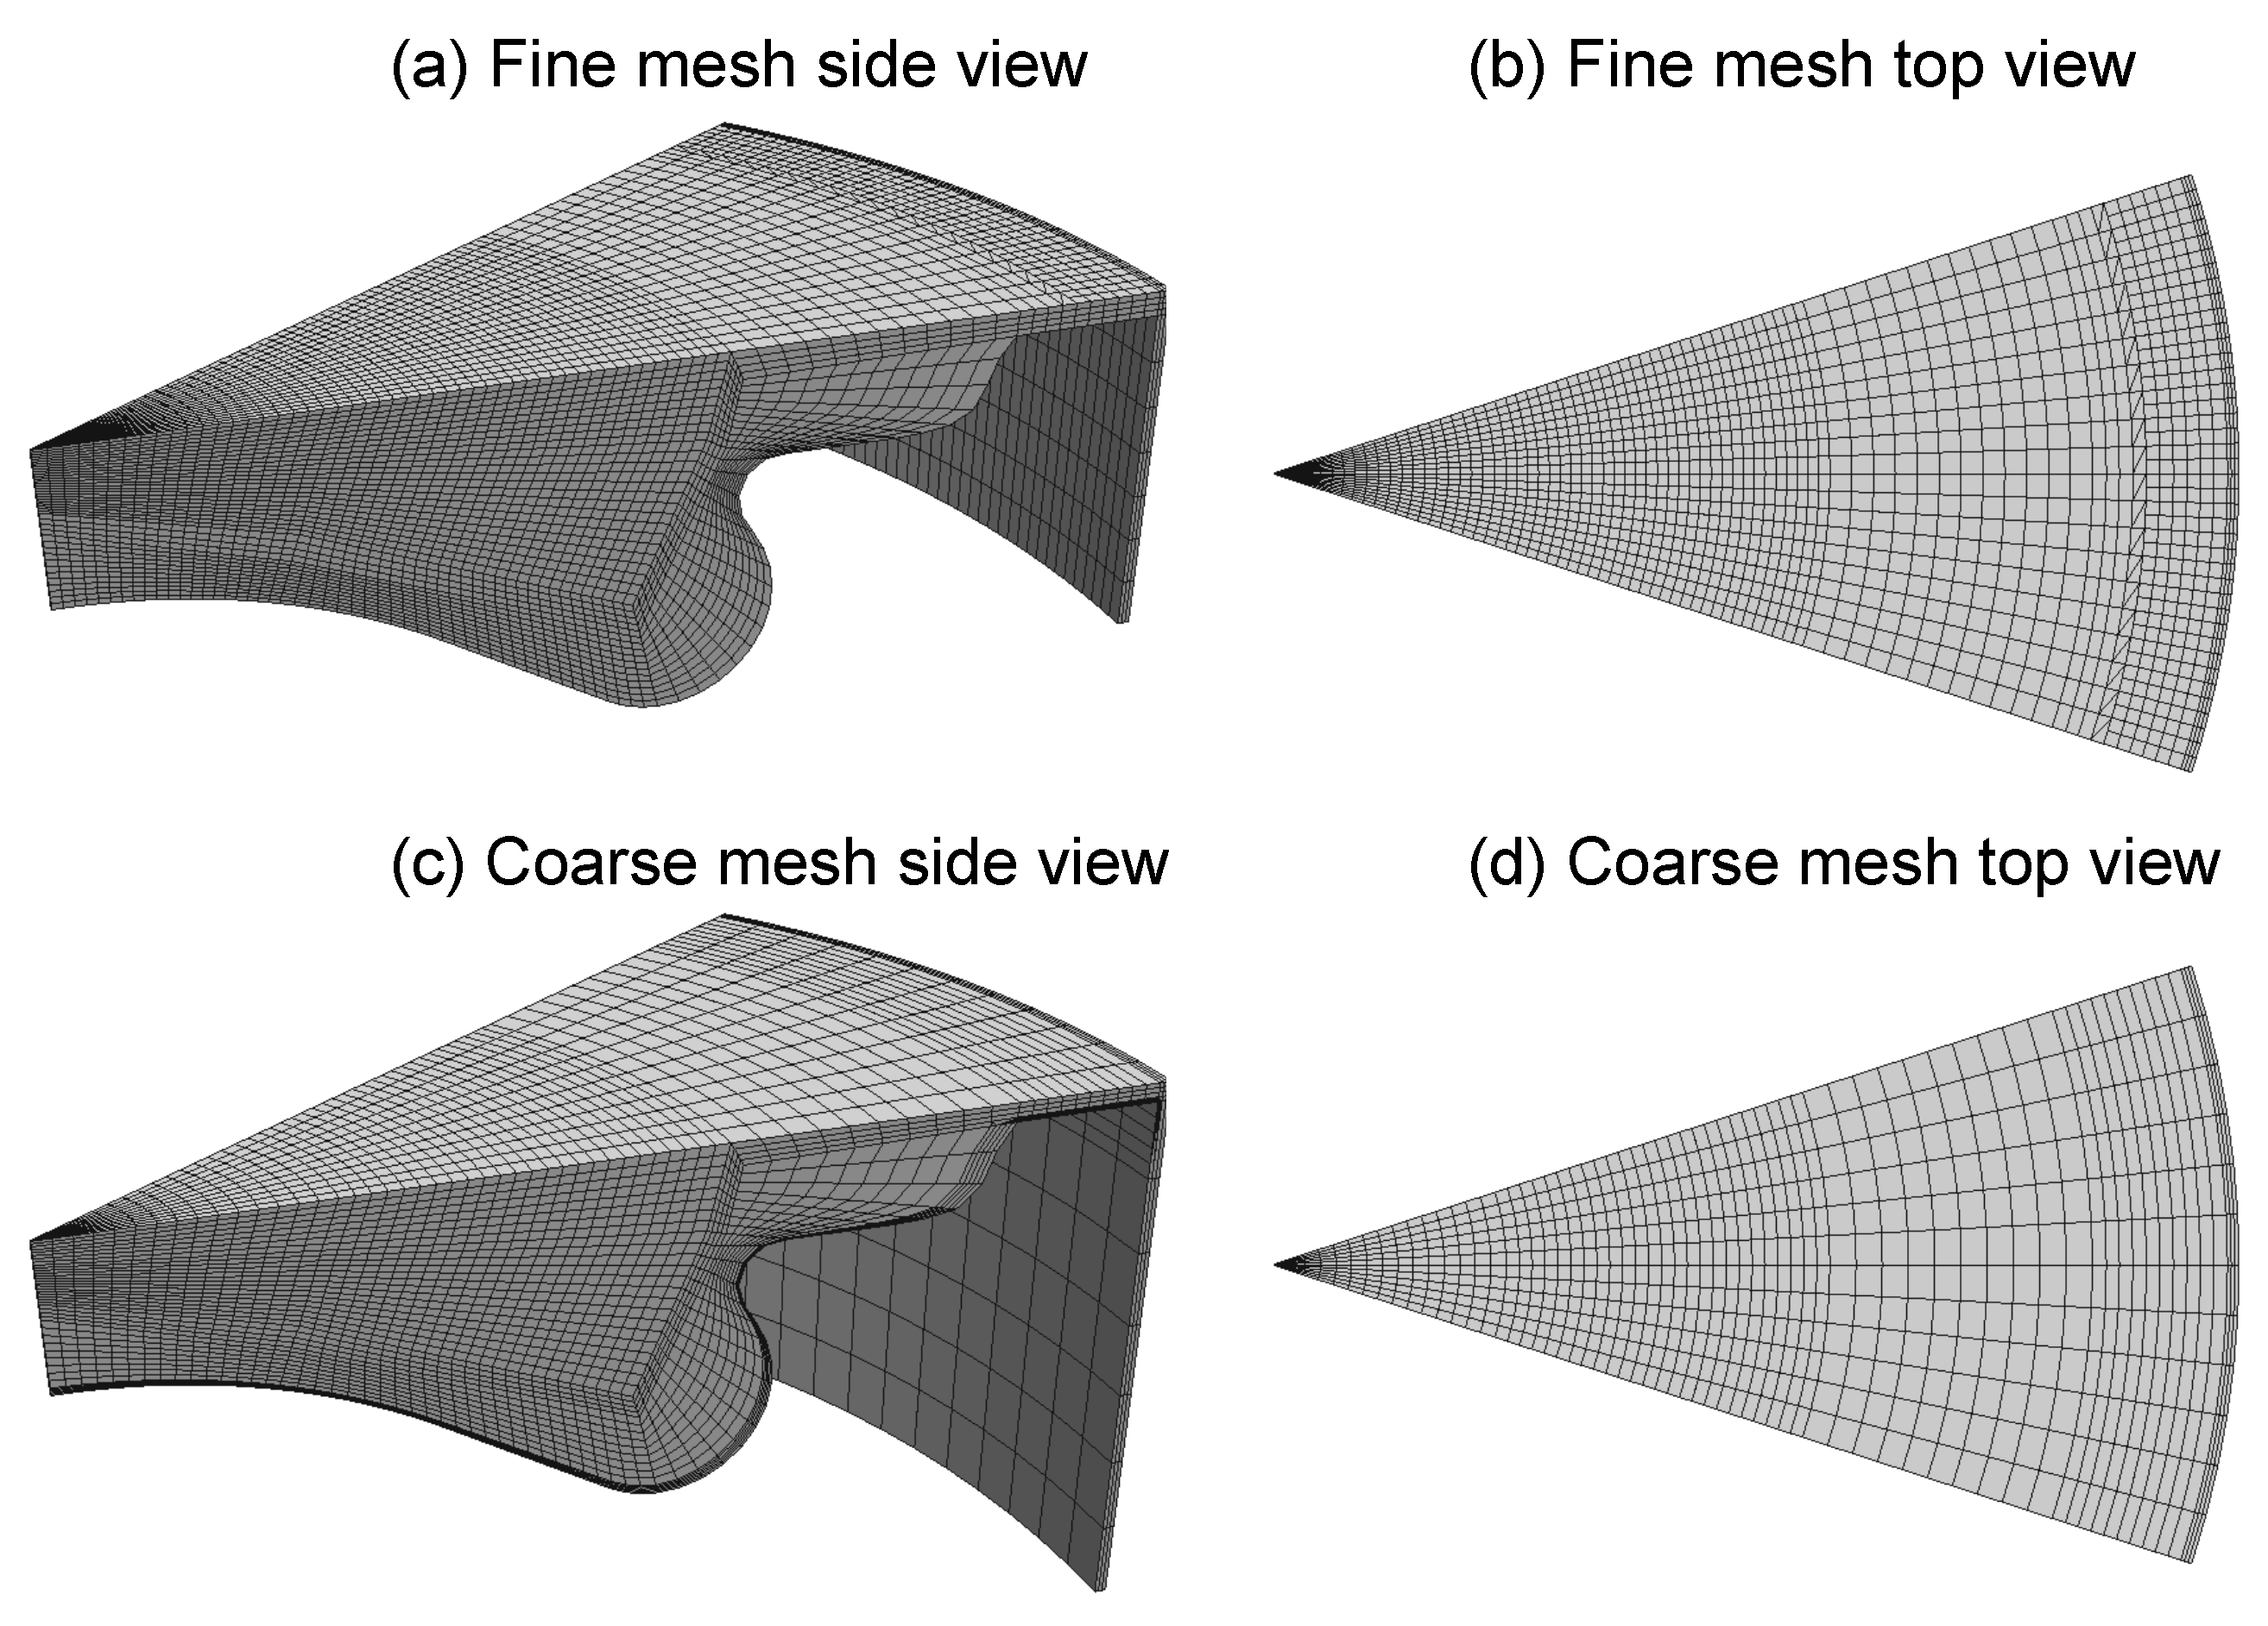
2.2. CFD Model Description and Model Validation

The CFD simulations were carried out by using the OpenFOAM® technology CFD software [24] with the Lib-ICE [25] code coupled to perform the combustion system simulation including a complete pack of solvers for internal combustion engine simulations. The model was built reproducing the real geometry of the cylinder, considering an axi-symmetric sector of the combustion chamber defined in function of the number of holes of the injector in order to reduce the computational time required to perform all the simulations. For the simulations of the experimental case, named as a reference case in this work, the sector represents 1/10 of the combustion chamber. A dynamic mesh layering technique was used to reproduce the movement of the piston, which is available in in Lib-ICE tools [25,26].
This model uses n-heptane as a fuel diesel surrogate in order to reproduce the experimental data of the engine. The spray characteristics were modeled by using a Lagrangian particle approach that assumes a “blob” injection model [27,28]. The liquid atomization, break-up, and evaporation model were modeled by using Kelvin–Helmholtz (KH) and Ryleigh–Taylor (RT) algorithms [29,30]. Also, the rate of injection (ROI) was obtained from an in-house model [31]. This model reproduces the injection profile as a function of the injection pressure, number of nozzle holes and engine speed. The CFD model then groups the liquid droplet into parcels inside the combustion chamber, thus serving as the spray field. Turbulence modelling was performed by the Reynolds-averaged Navier Stokes (RANS) approach with a re-normalized group (RNG k- ϵ ) [32]. The Angelberger model [33] was used to model the engine heat transfer. The detailed chemistry is represented by a reduced chemical kinetic mechanism implemented by N-heptane that contains 162 species and 1543 reactions. To perform the simulation of the combustion phenomenon, a representative interactive flamelet (RIF) model was implemented. The RIF model considers the flame structure as an unsteady laminar diffusion flame, and assumes that the length and turbulent scales are much larger than the chemical ones. Its evolution is calculated in the mixture fraction region where energy and species equations are solved and the effects of mixing are covered in the scalar dissipation rate [26]. The models and sub-models used in this study are listed in Table 2.
The values for the boundary conditions were gathered from the experimental data through an in-house methodology developed by Benajes et al. in [34] and are presented in Table 3. The boundary conditions at the edges of the segments were calculated by using a similar approach than the other walls of the combustion chamber. Specifically, at this region the temperature was the same than the wall temperature and the species concentration is the same as inside the combustion chamber.
An initial simulation using a well-refined mesh was performed by searching for a good agreement between experimental and simulation results with high accuracy in terms of in-cylinder pressure and heat-release rate. This well-refined mesh, named fine mesh, is presented in Figure 1 where the (a) and (b) images represent the fine mesh in the side and top view, respectively, and counts with 52,000 cells at top dead center (TDC). In addition, with the fine mesh already defined, a different mesh configuration was tested. A coarse mesh, which is a simplified version of the fine mesh, was used to evaluate a reduction in computational time while maintaining the same accuracy for the results. This coarse mesh counts with 26,900 cells at TDC are also shown in Figure 1, where images (c) and (d) shows the side and top view.
With the results of the CFD simulations for the fine and coarse mesh, a comparison between in-cylinder pressure, rate of heat released (RoHR), and heat release (HR), normalized with respect to the maximum energy value provided to the engine, for experiments and CFD-simulated results are presented in Figure 2. The black line represents the experimental data, the blue line represents the fine-mesh simulations results and the red line shows the coarse mesh simulation results. Both mesh configurations provide a good agreement between experimental data and simulations curves.
Moreover, the results of NO x emissions, concentration of soot and the gross indicated efficiency for the fine and coarse mesh were compared against the experimental data. These results are presented in Table 4 and show a good accuracy between experimental data and simulation results. The fine mesh provides better results in comparison with the coarse mesh for NO x and soot emissions, but worse results in terms of gross efficiency. Therefore, the differences observed are not big enough to justify the cost of computational time with the fine mesh.
Based on these results, the coarse mesh will be used to perform all simulations in this study, because it is strongly needed to reduce the computational time of the further optimization process. From now on, this case will be named as for reference as the diesel case in the subsequent parts of this document.

2.2.1. Oxy-Fuel Combustion Model

The feasibility of the oxy-fuel combustion concept was analyzed in a preliminary work performed by Serrano et al. [22]. As previously commented, they implemented a numerical methodology to assess oxy-fuel combustion features and the potential of this concept in optimal conditions. They simulated a conventional CI engine with a 0D-1D in-house simulation software named Virtual Engine Model (VEMOD) [23], in which they also integrated the oxygen membrane (MIEC) model technology.
In that preliminary study [17], the composition of the gas that entered the cylinder was formed by O 2 , CO 2 , and H 2 O, avoiding the presence of N 2 . The concentration of each species depends on the operating condition and the EGR rate. It was observed that the optimal operative conditions and the original volumetric compression ratio of the engine (with a CR of 16) operating in oxy-combustion mode, with an EGR rate of 70% and without N 2 , had a lower trapped mass than conventional air combustion, which means lower in-cylinder pressure if the temperature of the charge is maintained. For this reason, they performed a sensitivity study, increasing the CR value in order to maximize the engine torque and effective efficiency, varying different parameters in the engine, like intake pressure and temperature, among others (to fulfill the restriction of the exhaust temperature at 1000 ºC and respecting the in-cylinder pressure limit). The outcome was that the CR was changed from 16 to 28, and indirectly the conditions at the IVC changed slightly from the initial case, improving the trapped mass. Moreover, the minimum area of the MIEC required for supplying an appropriate amount of oxygen was calculated, obtaining a value of 10 m 2 for delivering the necessary O 2 amount for the engine. As a consequence, the value of the oxygen-fuel ratio ( λ ), based on the mass ratio, was maintained as a constant and with a relatively low value of 1.1 (compared to traditional CI values). The reason for this low value is because the oxygen separation onboard is costly, due to the high surface and thermal requirements of the MIEC to operate correctly.
The information obtained from this 0D-1D evaluation, in terms of optimum compression ratio, EGR rate and gas composition, is used for defining the boundary conditions for the CFD calculations performed in current work. Specifically, the calibrated case presented in Section 2.2, was updated considering the oxy-fuel operation characteristics and parameters from the 0D-1D simulations. The boundary conditions for the 3D model (so-called “baseline oxy-combustion”) are presented in Table 5.
A comparison of the in-cylinder pressure, RoHR, and the HR between the reference diesel case and the baseline oxy-combustion case is presented in Figure 3. The in-cylinder thermodynamic conditions are different in both cases, due to differences in the gas composition, promoting a higher delay in the start of combustion in the oxy-fuel concept. In terms of in-cylinder pressure (top graph in Figure 3), the reduction in the pressure values when the oxy-fuel combustion concept is used can be explained by the differences between CO 2 and N 2 properties, the different trapped masses and the different volumetric compression ratio. In spite of the higher CR, the oxy-fuel combustion case shows lower peak pressure values in both compression and combustion phases. The carbon dioxide molecule has a larger specific heat capacity compared with oxygen and nitrogen (the dominant parts of the air). Consequently, the increment of CO 2 in the combustion chamber, maintaining the same intake temperature and pressure, will vary the specific heat capacity of the mixture causing a lower temperature rise, and a larger ignition delay period [15,35]. When it comes to the RoHR (the graph in the middle), for the oxy-fuel combustion configuration the ignition delay is higher, and thus the combustion happens practically in the premixed combustion phase. Also, the combustion slows down to approximately 20 cad aTDC, because a jet-wall interaction might interfere the flame sustainability, because the higher CR requires a smaller volume of the combustion chamber.
All these differences have an impact on the total energy losses which can be seen in the normalized cumulative HR plot. The results from the simulations were normalized with respect to the maximum of the theorical total energy available in each cycle, which is calculated by the amount of fuel injected in a cycle multiplied by the low heating value of the fuel. The engine working in oxy-fuel combustion concept is not able to keep the combustion efficiency at acceptable values, compromising the engine efficiency.
Based on this initial analysis, it can be seen that the new oxy-fuel combustion concept has an unsatisfactory efficiency when it is used in an existing CI diesel combustion chamber designed for conventional air combustion. As stated in the objectives, this work intends to find a new combustion system adapted to this particular combustion concept requirements.
The number of variables that define the combustion system is typically high, where all of them have a contribution on the combustion performance, which have cross-interaction between them and non-linear trends. To find the right combination of factors that will provide an optimal engine design is still a challenge.

2.3. Computational Optimization Details

Optimization Methodology

The optimization process was carried out by using a novel approach based on the particle swarm optimization algorithm (PSO) [36]. One of the reasons for selecting this approach is because it offers a fast rate of the convergence to find the best solution. In addition, its implementation is simple and it is capable of solving problems with large search domain of candidates solutions. Nonetheless, a few drawbacks of the PSO are that the algorithm can be stuck in a local minimum not finding the global optimum, and that it has a strong sensitivity to meta-parameteric values. Although the PSO can execute, the algorithm requires some information about the particle that is being evaluated, including the position x i in the search space and the velocity v i , according to these expressions:
x i ( t + 1 ) = x i ( t ) + v i ( t + 1 ) ,
v i ( t + 1 ) = w · β · v i ( t ) + c 1 · τ · ( p i x i ( t ) ) + c 2 γ · ( g x i ( t ) ) ,
where w means the inertia weight, c 1 and c 2 represent the individual and social weight respectively, and t means the iteration. Typical values for the inertia weight w are in the range of [0.5, 1.5] and the values of c 1 and c 2 vary in the range of [1, 3]. In addition, in the previous Equation (2) p i means the current best position of x i and g refers to the global best position obtained from all evaluated particles. The variables β , τ , and γ are vectors where each element has a random value of a uniform distribution in the [0, 1] range.
In this study, the PSO basic algorithm has been combined with a mathematical tool that is known as the novelty search concept, which improves the convergence issues of the PSO. This integration has been used in previous works with successful results [37]. The use of novelty search concepts is proposed to improve the exploration of the search space dividing the set of particles in two groups: a first family formed by standard particles, which ruled the regular PSO equations (Equations (1) and (2)). The second family is formed by particles that “explore” all the search space, even the regions that provide bad results, which are not ruled by the best position information. This technique avoids that the PSO gets stuck in a local minimum.
Then, all the particles generated by the algorithm are stored in a repository. It maintains all the information of the optimization process, so the new particles that explore the domain avoid the regions close to the particles already investigated. The mathematical definition of the repository is given by Equation (3):
MC ( t ) = x R ( t ) x card ( R ( t ) ) ,
where R ( t ) is the repository in the iteration t, card ( R ( t ) ) is the number of elements of R ( t ) , and MC ( t ) is the point that summarizes the behavior of the system in the iteration t. In this expression, the MC ( t ) is defined to be analogous to a centre of mass.
Finally, to adapt the PSO algorithm with the novelty search concept it is necessary to define a new velocity equation in order to guide the explorer particles, taking into account the information in the repository. Therefore, Equation (4) was defined to modify the particle dependency from the global best position to the new centre of mass data,
v i ( t + 1 ) = w · δ · v i ( t ) + c 1 · ϕ · ( p i x i ( t ) ) + + c 3 · ρ · exp α · x i ( t ) MC ( t ) x m a x x m i n · ( x i ( t ) MC ( t ) ) ,
where x m a x , x m i n are vectors that represent the boundaries of the search space. The variables δ , ϕ , and ρ represent random vectors as in Equation (2). The quotient is given in Equation (5) which is part of the Equation (4) and should be carried out componentwise:
x i ( t ) MC ( t ) x m a x x m i n .

2.4. Optimization Parameters and Objective Function

As mentioned in previous sections, this work aims to find a suitable combustion system configuration that improves the performance of the oxy-fuel concept. Therefore, eleven parameters associated with the combustion system were selected as variables, of which six factors are geometrical parameters related to the piston bowl definition (see Figure 4), four parameters are used to characterize the injection system (nozzle holes number, spray angle, injection pressure, and start of injection), and the final parameter is the swirl number to characterize the in-cylinder gas motion. The range of all parameters used as inputs for the optimization process are presented in Table 6.
To define the first particles, the Latin hypercube methodology was used to create 100 distinct particles that were equally distributed in the range of each input. Later, the results of these parameters were used as a database for the initialization of the optimization algorithm. In the next step, PSO starts the optimization process generating the 30 standard particles and 10 particles that explore the search space.
The optimization algorithm will combine all the input variables in order to maximize the engine efficiency and, at the same time, minimize the soot emissions. Additionally, the algorithm should take into account two constraints: the maximum in-cylinder pressure (in order to ensure the mechanic integrity of the cylinder, established by the manufacturer), and the CO emissions, which should be lower than the value of the baseline case. To meet these requirements, the objective function OF is defined based on the relative importance of soot, efficiency, maximum pressure ( p m a x ) and CO emissions against the baseline values. The mathematical definition of the OF is presented in Equation (6),
O F = f 1 ( s o o t ) · coef soot + f 2 ( eff ) · coef eff + f 3 ( p m a x ) · coef p m a x + f 4 ( CO ) · coef CO ,
where the coef indexes are coefficients used to adjust the equation in order of importance of each term. In this work, the main objective of the optimization process is to obtain a combustion system that minimizes soot emissions and the second objective is to obtain the better efficiency value possible. For these reasons, the coefficients accustomed to these values are higher and play a major role in the objective function. The choice of lower values for the CO and maximum pressure coefficients is due to these parameters being constraints of the optimization and they should have minor influence on the objective function. In addition, the objective of soot oxidation is aligned with the objective of CO and C x H y oxidation. The absence of N 2 fully breaks the trade-off between oxidation and reduction reactions, in order to eliminate pollutants within the combustion chamber. In spite of this, C x H y is not within the optimization function, and it will be checked that it is not needed, because the CO optimization will also cause an C x H y oxidation below the standard air combustion levels. The values of those coefficients were coef soot = 1, coef eff = 0.75, coef p m a x = 0.1 and coef CO = 0.1. Moreover, the total objective function is composed of four subfunctions that are defined for each output. Those functions are detailed in Equations (7)–(10), summarized in Table 7.

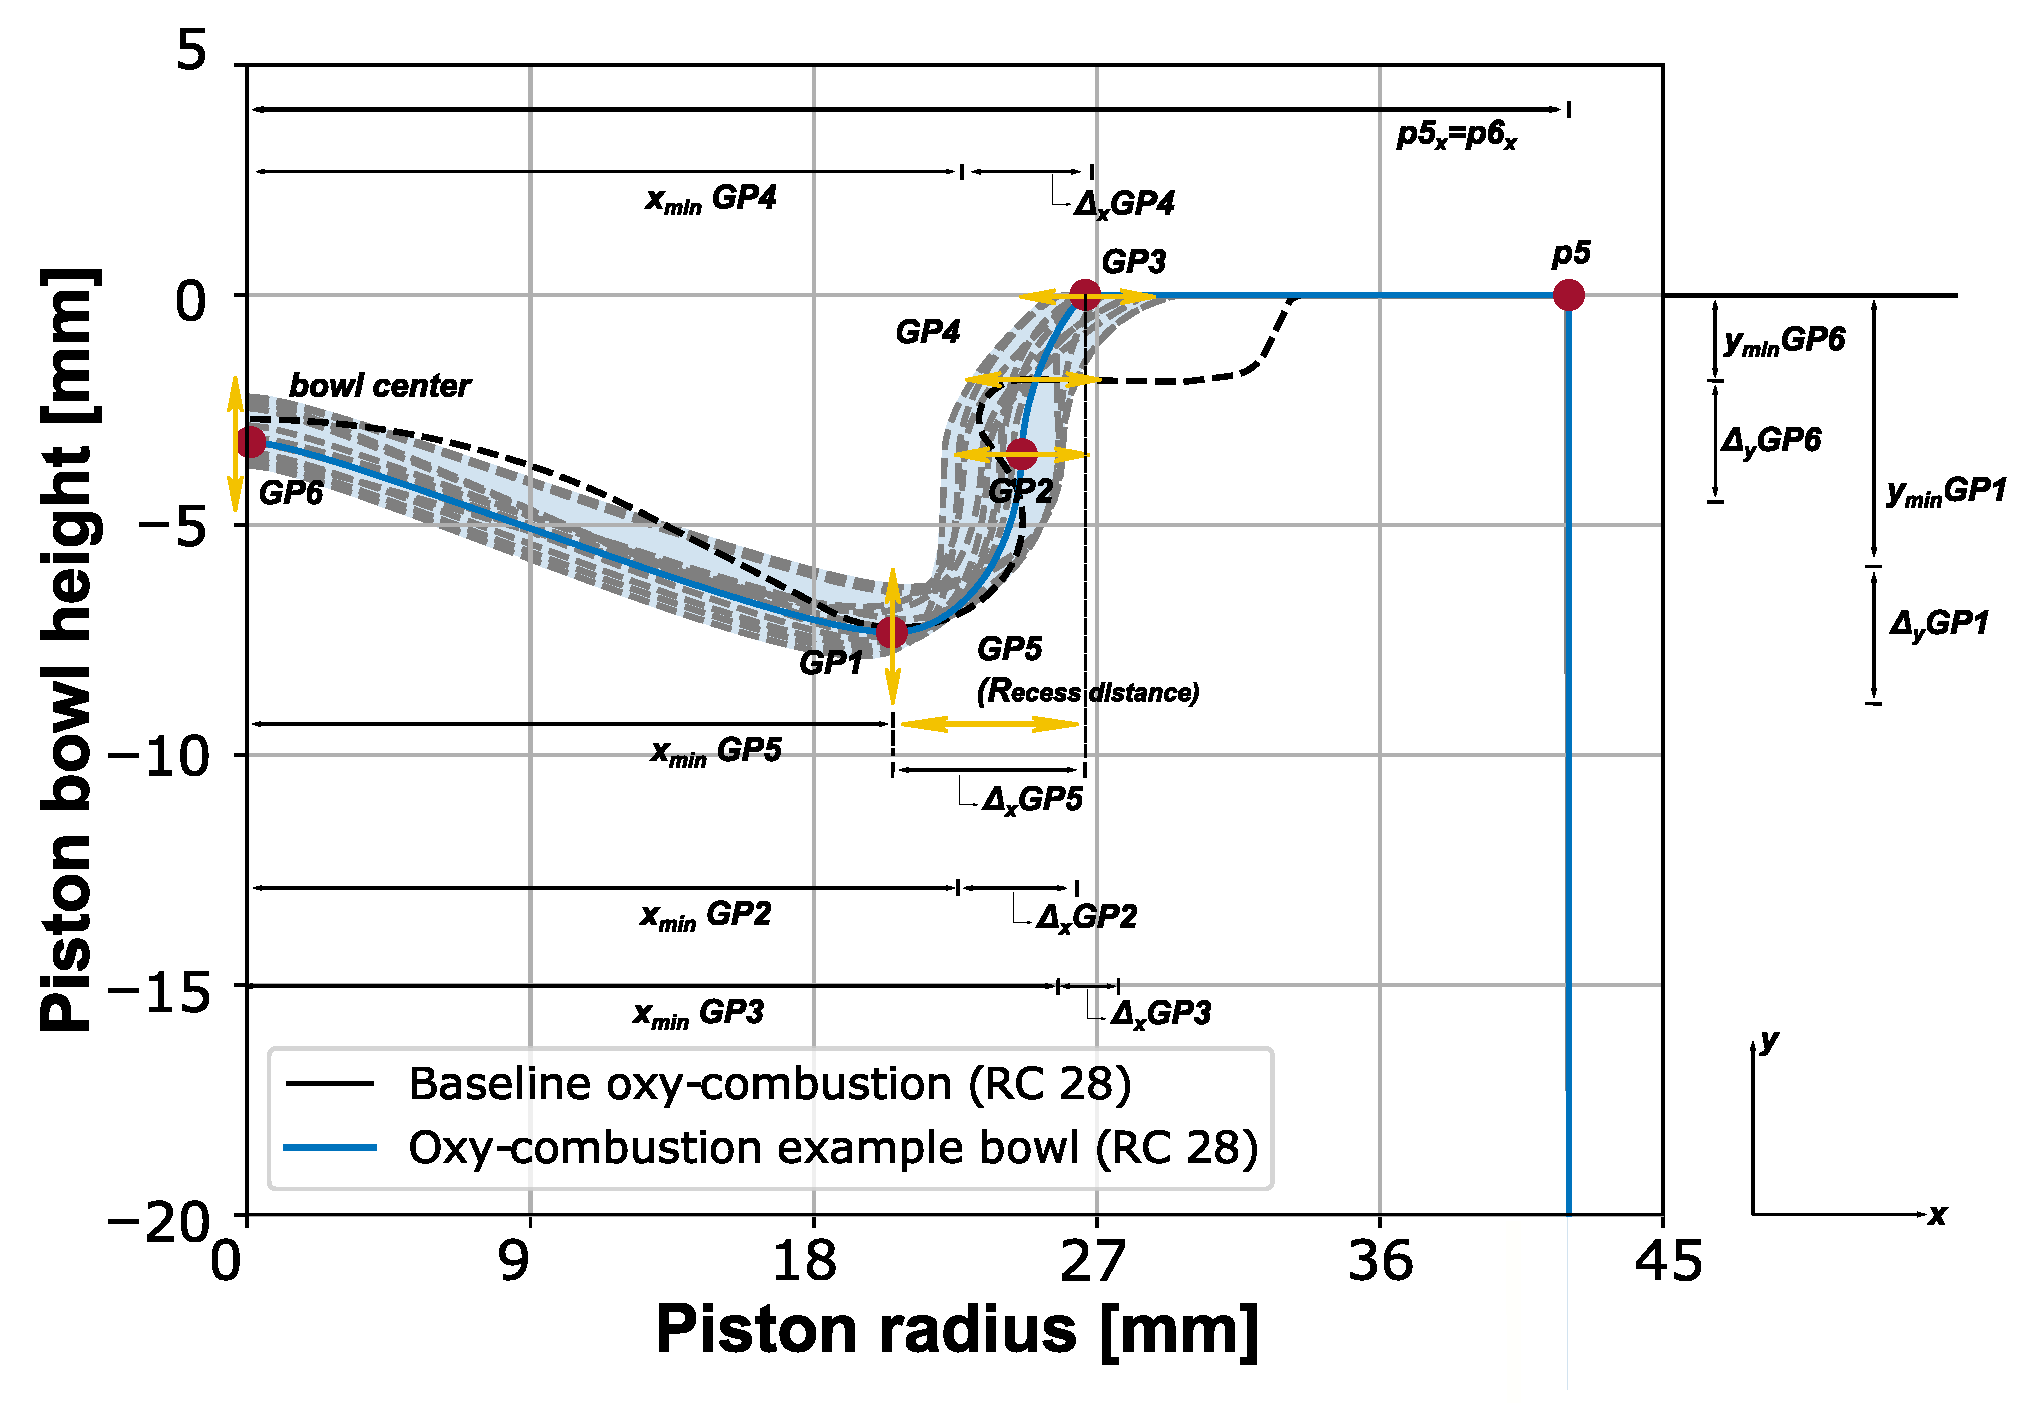
2.4.1. Piston Bowl Geometry Generator

An automatic piston bowl profile was implemented to generate the geometry of the combustion system through the use of Bezier polynomial curves [38] defined by six different control points. These six parameters are dimensionless, independent from each other, and have their own variation range in order to set a specific part of the piston bowl geometry. Considering that the piston bowl impacts directly on the compression ratio (CR) of the engine, the squish height is adjusted in order to maintain constant the CR, in a predefined value of 28. In Figure 4 the original piston bowl geometry is represented by the dashed line and compared with different geometries generated by using Bezier curves and all the points used to guide the geometry. In addition, the geometrical points (GP) are indicated, which are used as inputs in the NS-PSO algorithm. In Figure 4 the ` p ’ points are fixed and maintain the piston diameter constant.

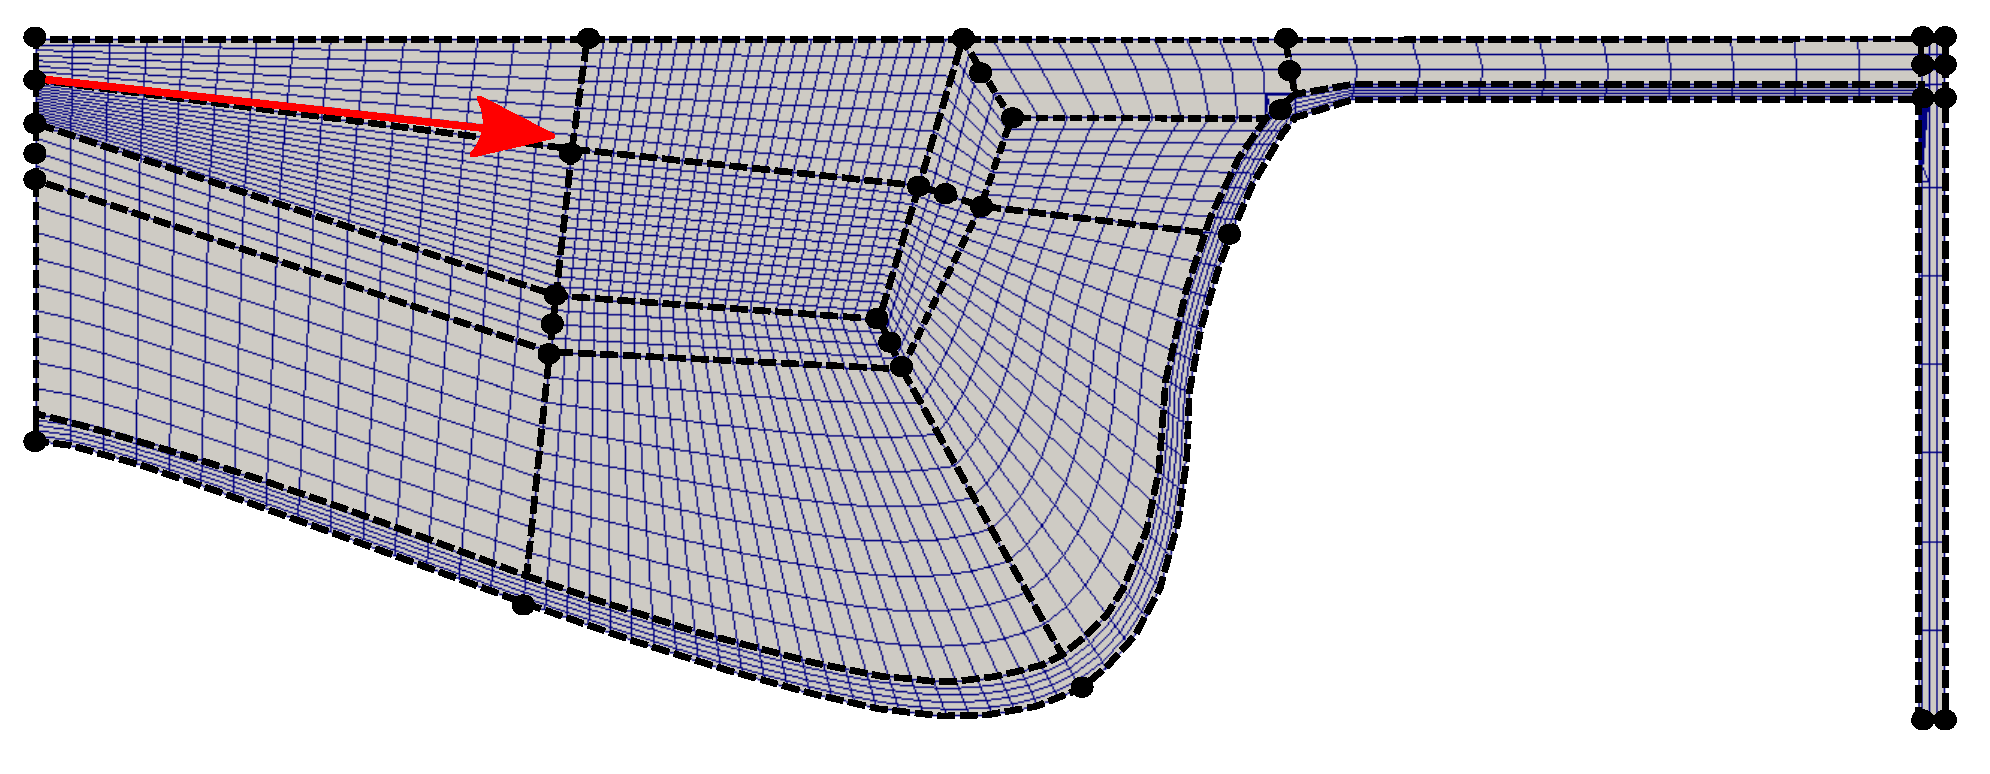
2.4.2. Mesh Generator

After the definition of the bowl geometry profile, the case should be constructed for the CFD calculations. Here, the next step is to generate a mesh capable of reproducing the piston geometry, which also changes for every case. A code in Python was developed to generate all the meshes automatically by using the technique of dynamic mesh layering developed by Lucchini et al. in [26]. This technique divides the domain in different blocks defined by control points and also maintains as fixed the number of cells around the spray region. The control points can move depending on the piston bowl geometry and the spray angle of each case, but the number of cells inside each block is constant. Then, the total number of cells for all simulations is the same. Furthermore, the orientation of the cells near the nozzle varies as a function of the spray angle. Figure 5 represents the definition of the control points, the blocks used to group the cells, the spray angle and the orientation of the cells. Moreover, each mesh is constructed as a sector based on the injector holes number, which is another input for the optimization. The simulation is performed for the combustion chamber with only one spray based on the axy-symmetric assumption to save computational time, because a large number of cases are required for the convergence of the optimization process.

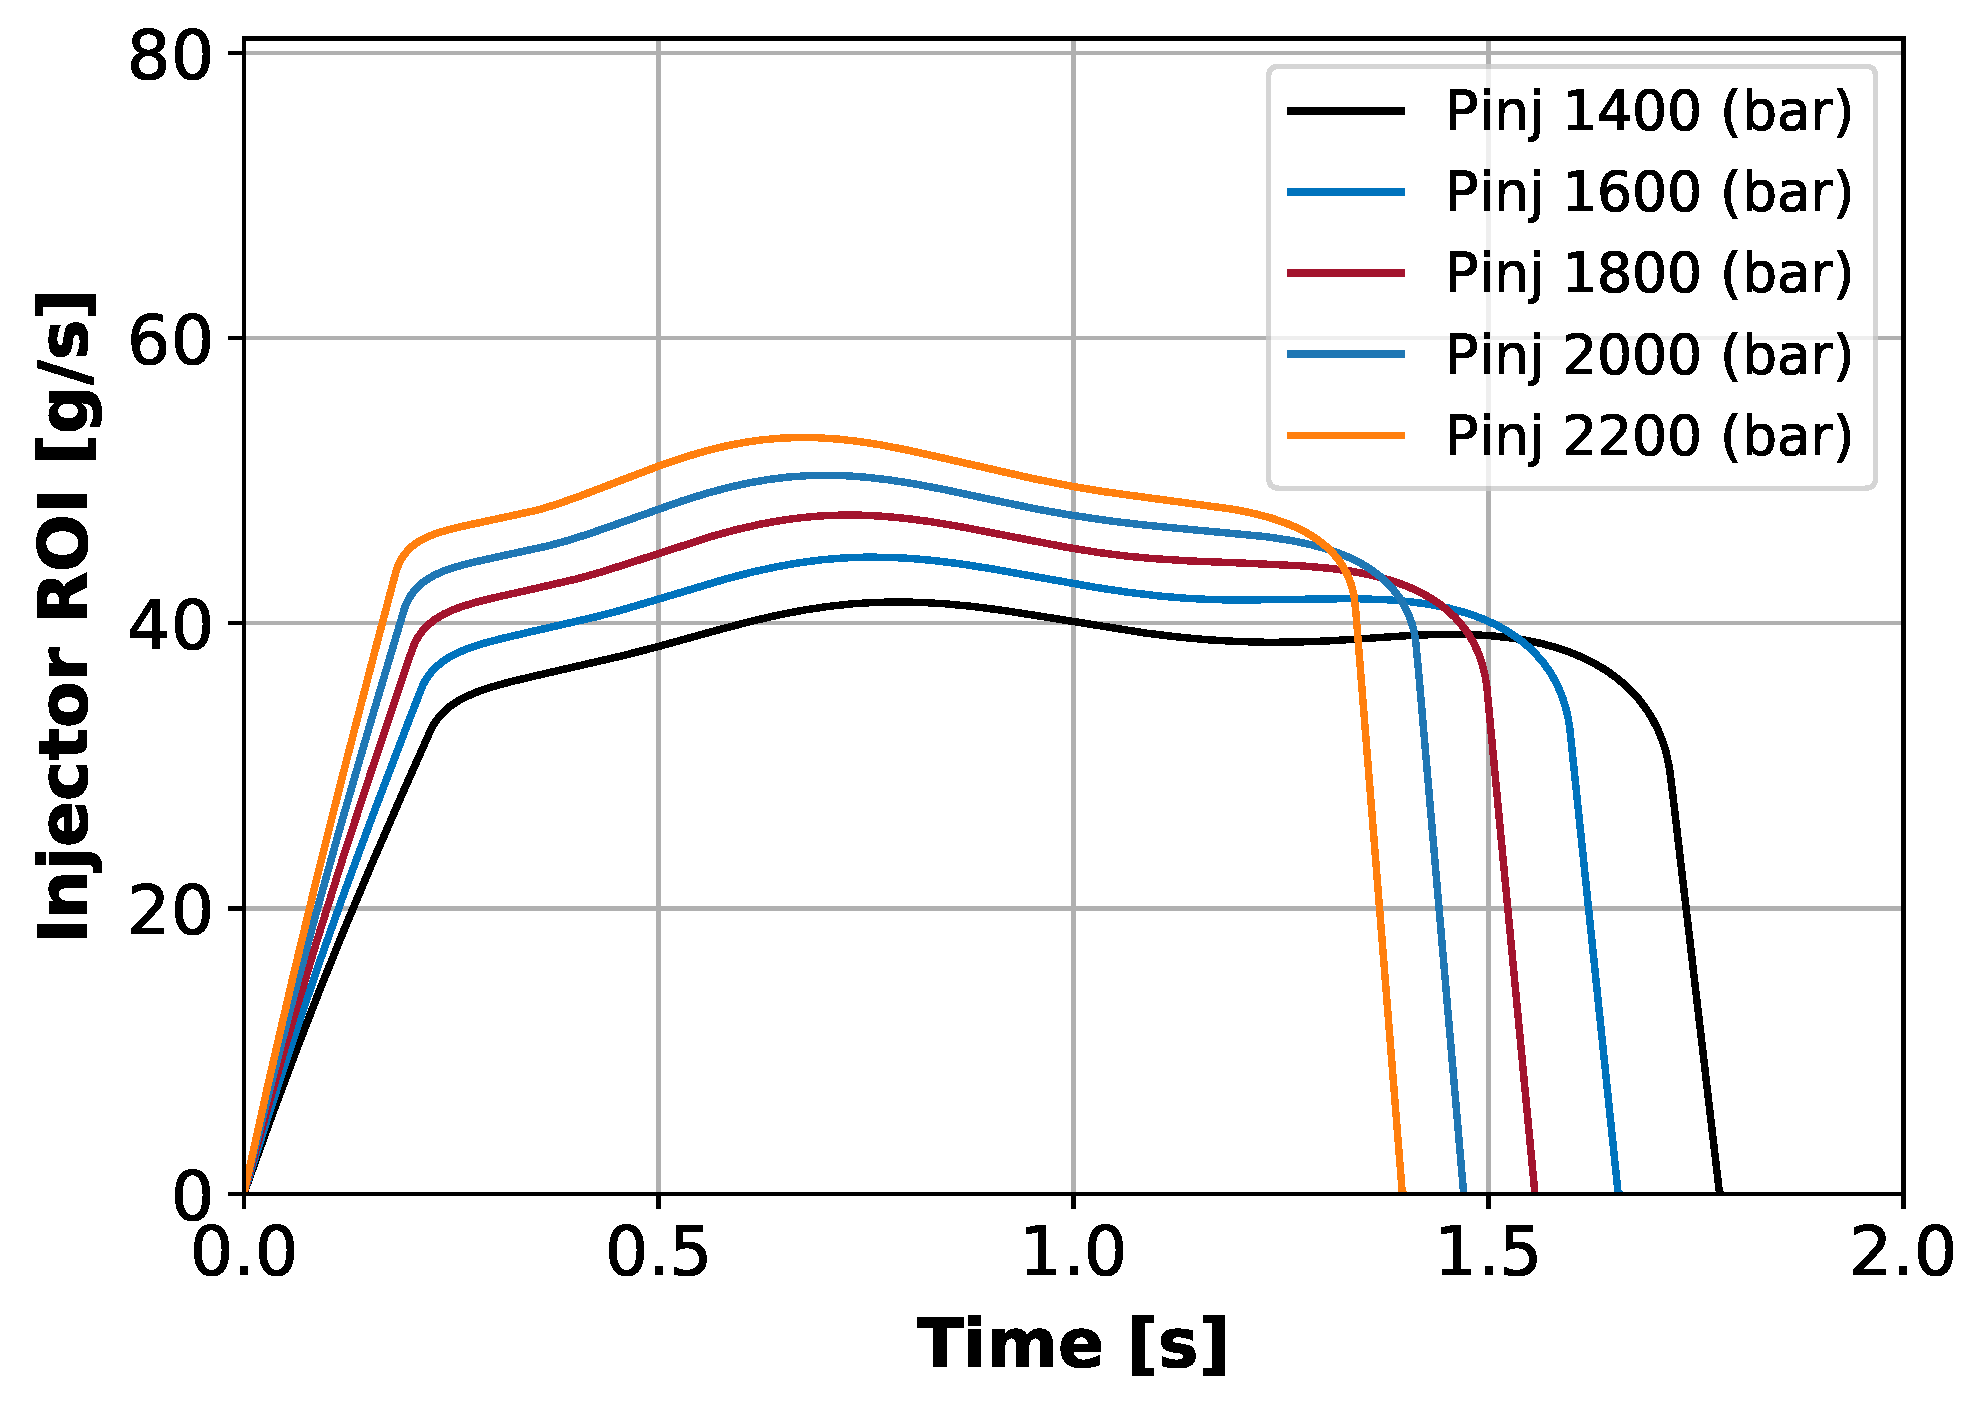
2.4.3. Virtual Injection Model

The rate of injection (ROI) profile is a factor that directly affects the combustion process of CI engines. As the ROI profile depends on several parameters used as inputs, it is necessary to generate a specific ROI for each case by using an in-house code (VIM) [31,39]. This tool builds a mass flow rate curve as a function of the number of holes, the injection pressure and the total mass of injected fuel in the cycle. It assumes that the flow inside the orifice of the injector is incompressible, solving the equations of Bernoulli and continuity between the inlet and outlet of the orifices. The nozzle permeability was a conserved constant for all cases, which leads to the need to update the nozzle diameter for each case, and also the need to modify the injection duration. Figure 6 shows a set of ROI curves generated by the code for different injection pressure levels.

3. Results and Discussion

This section summarizes the results obtained from the optimization process. First, the convergence of the optimization algorithm is presented, and the evolution of the output parameters is analyzed. Then, the results of the optimized combustion system are compared against the reference case for a better understanding of this new system that should maximize the benefits of the oxy-fuel combustion concept.

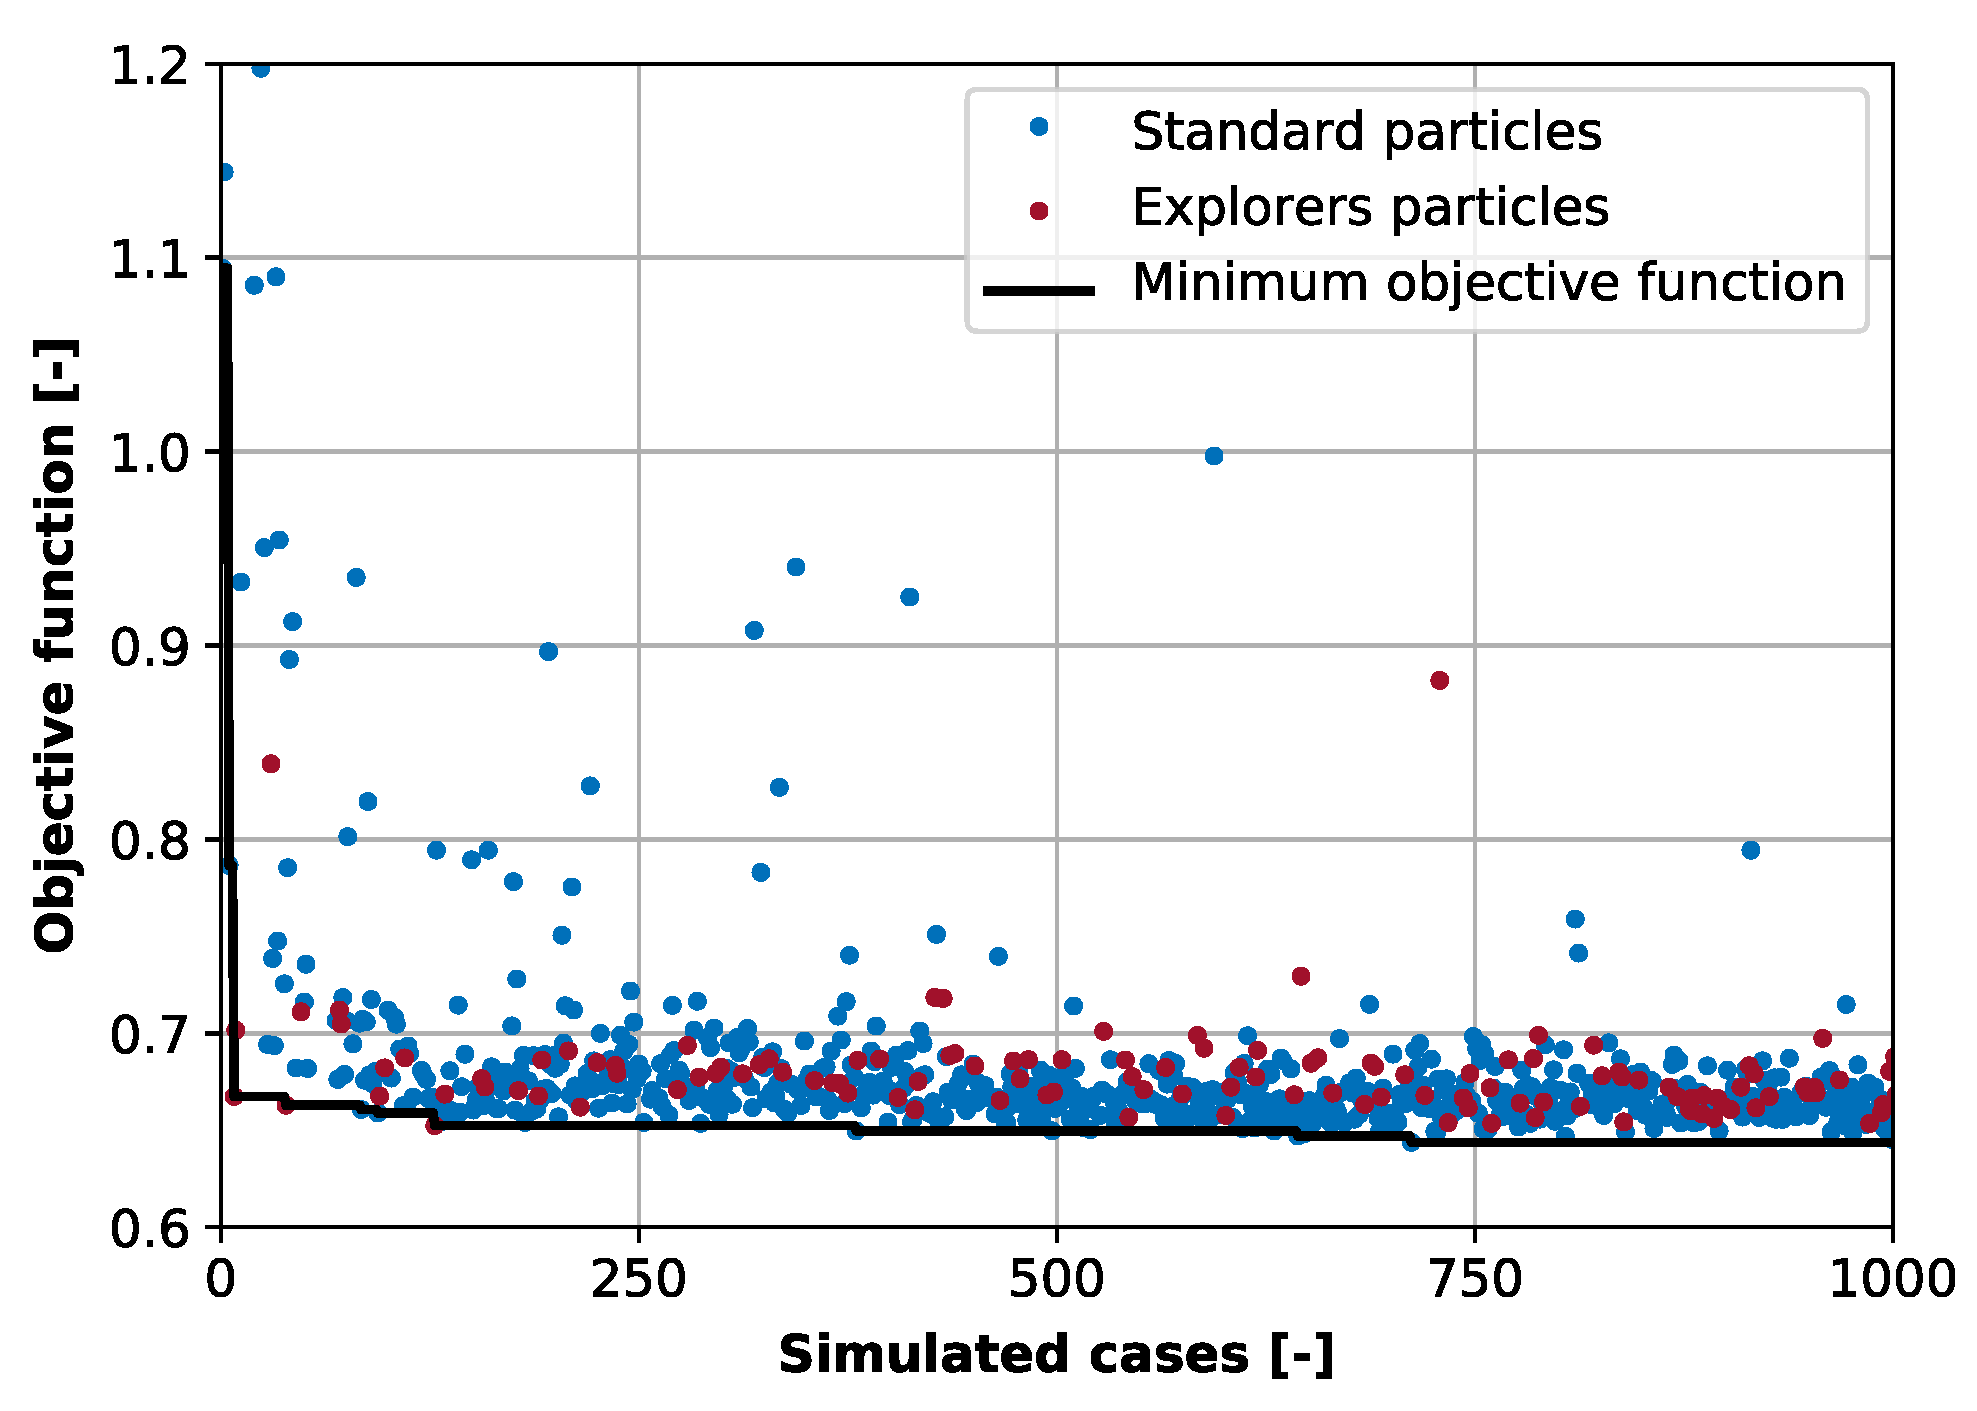
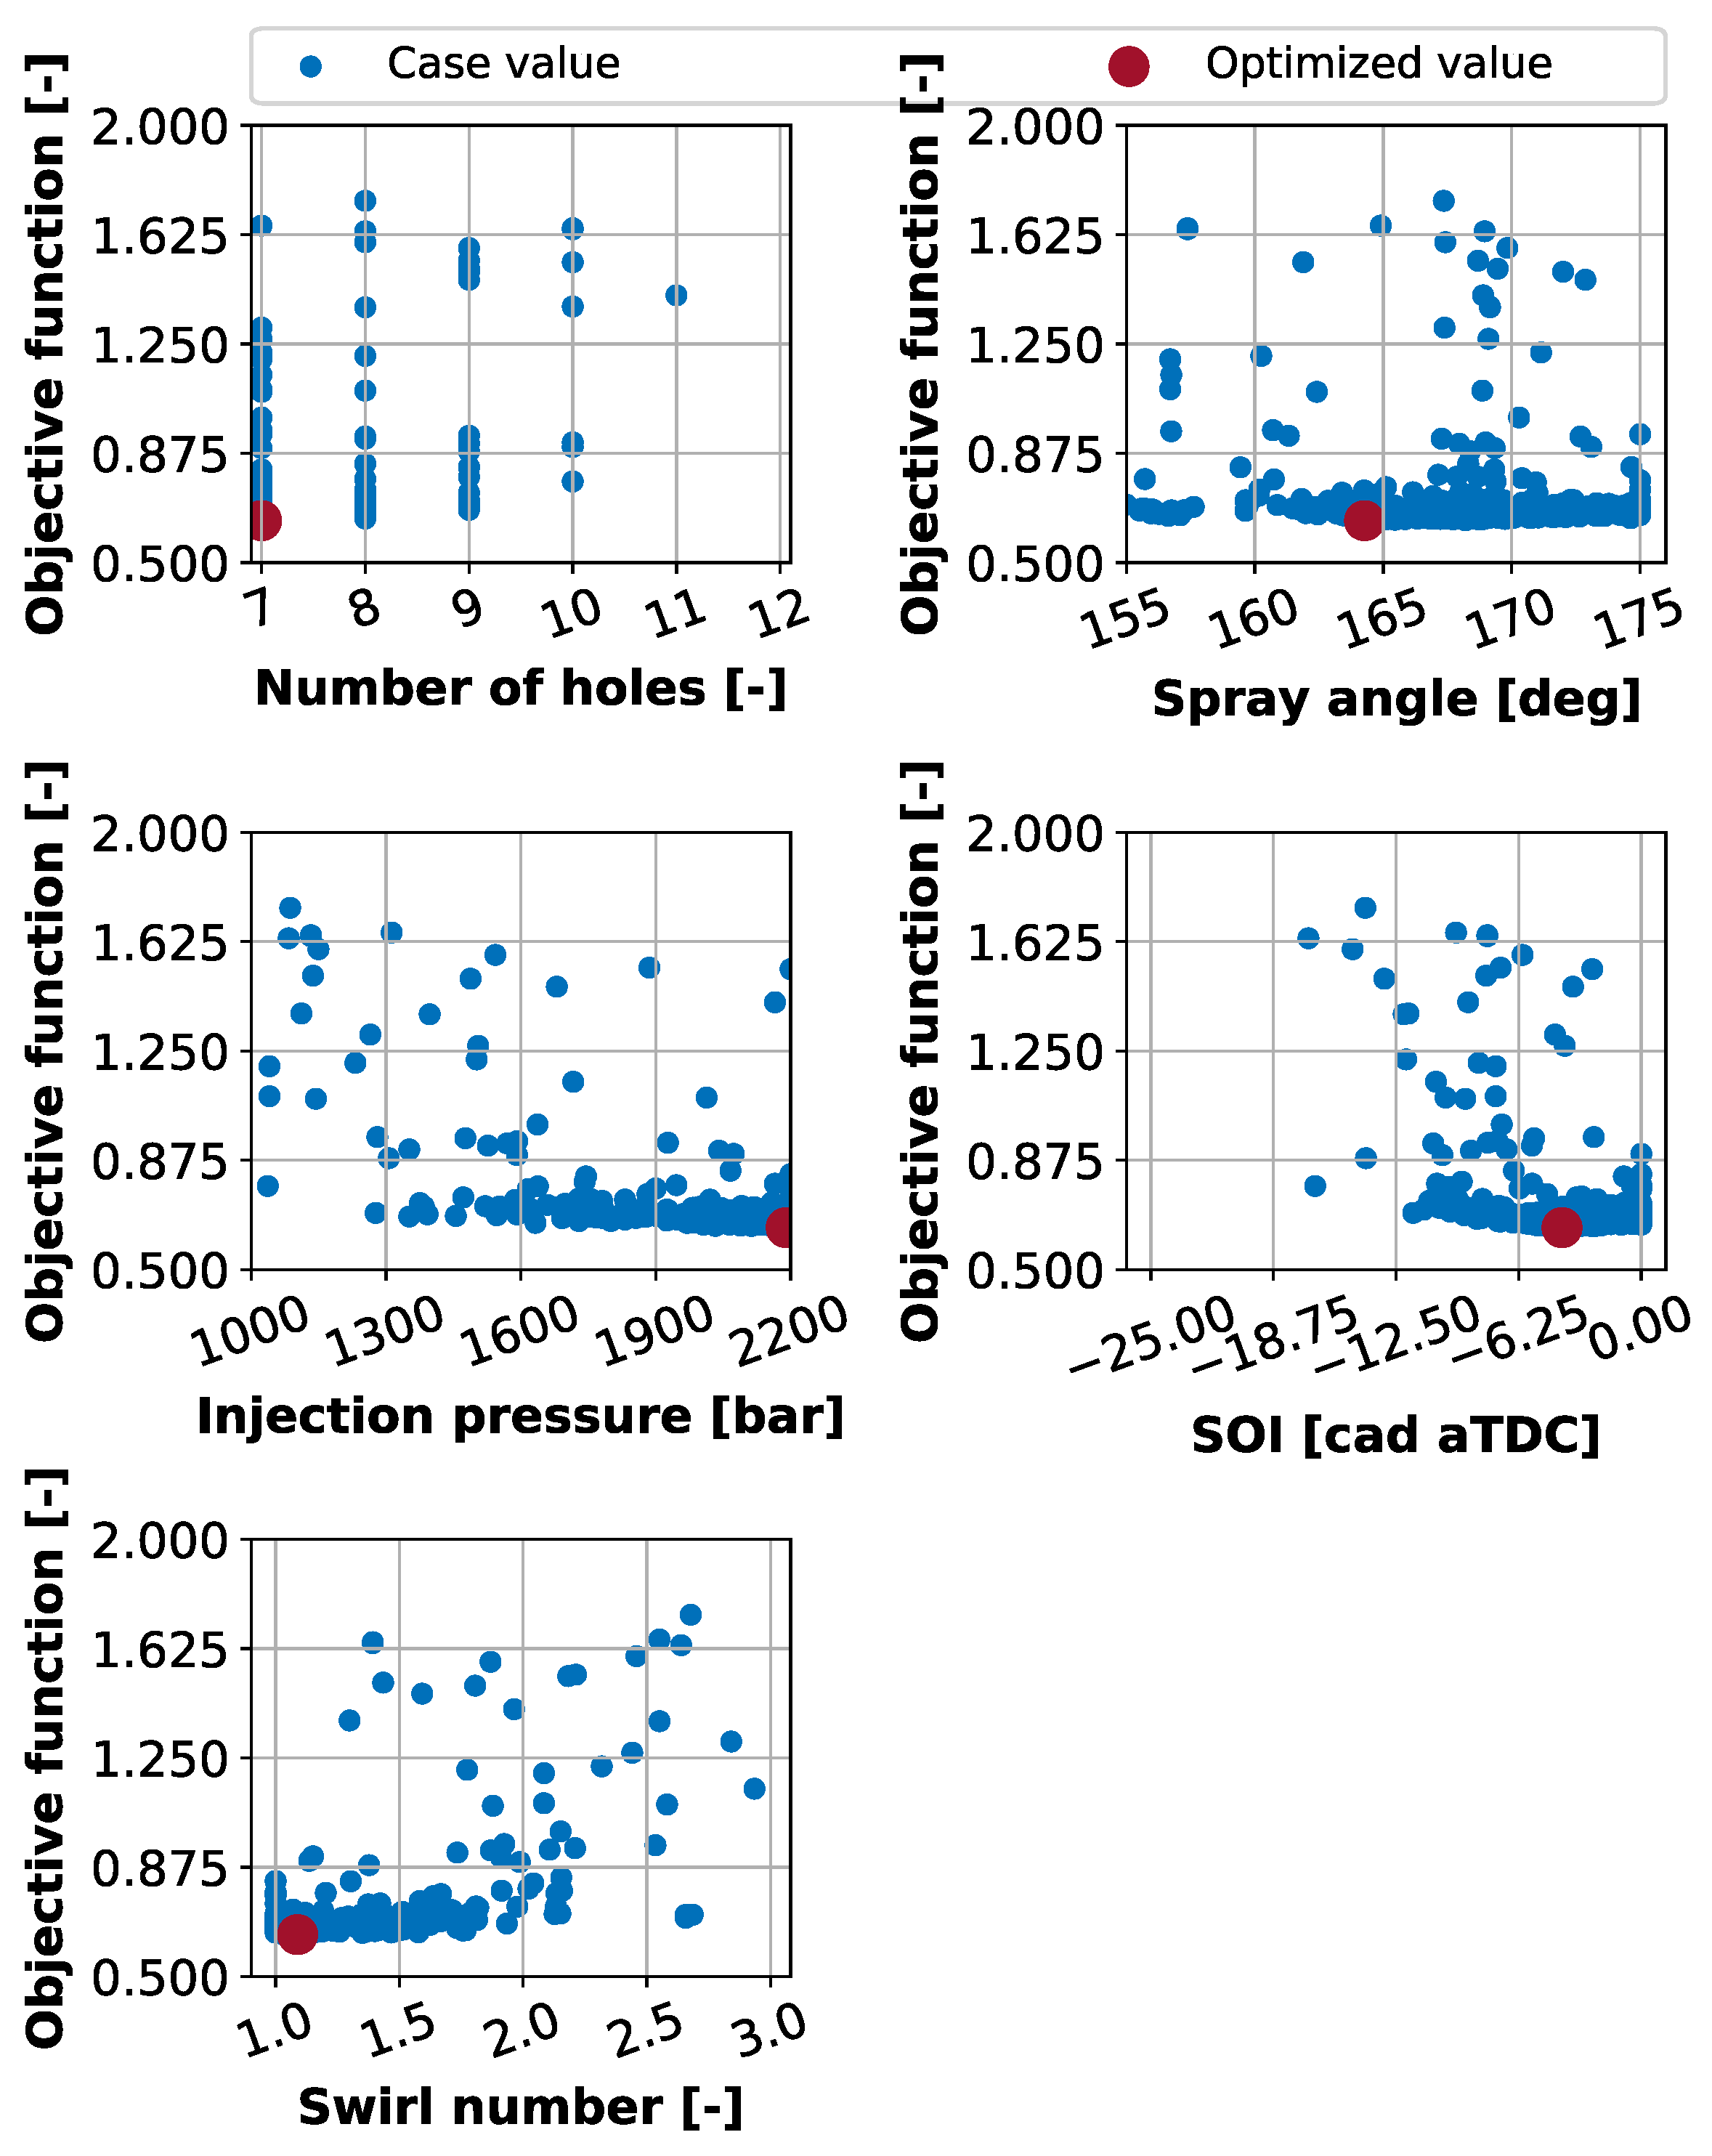
3.1. Optimization Process Results
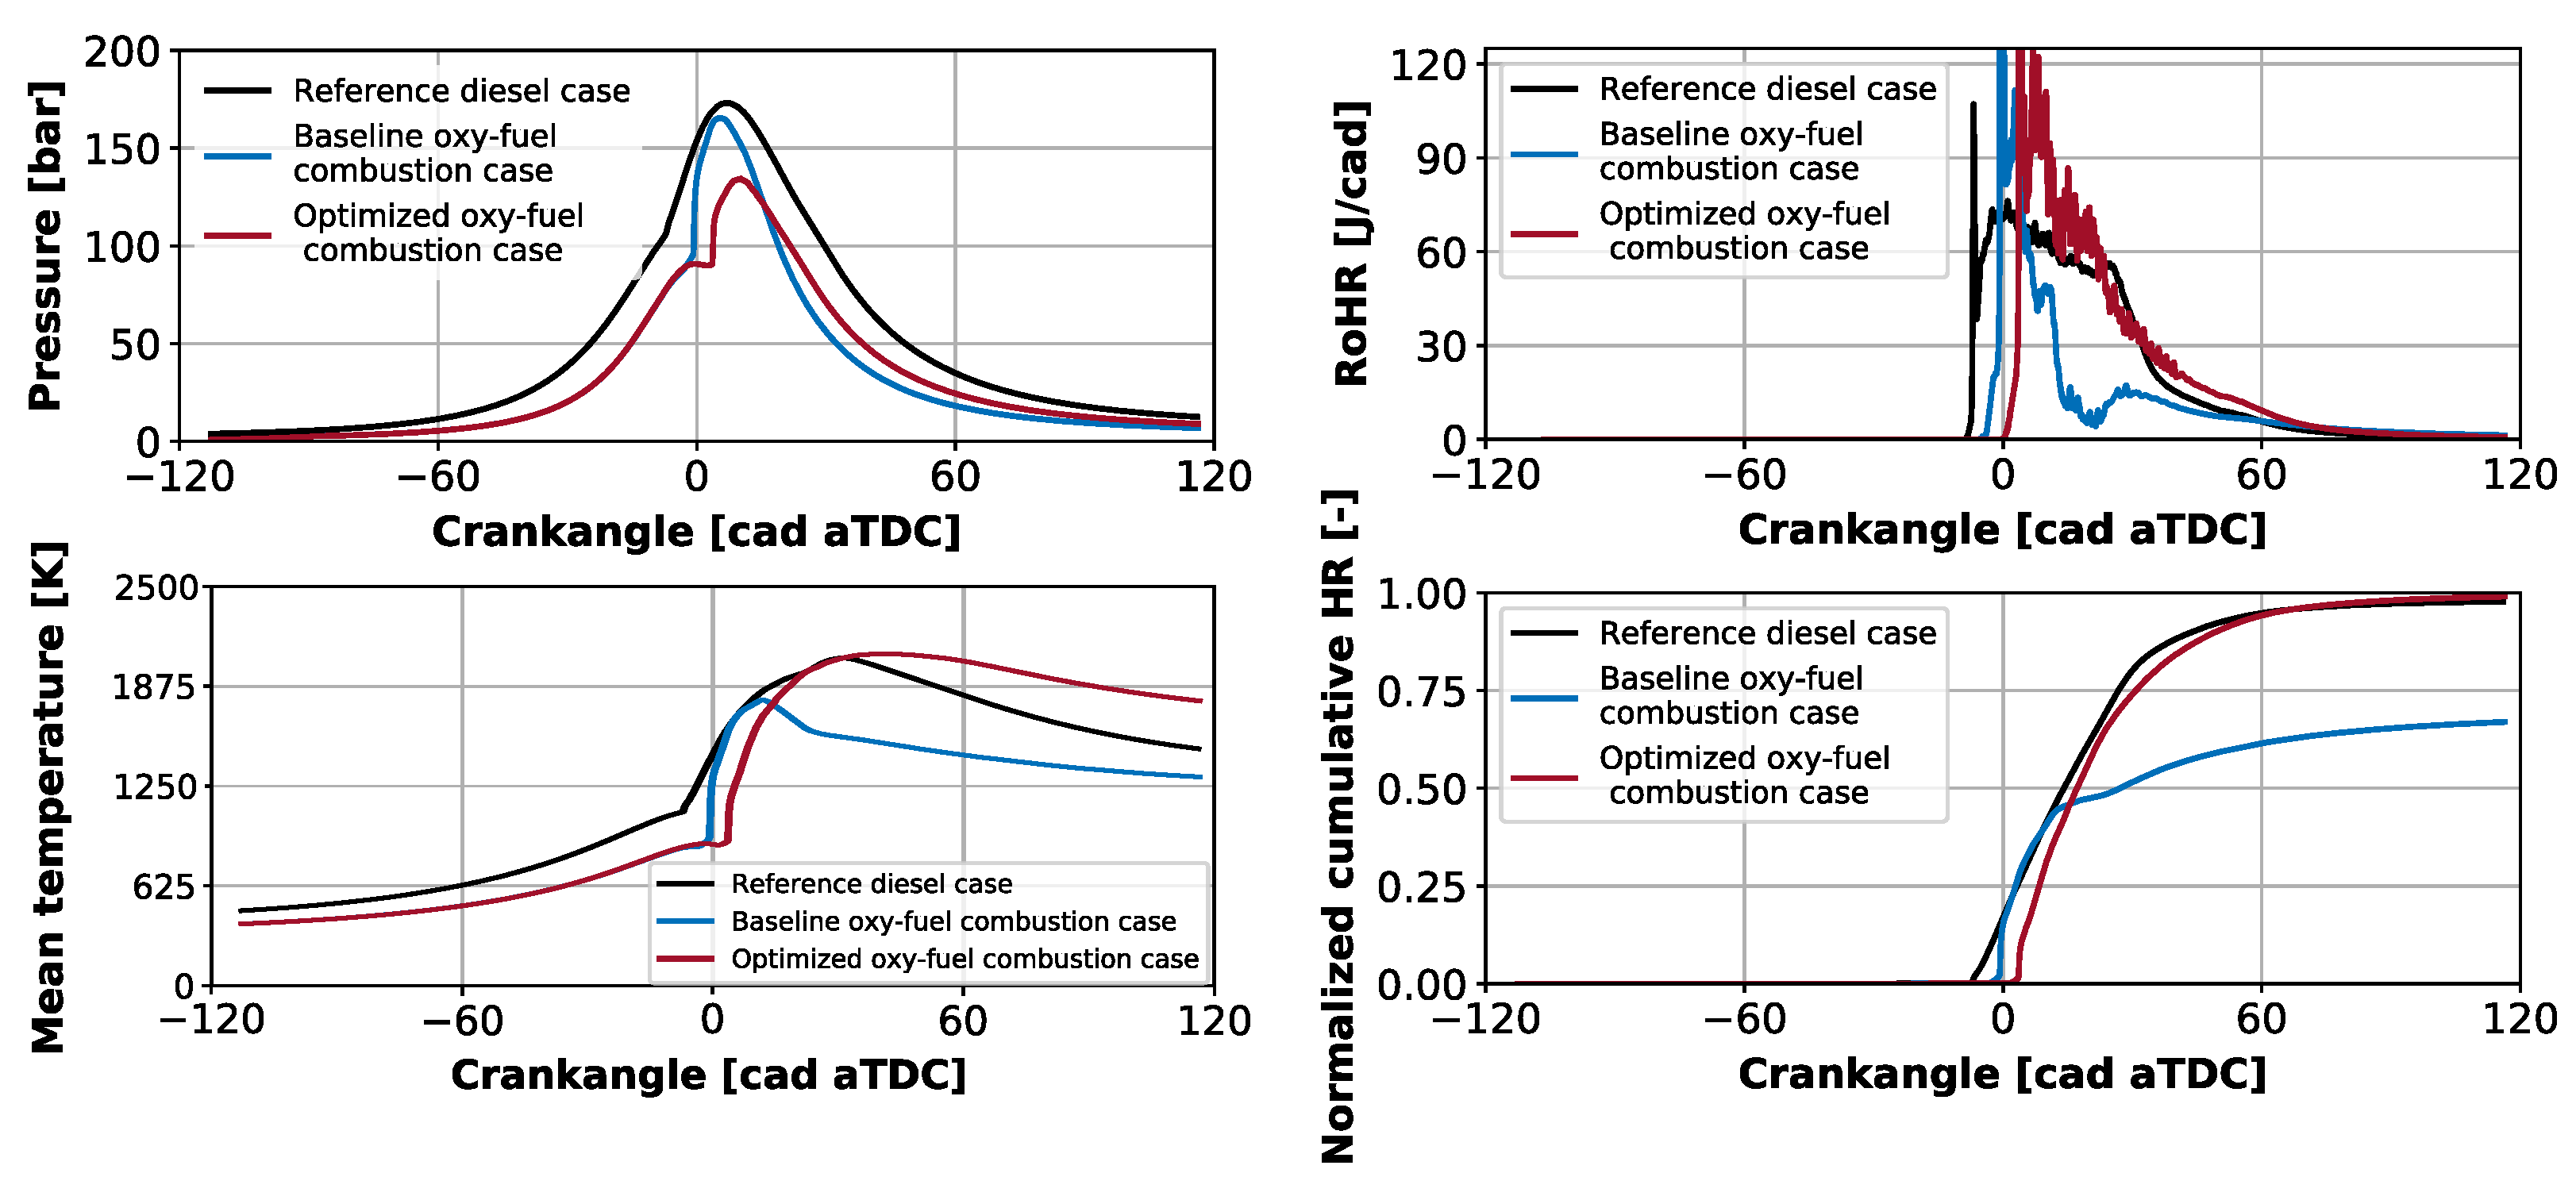
The initial step of the analysis of the results was the verification of the algorithm convergence. Figure 7 presents the evolution of the global objective function for all the cases simulated with CFD. It can be seen how the PSO-NS algorithm decreases the value of the objective function as it progresses, converging toward a minimum value. The definition of best particle refers to the one with the minimum value of the objective function until that current iteration. The capability of the PSO-NS for rapid convergence is observed, because the objective function decreases quickly from the beginning of the procedure. In this figure, the black dots represent the cases related to the standard particles, and the blue dots represent the particles that explore the domain. The best particle, the one with the lowest objective function, was obtained around the simulated case 720.
Subsequently, an analysis of the optimization targets and constraints was performed, to verify the evolution of these parameters during the optimization process. Figure 8 shows the progression of these parameters for each simulated case. The results obtained for soot and efficiency are shown in the bottom graphs and show a great improvement in both variables. Although the optimization process was capable of reducing the soot emissions close to a virtual zero, the efficiency exhibits an improvement of 8.8% in relation to the baseline oxy-fuel combustion case (marked with the horizontal dashed line). Likewise, all the graphs evidence a common information, the high variability of the outputs at the beginning of the optimization process with results that do not meet the constraint values. As the simulations evolve, the majority of the points try to reach the optimized region. However, some points seem to be scattered with relatively bad results in terms of soot or efficiency. These dispersed points are explorer particles that seek new positions throughout the search space, away from the optimal region.
Moreover, the top graphs represents the evolution of the constraints of the objective function: CO and maximum pressure respectively. In this figure, the blue dots represent each simulated case, and the black dashed line is the constraint, obtained from the baseline engine configuration operating under oxy-fuel conditions. Along the progress of the optimization, the blue dots tend to move far from their respective constraint value, especially on the reduction of the CO values, due to the high correlation between the reduction of CO emissions and the increase of the efficiency, also reported by Zubel et al. [40]. Finally, the optimized case is represented by the red dot in the four plots.
The dependency of the objective function value on the geometrical parameters is shown in Figure 9, where again the red dot represents the optimized case and the blue dots are the value of each parameter for each case. The geometrical parameter 1 (GP1) adjusts the depth of the piston and is presented in the left-top graph. The optimization process tends to move the value of GP1 toward regions near the maximum limit of this parameter, decreasing the height of the piston bowl. For the geometrical parameter 2, most points are concentrated near to the maximum limit of this parameter, suggesting that the bowl diameter increment would enhance the performance of the oxy-fuel combustion concept. The evolution of the geometrical parameter 3 during the optimization process starts with some cases in the minimum limit moving to an intermediate region of the total range, but nearer to the maximum limit. This evolution modifies the point GP3 in Figure 4, changing the initial geometry of the deep re-entrant piston toward an almost no re-entrant geometry. The geometrical parameters 4 and 5 are responsible for adjusting the curvature between the points GP2 and GP3 (shown in Figure 4) and the alignment between GP1 and GP2, respectively. The GP4 has values in the middle of the parameter range in order to obtain a smoother bowl shape with a lower objective function. Then, the GP5 was conduced to the maximum value of the range, again avoiding the re-entrant shape. The last parameter, the GP6, is capable of updating the bowl centre depth. The results for this parameter converge close to the maximum value possible.
Figure 10 summarizes the distribution of the objective function in the domain of each parameter related to the injection system and the swirl number. Analogous to previous figures, the blue dots represent each simulated case, and the red dot is the best configuration found for the oxy-fuel concept. The top-left graph shows that the most suitable number of orifices is the minimum in the studied range, leading to a big orifice diameter. This preference for fewer orifices is related to the reduction of the CO emissions, in agreement with the results of Yoon et al. in [41]. Furthermore, the PSO-NS algorithm explores all the possible ranges for the spray angle value. The best case is located in the spray angle value that matches the piston geometry [42]. Regarding the injection settings, the best case moves to the maximum level in the explored range, which is related to the fact that higher injection pressure improves the atomization and evaporation of the fuel, enhancing the mixture and the ability to react with the oxygen present in the combustion chamber [43].
Moreover, the SOI distribution during the optimization evidences that when the injection is advanced, the combustion performance deteriorated, because it promotes a longer ignition delay with a higher gap between fuel injection and the start of combustion. Thus, the heat release rate had a large peak in the premixed combustion phase, and a maximum in-cylinder pressure value beyond the constraint of the optimization process [44]. On the other hand, when the SOI moves toward the top dead center, the ignition delay is reduced, with a smoother start of combustion.
Lastly, the reduction of the swirl number is related to the increment of the bowl diameter that will reduce the gas velocity in the bowl, and at the same time, could reduce heat transfer and other energy losses [45].
The plots in Figure 11 corroborate the fact that the best case (the red dot with the minimum objective function), is obtained for the lowest soot level and the maximum efficiency, which were the objectives of the optimization process. Also, the constraints are respected, with a high reduction of CO emissions, associated with the maximum efficiency trend.
The Pareto fronts can be seen in the left side of Figure 12 where the initial diesel reference case is the black dot and the optimum case is represented with the red dot. In both plots, the vertical dashed line represents the efficiency of the baseline case, and the horizontal dashed lines indicate the respective levels for the constraints. In both graphs, several cases meet the constraints (are below the horizontal dashed lines), and provide a better efficiency than the oxy-fuel baseline case. Because the objective function is composed by four parameters with different coefficients that define the optimization priorities, the best solution is the combination between the constraints and the objectives with a best trade-off between all these outputs simultaneously. The plots on the right side of Figure 12 illustrate how the optimum case tries to reach the lowest HC level maximizing the efficiency. The most promising result can be seen in the soot vs. HC comparison (bottom-right plot in Figure 12), where both pollutant emissions were drastically reduced from the oxy-fuel baseline case, even reaching values much lower than the initial diesel reference case, with plenty of solutions still under the constraints.
Based on the results, the optimized geometry profile was compared against the baseline geometry, which is the same of the original diesel engine but adapted to the CR 28. The comparison of both geometries is shown in Figure 13. The baseline step-bowl profile changed to a new geometry without the step, where the re-entrant configuration has also disappeared. Initially, one objective of the step-bowl was to split the the fuel spray in two parts, with one direction toward the cylinder head, and the other part into the bowl. This helped the spray to avoid reaching the squish zone, resulting in less soot generated close to the cylinder walls, decreasing the soot-in-oil production in the engine [46,47]. The new bath-tube geometry is a result of the optimization process that reduces the soot emissions, and at the same time improves the efficiency, because this new geometry is focused on the area reduction, which reduces the heat transfer losses and improves the engine efficiency [48]. Additionally, the spray angle changes in order to match the new geometry. The spray angle in the baseline case conduces the injected fuel within the piston bowl, promoting spray-wall impingement; meanwhile in the new configuration the angle is wider. Therefore, the distribution of the spray in the chamber volume is more uniform, increasing the interaction between the injected fuel with the gas mixture available inside the chamber.
Finally, Table 8 summarizes the parameters that describe the combustion system for the baseline and the optimized cases. The oxy-fuel combustion concept requires an injector with lower orifice number (that is higher diameter in order to keep the same nozzle area). A wider spray angle is obtained, matching the new piston bowl geometry and avoiding excessive fuel impingement with the walls. Moreover, the optimal number of holes depends on the engine operating condition and compression ratio, but in general a low number of holes results in good efficiencies because it promotes the highest rate of heat release during the mixing combustion phase [47,49]. The swirl number was reduced following the number of injector nozzle behavior. The injection pressure is higher, improving the spray momentum, the atomization, and the mixing rate. The last parameter is the SOI and it was delayed until an instant where it is possible to control the peak of in-cylinder pressure within the limit of the engine operation.

3.2. Engine Results

In Figure 14 the comparison between the in-cylinder pressure, temperature, rate of heat release, and the cumulative heat release are presented. The lower in-cylinder pressure trace in the oxy-fuel cases comes from the differences in the gas properties, due to the absence of nitrogen as already mentioned in Section 2.2.1. Both oxy-fuel combustion cases, baseline cases, and optimized cases have the same CR and the differences in the peak of pressure are due to the differences in the engine settings. For instance, the optimization procedure indicates that for a proper operation in oxy-fuel mode, the start of injection should be delayed, near the top dead center, with a higher injection pressure. The benefit of this strategy is evidenced in the heat-release rate curves, where the start of combustion occurs sooner because the ignition delay is shorter because the injection occurs when the gas in the chamber is at a higher temperature and pressure. The wider bowl shape without the re-entrant edge minimizes the wall impingement and avoids the slowdown of the combustion observed in the blue curve around 15 cad. Another factor responsible for this improvement is the higher injection pressure, which atomizes the fuel better and helps to find the oxygen available in the chamber, enhancing the mixture distribution. The cumulative rate of heat-release curves corroborate this behaviour (bottom-right graph in Figure 14). The modifications in the combustion system allow the fuel to burn more efficiently in the engine, with a combustion efficiency more similar to those of conventional air-diesel engines.
Moreover, the evolution of the mean temperature along the cycle is analyzed because it is an important parameter for the correct operation of the MIEC. The bottom-left graph in Figure 14 shows that the temperature level in oxy-fuel cases is lower from the IVC and during the compression stroke. However, as soon the combustion starts, the temperature trace in the optimized configuration increases and reaches levels similar to the conventional diesel operation mode, delivering an exhaust gas with temperatures higher than 1500 K, and then this energy can be used for the O 2 separation in the MIEC membrane. This result is consistent with the RoHR curves (see the upper-right plot in Figure 14). This result is representative of the EGR level settled in the boundary conditions for the current study; however this might vary for different EGR rates as was determined by Serrano et al. in [5].
The improvement in terms of emissions per cylinder is listed in Table 9. Comparing the combustion system of the optimized oxy-fuel combustion case against the reference diesel case, it is possible to see that the soot emissions are widely reduced, obtaining values near to virtual zero. Regarding the CO emissions, the initial baseline engine operating with an oxy-fuel combustion concept produced an unacceptable level of this pollutant specie, ten times higher than the standard reference diesel. The new chamber hardware combined with adequate engine settings allowed for a decrease in the CO emissions to a lower level than the reference diesel. This result is obtained even with the restricted oxygen quantity in the system (lambda is 1.1, because its production in the membrane is costly). The unburned hydrocarbon emissions showed a similar trend, which can be noticed because the new combustion configuration produces lower HC (in mg/s per cylinder) than the initial diesel reference case, which is in agreement with the combustion efficiency observed in the cumulative HR curves presented in Figure 14. In the preliminary stage, the baseline oxy-fuel case generated extremely high levels of unburned hydrocarbons, due to strong jet-wall interaction that slowed down the combustion combined with the formation of very rich zones near the squish, with little O 2 availability, that stopped the combustion process. However, the configuration found by the optimization procedure was able to promote the mixture formation and the O 2 consumption as is corroborated in the last part of this section.
Additionally, the net indicated efficiency was also evaluated. It is net indicated efficiency, because for this analysis only the high pressure indicated work is taken into account, because the study is focused on the closed cycle and the combustion process. It can be seen that the changes in the system produced an increase in the net indicated efficiency of the engine compared to the baseline oxy-fuel combustion (from 26.6% to 35.7%). However, this value is still far from the initial value of the conventional diesel case (40.1%). Because the carbon dioxide molecule has a larger specific heat capacity compared with oxygen and nitrogen, the increment of CO 2 in the combustion chamber due to the higher EGR rate used in the oxy-fuel combustion concept, will vary the specific heat capacity of the mixture. Therefore, the adiabatic expansion coefficient ( γ ) when operating with EGR + O 2 is lower than considering pure N 2 ; then the efficiency in the oxy-fuel case is lower compared to the reference one, although they have similar cumulative HR. For all the positive efforts made during the study, this is one weakness of the concept that still remains. On the other hand, it must be highlighted that this is compensated by the absence of NOx emissions in the exhaust gases. Moreover, because there is no N 2 , the CO 2 can be easily separated from the water vapor (by water condensation) and compressed until it reaches a supercritical condition. This means capturing it as a dense supercritical liquid of high purity (more than 95%). Therefore, the increment in BSFC does not mean an increment in CO 2 emissions.
Figure 15 shows the energy balance for each of the three cases presented in Table 9. For the baseline oxy-fuel combustion case, it can be seen that some amount of the energy that is lost due to the unburned fuel, because it cannot find the oxygen available in the chamber. On the other hand, the optimized oxy-fuel combustion case is able to burn most of the fuel recovering part of the energy that was wasted in the Baseline oxy-fuel combustion case (and comparable to the one from the reference diesel-air case). However, higher losses were found through the walls, where the most significant difference is in the liner region due to the difference in compression ratio and bowl shape. Also, an important part of the energy is lost in the exhaust gases as a consequence of the lower adiabatic expansion coefficient of the gas.
Lastly, in order to understand the distribution of the mixture in the system, Figure 16 shows contours of the oxygen concentration inside the combustion chamber during the combustion process. The columns of the figure correspond to the instants of 10% (CA10), 25% (CA25), 50% (CA50), 75% (CA75), and 90% (CA90) of burned mass, and the rows represent each one of the three simulated cases. For the reference diesel case, the oxygen concentration available at IVC is lower than the other cases due to the air composition (oxygen and nitrogen). In this case the fuel jets are able to find relatively easily the oxygen inside the chamber, with small amounts of oxygen remaining in the crevice region and near to the injector at the end of combustion (CA90). For the baseline oxy-fuel combustion case, the CA10, CA25, and CA50 phases occur almost at the same crankangle position, during the premixed phase of the combustion. Higher quantities of oxygen remained in the squish region that did not reach the fuel, evidencing rich zones and incomplete combustion, responsible of the soot formation. On the contrary, the optimized oxy-fuel combustion case shows better oxygen consumption at the end of combustion (from CA50 to CA90) in comparison with the baseline configuration, with a similar distribution compared to the reference air-diesel engine, evincing the advantages of the optimization procedure.
Figure 17 illustrates the temperature contour inside the combustion chamber for the diesel reference and the optimized configuration. Although the new combustion chamber has smaller volume, the jet is able to distribute and progress within the domain until it reaches the bowl wall. The matching between the jet and the bowl corner can be seen, re-distributing the spray inside the bowl and some other part toward the squish, where fresh oxygen is available (in agreement with Figure 16). After CA50 phases, the temperature contours show higher values for the optimized case than the diesel one, which are also evenly distributed. This is also consistent with the temperature traces in Figure 14. In this combustion concept the high temperature levels can be afforded because if there is no N 2 in the trapped gas in the cylinder, then there is no NO x production. Also, relatively high temperature levels are desired in order to provide sufficient energy to the MIEC, as mentioned before.

4. Conclusions

In this study, a numerical methodology for the optimization of an engine using oxy-fuel combustion was presented. This work aimed to find a proper combustion system architecture to improve the efficiency and reduce the pollutant emissions in a CI engine for oxy-fuel combustion concept application. The methodology, based on the CFD-NS coupling optimization algorithm, considered the combustion chamber geometry, injector system specifications, and air-management system to design a specific combustion system. The main conclusions obtained from this investigation can be summarized as follows.
  • The CFD-NS coupling optimization method has demonstrated to be an adequate procedure for redefining the baseline combustion system of a CI engine when it is operated under oxy-fuel combustion concept. This method includes several routines to automatize the optimization process.
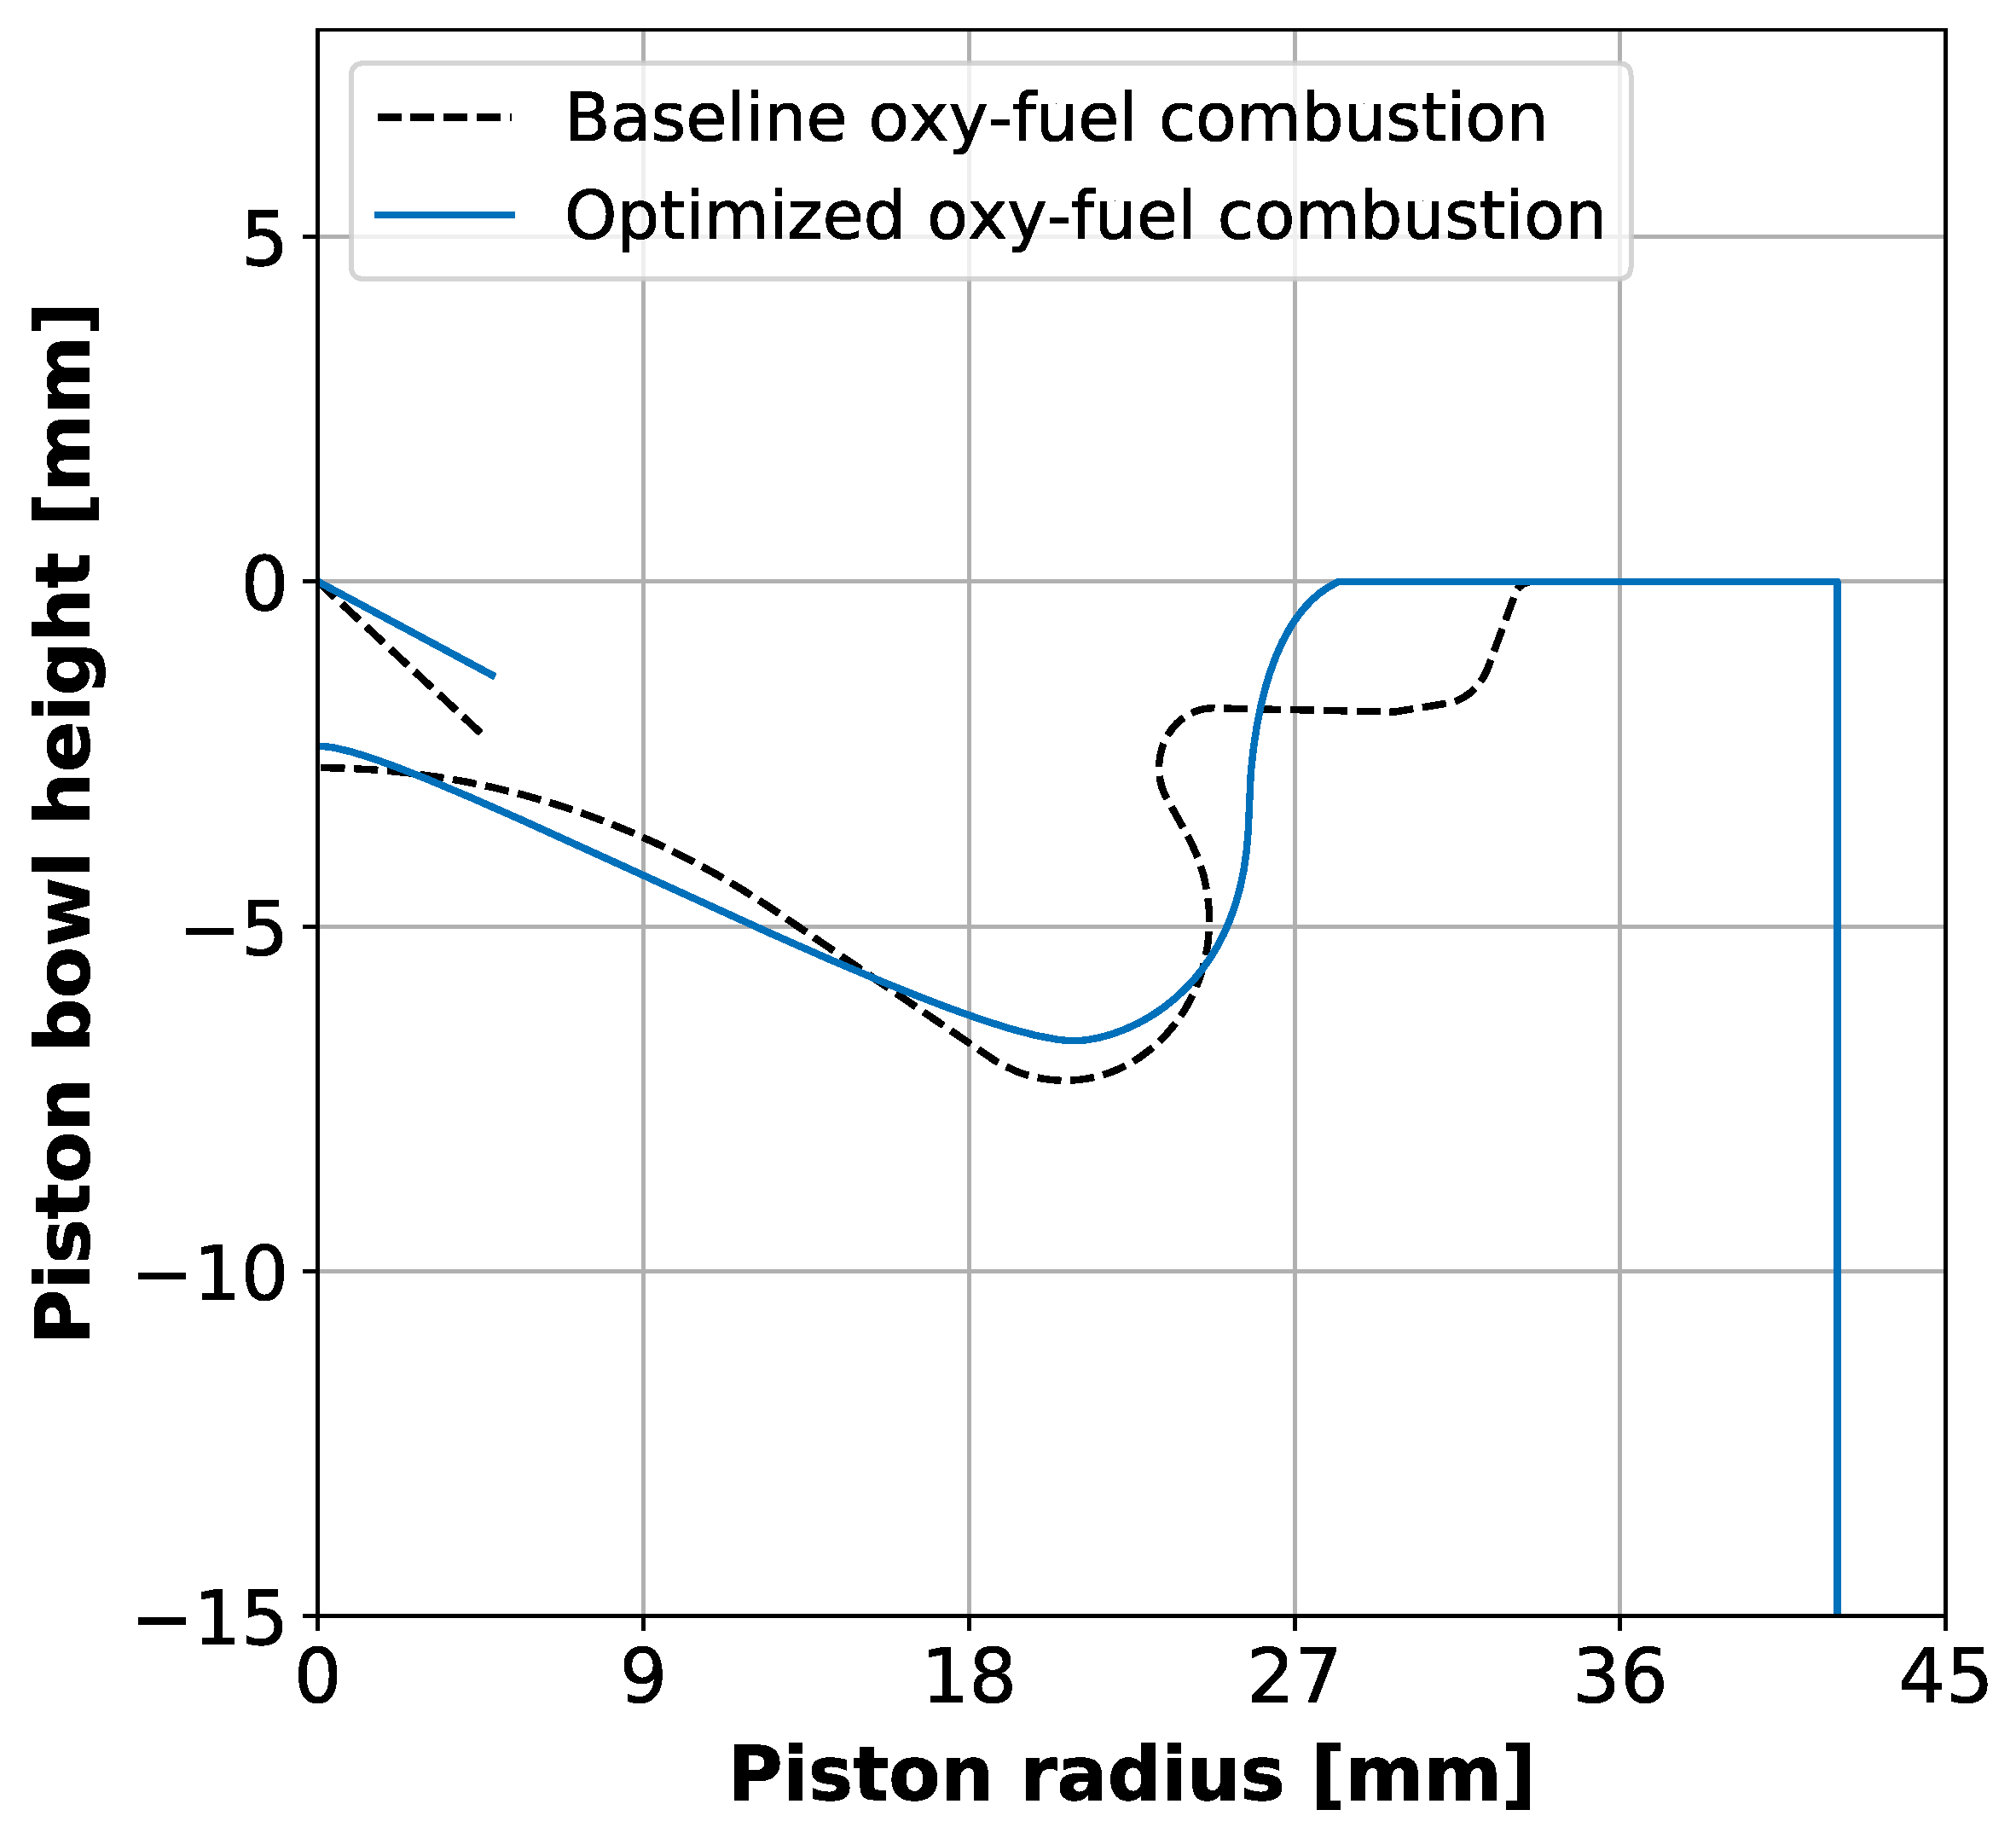
  • The new combustion system changes the baseline geometry to a bathtub shape that improves the engine efficiency and reduces the heat transfer losses. The number of injector nozzles changes from 10 to 7, allowing an improved interaction between the fuel and the oxygen inside the combustion chamber. The injection pressure is higher than the baseline, which leads a better fuel atomization and evaporation. The spray angle is higher and is better adjusted with the piston bowl geometry. With this new configuration, the swirl number should be lower in order to avoid the interaction between the sprays. Lastly, the SOI must be adjusted to control the maximum in-cylinder pressure limit.
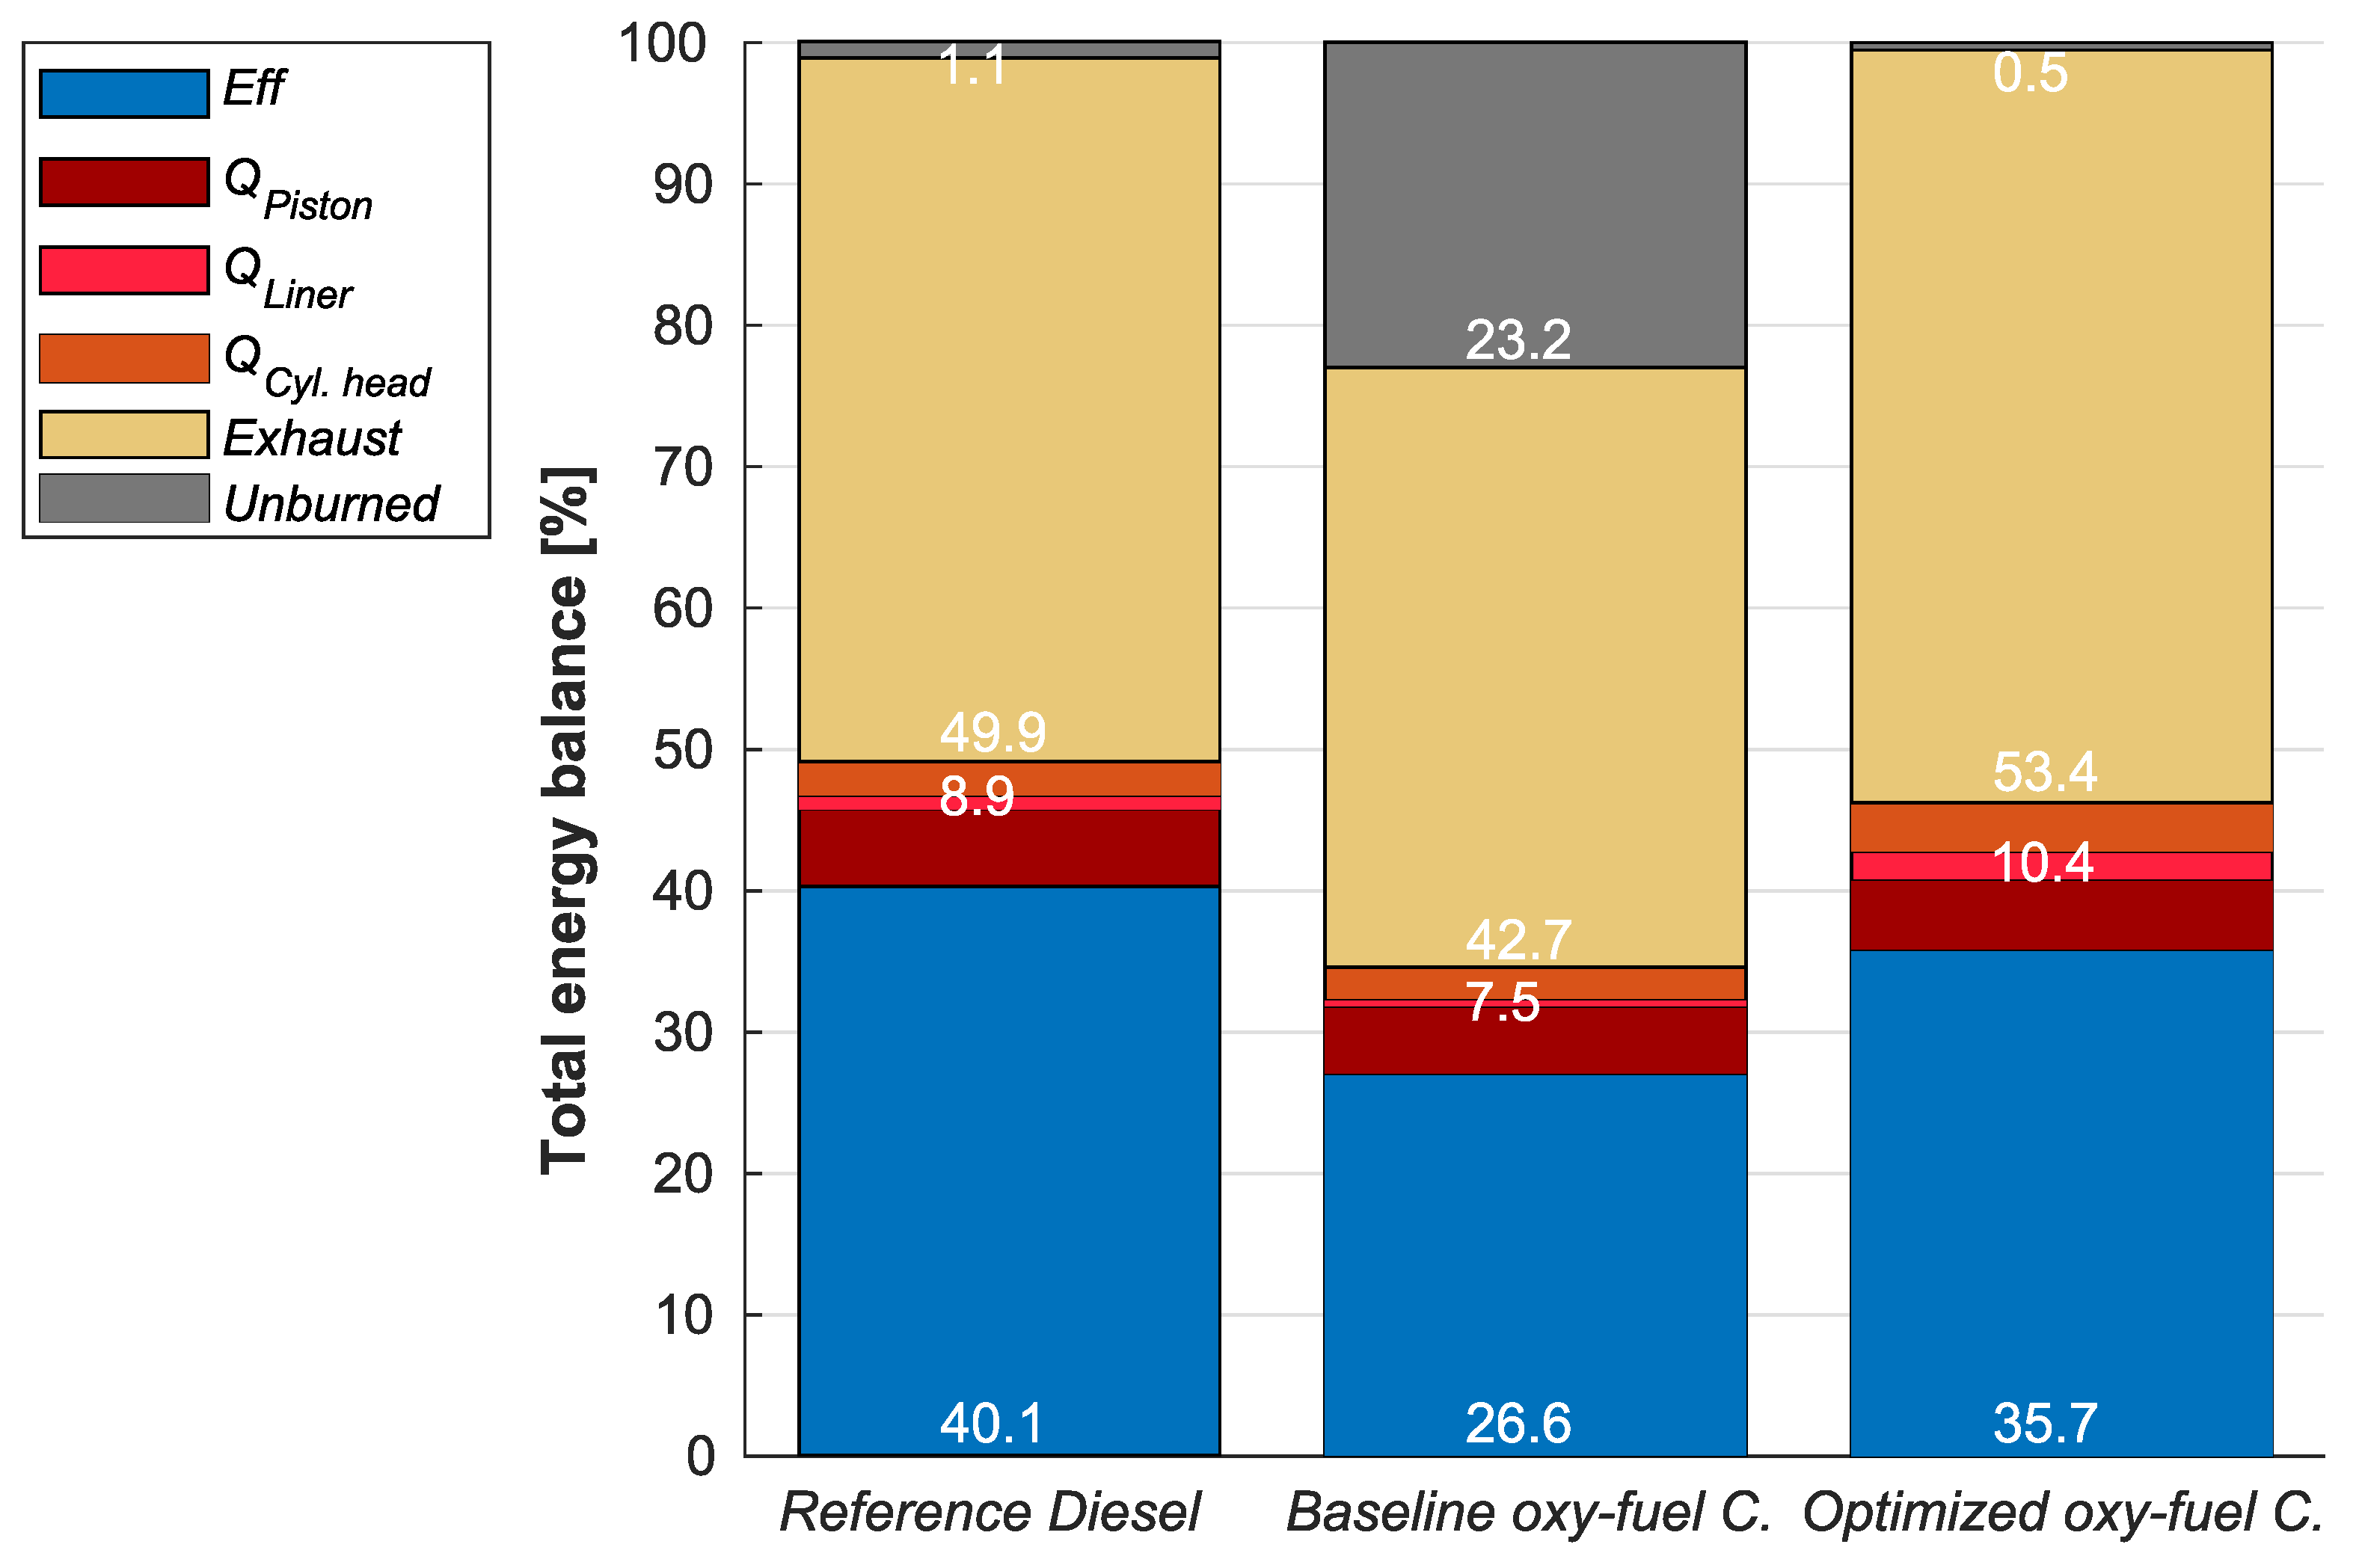
  • The optimized combustion system for oxy-fuel combustion improves the efficiency levels obtained by the baseline configuration (from 26.6% to 35.7%) while reducing soot emissions from 11.37 mg/s to a virtual zero. Soot avoidance is very important for this engine concept because exhaust gas energy must be recovered in proper regenerators (heat exchangers) to increase air temperature and separate O 2 from N 2 in the MIEC. Therefore, soot must be minimized in the combustion chamber to prevent heat exchangers from clogging.
  • Similarly, the new combustion system is able to reduce CO emissions up to similar levels of conventional diesel combustion. In addition, C x H y are below the conventional diesel combustion with air because there is no tradeoff between hydrocarbon oxidation and NO x reduction. This is a big advantage of oxy-fuel combustion because it allows for the minimization of pollutant emissions from the origin in the combustion chamber, because all design objective points are in the same direction of maximizing hydrocarbon oxidation. Having a virtual zero harmful emissions engine outside the combustion chamber makes the objective of obtaining a very high purity CO 2 easier. If some oxidation catalyst were needed for exhaust gases, after-treatment would be easier to design as well, due to the high temperatures, and lack of NO x and oxygen excess. However, the efficiency levels are significantly lower (35.7% against 40.1%), compromising the fuel consumption. Nevertheless, the possibility of CO 2 capture by simply condensing the water vapor allows for the decoupling of the BSFC increment from CO 2 emissions. Future works will be in the direction of minimizing BSFC while keeping the virtual zero emissions achievement.
In view of these trends, oxy-fuel combustion on a CI-based engine architecture can be considered an interesting solution for reducing the environmental footprint of transportation. This combustion concept allows us to completely avoid NOx emission by removing nitrogen form the oxidizer, while achieving very low pollutant emissions (soot and CO) if the combustion system is accordingly optimized. Moreover, the concept is even more interesting when combined with the MIEC technology because it is synergistic with carbon capture strategies in propulsive powerplants.

Author Contributions

All authors discussed and agreed on the contents of the manuscript. J.R.S.: project administration, conceptualization, supervision, methodology. G.B.: conceptualization, supervision, methodology, writing—review & editing. J.G.-S.: supervision, formal analysis, investigation, software, validation, writing—review draft. C.F.: investigation, software, validation, writing—original draft. All authors have read and agreed to the published version of the manuscript.

Funding

This research work has been supported by Grant PDC2021-120821-I00 funded by MCIN/AEI/ 10.13039/501100011033 and by EuropeanUnion NextGenerationEU/PRTR. This research was partially supported by Agència Valenciana de la Innovació (AVI) through the project “Demostrador de un motor de oxicombustión con captura de CO2” (INNVA1/2021/38).

Institutional Review Board Statement

Not applicable.

Informed Consent Statement

Not applicable.

Data Availability Statement

Not applicable.

Acknowledgments

The author Cássio Fernandes thanks the Universitat Politecnica de Valencia for his predoctoral contract (FPI-2019-S2-20-555), which is included within the framework of Programa de Apoyo para la Investigacion y Desarrollo (PAID). The authors would like to thank Tommaso Lucchini and David Martinez for all the support and suggestions with OpenFoam-LibIce and PSO respectively.

Conflicts of Interest

The authors declare no conflict of interest. The funders had no role in the design of the study; in the collection, analyses, or interpretation of data; in the writing of the manuscript; or in the decision to publish the results.

Abbreviations

The following abbreviations are used in this manuscript:
Letters
c1Individual Weight
c2Social Weight
coef CO CO Coefficient
coef eff Efficiency Coefficient
coefpmaxMaximum Pressure Coefficient
coef soot Soot Coefficient
MC(t)Centre of Mass
p i Current Best Position
pmaxMaximum pressure (bar)
R (t)Repository
v i Velocityi
x i Positioni
x m a x Boundary of the search space
x m i n Boundary of the search space
wInertia Weight
Greek symbols
β Random Vector
γ Random Vector
δ Random Vector
ρ Random Vector
τ Random Vector
ϕ Random Vector
Acronyms
CASCryogenic Air Separation
CFDComputational Fluid Dynamics
CICompression-ignited
CRCompression Ration
EGRExhaust Gas Re-circulation
EVOExhaust Valve Opening
GHGGreenhouse Gases
GPGeometrical Point
HRHeat Release
ICEInternal Combustion Engine
MIECMixed Ionic-Electronic Conducting Membranes
ISFCSpecific Fuel Consumption
IVCIntake Valve Closing
KHKelvin-Helmholtz
mRIFMulti Representative Interactive Flamelet
NSNovelty Search
PSOParticle Swarm Optimization
RANSReynolds-Averaged Navier Stokes
RoHRRate of Heat Release
ROIRate of Injection
RTRyleigh-Taylor
SOIStart of Injection
TDCTop Dead Center
VEMODVirtual Engine Model

References

  1. Intergovernmental Panel on Climate Change. Climate Change 2014. Mitigation of Climate Change: Working Group III Contribution to the IPCC Fifth Assessment Report; Cambridge University Press: Cambridge, UK; New York, NY, USA, 2014. [Google Scholar] [CrossRef] [Green Version]
  2. European Commission. COM15—Communication: A Policy Framework for Climate and Energy in the Period from 2020 to 2030. 2014. Available online: https://eur-lex.europa.eu/legal-content/EN/TXT/PDF/?uri=CELEX:52014DC0015&from=EN (accessed on 1 April 2022).
  3. Paltsev, S.; Morris, J.; Kheshgi, H.; Herzog, H. Hard-to-Abate Sectors: The role of industrial carbon capture and storage (CCS) in emission mitigation. Appl. Energy 2021, 300, 117322. [Google Scholar] [CrossRef]
  4. Wu, H.; Xu, M.; Li, Y.; Wu, J.; Shen, J.; Liao, H. Experimental research on the process of compression and purification of CO2 in oxy-fuel combustion. Appl. Energy 2020, 259, 114123. [Google Scholar] [CrossRef]
  5. Serrano, J.; Martin, J.; Gomez-Soriano, J.; Raggi, R. Theoretical and experimental evaluation of the spark-ignition premixed oxy-fuel combustion concept for future CO2 captive powerplants CO EU ST. Energy Convers. Manag. 2021, 244, 114498. [Google Scholar] [CrossRef]
  6. Mancini, N.D.; Mitsos, A. Conceptual design and analysis of ITM oxy-combustion power cycles. Phys. Chem. Chem. Phys. 2011, 13, 21351–21361. [Google Scholar] [CrossRef] [PubMed]
  7. Portillo, E.; Alonso-Fariñas, B.; Vega, F.; Cano, M.; Navarrete, B. Alternatives for oxygen-selective membrane systems and their integration into the oxy-fuel combustion process: A review. Sep. Purif. Technol. 2019, 229, 115708. [Google Scholar] [CrossRef]
  8. Baumann, S.; Serra, J.M.; Lobera, M.P.; Escolástico, S.; Schulze-Küppers, F.; Meulenberg, W.A. Ultrahigh oxygen permeation flux through supported Ba0.5Sr0.5Co0.8Fe0.2O3-δ membranes. J. Membr. Sci. 2011, 377, 198–205. [Google Scholar] [CrossRef] [Green Version]
  9. Catalán-Martínez, D.; Santafé-Moros, A.; Gozálvez-Zafrilla, J.M.; García-Fayos, J.; Serra, J.M. Characterization of oxygen transport phenomena on BSCF membranes assisted by fluid dynamic simulations including surface exchange. Chem. Eng. J. 2020, 387, 124069. [Google Scholar] [CrossRef]
  10. Kanniche, M.; Gros-Bonnivard, R.; Jaud, P.; Valle-Marcos, J.; Amann, J.M.; Bouallou, C. Pre-combustion, post-combustion and oxy-combustion in thermal power plant for CO2 capture. Appl. Therm. Eng. 2010, 30, 53–62. [Google Scholar] [CrossRef] [Green Version]
  11. Wimmer, K.; Sanz, W. Optimization and comparison of the two promising oxy-combustion cycles NET Power cycle and Graz Cycle. Int. J. Greenh. Gas Control 2020, 99, 103055. [Google Scholar] [CrossRef]
  12. Al-Sheikh, F.A.; Elkamel, A.; Anderson, W.A. Comparison between Post- and Oxy-Combustion Systems in a Petroleum Refinery Unit Using Modeling and Optimization. World Acad. Sci. Eng. Technol. Int. J. Chem. Mol. Nucl. Mater. Metall. Eng. 2017, 11, 793–799. [Google Scholar]
  13. Gerbelová, H.; Van Der Spek, M.; Schakel, W. Feasibility Assessment of CO2 Capture Retrofitted to an Existing Cement Plant: Post-combustion vs. Oxy-fuel Combustion Technology. Energy Procedia 2017, 114, 6141–6149. [Google Scholar] [CrossRef]
  14. Van Blarigan, A.; Kozarac, D.; Seiser, R.; Cattolica, R.; Chen, J.Y.; Dibble, R. Experimental Study of Methane Fuel Oxycombustion in a Spark-Ignited Engine. J. Energy Resour. Technol. 2014, 136, 012203. [Google Scholar] [CrossRef]
  15. Tan, Q.; Hu, Y. A study on the combustion and emission performance of diesel engines under different proportions of O2 & N2 & CO2. Appl. Therm. Eng. 2016, 108, 508–515. [Google Scholar] [CrossRef]
  16. Arnau, F.; García-Cuevas, L.; Novella, R.; Gutiérrez, F. Adapting an internal combustion engine to oxy-fuel combustion with in-situ oxygen production. In Proceedings of the ASME 2021 Internal Combustion Engine Division Fall Technical Conference, Virtual, Online, 13–15 October 2021. [Google Scholar]
  17. Serrano, J.; Arnau, F.; García-Cuevas, L.; Farias, V. Oxy-fuel combustion feasibility of compression ignition engines using oxygen separation membranes for enabling carbon dioxide capture. Energy Convers. Manag. 2021, 247, 114732. [Google Scholar] [CrossRef]
  18. Krieger, G.C.; Campos, A.P.; Takehara, M.D.; Alfaia Da Cunha, F.; Gurgel Veras, C.A. Numerical simulation of oxy-fuel combustion for gas turbine applications. Appl. Therm. Eng. 2015, 78, 471–481. [Google Scholar] [CrossRef]
  19. Nemitallah, M.A.; Habib, M.A. Numerical investigation of liquid methanol evaporation and oxy-combustion inside a button-cell ITM reactor. Appl. Therm. Eng. 2017, 112, 378–391. [Google Scholar] [CrossRef]
  20. Kang, Z.; Chen, S.; Wu, Z.; Deng, J.; Hu, Z.; Li, L. Simulation Study of Water Injection Strategy in Improving Cycle Efficiency Based on a Novel Compression Ignition Oxy-Fuel Combustion Engine. SAE Int. J. Engines 2018, 11, 935–945. [Google Scholar] [CrossRef]
  21. Mobasheri, R.; Aitouche, A.; Peng, Z.; Li, X. Influence of Oxy-Fuel Combustion on Engine Operating Conditions and Combustion Characteristics in a High Speed Direct Injection (HSDI) Diesel Engine under Homogenous Charge Compression Ignition (HCCI) Mode; SAE Technical Paper; SAE International: Warrendale, PA, USA, 2020; pp. 1–10. [Google Scholar] [CrossRef]
  22. Serrano, J.; Arnau, F.; Martín, J.; Novella, R.; García-Cuevas, L.; Bracho, G.; Goméz-Soriano, J. Oxy-Fuel Combustion Engine for Highly Efficient Onboard CO2 Capture. Another Step Forward in the Path to a CO2 Circular Economy. Sustainable Internal Combustion Engine Virtual Symposium 2021. Available online: https://www.sustainable-ic-enginevirtuallive.com/ (accessed on 10 February 2021).
  23. Martin, J.; Arnau, F.; Piqueras, P.; Auñon, A. Development of an Integrated Virtual Engine Model to Simulate New Standard Testing Cycles; SAE Technical Paper; SAE Internacional: Warrendale, PA, USA, 2018; pp. 1–17. [Google Scholar] [CrossRef] [Green Version]
  24. OpenFOAM Website. Available online: https://openfoam.org/ (accessed on 10 May 2022).
  25. Montenegro, G.; Onorati, A.; Piscaglia, F.; D’Errico, G. Integrated 1D-MultiD Fluid Dynamic Models for the Simulation of ICE Intake and Exhaust Systems; SAE Technical Paper; SAE International: Warrendale, PA, USA, 2007; Volume 1, pp. 776–790. [Google Scholar] [CrossRef] [Green Version]
  26. Lucchini, T.; D’Errico, G.; Jasak, H.; Tukovic, Z. Automatic Mesh Motion with Topological Changes for Engine Simulation; SAE Technical Paper; SAE International: Warrendale, PA, USA, 2007; Volume 1, pp. 1–20. [Google Scholar] [CrossRef]
  27. Ismail, H.; Ng, H.; Gan, S.; Lucchini, T. Approach for the Modeling of Reacting Biodiesel Fuel Spray Using OpenFOAM; SAE Technical Paper; SAE International: Warrendale, PA, USA, 2014; Volume 1, pp. 1–9. [Google Scholar] [CrossRef]
  28. D’Errico, G.; Lucchini, T.; Hardy, G.; Tap, F.; Ramaekers, G. Combustion Modeling in Heavy Duty Diesel Engines Using Detailed Chemistry and Turbulence-Chemistry Interaction; SAE Technical Paper; SAE International: Warrendale, PA, USA, 2015; Volume 1, pp. 1–14. [Google Scholar] [CrossRef]
  29. Ismail, H.M.; Ng, H.K.; Gan, S.; Lucchini, T.; Onorati, A. Development of a reduced biodiesel combustion kinetics mechanism for CFD modelling of a light-duty diesel engine. Fuel 2013, 106, 388–400. [Google Scholar] [CrossRef]
  30. Ismail, H.M.; Ng, H.K.; Cheng, X.; Gan, S.; Lucchini, T.; D’Errico, G. Development of Thermophysical and Transport Properties for the CFD Simulations of In-Cylinder Biodiesel Spray Combustion. Energy Fuels 2012, 26, 4857–4870. [Google Scholar] [CrossRef]
  31. Payri, R.; Gimeno, J.; Novella, R.; Bracho, G. On the rate of injection modeling applied to direct injection compression ignition engines. Int. J. Engine Res. 2016, 17, 1015–1030. [Google Scholar] [CrossRef] [Green Version]
  32. Yakhot, V.; Orszag, S.A. Renormalization group analysis of turbulence. I. Basic theory. J. Sci. Comput. 1986, 1, 3–51. [Google Scholar] [CrossRef]
  33. Angelberger, C.; Poinsot, T.; Delhay, B. Improving Near-Wall Combustion and Wall Heat Transfer Modeling in SI Engine Computations; SAE Technical Paper; SAE International: Warrendale, PA, USA, 1997. [Google Scholar] [CrossRef]
  34. Benajes, J.; Olmeda, P.; Martín, J.; Carreño, R. A new methodology for uncertainties characterization in combustion diagnosis and thermodynamic modelling. Appl. Therm. Eng. 2014, 71, 389–399. [Google Scholar] [CrossRef]
  35. Kang, Z.; Wu, Z.; Zhang, Z.; Deng, J.; Hu, Z.; Li, L. Study of the Combustion Characteristics of a HCCI Engine Coupled with Oxy-Fuel Combustion Mode. SAE Int. J. Engines 2017, 10, 908–916. [Google Scholar] [CrossRef]
  36. Kennedy, J.; Eberhart, R. 47-Particle Swarm Optimization Proceedings. In Proceedings of the ICNN’95—International Conference on Neural Networks, Perth, WA, Australia, 27 November–1 December 1995; Volume 11, pp. 111–117. [Google Scholar]
  37. Lehman, J.; Stanley, K.O. Exploiting open-endedness to solve problems through the search for novelty. In Artificial Life—ALIFE; MIT Press: Cambridge, MA, USA, 2008. [Google Scholar]
  38. Benajes, J.; Novella, R.; Pastor, J.M.; Hernández-López, A.; Hasegawa, M.; Tsuji, N.; Emi, M.; Uehara, I.; Martorell, J.; Alonso, M. Optimization of the combustion system of a medium duty direct injection diesel engine by combining CFD modeling with experimental validation. Energy Convers. Manag. 2016, 110, 212–229. [Google Scholar] [CrossRef]
  39. Payri, R.; Salvador, F.J.; Gimeno, J.; Bracho, G. A new methodology for correcting the signal cumulative phenomenon on injection rate measurements. Exp. Tech. 2008, 32, 46–49. [Google Scholar] [CrossRef]
  40. Zubel, M.; Ottenwälder, T.; Heuser, B.; Pischinger, S. Combustion system optimization for dimethyl ether using a genetic algorithm. Int. J. Engine Res. 2021, 22, 22–38. [Google Scholar] [CrossRef]
  41. Yoon, S.; Lee, S.; Kwon, H.; Lee, J.; Park, S. Effects of the swirl ratio and injector hole number on the combustion and emission characteristics of a light duty diesel engine. Appl. Therm. Eng. 2018, 142, 68–78. [Google Scholar] [CrossRef]
  42. Shi, Y.; Reitz, R.D. Assessment of optimization methodologies to study the effects of bowl geometry, spray targeting and swirl ratio for a heavy-duty diesel engine operated at High-Load. SAE Int. J. Engines 2009, 1, 537–557. [Google Scholar] [CrossRef]
  43. Han, S.; Bae, C. The influence of Fuel Injection Pressure and Intake Pressure on Conventional and Low Temperature Diesel Combustion; SAE Technical Paper; SAE International: Warrendale, PA, USA, 2012. [Google Scholar] [CrossRef]
  44. Agarwal, A.K.; Srivastava, D.K.; Dhar, A.; Maurya, R.K.; Shukla, P.C.; Singh, A.P. Effect of fuel injection timing and pressure on combustion, emissions and performance characteristics of a single cylinder diesel engine. Fuel 2013, 111, 374–383. [Google Scholar] [CrossRef]
  45. Yaliwal, V.S.; Banapurmath, N.R.; Gireesh, N.M.; Hosmath, R.S.; Donateo, T.; Tewari, P.G. Effect of nozzle and combustion chamber geometry on the performance of a diesel engine operated on dual fuel mode using renewable fuels. Renew. Energy 2016, 93, 483–501. [Google Scholar] [CrossRef]
  46. Dreisbach, R.; Graf, G.; Kreuzig, G.; Theissl, H.; Pfahl, U. HD Base Engine Development to Meet Future Emission and Power Density Challenges of a DDI™ Engine; SAE Technical Paper; SAE International: Warrendale, PA, USA, 2007. [Google Scholar] [CrossRef]
  47. Miles, P.C.; Andersson, Ö. A review of design considerations for light-duty diesel combustion systems. Int. J. Engine Res. 2016, 17, 6–15. [Google Scholar] [CrossRef]
  48. Benajes, J.; Pastor, J.V.; García, A.; Monsalve-Serrano, J. An experimental investigation on the influence of piston bowl geometry on RCCI performance and emissions in a heavy-duty engine. Energy Convers. Manag. 2015, 103, 1019–1030. [Google Scholar] [CrossRef]
  49. Cursente, V.; Pacaud, P.; Gatellier, B. Reduction of the compression ratio on a hsdi diesel engine: Combustion design evolution for compliance the future emission standards. SAE Int. J. Fuels Lubr. 2009, 1, 420–439. [Google Scholar] [CrossRef]
Figure 1. Mesh comparison between fine mesh: side view (a), top view (b), and the coarse mesh side view (c), and top view (d).
Applsci 12 07104 g001
Figure 2. Comparison between experimental data, fine-mesh, and coarse-mesh simulation results of in-cylinder pressure (top), RoHR (middle), and normalized cumulative HR (bottom).
Applsci 12 07104 g002
Figure 3. Comparison between the simulations of the reference diesel case against the baseline oxy-fuel combustion case, results of in-cylinder pressure (top), RoHR (middle) and normalized cumulative HR (bottom).
Applsci 12 07104 g003
Figure 4. Example of bowls obtained for the combustion chamber geometry.
Applsci 12 07104 g004
Figure 5. Mesh generator: control points and block definition.
Applsci 12 07104 g005
Figure 6. Virtual injector model: a comparison between several values of injection pressure.
Applsci 12 07104 g006
Figure 7. Objective function convergence evolution.
Applsci 12 07104 g007
Figure 8. Evolution of constraints and objectives outputs toward the optimized value.
Applsci 12 07104 g008
Figure 9. Objective function value for the geometrical parameters.
Applsci 12 07104 g009
Figure 10. Objective function value for inputs of the injection system and swirl number.
Applsci 12 07104 g010
Figure 11. Objective function value evolution for the constraints and objective parameters.
Applsci 12 07104 g011
Figure 12. Pareto front of max. pressure of the engine vs. efficiency, CO emissions, HC. and soot evolution vs. efficiency. The pollutant emissions are normalized by the reference diesel case value.
Applsci 12 07104 g012
Figure 13. Comparison between the baseline and the optimized geometry.
Applsci 12 07104 g013
Figure 14. Comparison between in-cylinder pressure, RoHR, and normalized cumulative HR for the reference diesel case, baseline, and optimized oxy-fuel combustion case.
Applsci 12 07104 g014
Figure 15. Energy balance for the three simulated cases.
Applsci 12 07104 g015
Figure 16. O 2 distribution inside the combustion chamber for several combustion periods (CA) and comparison between the reference diesel, baseline, and optimized oxy-fuel combustion case.
Applsci 12 07104 g016
Figure 17. Temperature distribution inside the combustion chamber for a several combustion periods (CA) comparison between the reference diesel and optimized oxy-fuel combustion case.
Applsci 12 07104 g017
Table 1. Engine specifications.
Engine typeDI Diesel engine
Compression ratio [-]16:1
Number of cylinders [-]4
Bore/stroke [mm]85/96
Volume [L]2.2
Injector number of orifices10
Spray angle [deg]154
Table 2. CFD models specifications.
InjectionBlob Injector
Break-upKH-RT
Collisionoff
Evaporationstandard
TurbulenceRNG k ϵ RANS
Wall Heat transferAngelberger
CombustionRIF
SootLeung Lindstedt Jones
Table 3. CFD model boundary conditions.
IVC [cad aTDC]−112
EVO [cad aTDC]116
Pressure at IVC [bar]3.9
Temperature at IVC [K]470
Injection pressure [bar]1800
Start Of Injection (SOI) [deg]−11.5
Table 4. Comparison between the experimental and CFD simulation values.
NO x
[ppm]
YSoot
[-]
Gross Efficiency
[%]
Experimental data12534.18 × 10 6 44.8
Fine mesh simulation12773.03 × 10 6 43.4
Coarse mesh simulation14592.09 × 10 6 43.8
Table 5. Oxy-fuel combustion model boundary conditions.
Compression Ratio [-]28:1
Engine speed [rpm]3500
IMEP [bar]20.25
Fuel mass [mg/cc]62
Fuel LHV [MJ/kg]44.6
SOI [deg]−11.5
Temperature at IVC [K]387
Pressure at IVC [bar]1.83
O 2 [-]0.364
H 2 O [-]0.203
CO 2 [-]0.433
EGR [%]70
Table 6. Inputs parameters and their ranges considered in the optimization process.
ParameterRange
Geometrical parameter 1 [-][−0.5, 1.0]
Geometrical parameter 2 [-][−1.0, 1.25]
Geometrical parameter 3 [-][−1.0, 2.0]
Geometrical parameter 4 [-][0.0, 1.0]
Geometrical parameter 5 [-][−1.4, 0.1]
Geometrical parameter 6 [-][−0.5, 1.0]
Number of injector holes [-][7, 12]
Spray angle [ ][155, 175]
Swirl number at IVC [-][1.0, 3.0]
Injection pressure [bar][1000, 2200]
SOI [cad aTDC][−25, 0]
Table 7. Component functions of the parameters to optimize and the constraints.
Condition f 1 ( soot ) . . . . . Equation (7)
if f CFD < f l i m f CFD f l i m
if f CFD f l i m f CFD f l i m + 1000 · ( l o g ( f CFD ) l o g ( f l i m ) ) 2
Condition f 2 ( eff ) . . . . . Equation (8)
if f CFD > f l i m f l i m f CFD
if f CFD   f l i m f l i m f CFD + 100 · ( l o g ( f CFD ) l o g ( f l i m ) ) 2
Condition f 3 ( p m a x ) . . . . . Equation (9)
if f CFD < f l i m f CFD f l i m
if f CFD   f l i m f CFD f l i m + 50 · ( f CFD f l i m ) 2
Condition f 4 ( CO ) . . . . . Equation (10)
if f CFD < f l i m f CFD f l i m
if f CFD   f l i m f CFD f l i m + 100 · ( f CFD f l i m ) 2
where the CFD index represents the value obtained from the CFD simulation and the lim index represents the baseline level of each component. The objective function is important in the optimization process because it is the one that feeds the NS algorithm with the evaluation of the inputs and their effect on the efficiency and emission reduction, leading to the convergence of the solution.
Table 8. Input comparison between the baseline and optimized oxy-fuel combustion cases configuration.
Baseline CaseOxy-Fuel Combust.
Best Case
Number of injector holes [-]107
Spray angle [deg]154164
Swirl number [-]2.001.08
Injection pressure [bar]18002190
SOI [cad aTDC]−11.5−4.04
Table 9. Comparison between the efficiency, soot, and CO between the reference Diesel case, baseline and optimized oxy-fuel combustion cases.
Reference
Diesel
Baseline
Oxy-Fuel C.
Optimized
Oxy-Fuel C.
Efficiency [%]40.126.635.7
Soot [mg/s]0.3511.4<0.0001
CO [mg/s]177192981
HC [mg/s]282064.5
Publisher’s Note: MDPI stays neutral with regard to jurisdictional claims in published maps and institutional affiliations.

