1. Introduction
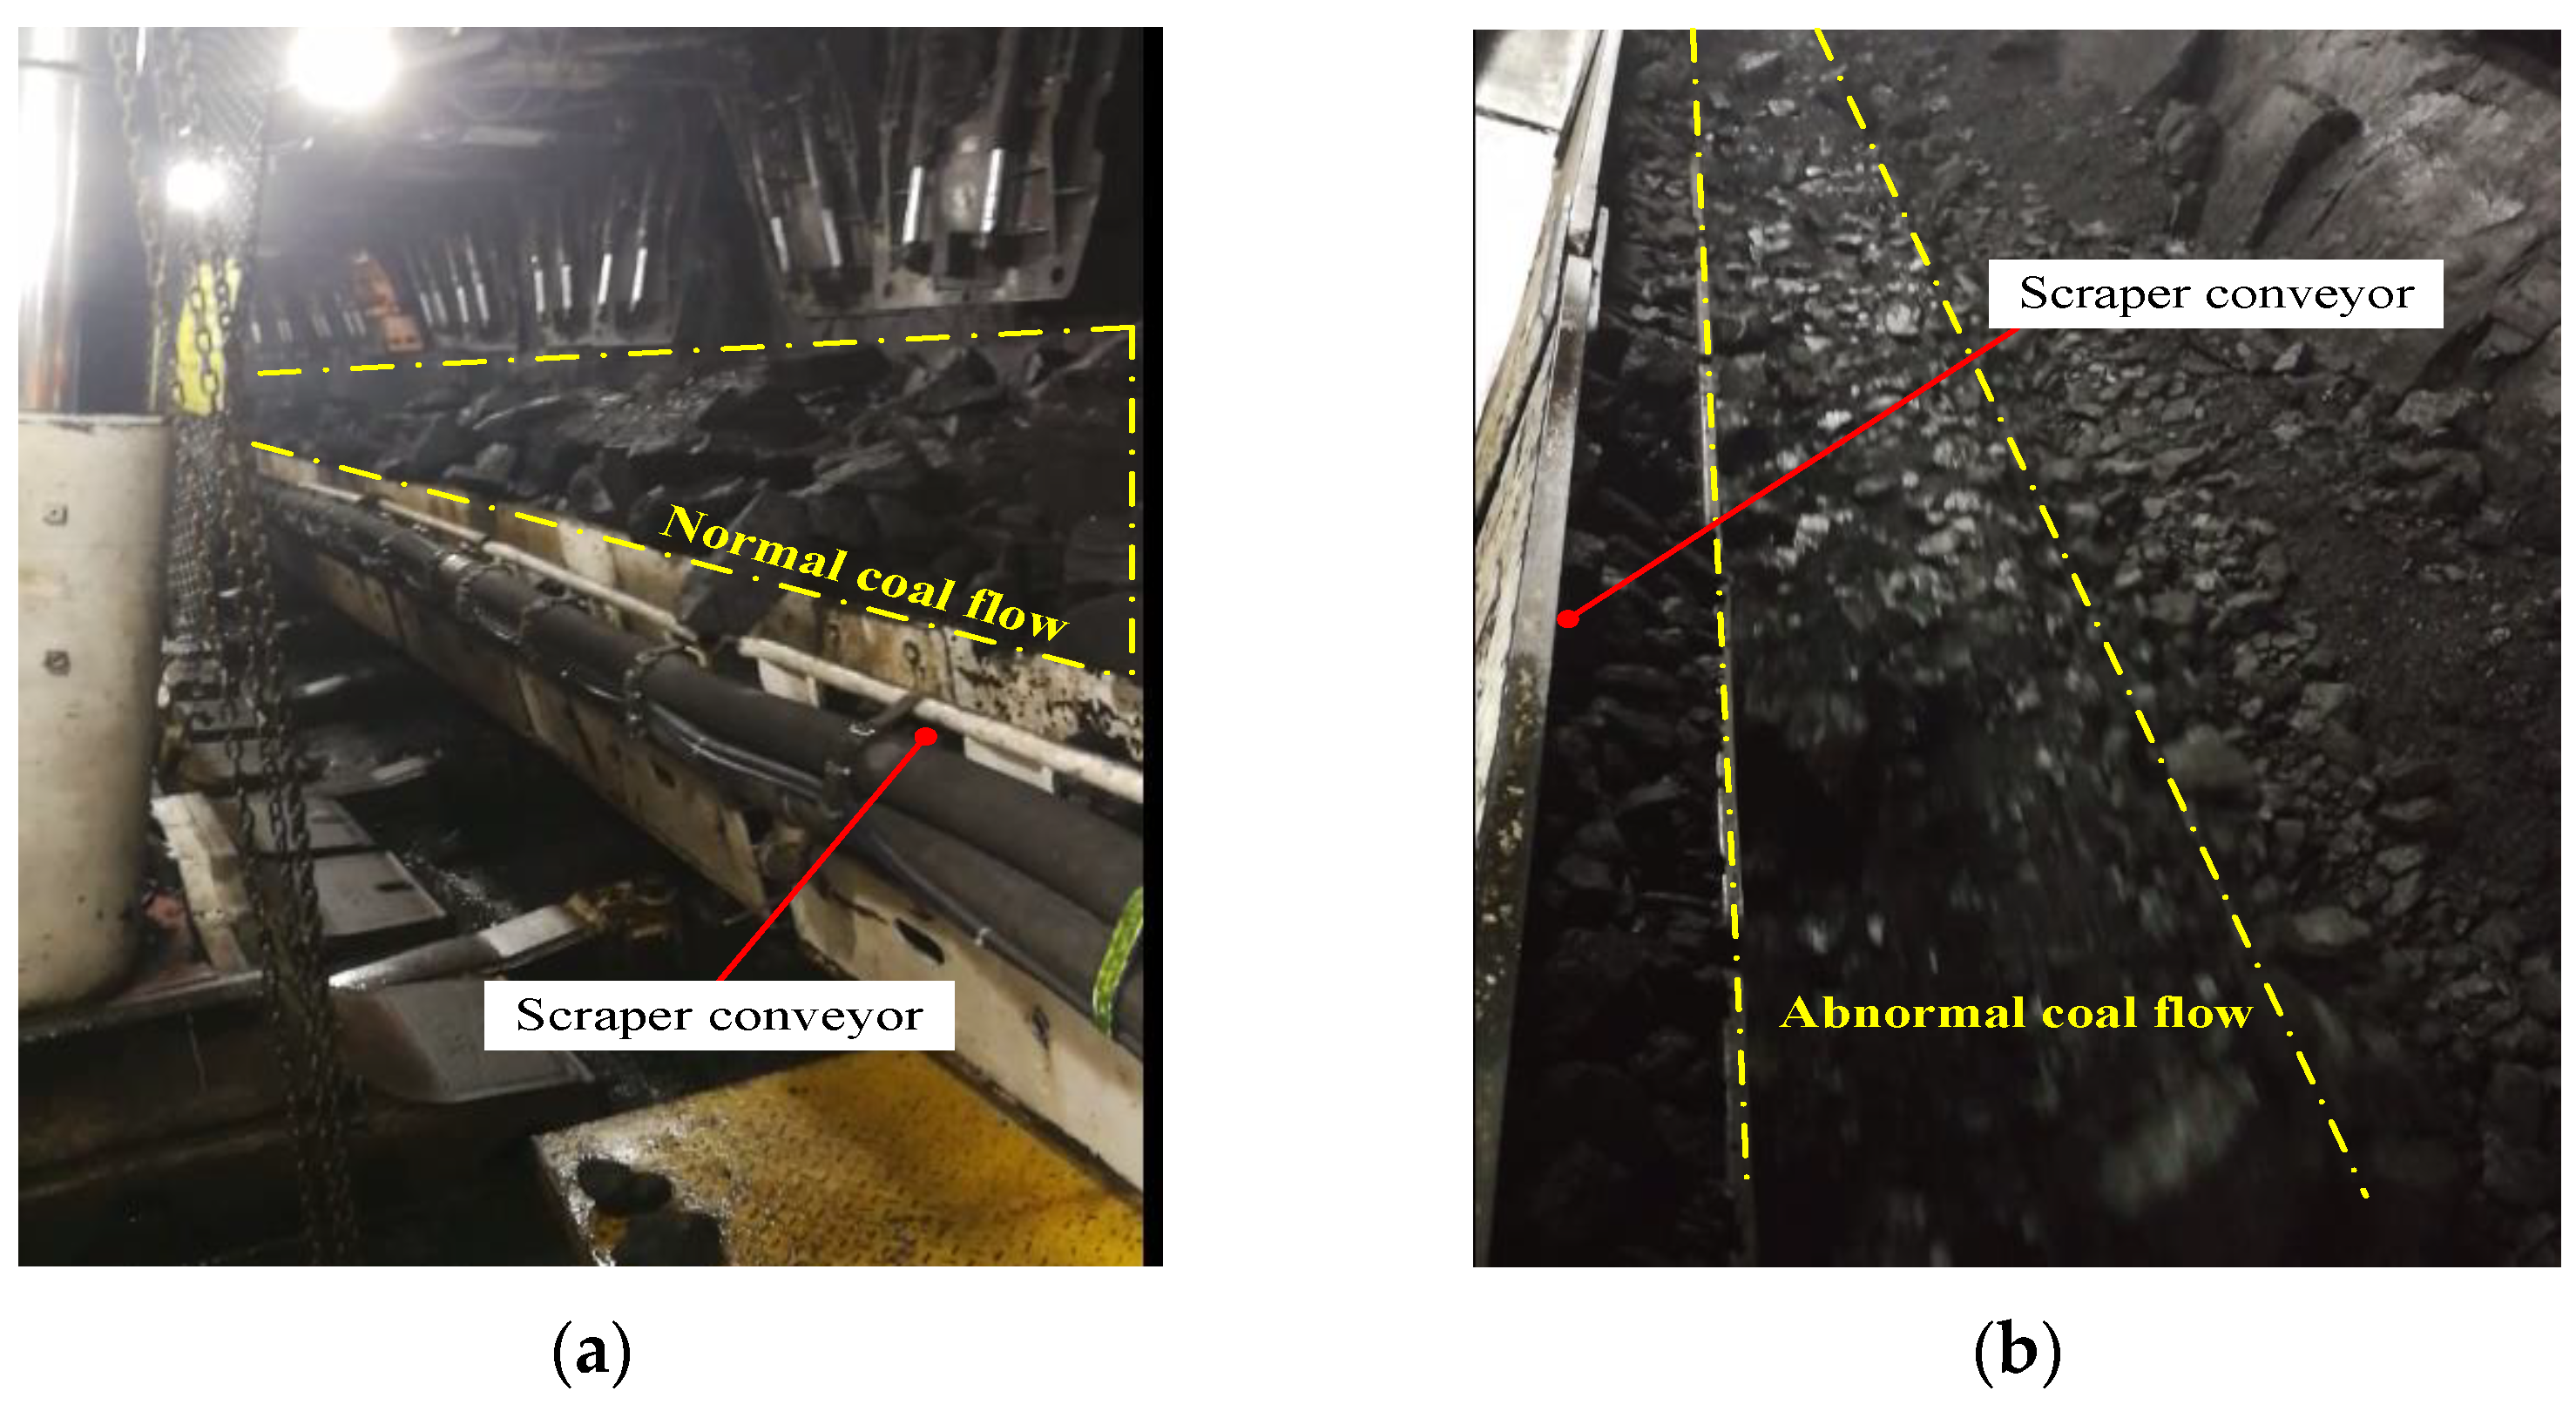
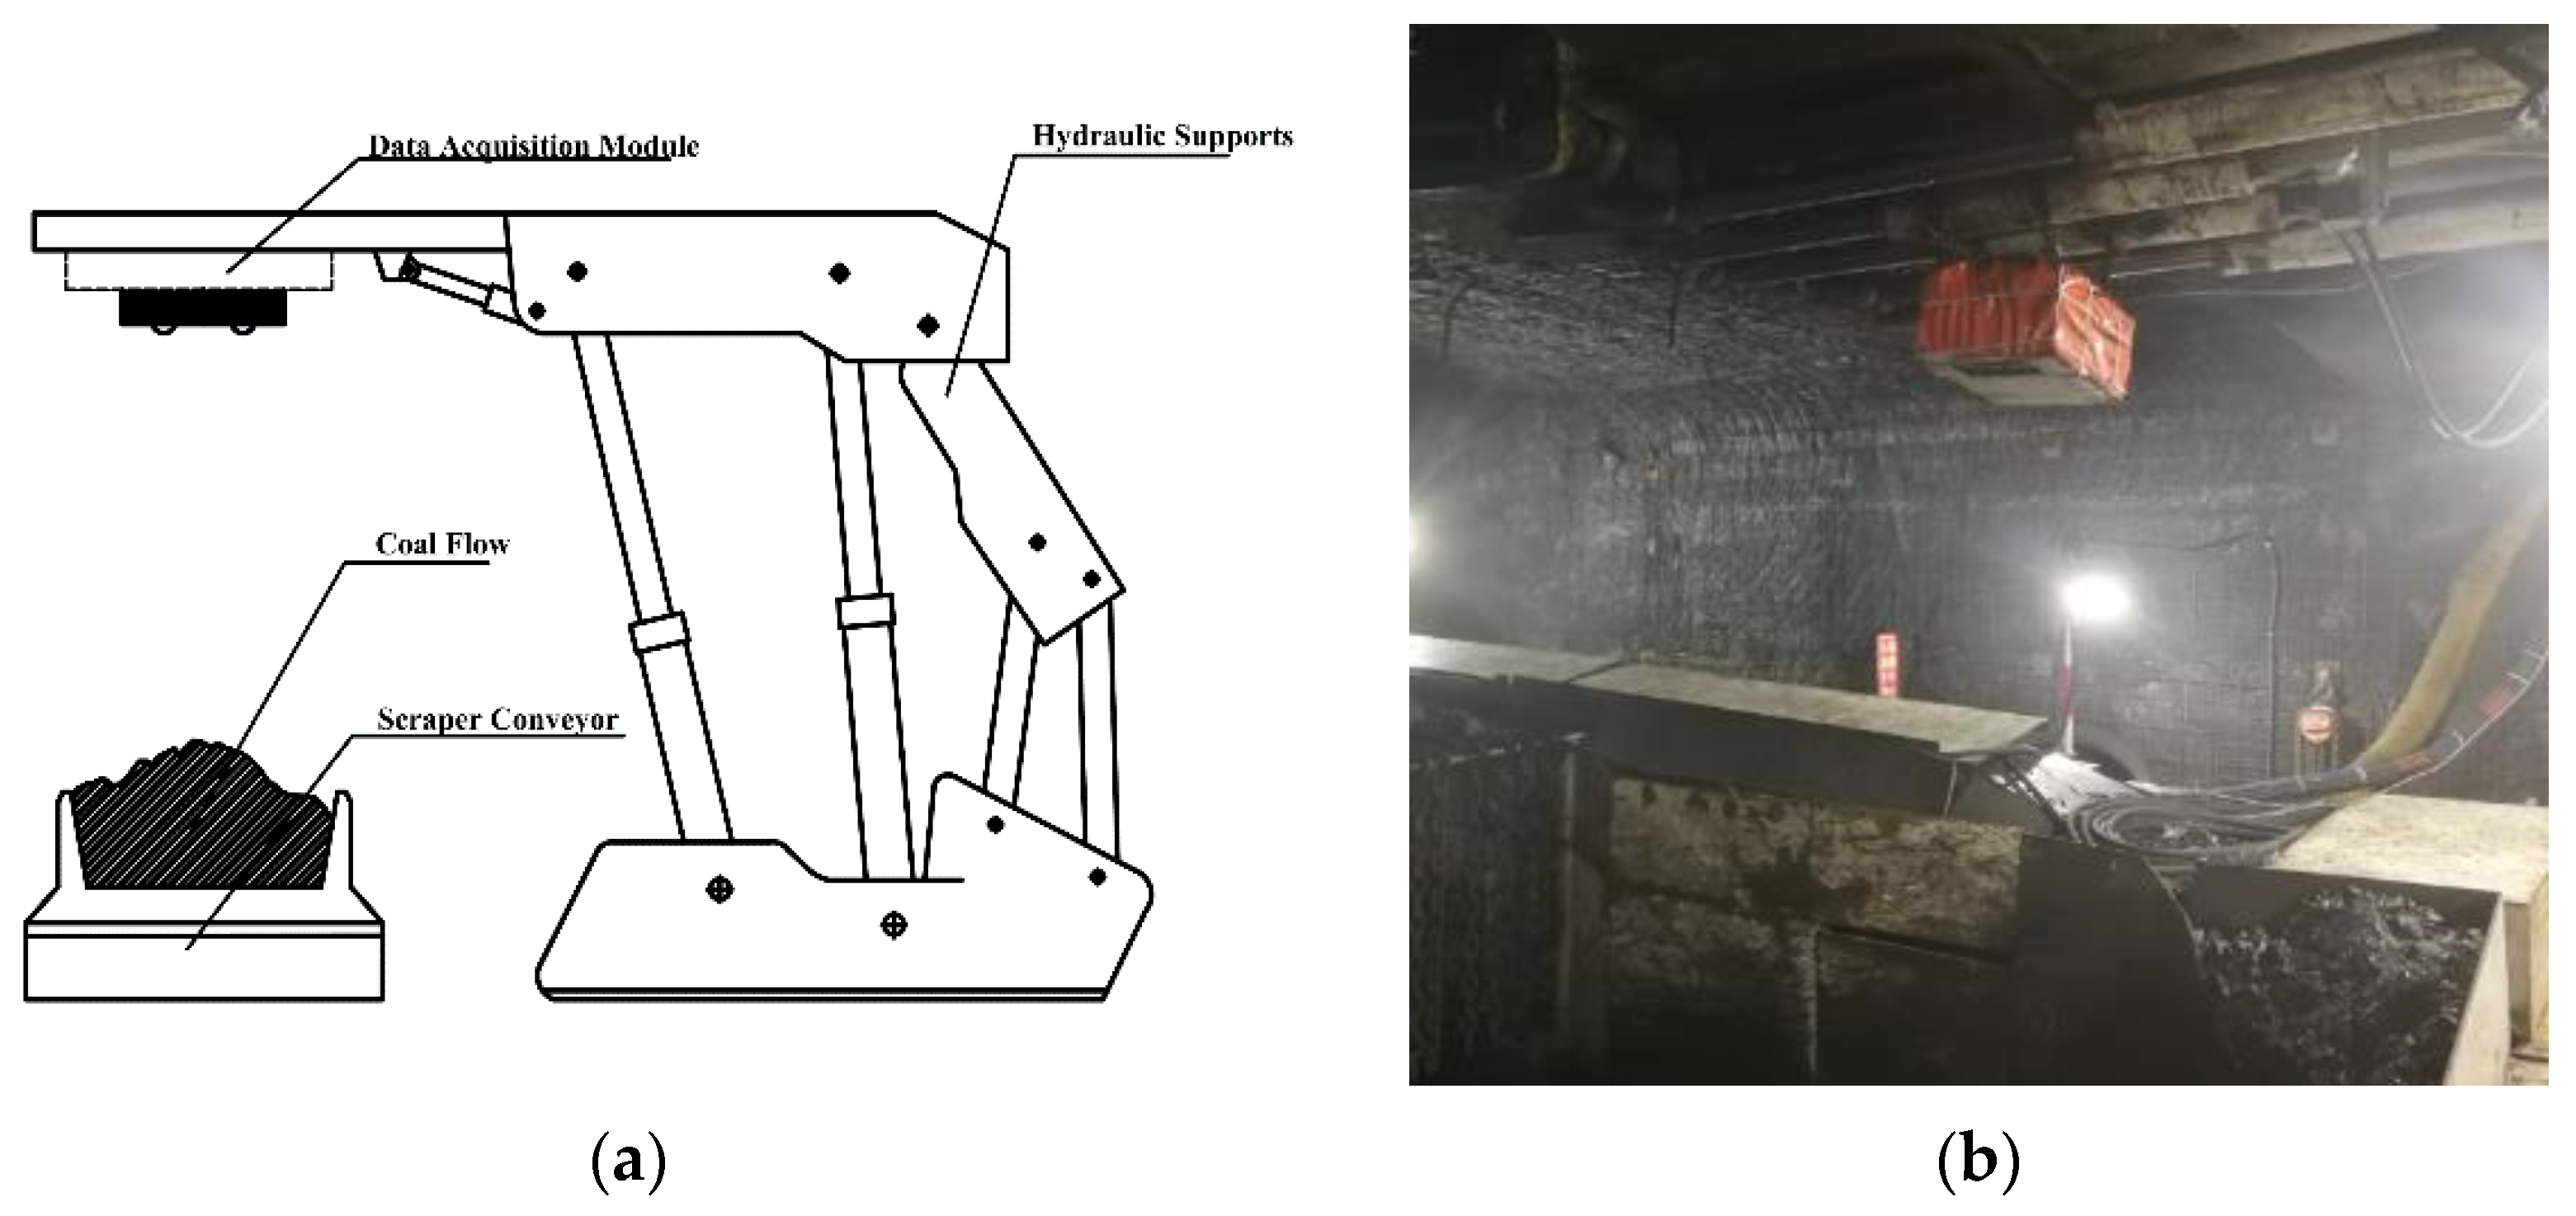
The conveyor that is pulled by a scraper chain and transports bulk materials in the tank is called a scraper conveyor, as shown in
Figure 1. In the process of coal mine production, scraper conveyors are used to transport newly mined irregular coal bodies. Scraper conveyors have been widely used in coal mine production because of their long transportation distance, large and continuous transportation volume, easy to realize automatic control and centralized control, and relatively simple structure.
At present, scraper conveyors are running at full speed, and there is no effective means to adjust the motor speed according to the load. When the load is light or no load, the high-speed operation of the belt conveyor system will seriously wear the mechanical transmission system, shorten the service life of the equipment, and cause a lot of waste of electric energy. When the conveyor is overloaded, it will not only accelerate the aging of the conveyor system, but also cause the coal outlet of the scraper conveyor to be congested [
1,
2,
3,
4].
Figure 2 shows the coal flow on the scraper conveyor.
In recent years, due to the advantages of frequency conversion technology with stable speed regulation, high transient stability, and energy saving, researchers have proposed frequency conversion speed regulation control methods for belt conveyors based on the real-time load of the conveyor belt [
5,
6,
7,
8]. To make the conveyor run in the best load state, the instantaneous flow of coal becomes an important indicator for adjusting the running speed of the belt conveyor. As the amount of coal conveyed by the scraper conveyor system is not uniform, it is difficult to accurately measure the instantaneous flow of coal on the belt conveyor [
9]. Therefore, the detection of coal flow of the scraper conveyor is one of the hotspots in the current research of relevant scholars.
To meet the needs of high-precision monitoring of coal flow in mine scraper conveyors, this paper proposes an accurate and economical monitoring method based on binocular speckle camera data. The method monitors the abnormal coal quantity of the scraper conveyor by simplifying the collected speckle data, and has the advantages of low cost, convenient installation, and easy popularization. The rest of this paper is organized as follows:
Section 2 reviews the previous literature;
Section 3 introduces the technical route studied in this paper; in
Section 4, the proposed point cloud data simplification algorithm for speckle structured light data and the proposed coal flow monitoring method are introduced;
Section 5 presents a case study and analysis of the proposed method in Yujialiang Coal Mine; finally,
Section 6 summarizes and looks forward to the work of this paper.
2. Literature Review
At this stage, the methods used for the amount of coal transported by scraper conveyors mainly include electronic belt scales, nuclear scales, visual ranging, and laser scanning methods. These methods can be divided into contact and non-contact categories.
The traditional coal instantaneous flow detection mostly adopts contact methods such as electronic tape scales and nuclear scales. The contact method is usually installed on a single weighing device on a long conveyor belt frame, and the structure includes a weighing frame, a load cell, a speed sensor, and a totalizer meter. The advantages of this method include low-cost, simple and convenient installation, and no need to make too many changes to the original equipment infrastructure [
10,
11,
12,
13]. Scholars have used the discrete element method (DEM) to study the interaction between scraper conveyors and coal flow [
14]. Traditional contact methods often have the following disadvantages:
- (1)
When the environment around the sensor is humid, the sensor is prone to short circuit.
- (2)
Due to the long transportation distance of the scraper conveyor, the accuracy of this type of method is insufficient.
To overcome the above problems, scholars have successively proposed coal flow calculation methods based on non-contact scraper conveyors with ultrasonic technology, laser technology, and computer vision [
15]. Ultrasonic technology is a high-efficiency, high-precision, real-time measurement of the physical height of the object to be measured. It has the advantages of non-contact measurement, less influence by coal texture characteristics and coal dust resistance and is widely used in coal mine production [
16]. The ultrasonic range finder detection method uses the principle of ultrasonic detection to realize the detection of coal flow through the reflected sound waves, but there are problems such as poor anti-interference performance and accuracy
Laser measurement technology is an important means of geometric measurement. It is based on the principle of photoelectric technology, and the product is added together by means of mechanical instrument measurement. Using computer technology, it can be measured quickly and accurately with high precision. Due to its high accuracy, clear imaging, non-contact, and other advantages, it is widely used in modern industrial estimation. Although lidar can accurately extract the coal flow of the scraper conveyor, it cannot be widely promoted due to its high cost and redundant data processing problems in the later stage [
17,
18].
Vision measurement technology is a new type of measurement technology based on machine vision. Its advantages are high precision, strong real-time performance, large amount of information and non-contact measurement. With the reduction of implementation costs and the development of related software and hardware performance, the advantages of visual measurement technology have gradually emerged, and it has become one of the methods to solve measurement problems in the industrial production process [
19,
20,
21,
22]. In view of the huge potential safety hazards of nuclear scale radiation, scholars [
23] have proposed a coal quantity detection method based on machine vision and deep learning classification. This method uses an industrial camera to capture a dynamic coal volume image transmitter that laser illuminates the conveyor belt. However, due to the gravity of the coal, the scraper conveyor belt will bend to different degrees than when it is empty, resulting in errors in the data predicted by the visual measurement method.
3. Technical Route of Coal Flow Monitoring of Scraper Conveyor
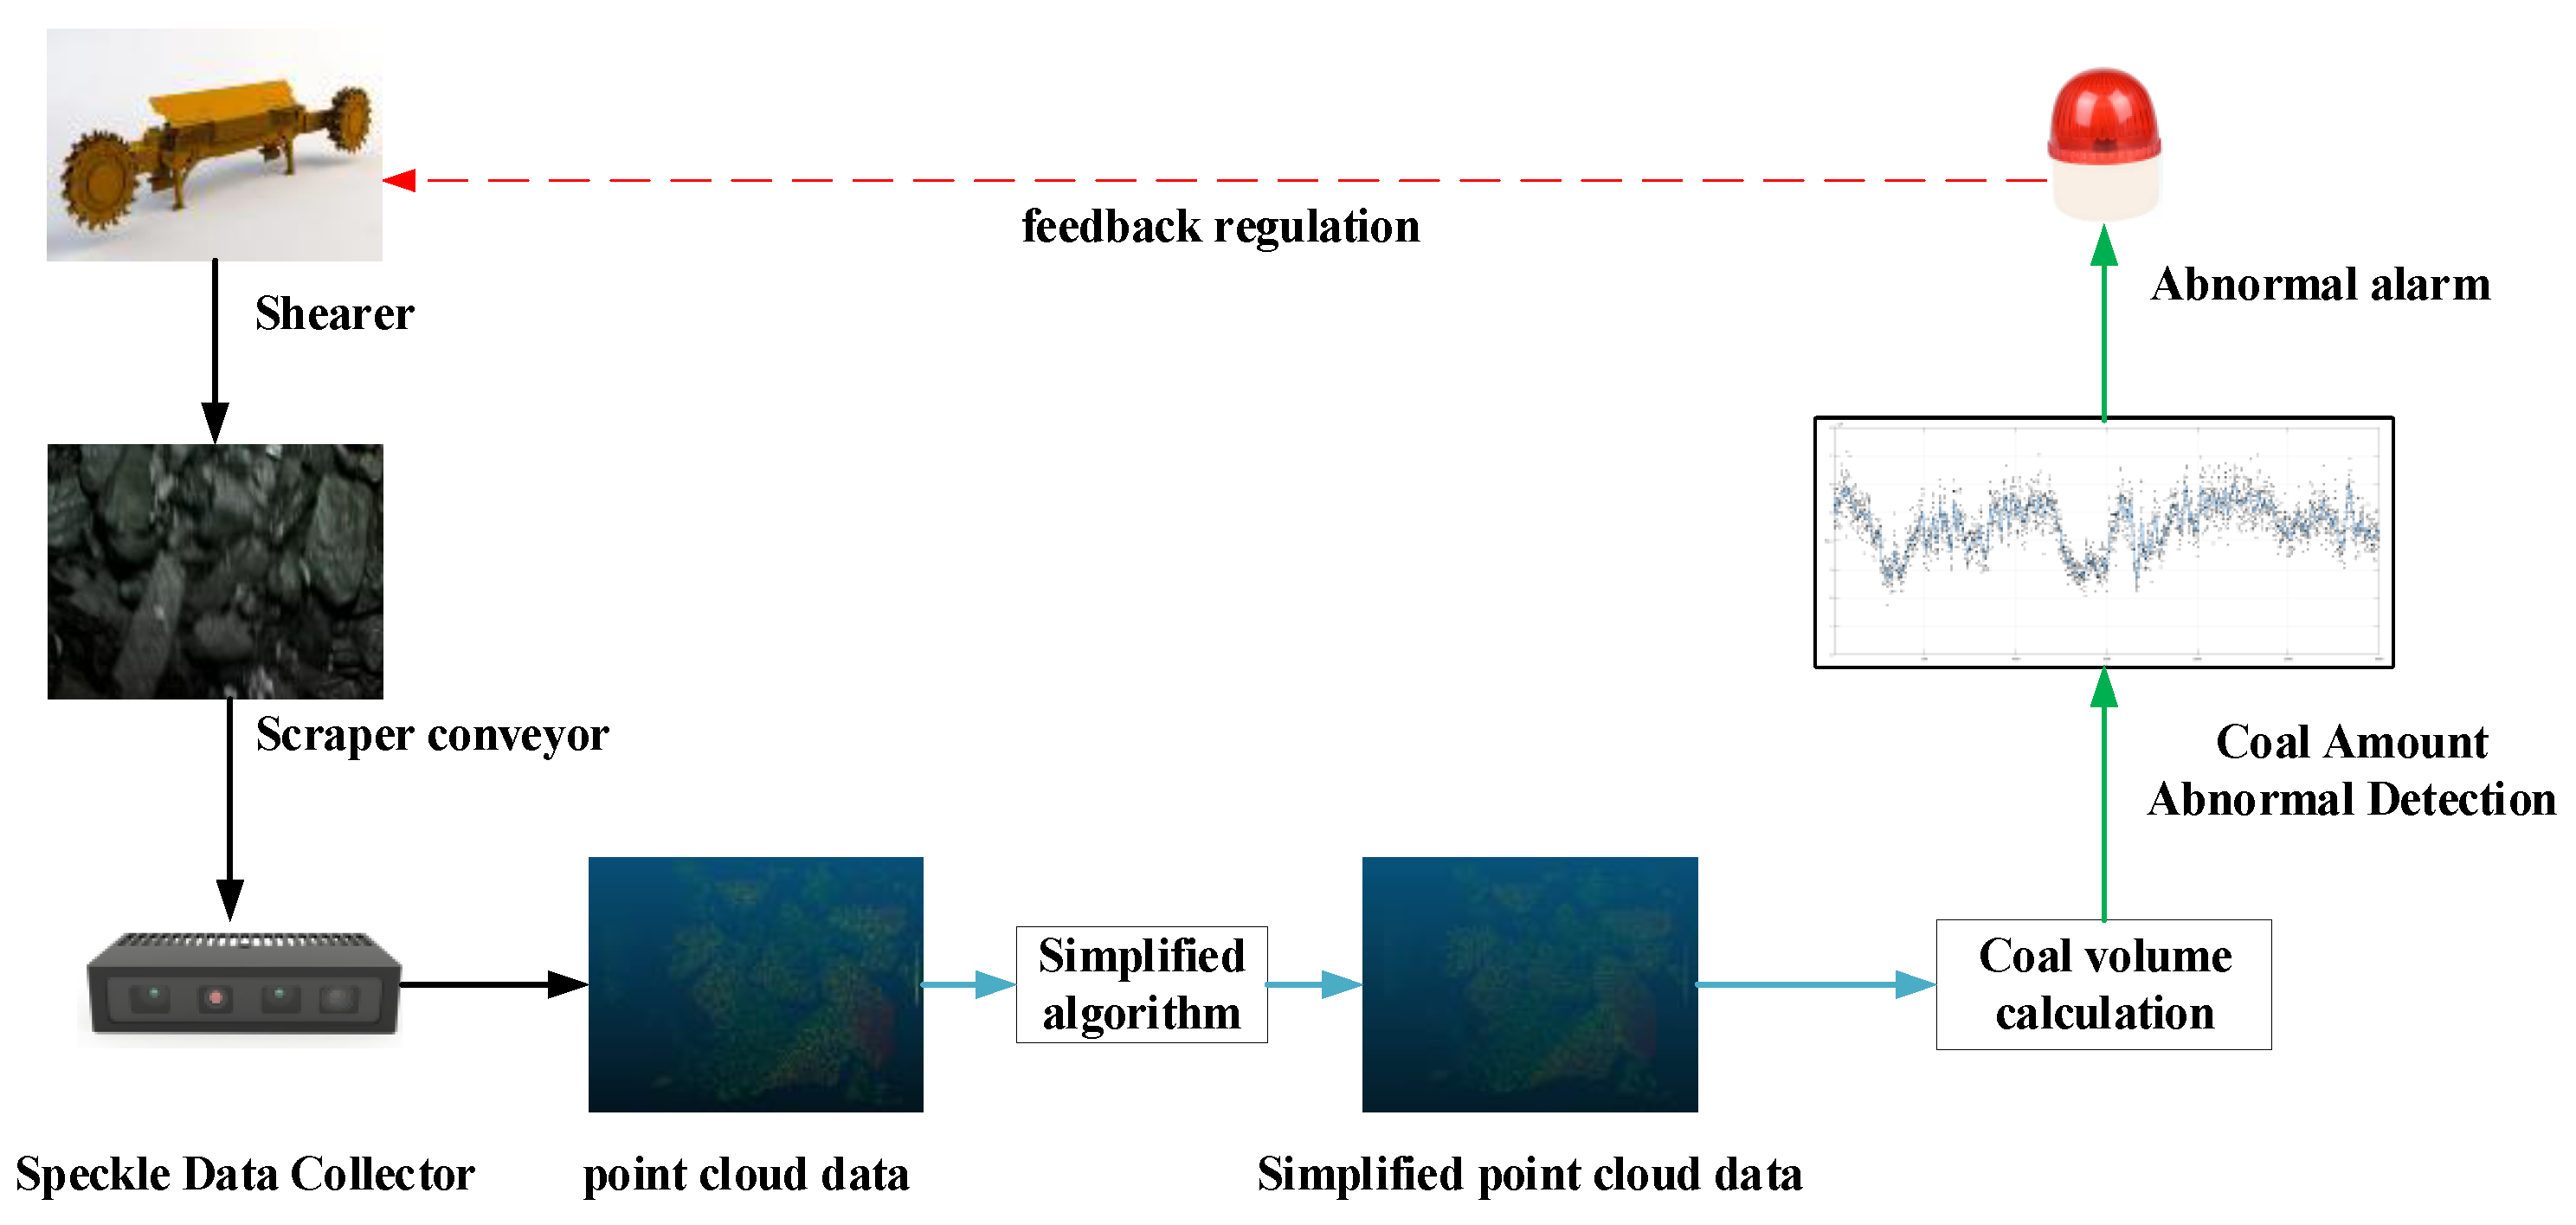
To solve the limitations of traditional methods, a method for monitoring the coal flow of a scraper conveyor based on speckle structured light data is designed.
Figure 3 shows the technical route of this paper. In the first step, we installed a speckle structured light collector and a point cloud data converter on the scraper conveyor and obtained the point cloud data of the coal body on the scraper conveyor. In the second step, by analyzing the collected point cloud data, a point cloud simplification algorithm is proposed for the collected coal body point cloud data. In the third step, the volume of the coal mass is calculated from the simplified point cloud data and used to monitor the coal flow of the scraper conveyor. Finally, when the abnormal coal flow of the scraper conveyor is detected, the system will issue an abnormal alarm and transmit the abnormal information to the shearer. The abnormal alarm can remind the staff that the coal flow is abnormal at this time, and the shearer will also reduce the mining efficiency.
4. Methodology
4.1. PDS-Algorithm
Before using the point cloud data to calculate the coal volume, it is necessary to simplify the collected point cloud data. At present, scholars have proposed different point cloud simplification algorithms in order to achieve different simplification effects. These algorithms are roughly divided into three categories. The first category is to simplify scattered point clouds according to mathematical ideas, such as the random sampling method and its improvement method [
24,
25]. This kind of method can directly simplify the point cloud data as a whole, and the efficiency is relatively high. The second category is to divide the original point cloud data into different grids [
26,
27]. By simplifying the point cloud data in each grid, such as the uniform grid method, this method requires grid construction before data simplification. The third category is to simplify the point cloud based on the differential geometric information of the point and its neighboring points, such as the curvature method and the minimum distance method [
28].
By analyzing the point cloud data collected by speckle structured light acquisition equipment, we found that this kind of data is very different from the data scanned by devices such as lidar. This difference is embodied in two points:
- (1)
The area of point cloud data collected by speckle equipment is highly controllable. This is also one of the reasons for choosing the speckle equipment to collect the point cloud data of the scraper conveyor. We only care about the point cloud data of the coal body in the area of the scraper conveyor, not the point cloud data of the environment outside the scraper conveyor.
- (2)
The accuracy of point cloud data collected by speckle structured light equipment is limited. The collected point cloud data can only reflect the overall outline of the coal and there are some voids, rather than the uniformity and density of the coal collected by lidar equipment. Because the focus of this paper is the coal volume on the scraper conveyor, the point cloud data collected by the speckle structured light can basically meet the accuracy requirements for calculating the coal volume in the area.
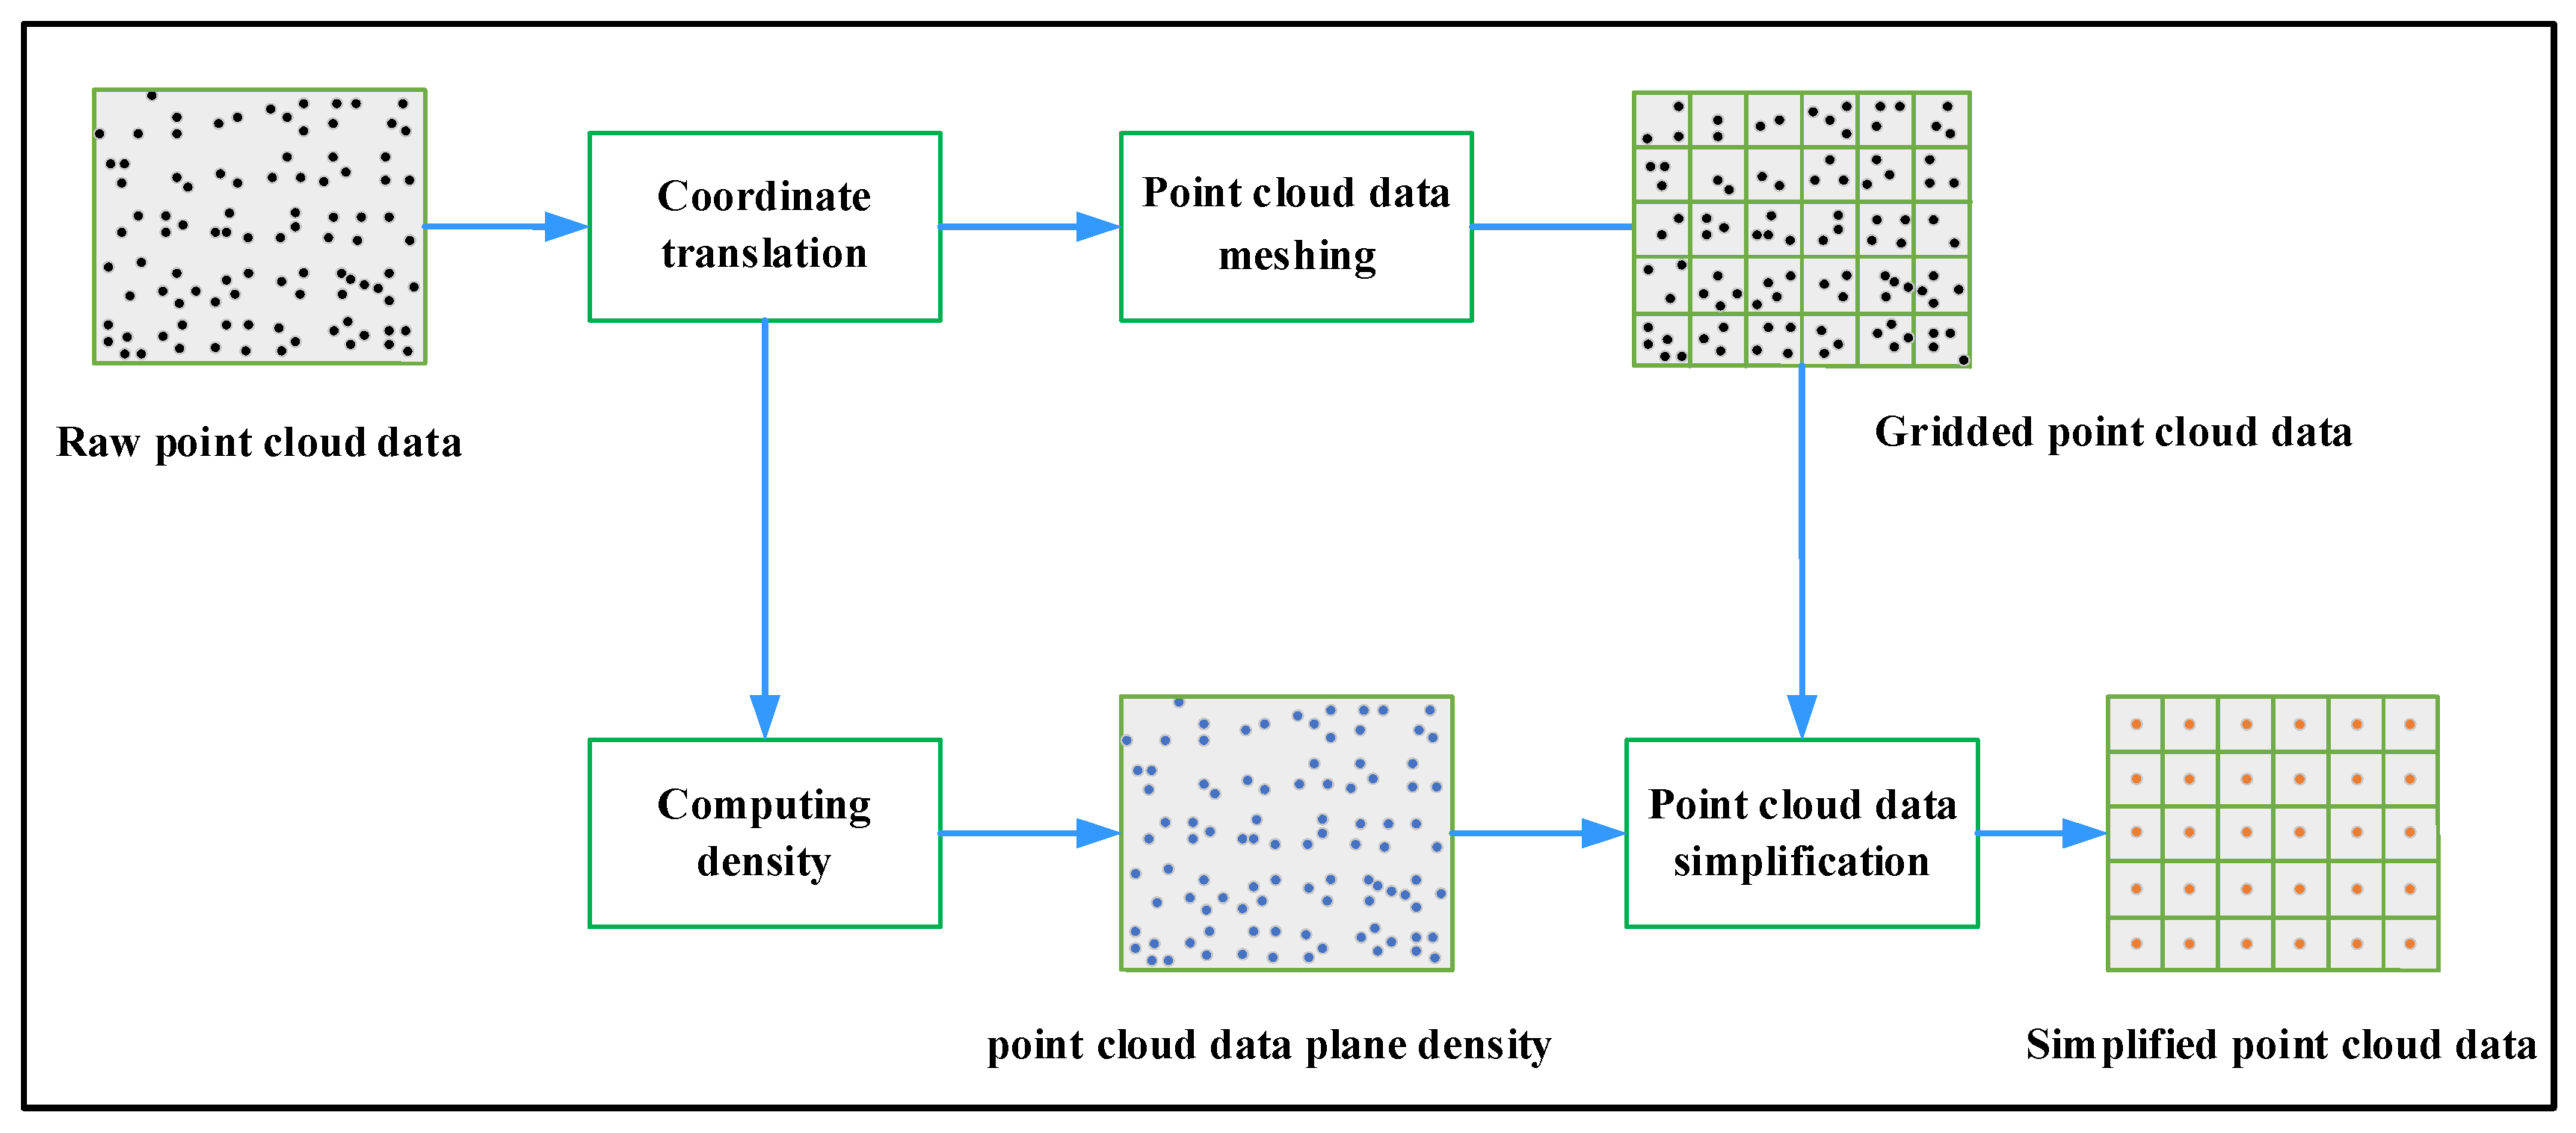
Compared with lidar, the images collected by speckle structured light will have an uneven density of point cloud data due to the difference in the angle of view collected by the binocular camera. As we all know, the denser the distribution of collected point cloud data, the higher the accuracy of the collection area. In view of the uneven distribution and limited accuracy of speckle structured light data, this paper proposes a point cloud data simplification algorithm based on plane density (PDS-Algorithm). As the height coordinates of the point cloud data are the most concerned in this paper, not the three-dimensional features, this paper selects the uniform grid method that can make full use of the height coordinates of the point cloud data as the improved basic algorithm. As shown in
Figure 4, the flow chart of the PDS-Algorithm. In the following sections, the Coordinate translation, Density calculation, point cloud meshing and point cloud data simplification in the flowchart will be introduced one after another.
4.1.1. Coordinate Translation
Since the speckle structured light collection device is collected from top to bottom, the high values of the collected point cloud data are all negative values. At the beginning of the algorithm, the high values of all point cloud data are adjusted. The formula is as follows:
where
represents the height of the collected point cloud data,
is the height adjustment parameter, and the adjustment parameter should at least ensure that the height value of all point cloud data is positive.
4.1.2. Computing Density
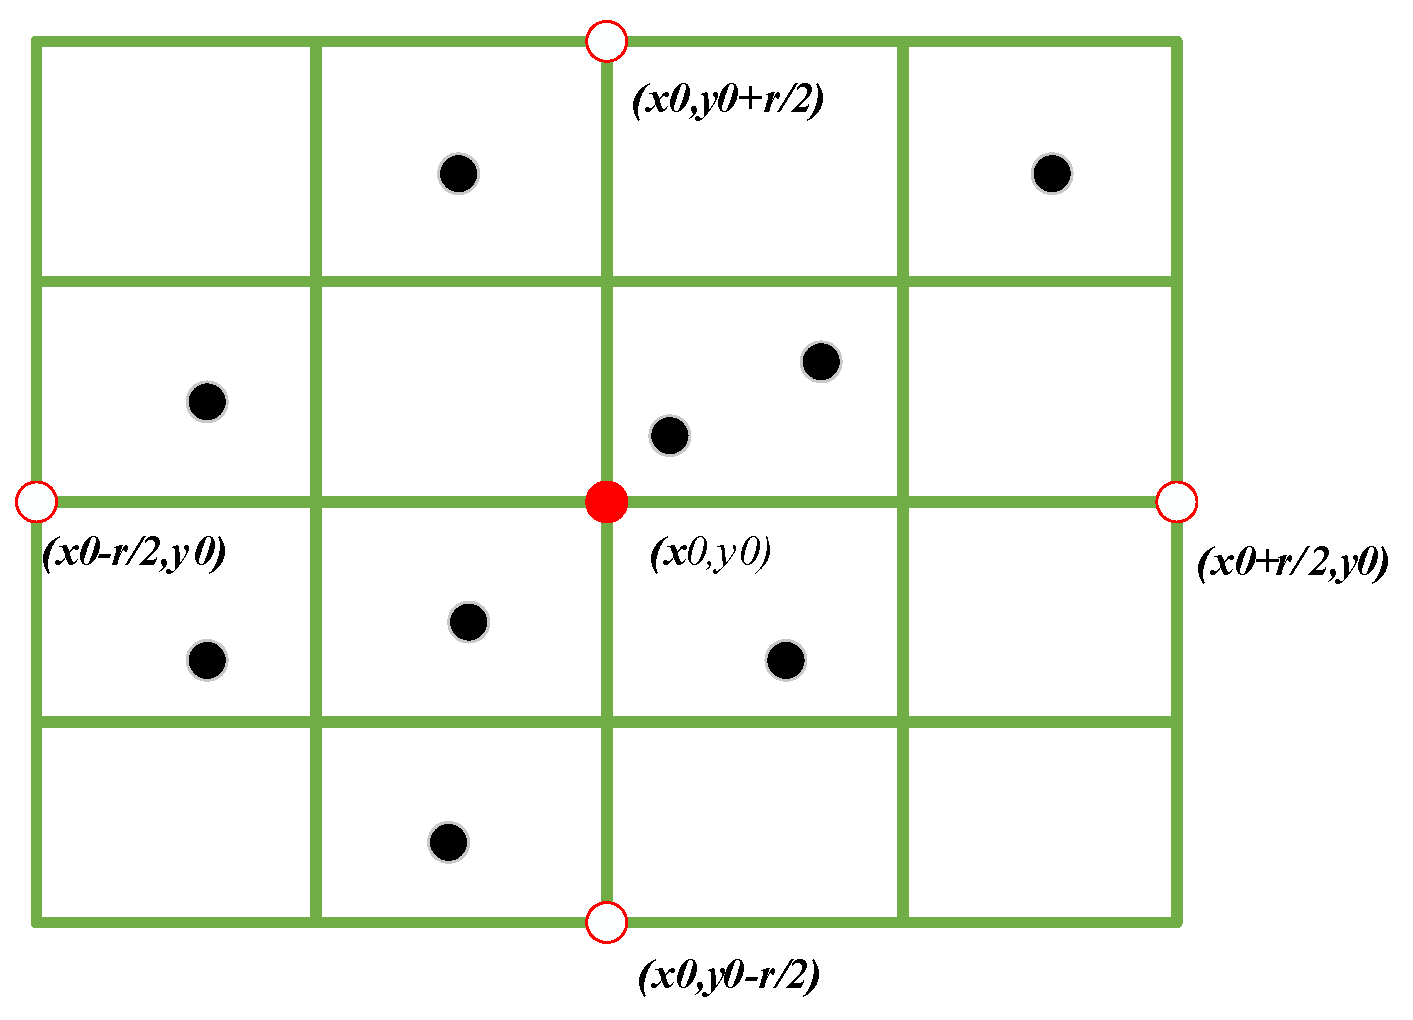
The second step is to calculate the plane density of all point cloud data. The distribution of point cloud data collected by speckle structured light equipment is uneven. The density of point cloud data can reflect the true degree of regional spatial information, which is recognized by everyone. Therefore, this paper associates the distribution density of point cloud data with the height value of point cloud data to obtain a more realistic height value. The definition of point cloud data density in this paper is shown as Equation (2).
The meaning of its density is the density in the range r around the point. The pmin and k values in Formula (2) are hyperparameters, which can be set according to the needs of practical engineering applications. Where pmin represents the minimum density assigned to the point.
Formula (3) calculates the density of the number of points around the point divided by the area. Equation (4) shows the definition of the range around the point. As shown in
Figure 5, the number of points in the surrounding range of point (
x0,
y0) is 10 (including its own point).
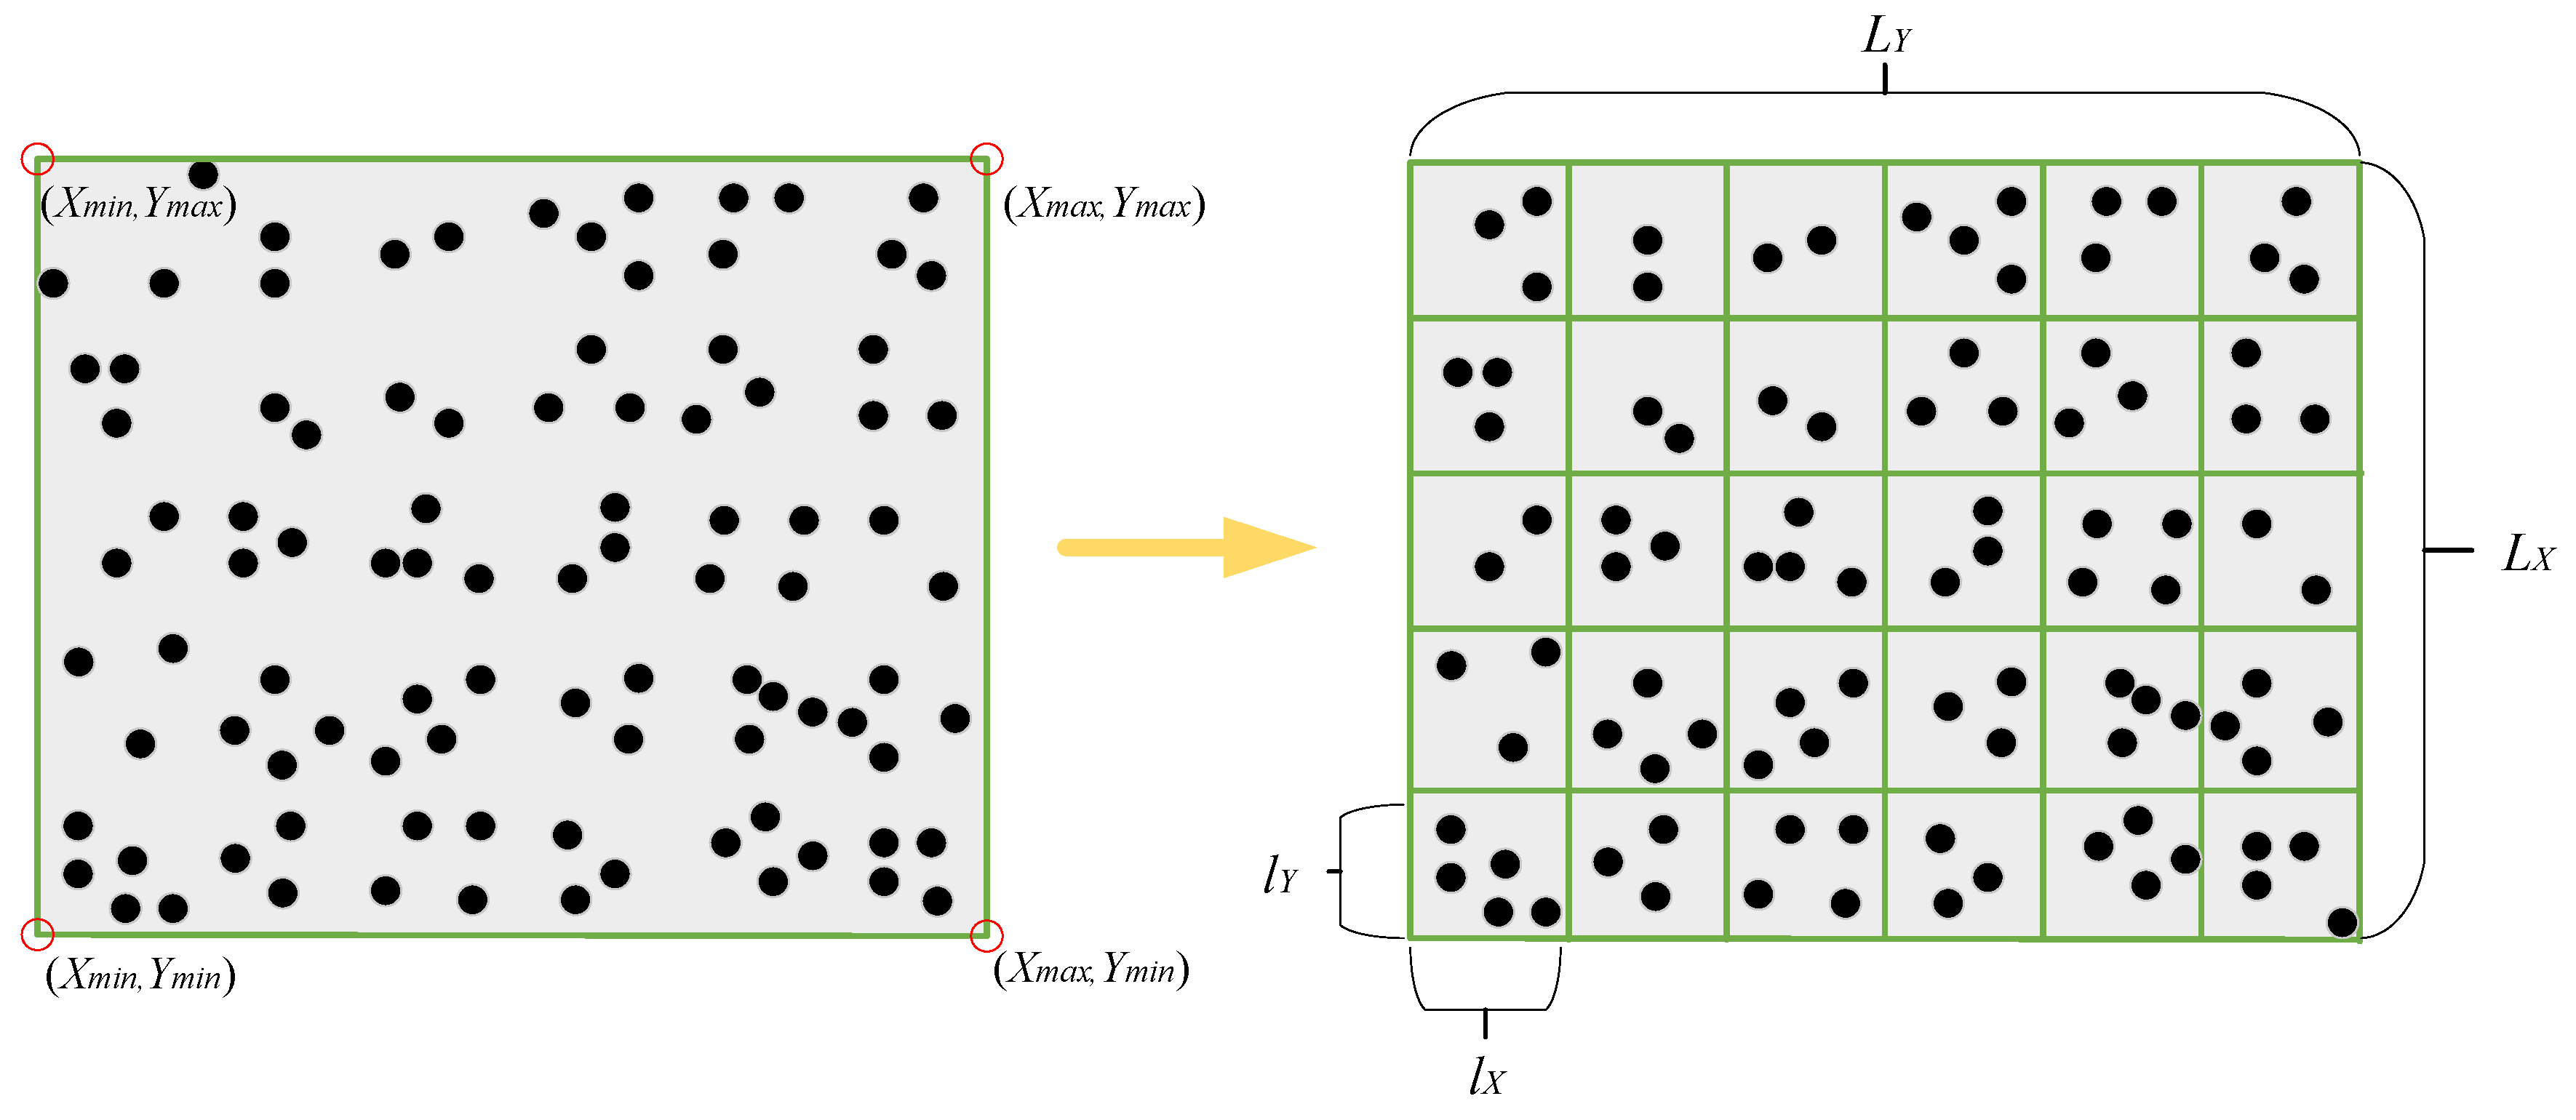
4.1.3. Point Cloud Data Meshing
Assuming that the point cloud dataset contains n point cloud data. In all point cloud data, the maximum values in the two-dimensional direction are
,
, and the minimum values are
,
, respectively. To ensure that the bounding box contains all the point cloud data in the point cloud dataset, it is necessary to increase the side length of the bounding box to different degrees. Its overall bounding box side length is shown in Formula (5):
where
a1 and
a2 in Formula (5) are the parameters to be adjusted. Formula (6) is the calculation method of the side length of the divided grid. After the division is completed,
s ×
s small squares will be generated.
Figure 6 is a comparison diagram before and after segmentation.
4.1.4. Point Cloud Data Simplification
To find the closest true height value for each square, we calculate the weighted average of the height values of all points in the square, where the weight is the density of each point calculated previously.
Formula (7) is the height–weight average calculation relationship. To keep the original point cloud data size, this paper places the calculated height value in the center of the square, as shown in
Figure 7. In Formula (7),
is the height of the point cloud data in the area,
is the corresponding weight, and
is the number of point clouds in the area.
The pseudo code of the algorithm proposed in this paper is shown in Algorithm 1.
| Algorithm 1 PDS(P,s,r) |
Input: Point cloud data P, Grid number s Density range r
Output: newP
1: P = Coordinate translation (P)
2: Pdensity = Computing density (P, r)
3: P = Mesh(P, s)
4: for i = 1: Length(P) { |
5: Hi = Computing Height (Pi, Pdensity)
6: sP = Zeros (Size(Pi))
7: sPcenter = 1
8: newP(i) = H (i)×sPcenter
9: } |
| 10:reture newP |
4.2. Method for Monitoring Abnormal Flow of Coal
4.2.1. Coal Volume Calculation of Scraper Conveyor
After simplifying the point cloud data by PDS-Algorithm, the point cloud data has been differentiated into several equal-area squares. If the area of each block is 1, the simulated volume of this pile of coal can be expressed as Formula (8).
where
i is the serial number of the block in the point cloud data, and
Hi is the height of the corresponding block. This results in a linear correspondence between the simulated volume and the real volume due to possible errors during point cloud data acquisition and simplification. Equation (9) gives the linear relationship between the real volume and the simulated volume.
k and
b in Formula (9) are adjustable parameters and should be adjusted in practical applications.
4.2.2. Coal Flow Monitoring Method
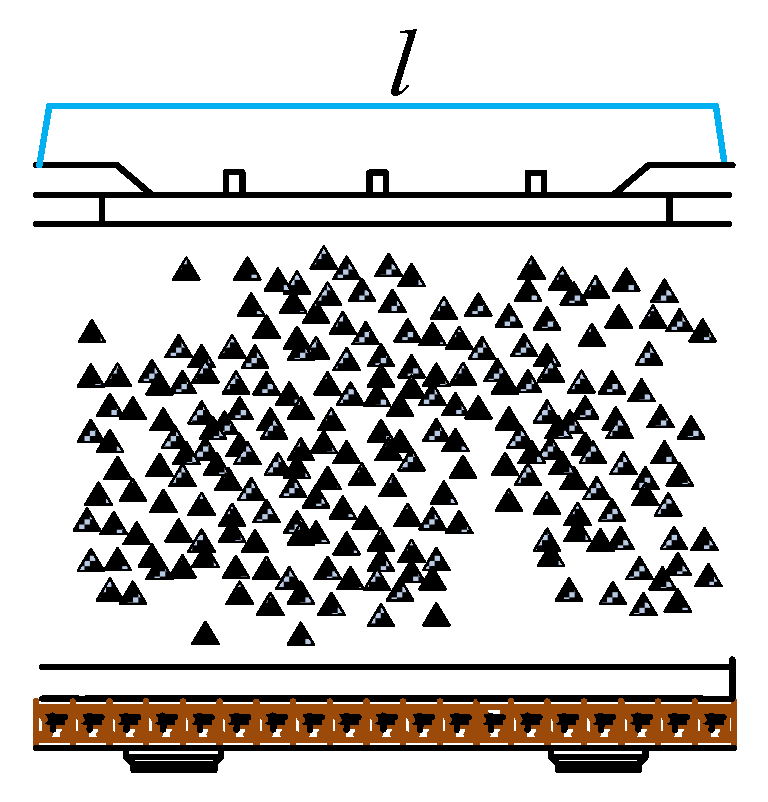
Due to the long length of the scraper conveyor, the speckle structured light collection device can only collect a section of the coal body of the conveyor, as shown in
Figure 8. In this paper, a coal flow detection method based on time series is designed. Assuming that the length of the scraper conveyor area taken is
l and the conveying speed is
v, then it takes
t(
l/
v) seconds for all coal bodies in the area to appear and then disappear. If the collection frequency of the speckle structured light collection device is set to 1/
t, theoretically, all coal bodies passing through the collection area can be collected only once. If the length of the scraper conveyor is 3
l, then the data acquisition equipment needs to collect at least three times to collect all the coal flowing through.
Figure 9 shows the time series coal flow calculation method set in this paper. The Ts row represents the total time series, the time when the coal flow needs to be calculated for the first time for the T1 line is t
0–t
2, the time for the T2 line to calculate the coal flow for the second time, and so on. We can use the sum of the coal amount at this moment and the coal amount at the previous moment to calculate the real coal amount data on the scraper conveyor at this moment. Calculations of several frames of historical flow can be adjusted according to the length of the scraper conveyor.
5. Application Example and Analysis of Scraper Conveyor Monitoring
5.1. Establishment of Data Acquisition System
Daliuta Coal Mine is located in Daliuta Town, Shenmu County, Shaanxi Province. It is a 10-million-ton mine and an important export coal base under the jurisdiction of China Shenhua Energy Company. The mine’s approved production capacity is 21.7 million tons per year, with recoverable reserves of 1530 million tons. The coal seam in the mine field has a stable occurrence and simple structure, and belongs to a gentle monoclinic structure. The mined coal is of good quality and has the characteristics of ultra-low ash, ultra-low sulfur, ultra-low phosphorus, high volatile content, medium and high calorific value, and high melting ash content. Due to the high mining intensity of this coal mine, the underground scraper conveyor frequently fails due to the overload or light load of the transmission flow. The speed of the scraper conveyor is 1.89 m/s.
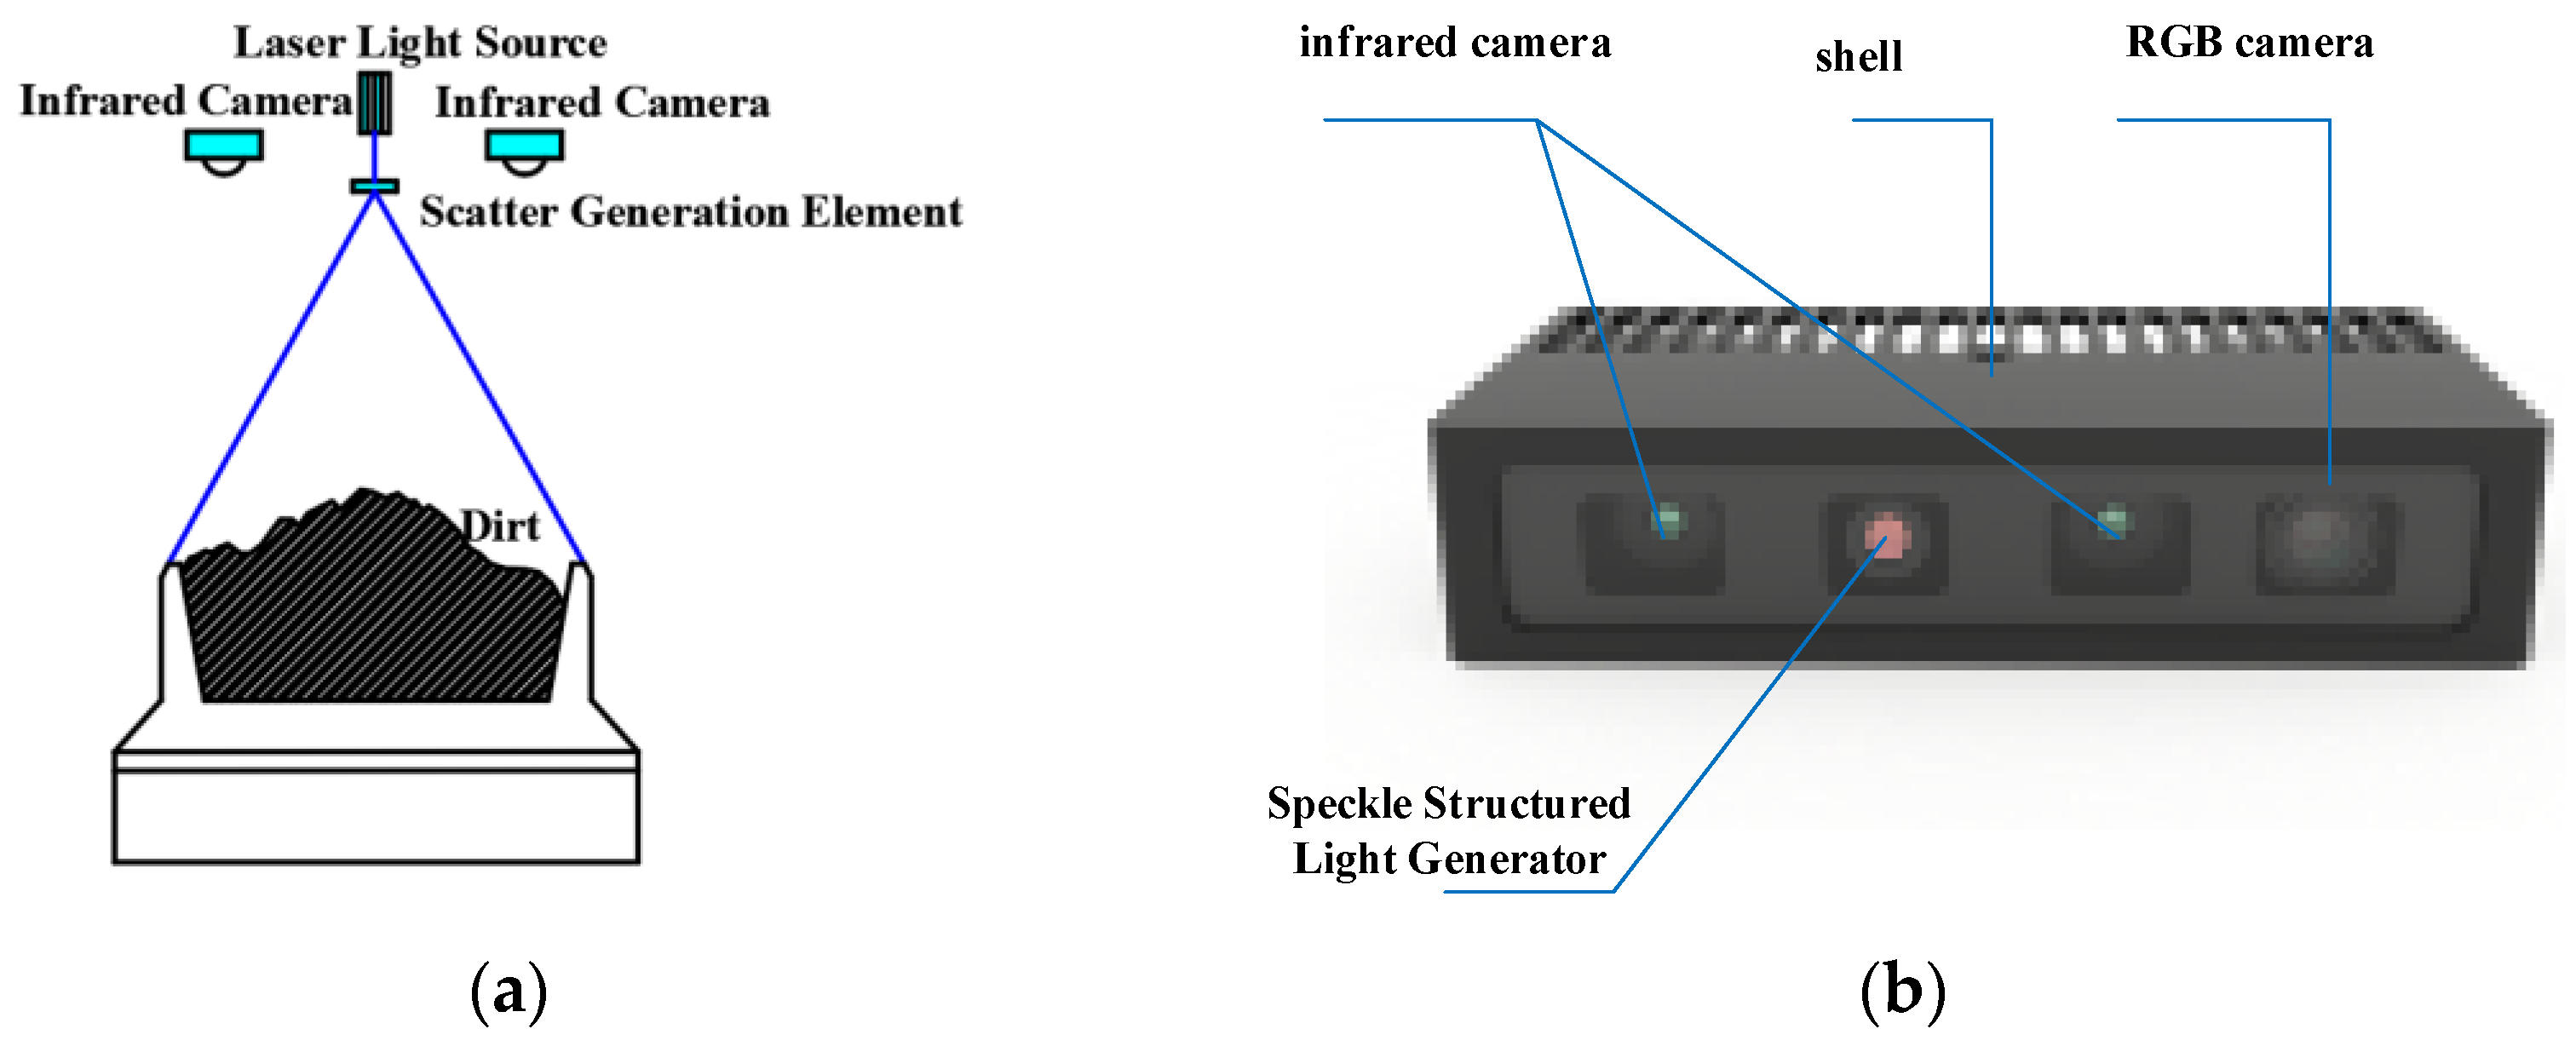
The installation position of the speckle structured light coal flow measurement system in the fully mechanized mining face, as shown in
Figure 10. After passing through the speckle generating element, the laser forms a speckle field and projects it to the surface of the coal stream. The two cameras simultaneously collect the speckle image of the object, find the corresponding point by the digital image correlation algorithm, and finally calculate the three-dimensional coordinates of the corresponding point through the principle of stereo vision.
The structure of the speckle structure optical coal flow 3D reconstruction system is shown in
Figure 11. The hardware of the system mainly includes a laser light source, speckle generating element and infrared camera. The speckle generating element is usually ground glass or a designed diffractive optical element. The frequency of the speckle structured light collection is 6 Hz. Under these conditions, all coal passing through the data collection area of the scraper conveyor passes through the area within exactly 1 s.
Table 1 shows basic technical parameters of system hardware.
5.2. Accuracy Analysis of Coal Quantity Calculation with PDS Algorithm
This article uses the C++ language in Visual Studio software to compile the algorithm under the Ubuntu system, the processor is i7-12700K, the graphics card model is NVIDIA GeForce RTX 3080, and the system memory is 32 G. The compiled algorithm is installed on an industrial computer with model GK4000 underground for testing.
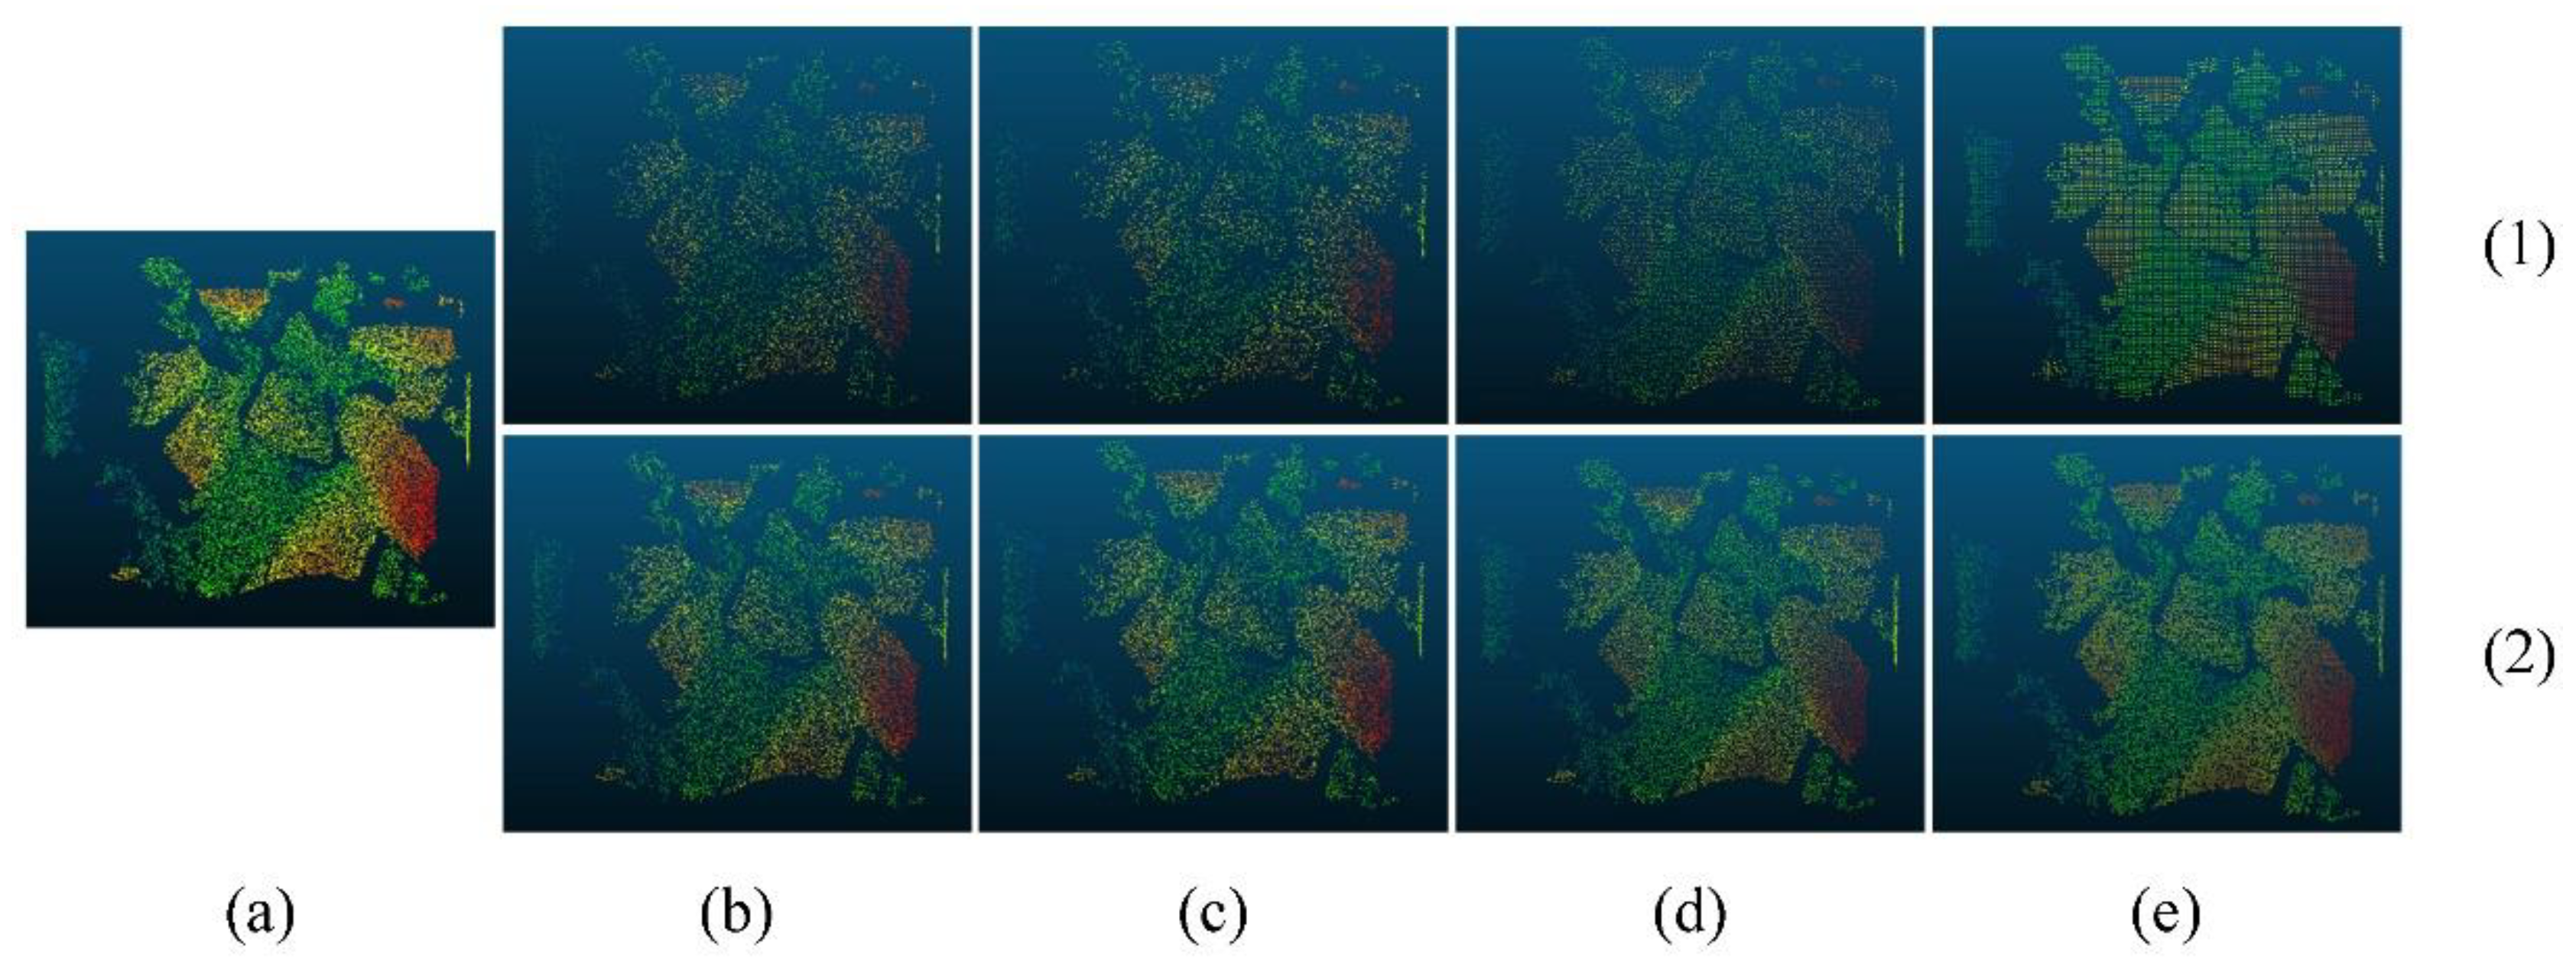
Figure 12 shows the comparison of the effects of different simplified algorithms on the original coal point cloud data. Line (1) in
Figure 12 indicates that the point cloud data simplification rate is 30%, and line (2) in the figure indicates that the simplification rate is 60%. In particular, the color that appears in the point cloud data graph in this article represents the height of the point cloud data. Blue is the lowest, green is next, yellow is next, and red is the highest. It can be seen from the figure that the simplification effect of the four simplification algorithms is similar in general. However, the distribution of point cloud data processed by the bounding box grid method and the PDS algorithm is more uniform. Compared with other methods, the PDS algorithm does not give up the elevation of each point cloud data, so the point cloud data simplified by the PDS algorithm has the point cloud height information closest to the original data.
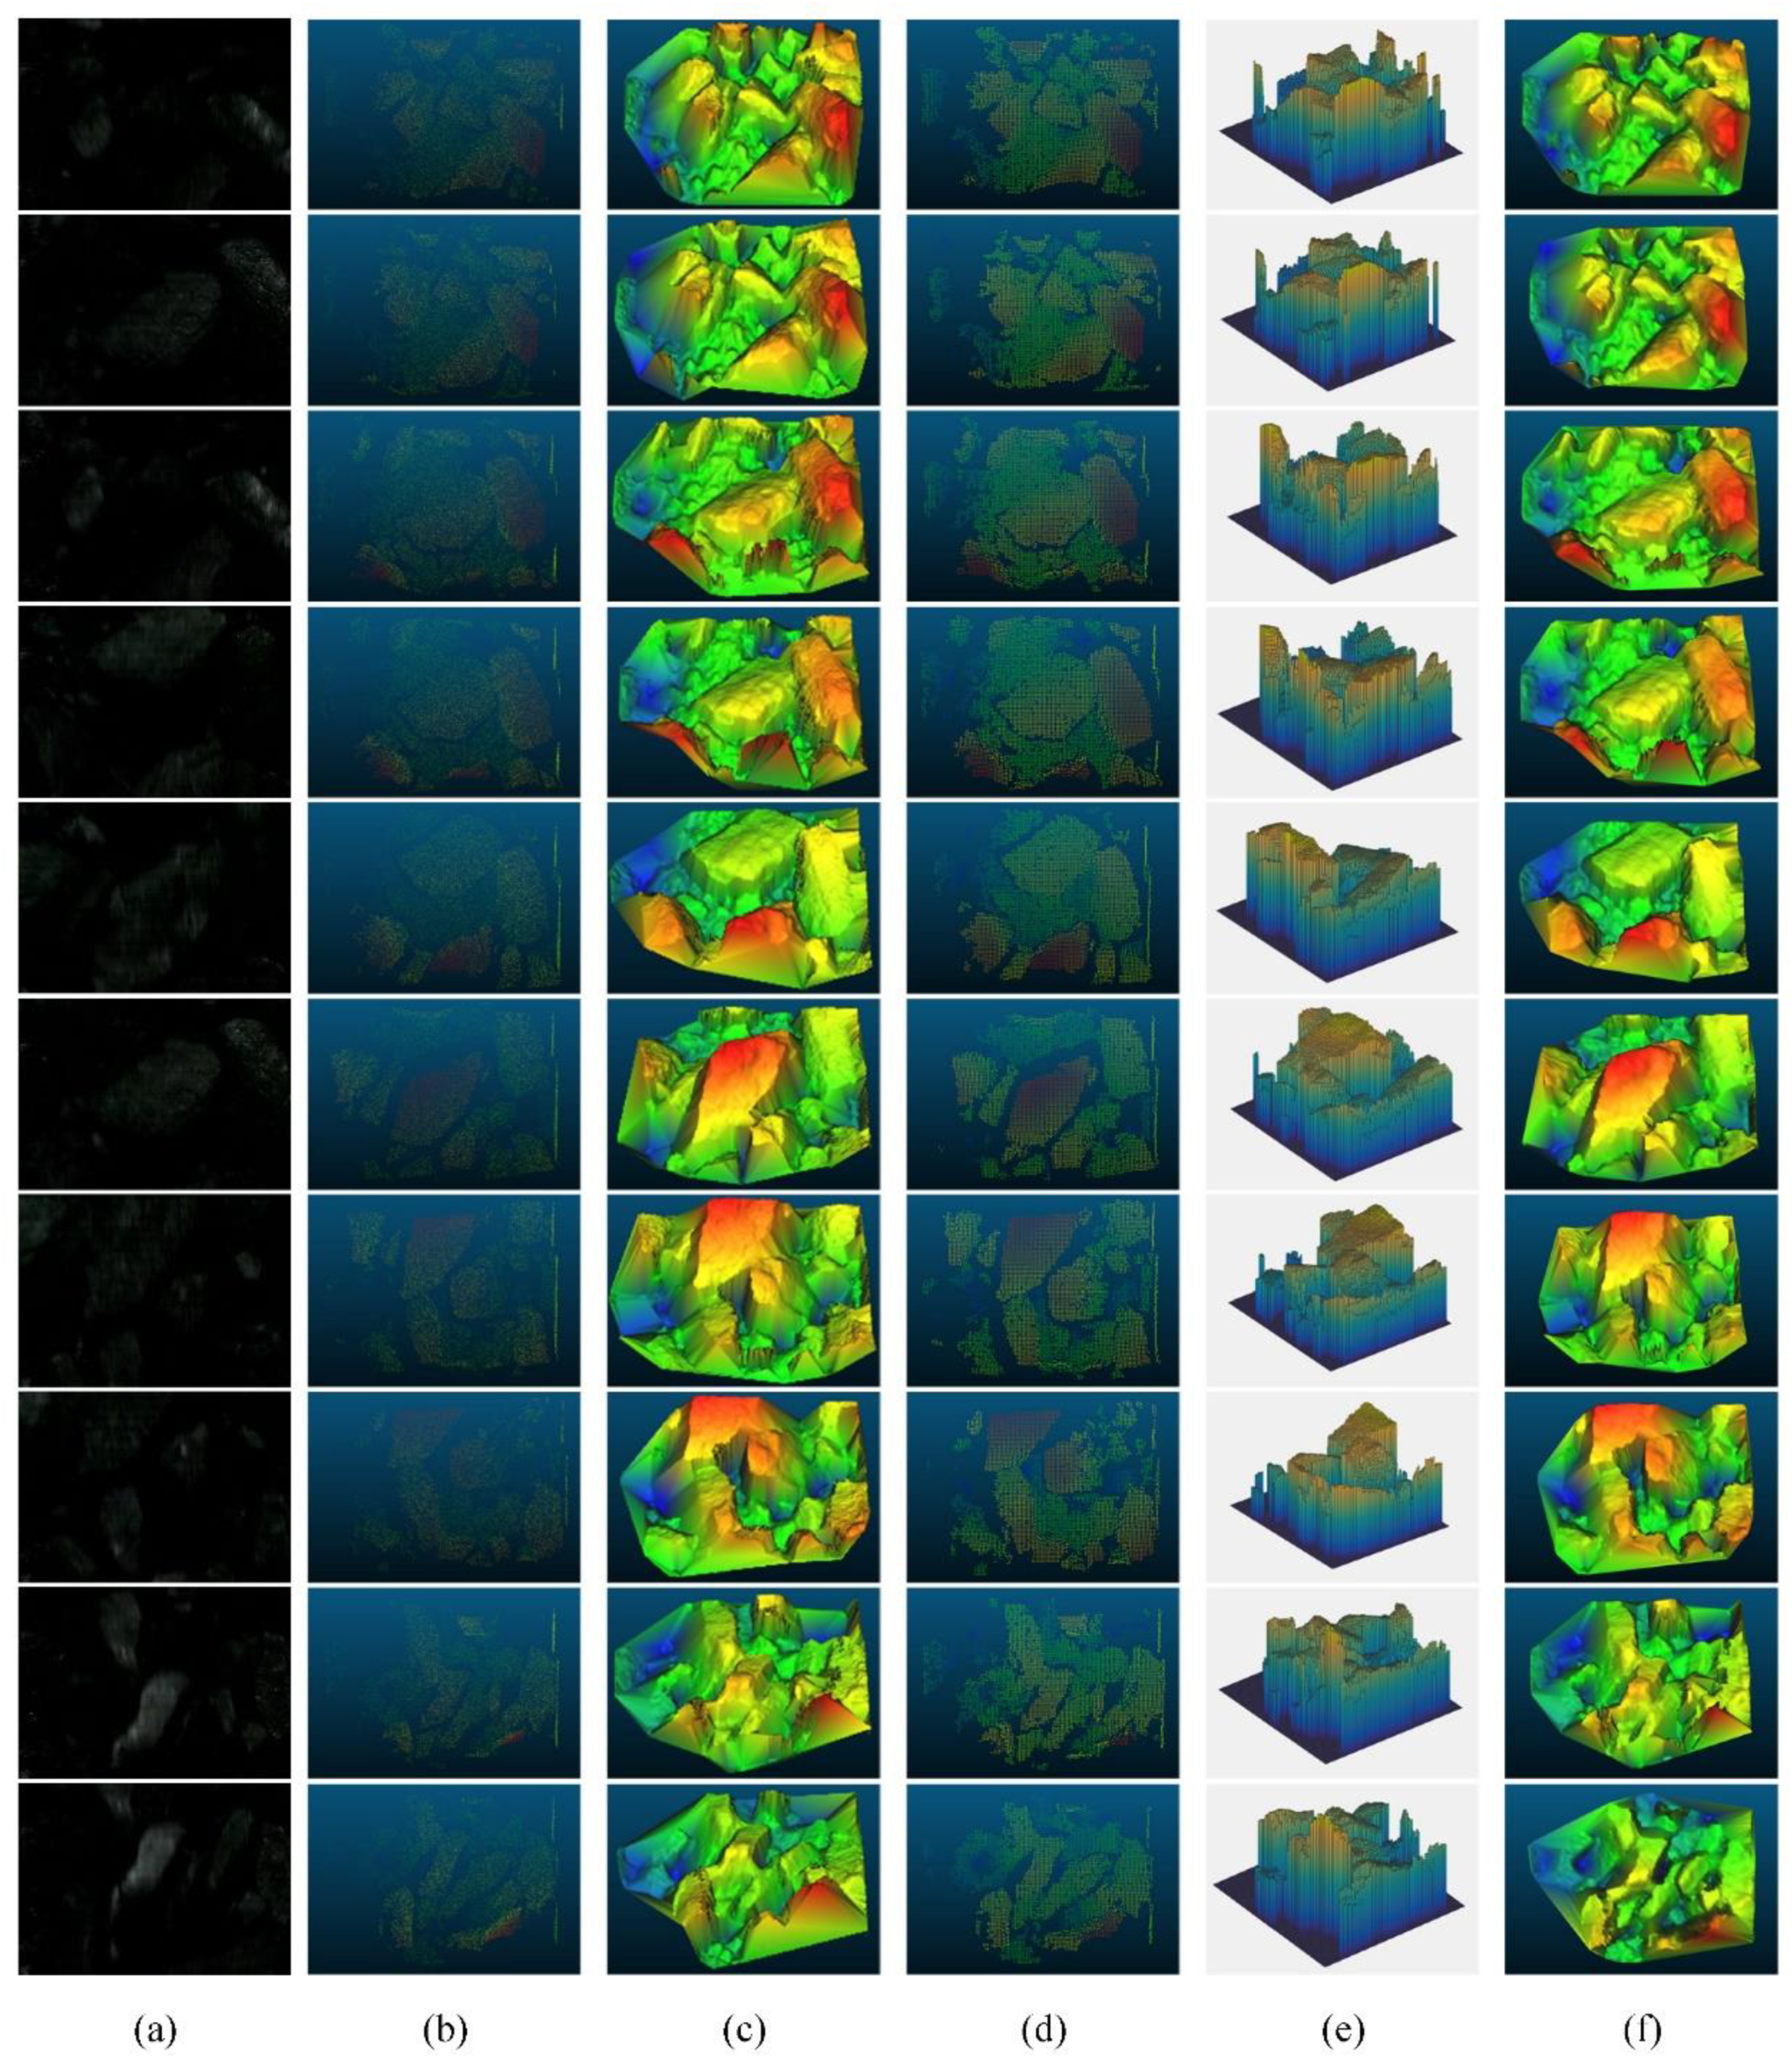
To compare whether the point cloud data before and after simplification is distorted, this paper conducts modeling analysis on ten consecutive frames of point cloud data.
Figure 13 shows the point cloud data constructed from the original data and the point cloud model after 60% simplification. The coal blocks share six images from entering the monitoring area to leaving the monitoring area, which is consistent with the sampling rate set in this paper.
Figure 13e is the computational mathematical model constructed in this paper. It can be seen from
Figure 13c,f that the simplified point cloud data in this paper are constructed by the Delaunay triangulation method. The overall difference is not large, which shows that the simplified method in this paper does not damage the internal relationship of the model.
To quantitatively calculate the improved accuracy of the PDS algorithm proposed in this paper and the same type of grid simplification algorithm, this paper compares random grid simplification, median grid simplification, mean grid simplification, and the PDS algorithm in this paper. We collected 3000 continuous point cloud data and measured the corresponding coal volume data and compared the algorithms using the accuracy calculation method of Equation (10).
Table 2 shows the accuracy of the final volume for different simplification methods. Where
is the predicted volume and
is the real volume.
It can be seen from
Table 2 that the PDS algorithm proposed in this paper has the best accuracy under different simplified precisions. The mean simplification algorithm is next, and the random simplification is similar to the median simplification. The superiority of the PDS algorithm is that it considers the density relationship in the range of point cloud numbers in the process of simplification.
The processing time of the above methods is basically the same. The processing time of one frame of data without simplification is 17.6 s, but when the simplification rate is 70%, the processing time is only 0.81 s. This fully shows that it is very necessary to simplify the coal point cloud data. When the simplification rate reaches 80%, the processing time is 1.45 s and the accuracy also reaches 93.42%. When the simplification rate reaches 80%, the processing time is 1.45 s, and the accuracy rate also reaches 93.42%. Neither accuracy nor processing time can meet the requirements for coal flow monitoring of scraper conveyors.
5.3. Analysis on the Accuracy of Flow Monitoring of Scraper Conveyor
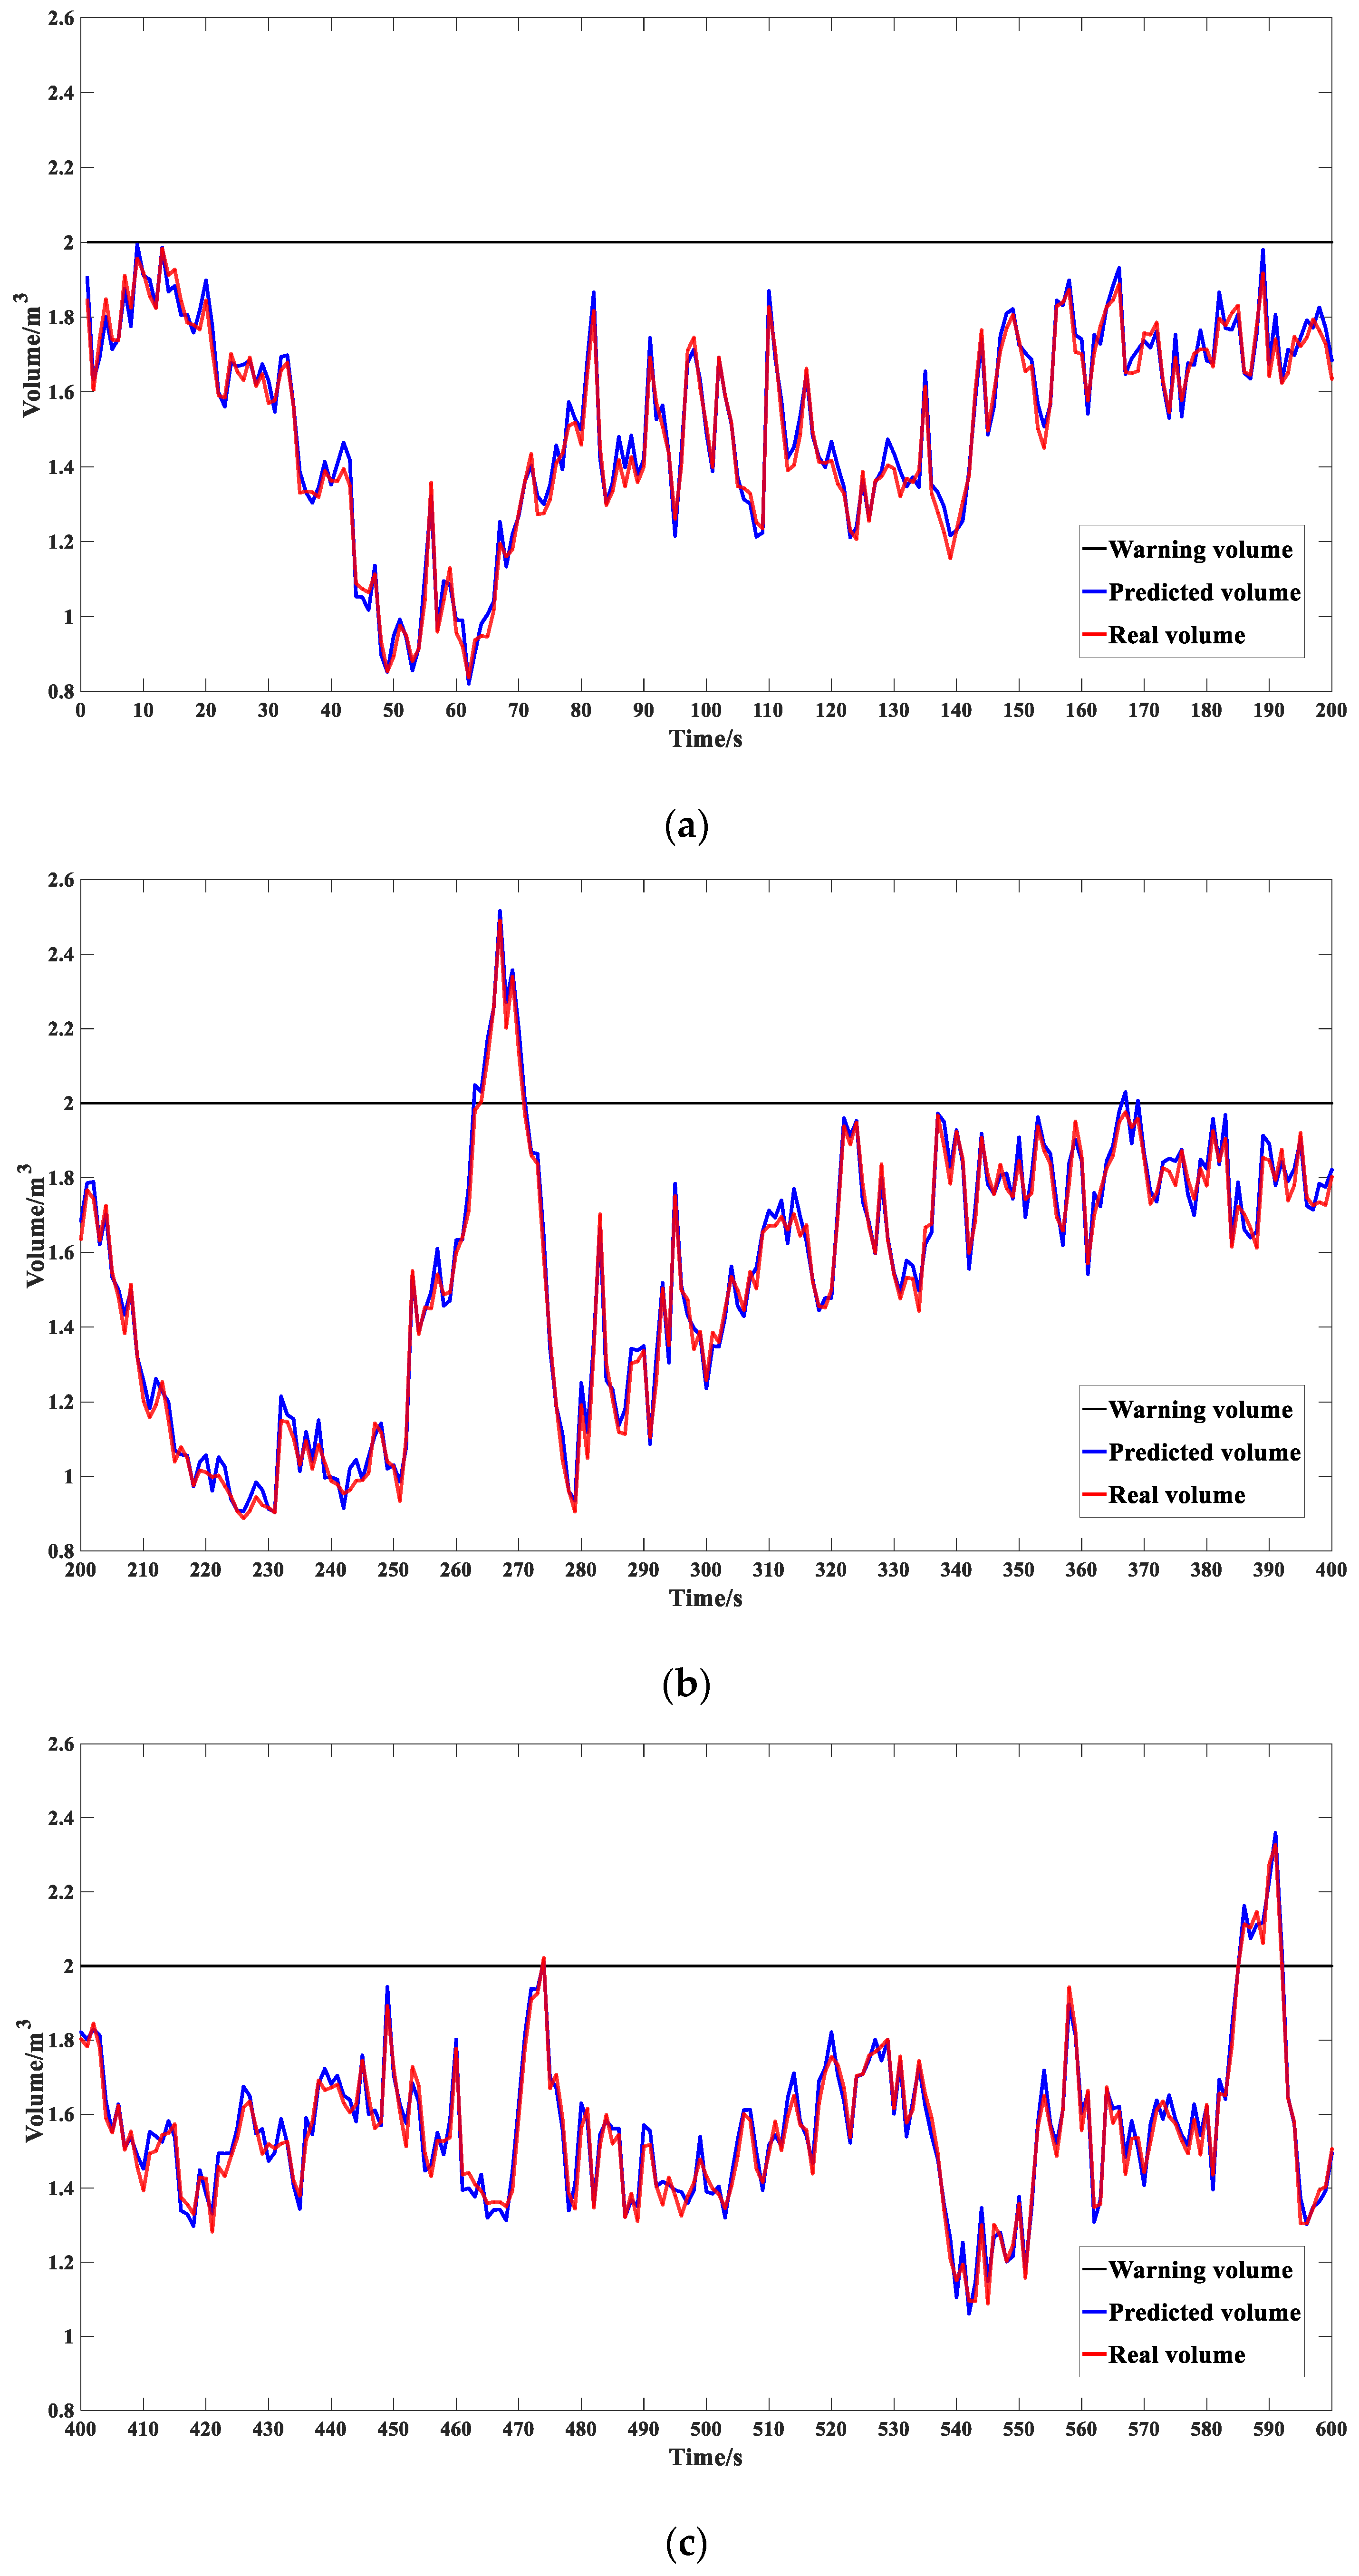
The proposed monitoring method is used to monitor the coal flow overload of the scraper conveyor in Shaanxi Daliuta Coal Mine. As shown in
Figure 14, the coal flow monitoring result of the scraper conveyor in ten minutes is shown. To maintain the accuracy of the algorithm, this paper defines the distance of 2.5 m between the monitoring point and the coal outlet as the coal flow of the scraper conveyor. Based on engineering experience, we have obtained a reasonable coal flow rate of 2.5 m scraper conveyor coal should not exceed 2 m
3, and finally 2 m
3 is used as the warning threshold in this paper.
As can be seen from
Figure 14, there are three abnormal coal flows in the scraper conveyor within ten minutes.
Figure 14b shows the first anomaly period, this anomaly lasts about 7 s. As shown in
Figure 14c, the third segment anomaly lasts about 6 s. Normally, an alarm is issued when the abnormality lasts for two seconds, which in turn causes the shearer to reduce the mining speed to prevent the scraper conveyor from being overloaded. After a long field test, it was finally verified that the monitoring accuracy of the method proposed in this paper was as high as 92%. At present, this kind of precision monitoring method can meet the precision requirements of most scraper cloud data machines.
5.4. Performance Analysis of Coal Flow Method for Scraper Conveyor
This paper makes a horizontal comparison between the method in this paper and the existing methods from the aspects of contact type, safety, installation difficulty, monitoring sensitivity, consumption cost, precision, and real-time performance of different methods. From
Table 3, it can be clearly seen that the method based on speckle data proposed in this paper has advantages in different performances compared with other existing methods.
6. Conclusions
Aiming at the problems of serious conveyor loss and clogging of coal outlet caused by abnormal coal flow of coal mine scraper conveyor, this paper proposes a coal flow monitoring method for the scraper conveyor based on speckle structured light data. The simplification effect of the proposed PDS-algorithm is better than other similar grid algorithms under the same simplification rate. In the case of a simplification rate of 90%, the calculation accuracy of coal volume is as high as 96.85%. In the coal flow monitoring of scraper conveyor, the proposed monitoring method can predict abnormal flow with an accuracy of up to 92%.
In this paper, the influence of large lumps of coal on the scraper conveyor is regarded as a factor affecting the coal flow, but the overall coal flow may be very small and large lumps still exist in production. The presence of large pieces of coal on the conveyor may cause the coal outlet to be blocked and affect the normal operation of the mine. The problem of detection and identification of large lump coal is the defect of this method. Therefore, it is our next research plan to develop a set of visual coal flow and large lump coal identification software systems combined with the visual method.
The method based on statistical process control chart can more accurately determine the threshold value of coal quantity exceeding the limit. In this study, the coal quantity overrun threshold was calculated based on engineering experience, which lacks a certain theoretical basis. If the method of statistical process control chart is used to calculate the coal volume exceeding threshold, it is necessary to obtain enough coal flow data samples. However, the coal flow data acquisition device used in this study is restricted by the underground environment of the coal mine and cannot be continuously monitored for a long time. In the follow-up, we will improve the data acquisition device, collect a large amount of coal flow data, and give a more reasonable and accurate coal excess threshold based on the statistical process control chart method.
Author Contributions
Conceptualization, Y.W. and W.G.; methodology, Y.W. and S.Z.; software, Y.W., S.Z. and Z.X.; validation, Y.W. and W.G.; formal analysis, Y.W., W.G. and S.Z.; investigation, Y.W. and W.G.; resources, Y.W., W.G. and Z.X.; data curation, Y.W. and S.Z.; writing—original draft preparation, Y.W. and B.X.; writing—review and editing, Y.W., B.X. and Z.X.; supervision, Y.W. and Z.X. All authors have read and agreed to the published version of the manuscript.
Funding
This study was supported by the National Key R&D Program of China (grant No. 2017YFC0804310), the General Special Scientific Research Plan of Shaanxi Provincial Department of Education (grant No. 20JK0754).
Institutional Review Board Statement
Not applicable.
Informed Consent Statement
Not applicable.
Data Availability Statement
Data sharing not applicable.
Acknowledgments
The authors thank the editor for the editing assistance. Lastly, the authors would like to thank the reviewers for their valuable comments and suggestions on an earlier version of our manuscript.
Conflicts of Interest
The authors declare that they have no conflict of interest.
References
- Fedorko, G.; Nečas, J.; Zegzulka, J.; Gelnar, D.; Molnár, V.; Tomašková, M. Measurement of Amount for Steel Abrasive Material Transported by Special Scraper Conveyor. Appl. Sci. 2021, 11, 1852. [Google Scholar] [CrossRef]
- Wojnar, G.; Burdzik, R.; Wieczorek, A.N.; Konieczny, Ł. Multidimensional Data Interpretation of Vibration Signals Registered in Different Locations for System Condition Monitoring of a Three-Stage Gear Transmission Operating under Difficult Conditions. Sensors 2021, 21, 7808. [Google Scholar] [CrossRef] [PubMed]
- Wieczorek, A.N.; Wójcicki, M. Synergism of the Binary Wear Process of Machinery Elements Used for Gaining Energy Raw Materials. Energies 2021, 14, 1981. [Google Scholar] [CrossRef]
- Li, J.; Liu, Y.; Xie, J.; Wang, X.; Ge, X. Cutting Path Planning Technology of Shearer Based on Virtual Reality. Appl. Sci. 2020, 10, 771. [Google Scholar] [CrossRef] [Green Version]
- Stoicuta, O.; Pana, T.; Mandrescu, C. The control system analysis of the coal flow on the scrapers conveyor in a longwall mining system. In Proceedings of the 2016 International Conference on Applied and Theoretical Electricity (ICATE), Craiova, Romania, 6–8 October 2016; pp. 1–10. [Google Scholar]
- Luo, J.; Huang, W.; Zhang, S. Energy cost optimal operation of belt conveyors using model predictive control methodology. J. Clean. Prod. 2015, 105, 196–205. [Google Scholar] [CrossRef]
- Pang, Y.; Lodewijks, G.; Schott, D.L. Fuzzy controlled energy saving solution for large-scale belt conveying systems. Appl. Mech. Mater. 2013, 260–261, 59–64. [Google Scholar] [CrossRef]
- Stoicuţă, O.; Pană, T. Modeling and simulation of the coal flow control system for the longwall scraper conveyor. Ann. Univ. Craiova Electr. Eng. Ser. 2016, 40, 101–108. [Google Scholar]
- Chen, X. Design of multi-point coal flow monitoring system for belt conveyor based on ultrasonic. Ind. Mine Autom. 2017, 43, 75–78. [Google Scholar]
- Yamazaki, T.; Sakurai, Y.; Ohnishi, H.; Kobayashi, M.; Kurosu, S. Continuous mass measurement in checkweighers and conveyor belt scales. In Proceedings of the 41st SICE Annual Conference, Osaka, Japan, 5–7 August 2002; Volume 1, pp. 470–474. [Google Scholar]
- Tasaki, R.; Yamazaki, T.; Ohnishi, H.; Kobayashi, M.; Kurosu, S. Improved continuous weighing by multi-stage conveyor belt scale. Trans. Soc. Instrum. Control. Eng. 2004, 40, 1205–1210. [Google Scholar] [CrossRef]
- Tasaki, R.; Yamazaki, T.; Ohnishi, H.; Kobayashi, M.; Kurosu, S. Development of continuous weighing by multi-stage conveyor belt scale. In Proceedings of the SICE 2004 Annual Conference, Sapporo, Japan, 4–6 August 2004; Volume 1, pp. 813–818. [Google Scholar]
- Xing, Z.; Zhao, S.; Guo, W.; Guo, X.; Wang, Y. Processing Laser Point Cloud in Fully Mechanized Mining Face Based on DGCNN. ISPRS Int. J. Geo-Inf. 2021, 10, 482. [Google Scholar] [CrossRef]
- Wang, X.; Li, B.; Yang, Z. Analysis of the Bulk Coal Transport State of a Scraper Conveyor Using the Discrete Element Method. Stroj. Vestn. J. Mech. Eng. 2018, 64, 37–46. [Google Scholar]
- Qu, D.; Qiao, T.; Pang, Y. Research on adcn method for damage detection of mining conveyor belt. IEEE Sens. J. 2020, 21, 8662–8669. [Google Scholar] [CrossRef]
- Huang, K.; Huang, Y. Multiple-frequency ultrasonic distance measurement using direct digital frequency synthesizers. Sens. Actuators A Phys. 2009, 149, 42–50. [Google Scholar] [CrossRef]
- Zhang, M.; Zhou, M.; Shi, H. A computer vision-based real-time load perception method for belt conveyors. Math. Probl. Eng. 2020, 2020, 8816388. [Google Scholar] [CrossRef]
- Badreldin, N.; Sanchez-Azofeifa, A. Estimating Forest Biomass Dynamics by Integrating Multi-Temporal Landsat Satellite Images with Ground and Airborne LiDAR Data in the Coal Valley Mine, Alberta, Canada. Remote Sens. 2015, 7, 2832–2849. [Google Scholar] [CrossRef] [Green Version]
- Wen, X.; Wang, J.; Zhang, G.; Niu, L. Three-Dimensional Morphology and Size Measurement of High-Temperature Metal Components Based on Machine Vision Technology: A Review. Sensors 2021, 21, 4680. [Google Scholar] [CrossRef] [PubMed]
- Shao, S.; Zhou, Z.; Deng, G.; Du, P.; Jian, C.; Yu, Z. Experiment of Structural Geometric Morphology Monitoring for Bridges Using Holographic Visual Sensor. Sensors 2020, 20, 1187. [Google Scholar] [CrossRef] [Green Version]
- Zhang, Z.; Wang, X.; Zhao, H.; Ren, T.; Xu, Z.; Luo, Y. The Machine Vision Measurement Module of the Modularized Flexible Precision Assembly Station for Assembly of Micro- and Meso-Sized Parts. Micromachines 2020, 11, 918. [Google Scholar] [CrossRef]
- Kim, J.-I.; Gang, H.-S.; Pyun, J.-Y.; Kwon, G.-R. Implementation of QR Code Recognition Technology Using Smartphone Camera for Indoor Positioning. Energies 2021, 14, 2759. [Google Scholar] [CrossRef]
- Liu, W.; Sun, J.; Li, W.; Hu, T.; Wang, P. Deep Learning on Point Clouds and Its Application: A Survey. Sensors 2019, 19, 4188. [Google Scholar] [CrossRef] [Green Version]
- Fotsing, C.; Nziengam, N.; Bobda, C. Large Common Plansets-4-Points Congruent Sets for Point Cloud Registration. ISPRS Int. J. Geo-Inf. 2020, 9, 647. [Google Scholar] [CrossRef]
- Zhang, K.; Qiao, S.; Wang, X.; Yang, Y.; Zhang, Y. Feature-Preserved Point Cloud Simplification Based on Natural Quadric Shape Models. Appl. Sci. 2019, 9, 2130. [Google Scholar] [CrossRef] [Green Version]
- Leal, E.; Sanchez-Torres, G.; Branch-Bedoya, J.W.; Abad, F.; Leal, N. A Saliency-Based Sparse Representation Method for Point Cloud Simplification. Sensors 2021, 21, 4279. [Google Scholar] [CrossRef] [PubMed]
- Gong, M.; Zhang, Z.; Zeng, D. A New Simplification Algorithm for Scattered Point Clouds with Feature Preservation. Symmetry 2021, 13, 399. [Google Scholar] [CrossRef]
- Gao, Y.; Ping, C.; Wang, L.; Wang, B. A Simplification Method for Point Cloud of T-Profile Steel Plate for Shipbuilding. Algorithms 2021, 14, 202. [Google Scholar] [CrossRef]
| Publisher’s Note: MDPI stays neutral with regard to jurisdictional claims in published maps and institutional affiliations. |
© 2022 by the authors. Licensee MDPI, Basel, Switzerland. This article is an open access article distributed under the terms and conditions of the Creative Commons Attribution (CC BY) license (https://creativecommons.org/licenses/by/4.0/).


