1. Introduction
Thin film deposition has great significance in industrial and medical processes, and numerous studies are concerned with the development of thin-film processes for specific applications [
1,
2]. Plasma spraying by means of an atmospheric pressure plasma jet (APPJ) allows the deposition of thin layers of metal, metal oxide or polymers and on temperature-sensitive substrates, such as paper or wood. In the process, particles are melted in the plasma of an atmospheric pressure gliding plasma arc jet and applied to the surface [
3,
4,
5]. The plasma source and parameters ensure low particle temperatures at the nozzle exit compared to a thermal plasma spray, and at working distances of ≥20 mm no thermal impact to the specimen occurred. The process is also termed “cold plasma spraying” [
6,
7].
For broad application, understanding the underlying mechanism and influence of the relevant parameters, process stability and monitoring are necessary. Appropriate methods need to be non-invasive, reliable and fast to detect changes in plasma properties in real time and under process conditions. Optical emission spectroscopy (OES) is well established for the characterization of APPJ because it provides insight into plasma energy distributions and kinetics and is interference-free. OES experiments showed that gliding arcs exhibit an initial quasi-equilibrium zone close to the electrodes, followed by a non-equilibrium zone with electron temperatures about 10 times higher than rotational and translational temperatures [
8]. In general, studies showed similar trends for different types of APPJs, including an increase in plasma temperature and electron density with input power or a decrease in plasma temperature with increasing axial distance. Changes in gas composition, well studied for the influence of water, lead to a change in kinetics and therefore a strong variation in plasma temperatures, electron densities, and excited species densities can be observed [
9,
10,
11,
12]. The presence of substrates can have similar effects, but many jets are monitored under laboratory conditions, and not many studies focus on substrate interactions [
13]. Recent developments have focused on the application of OES for the monitoring and controlling of plasma. Line-ratio methods and simple kinetic models allow evaluation in real time for selected processes [
14,
15].
To establish OES as a tool to monitor cold plasma spray, fundamental investigations are first necessary. In this study, OES was used for the downstream characterization of the effluent plasma of an APPJ for the thin film deposition of metals, metal oxides or polymers. Beside the determination of reactive species and their development being dependant on the distance from the nozzle and different gas flows, special attention was paid to the determination of plasma temperatures. A rotational temperature, determined by an analysis of the molecular spectrum of a species such as
,
, NO or CN, is commonly assumed to be equal to the gas temperature in atmospheric pressure plasmas as long as certain conditions are fulfilled [
16,
17]. Special care has to be taken in the selection of spectral bands to avoid spectral overlapping of different species. In addition, knowledge of rotational temperature, electron density and electron temperature, also referred to as electron energy, are fundamental. While determining electron density by the Stark effect is possible using OES if the gas temperature is known and the resolution of the spectrometer is sufficient, determining electron energy is sophisticated and requires a valid kinetic model [
18,
19]. On the other hand, excitation temperatures can easily be derived by line-ratio methods. The general trend for both, electron and excitation temperatures, is the same, while for non-LTE plasmas the electron temperature is higher than the excitation temperature [
20,
21]. For deposition processes, excitation temperature is of special interest as the energy transfer between excited atoms and molecules is important for the melting of the particles, whereas the energy transfer between electrons and particles is negligible.
2. Materials and Methods
2.1. Plasma Source and Measurement Conditions
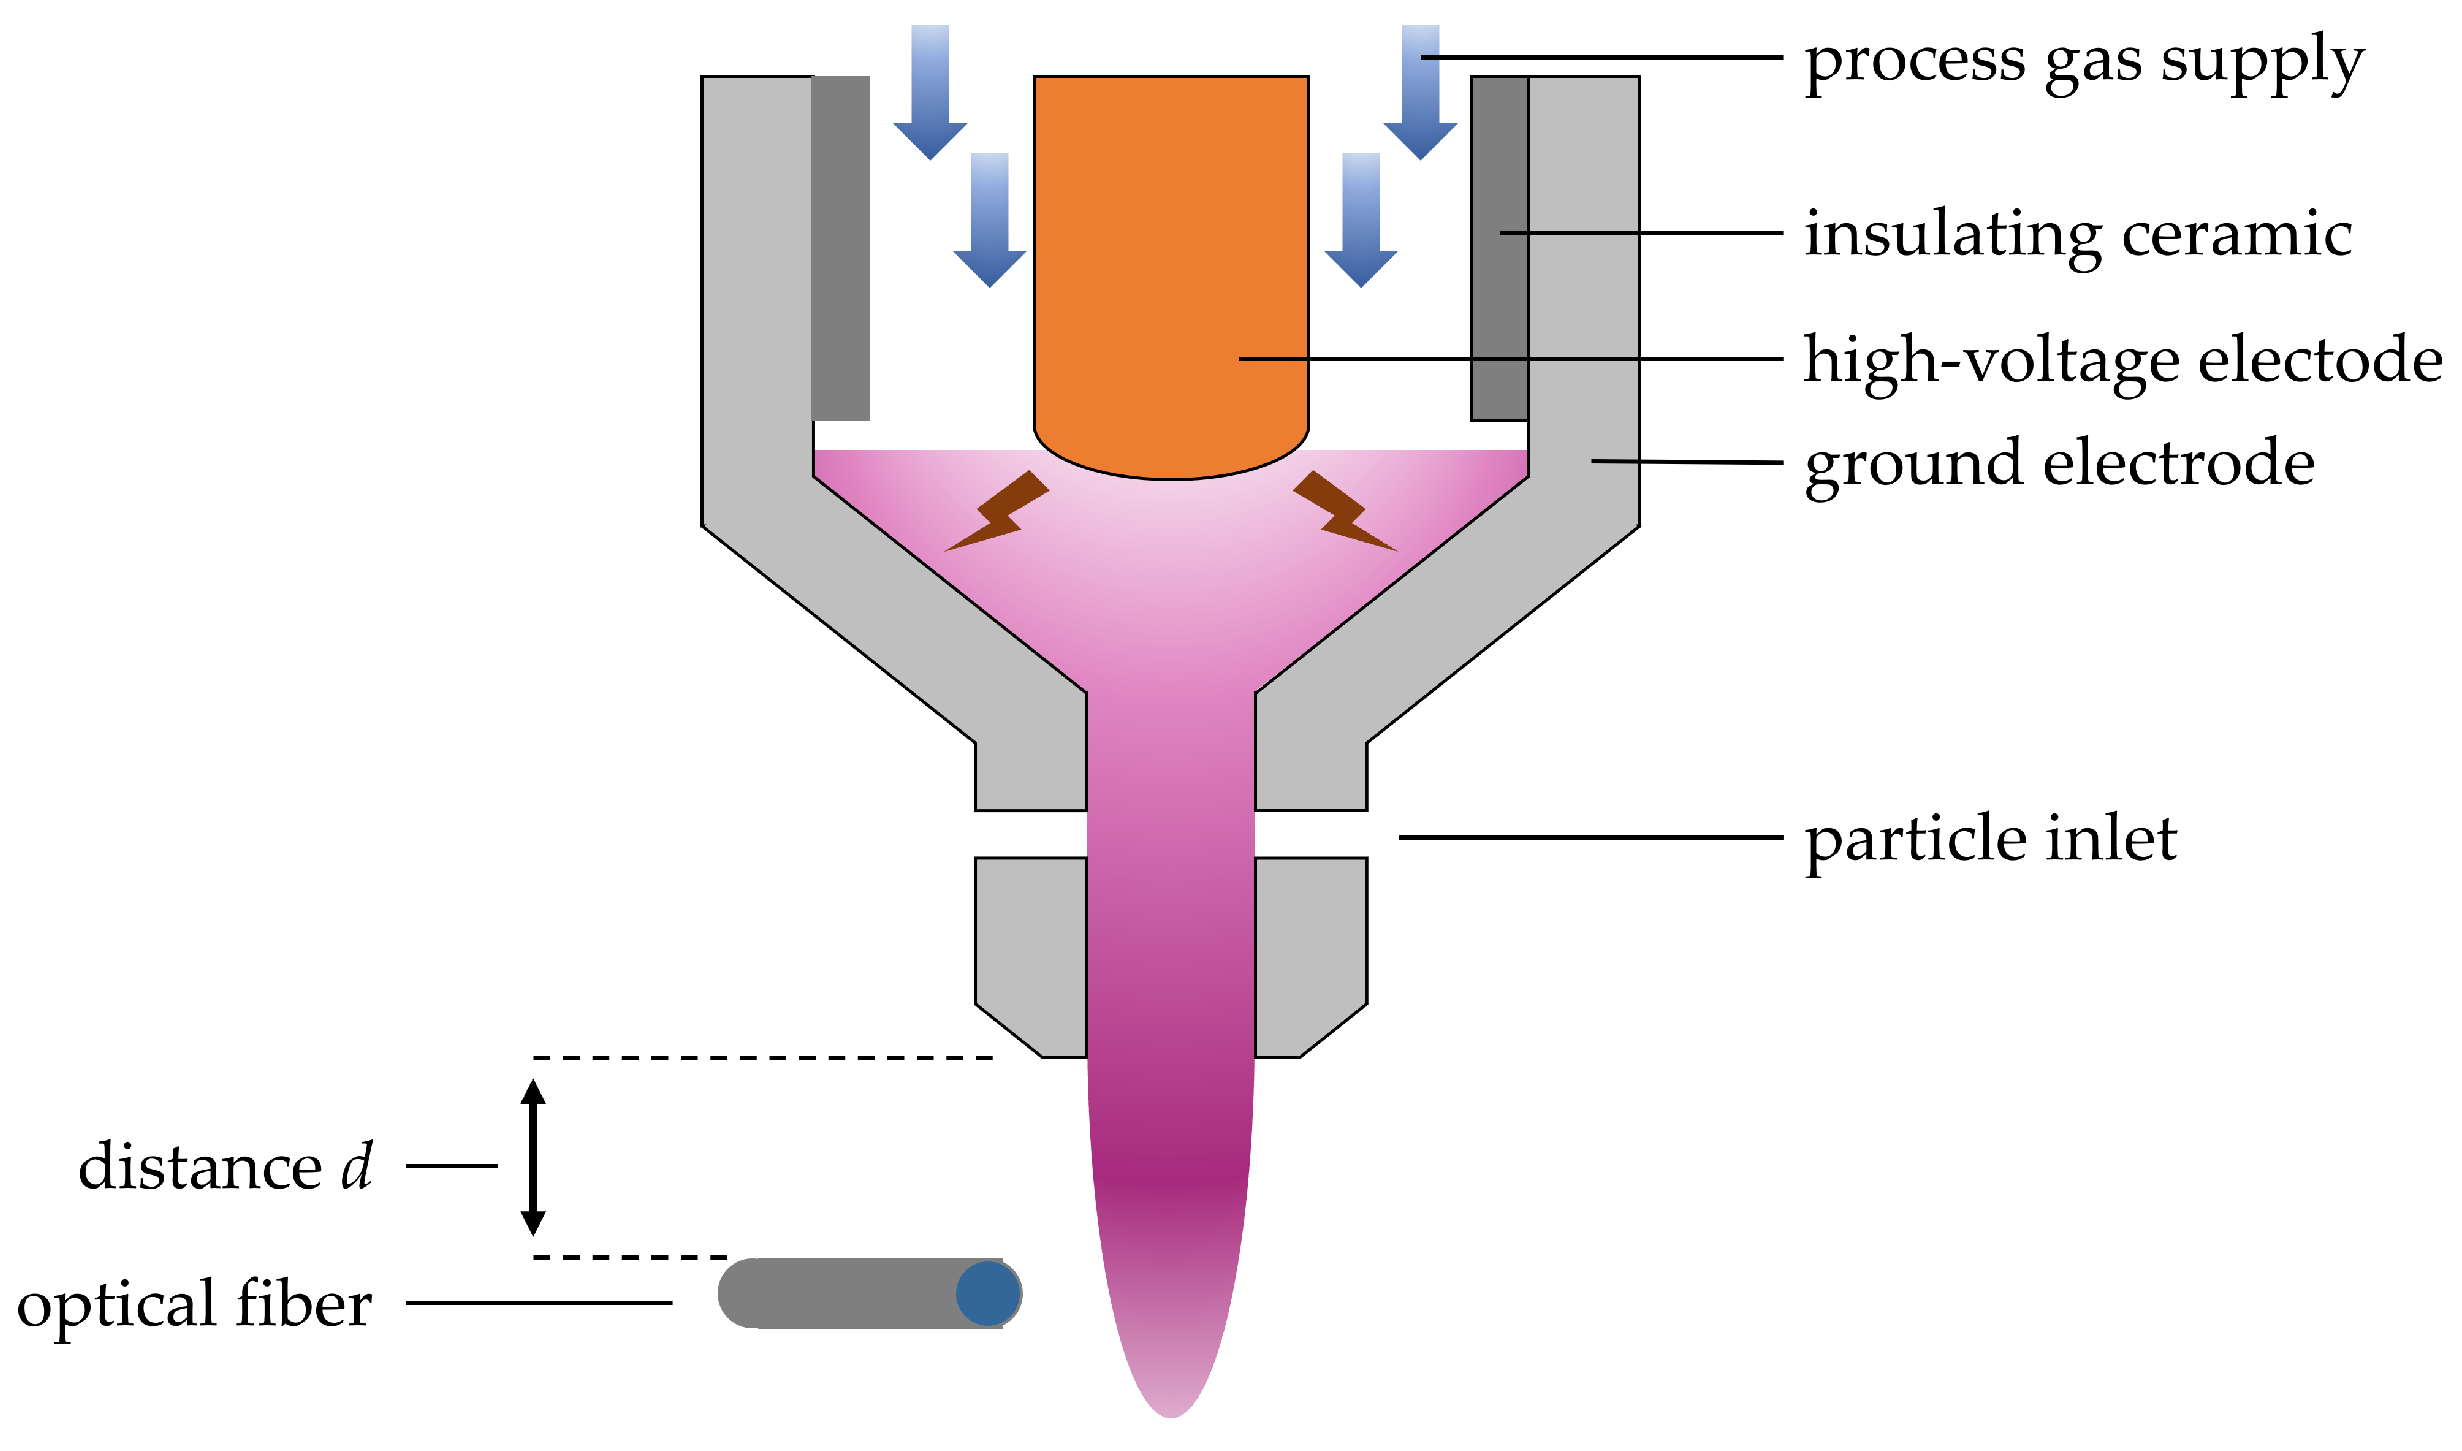
The atmospheric-pressure rotating arc jet (Plasma Plotter 3D, INOCON Technologies GmbH, Austria) consisted of a high voltage power supply and a self-developed spray nozzle as an electrode. The plasma was generated as an arc between the high voltage electrode and the grounded spraying nozzle and was blown out by compressed nitrogen (Linde AG, Pullach, Germany, ≥99.999%) as pictured in
Figure 1. The input power of the APPJ was less than 1 kW, described by pulsed high voltage of 3–4 kV (effective voltage 2–3 kV) with a pulse period of 5–10 μs and a repetition frequency of 50 kHz.
Optical emission spectra were taken using an Echelle spectrometer (Aryelle–Butterfly 400, LTB Lasertechnik Berlin GmbH, Berlin, Germany) with two separate spectral ranges—UV (200–355 nm) and UV-VIS (330–960 nm)—with a resolution of ≤11 and ≤24 pm, respectively, calibrated to wavelength and relative intensity. For spectra recording, a bare optical fiber (0.22 NA) was placed perpendicular to the plasma torch in distances from 2 to 20 mm relative to the outlet nozzle and at a distance of 3 mm from the plasma column. Thermal impact on the fiber was excluded in prior experiments. Due to the low light intensity of the APPJ, no additional optics or masks were used. For each distance, 10 spectra were taken with an integration time of 50 ms for distances of 2–6 mm and 100 ms for distance of 8–14 mm in the UV region; integration times of 10 ms were taken for distances of 2–10 mm and 100 ms for distances of 12–20 mm in the UV-VIS region. All spectra were dark corrected and averaged for each measurement setting before further evaluation.
2.2. Determination of Plasma Temperatures
Nitrogen and nitrogen ion bands are widely used to determine rotational temperature. Most often, the method is a comparison of the
(
) transition at 337.1 nm with the simulated emission spectra. In our case, the band showed spectral overlap with NO
, so it was excluded. The first positive band of
(
) can also be used for determination, but studies indicate low accuracy for high temperatures [
17].
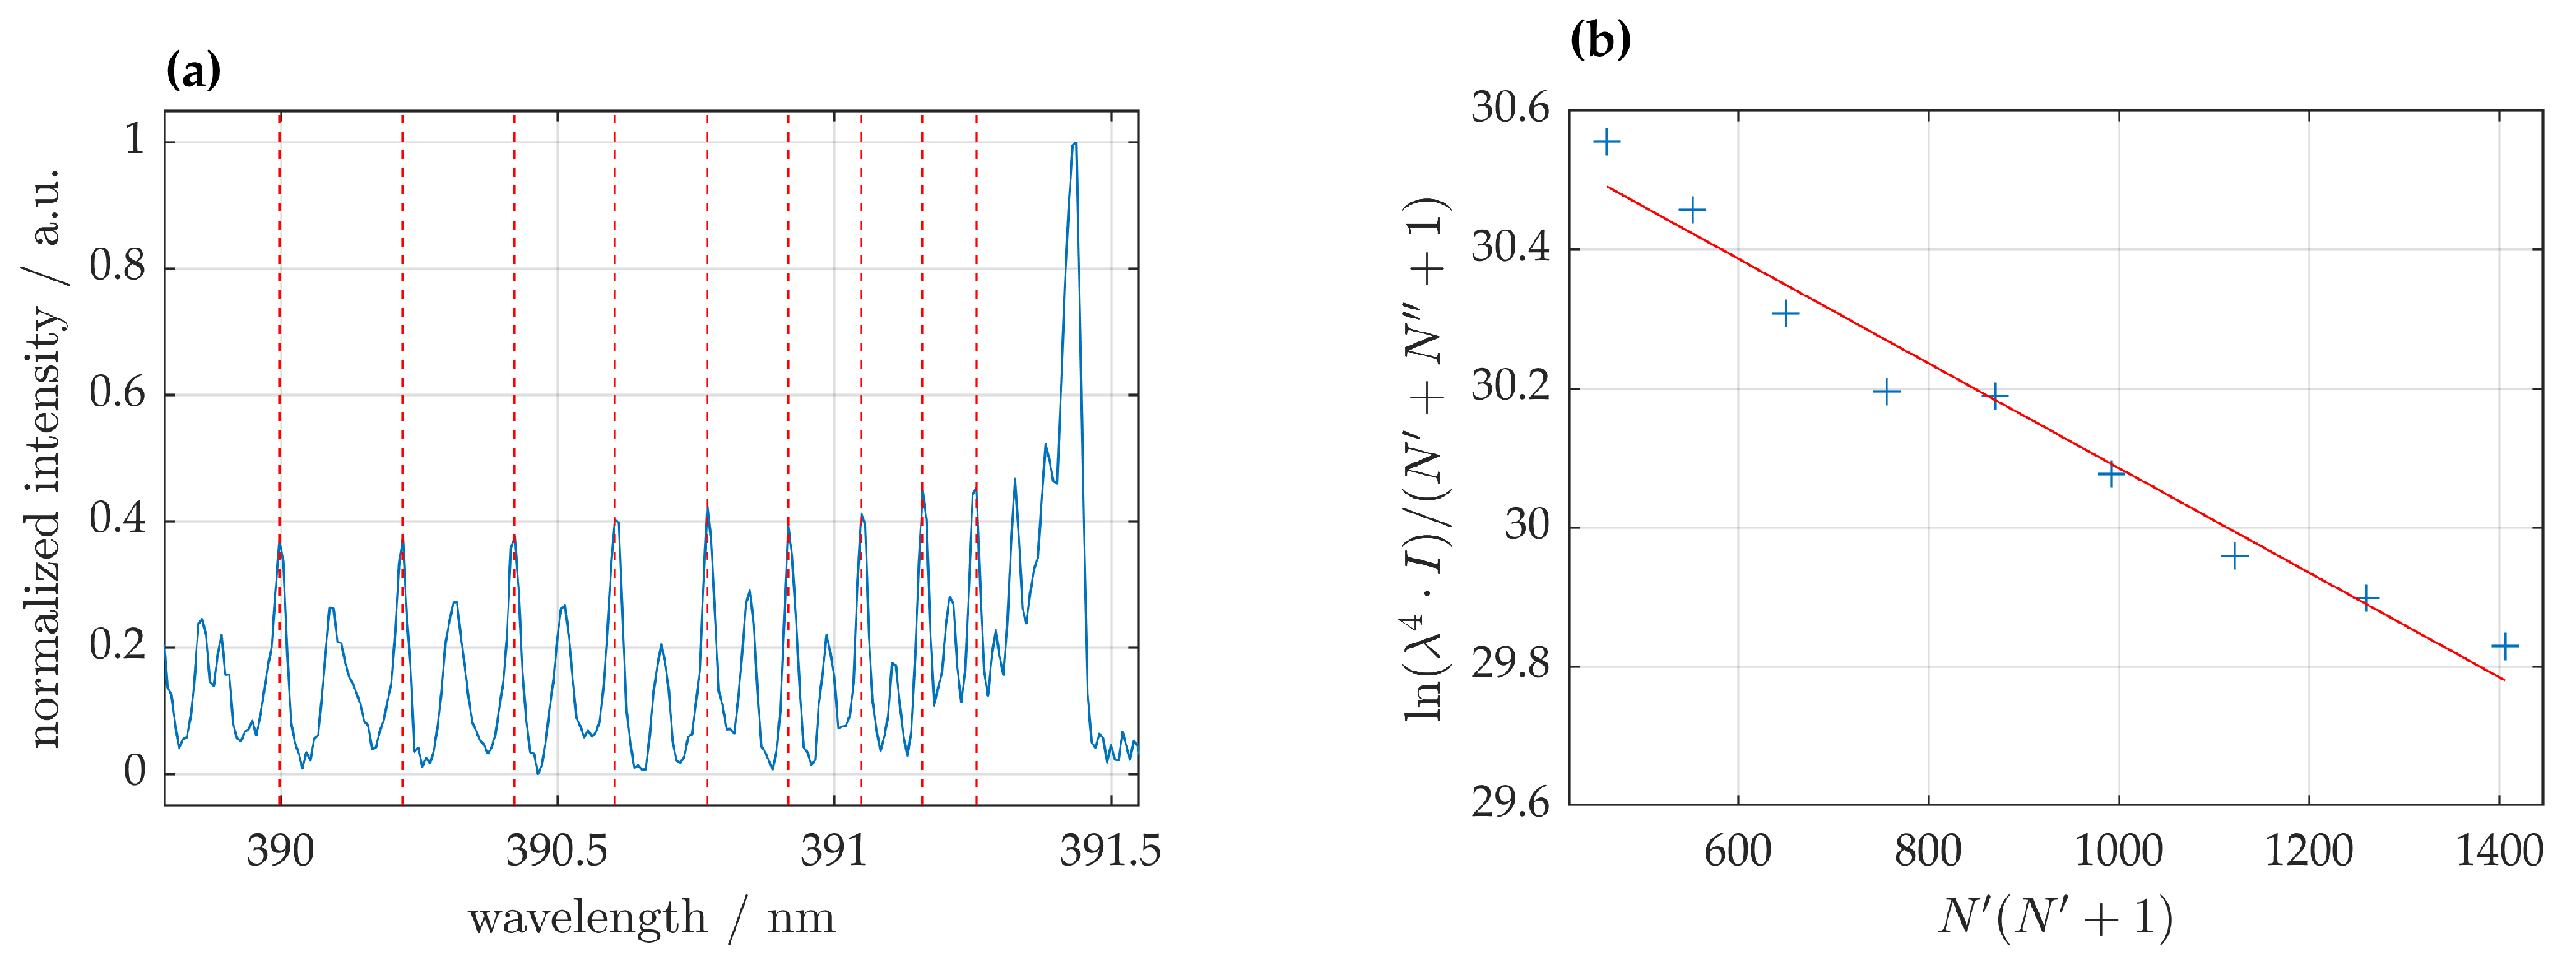
Therefore, the 0-0 band of the
(
) transition at 391.1 nm was chosen to determine rotational temperature as depicted in
Figure 2a. Rotational temperature
was determined from the slope of the Boltzmann plot, depicted in
Figure 2b and given by
with the intensity of the transition
at the specific wavelength
, quantum numbers of the upper state
and
and
h,
c,
being the Planck constant, speed of light and Boltzmann’s constant, respectively. The rotational constant
was calculated according to Equation (
2) with
and
taken from [
22]:
For the analysis, spectral lines of the P-branch were chosen, and these showed no spectral overlap with lines from the R-branch [
17,
23]. Rotational lines were identified using values from the literature and are given in
Table 1 [
24].
A set of atomic nitrogen lines was selected to determine the excitation temperature by the Boltzmann plot method and is given by
where
,
and
are the spectral line intensity, wavelength and transition probability of the selected transition, respectively, and
and
are the statistical weight and the energy of the upper level. The selected spectral lines and necessary parameters taken from [
25], are listed in
Table 2. Uncertainty of
is less than
for all transitions.
2.3. Electron Density
The determination of electron density by Stark broadening is a widely applied method. Often the H
line is used due to its high sensitvity, but it overlaps the
band, which is why in this study the H
line was used. Electron density was calculated by
where the electron density is
in cm
, and the Stark broadening is at its full width at half area
in nm. A deconvolution of the measured line profile and the determination of
was performed as described in [
26,
27,
28]. In this experiment, nitrogen with the addition of 1% hydrogen (Linde AG, Pullach, Germany, ≥99.999%) was used as a working gas, and measurements were taken at a distance of 2 mm from the nozzle.
3. Results
Besides emission from the OH, and molecular bands and from atomic nitrogen and atomic oxygen in the spectra, traces of iron and tungsten were identified. While the metallic species are due to erosion of the electrode, the other species originated from the feed gas and the surrounding air.
For both spectral ranges, the emission intensity decreased exponentially. To compare results from both spectral ranges, all spectra were normalized to the intensity of at 337.1 nm, which was observed in both.
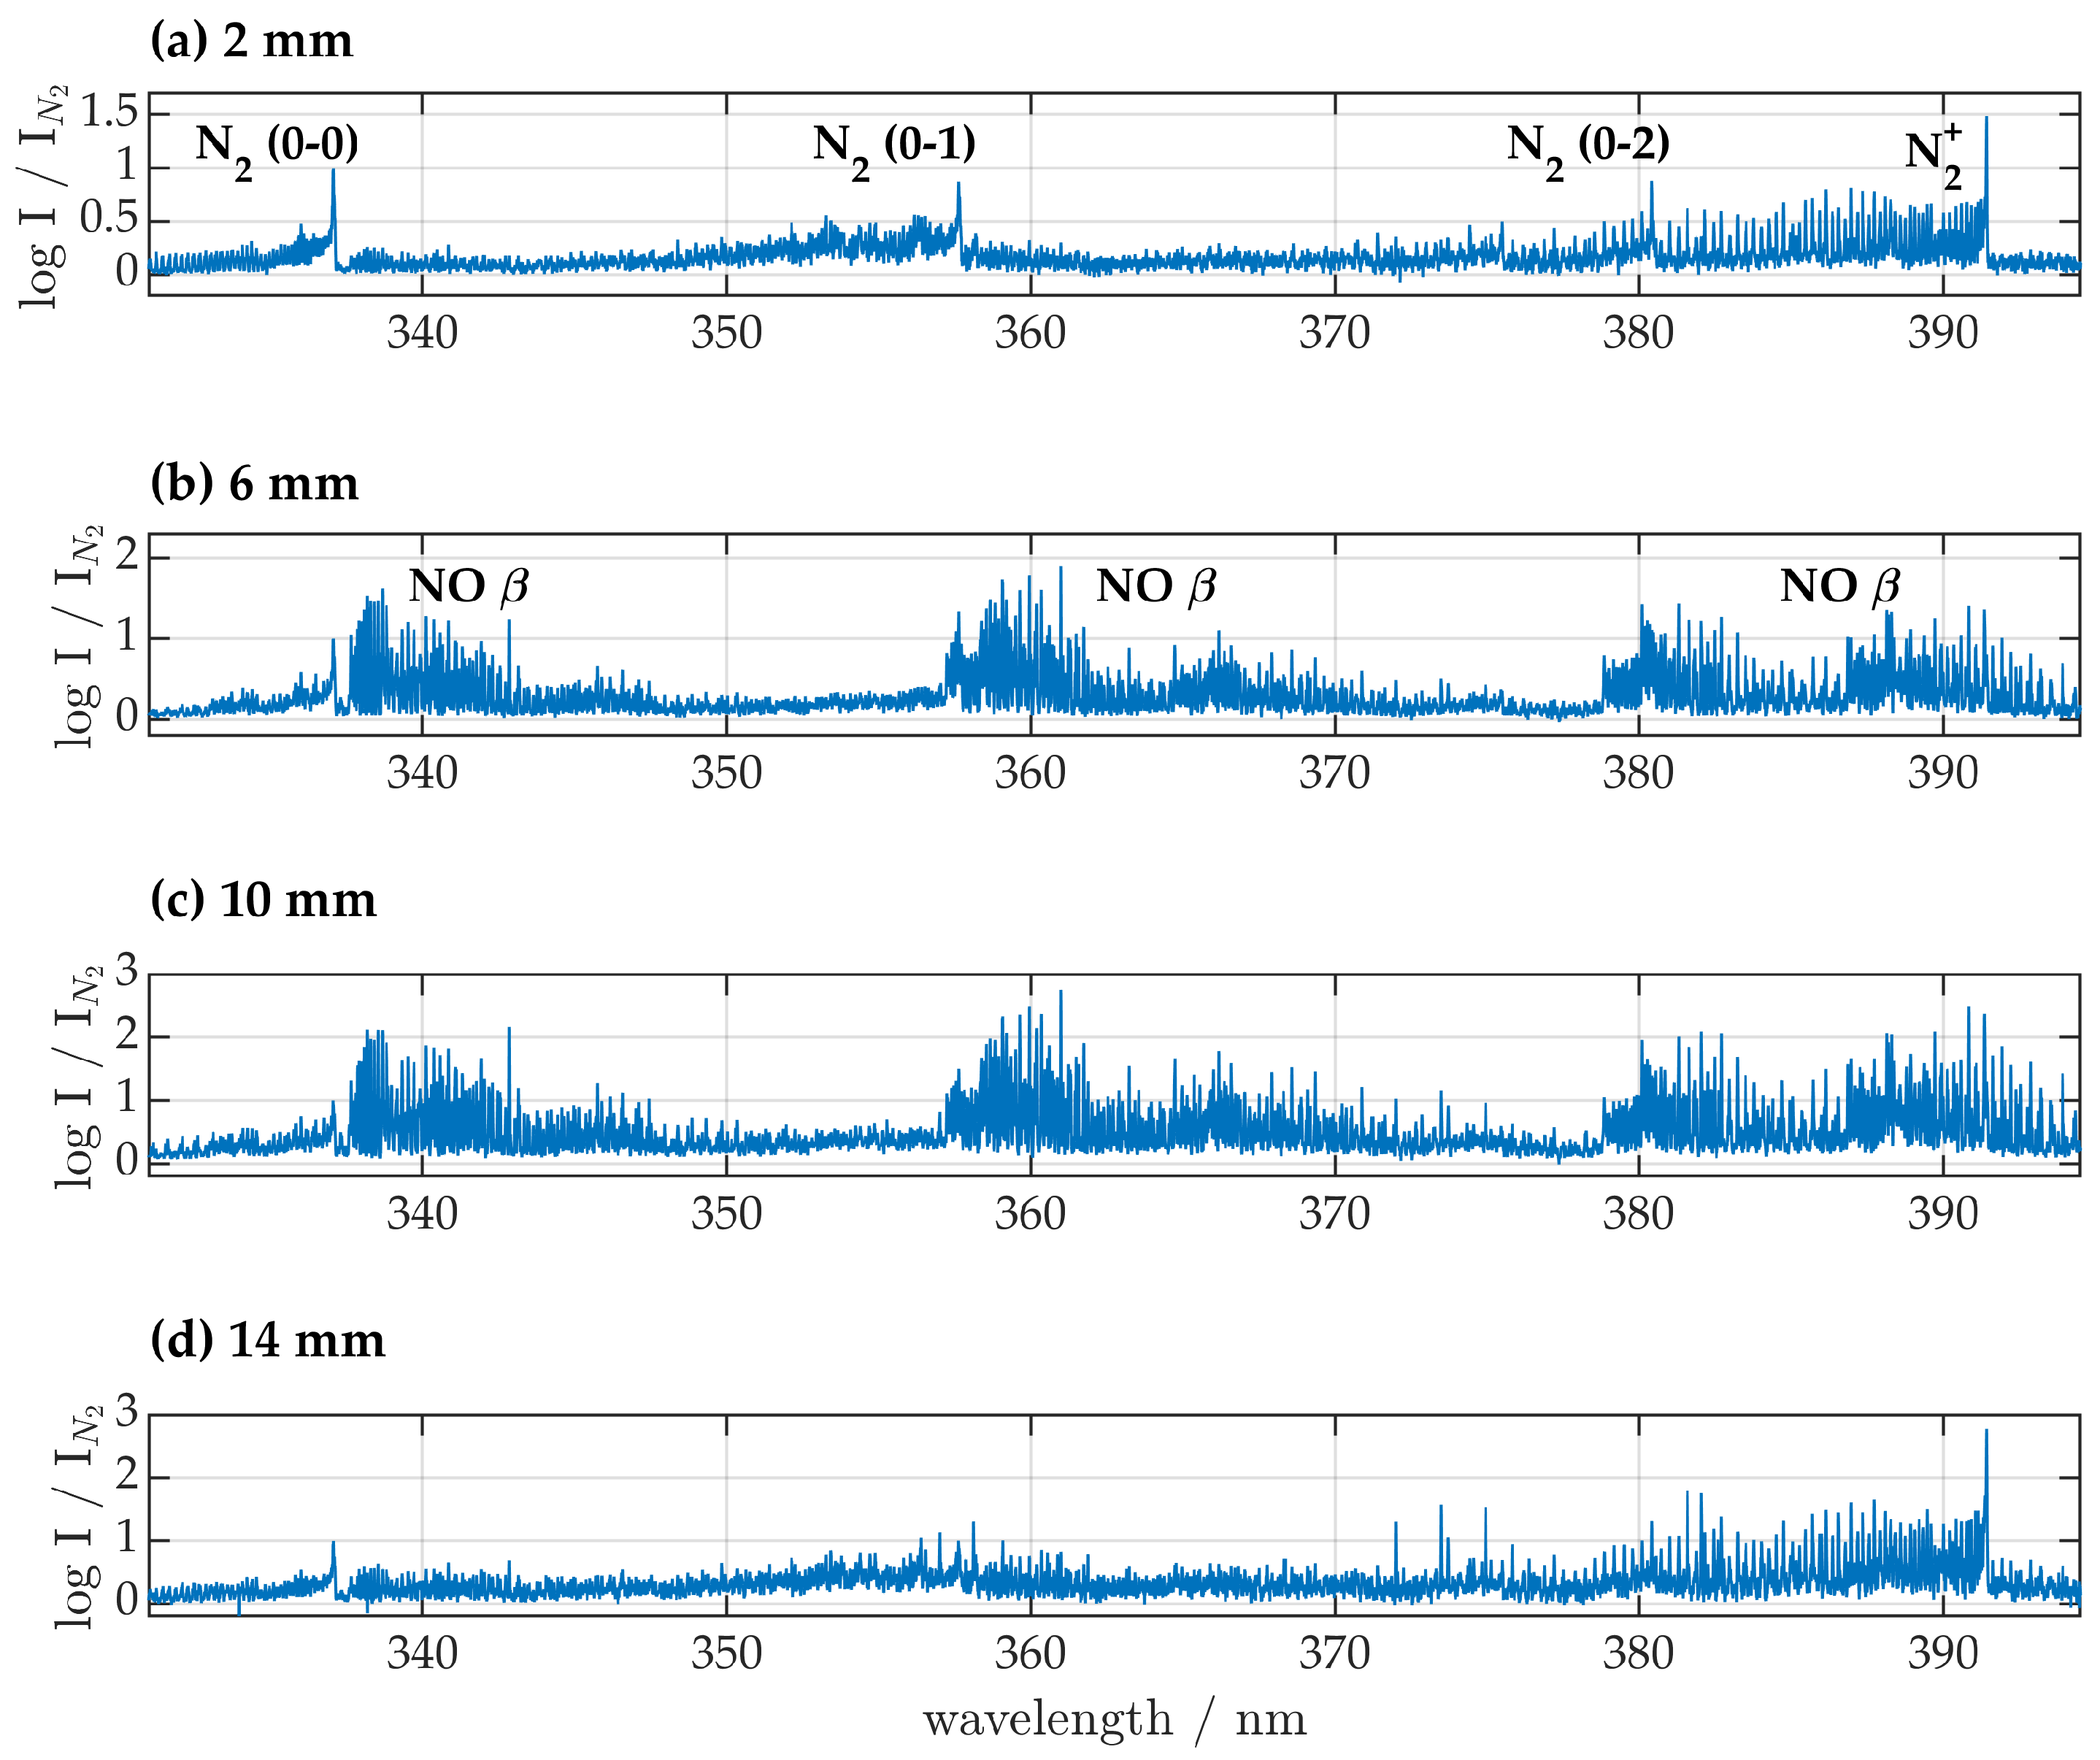
Close to the nozzle in the UV-region from 200 to 355 nm the second positive system (SPS) of molecular
(
) was the dominant species, and OH
, NO
and NO
were present. With increasing distance to the nozzle
emission intensity decreased while NO and OH intensities increased with a maximum intensity relative to
at a distance of 10 mm from the nozzle as depicted in
Figure 3 and
Figure 4.
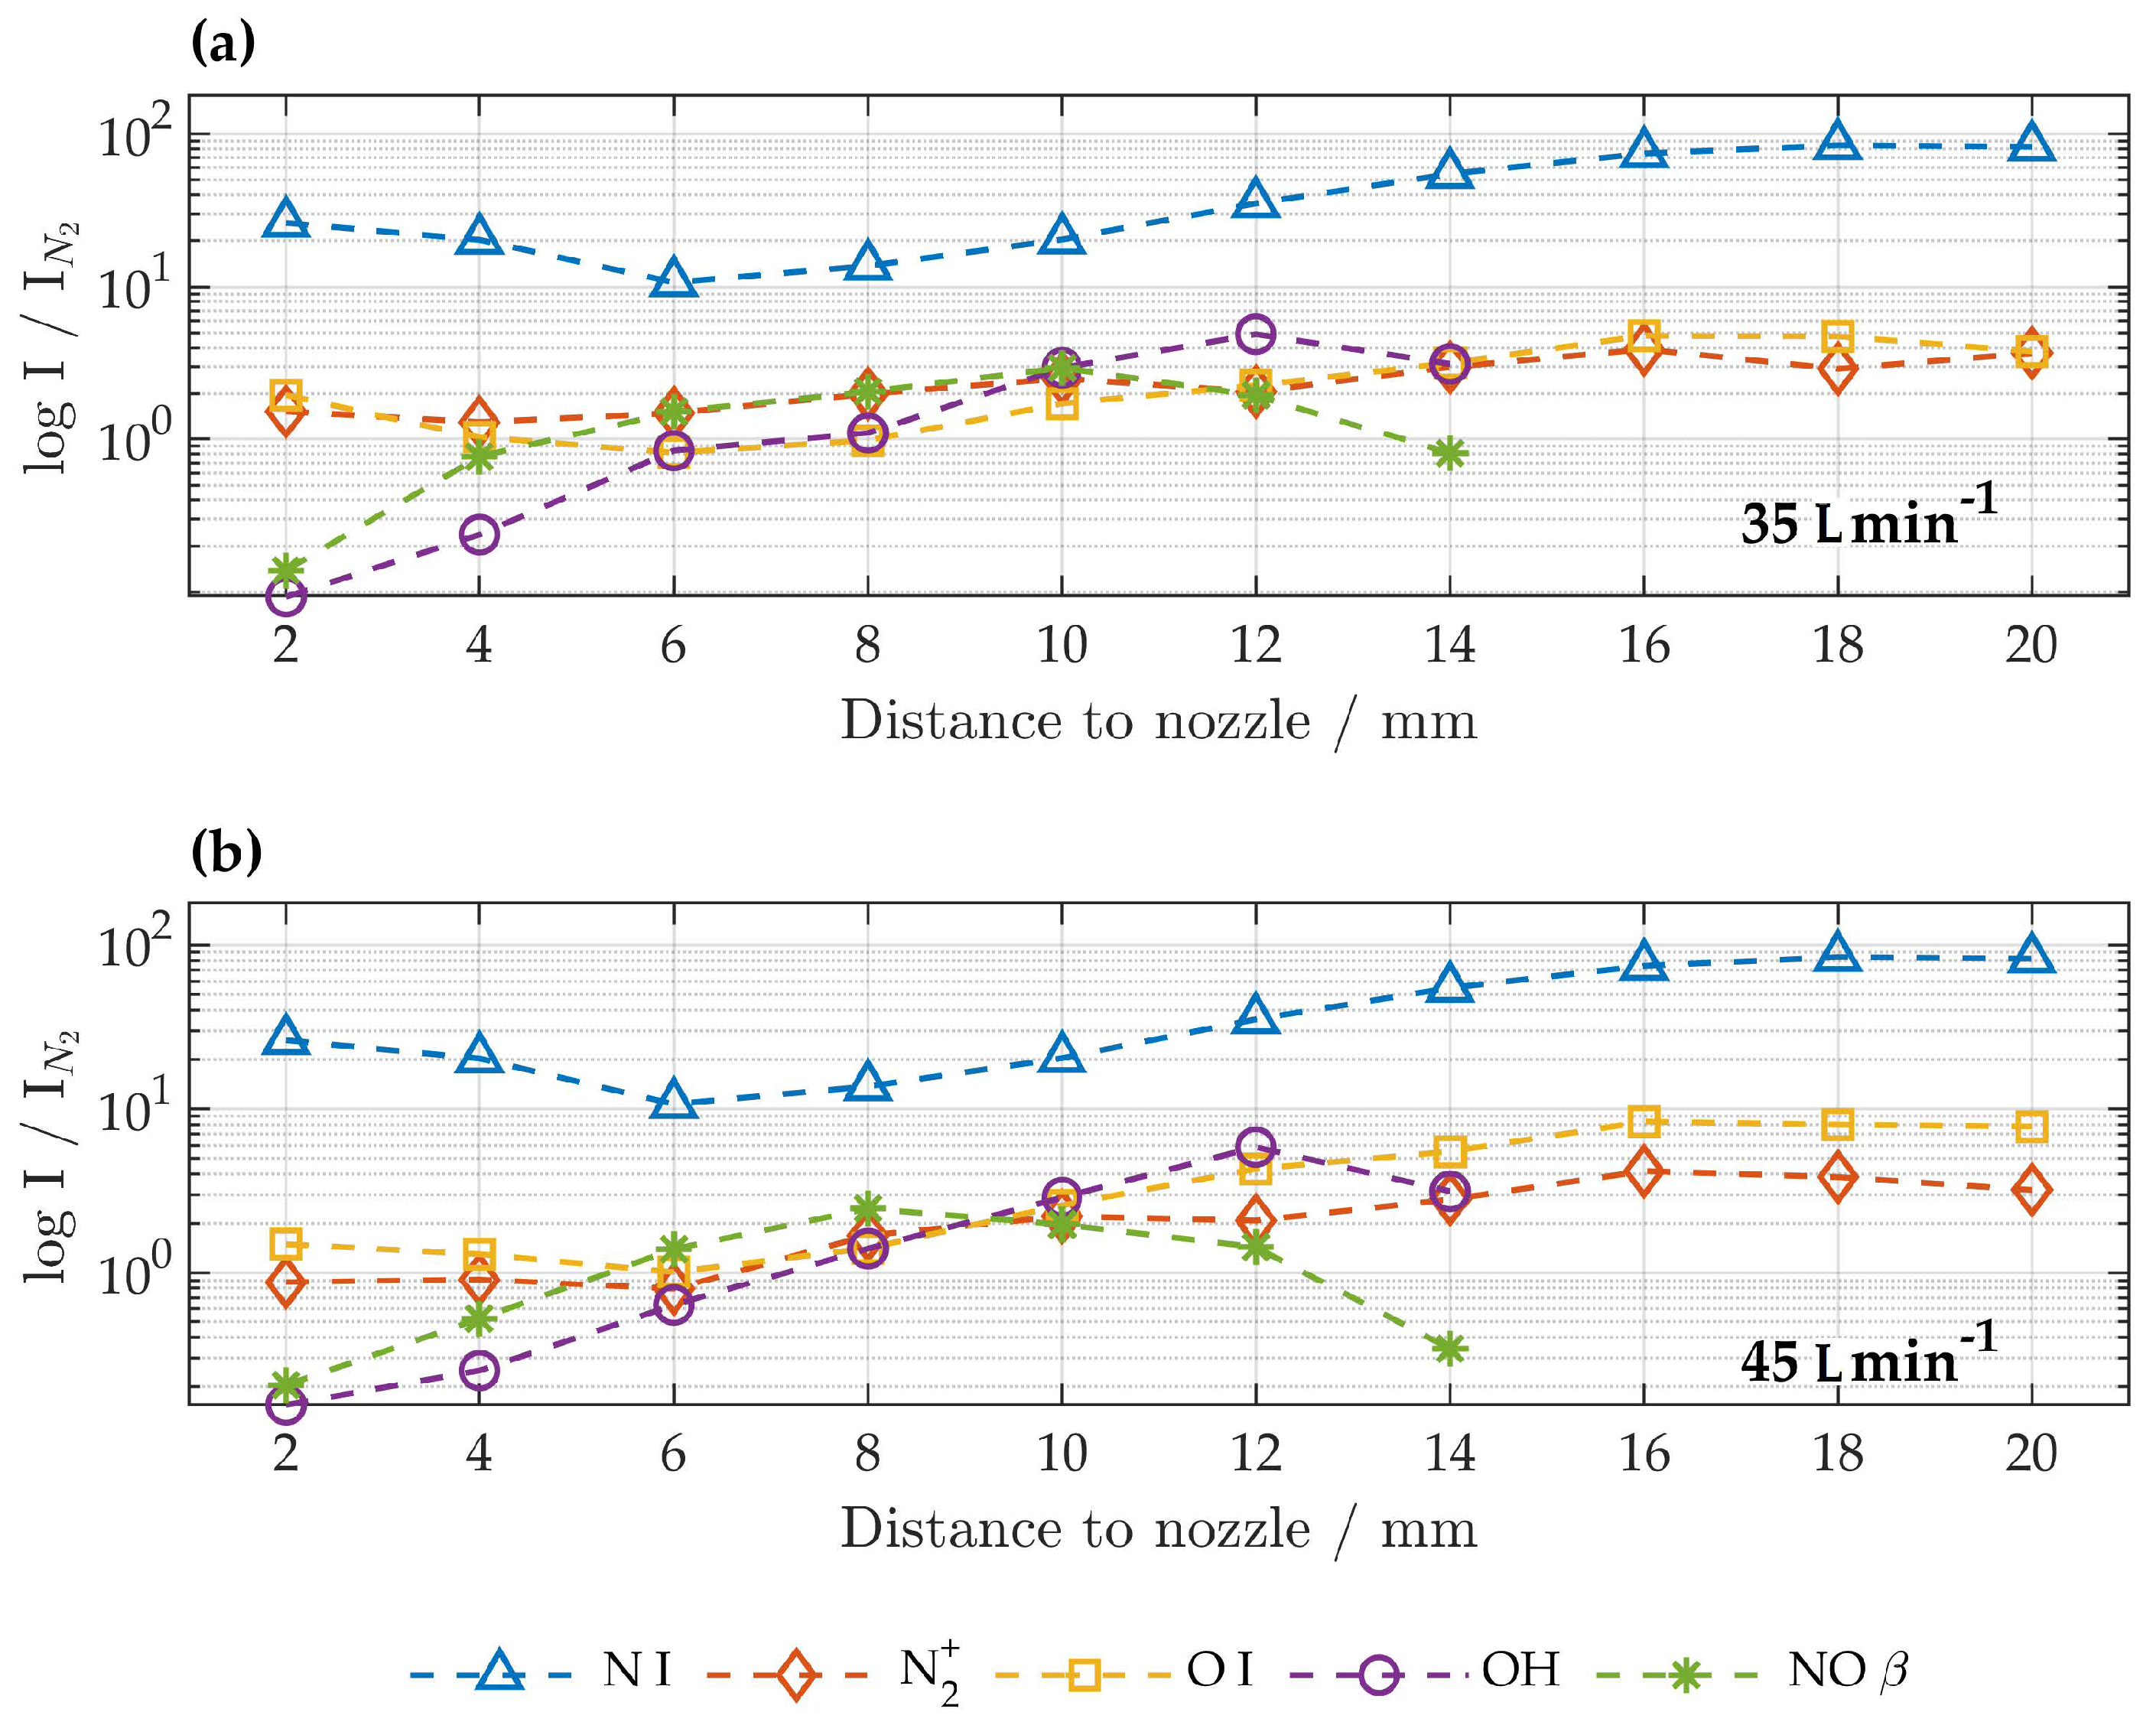
In the UV-VIS region from 330 to 960 nm different nitrogen species were present. The first negative system (FNS) of () was clearly visible and of higher intensity than the transition. For distances of 2 and 14 mm the 0-0 transition of the FNS showed no spectral overlap with other species and was thus suitable for rotational temperature determination.
The first positive system of () led to characteristic spectral features for wavelengths above 500 nm. Intensities of atomic nitrogen species were very high for all distances. Atomic oxygen () at 777 nm was clearly visible, but no other oxygen transitions were detected. With increasing distance to the nozzle an increase in FNS, FPS, atomic nitrogen and atomic oxygen relative to SPS was detected. No significant differences were found for gas flows of 35 and 45 .
3.1. Rotational and Excitation Temperatures
Rotational and excitation temperatures were determined according to Equations (
1) and (
3) for all spectra. The error was determined by propagation of the slope error. Only results with an correlation coefficient >0.98 and errors below
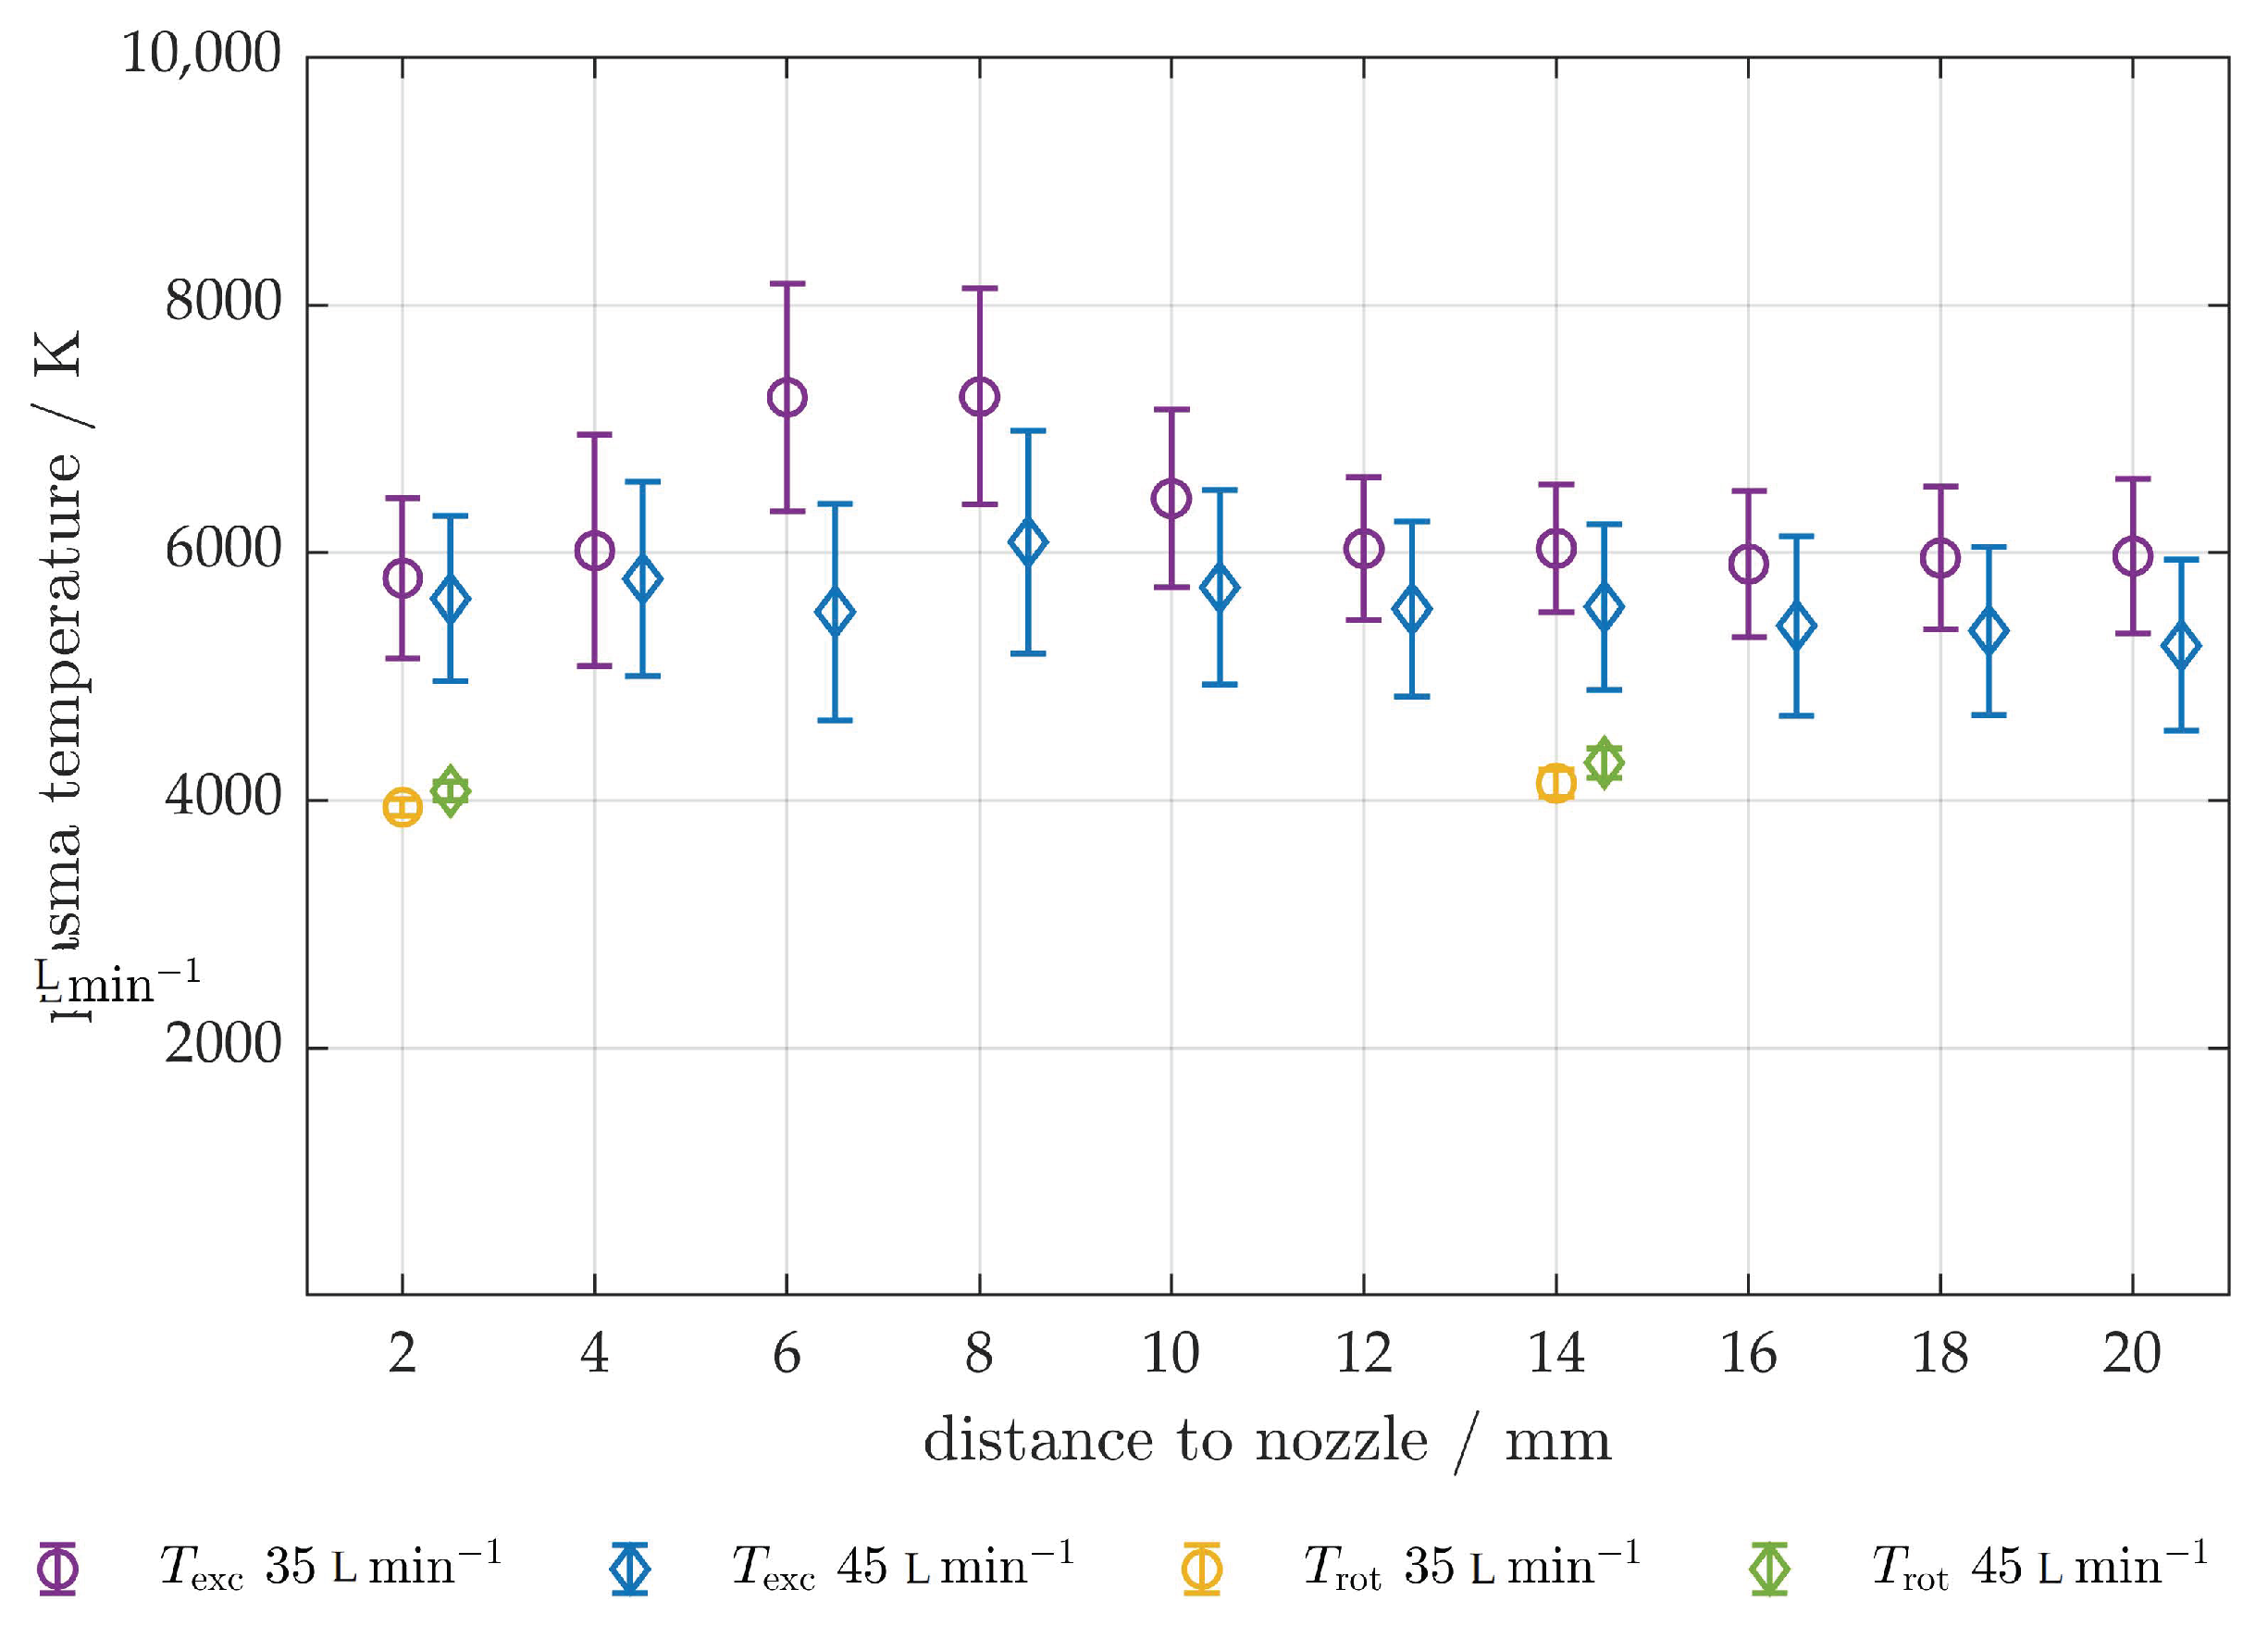
were considered for further evaluation and are presented in
Figure 5.
Rotational temperatures could only be determined for distances of 2 and 14 mm from the nozzle; for all other distances the correlation coefficient was <0.98 due to spectral overlap with other species. For a gas flow of 35 rotational temperatures were found to be K at a distance of 2 mm and K at 14 mm. Rotational temperatures for 451 were slightly higher with K at a distance of 2 mm and K at 14 mm.
Excitation temperatures show a mean value of 6247 K for lower 5575 K for higher gas flow. Comparison of the determined values shows no influence on the distance to the nozzle or on different feed gas flows of 35 and 45 .
3.2. Electron Density
Electron densities were determined assuming that the
rotational temperature corresponded to the gas temperature. No influence of self-absorption was detected in the spectra under experimental conditions. Determined values were below the recommended limits for Equation (
4) of
for both gas flows [
27,
29].
4. Discussion
For the APPJ under investigation, no difference in emitted species and plasma parameters were found for different gas flows of 35
and 45
. Similar results are in the literature, where properties of APPJ are independent of gas flow rates over a wide range [
10,
17].
As depicted in
Figure 5, excitation temperatures are about 1.5 times higher than rotational temperatures; hence, it can be assumed that the APPJ is in a non-equilibrium state. Both the rotational and excitation temperatures of the nitrogen species were found to be high at the nozzle exit and steady with distance, while their intensity and concentration decreased. Although the measurement series was consistent, some uncertainties needed to be addressed. It is known, that
molecules are not only populated by direct excitation from the ground state but are also by highly vibrationally excited
molecules through resonant energy transfer [
30]. These “hot” molecules cannot be detected by simple Boltzmann plots; therefore, results should be confirmed by rotational temperature determination of further bands or systems or by the application of other methods.
For most plasma jets, gas temperatures were reported to decrease with increasing axial distance. This behaviour was due to convective cooling and the entrainment of ambient air as shown by Hsu et al., who studied the effect of ambient air on the gas temperature of a nitrogen APPJ using a glass tube for shielding and thermocouples for measuring [
11]. Xiao et al. reported on a nitrogen APPJ, where excitation and rotational temperatures measured by OES were not dependent on distance [
10]. For long axial distances the approximation of the rotational temperature equalling the gas temperature seemed not to be valid. While for long distances, the gas temperature was mainly governed by cold neutral temperatures from the ambient air, which still had a fair amount of reactive plasma species, such as
and atomic nitrogen with high rotational and excitation temperatures.
Former measurements on APPJs for cold plasma spray using thermocouples showed low gas temperatures of ≤400 K at a working distance of 20 mm from the nozzle exit [
5,
7]. While differences between gas and rotational temperatures were one explanation, it should be noted that in our experiment no particles for deposition were added to the jet, and studies showed a great influence of substrates on gas-phase chemistry [
13]. As the validity range for electron-density determination was exceeded, it can only be stated that the electron density was lower than the limit of
although this is in agreement with the literature for atmospheric-pressure non-thermal nitrogen jets [
31].
5. Conclusions
In this study, a gliding arc atmospheric pressure plasma jet for thin-film deposition by cold plasma spray was examined using optical emission spectroscopy. Both the excitation and rotational temperatures seemed to be independent of distance. If previous studies were taken into account, where a similar gliding arc APPJ showed low particle temperatures and no thermal impact on the substrate, the rotational temperatures seemed to be high with values of and for the different gas flows. It was assumed that the addition of particles may have had a cooling effect. Therefore the impact of the addition of metal particles shall be addressed in further investigations. In addition, numerical gas-flow simulations will be carried out, to take into account the special geometry of the nozzle and the current data on excited species and plasma temperatures.
Author Contributions
Conceptualization, J.M.; methodology, J.M.; validation, all authors; formal analysis, J.M.; investigation, J.M.; resources, W.V.; data curation, J.M.; writing—original draft preparation, J.M.; writing—review and editing, all authors; visualization, J.M.; supervision, J.M. and W.V.; project administration, J.M.; funding acquisition, W.V. All authors have read and agreed to the published version of the manuscript.
Funding
This research was funded by the German Federal Ministry of Education and Research (13FH6E01IA).
Institutional Review Board Statement
Not applicable.
Informed Consent Statement
Not applicable.
Data Availability Statement
The data presented in this study are available on request from the corresponding author. The data are not publicly available due to being used in a Ph.D. thesis in preparation.
Acknowledgments
The authors thank the German Research Foundation (Deutsche Forschungsgemeinschaft, DFG) for funding the plasma spray system (INST 196/11-1 FUGG). We thank Roman Rerich for his support with the measurements.
Conflicts of Interest
The authors declare no conflict of interest.
References
- Tejero-Martin, D.; Rezvani Rad, M.; McDonald, A.; Hussain, T. Beyond Traditional Coatings: A Review on Thermal-Sprayed Functional and Smart Coatings. J. Therm. Spray Technol. 2019, 28, 598–644. [Google Scholar] [CrossRef] [Green Version]
- Uricchio, A.; Fanelli, F. Low-Temperature Atmospheric Pressure Plasma Processes for the Deposition of Nanocomposite Coatings. Processes 2021, 9, 2069. [Google Scholar] [CrossRef]
- Köhler, R.; Sauerbier, P.; Ohms, G.; Viöl, W.; Militz, H. Wood Protection through Plasma Powder Deposition—An Alternative Coating Process. Forests 2019, 10, 898. [Google Scholar] [CrossRef] [Green Version]
- Wallenhorst, L.; Gurău, L.; Gellerich, A.; Militz, H.; Ohms, G.; Viöl, W. UV-blocking properties of Zn/ZnO coatings on wood deposited by cold plasma spraying at atmospheric pressure. Appl. Surf. Sci. 2018, 434, 1183–1192. [Google Scholar] [CrossRef]
- Köhler, R.; Sauerbier, P.; Militz, H.; Viöl, W. Atmospheric Pressure Plasma Coating of Wood and MDF with Polyester Powder. Coatings 2017, 7, 171. [Google Scholar] [CrossRef] [Green Version]
- Wallenhorst, L.M.; Loewenthal, L.; Avramidis, G.; Gerhard, C.; Militz, H.; Ohms, G.; Viöl, W. Topographic, optical and chemical properties of zinc particle coatings deposited by means of atmospheric pressure plasma. Appl. Surf. Sci. 2017, 410, 485–493. [Google Scholar] [CrossRef]
- Gascón-Garrido, P.; Mainusch, N.; Militz, H.; Viöl, W.; Mai, C. Copper and aluminium deposition by cold-plasma spray on wood surfaces: Effects on natural weathering behaviour. Eur. J. Wood Wood Prod. 2017, 75, 315–324. [Google Scholar] [CrossRef]
- Czernichowski, A.; Nassar, H.; Ranaivosoloarimanana, A.; Fridman, A.A.; Simek, M.; Musiol, K.; Pawelec, E.; Dittrichova, L. Spectral and Electrical Diagnostics of Gliding Arc. Acta Phys. Pol. A 1996, 89, 595–603. [Google Scholar] [CrossRef]
- Zaplotnik, R.; Primc, G.; Vesel, A. Optical Emission Spectroscopy as a Diagnostic Tool for Characterization of Atmospheric Plasma Jets. Appl. Sci. 2021, 11, 2275. [Google Scholar] [CrossRef]
- Xiao, D.; Cheng, C.; Shen, J.; Lan, Y.; Xie, H.; Shu, X.; Meng, Y.; Li, J.; Chu, P.K. Characteristics of atmospheric-pressure non-thermal N2 and N2/O2 gas mixture plasma jet. J. Appl. Phys. 2014, 115, 033303. [Google Scholar] [CrossRef] [Green Version]
- Hsu, Y.w.; Yang, Y.j.; Wu, C.y.; Hsu, C.c. Downstream Characterization of an Atmospheric Pressure Pulsed Arc Jet. Plasma Chem. Plasma Process. 2010, 30, 363–372. [Google Scholar] [CrossRef]
- Förster, S.; Mohr, C.; Viöl, W. Investigations of an atmospheric pressure plasma jet by optical emission spectroscopy. Surf. Coat. Technol. 2005, 200, 827–830. [Google Scholar] [CrossRef]
- Hanna, A.R.; Fisher, E.R. Investigating recent developments and applications of optical plasma spectroscopy: A review. J. Vac. Sci. Technol. Vacuum Surf. Film. 2020, 38, 020806. [Google Scholar] [CrossRef]
- Park, J.H.; Cho, J.H.; Yoon, J.S.; Song, J.H. Machine Learning Prediction of Electron Density and Temperature from Optical Emission Spectroscopy in Nitrogen Plasma. Coatings 2021, 11, 1221. [Google Scholar] [CrossRef]
- Kwon, H.; Hong, S.J. Use of Optical Emission Spectroscopy Data for Fault Detection of Mass Flow Controller in Plasma Etch Equipment. Electronics 2022, 11, 253. [Google Scholar] [CrossRef]
- Bruggeman, P.; Sadeghi, N.; Schram, D.C.; Linss, V. Gas temperature determination from rotational lines in non-equilibrium plasmas: A review. Plasma Sources Sci. Technol. 2014, 23, 023001. [Google Scholar] [CrossRef] [Green Version]
- Chen, C.J.; Li, S.Z. Spectroscopic measurement of plasma gas temperature of the atmospheric-pressure microwave induced nitrogen plasma torch. Plasma Sources Sci. Technol. 2015, 24, 035017. [Google Scholar] [CrossRef]
- Gröger, S.; Ramakers, M.; Hamme, M.; Medrano, J.A.; Bibinov, N.; Gallucci, F.; Bogaerts, A.; Awakowicz, P. Characterization of a nitrogen gliding arc plasmatron using optical emission spectroscopy and high-speed camera. J. Phys. D Appl. Phys. 2018, 52, 065201. [Google Scholar] [CrossRef] [Green Version]
- Peters, F.; Hünnekens, B.; Wieneke, S.; Militz, H.; Ohms, G.; Viöl, W. Comparison of three dielectric barrier discharges regarding their physical characteristics and influence on the adhesion properties on maple, high density fiberboards and wood plastic composite. J. Phys. D Appl. Phys. 2017, 50, 475206. [Google Scholar] [CrossRef] [Green Version]
- Abrar, M.; Qayyum, A.; Gilani, A.R.; Khan, A.W.; Saeed, A.; Naseer, S.; Zakaullah, M. Effect of helium mixing on excitation temperature and nitrogen dissociation in inductively coupled plasma. Curr. Appl. Phys. 2013, 13, 969–974. [Google Scholar] [CrossRef]
- Park, H.; Choe, W. Parametric study on excitation temperature and electron temperature in low pressure plasmas. Curr. Appl. Phys. 2010, 10, 1456–1460. [Google Scholar] [CrossRef]
- Ochkin, V.N. Spectroscopy of Low Temperature Plasma; Wiley-VCH: Weinheim, Germany, 2009. [Google Scholar] [CrossRef]
- Muñoz, J.; Margot, J.; Calzada, M.D. Experimental study of a helium surface-wave discharge at atmospheric pressure. J. Appl. Phys. 2010, 107, 083304. [Google Scholar] [CrossRef]
- Boulos, M.I. Thermal Plasmas: Fundamentals and Applications; Springer: Boston, MA, USA, 1994. [Google Scholar] [CrossRef]
- Kramida, A.; Ralchenko, Y.; Reader, J.; NIST ASD Team. NIST Atomic Spectra Database (Version 5.9); National Institute of Standards and Technology: Gaithersburg, MD, USA, 1999. Available online: https://physics.nist.gov/asd (accessed on 12 May 2022).
- Gigosos, M.A.; González, M.Á.; Cardeñoso, V. Computer simulated Balmer-alpha, -beta and -gamma Stark line profiles for non-equilibrium plasmas diagnostics. Spectrochim. Acta Part B At. Spectrosc. 2003, 58, 1489–1504. [Google Scholar] [CrossRef]
- Nikiforov, A.Y.; Leys, C.; Gonzalez, M.A.; Walsh, J.L. Electron density measurement in atmospheric pressure plasma jets: Stark broadening of hydrogenated and non-hydrogenated lines. Plasma Sources Sci. Technol. 2015, 24, 034001. [Google Scholar] [CrossRef]
- Wang, S.; Liu, F.; Yang, D.-z.; Wang, W.; Fang, Z. Characteristic study of a transient spark driven by a nanosecond pulse power in atmospheric nitrogen using a water cathode. J. Appl. Phys. 2019, 125, 043304. [Google Scholar] [CrossRef]
- Konjević, N.; Ivković, M.; Sakan, N. Hydrogen Balmer lines for low electron number density plasma diagnostics. Spectrochim. Acta Part B At. Spectrosc. 2012, 76, 16–26. [Google Scholar] [CrossRef]
- Linss, V.; Kupfer, H.; Peter, S.; Richter, F. Two () populations with different Boltzmann distribution of the rotational levels found in different types of N2/Ar discharges—Improved estimation of the neutral gas temperature. J. Phys. D Appl. Phys. 2004, 37, 1935–1944. [Google Scholar] [CrossRef]
- Xiao, D.; Cheng, C.; Shen, J.; Lan, Y.; Xie, H.; Shu, X.; Meng, Y.; Li, J.; Chu, P.K. Electron density measurements of atmospheric-pressure non-thermal N2 plasma jet by Stark broadening and irradiance intensity methods. Phys. Plasmas 2014, 21, 053510. [Google Scholar] [CrossRef] [Green Version]
| Publisher’s Note: MDPI stays neutral with regard to jurisdictional claims in published maps and institutional affiliations. |
© 2022 by the authors. Licensee MDPI, Basel, Switzerland. This article is an open access article distributed under the terms and conditions of the Creative Commons Attribution (CC BY) license (https://creativecommons.org/licenses/by/4.0/).


