
Bonding Performance of Steel Rebar Coated with Ultra-High-Performance Concrete


Abstract
:Featured Application
Abstract
1. Introduction
2. Materials and Methods
2.1. Materials
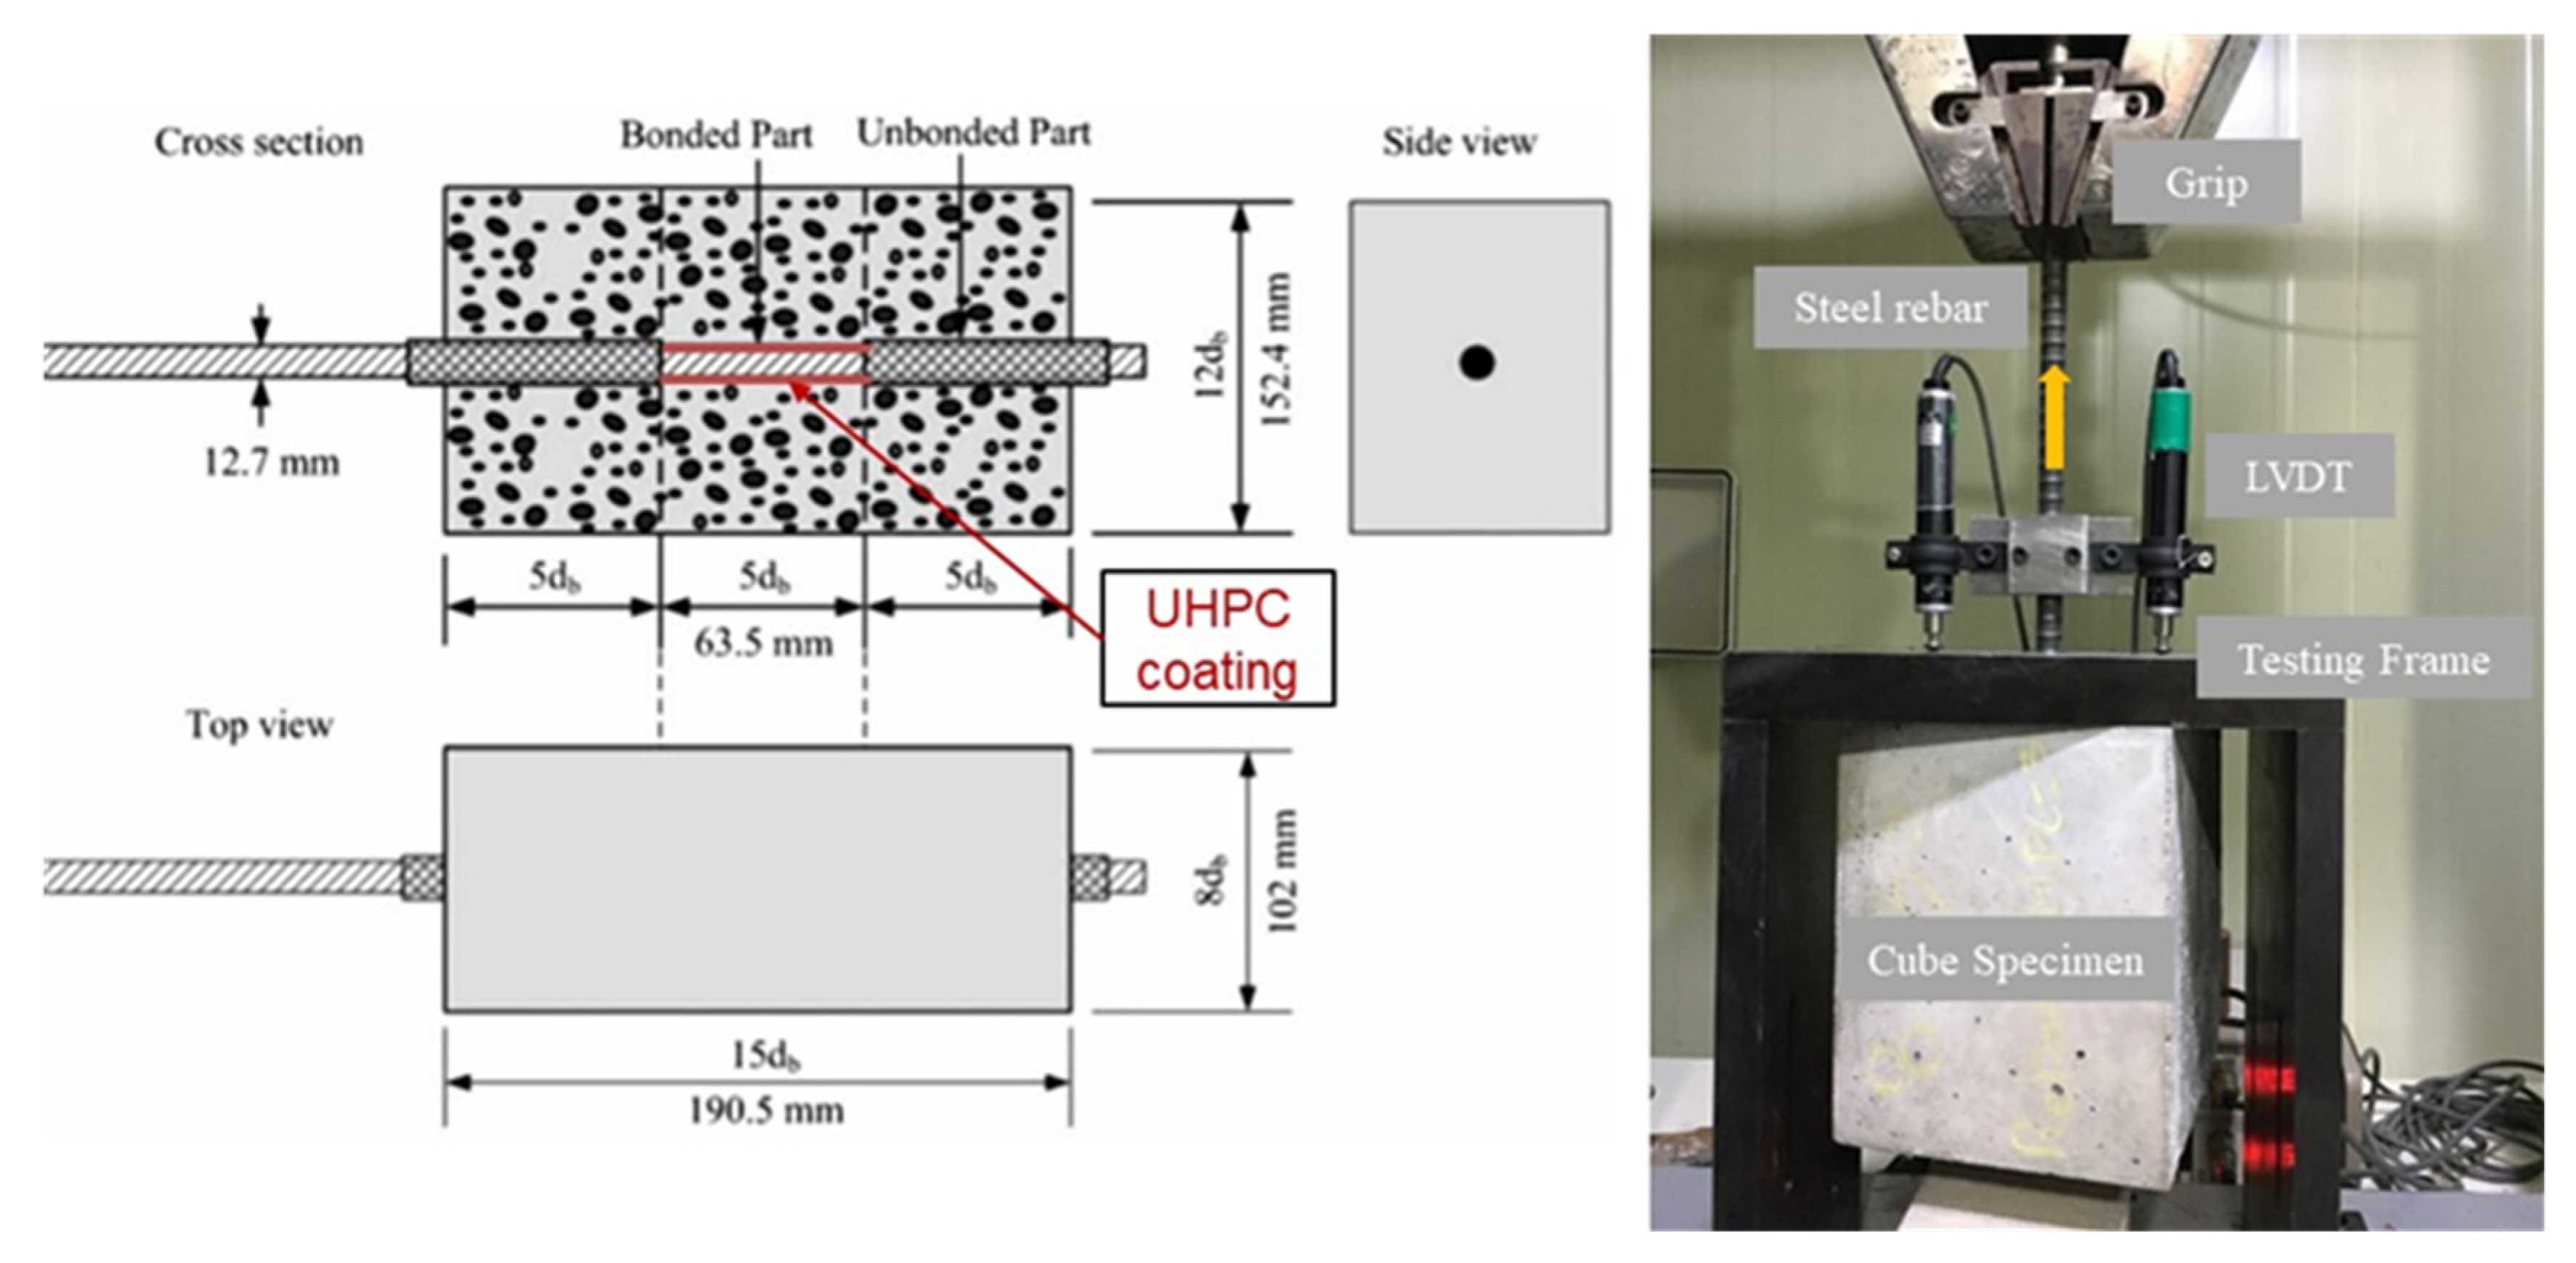
2.2. Specimens for Pullout Test
2.3. Test Setup and Testing Procedure
3. Results and Discussion
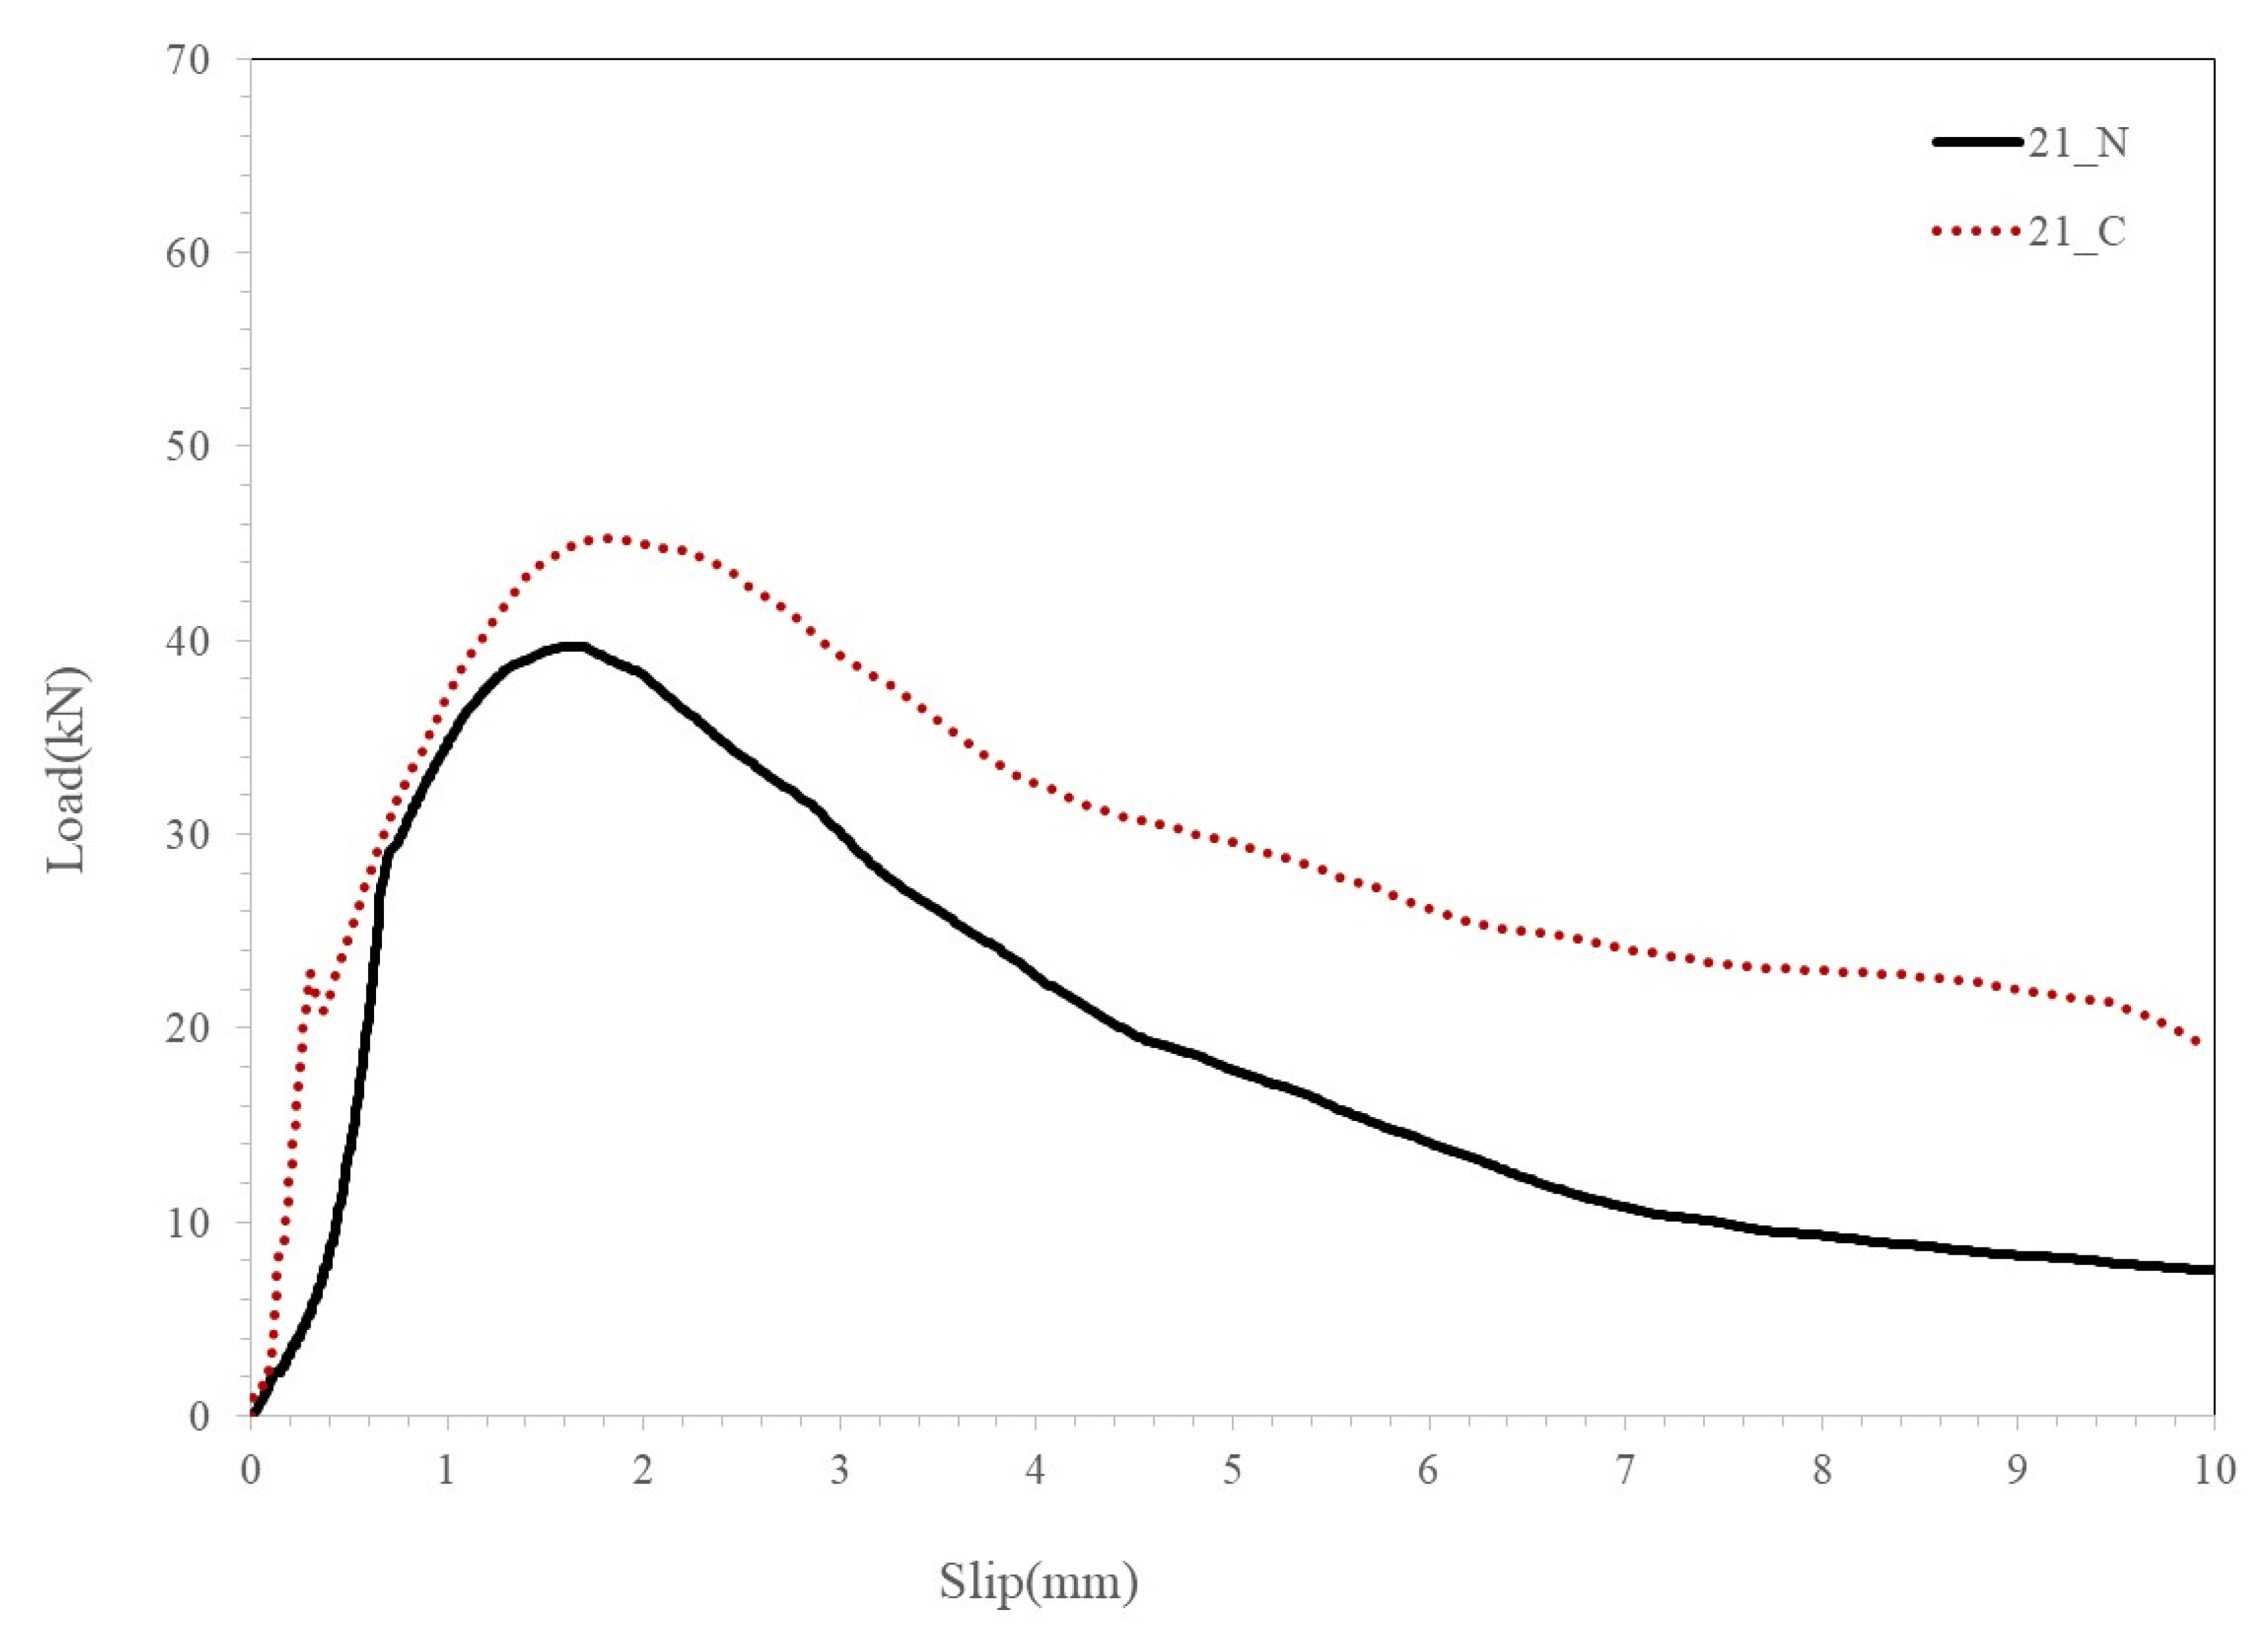
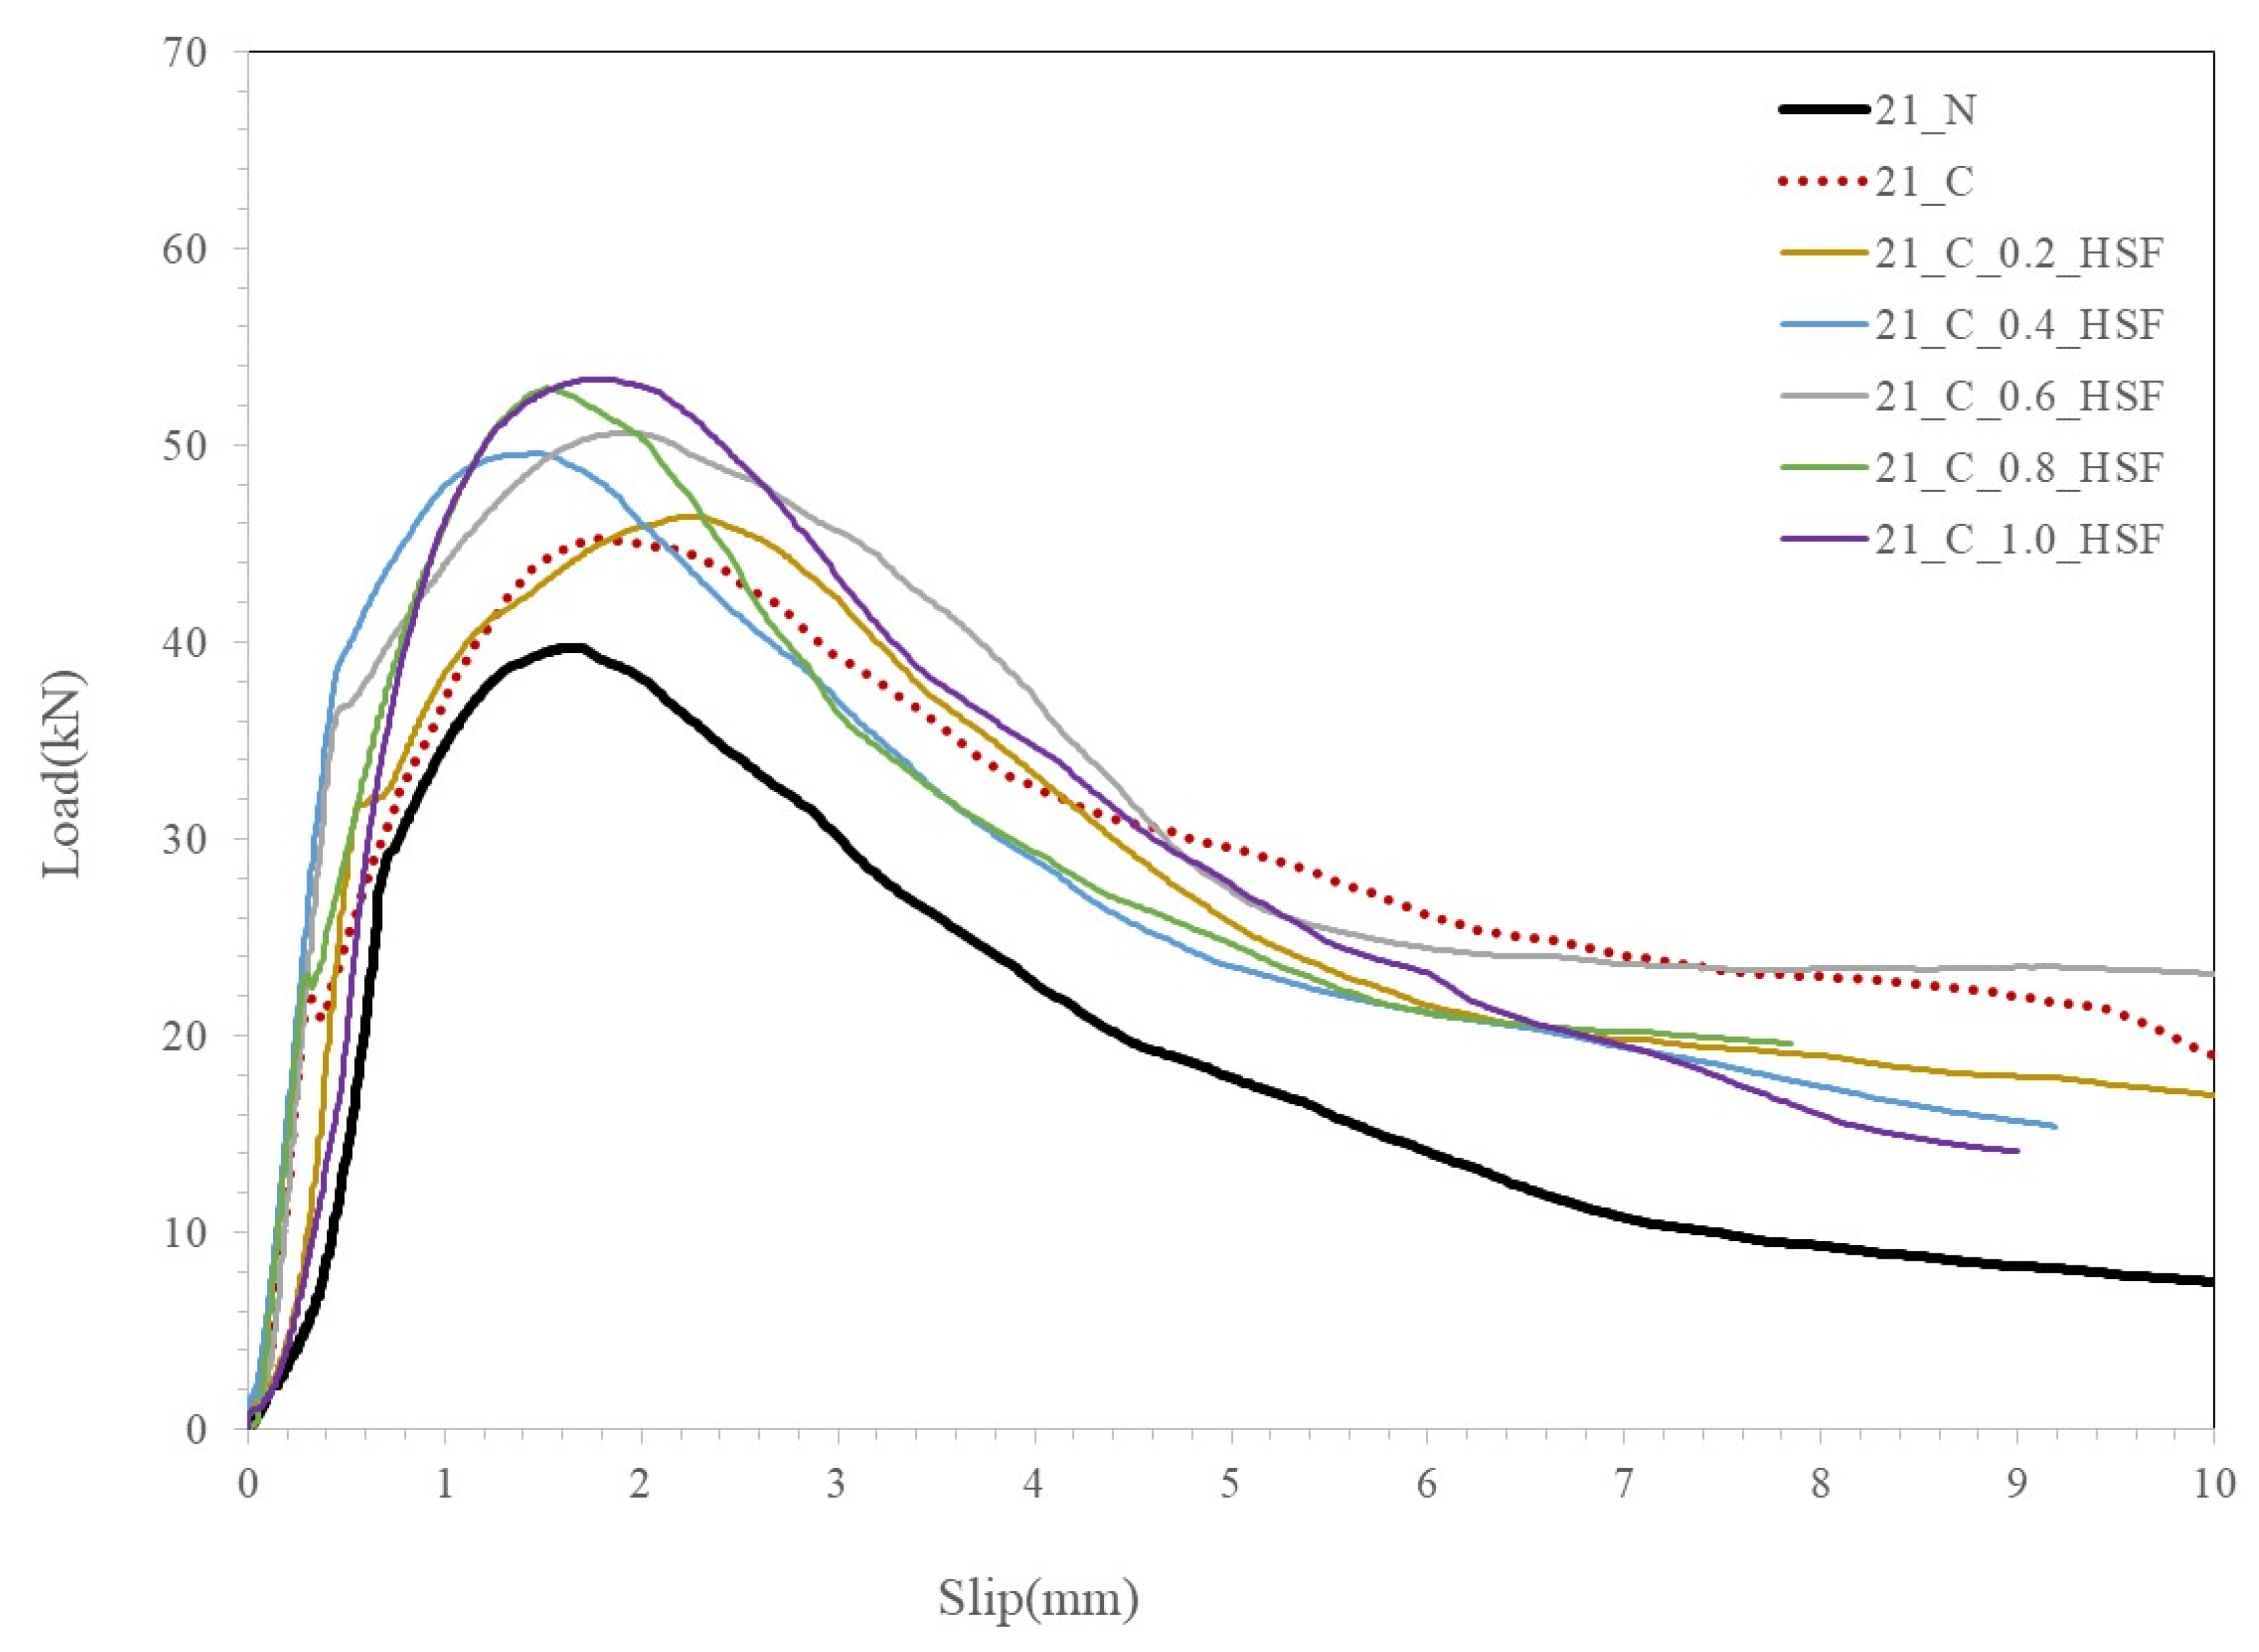
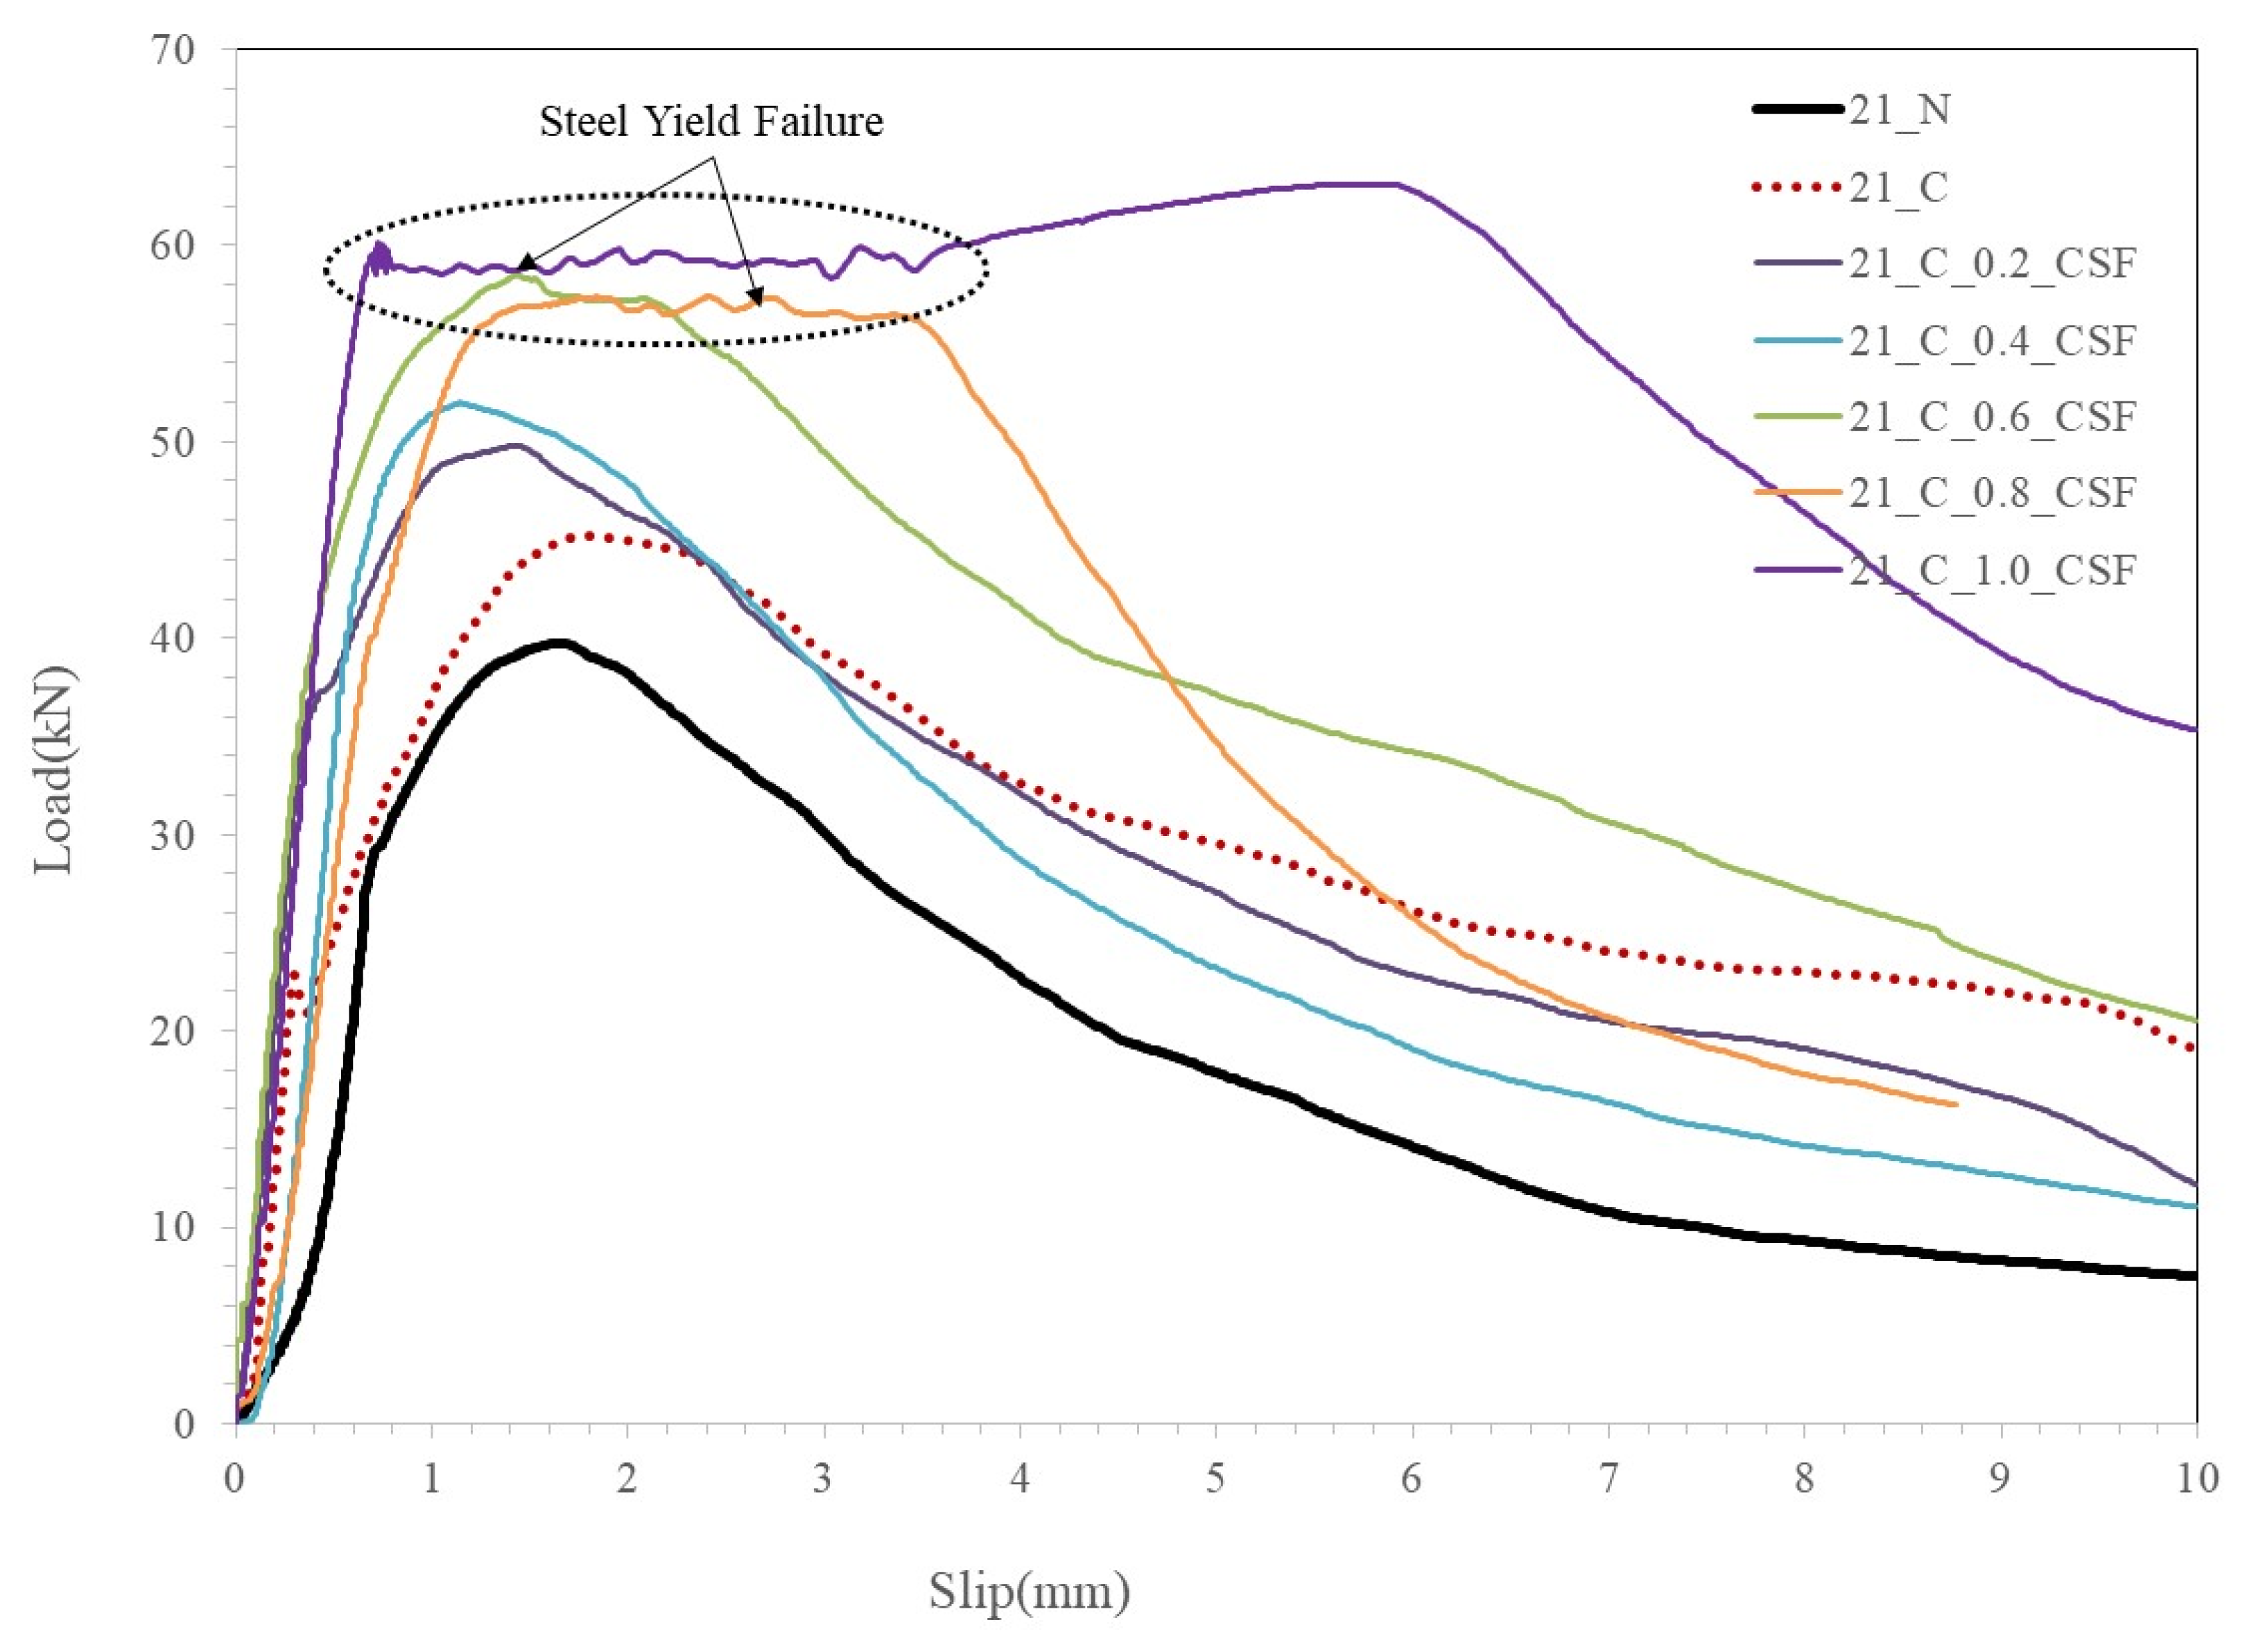
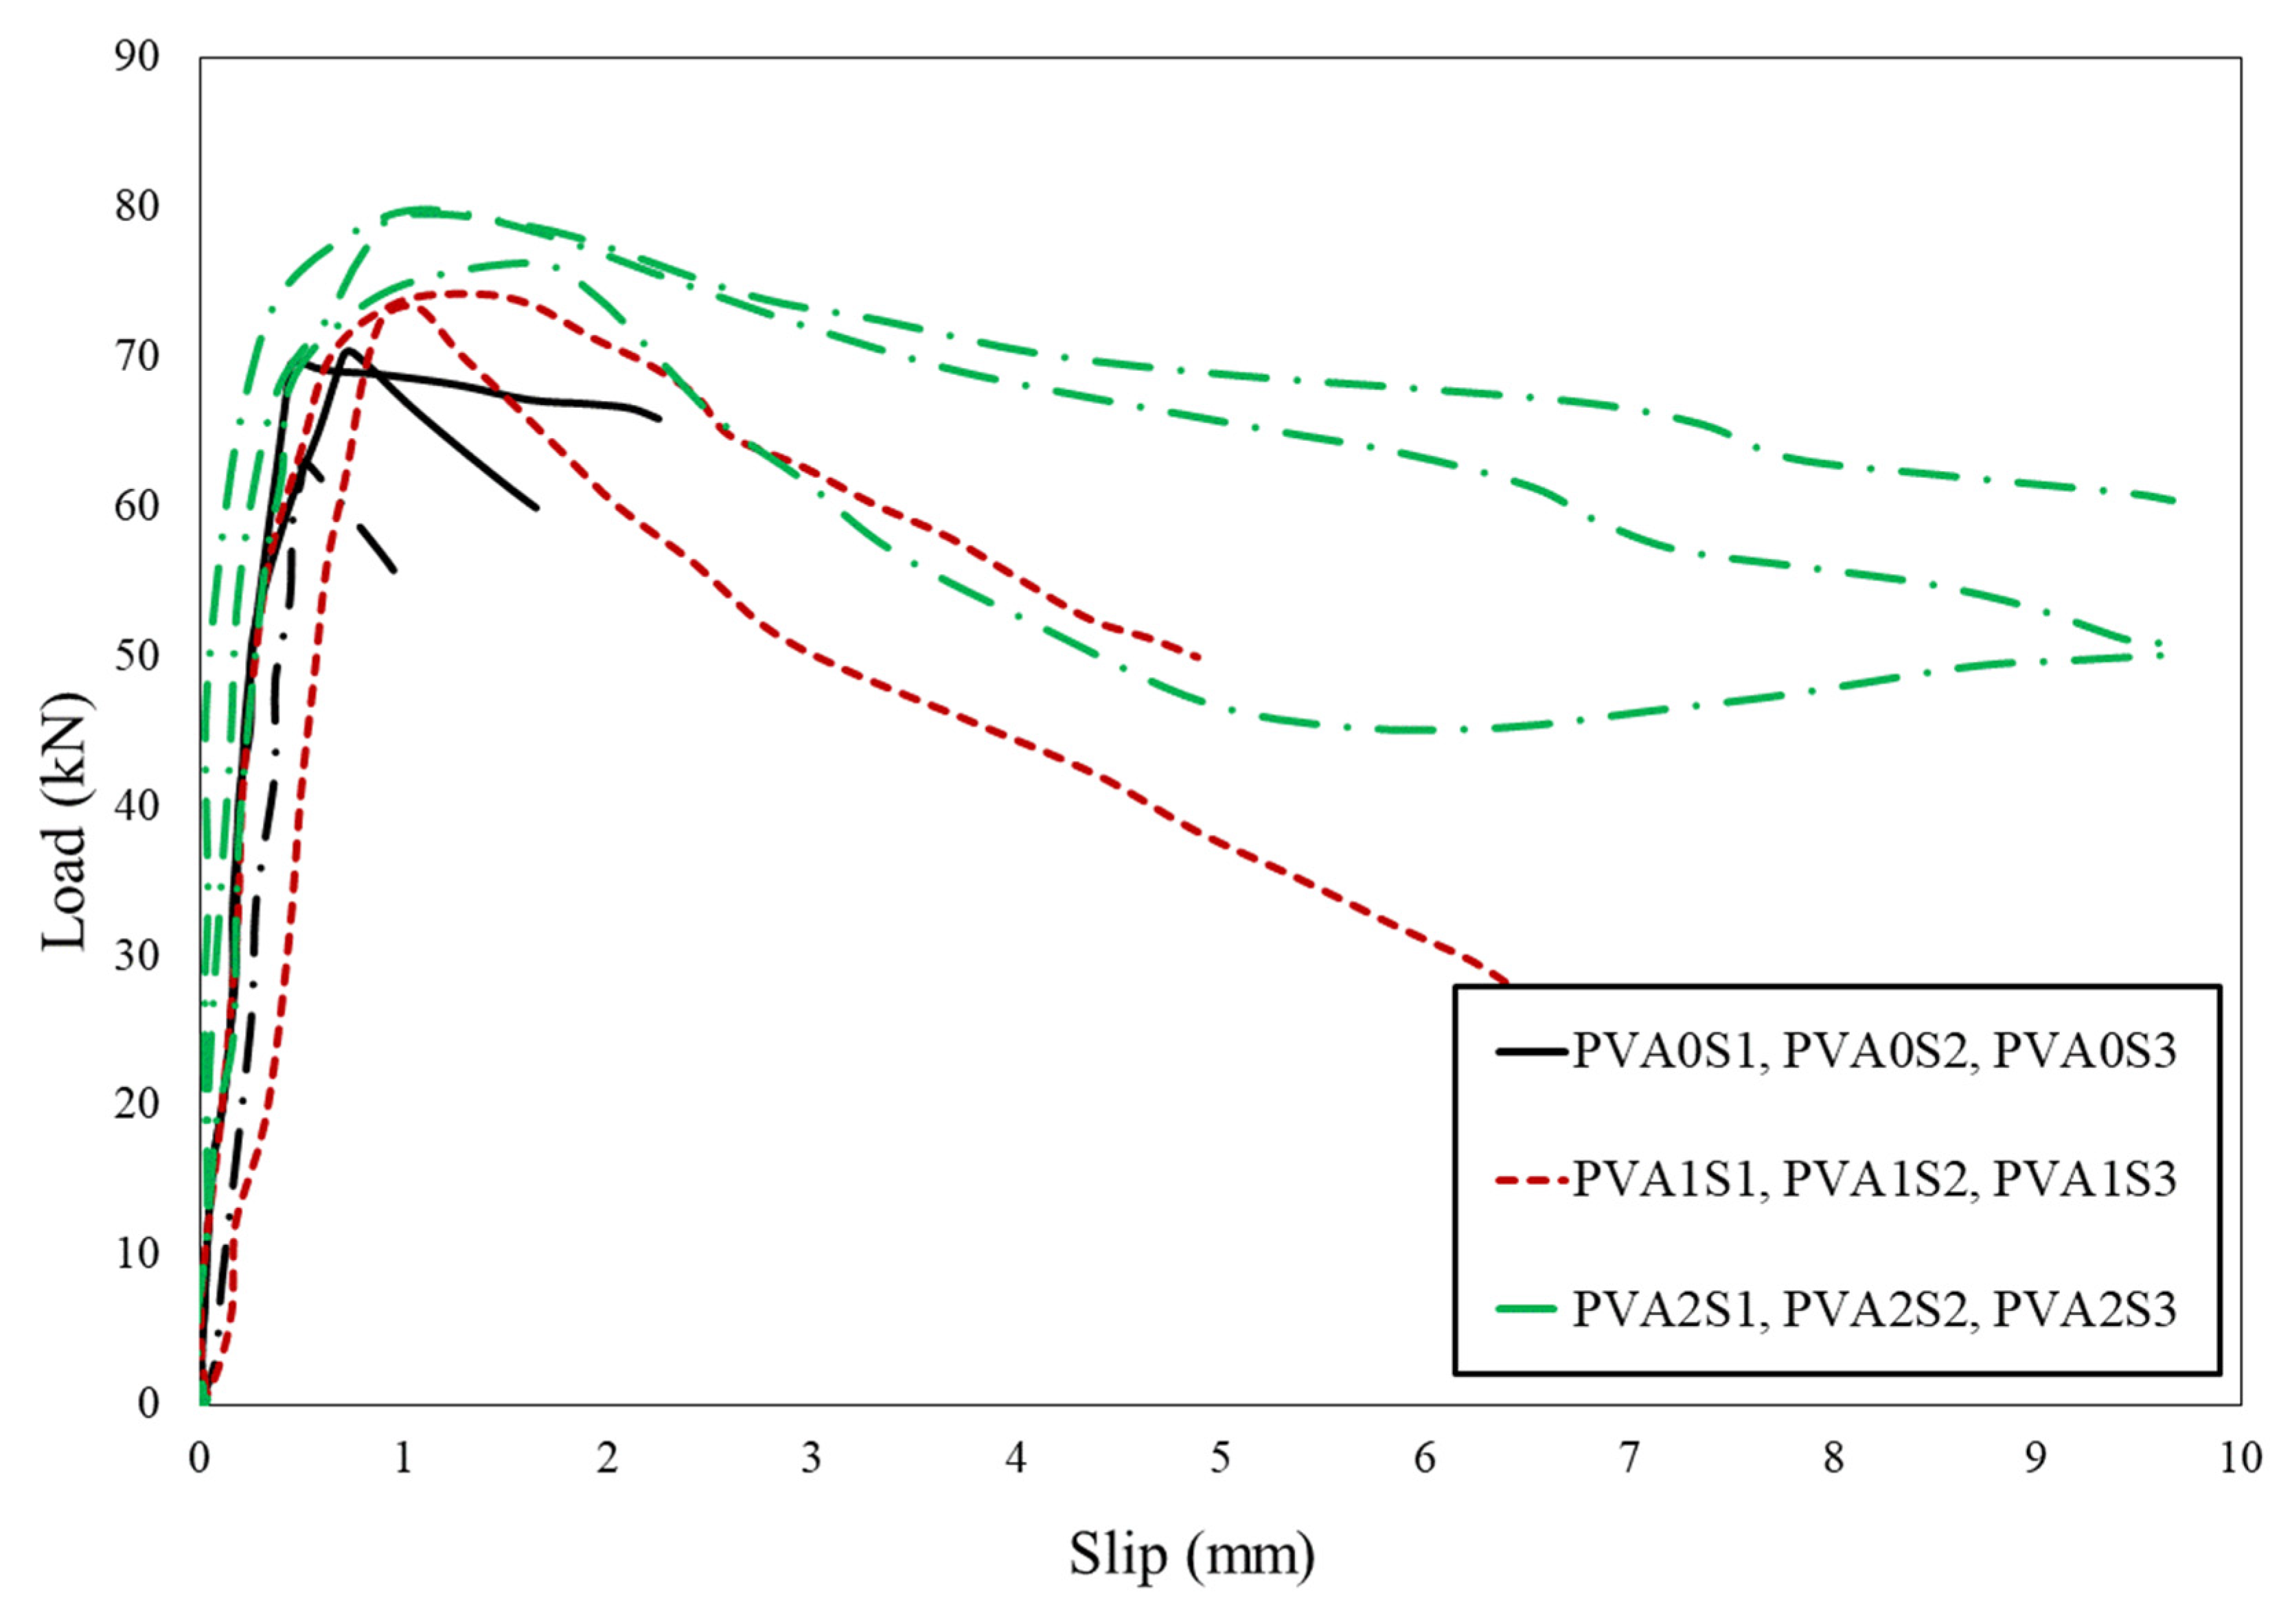
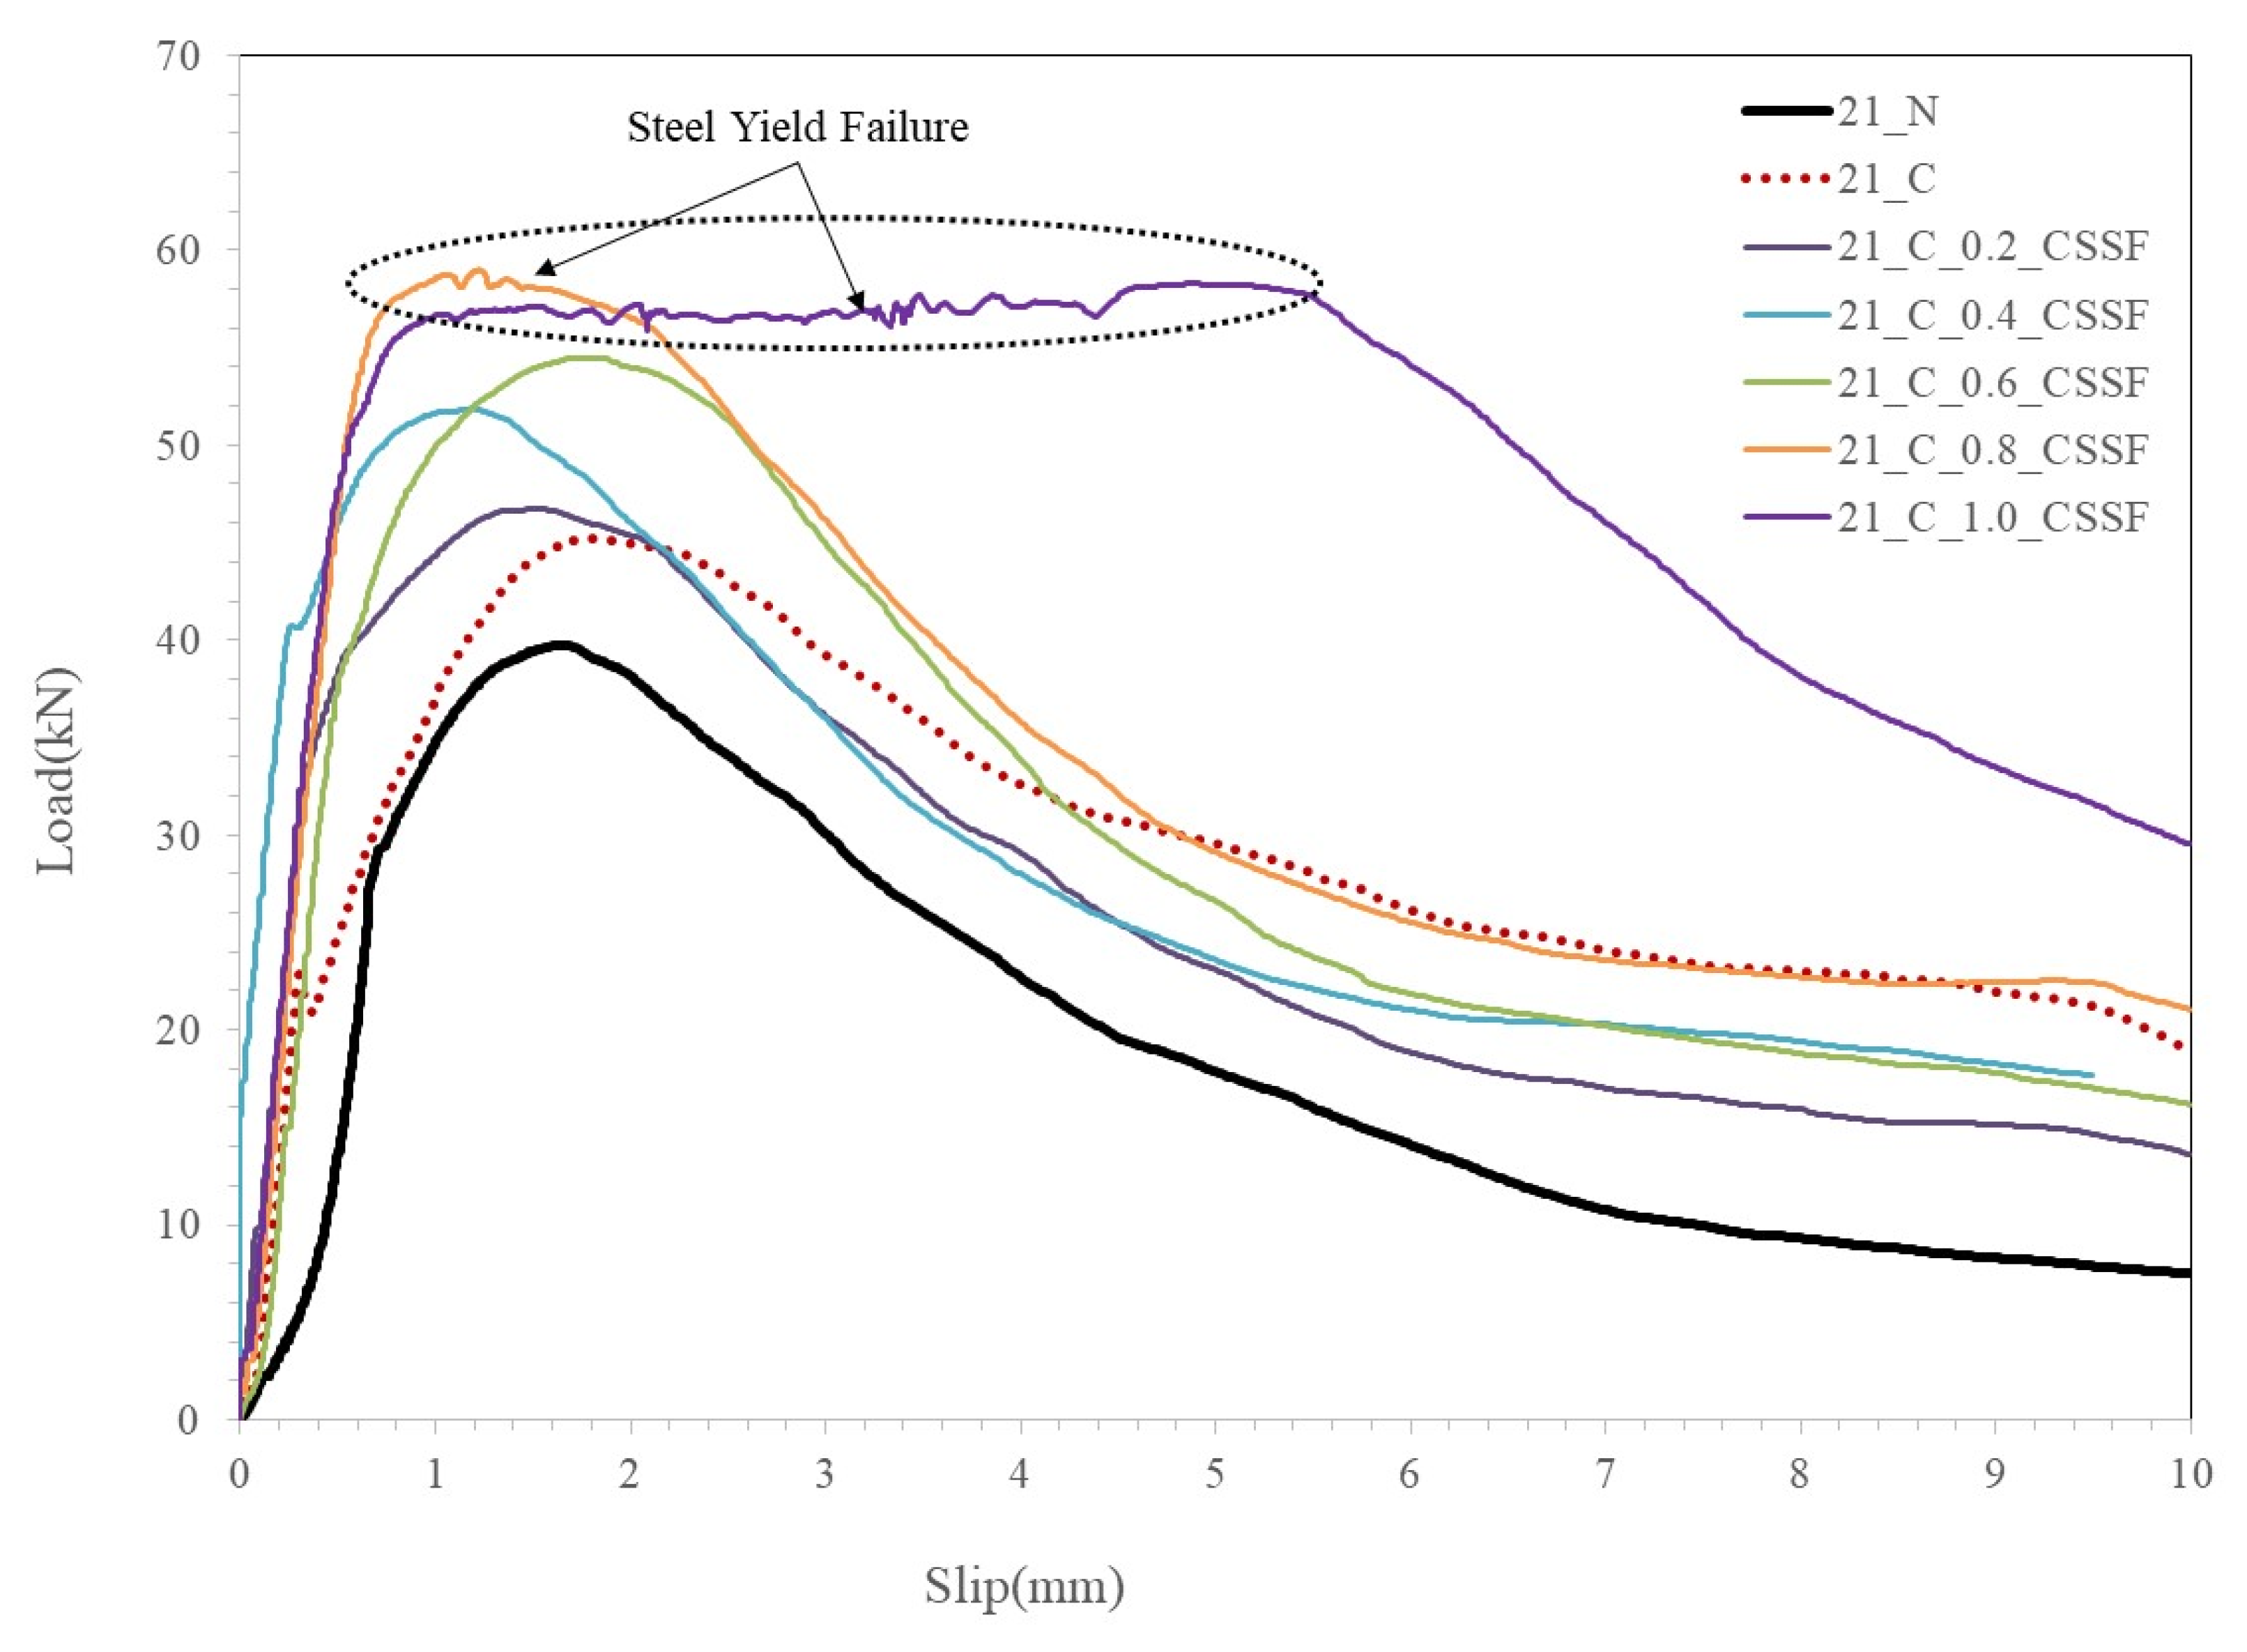
3.1. Load–Slip Relationship
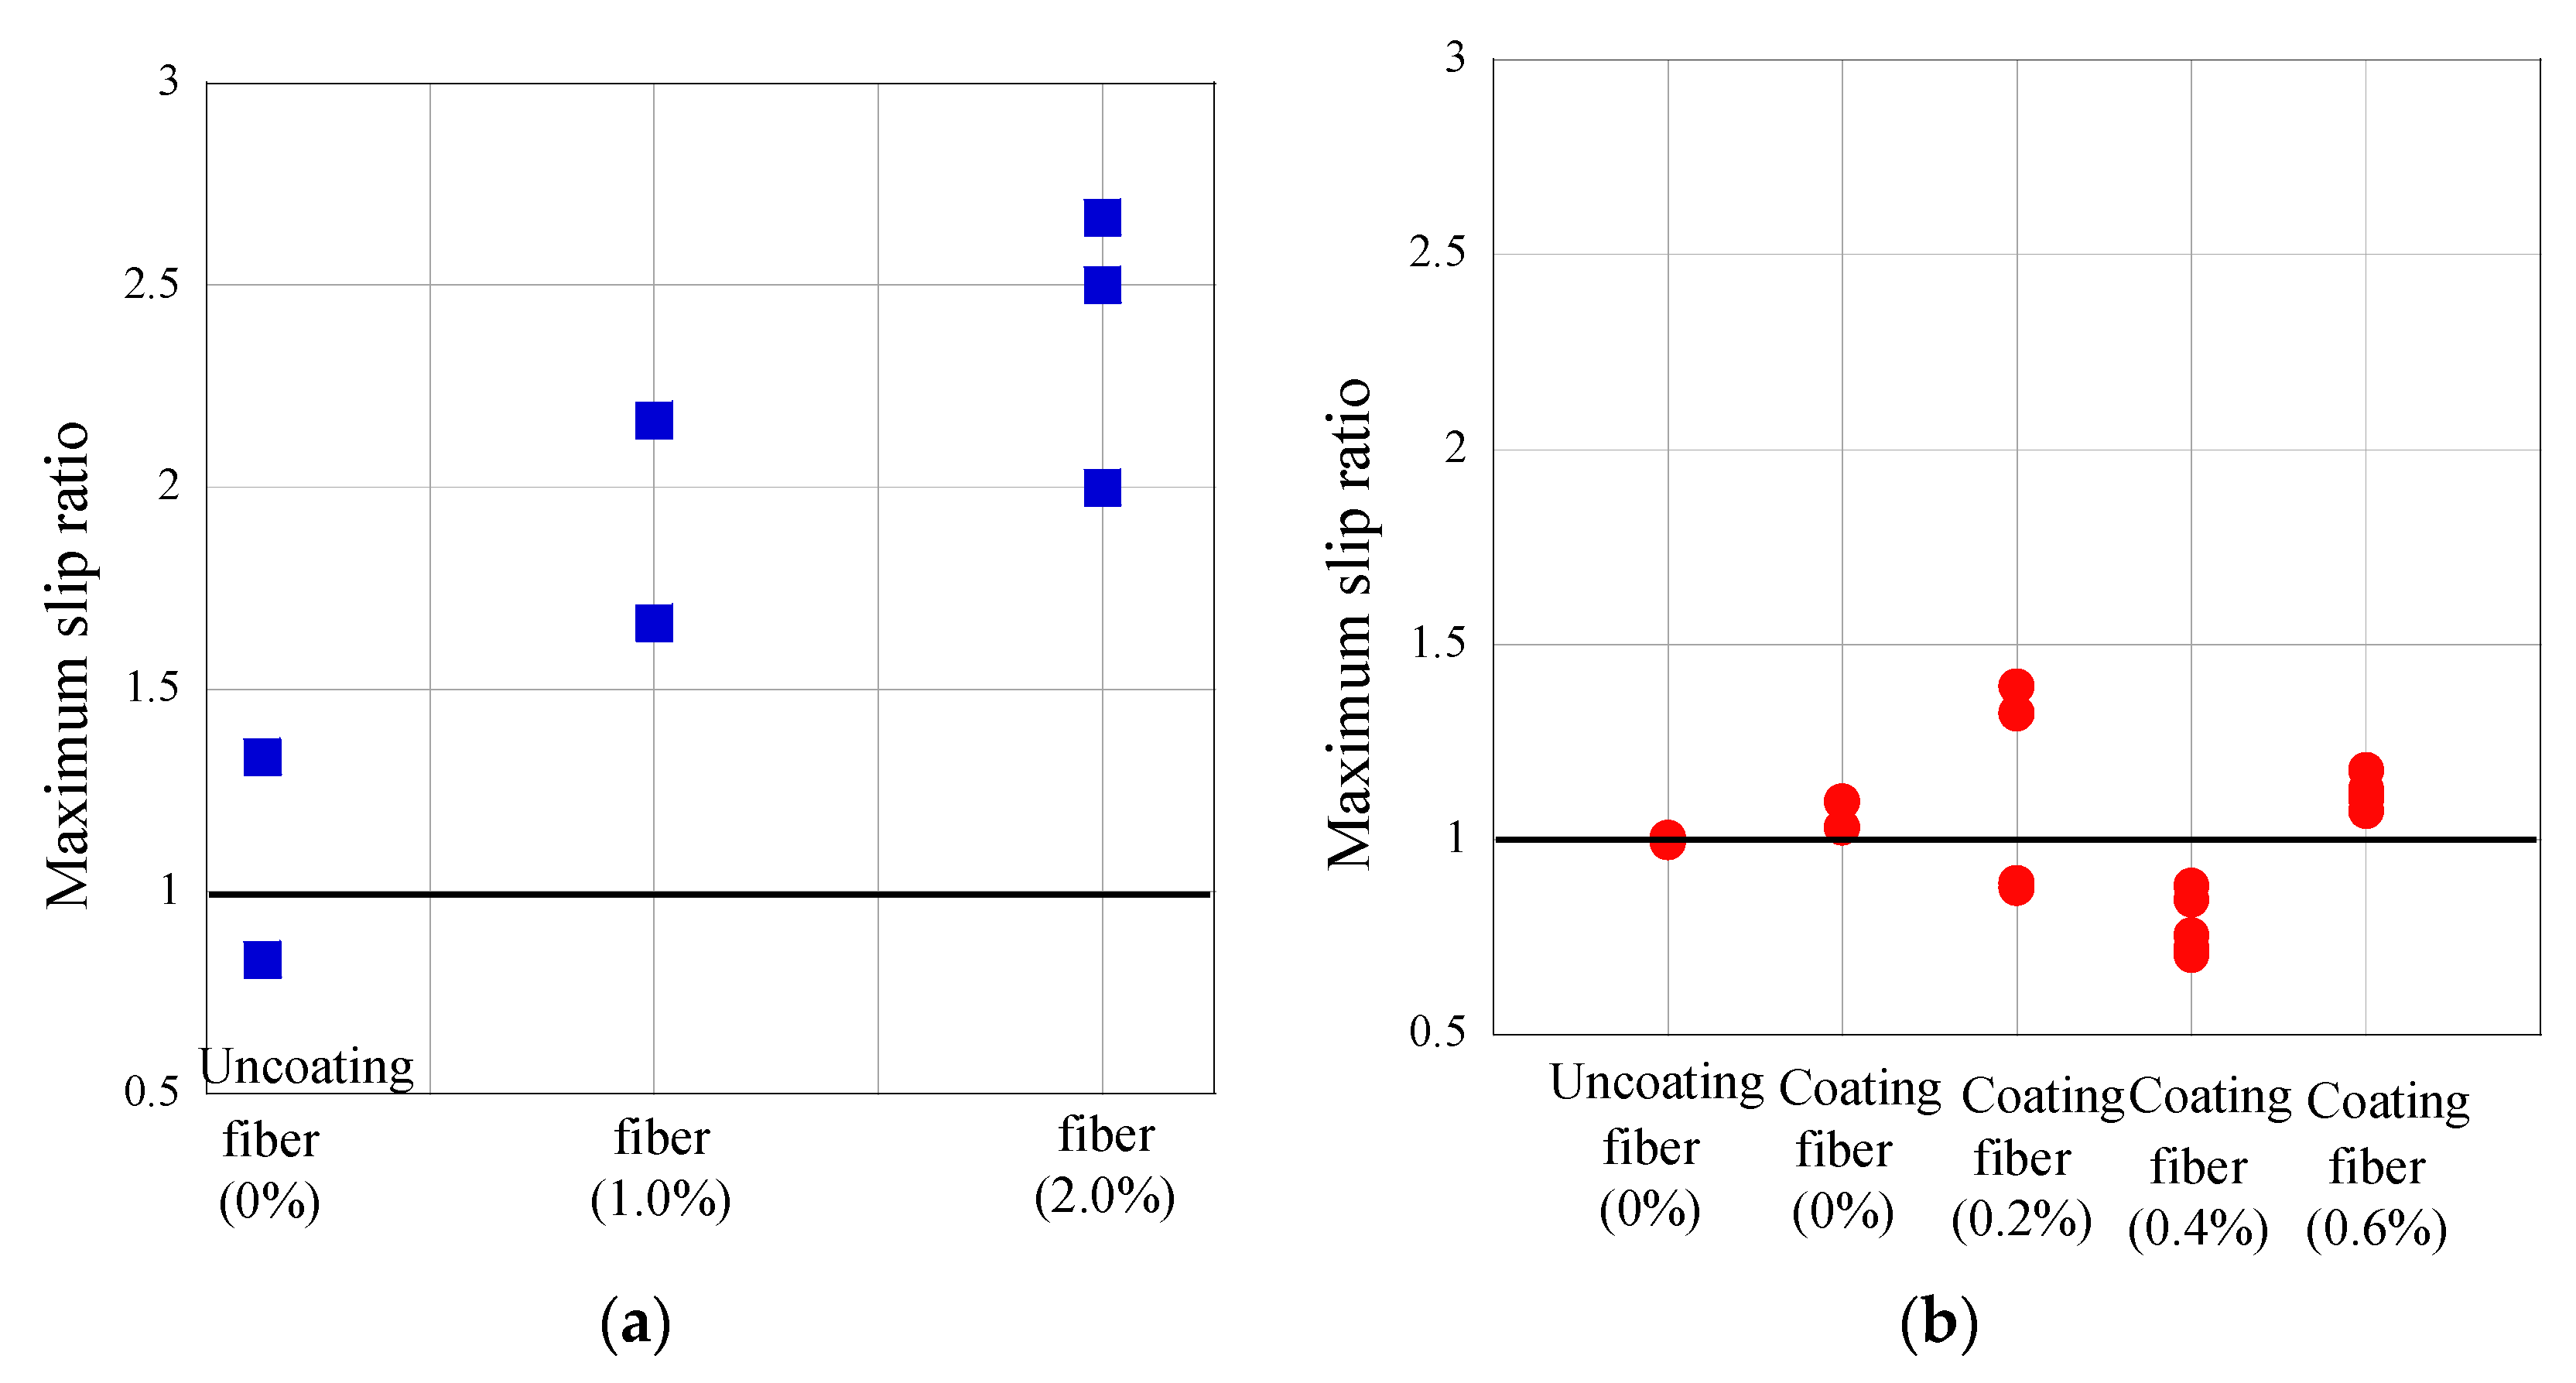
3.2. Bond Strength and Maximum Slip
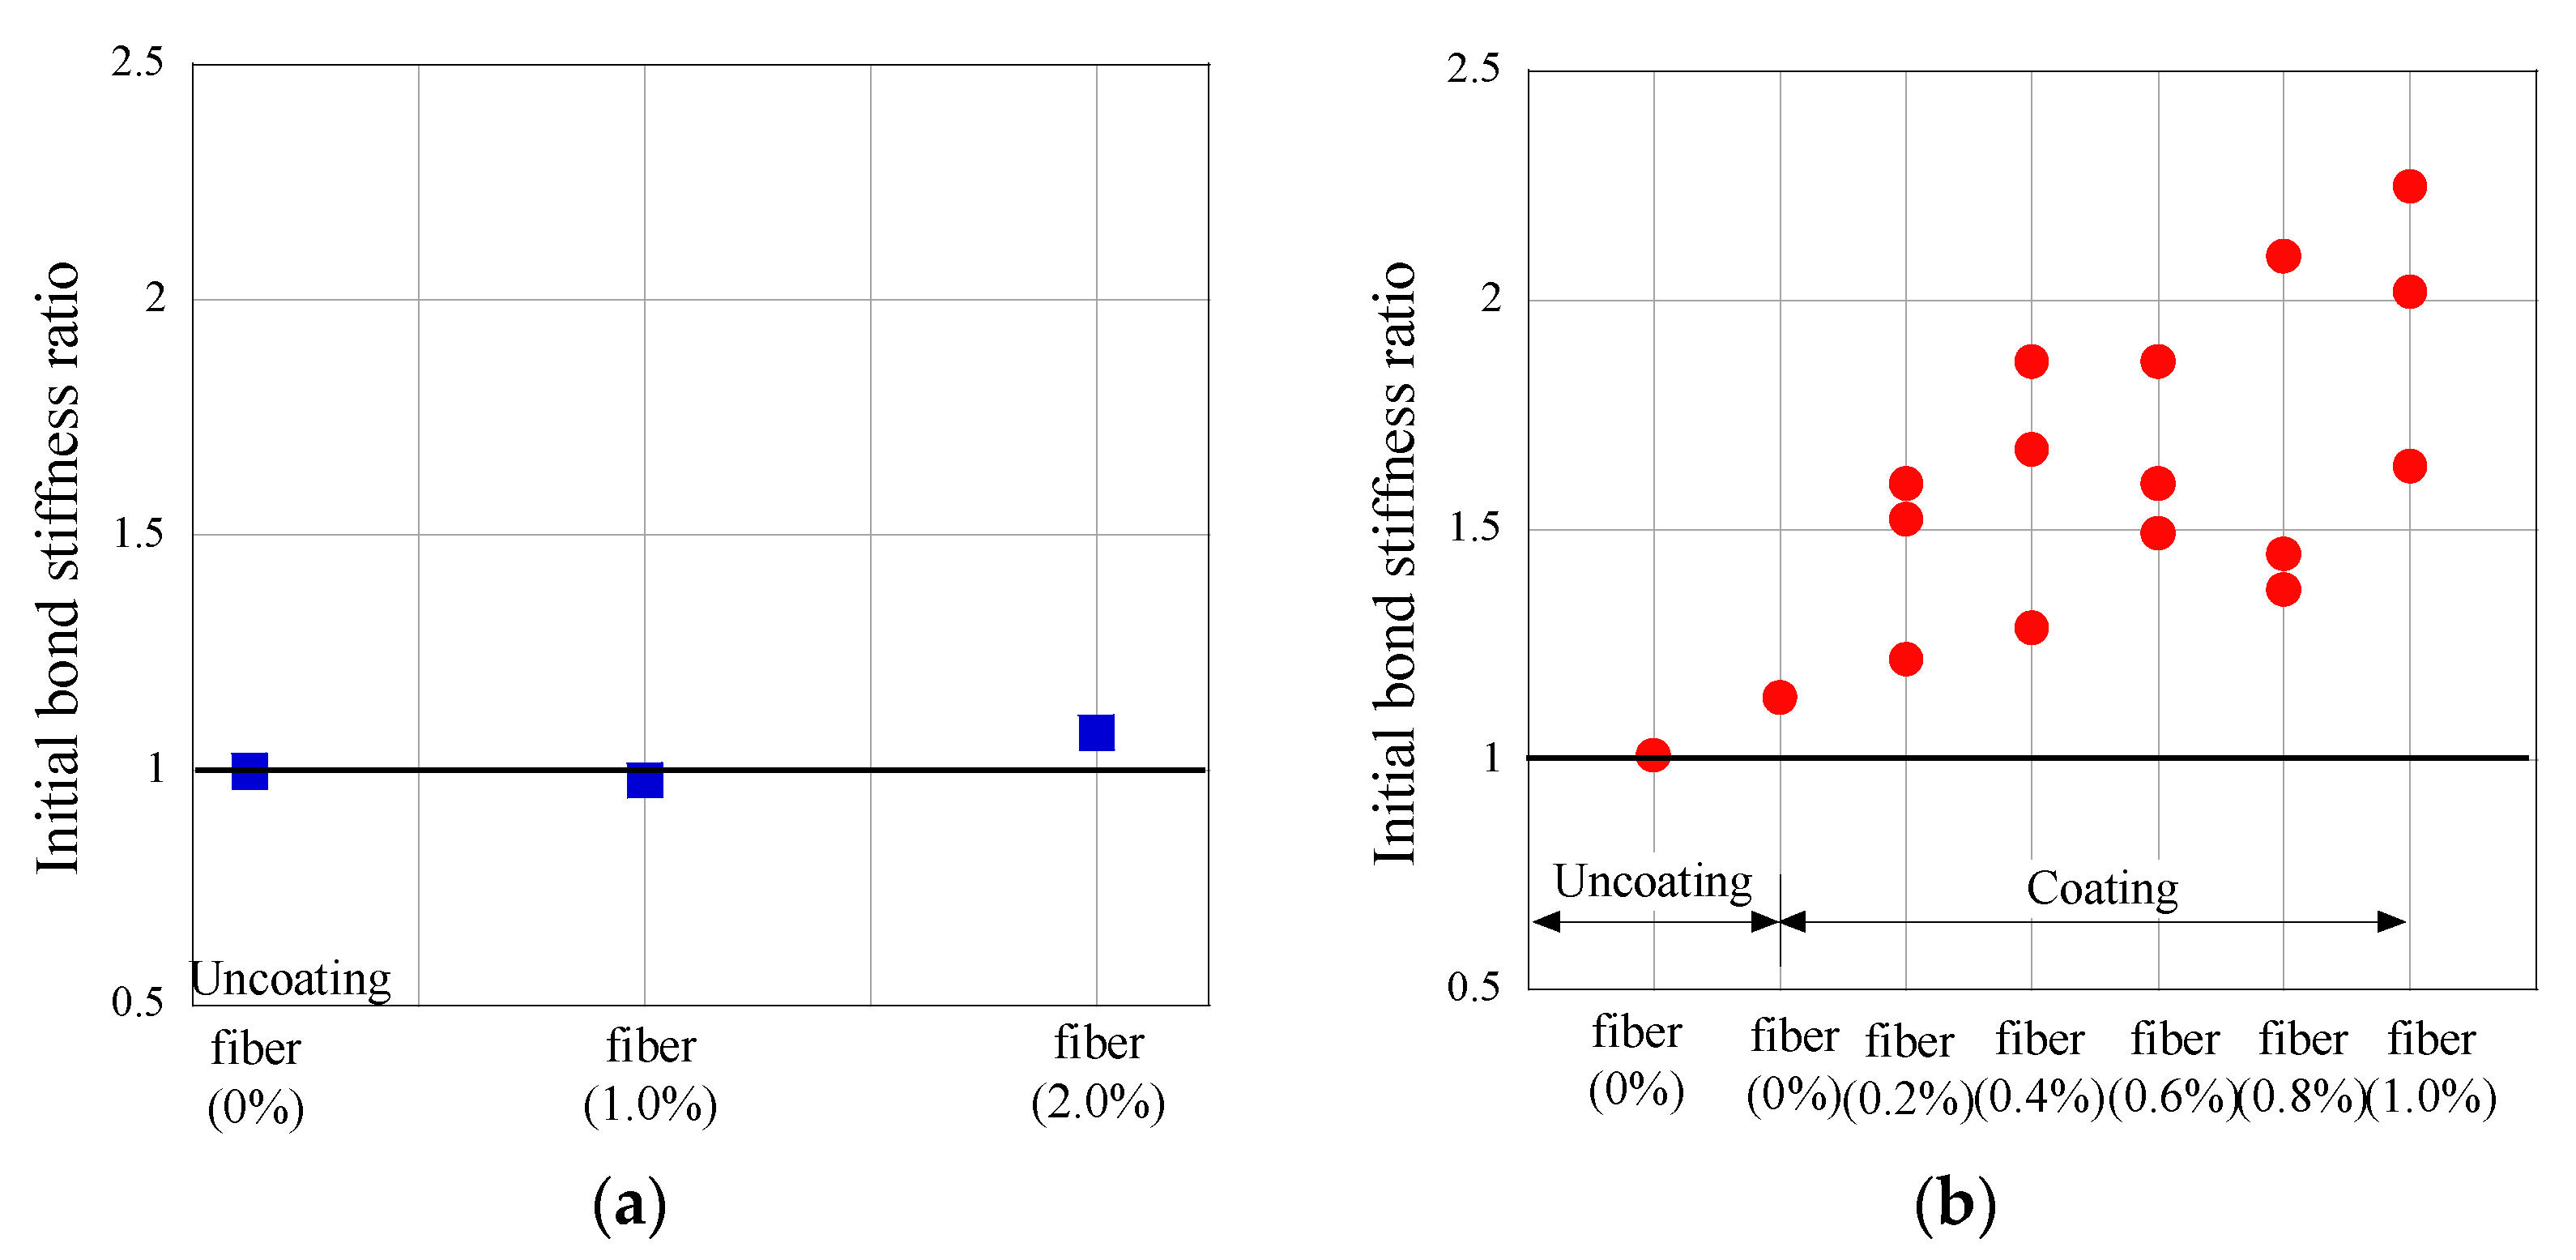
3.3. Initial Stiffness Influence
3.4. Analytical Modelling of UHPC-Coated Steel Rebars
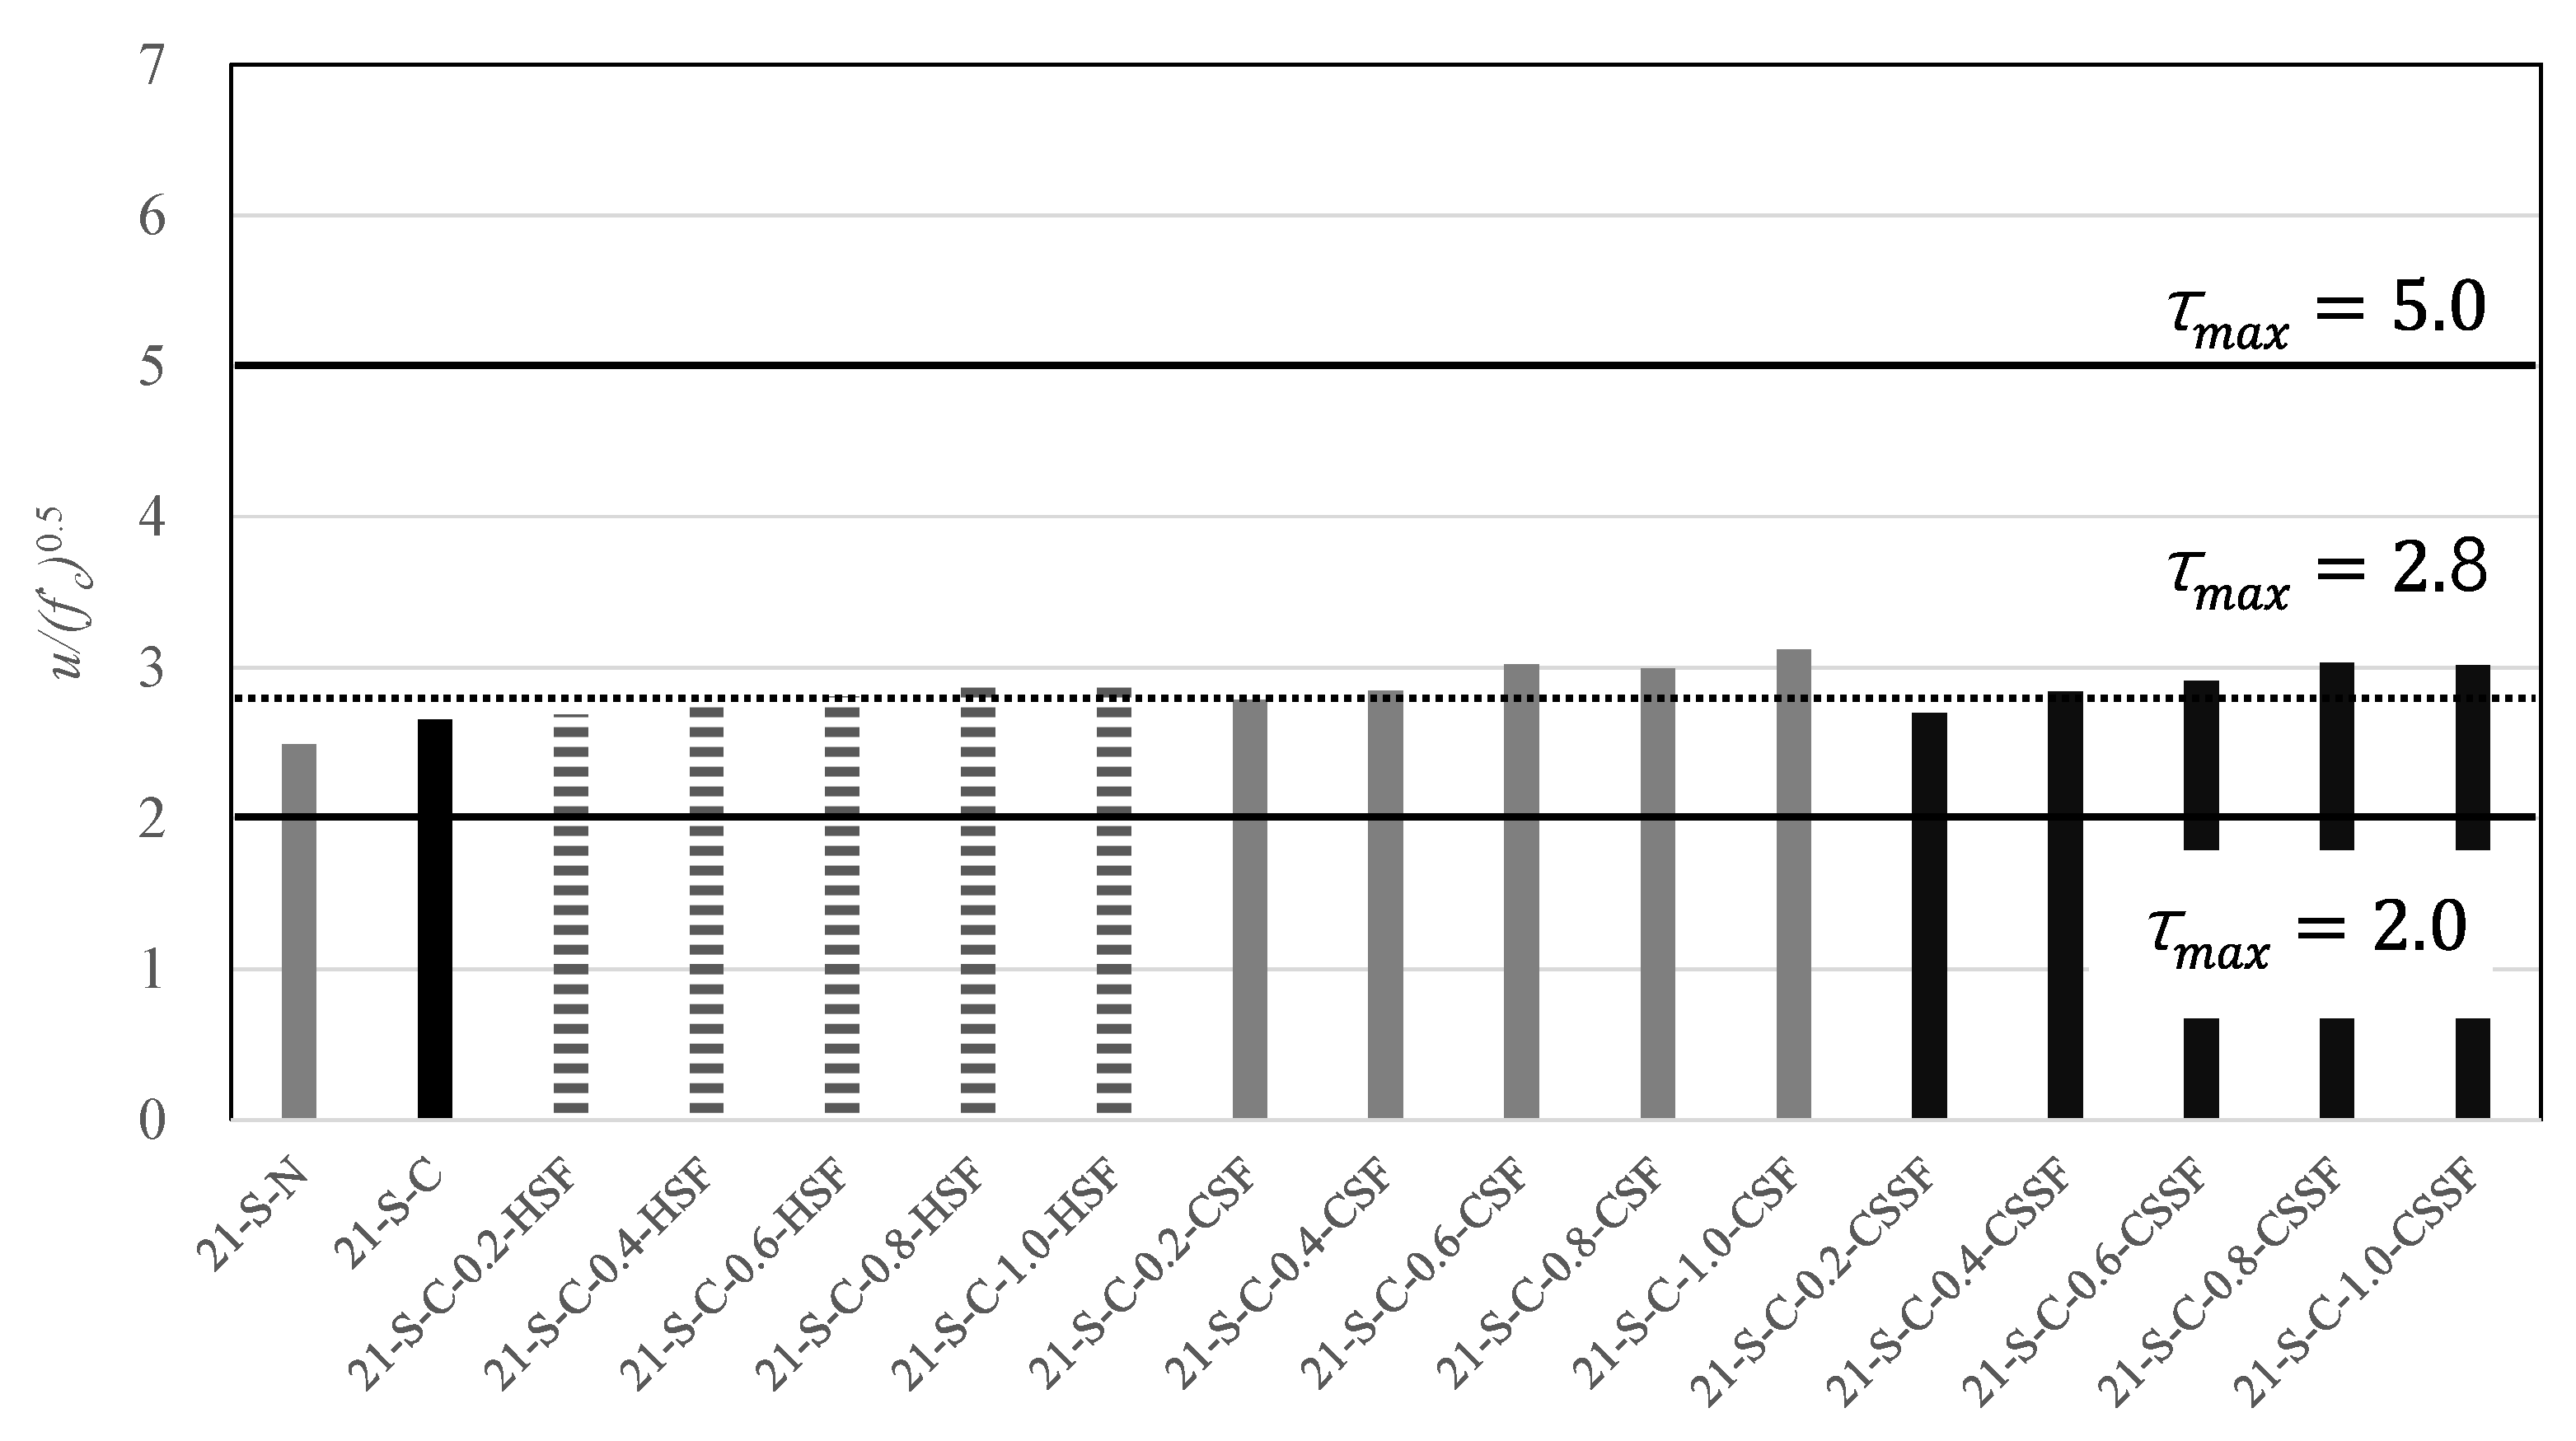
3.4.1. Normalized Bond Strength
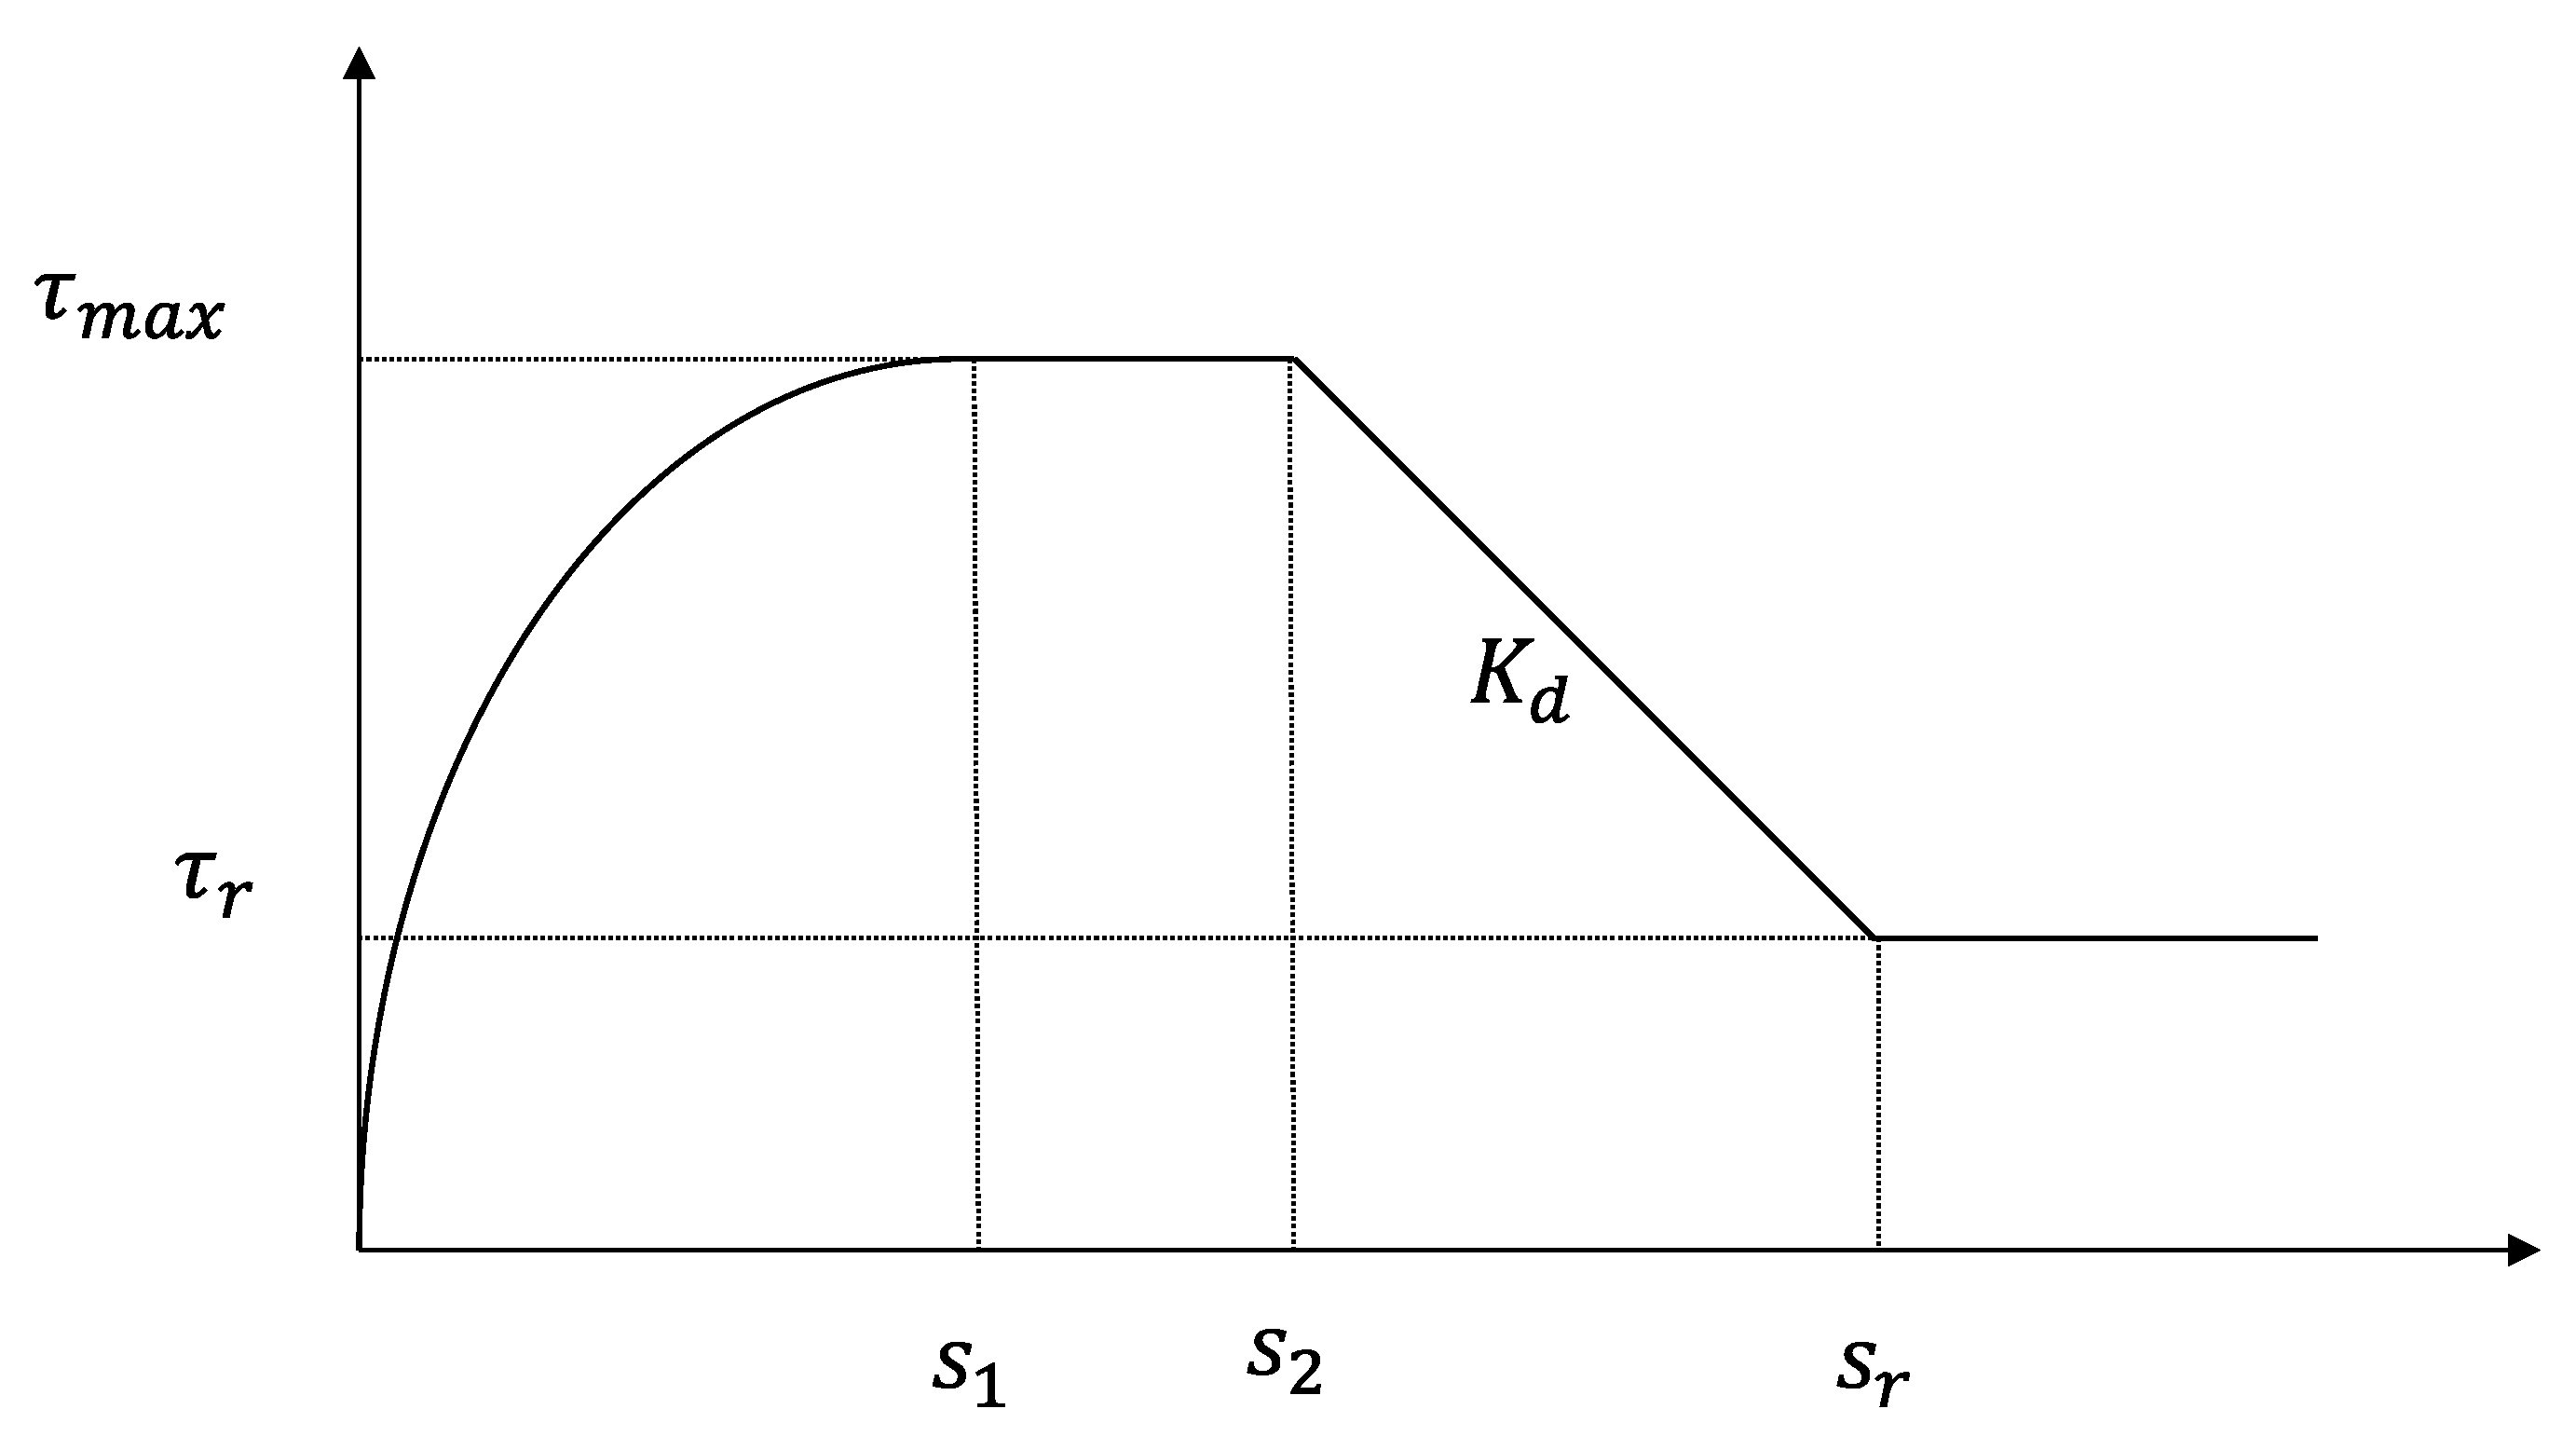
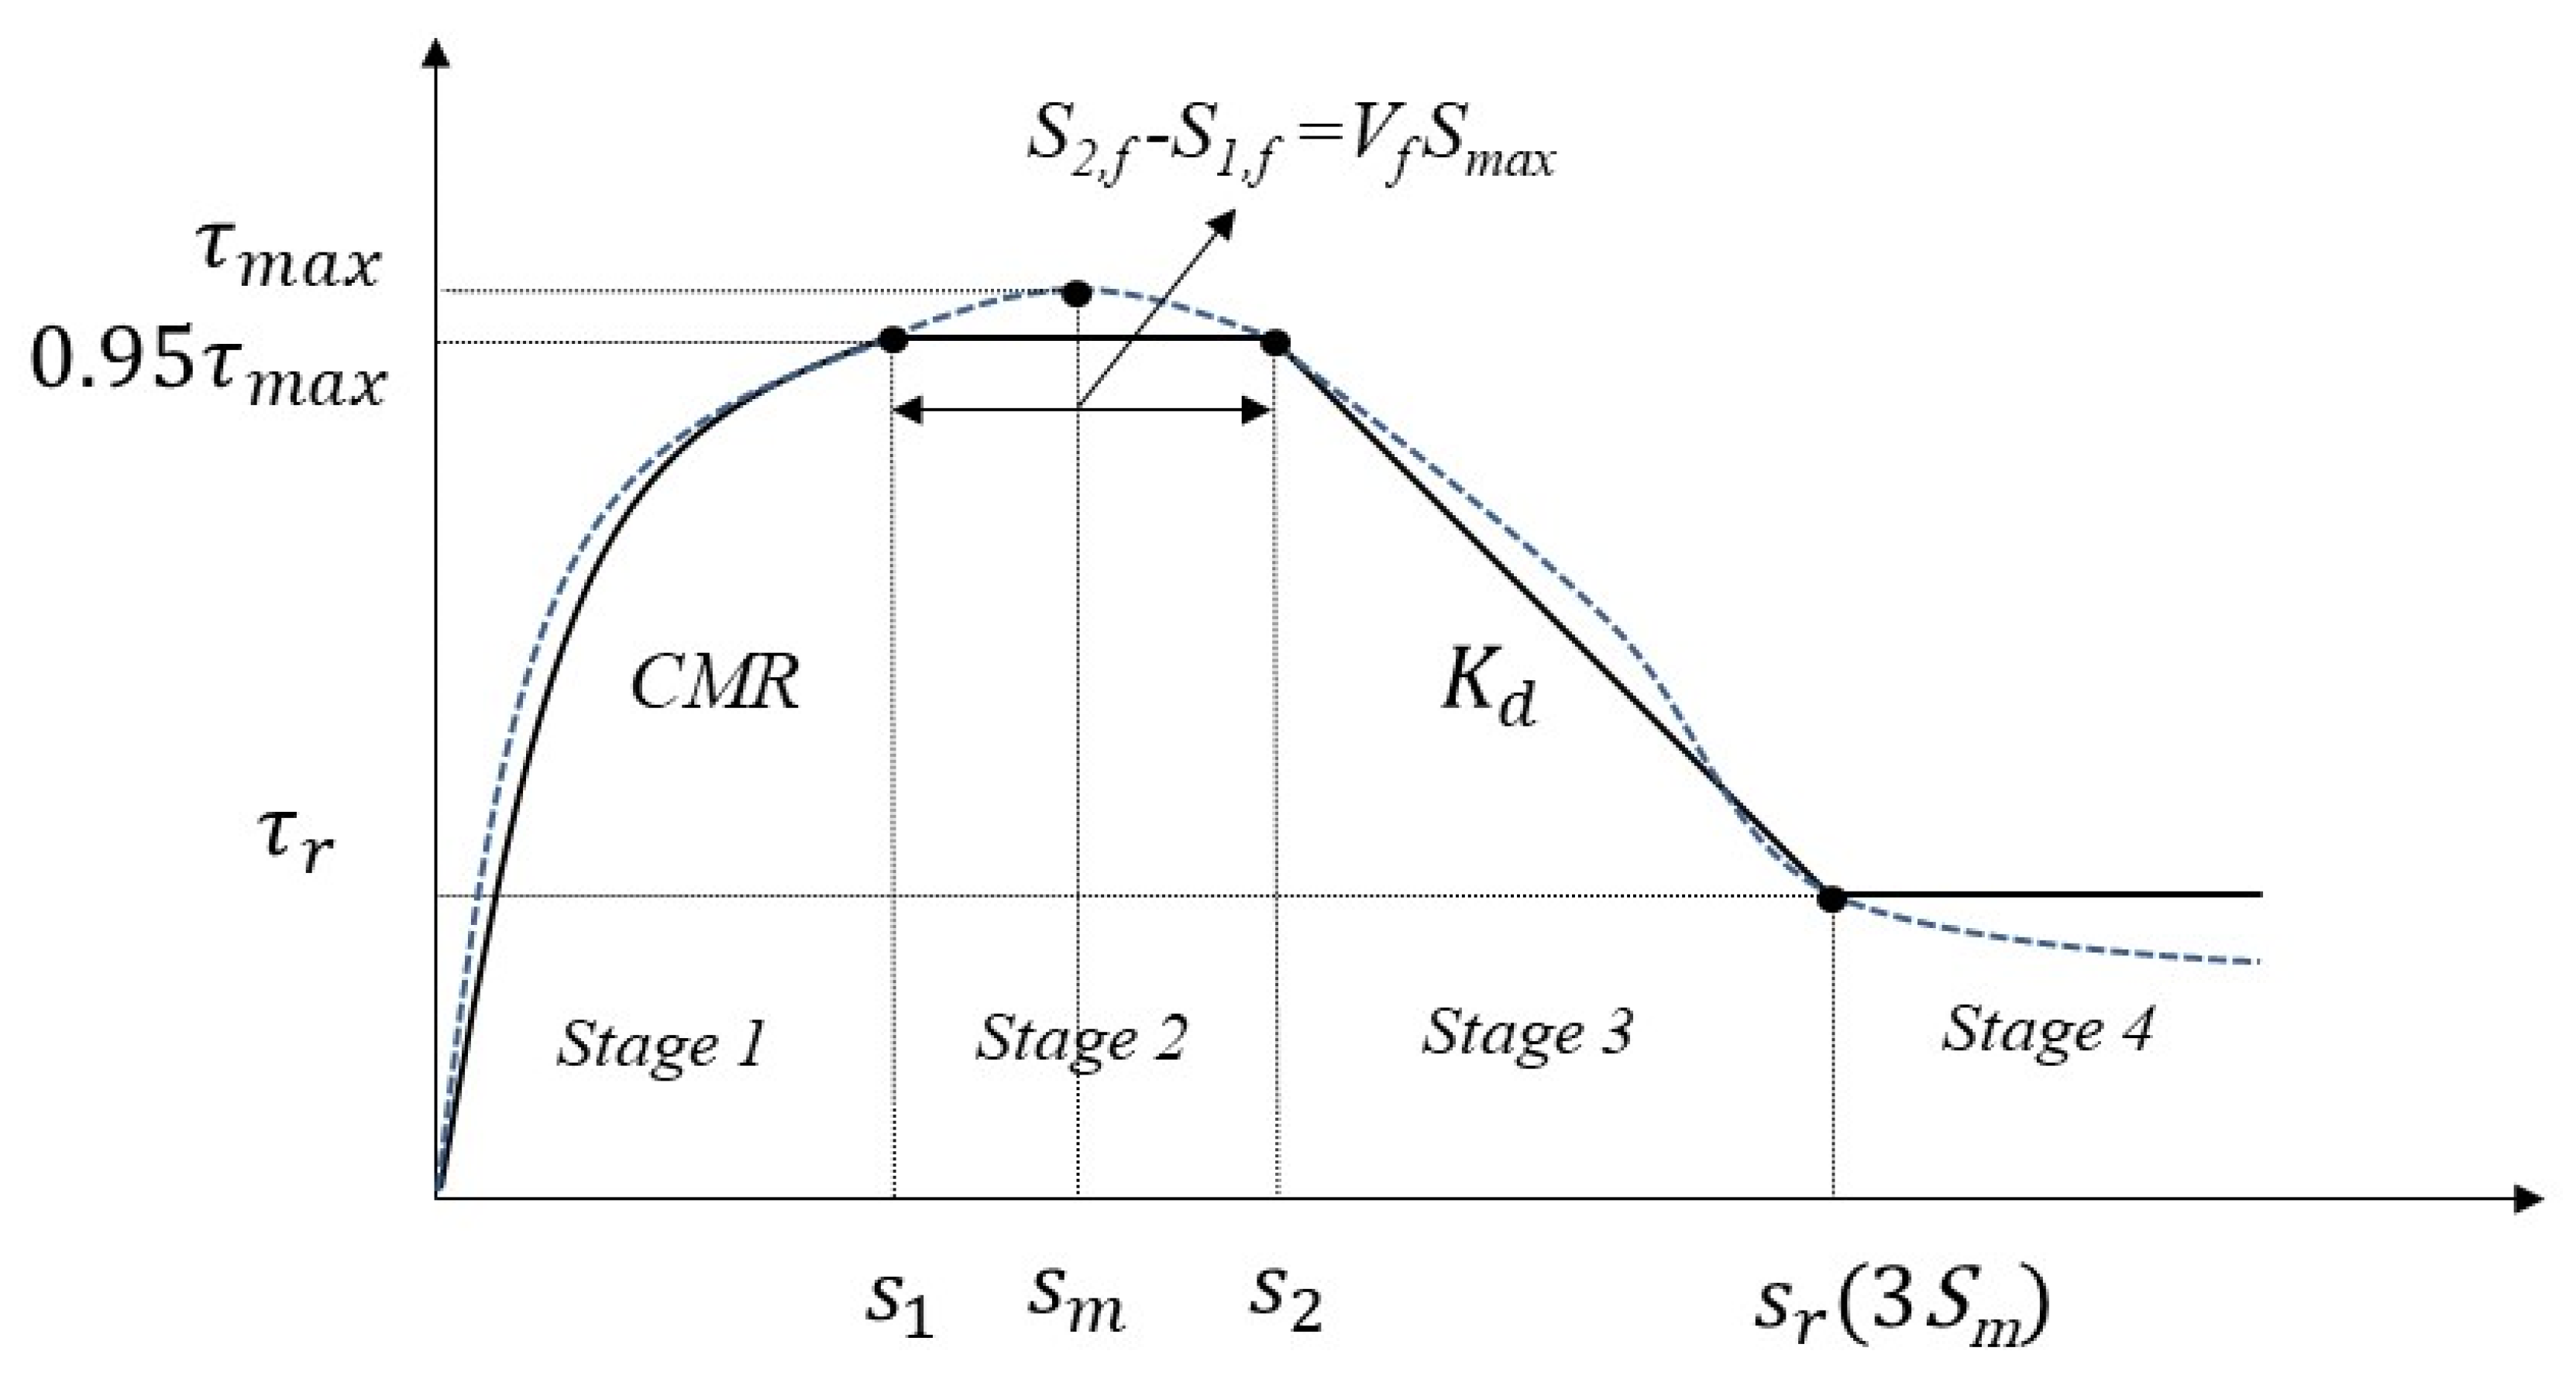
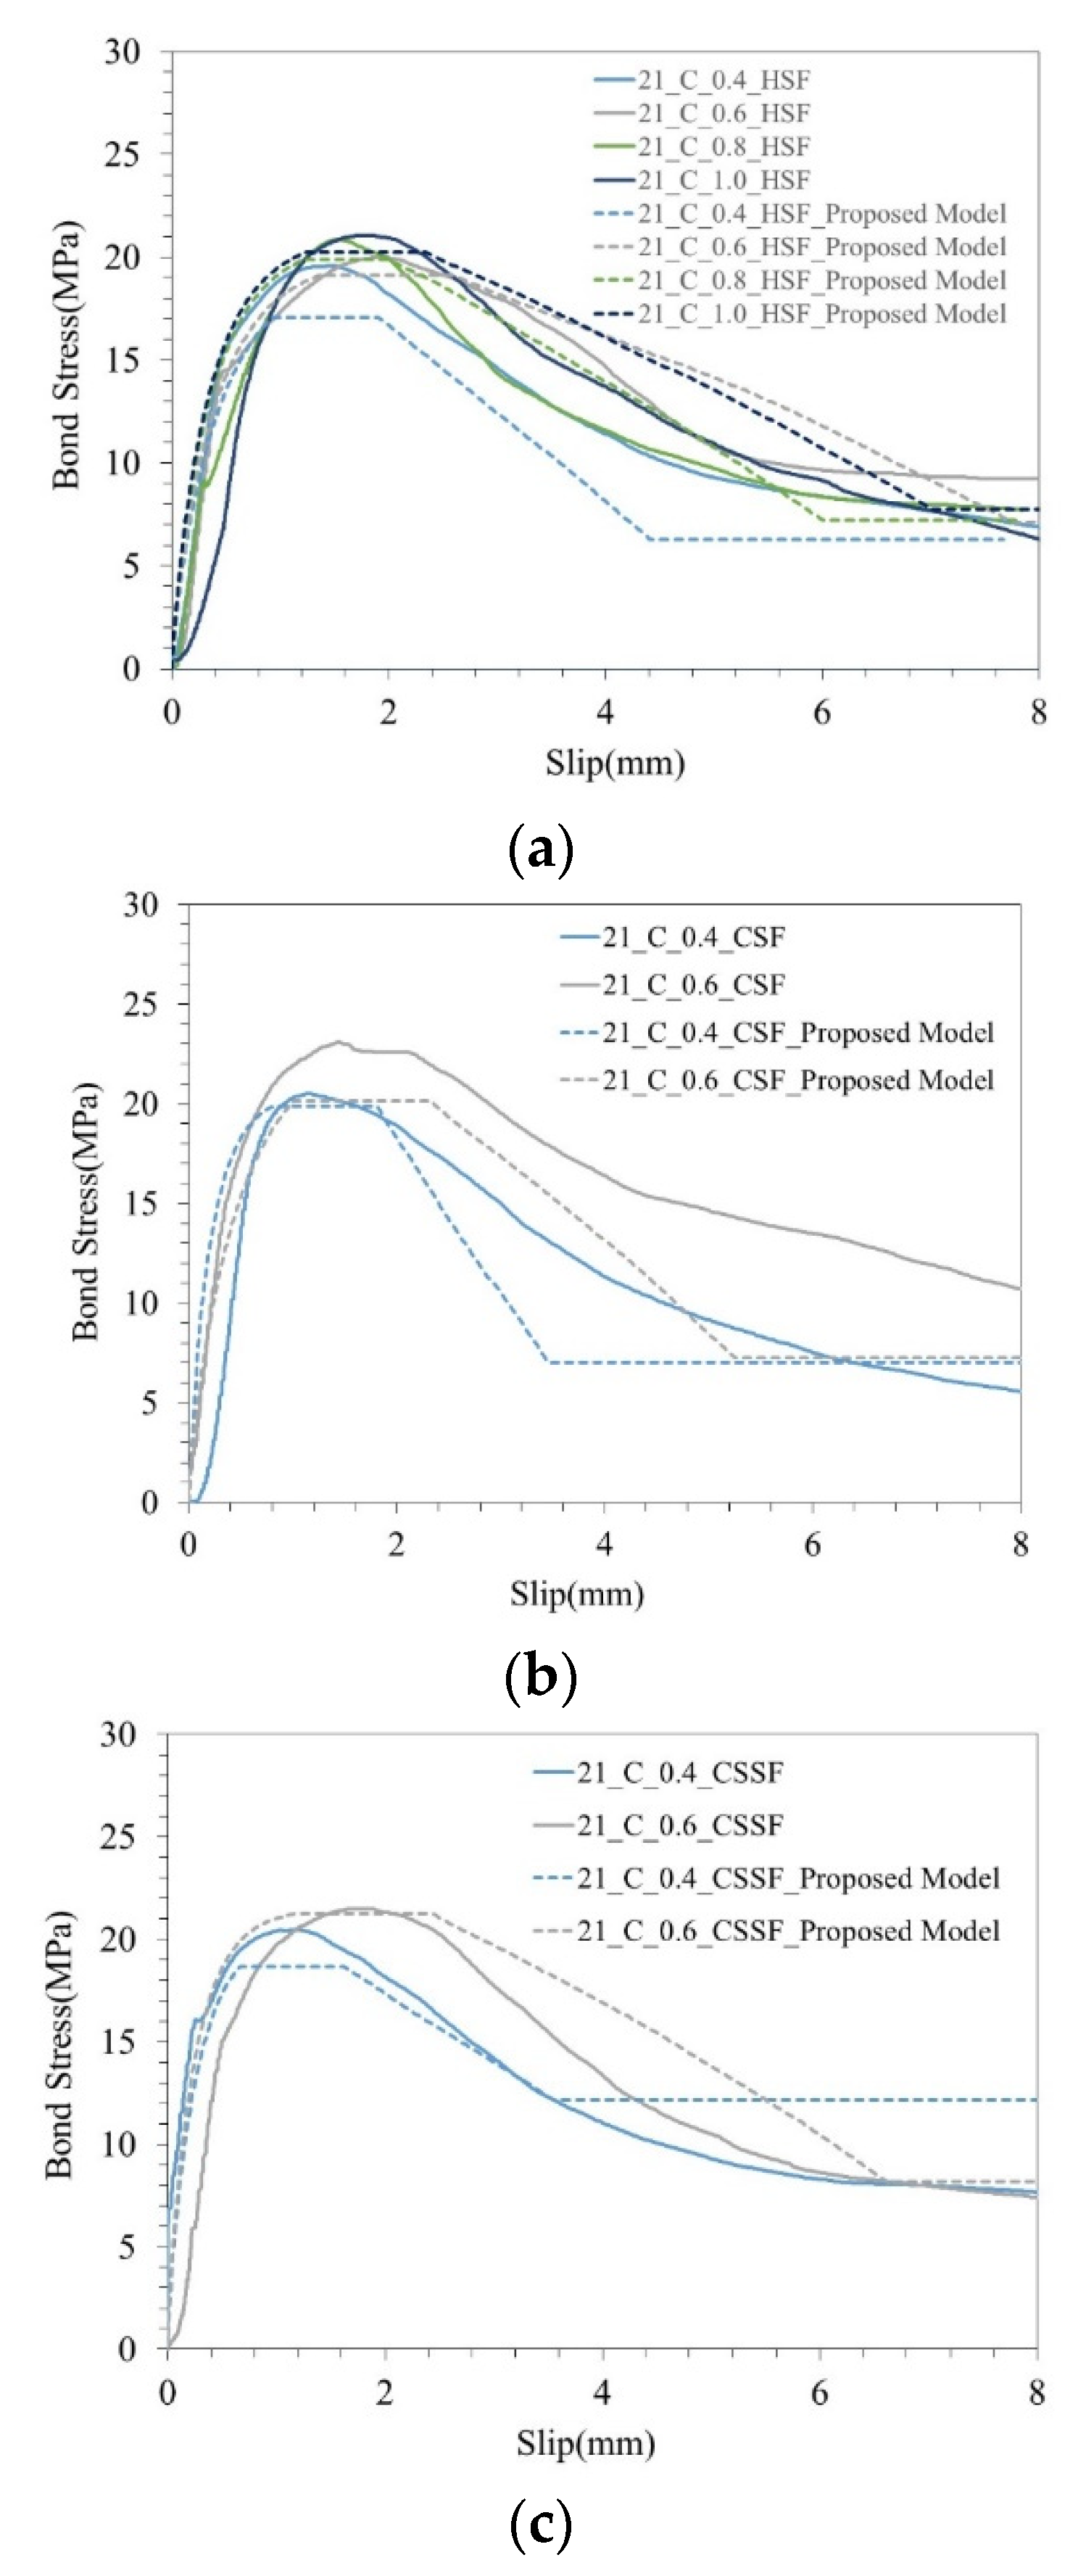
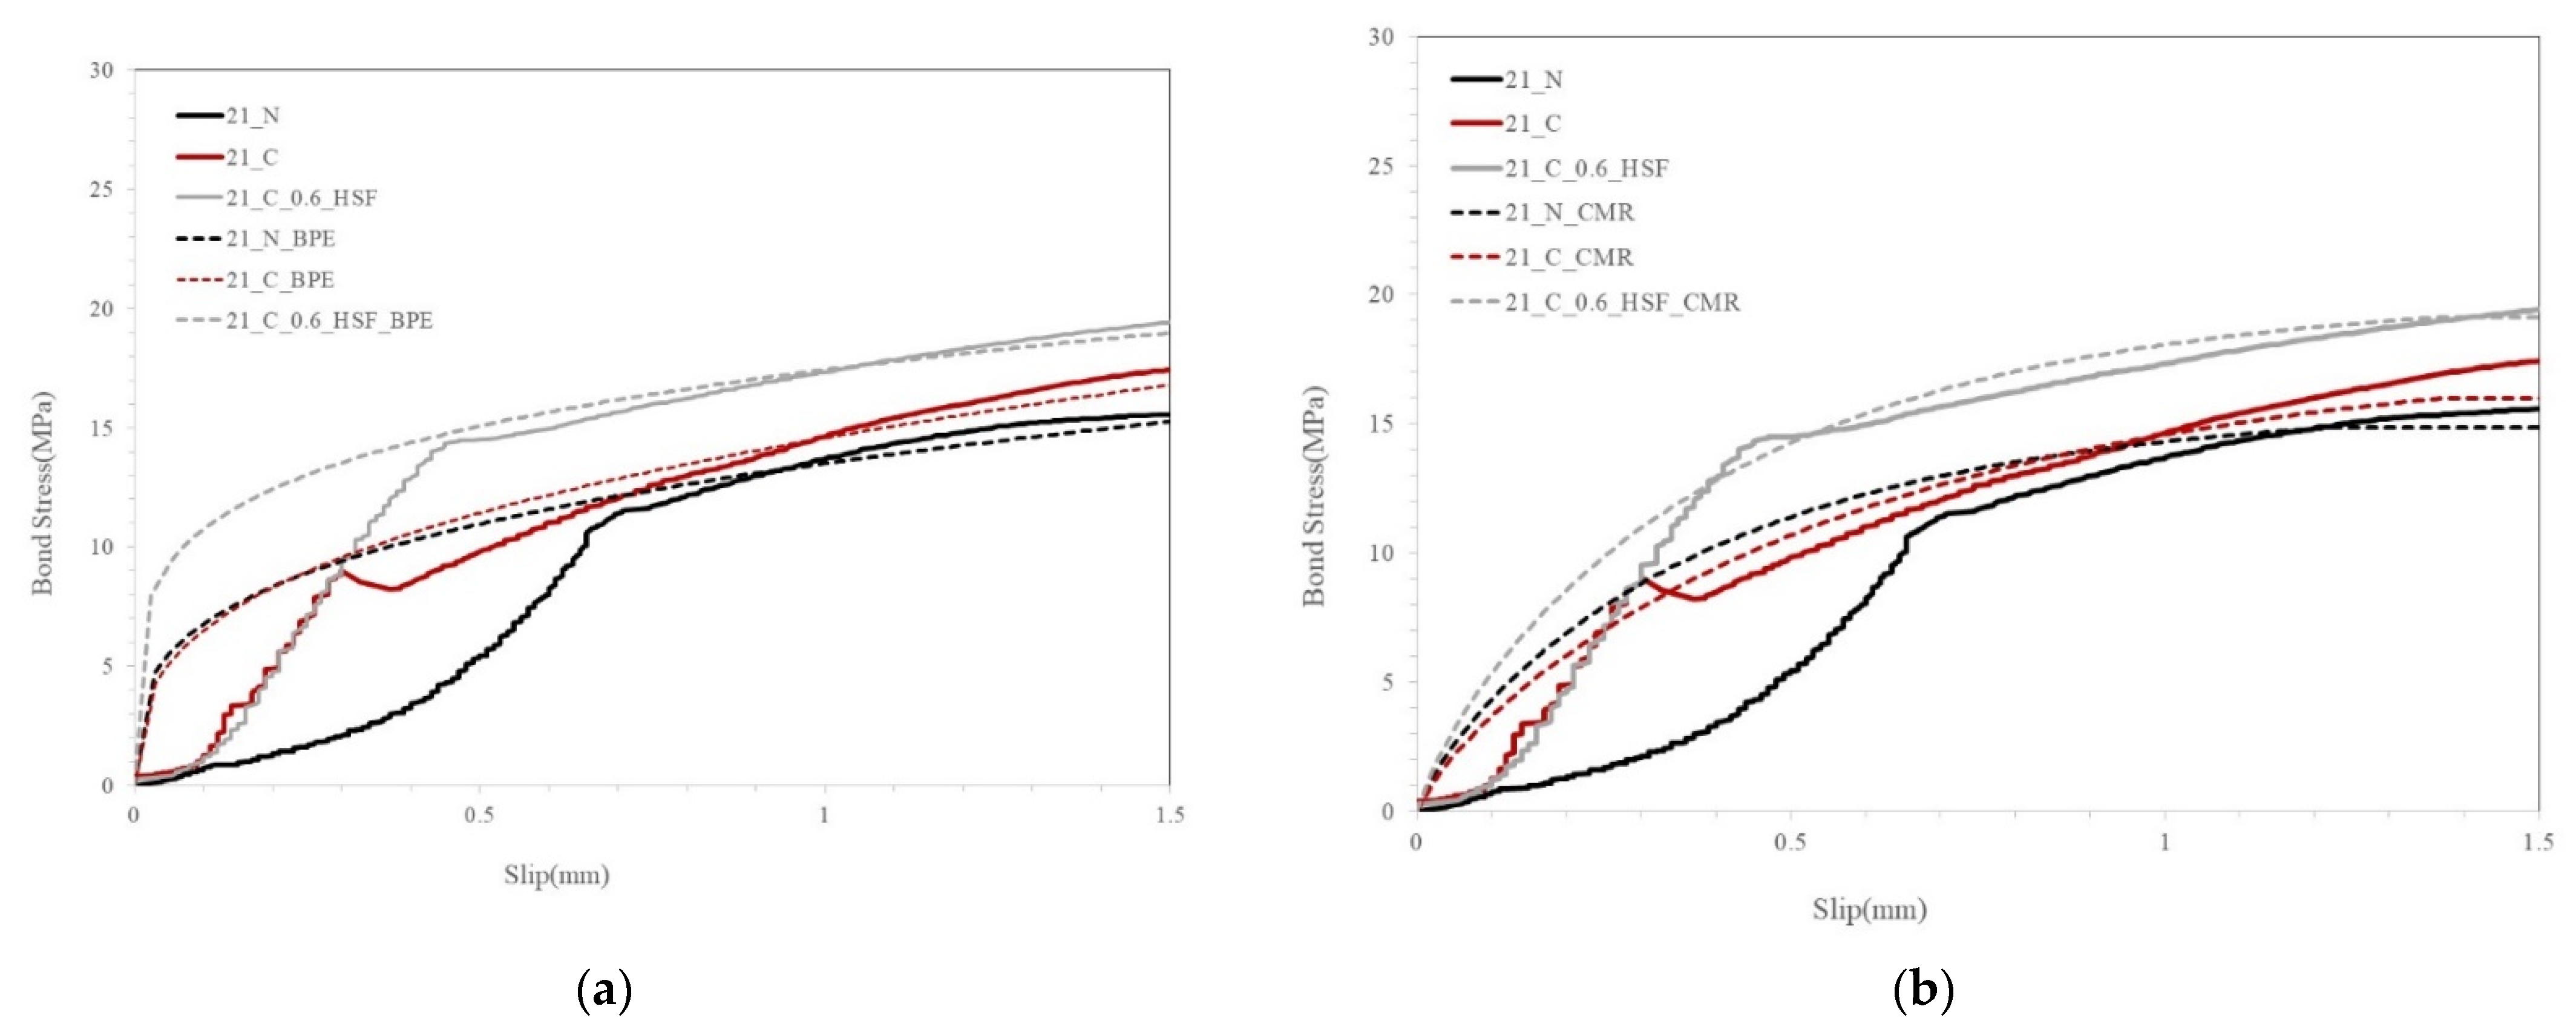
3.4.2. Predicting Bond Stress–Slip Behavior
4. Conclusions
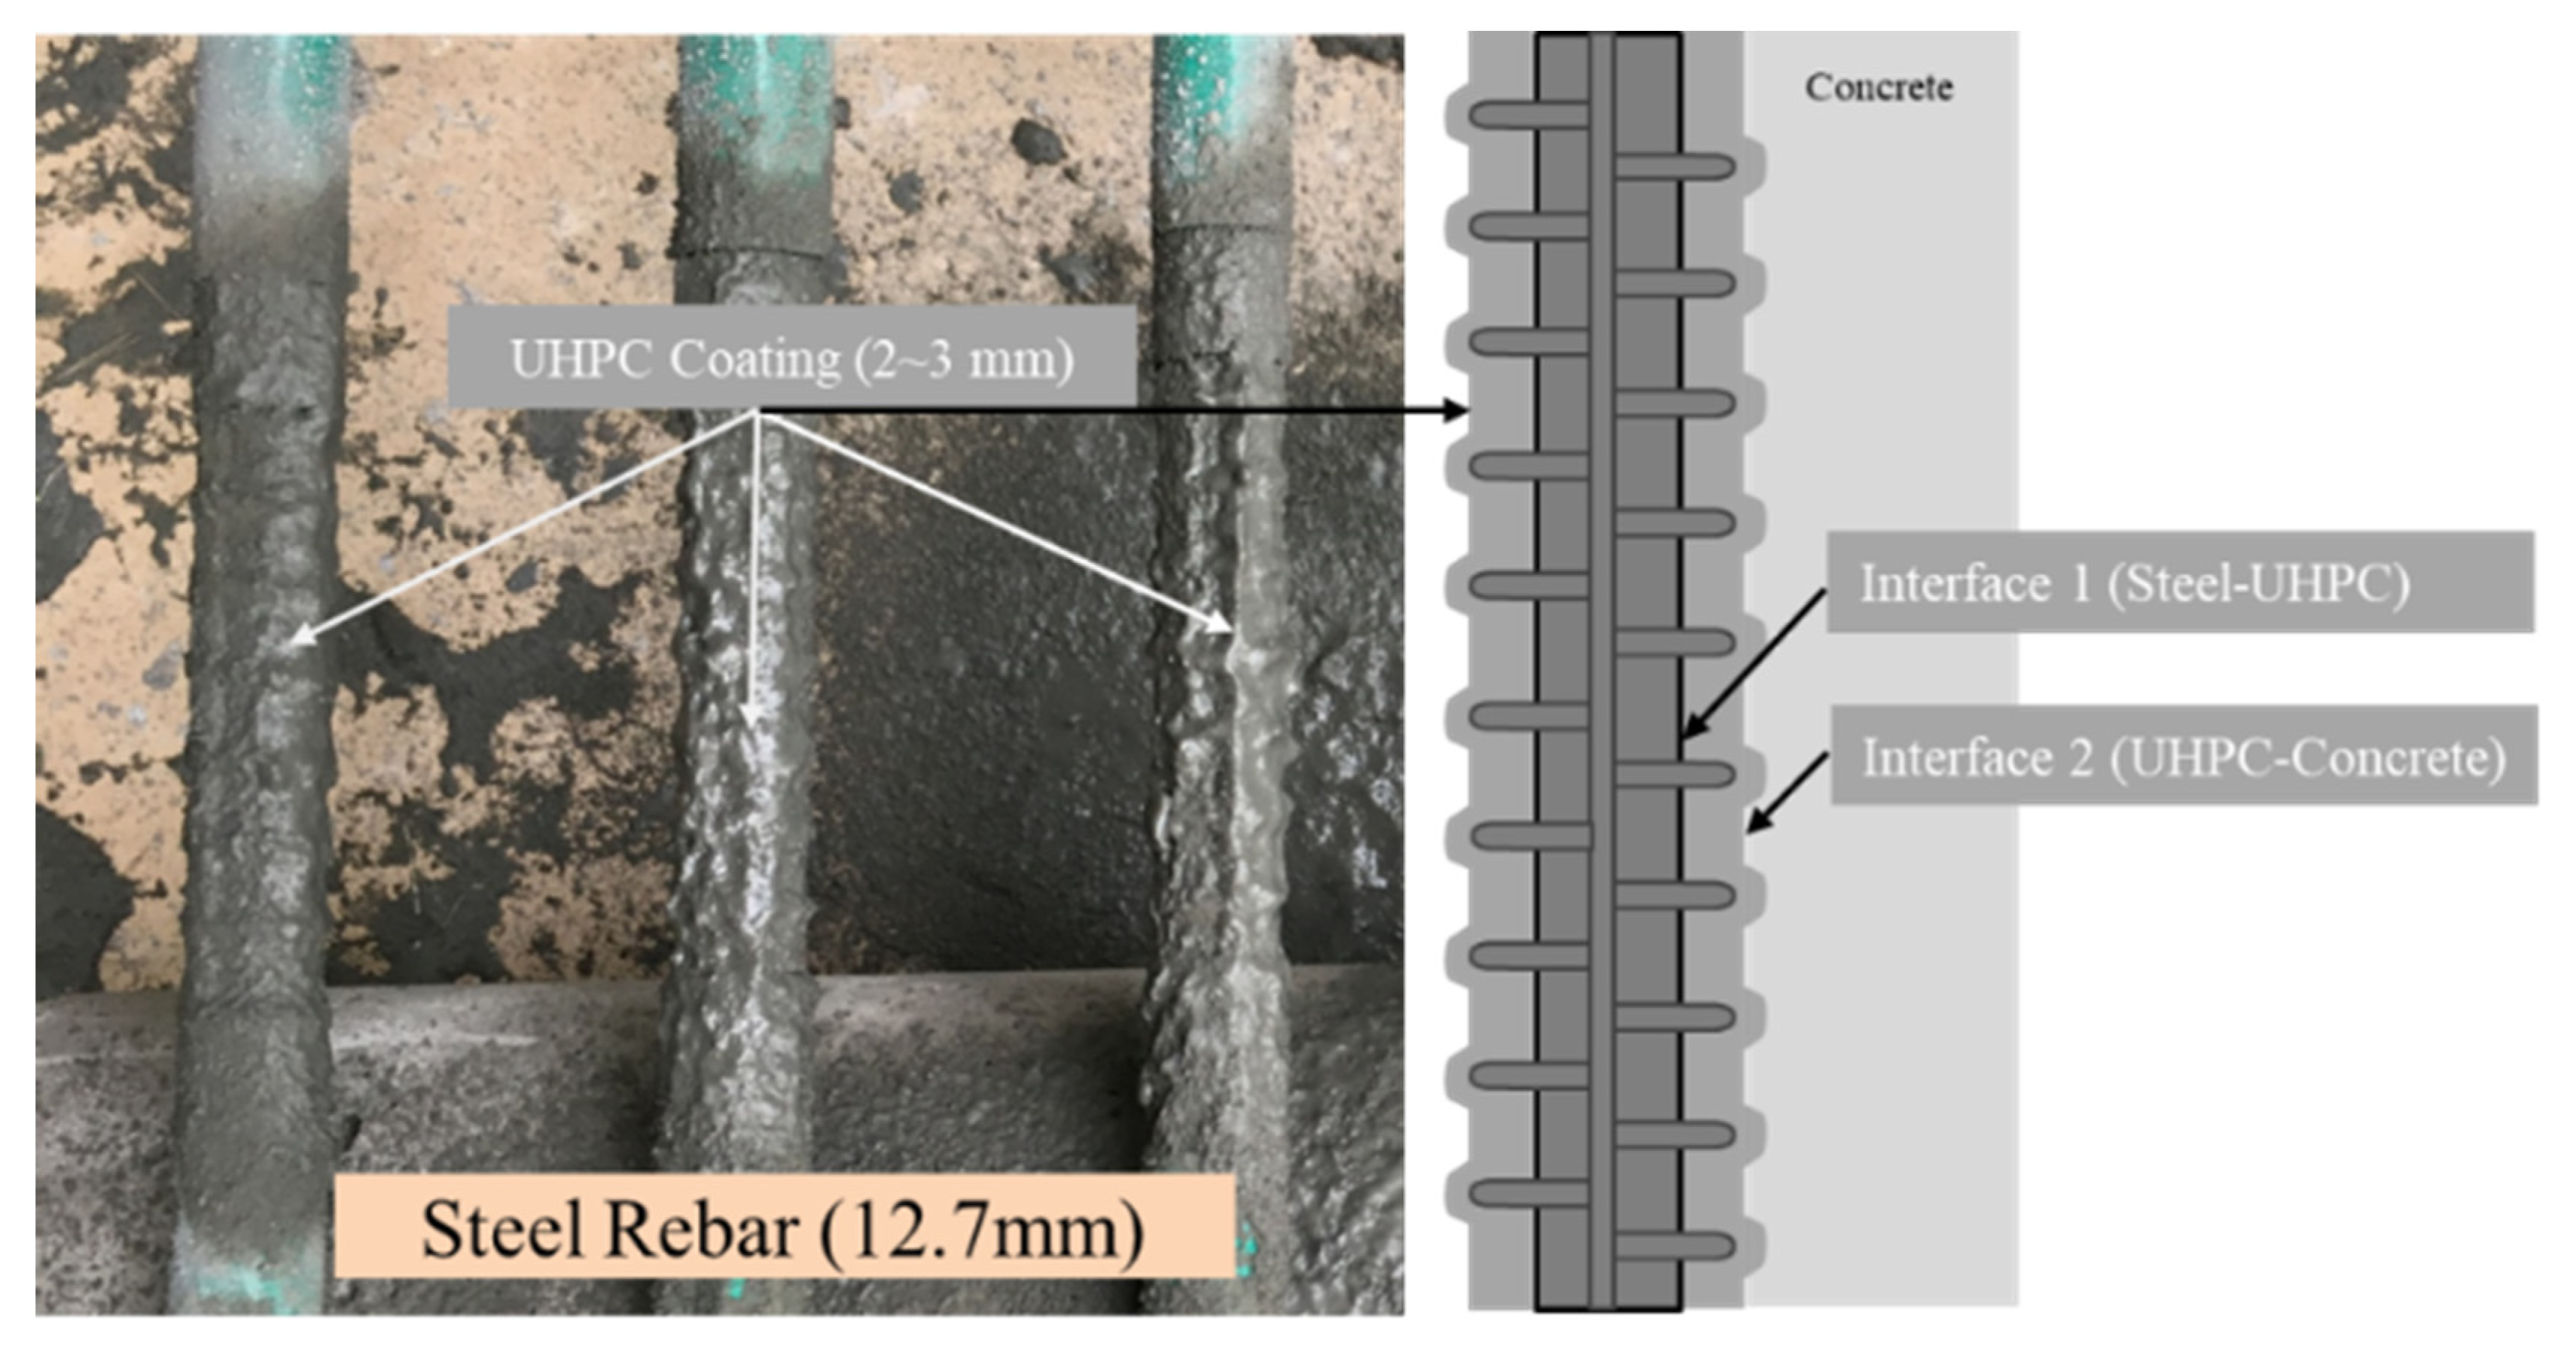
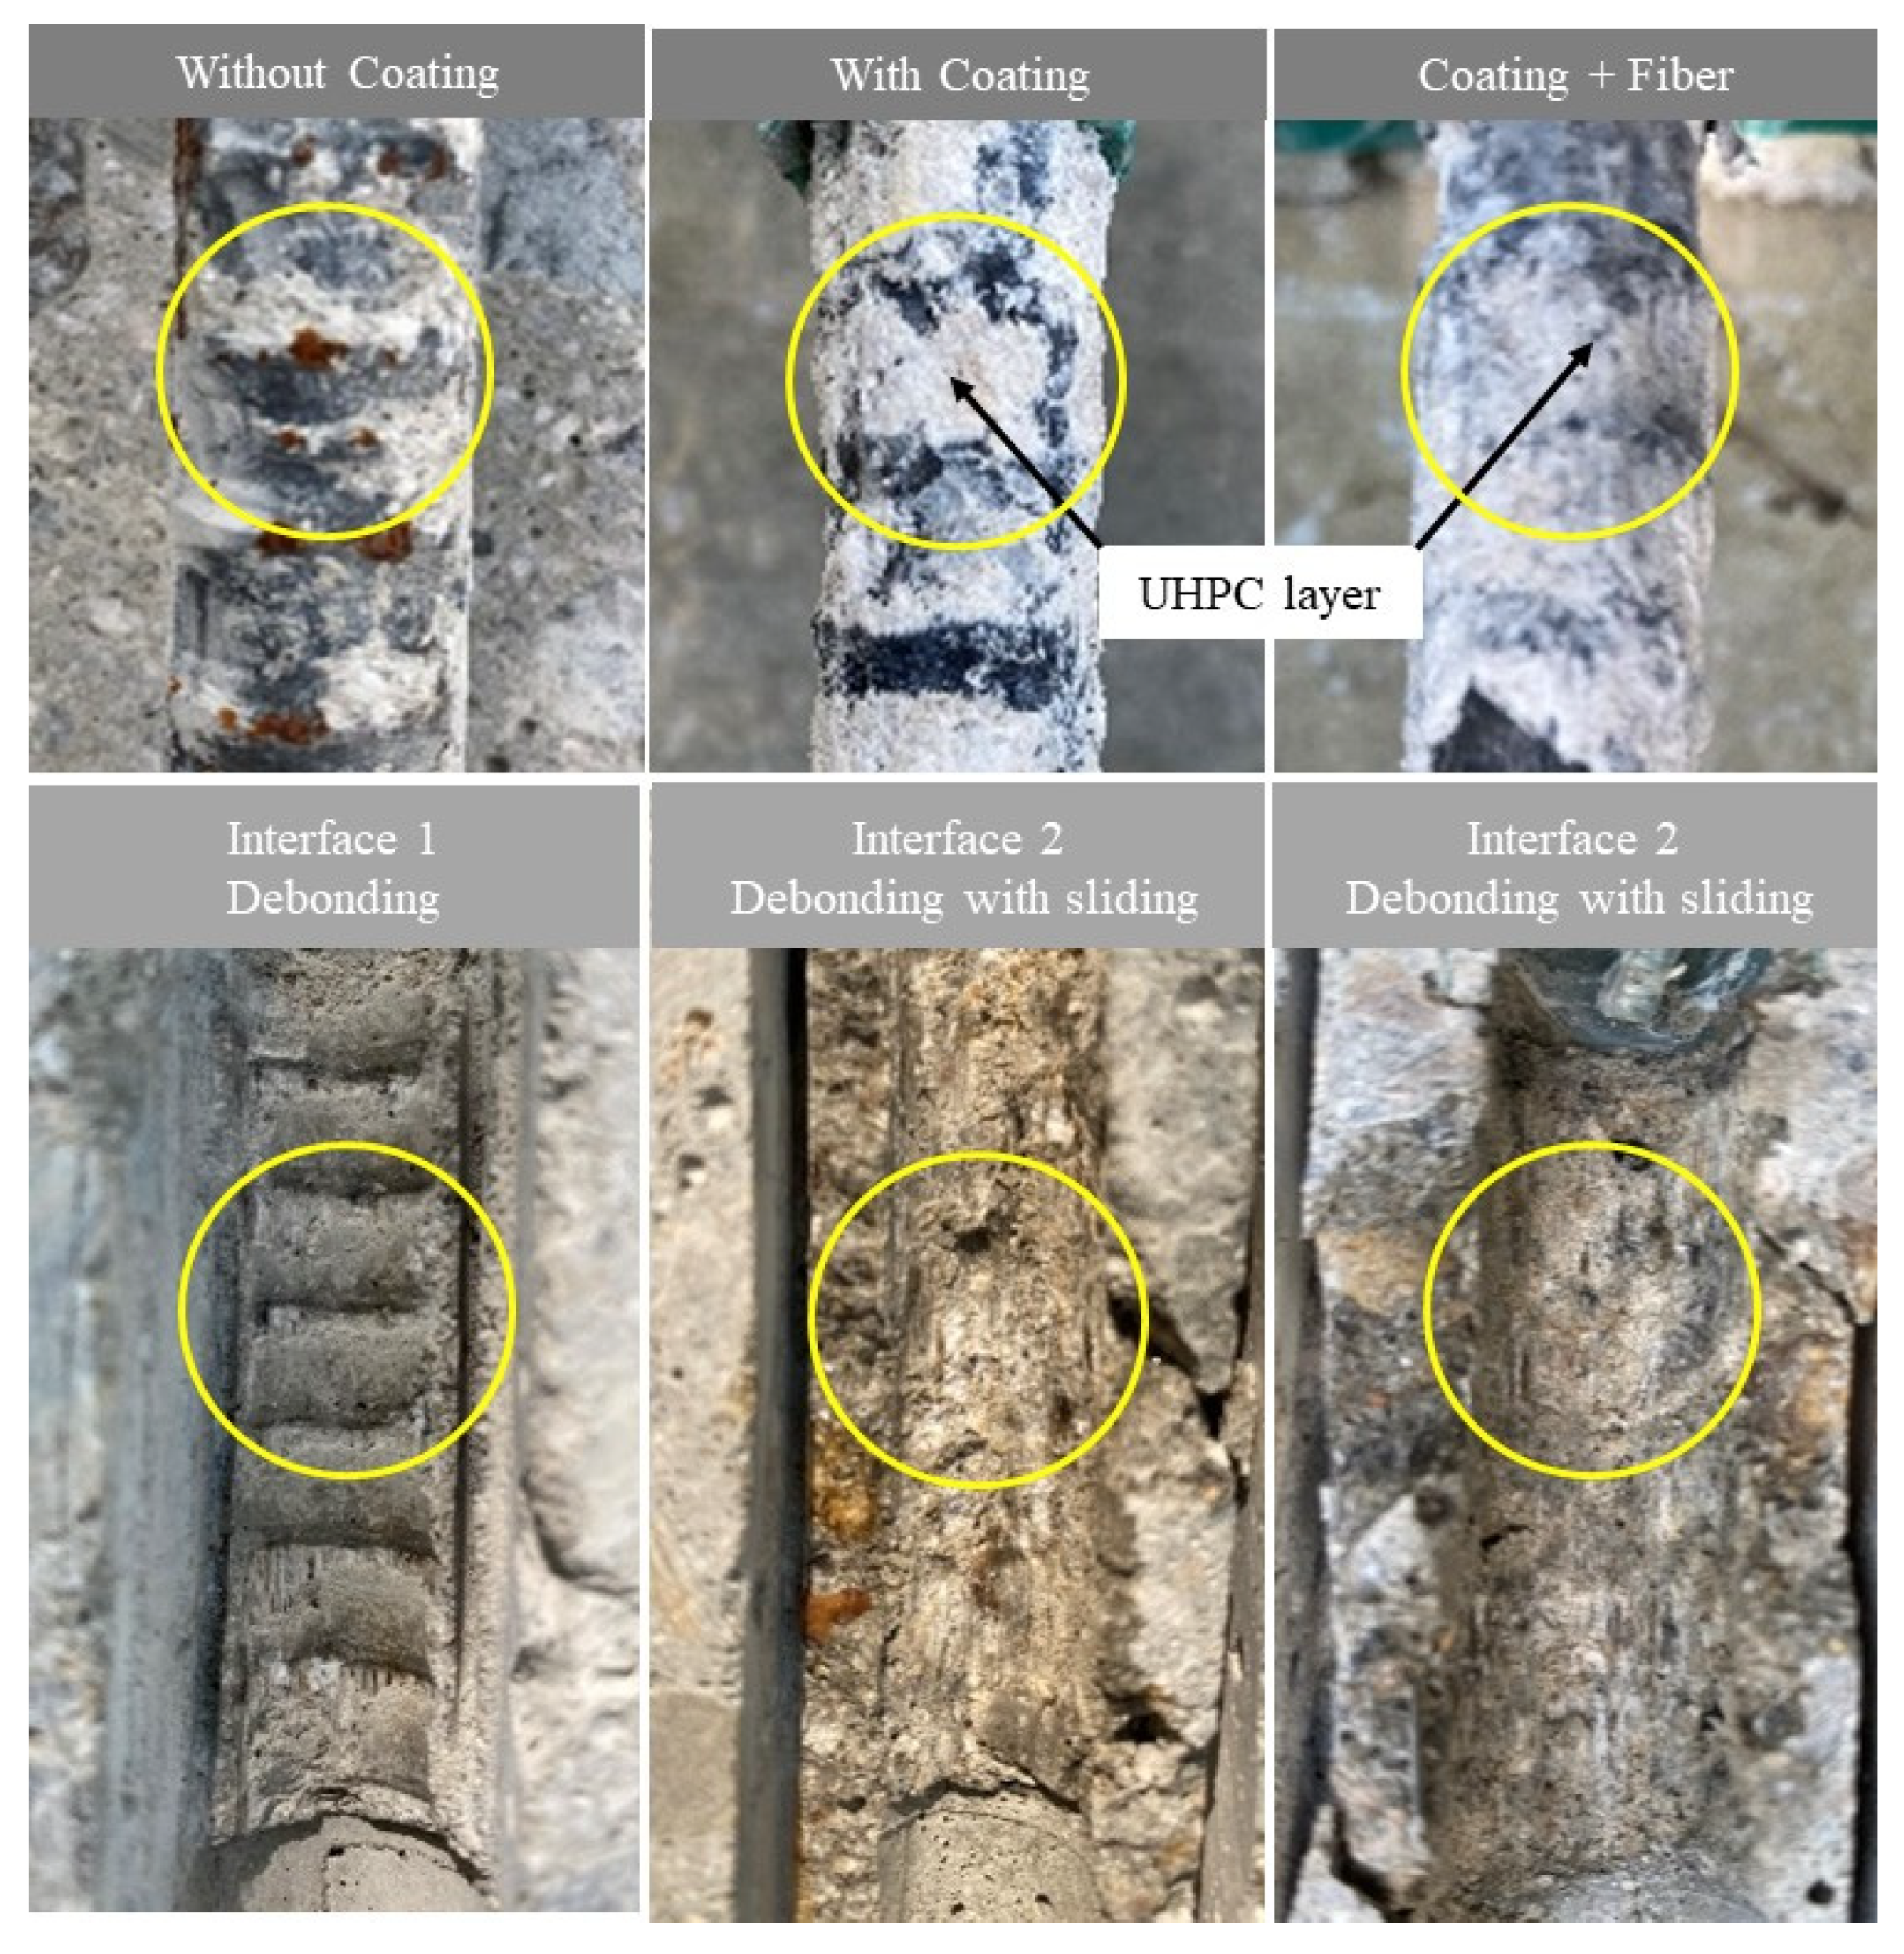
- The thin layer of UHPC coating on the surface was strongly attached to the reinforcing bar and bond failure due to slippage was observed at the UHPC-OPC interface (interface 2) by inducing the integral behavior;
- The UHPC-coated reinforcing bar significantly improved the bond strength and pullout performance by forming a new interface, while the addition of steel fibers improved the overall performance of the adhesion–slip behavior. Among the fiber types, the crimped steel fiber had the highest effect on the bond performance;
- The bond failure modes were sensitive to the thin coating of UHPC, creating an additional interface between the steel rebar and concrete matrix. Most of specimens had high residual bond stresses compared to the control specimen. For the 0.8% and 1.0% fiber volumes in both CSF and CSSF specimens, the strain hardening of the steel rebar against the pullout load was created, which delayed the bonding failure mechanism;
- The prediction models were proposed by analyzing existing models (BPE, CMR). The CMR model fitted the ascending branches well compared to the BPE model before the maximum load. After the maximum load, a prediction model for the residual load was proposed by modifying the existing BPE model through a comparison with the experimental data.
Author Contributions
Funding
Institutional Review Board Statement
Informed Consent Statement
Conflicts of Interest
References
- Lee, J.Y. Reinforced Concrete Structure; Donghwa: Paju, Korea, 2011; pp. 20–26. [Google Scholar]
- Mindess, S.; Young, J.F.; Darwin, D. Concrete; Prentice Hall: Hoboken, NJ, USA, 2003; pp. 477–498. [Google Scholar]
- Oh, B.H. Pull-out bond characteristics of reinforced concrete members. Korea Concr. Inst. 1992, 4, 113–121. [Google Scholar]
- Oh, B.H.; Kang, Y.J.; Lee, S.R.; Bang, K.S. An experimental study on the bond characteristics of reinforced concrete structures. Korea Concr. Inst. 1990, 4, 99–107. [Google Scholar]
- Ferguson, P.M.; Thomson, N. Development length of high strength reinforcing bars in bond. ACI J. 1962, 59, 887–923. [Google Scholar]
- Losberg, A.; Olsson, P.A. Bond failure of deformed reinforcing bars based on the longitudinal splitting effect of the bars. ACI J. 1979, 76, 5–19. [Google Scholar]
- Thompson, M.A.; Jirsa, J.O.; Breen, J.E.; Meinheit, D.F. Behavior of multiple lap splices in wide section. ACI J. 1979, 76, 227–248. [Google Scholar]
- Chung, H.W. Epoxy repair of bond in reinforced concrete members. ACI J. 1981, 78, 79–85. [Google Scholar]
- Edwards, A.D.; Yannopoulos, P.J. Local bond stress to slip relationships for hot rolled deformed bars and mild steel plain bars. ACI J. 1979, 76, 405–421. [Google Scholar]
- Yoo, D.-Y.; Kwon, K.-Y.; Park, J.-J.; Yoon, Y.-S. Local bond-slip response of GFRP rebar in ultra-high-performance fiber-reinforced concrete. Compos. Struct. 2015, 120, 53–64. [Google Scholar] [CrossRef]
- Zhou, M.; Lu, W.; Song, J.; Lee, G.C. Application of Ultra-High Performance Concrete in bridge engineering. Constr. Build. Mater. 2018, 186, 1256–1267. [Google Scholar] [CrossRef]
- Xue, J.; Briseghella, B.; Huang, F.; Nuti, C.; Tabatabai, H.; Chen, B. Review of ultra-high performance concrete and its application in bridge engineering. Constr. Build. Mater. 2020, 260, 119844. [Google Scholar] [CrossRef]
- Shi, C.; Wu, Z.; Xiao, J.; Wang, D.; Huang, Z.; Fang, Z. A review on ultra high performance concrete: Part I. Raw materials and mixture design. Constr. Build. Mater. 2015, 101, 741–751. [Google Scholar] [CrossRef]
- Wang, D.; Shi, C.; Wu, Z.; Xiao, J.; Huang, Z.; Fang, Z. A review on ultra high performance concrete: Part II. Hydration, microstructure and properties. Constr. Build. Mater. 2015, 96, 368–377. [Google Scholar] [CrossRef]
- Bae, Y.; Pyo, S. Ultra high performance concrete (UHPC) sleeper: Structural design and performance. Eng. Struct. 2020, 210, 110374. [Google Scholar] [CrossRef]
- Bae, Y.; Pyo, S. Effect of steel fiber content on structural and electrical properties of ultra high performance concrete (UHPC) sleepers. Eng. Struct. 2020, 222, 111131. [Google Scholar] [CrossRef]
- Brühwiler, E.; Denarié, E. Rehabilitation and Strengthening of Concrete Structures Using Ultra-High Performance Fibre Reinforced Concrete. Struct. Eng. Int. 2013, 23, 450–457. [Google Scholar] [CrossRef]
- Yoo, D.-Y.; Lee, J.-H.; Yoon, Y.-S. Effect of fiber content on mechanical and fracture properties of ultra high performance fiber reinforced cementitious composites. Compos. Struct. 2013, 106, 742–753. [Google Scholar] [CrossRef]
- Richard, P.; Cheyrezy, M. Composition of reactive powder concretes. Cem. Concr. Res. 1995, 25, 1501–1511. [Google Scholar] [CrossRef]
- Yoo, D.-Y.; Shin, H.-O.; Yang, J.-M.; Yoon, Y.-S. Material and bond properties of ultra high performance fiber reinforced concrete with micro steel fibers. Compos. Part B Eng. 2014, 58, 122–133. [Google Scholar] [CrossRef]
- De Larrard, F.; Sedran, T. Optimization of ultra-high-performance concrete by the use of a packing model. Cem. Concr. Res. 1994, 24, 997–1009. [Google Scholar] [CrossRef]
- Meng, W.; Khayat, K.H. Mechanical properties of ultra-high-performance concrete enhanced with graphite nanoplatelets and carbon nanofibers. Compos. Part B Eng. 2016, 107, 113–122. [Google Scholar] [CrossRef]
- Habel, K.; Viviani, M.; Denarié, E.; Brühwiler, E. Development of the mechanical properties of an Ultra-High Performance Fiber Reinforced Concrete (UHPFRC). Cem. Concr. Res. 2006, 36, 1362–1370. [Google Scholar] [CrossRef]
- Yu, R.; Spiesz, P.; Brouwers, H.J.H. Mix design and properties assessment of Ultra-High Performance Fibre Reinforced Concrete (UHPFRC). Cem. Concr. Res. 2014, 56, 29–39. [Google Scholar] [CrossRef]
- Schröfl, C.; Gruber, M.; Plank, J. Preferential adsorption of polycarboxylate superplasticizers on cement and silica fume in ultra-high performance concrete (UHPC). Cem. Concr. Res. 2012, 42, 1401–1408. [Google Scholar] [CrossRef]
- Dingqiang, F.; Yu, R.; Kangning, L.; Junhui, T.; Zhonghe, S.; Chunfeng, W.; Shuo, W.; Zhenfeng, G.; Zhengdong, H.; Qiqi, S. Optimized design of steel fibres reinforced ultra-high performance concrete (UHPC) composites: Towards to dense structure and efficient fibre application. Constr. Build. Mater. 2020, 273, 121698. [Google Scholar] [CrossRef]
- Naaman, A.E.; Reinhardt, H.W. Proposed classification of HPFRC composites based on their tensile response. Mater. Struct. 2006, 39, 547–555. [Google Scholar] [CrossRef]
- Jungwirth, J.; Muttoni, A. Structural behavior of tension members in UHPC. In Proceedings of the International Symposium on Ultra High Performance Concrete; Springer: Kassel, Germany, 2004; pp. 533–544. [Google Scholar]
- Yang, I.H.; Joh, C.; Kim, B.-S. Structural behavior of ultra high performance concrete beams subjected to bending. Eng. Struct. 2010, 32, 3478–3487. [Google Scholar] [CrossRef]
- Graybeal, B.A. Flexural Behavior of an Ultrahigh-Performance Concrete I-Girder. J. Bridg. Eng. 2008, 13, 602–610. [Google Scholar] [CrossRef]
- Branson, A.K. Precast Bridge Deck Joints Using FRP and Ultra-High Performance Concrete. Master’s Thesis, The University of Western Ontario, London, ON, Canada, 2013; pp. 1–132. [Google Scholar]
- Kim, B.; Lee, J.Y. Polyvinyl alcohol engineered cementitious composite (PVA-ECC) for the interfacial bond behavior of glass fibre reinforced polymer bars (GFRP). Polym. Polym. Compos. 2012, 20, 545–557. [Google Scholar]
- Lee, J.; Yi, C.; Kim, B.; Cheong, Y. Bond degradation of glass fibre reinforced plastic bars in concrete subjected to tensile cyclic loads. J. Reinf. Plast. Compos. 2013, 32, 463–475. [Google Scholar] [CrossRef]
- Lee, J.Y.; Yi, C.K.; Cheong, Y.G.; Kim, B.I. Bond stress–slip behaviour of two common GFRP rebar types with pullout failure. Mag. Concr. Res. 2012, 64, 575–591. [Google Scholar] [CrossRef]
- Kim, B.; Lee, J.-Y. Resistance of interfacial debonding failure of GFRP bars embedded in concrete reinforced with structural fibers under cycling loads. Compos. Part B Eng. 2018, 156, 201–211. [Google Scholar] [CrossRef]
- Yoo, D.-Y.; Park, J.-J.; Kim, S.-W.; Yoon, Y.-S. Influence of reinforcing bar type on autogenous shrinkage stress and bond behavior of ultra high performance fiber reinforced concrete. Cem. Concr. Compos. 2014, 48, 150–161. [Google Scholar] [CrossRef]
- Ametrano, D. Bond Characteristics of Glass Fibre Reinforced Polymer Bars Embedded in High Performance and Ultra-High Performance Concrete. Master’s Thesis, Ryerson University, Toronto, ON, Canada, 2011; pp. 1–132. [Google Scholar]
- Hossain, K.M.; Ametrano, D.; Mak, C.; Lachemi, M. Bond Strength and Development Length of GFRP Bars in Ultra-High Performance Concrete; Materials Engineering and Research Office Report; Ontario Ministry of Transportation: Toronto, ON, Canada, 2011; pp. 1–96. [Google Scholar]
- Alavi-Fard, M.; Marzouk, H. Bond behavior of high strength concrete under reversed pull-out cyclic loading. Can. J. Civ. Eng. 2002, 29, 191–200. [Google Scholar] [CrossRef]
- Baean, M.; Torres, L.; Turon, A.; Barris, C. Experrimental study of bond behavior between concrete and FRP bars using a pull-out test. Compos. Part B 2009, 40, 784–797. [Google Scholar] [CrossRef]
- Lee, J.-Y.; Kim, T.-Y.; Yi, C.-K.; Park, J.-S.; You, Y.-C.; Park, Y.-H. Interfacial bond strength of glass fiber reinforced polymer bars in high-strength concrete. Compos. Part B Eng. 2008, 39, 258–270. [Google Scholar] [CrossRef]
- CEM Bulletins. CEB-FIP Model Code for Concrete Structures; Comite Euro International du Beton: Lausanne, Switzerland, 1993. [Google Scholar]
- ACI Committee. Bond and Development of Straight Reinforcing Bars in Tension; ACI 408R-03; American Concrete Institute: Detroit, MI, USA, 2003. [Google Scholar]
- Eligehusen, R.; Popve, E.P.; Bertero, V.V. Local Bond Stress-Slip Relationships of Deformed Bars under Generalized Excitations; University of California: Berkeley, CA, USA, 1982. [Google Scholar]
- Cosenza, E.; Manfredi, G.; Realfonzo, R. Analytical modelling of bond between FRP reinforcing bars and concrete. In Proceedings of the Second International RILEM Symposium (FRPRCS-2); Taerwe, L., Ed.; E. and F.N. Spon: London, UK, 1995; pp. 164–171. [Google Scholar]


| Specimen | W/C (%) | Unit Weight (kg/m3) | ||||||
|---|---|---|---|---|---|---|---|---|
| Water | Cement | Silica Fume | Silica Sand | Filler | Super Plasticizer | Anti-Foamer | ||
| UHPC | 30 | 235 | 784 | 196 | 862 | 235 | 47.0 | 2.35 |
| Variables | Hooked Steel Fiber (HSF) | Crimped Steel Fiber (CSF) | Crimped Stainless Steel Fiber (CSSF) | Polyvinyl Alcohol Fiber (PVA) |
|---|---|---|---|---|
| Length (mm) | 35 | 35 | 35 | 8 |
| Diameter (mm) | 0.5 | 0.5 | 0.5 | 40 (μm) |
| Aspect Ratio (L/D) | 70 | 70 | 70 | - |
| Surface Structure | Hooked-end | Crimped | Crimped stainless | Resin-bundled chopped |
| Density (g/cm3) | 7.8 | 7.8 | 7.8 | 1.3 |
| Tensile strength (MPa) | 1300 | 2900 | 1950 | 1300 |
| Shape | 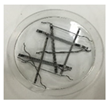 | 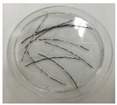 | 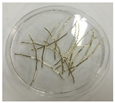 | 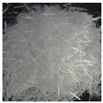 |
| Mix Type | Cement (kg/m3) | Water (kg/m3) | Sand (kg/m3) | Coarse Aggregate (kg/m3) | Blast Furnace Slag (kg/m3) | Fly Ash (kg/m3) | Fiber Content (kg/m3) | Super-plasticizer (kg/m3) |
|---|---|---|---|---|---|---|---|---|
| 21-N (OPC) | 239 | 164 | 922 | 928 | 30 | 30 | - | 1.79 |
| Steel-1 (PVA0) | 580 | 255 | 580 | - | - | 580 | 0 | 6.96 |
| Steel-2 (PVA1) | 580 | 255 | 580 | - | - | 580 | 13 | 6.96 |
| Steel-3 (PVA2) | 580 | 255 | 580 | - | - | 580 | 26 | 11.6 |
| 21-C-0.2-SF | 239 | 164 | 922 | 928 | 30 | 30 | 0.31 | 1.79 |
| 21-C-0.4-SF | 239 | 164 | 922 | 928 | 30 | 30 | 0.63 | 1.79 |
| 21-C-0.6-SF | 239 | 164 | 922 | 928 | 30 | 30 | 0.94 | 1.79 |
| 21-C-0.8-SF | 239 | 164 | 922 | 928 | 30 | 30 | 1.26 | 1.79 |
| 21-C-1.0-SF | 239 | 164 | 922 | 928 | 30 | 30 | 1.57 | 1.79 |
| Mix Type | Fiber Volume Fraction, Vf (%) | Specimen Name for Pullout Test |
|---|---|---|
| 21-N (OPC) | None | 21-N |
| Steel-1 (PVA0) | None | PVA 0% |
| Steel-2 (PVA1) | 1% | PVA 1% |
| Steel-3 (PVA2) | 2% | PVA 2% |
| 21-C(UHPC coating) | None | 21-C |
| 21-C-SF-A | 0, 0.2, 0.4, 0.6, 0.8, 1.0 | 21-C-Vf-HSF |
| 21-C-SF-B | 0, 0.2, 0.4, 0.6, 0.8, 1.0 | 21-C-Vf-CSF |
| 21-C-SF-C | 0, 0.2, 0.4, 0.6, 0.8, 1.0 | 21-C-Vf-CSSF |
| Specimen | Pmax (kN) | τmax (MPa) | τmax-mean (MPa) | Sm (mm) | Sm-mean (mm) | τ*max (MPa) | Failure Mode |
|---|---|---|---|---|---|---|---|
| 21-N-1 | 39.71 | 15.68 | 15.40 | 1.64 | 1.63 | 3.26 | PO |
| 21-N-2 | 38.30 | 15.12 | 1.62 | 3.14 | PO | ||
| 21-C-1 | 45.24 | 17.87 | 17.76 | 1.79 | 1.74 | 3.71 | PO |
| 21-C-2 | 44.70 | 17.65 | 1.68 | 3.66 | PO | ||
| PVA0S1 ** | 69.64 | 27.50 | 0.50 | 3.55 | PO | ||
| PVA0S2 ** | 70.40 | 27.80 | 27.27 | 0.80 | 0.60 | 3.59 | PO |
| PVA0S3 ** | 67.10 | 26.50 | 0.50 | 3.42 | PO | ||
| PVA1S1 ** | 71.16 | 28.10 | 1.30 | 3.59 | PO | ||
| PVA1S2 ** | 73.18 | 28.90 | 28.80 | 1.00 | 1.20 | 3.70 | PO |
| PVA1S3 ** | 74.45 | 29.40 | 1.30 | 3.76 | PO | ||
| PVA2S1 ** | 77.74 | 30.70 | 1.50 | 4.03 | PO | ||
| PVA2S1 ** | 76.47 | 30.20 | 30.73 | 1.60 | 1.10 | 3.97 | PO |
| PVA2S1 ** | 79.26 | 31.30 | 1.20 | 4.10 | PO | ||
| 21-C-0.2-HSF-1 | 46.39 | 18.32 | 18.56 | 2.27 | 2.22 | 3.80 | PO |
| 21-C-0.2-HSF-2 | 47.60 | 18.80 | 2.16 | 3.90 | PO | ||
| 21-C-0.4-HSF-1 | 49.54 | 19.56 | 19.44 | 1.44 | 1.41 | 4.06 | PO |
| 21-C-0.4-HSF-2 | 48.90 | 19.31 | 1.38 | 4.01 | PO | ||
| 21-C-0.6-HSF-1 | 50.63 | 20.00 | 20.15 | 1.92 | 1.86 | 4.15 | PO |
| 21-C-0.6-HSF-2 | 51.40 | 20.30 | 1.80 | 4.21 | PO | ||
| 21-C-0.8-HSF-1 | 52.86 | 20.88 | 20.75 | 1.52 | 1.49 | 4.33 | PO |
| 21-C-0.8-HSF-2 | 52.20 | 20.61 | 1.47 | 4.28 | PO | ||
| 21-C-1.0-HSF-1 | 53.33 | 21.06 | 21.11 | 1.81 | 1.80 | 4.37 | PO |
| 21-C-1.0-HSF-2 | 53.60 | 21.17 | 1.78 | 4.40 | PO | ||
| 21-C-0.2-CSF-1 | 49.77 | 19.65 | 19.78 | 1.43 | 1.44 | 4.08 | PO |
| 21-C-0.2-CSF-2 | 50.40 | 19.90 | 1.45 | 4.13 | PO | ||
| 21-C-0.4-CSF-1 | 51.96 | 20.52 | 20.84 | 1.15 | 1.17 | 4.26 | PO |
| 21-C-0.4-CSF-2 | 53.60 | 21.17 | 1.18 | 4.40 | PO | ||
| 21-C-0.6-CSF-1 | 58.54 | 23.12 | 22.89 | 1.75 | 1.80 | 4.80 | PO |
| 21-C-0.6-CSF-2 | 57.40 | 22.67 | 1.84 | 4.71 | PO | ||
| 21-C-0.8-CSF-1 | 57.38 | 22.66 | 22.90 | 0.81 | 0.80 | 4.70 | SY |
| 21-C-0.8-CSF-2 | 58.60 | 23.14 | 0.79 | 4.80 | SY | ||
| 21-C-1.0-CSF-1 | 62.39 | 24.64 | 24.86 | 0.87 | 0.88 | 5.12 | SY |
| 21-C-1.0-CSF-2 | 63.50 | 25.08 | 0.90 | 5.21 | SY | ||
| 21-C-0.2-CSSF-1 | 46.70 | 18.44 | 18.66 | 0.53 | 0.52 | 3.83 | PO |
| 21-C-0.2-CSSF-2 | 47.80 | 18.88 | 0.51 | 3.92 | PO | ||
| 21-C-0.4-CSSF-1 | 51.86 | 20.48 | 20.72 | 1.18 | 1.20 | 4.25 | PO |
| 21-C-0.4-CSSF-2 | 53.10 | 20.97 | 1.23 | 4.35 | PO | ||
| 21-C-0.6-CSSF-1 | 54.46 | 21.51 | 21.77 | 1.83 | 1.88 | 4.47 | PO |
| 21-C-0.6-CSSF-2 | 55.80 | 22.04 | 1.92 | 4.58 | PO | ||
| 21-C-0.8-CSSF-1 | 58.98 | 23.29 | 23.02 | 1.23 | 1.20 | 4.84 | SY |
| 21-C-0.8-CSSF-2 | 57.60 | 22.75 | 1.18 | 4.72 | SY | ||
| 21-C-1.0-CSSF-1 | 58.27 | 23.01 | 23.19 | 0.70 | 0.72 | 4.78 | SY |
| 21-C-1.0-CSSF-2 | 59.20 | 23.38 | 0.73 | 4.85 | SY |
| Specimen | τmax (MPa) | Sm (mm) | BPE | CMR | |
|---|---|---|---|---|---|
| α | β | Sr | |||
| 21-N | 15.40 | 1.63 | 0.30 | 0.80 | 0.45 |
| 21-C | 17.76 | 1.74 | 0.35 | 0.80 | 0.67 |
| 21-C-0.2-HSF | 18.56 | 2.22 | 0.33 | 0.80 | 0.65 |
| 21-C-0.4-HSF | 19.44 | 1.41 | 0.25 | 0.80 | 0.50 |
| 21-C-0.6-HSF | 20.15 | 1.86 | 0.21 | 0.80 | 0.47 |
| 21-C-0.8-HSF | 20.75 | 1.49 | 0.20 | 0.80 | 0.43 |
| 21-C-1.0-HSF | 21.11 | 1.80 | 0.18 | 0.80 | 0.41 |
| 21-C-0.2-CSF | 19.78 | 1.44 | 0.28 | 0.80 | 0.52 |
| 21-C-0.4-CSF | 20.84 | 1.17 | 0.22 | 0.80 | 0.25 |
| 21-C-0.6-CSF | 22.89 | 1.80 | 0.27 | 0.80 | 0.55 |
| 21-C-0.8-CSF | 22.90 | 0.80 | 0.06 | 0.80 | 0.22 |
| 21-C-1.0-CSF | 24.86 | 0.88 | 0.09 | 0.80 | 0.42 |
| 21-C-0.2-CSSF | 18.66 | 0.52 | 0.30 | 0.80 | 0.33 |
| 21-C-0.4-CSSF | 20.72 | 1.20 | 0.28 | 0.80 | 0.30 |
| 21-C-0.6-CSSF | 21.77 | 1.88 | 0.25 | 0.80 | 0.28 |
| 21-C-0.8-CSSF | 23.02 | 1.20 | 0.23 | 0.80 | 0.25 |
| 21-C-1.0-CSSF | 23.19 | 0.72 | 0.15 | 0.80 | 0.16 |
| Specimen | 0.95τmax (MPa) | S1 | S2 | Kd (MPa/mm) | τr (MPa) |
|---|---|---|---|---|---|
| 21-N | 14.10 | 1.22 | 2.07 | 3.20 | 4.94 |
| 21-C | 16.96 | 1.37 | 2.52 | 3.91 | 5.81 |
| 21-C-0.2-HSF | 17.40 | 1.65 | 2.78 | 2.78 | 6.30 |
| 21-C-0.4-HSF | 18.59 | 0.93 | 1.90 | 5.12 | 6.26 |
| 21-C-0.6-HSF | 19.00 | 1.37 | 2.59 | 3.74 | 7.11 |
| 21-C-0.8-HSF | 19.83 | 1.22 | 2.01 | 4.97 | 7.21 |
| 21-C-1.0-HSF | 20.01 | 1.25 | 2.34 | 3.96 | 7.76 |
| 21-C-0.2-CSF | 18.67 | 0.92 | 1.85 | 5.10 | 6.27 |
| 21-C-0.4-CSF | 19.49 | 0.82 | 1.81 | 7.65 | 7.02 |
| 21-C-0.6-CSF | 21.96 | 1.02 | 2.32 | 5.01 | 7.26 |
| 21-C-0.8-CSF | 21.53 | 1.15 | 3.64 | 3.96 | 9.80 |
| 21-C-1.0-CSF | 23.67 | 0.73 | 5.70 | 4.81 | 7.34 |
| 21-C-0.2-CSSF | 17.52 | 1.00 | 2.18 | 8.13 | 9.97 |
| 21-C-0.4-CSSF | 19.46 | 0.67 | 1.63 | 3.80 | 12.17 |
| 21-C-0.6-CSSF | 20.43 | 1.19 | 2.43 | 2.91 | 8.19 |
| 21-C-0.8-CSSF | 22.13 | 0.70 | 2.05 | 4.08 | 13.86 |
| 21-C-1.0-CSSF | 21.86 | 0.78 | 4.87 | 2.02 | 12.48 |
Publisher’s Note: MDPI stays neutral with regard to jurisdictional claims in published maps and institutional affiliations. |
© 2022 by the authors. Licensee MDPI, Basel, Switzerland. This article is an open access article distributed under the terms and conditions of the Creative Commons Attribution (CC BY) license (https://creativecommons.org/licenses/by/4.0/).
Share and Cite
Eom, I.-H.; Oh, S.-K.; Kim, B. Bonding Performance of Steel Rebar Coated with Ultra-High-Performance Concrete. Appl. Sci. 2022, 12, 6808. https://doi.org/10.3390/app12136808
Eom I-H, Oh S-K, Kim B. Bonding Performance of Steel Rebar Coated with Ultra-High-Performance Concrete. Applied Sciences. 2022; 12(13):6808. https://doi.org/10.3390/app12136808
Chicago/Turabian StyleEom, In-Hyeok, Sang-Keun Oh, and Byoungil Kim. 2022. "Bonding Performance of Steel Rebar Coated with Ultra-High-Performance Concrete" Applied Sciences 12, no. 13: 6808. https://doi.org/10.3390/app12136808
APA StyleEom, I.-H., Oh, S.-K., & Kim, B. (2022). Bonding Performance of Steel Rebar Coated with Ultra-High-Performance Concrete. Applied Sciences, 12(13), 6808. https://doi.org/10.3390/app12136808