Article

Efficiency of Pulsating Base Bleeding to Control Trailing Edge Flow Configurations

by
Carlos Carbajosa
1,
Alejandro Martinez-Cava
2,*,
Eusebio Valero
1,3 and
Guillermo Paniagua
3
1
Center of Computational Simulation, Universidad Politécnica de Madrid, Plaza Cardenal Cisneros 3, E-28040 Madrid, Spain
2
Instituto Universitario de Microgravedad “Ignacio da Riva”, Universidad Politécnica de Madrid (IDR/UPM), E-28223 Madrid, Spain
3
Maurice J. Zucrow Laboratories, Purdue University, 500 Allison Road, West Lafayette, IN 47907-2014, USA
*
Author to whom correspondence should be addressed.
Appl. Sci. 2022, 12(13), 6760; https://doi.org/10.3390/app12136760
Submission received: 31 May 2022 / Revised: 27 June 2022 / Accepted: 28 June 2022 / Published: 4 July 2022
(This article belongs to the Special Issue Flow Control, Active and Passive Applications)

Abstract

:
As high-pressure-turbines operate at extreme temperature conditions, base bleed can be applied at the trailing edge of the airfoils, enhancing the thermal protection along the trailing edge surface, but also disrupting the trailing edge flow and altering the overall aerodynamic pressure losses. The current work explores the potential use of base bleed as a flow control tool to modulate the flow between turbine blade rows. Through the numerical analysis of a symmetric airfoil immersed in a subsonic flow, the effects that trailing edge ejection has on the base region properties and the downstream flow are evaluated. In particular, previous research constrained to steady blowing is now extended to consider an unsteady pulsating base bleed injection. Three injection frequencies are investigated, covering a wide range of base bleed intensities. The results presented herein demonstrate that pulsating bleed flow is more efficient than its steady counterpart in terms of reducing pressure losses and controlling the primary frequency of the downstream oscillations for the same mass flow injection.

1. Introduction

In pursuing higher performance, the architecture of aircraft engines evolves towards lighter and more compact designs. Compactness can be achieved using counter-rotating subsonic turbines [1], transonic turbines [2], or supersonic turbines with pressure gain combustion [3]; but those configurations normally increase the unsteadiness and flow detachment of the boundary layer downstream of the trailing edge, which significantly contributes to the profile losses [4].
To illustrate the problem, Figure 1 depicts a representative trailing edge flow topology. As the flow approaches the trailing edge, the boundary layers from the pressure and suction sides of the turbine airfoils separate into two alternate shear layers, rolling into vortical structures. Eventually, the two periodic shear layers merge downstream at a confluence point, forming a confined region of low pressure and momentum, known as the base region [5]. The flow structures that form downstream of the turbine blade and their behavior are strongly affected by the base region properties, in particular the intermittent shear layer detachment that generates one or more pairs of vortexes that roll downstream. Both the rear suction side of the airfoil and the trailing edge must be carefully designed as they are prime contributors to aerodynamic drag and a source of forcing to downstream blade rows.
One way of mitigating both the losses and the source of unsteady forcing is to add momentum to this region, disrupting the base pressure, wake, and the downstream vortical pattern [6]. As high-pressure-turbines work in extreme temperatures environments, they require continuous airfoil cooling. In particular, the trailing edge of the airfoils is refrigerated by the redirection of coolant flow constantly ejected through holes or slots. When ejected at the trailing edge, this mass flow may be exploited to control the flow topology of the base region [6,7]. In recent years, the use of trailing edge or base bleed coolant ejection has proven to be effective in the mitigation and modulation of wake flow structures [8,9,10], or, when high velocities are involved, the trailing edge shock wave [11,12,13,14]. Available results in the literature mostly consider a constant mass flow ejection. Towards a more efficient use of this flow actuation, the modulation of the base bleed flow by means of intermittent trailing edge injection instead of a constant mass flow can be considered. This topic was numerically and experimentally covered in the low supersonic regime [15,16,17], with interesting results. While part of the published numerical data suggests that employing intermittent base bleed actuation would not offer significant gains when compared to constant actuation [16], empirical results indicate the contrary. It has been shown that forcing base bleed to actuate by pulses may enhance blade cooling and reduce associated losses, as the modulation of the trailing edge flow could alter the impingement of the trailing edge shock wave on the suction side of downstream blades [17].
However, trailing edge coolant injection may lead to the onset of unintuitive flow configurations. Saracoglu et al. [14] reported for the first time the onset of non-symmetric trailing edge flows when the flow is ejected in symmetric supersonic turbine blade configurations. A hydrodynamic stability analysis of the former configuration performed by Martinez-Cava et al. [18] demonstrated that a global instability may become dominant for specific blowing intensities, eventually breaking the symmetry of the base bleed jet. The flow topology at the base region may yield flow perturbations, whose properties depend on the ejected flow intensity and may tend to grow, eventually introducing a source of asymmetry, developing a Coanda effect produced by local pressure gradients. While this effect was present only at certain base bleed intensities, its link with the vortex detachment could affect the downstream flow structures and the aerodynamic forces developed on the airfoil [19].
The current work further explores the effects of base bleed on subsonic conditions, considering a pulsating coolant flow base ejection to verify if unsteady blowing is more efficient than a continuous and steady trailing edge injection. A large set of numerical flow calculations covering a range of base bleed intensities and injection frequencies is compared against constant blowing conditions at the same maximum flow rate. Wake structure, pressure loss, angle of the jet, and a detailed energy balance are evaluated. Despite having an apparent lower effect on the base region than constant base bleed, notable changes in the ejected jet angle, pressure losses, and measured forces are found when pulsating base bleed is employed, with significant gains on the energy costs required to reduce the aerodynamic pressure drag.

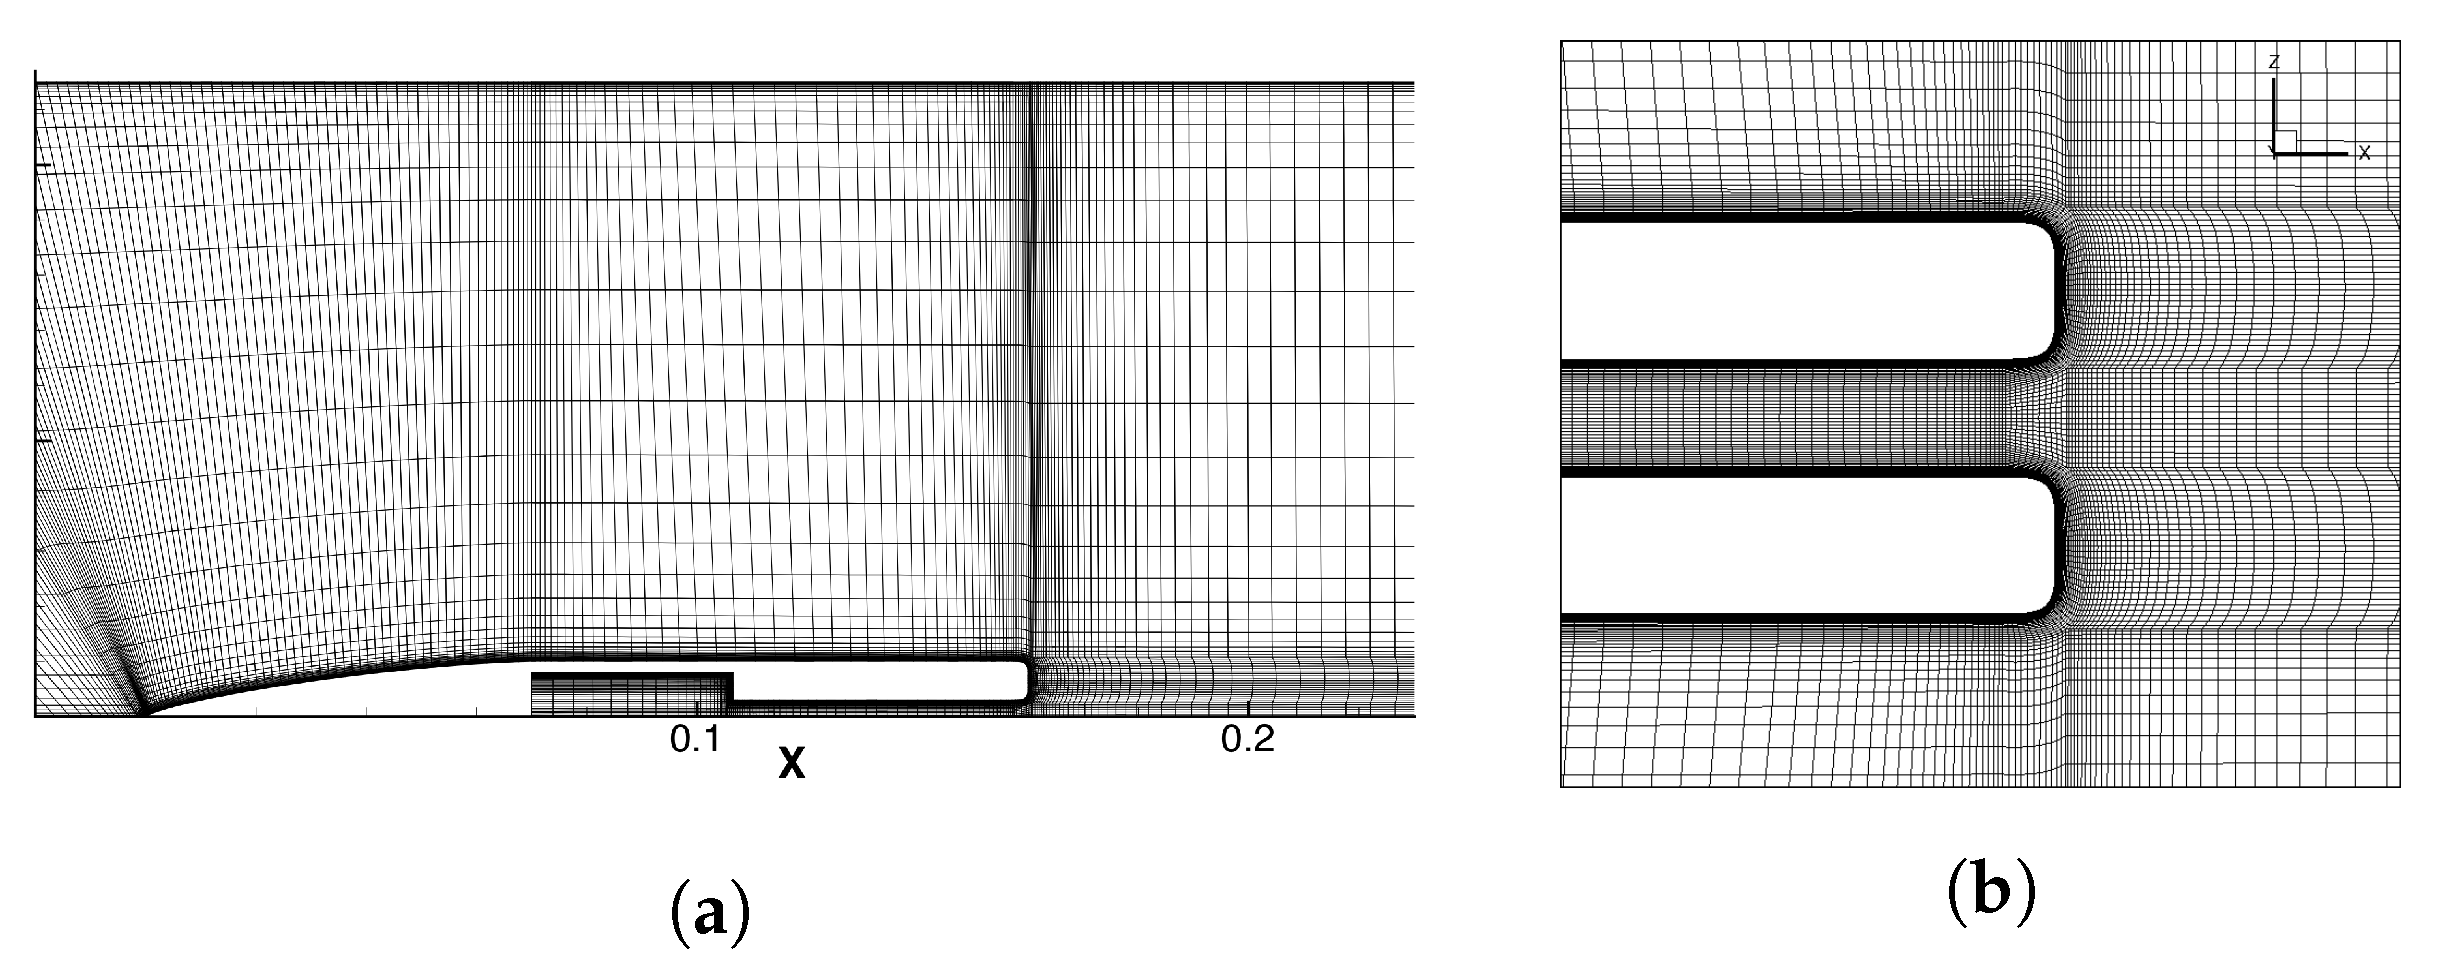
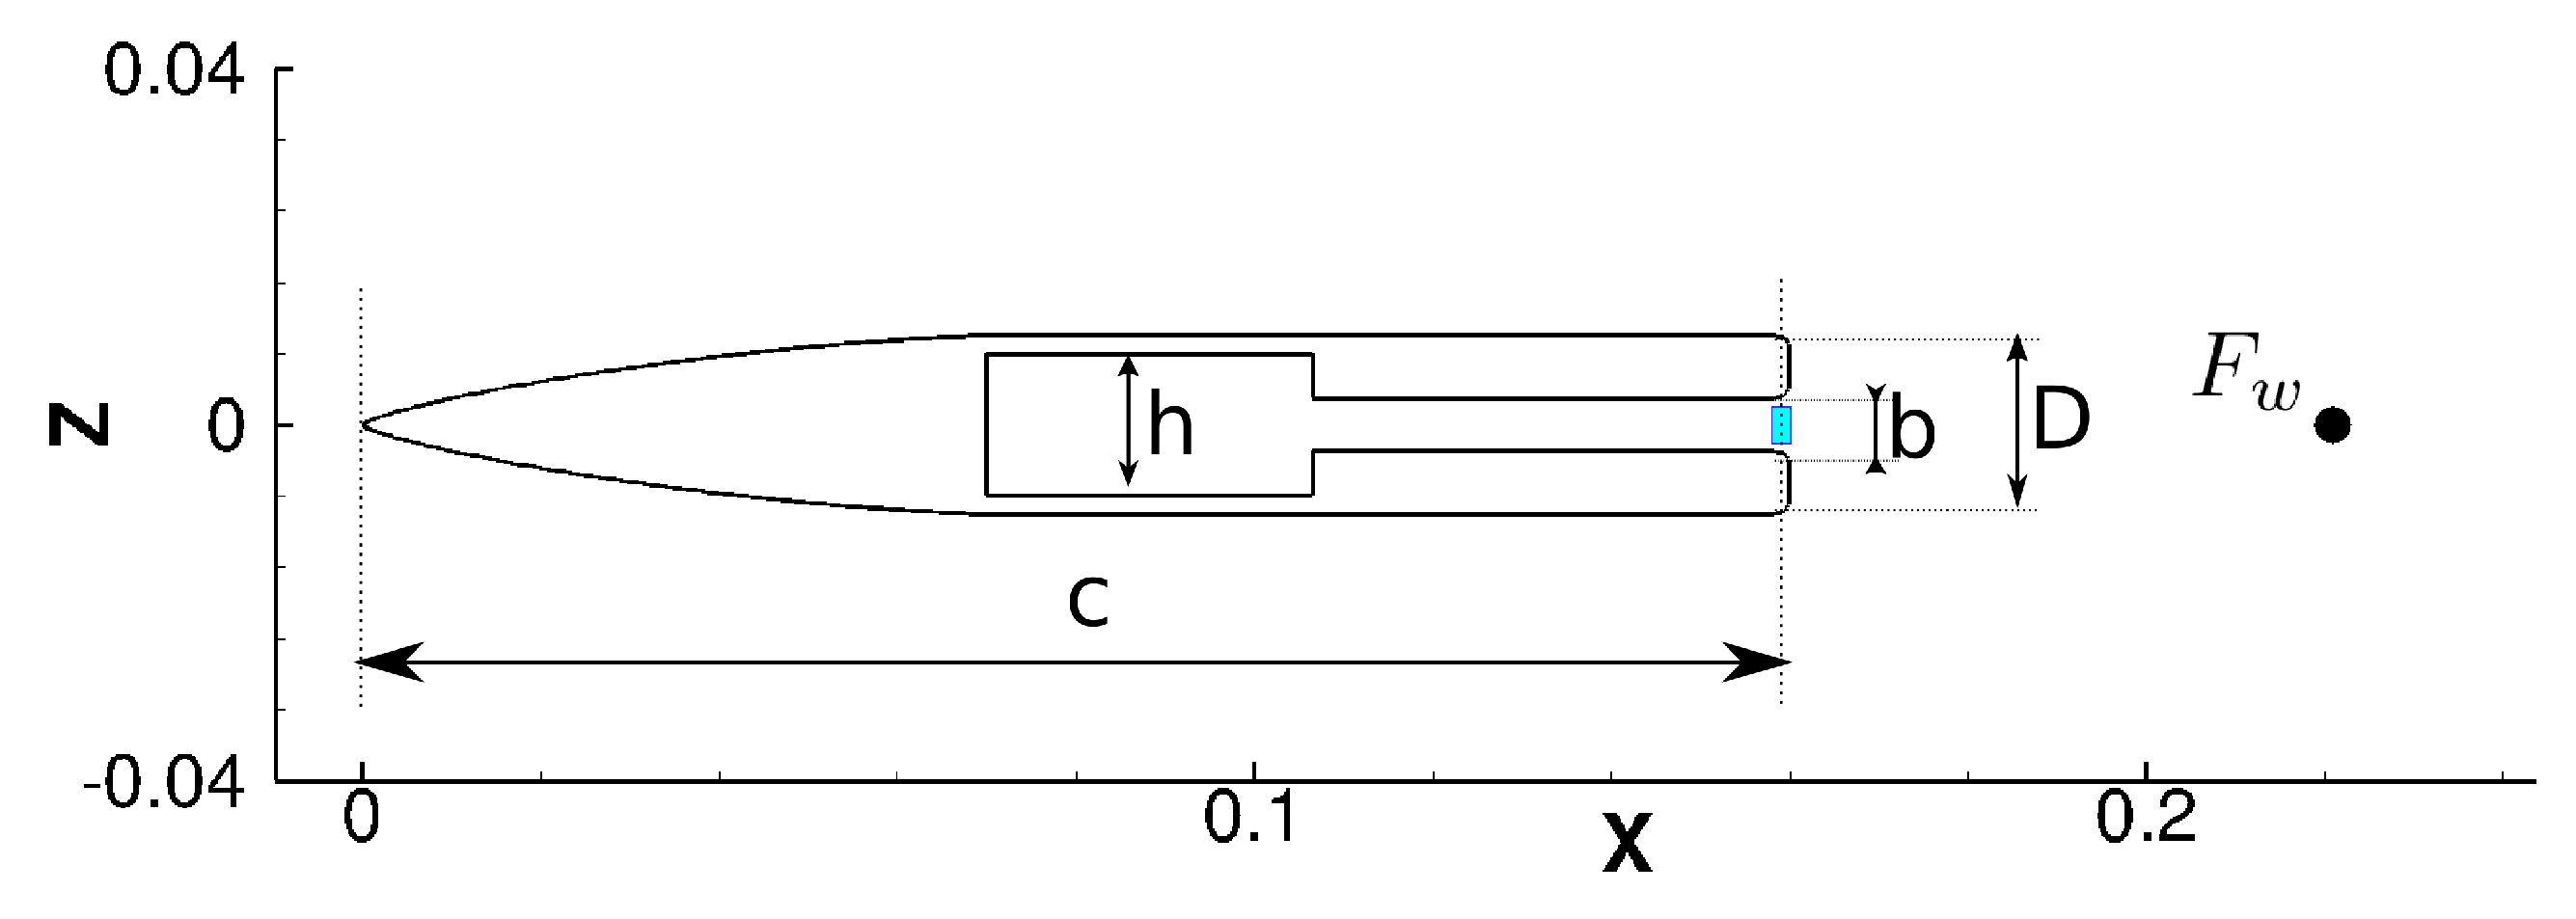
2. Computational Set-Up

The geometry considered in this work is the same studied by Martinez-Cava et al. [19] that we reproduce here for clarity.
A simplified trailing edge flow is achieved through a zero-cambered airfoil of 160 mm chord (c), with an aspect ratio value of 8 (defined as c / D , D = 0.020 m being the trailing edge thickness). Boundary layer separation at the leading edge has been avoided using a smooth Haack Series [20] nose shape. The mass flow employed on the base bleed is first discharged in a stagnation plenum inside the airfoil, which is connected to the base region by a thinner passage covering a third of its width ( b = 0.3 D ). The model is confined between two parallel walls separated by 230 mm, and the inlet and outlet boundaries are placed at enough distance to avoid any interference of the boundary conditions. Subsonic conditions are imposed to recover a Mach and Reynolds number of M = 0.34 and Re c = 1.53 × 10 6 , respectively. As no thermal aspects are covered in this analysis, a total temperature of 257 K is set at the free stream and a static temperature of 250 K is imposed on the base bleed flow.
Without any flow actuation, pairs of vortices would detach from the trailing edge with an associated frequency related to the incoming flow velocity and the trailing edge thickness, under a characteristic Strouhal number of St = 0.287 . These vortices separate in an alternating manner from upper and lower sides, producing an oscillating behavior of the wake and the base region (Figure 1).
Flow calculations in this work are computed with the Finite Volume DLR-TAU Code [21] (TAU). Based on a three-dimensional finite volume scheme approach, TAU is a state-of-the-art compressible flow solver used on the aerospace industry to accurately calculate flow solutions from the low subsonic to the hypersonic flow regime. On time-dependent solutions, such as TAU, employ a dual time-stepping scheme coupled with a multigrid acceleration. Due to its performance in compressible flow, turbulent fluxes are modeled with the Menter’s 2003 Shear Stress Transport version of the k- ω closure model [22]. The flow is considered to be fully turbulent from the leading edge, according to the suggestions of the high-pressure turbine community. The spatial discretization of the domain is done using a non-structured quadrilateral mesh (Figure 2), with localized refinements on the areas of interest, keeping y + values below unity so the boundary layer is fully resolved. Both mesh sensitivity and influence of the inlet turbulence intensity were evaluated in previous works [19], ensuring spatial discretization independence on the results and discarding sensitive results to changes in the turbulent inlet conditions. Furthermore, convergence of the periodic unsteady flowfield was ensured following the recommendations established by Clark and Grover [23].

Actuation Details

Trailing edge flow actuation is modeled using TAU native boundary conditions, allowing control of the ejected mass flow and modulating its timing. The mass flow used on the trailing edge flow actuation is first discharged within a stagnation chamber and connected through a straight passage to the base region.
To keep a consistent nomenclature with previous works on trailing edge actuation of the literature, the mass flow ejected on the base bleed actuation is non-dimensionalized as:
C b = m ˙ / ρ U h ,
m ˙ being the imposed mass flow rate, h = 0.9 D the width of the base bleed stagnation chamber, with ρ and U as the free stream density and flow velocity. In this work, the non-dimensional parameter C b is varied from 0 to 1, evaluating the different effects on the trailing edge flow encountered when varying the total ejected mass flow.
The base bleed flow is modulated in frequency and smoothed to avoid sudden changes, ramping up and down from constant blowing velocity to zero-mass flow during one actuation cycle, as depicted in Figure 3. The actuation time period is defined as T = T a c t + T z , T a c t being the time where the flow is injected per period and T z the zero flow rate actuating time. A duty cycle value of D c = T a c t / T = 0.5 is considered for all the studied cases.
All configurations are tested for constant and pulsating blowing at the same maximum flow rate and at a range of frequencies varying from 100 to 200 Hz, the expected periodicity caused by the blade passing on high pressure turbines. The downstream flow topologies, the influence of the Coanda effect, and the energy gains due to the trailing edge flow injection are herein investigated. Furthermore, numerical monitors are employed to monitor static pressure at specific regions that, together with the calculated viscous forces, are time averaged to evaluate the changes produced during the pulsating trailing edge actuation.

3. Results and Discussion

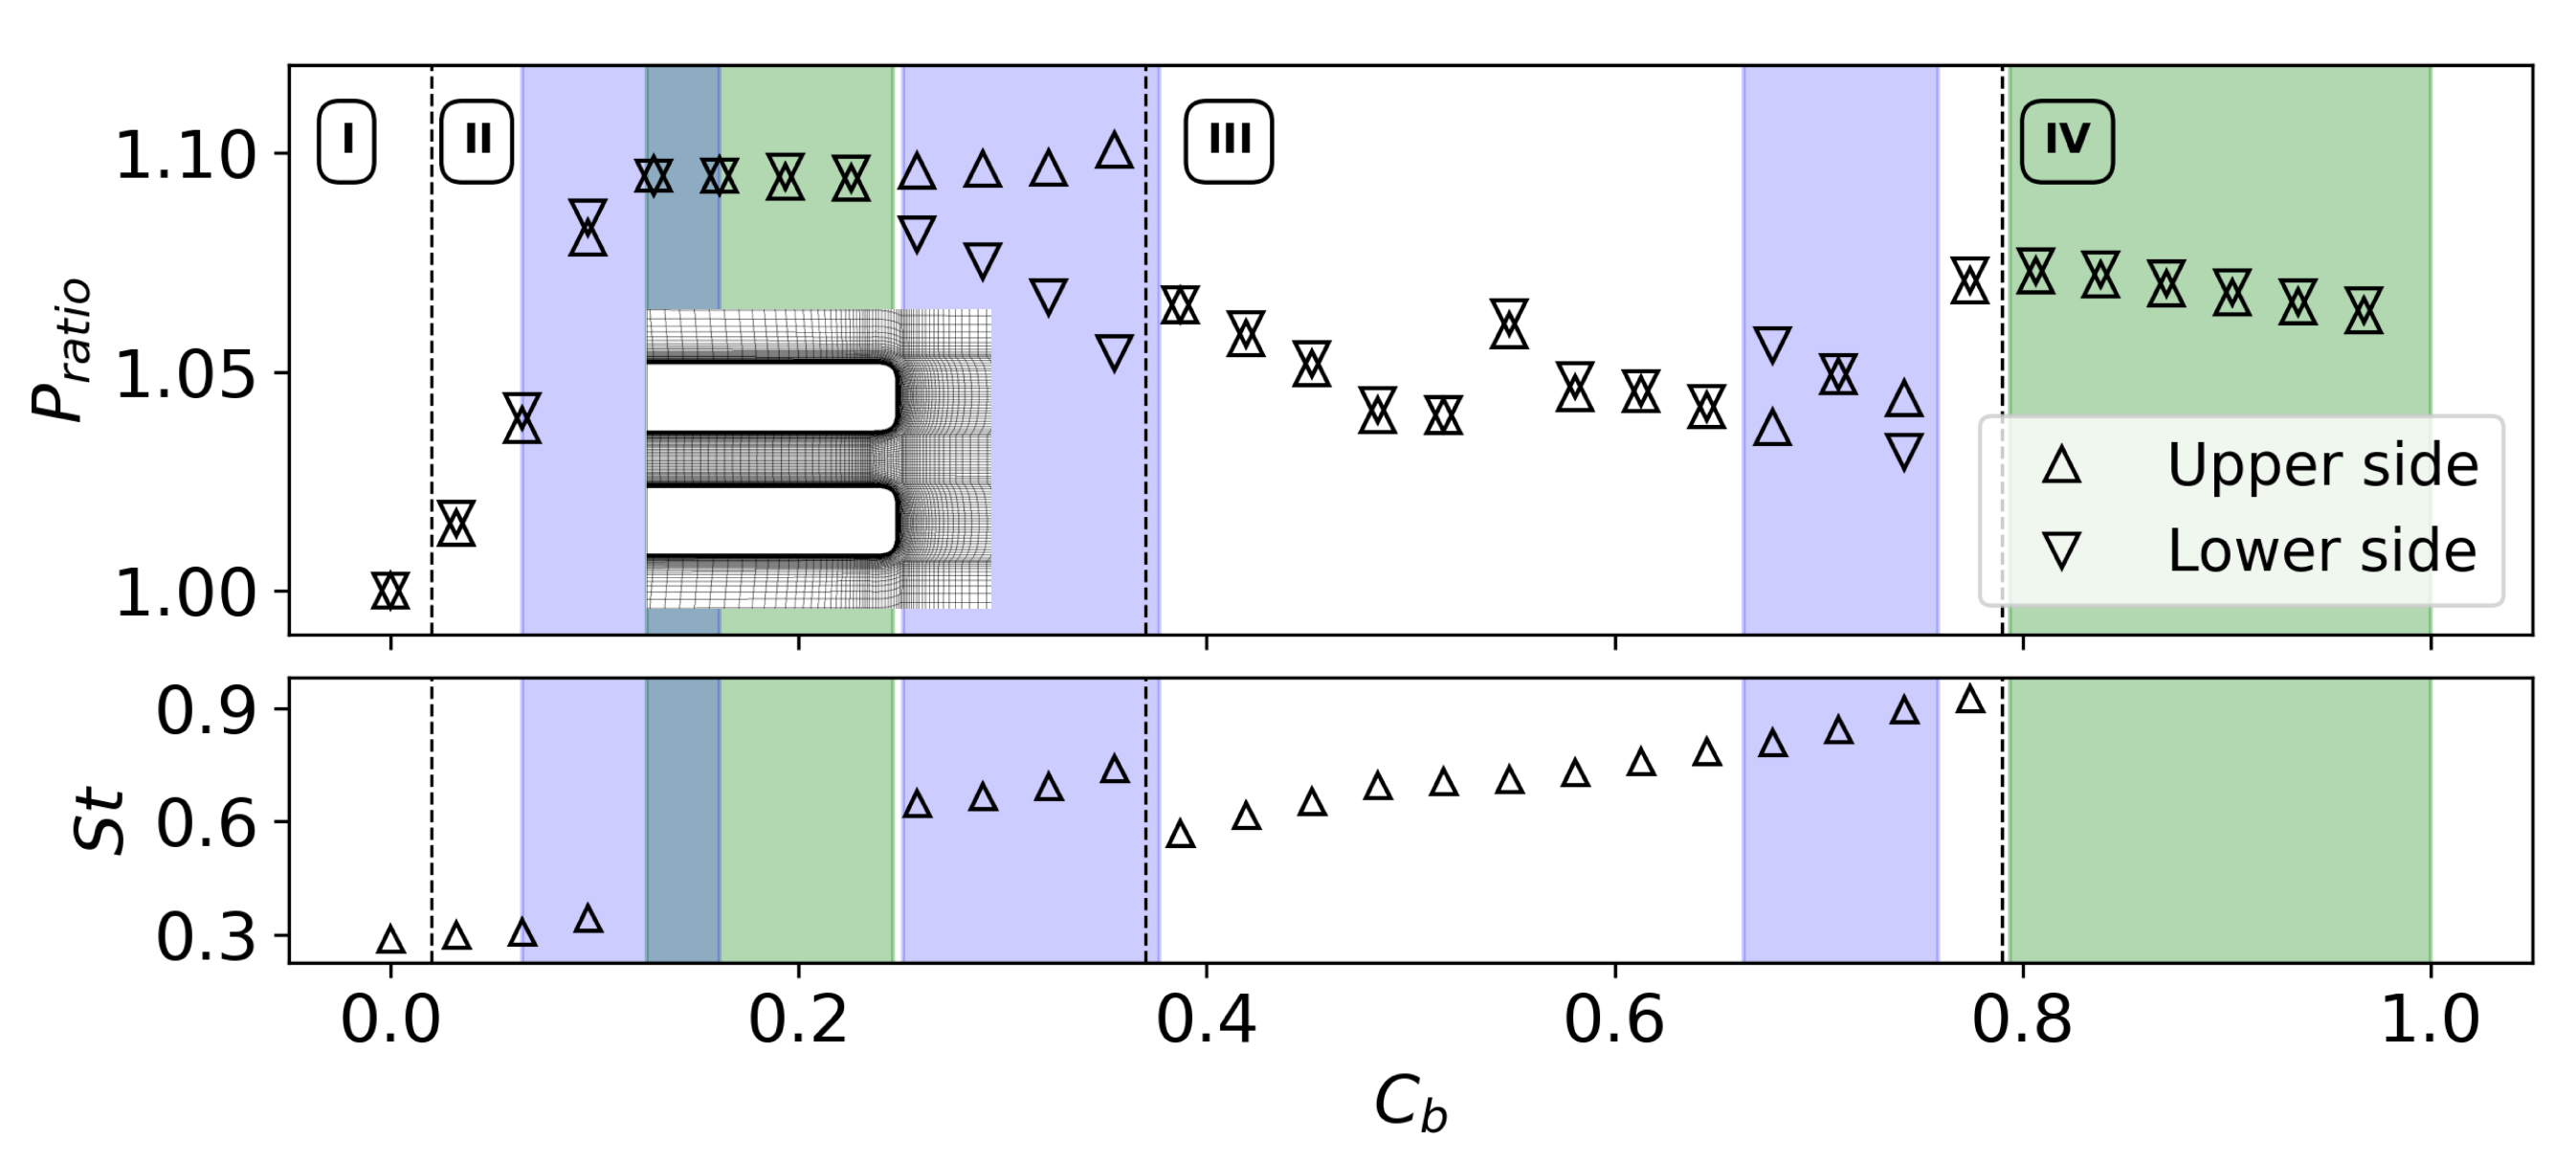
3.1. Trailing Edge Steady Actuation

The effects of steady base bleed on the base pressure and the characteristic Strouhal number of the wake flow structures were studied in Martinez-Cava et al. [19] and are summarized in Figure 4. The evidence obtained from numerical analyses suggested to divide the trailing edge flow behavior in four distinctive phases:
Phase I.
C b 0 
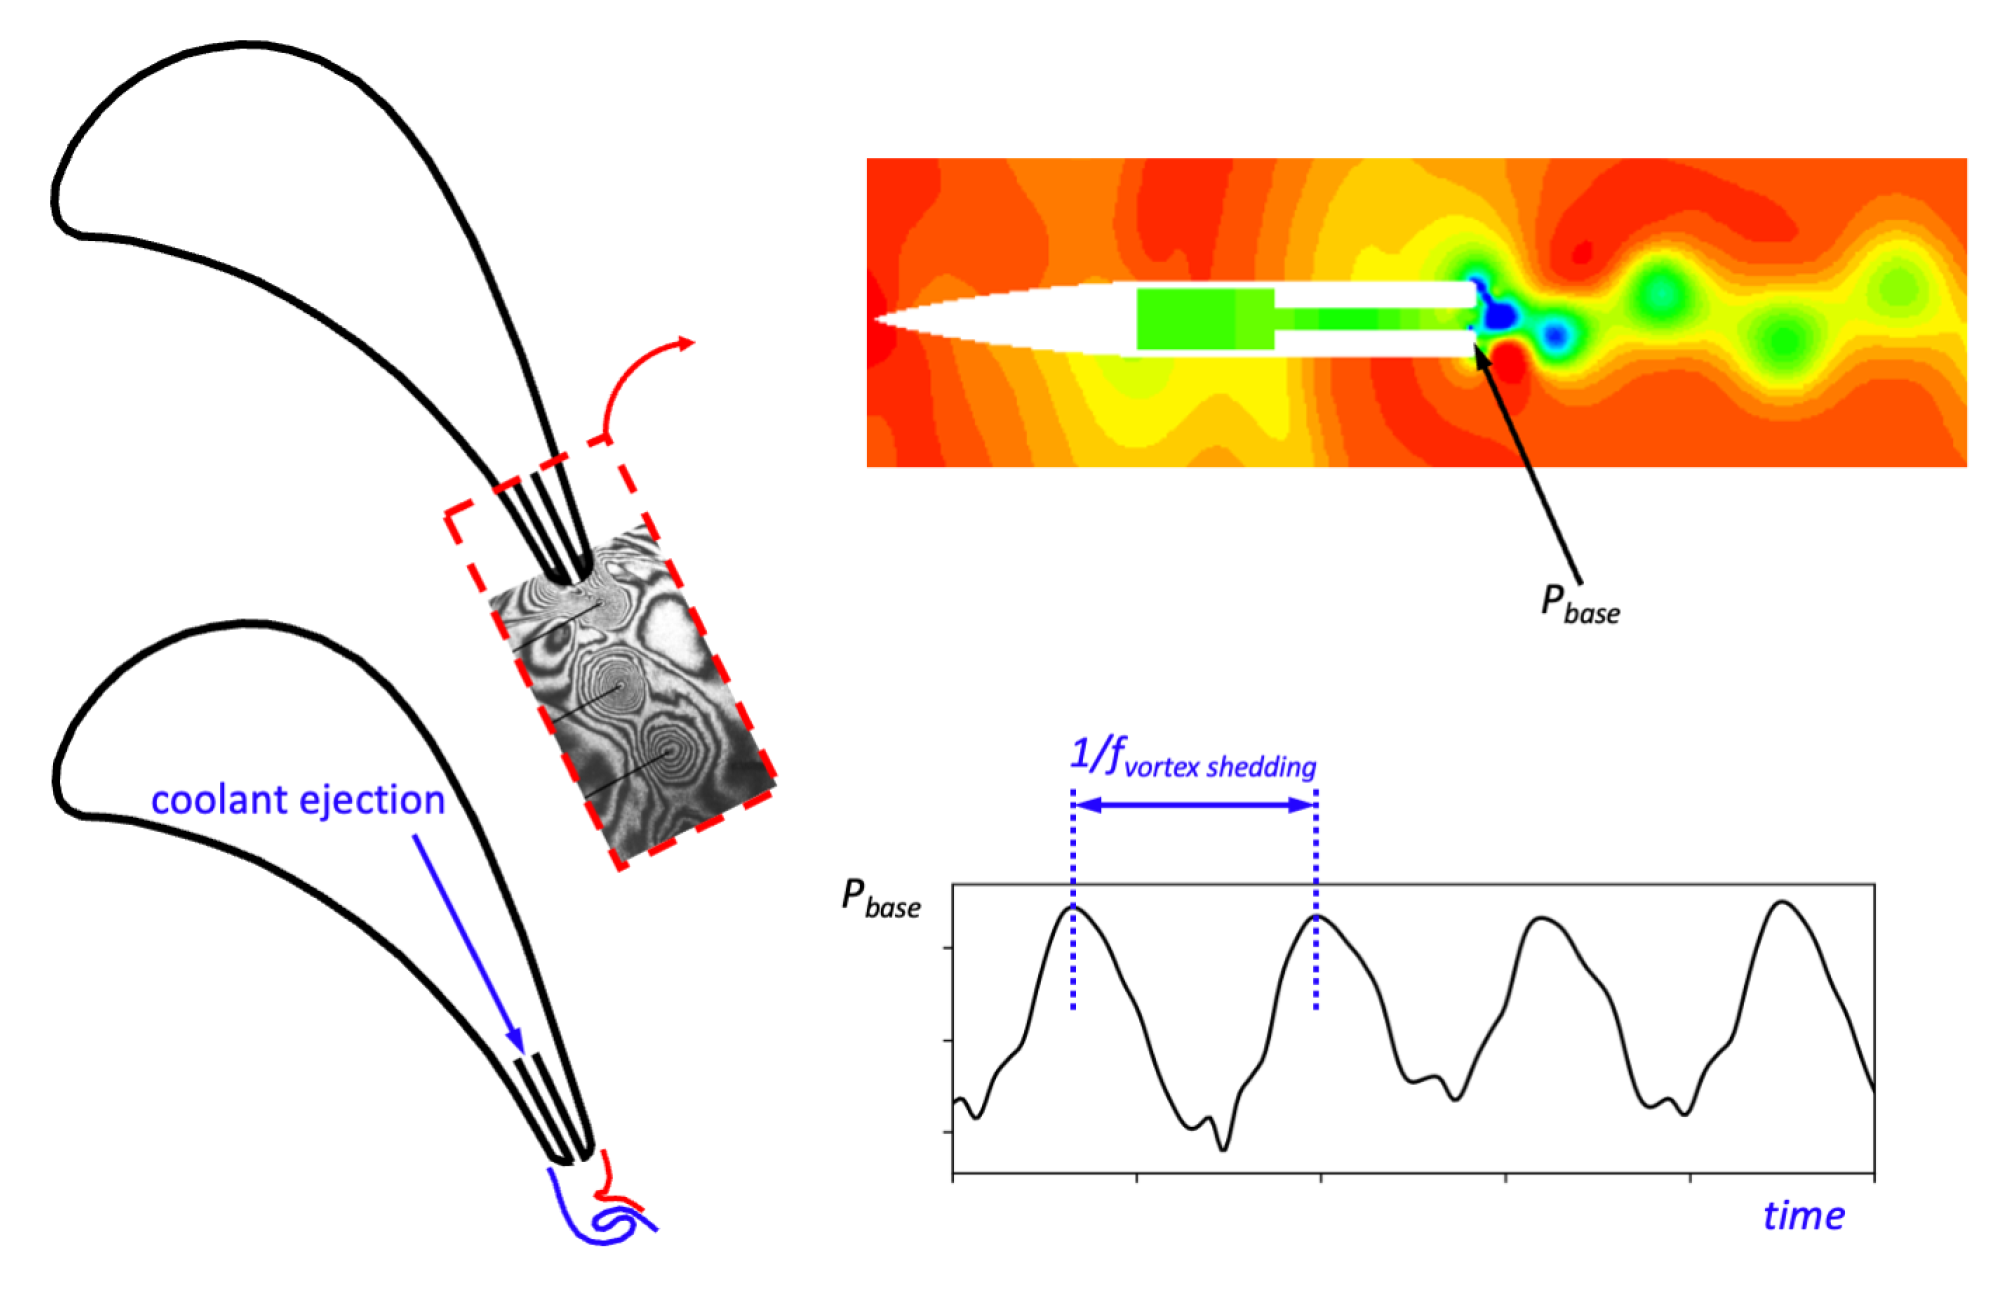
. Vortices shed in an alternate manner from the trailing edge when no base bleed is applied. We refer to this stage as a non-blowing configuration.
Phase II.
C b < 0.38 . Base pressure increases due to an initial “filling” effect, raising the maximum base pressure value to P b a s e / P 1.1 , with a slight increment in the frequency associated to the vortices. Under these conditions, the base bleed introduces a source of asymmetry on the wake downstream, followed by a neutralization of the vortex shedding.
Phase III.
0.38 < C b < 0.8 . At this stage, the base pressure rapidly decays, almost eliminating the observed gains produced by a lower intensity trailing edge actuation. These changes are also accompanied by a reduction of the dominant wake flow frequency. While the trailing edge flow initially behaves as symmetric when it is time averaged, higher blowing intensities promote the onset of a non-symmetric flow topology.
Phase IV.
C b > 0.8 . Elevated ejected mass flows eventually force a symmetric trailing edge flow, weakening any oscillation and increasing the base pressure towards a final plateau of P b a s e / P 1.07 . Further increments in the base bleed intensity do not produce significant changes in the flow topology.

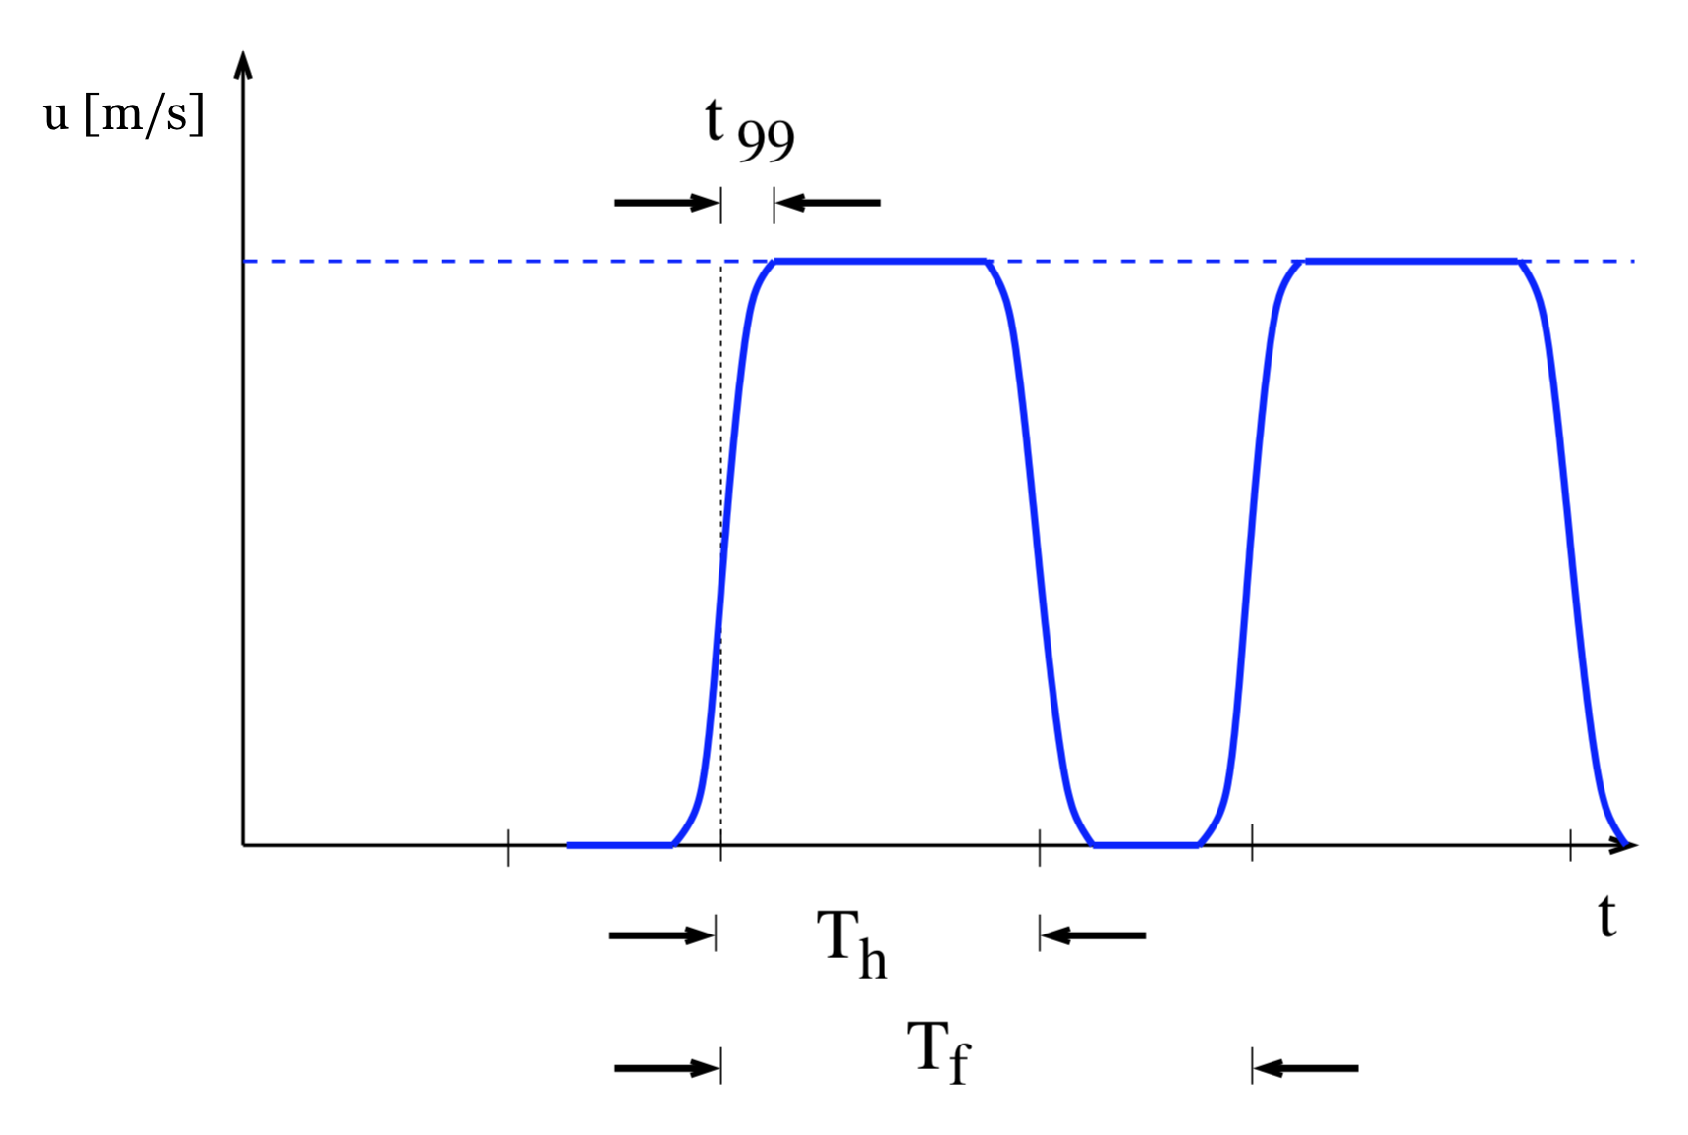
3.2. Trailing Edge Pulsating Actuation

To evaluate the influence of a pulsating injection, the analysis of the considered base bleed configurations targets the evolution of four aerodynamic aspects:
1.
Airfoil drag force.
2.
Airfoil lift force, monitoring characteristic frequencies and extreme values.
3.
Onset of a base region Coanda effect.
4.
Energy efficiency of the trailing edge actuation.
Results are compared against those obtained with non-blowing and steady base bleeding configurations.

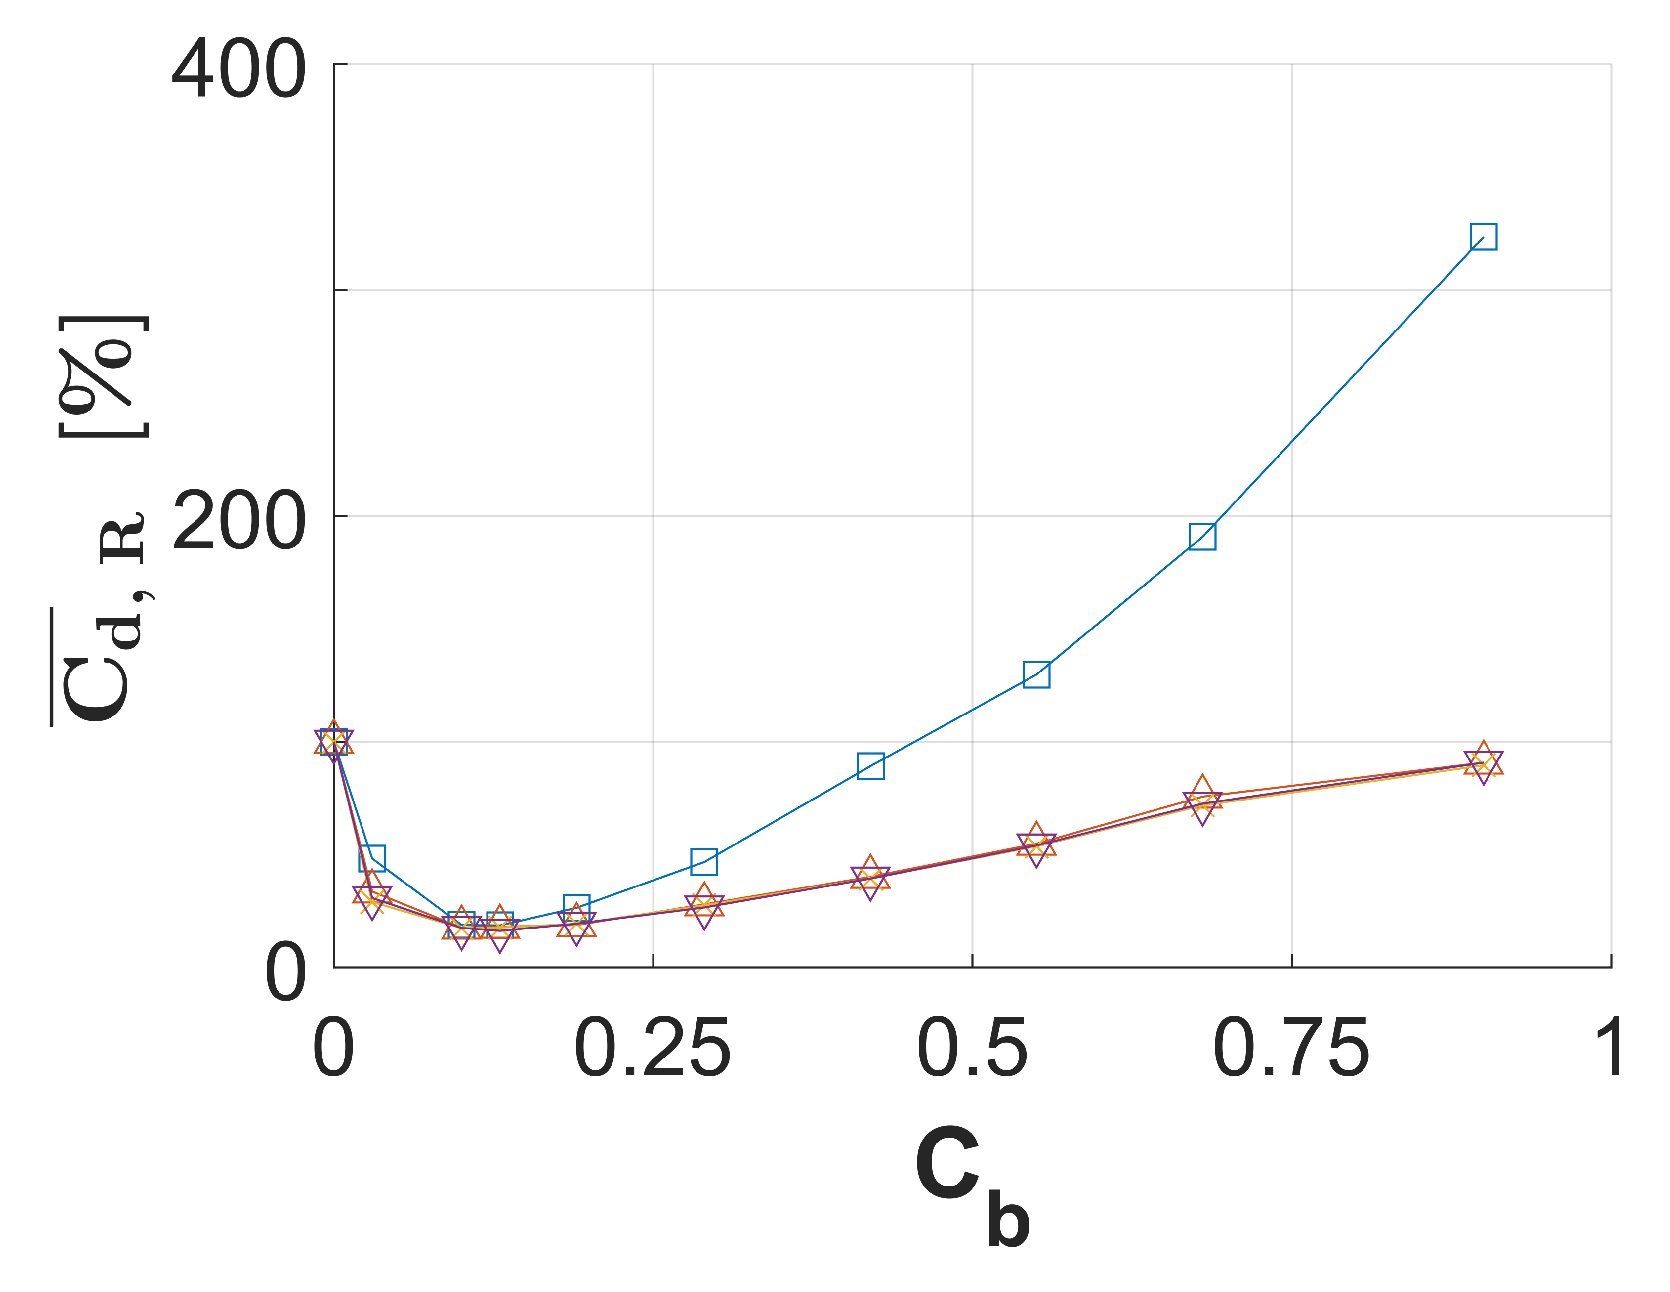
3.2.1. Airfoil Drag Force

To track the evolution of the viscous drag forces with respect to the base bleed intensity, a relative non-dimensional coefficient for the aerodynamic drag forces, C d , R ¯ , is defined as:
C d , R ¯ = C d C d N B ,
where C d is the drag force coefficient for a specific configuration and C d N B is the corresponding drag coefficient for a non-blowing configuration. Its dependency with the non-dimensional base bleed rate, C b , is depicted in Figure 5 for different pulsating base bleed frequencies. Increasing the values of C b , the drag force coefficient initially decreases until it reaches a minimum at ≃ C b = 0.13 , approximately 17 % lower than the reference value. However, higher values of C b imply a further increment of the drag force coefficient, this being more pronounced for a steady base bleed. This increment of the drag force coefficient is related to a decrease in the base pressure value, as the ejected mass flow evacuates flow from the base region, hence increasing the pressure drag. Nevertheless, this trend is more pronounced for a steady base bleed actuation, indicating that a pulsating injection may be more beneficial in terms of aerodynamic drag than its steady counterpart.
In the evaluated injection frequency range of 100–200 Hz, the drag forces appear to be quite insensitive to the frequency of the bleeding. Lower frequency ejections (below 100 Hz) may show a smooth transition from the numbers observed on a steady actuation to those shown herein for a pulsating actuation, but that remains out of the scope of the present analysis.
For illustration, snapshots of instantaneous pressure coefficient contours obtained from an URANS solution at C b = 0.13 and C b = 0.90 for a pulsating base bleed frequency of f = 100 Hz are depicted in Figure 6. The pulsation of base bleed modulates the pattern of trailing edge vortex shedding but does not neutralize it for high values of the non-dimensional base bleed rate, as observed in steady base bleed actuation [19].

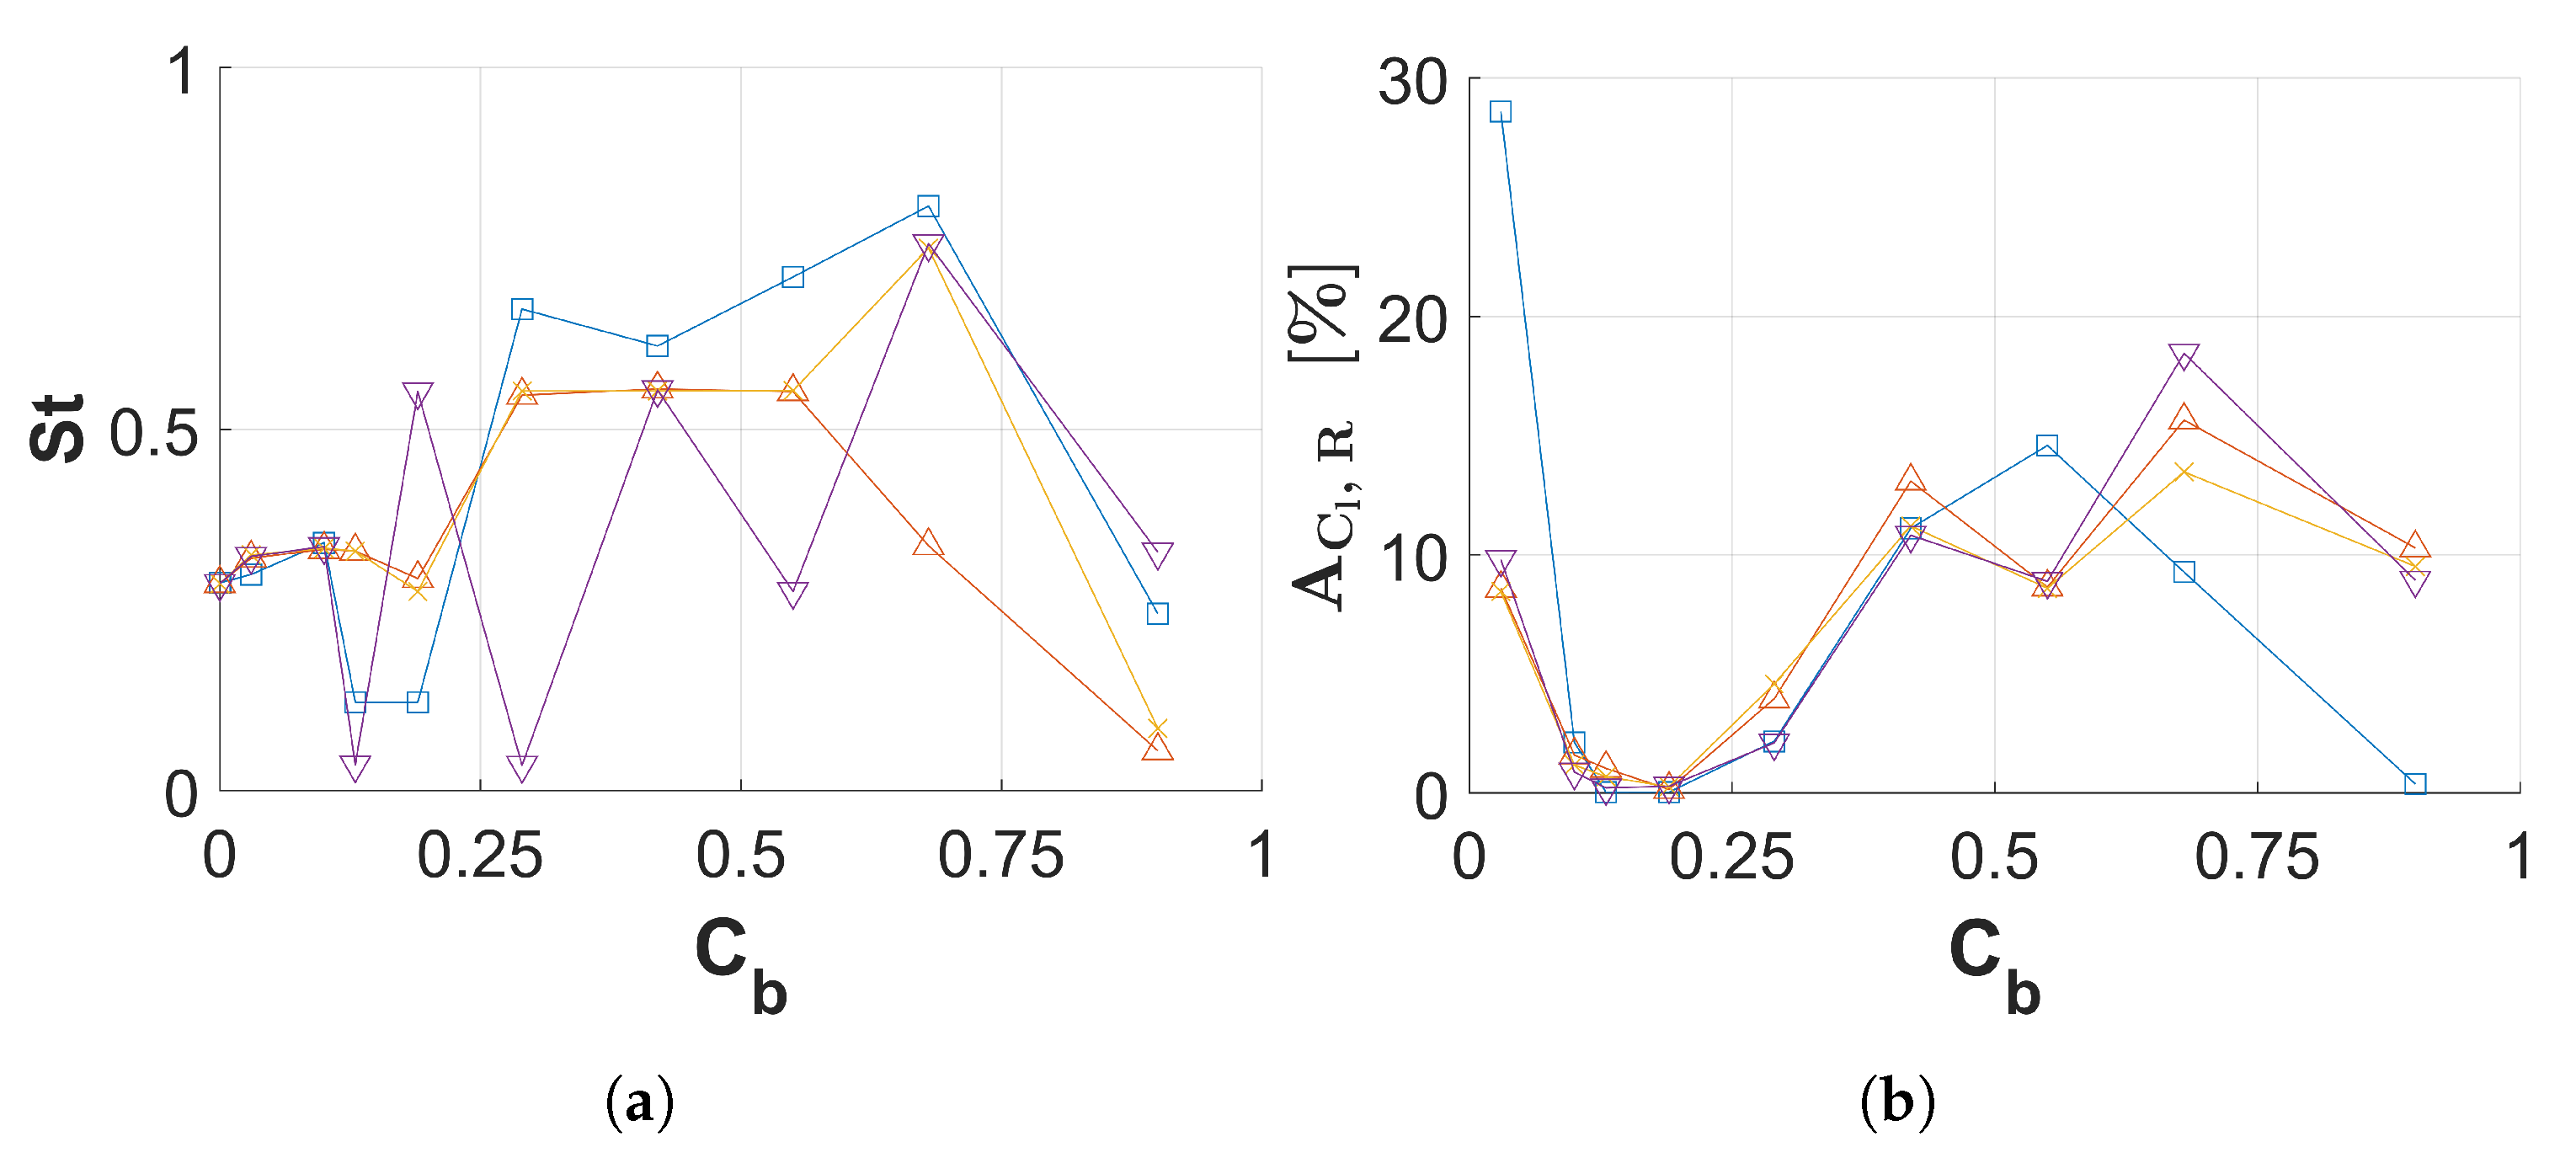
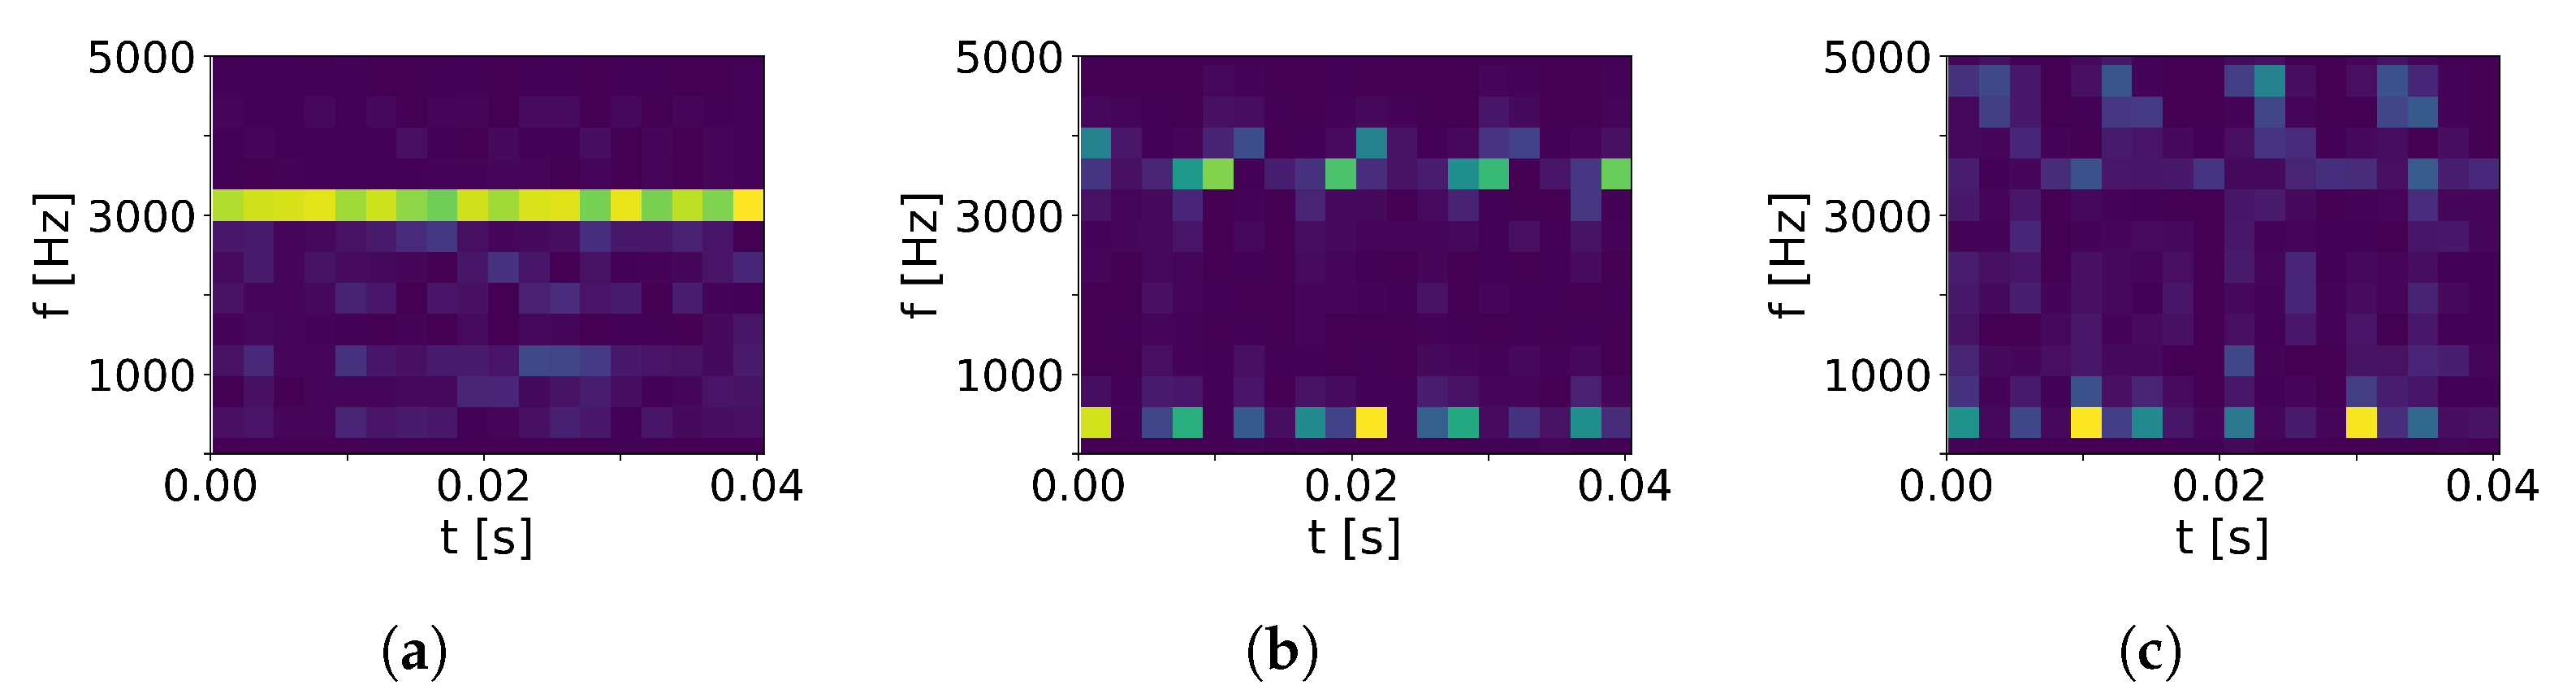
3.2.2. Airfoil Lift Force

In this Section, the effect of the pulsating base bleed on the frequency and amplitude of the oscillations of the lift force coefficient is discussed. The definition of the Strouhal number considered for the interpretation of the results shown herein follows the definition:
St = f D U ,
where U is the velocity of the incident flow, D is the thickness of the considered airfoil at the trailing edge, and f is the lift force main oscillation frequency. The reference value for the Strouhal number is associated with a non-blowing configuration, St = 0.287 . According to the underlying physics, there are three main possible contributions to the lift force oscillations:
1.
Vortex shedding phenomenon
2.
Oscillations of the jet angle
3.
Injection frequency
The characteristic frequency is determined through a Fast Fourier Transform (FFT) of the time series obtained from the URANS simulations, which have been ensured to have reached convergence by showing periodic flow tendencies. Figure 7 depicts the Strouhal number obtained of the most energetic frequency plotted against the non-dimensional base bleed rate. The injection has a strong impact on the frequency of the lift oscillations, and despite the fact that there is no clear relation between St and C b , certain conclusions can be extracted.
The dependency of the associated frequencies with the base bleed rate follows the observed trend for steady base bleed [19], peaking as C b increases. At certain ranges of base bleed intensities ( C b = 0.1 0.3 and C b > 0.8 ), the oscillations are so small that it can be assumed that vortex shedding has been suppressed. The use of base bleed generally reduces the amplitude of the oscillations when compared to the non-blowing configuration, but the effect of the pulsating injection appears to be less evident than a steady actuation. For each injection cycle, the flow patterns at the base region are modulated with the duty cycle. Although base bleed mostly affects the base region area, the downstream region flow topology is also severely altered. A probe located downstream of the injection channel is used to monitor flow variables over time (point F w on Figure 8). In Figure 9, spectrograms based on pressure time series of four actuation cycles are gathered for a non-blowing configuration and two different base bleed intensities. As the profiling point is located in the symmetry plane of the model, the first shows a clear dominance of a frequency value that doubles the frequency corresponding to the natural vortex shedding. However, the other two frequencies appear modulated by the actuation cycle, with the former showing a disappearance of the vortex shedding related oscillations as the strength of the base bleed jet generates a symmetric flow topology.

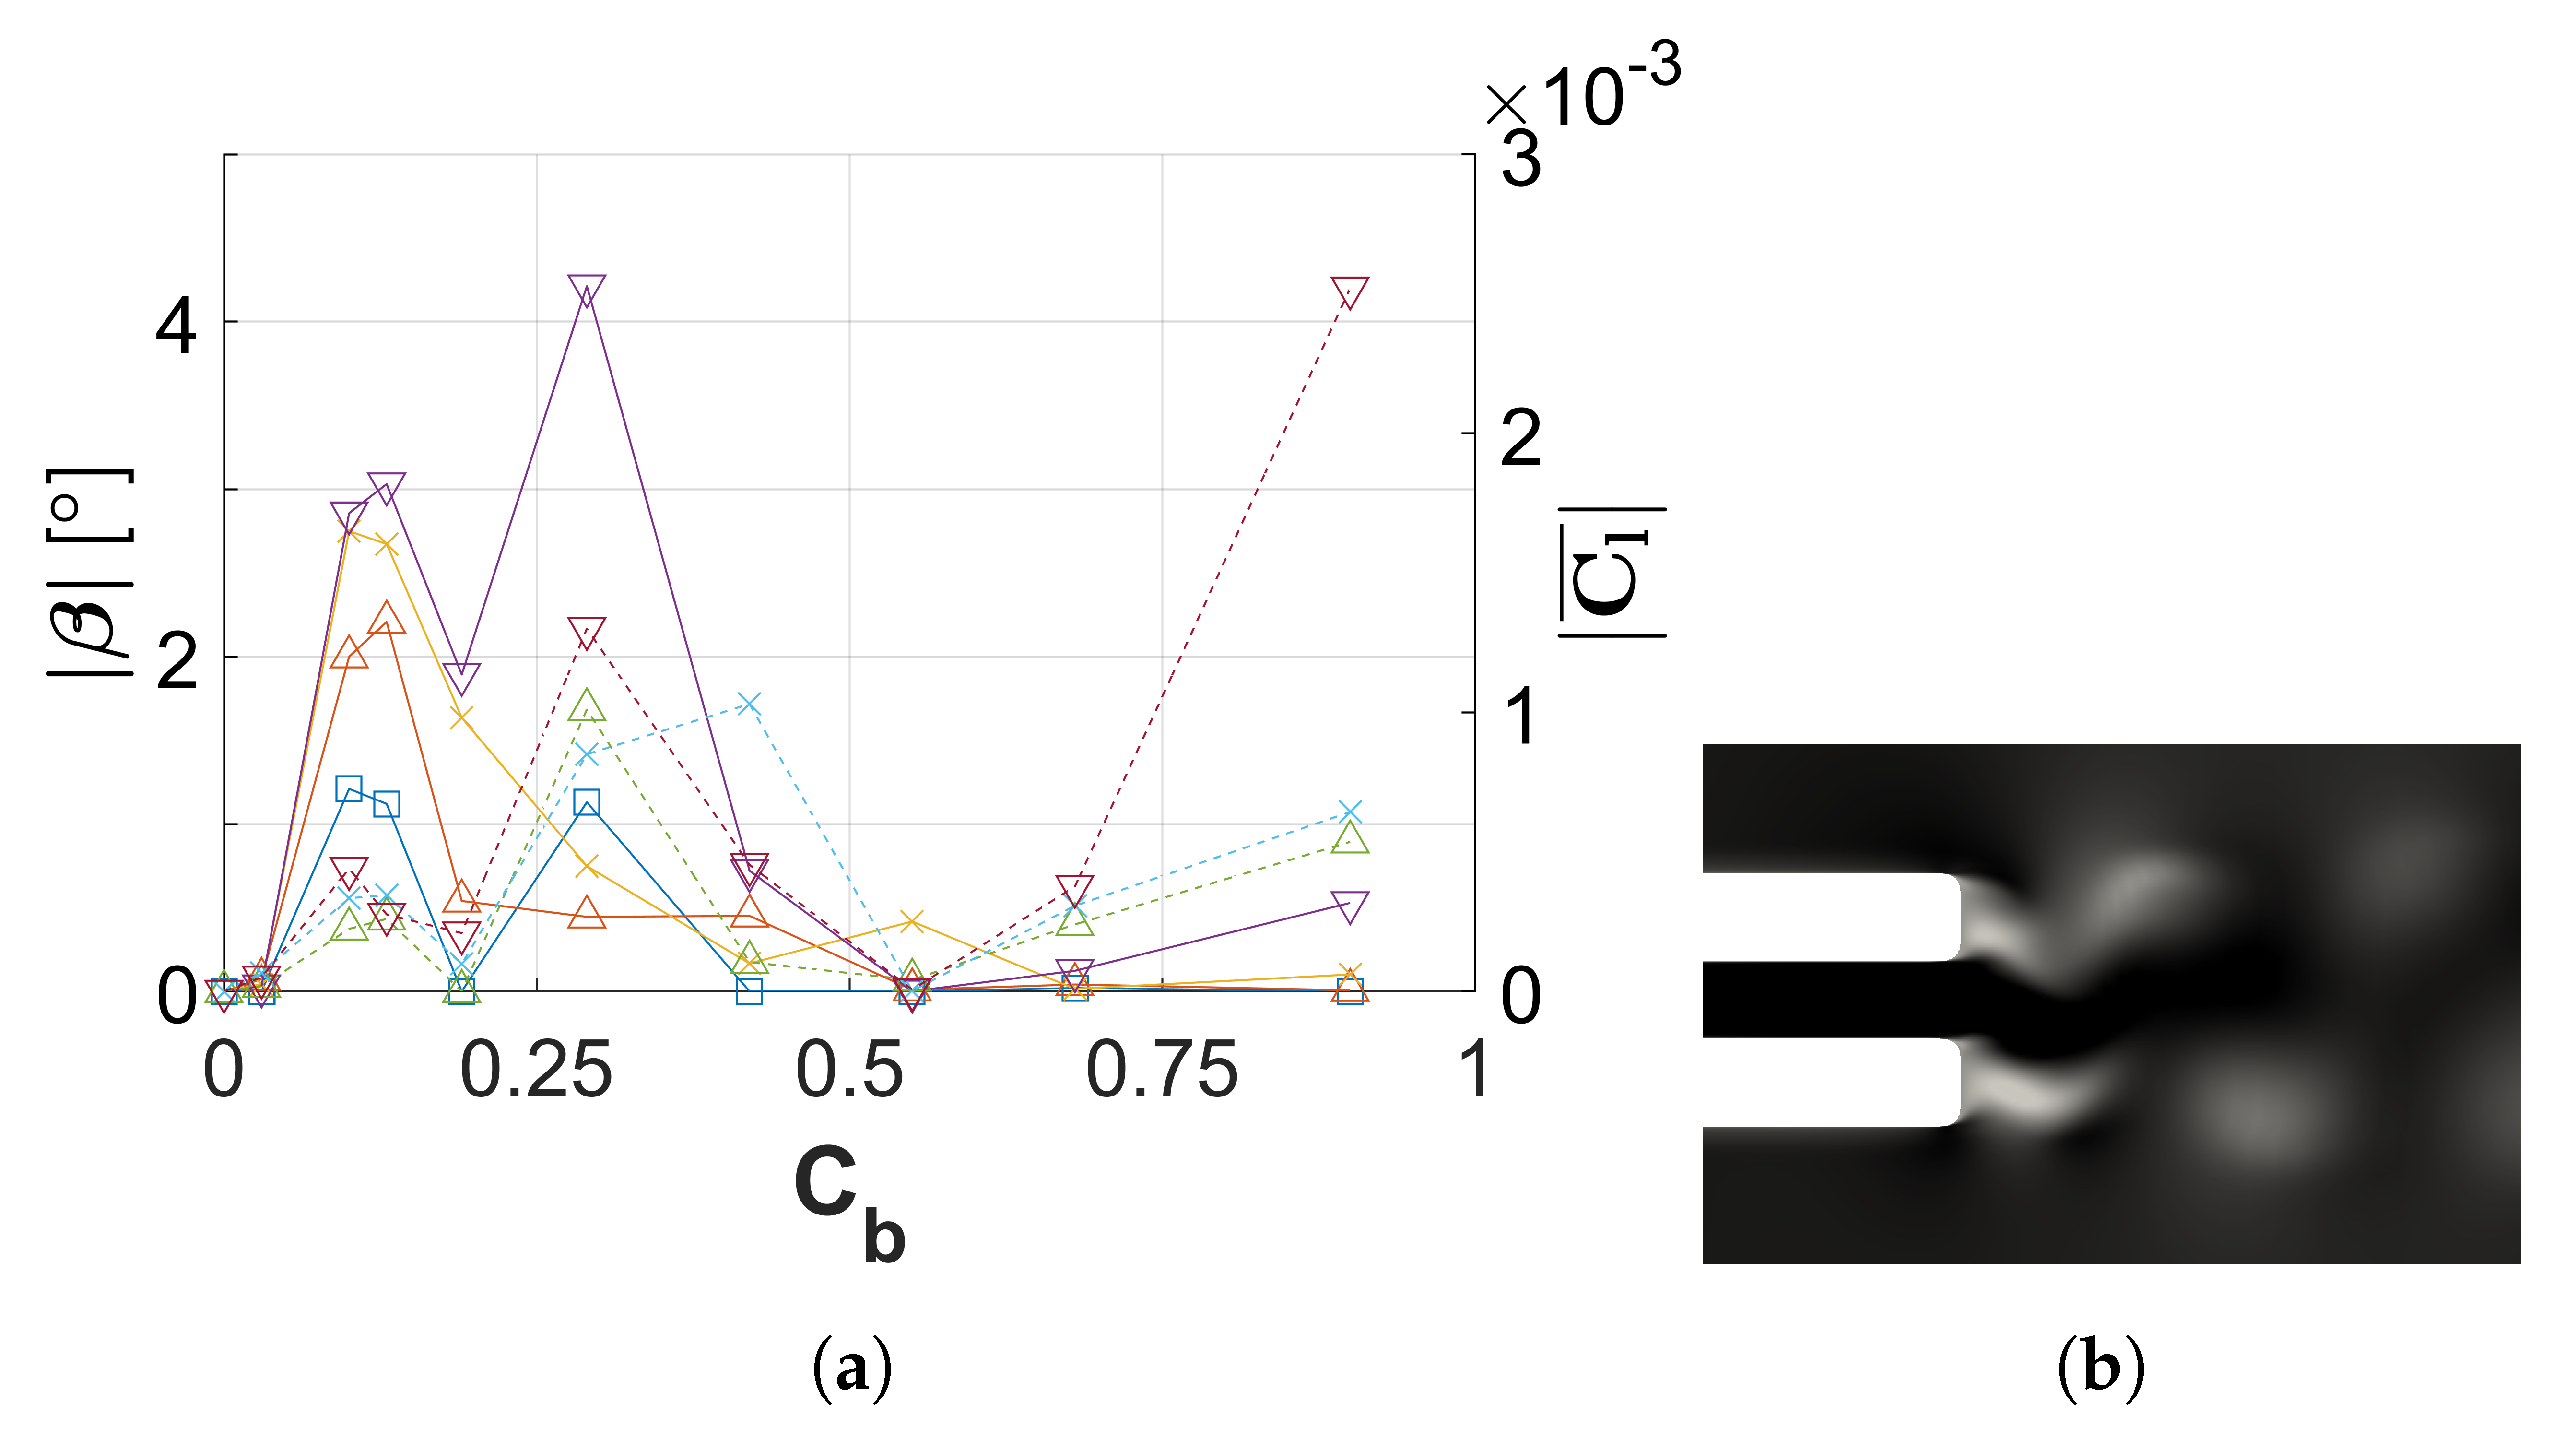
3.2.3. Base Region Coanda Effect

The evolution of non-symmetrical perturbations at the end of the base bleed injection channel develops the interaction of the upper and lower recirculation regions, eventually causing a deflection of the trailing edge jet following a so called “weak Coanda” effect [18]. This asymmetry in the base region is evaluated herein by means of two interrelated variables: the injection jet angle, β , and the averaged value of the lift coefficient, C l ¯ = l ¯ / q c , l being the transversal aerodynamic force.
The base region flow properties are modified over time as a combination of the shear layer oscillations, vortex shedding, and the behavior of the base bleed jet. The jet angle, β , indicates the direction of the injected base bleed flow with respect to the symmetry plane. In this regard, several probes are located at the end of the injection channel, monitoring the different velocity components. An oscillation of β is expected when vortices are shed from the base region, while steady deviations of the injection flow, with respect to the horizontal, are caused by the onset of the aforementioned Coanda effect. Averaged values of the absolute value of the jet angle, | β | , are depicted in Figure 10, indicating that a Coanda effect appears for mid and low values of C b , in a similar behavior to that obtained for a steady blowing, and its magnitude increases with the frequency of the pulsating injection. However, as opposed to steady base bleed configurations, where the deviation in the jet remains constant, now an oscillation in the direction of the jet linked to the intermittent flow injection appears, causing a further increment of the absolute value of the average jet angle. It can be argued that this phenomenon is related to the ramping-down effect of the jet intensity when the duty cycle is on its low stage, as the ejected mass flow decreases and acquires values for which a Coanda effect might develop. Finally, in a similar way to the observed trends during a steady actuation, at higher values of the injection rate, the Coanda effect is negligible.
In absence of trailing edge injection, the mean value of the lift force is zero despite the flow oscillations. However, the Coanda effect induced by certain base bleed intensities introduces a non-symmetric flow topology, causing transversal loads with a non-zero average value. This effect is reflected in the results gathered in Figure 10, where the averaged lift force as a function of the injected mass flow rate is depicted. For illustration, lift forces are compared with those obtained with a non-blowing configuration. As expected, low values of the jet angle are linked to near zero averaged values of the lift force. Lift values increase with low C b values, this effect being more pronounced for higher injection rates. Without contradicting the aforementioned results of the jet angle analysis, it appears that, despite the low jet angle for high C b values, the large mass flow injected at the trailing edge has an non-negligible effect on the aerodynamics forces.
It may be argued that the global effect on the aerodynamic loads over a symmetric airfoil as the one analyzed here is relatively low. However, this effect could gain relevance on cambered airfoils with different trailing edge shapes, possibly causing circulation alterations and thus lift variations.

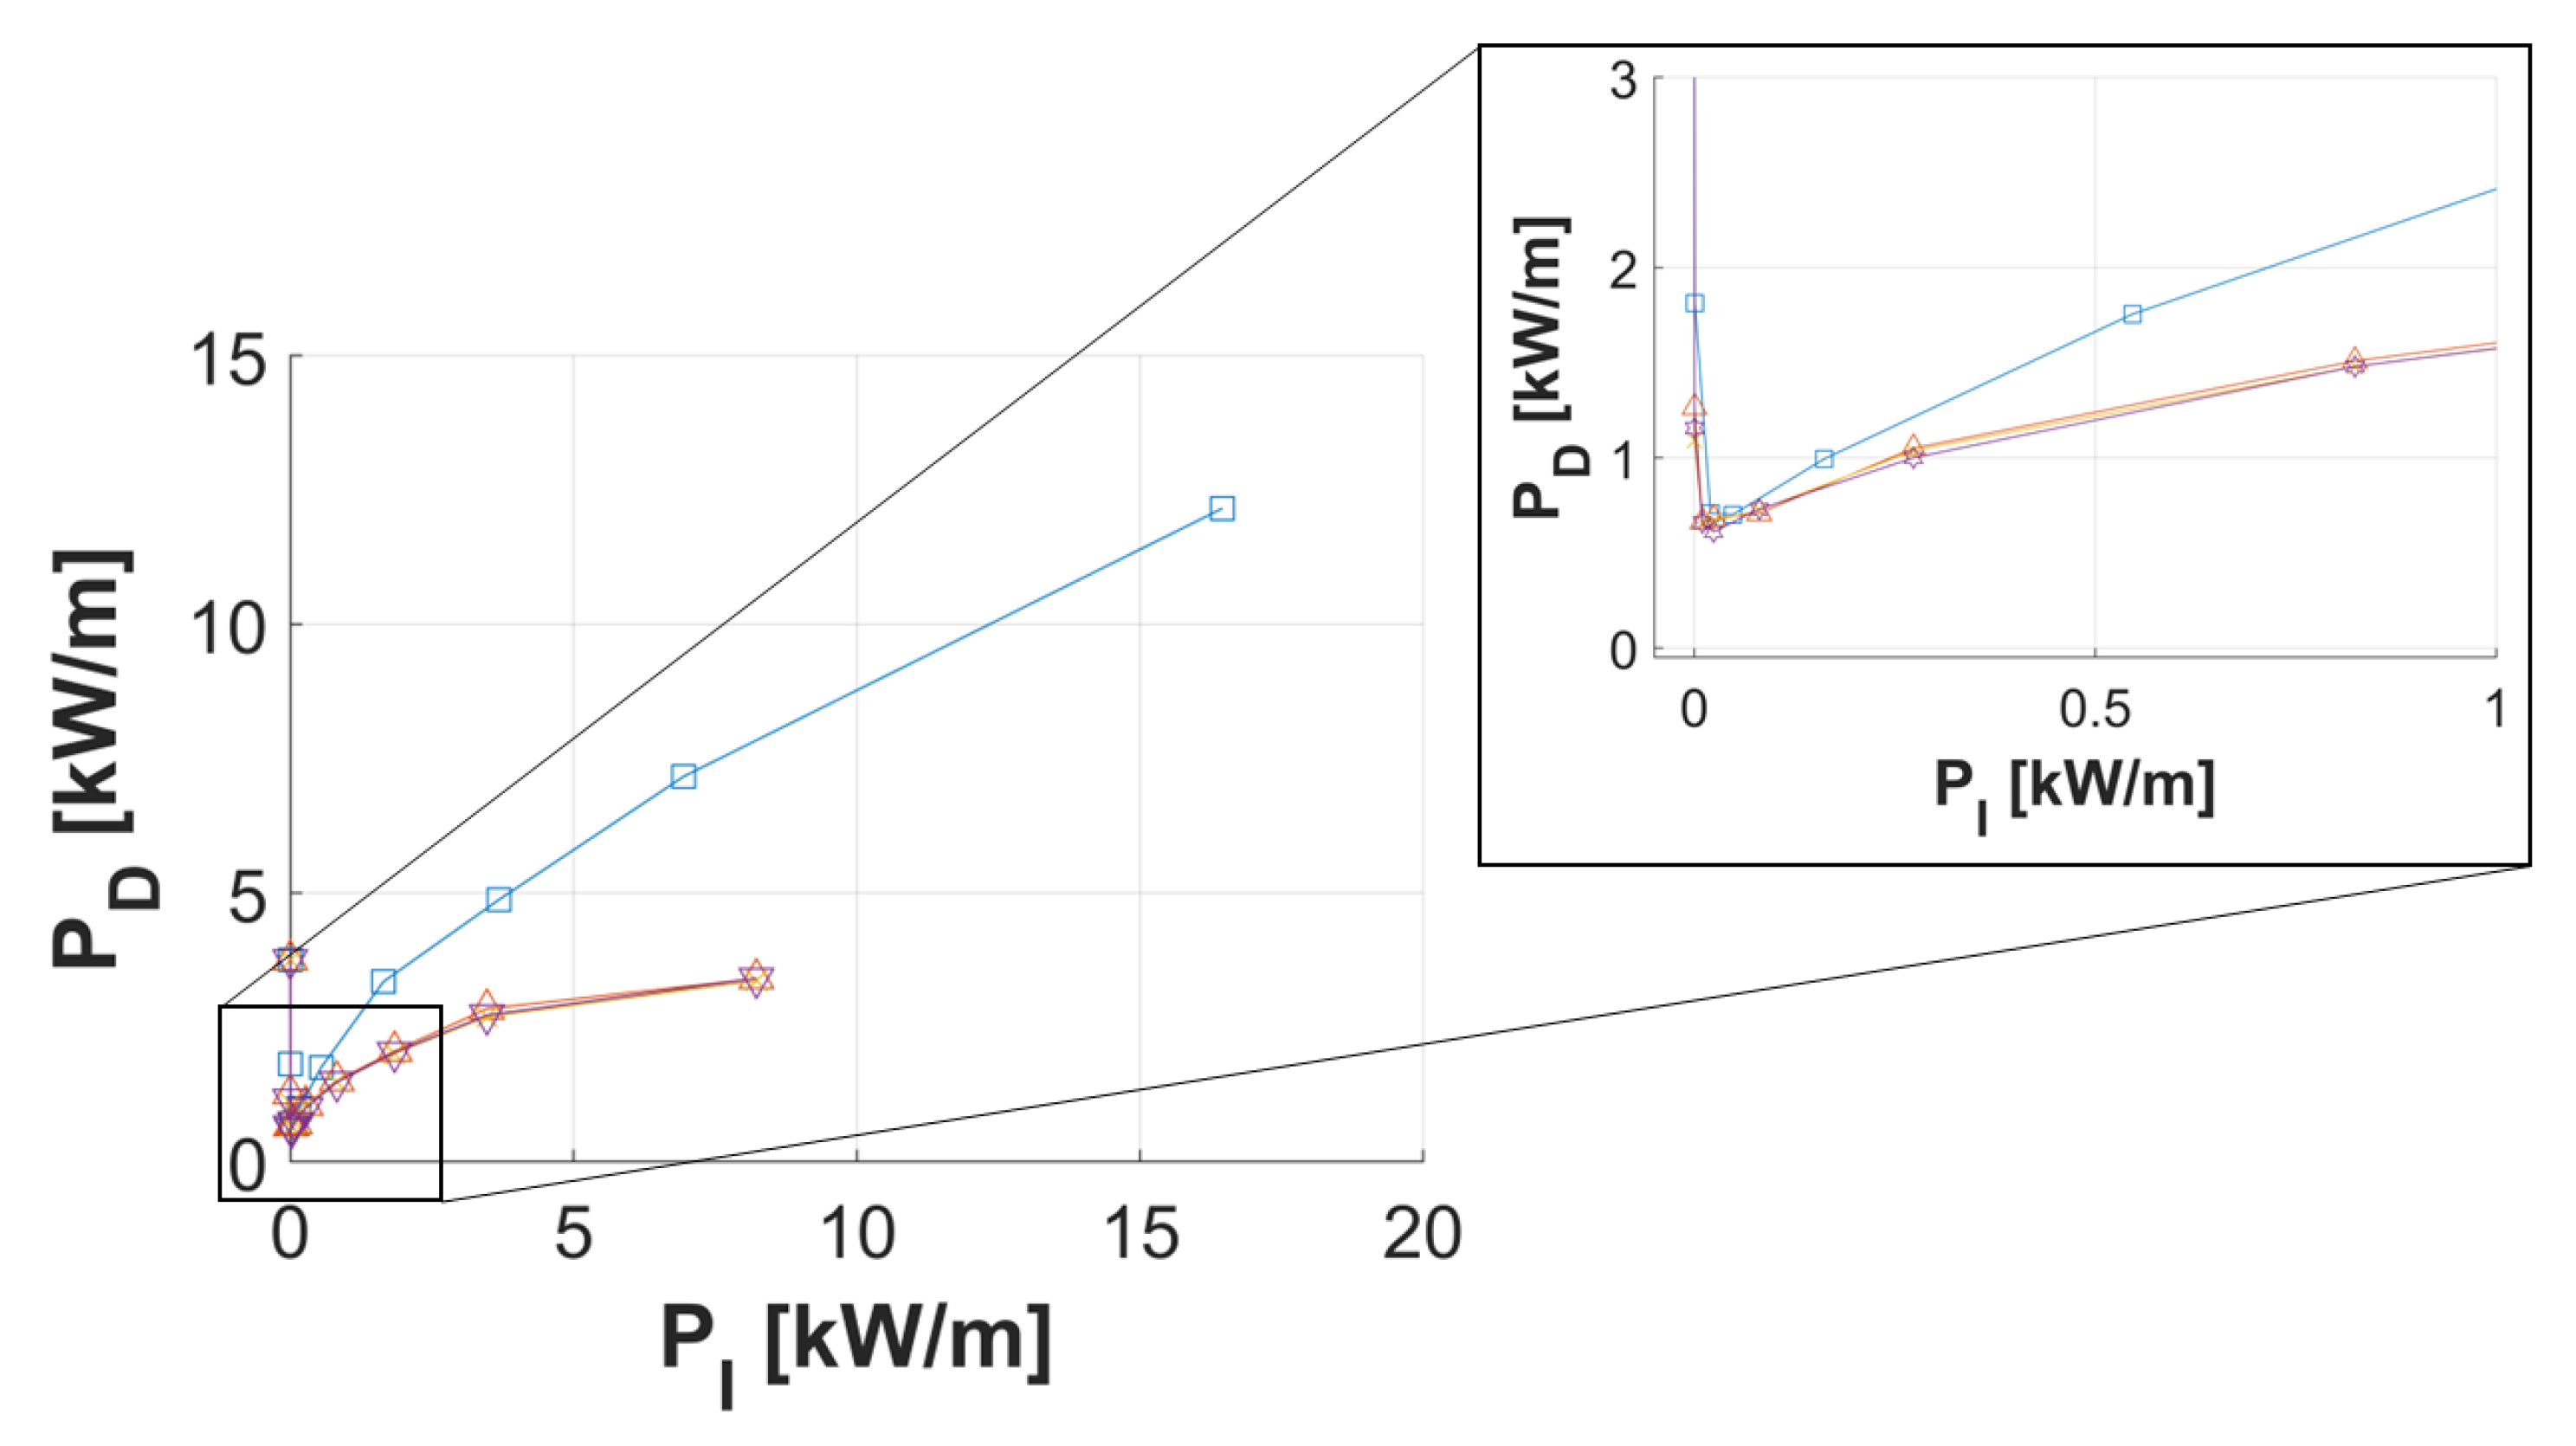
3.2.4. Efficiency Gain

A last analysis is performed herein, evaluating the energy requirements for each bleeding strategy. For a particular pulsating base bleed frequency, f, the total amount of mass flow injected per actuating period yields m = m ˙ D c / f . Hence, we may express the total energy needed to inject an amount of mass, m, at a certain flow speed, V, during a time period, T, as:
E I n j e c t i o n = 1 2 m V 2 = 1 2 m ˙ D c f V 2 .
The injection power, P I n j e c t i o n , defined as the energy required per unit of time, here expressed as a certain number of injection periods, N p e r i o d s , with respect to an actuation time, t, is then enunciated as:
P I n j e c t i o n = E I n j e c t i o n N p e r i o d s t = 1 2 m ˙ D c V 2 .
An important conclusion drawn from the aforementioned formulation is that, in the analytical approach performed, the injection power for a given base bleed rate is independent of the injection frequency and only depends on the duty cycle. The injection power for steady base bleed configurations can be recovered when M = T , while the injection power required for pulsating base bleed results from taking D c = M / T = 0.5 .
Given the two-dimensional nature of the analyses, the dissipated power per unit depth, P D i s s i p a t e d , can be defined as the product of the dimensional aerodynamic drag per unit depth and the inflow velocity:
P D i s s i p a t e d = q U c C d ¯ ,
with the corresponding values of for the dynamic pressure, q , and the free stream velocity, U , calculated from the inlet conditions described in Section 2.
The dissipated power is depicted in Figure 11, where the benefits of pulsed injection are clearly visible. It is interesting to note that, despite the variation on the ejected total mass flow and the subsequent variations on the base pressure, the gains in the averaged pressure drag of the most efficient configuration ( C b 0.13 ) are nearly the same as those obtained for a steady trailing edge actuation. Increasing the injection intensity, a pulsed injection results in a more efficient use of the energy compared to constant bleeding, this effect being more accused for higher injection powers.

4. Conclusions

In this work, a thorough numerical analysis on the effects and gains caused by pulsating flow actuation applied at an airfoil trailing edge has been conducted and compared with previous results obtained for constant base bleed and configurations without flow control at subsonic inflow speeds. In particular, actuation frequencies linked to the periodicity of the flow that may be caused by the blade passing on high pressure turbines is investigated. The potential capabilities of pulsating bleeding at the trailing edge as an active flow control methodology are notable, with proven effectiveness on the modulation of downstream flow structures, reducing the overall drag and controlling the frequency of the vortex detachment and transversal forces.
Considering the injected mass flow and the frequency of the injection as critical parameters, the results show a drag reduction of almost 85 % for a non-dimensional injected mass flow of C b = 0.13 . While this gain is comparable to that obtained with steady blowing, a pulsed injection results in a more efficient use of the energy compared with constant bleeding, with this effect being more pronounced for higher injection powers.
The use of base bleed reduces the amplitude of the force oscillations when compared to the non-blowing configuration, but the effect of the pulsating injection on the lift force associated frequencies is less evident. While relatively low ( C b 0.13 ) and high ( C b > 0.8 ) values of the non-dimensional base bleed mass flow are still related to a drastic reduction of the wake perturbations, indicating a vortex shedding neutralization, intermediate values behave more erratically and seem to be more dependent on the pulsating frequency than expected. Further investigation is needed in this regard. However, the obtained frequency spectrograms for the trailing edge downstream flow show a clear modulation of the perturbations and a coupling with the frequency of actuation. Interestingly, a Coanda effect appears for mid and low values of C b , in a similar behavior to that obtained for a steady blowing, and its magnitude (measured through the angle of the base bleed jet angle) increases with the frequency of the pulsating injection. Contrary to the cases with constant base bleed, where the deviation in the jet remains constant, now an oscillation in the direction of the jet linked to the intermittent flow injection appears, causing an increment of the absolute value of the average jet angle.
As coolant flow ejected at the trailing edge is currently employed on the enhancement of airfoil performance through base pressure modulation, the results shown herein present the use of pulsating flow actuation as a more efficient flow modulating tool to be considered on cooling flow systems. Additionally, intermittent flow actuation allows for modulate the airfoil wake structures, coupling it to the employed actuating frequencies and allowing for further exploitation of these methodologies.

Author Contributions

Conceptualization, A.M.-C. and G.P. and E.V.; Methodology, C.C. and A.M.-C.; Validation, C.C. and A.M.-C.;Writting, C.C., A.M.-C., E.V. and G.P.; Funding Acquisition, E.V. and G.P. All authors have read and agreed to the published version of the manuscript.

Funding

This research has received funding from he Ministerio de Ciencia, Innovation e Universidades of Spain under the project SIMOPAIR (Ref: RTI2018-480 097075-B-I00). This work has received funding from the European Union’s Horizon 2020 research and innovation programme under the project FLOWCID, grant agreement No 101019137.

Institutional Review Board Statement

Not Applicable.

Informed Consent Statement

Not Applicable.

Data Availability Statement

Not Applicable.

Acknowledgments

The authors gratefully acknowledge the Universidad Politécnica de Madrid for providing computing resources on Magerit Supercomputer.

Conflicts of Interest

The authors declare no conflict of interest.

References

  1. Paniagua, G.; Szokol, S.; Kato, H.; Manzini, G.; Varvill, R. Contra-rotating turbine aero-design for an advanced hypersonic propulsion system. J. Propuls. Power 2008, 24, 1269–1277. [Google Scholar] [CrossRef]
  2. Sieverding, C.H.; Heinemann, H. The influence of boundary layer state on vortex shedding from flat plates and turbine cascades. ASME J. Turbomach. 1990, 112, 181–187. [Google Scholar] [CrossRef]
  3. Sousa, J.; Paniagua, G.; Collado, E. Supersonic turbine design suitable for detonation based engines. Chin. J. Aeronaut. 2022, in press. [Google Scholar] [CrossRef]
  4. Denton, J.D. Loss Mechanisms in Turbomachinery. ASME J. Turbomach. 1993, 115, 621–656. [Google Scholar] [CrossRef]
  5. Nash, J.F. A Review of Research on Two-Dimensional Base Flow. ARC R&M 1963, 1–25. [Google Scholar]
  6. Sieverding, C.H. The influence of trailing edge ejection on the base pressure in transonic turbine cascades. Proc. ASME Turbo Expo 1983, 105, 215–222. [Google Scholar] [CrossRef]
  7. Motallebi, F.; Norbury, J. The effect of base bleed on vortex shedding and base pressure in compressible flow. J. Fluid Mech. 1981, 110, 273–292. [Google Scholar] [CrossRef]
  8. Barigozzi, G.; Armellini, A.; Mucignat, C.; Casarsa, L. Experimental investigation of the effects of blowing conditions and Mach number on the unsteady behavior of coolant ejection through a trailing edge cutback. Int. J. Heat Fluid Flow 2012, 37, 37–50. [Google Scholar] [CrossRef]
  9. Rehder, H.J. Investigation of trailing edge cooling concepts in a high pressure turbine cascade-aerodynamic experiments and loss analysis. J. Turbomach. 2012, 134, 51029-1–51029-11. [Google Scholar] [CrossRef]
  10. Li, Y.; Xu, H.; Wang, J.; Zhu, J.; Su, H. Numerical study of unsteady flow and cooling characteristics of turbine blade cutback trailing edges integrated with pin fins and film holes. Aerosp. Sci. Technol. 2022, 126, 107604. [Google Scholar] [CrossRef]
  11. Kost, F.H.; Holmes, A.T. Aerodynamic effect of coolant ejection in the rear part of transonic rotor blades. In AGARD Heat Transfer and Cooling in Gas Turbines (SEE N86-29823 21-07); AGARD: Neuilly Sur Seine, France, 1985. [Google Scholar]
  12. Raffel, M.; Kost, F. Investigation of aerodynamic effects of coolant ejection at the trailing edge of a turbine blade model by PIV and pressure measurements. Exp. Fluids 1998, 24, 447–461. [Google Scholar] [CrossRef]
  13. Yang, Z.; Hu, H. An experimental investigation on the trailing edge cooling of turbine blades. Propuls. Power Res. 2012, 1, 36–47. [Google Scholar] [CrossRef] [Green Version]
  14. Saracoglu, B.H.; Paniagua, G.; Sanchez, J.; Rambaud, P. Effects of blunt trailing edge flow discharge in supersonic regime. Comput. Fluids 2013, 88, 200–209. [Google Scholar] [CrossRef] [Green Version]
  15. Saracoglu, B.H.; Paniagua, G.; Salvadori, S.; Tomasoni, F.; Duni, S.; Yasa, T.; Miranda, A. Trailing edge shock modulation by pulsating coolant ejection. Appl. Therm. Eng. 2012, 48, 1–10. [Google Scholar] [CrossRef]
  16. Bernardini, C.; Salvadori, S.; Martelli, F.; Paniagua, G.; Saracoglu, B.H. Pulsating Coolant Ejection Effects Downstream of Supersonic Trailing Edge. Eng. Appl. Comput. Fluid Mech. 2013, 7, 250–260. [Google Scholar] [CrossRef] [Green Version]
  17. Saavedra, J.; Paniagua, G.; Saracoglu, B.H. Experimental Characterization of the Vane Heat Flux Under Pulsating Trailing-Edge Blowing. J. Turbomach. 2017, 139, 061004. [Google Scholar] [CrossRef]
  18. Martinez-Cava, A.; Wang, Y.; de Vicente, J.; Valero, E. Pressure Bifurcation Phenomenon on Supersonic Blowing Trailing Edges. AIAA J. 2019, 57, 153–164. [Google Scholar] [CrossRef]
  19. Martinez-Cava, A.; Rodríguez, D.; Valero, E.; Paniagua, G. Characterization of base bleed effects on subsonic trailing edge flows. Aerosp. Sci. Technol. 2021, 113, 106730. [Google Scholar] [CrossRef]
  20. Perkins, E.W.; Jorgensen, L.H.; Sommer, S.C. NACA-TR-1386: Investigation of the Drag of Various Axially Symmetric Nose Shapes of Fineness Ratio 3 for Mach Numbers from 1.24 to 7.4; Technical Report; National Advisory Committee for Aeronautics; Ames Aeronautical Lab.: Moffett Field, CA, USA, 1958. [Google Scholar]
  21. Schwamborn, D.; Gerhold, T.; Heinrich, R. The DLR Tau-code: Recent applications in research and industry. In Proceedings of the ECCOMAS CFD 2006: European Conference on Computational Fluid Dynamics, Egmond aan Zee, The Netherlands, 5–8 September 2006; Delft University of Technology: Edmond aan Zee, The Netherlands, 2006. [Google Scholar]
  22. Wilcox, D.C. Formulation of the k-w Turbulence Model Revisited. AIAA J. 2008, 46, 2823–2838. [Google Scholar] [CrossRef] [Green Version]
  23. Clark, J.P.; Grover, E.A. Assessing convergence in predictions of periodic-unsteady flowfields. In Turbo Expo: Power for Land, Sea, and Air; Paper No: GT2006-90735; International Gas Turbine Institute: Barcelona, Spain, 2006; pp. 1831–1841. [Google Scholar] [CrossRef]
Figure 1. Representational scheme of trailing edge base region flow, together with static pressure contours and static pressure time series. Image partially reproduced from Martinez-Cava et al. [19]. Copyright © 2021, published by Elsevier Masson SAS. All rights reserved.
Applsci 12 06760 g001
Figure 2. Detail of the grid spatial discretization used on the numerical analysis. General view (a) and trailing edge mesh details (b). Image partially reproduced from Martinez-Cava et al. [19]. Copyright © 2021, published by Elsevier Masson SAS. All rights reserved.
Applsci 12 06760 g002
Figure 3. Illustration of the actuating boundary condition for periodic base bleed.
Applsci 12 06760 g003
Figure 4. Evolution of the temporal averaging of the static base pressure ratio ( P r a t i o = P b a s e / P b a s e N B ) and the Strouhal number ( S t = f D / U ) when the base bleed intensity is increased. Those mass flows related to non-symmetrical trailing edge flows are highlighted in blue, while those associated with the disappearance of vortex shedding are marked in green. Reproduced from Martinez-Cava et al. [19]. Copyright © 2021, published by Elsevier Masson SAS. All rights reserved.
Applsci 12 06760 g004
Figure 5. Mean drag coefficient relative to a non-blowing configuration against non-dimensional base bleed rate for constant (-□-) [19] and pulsating base bleeds at 100 Hz (-△-), 150 Hz (-×-) and 200 Hz (-▽-).
Applsci 12 06760 g005
Figure 6. Snapshots of instantaneous pressure coefficient contours for a pulsating base bleed of f = 100 Hz and non-dimensional base bleed rates of C b = 0.13 and C b = 0.90 . (a) t = 0.1 T . (b) t = 0.4 T . (c) t = 0.7 T . (d) t = T . (e) t = 0.1 T . (f) t = 0.4 T . (g) t = 0.7 T . (h) t = T .
Applsci 12 06760 g006
Figure 7. Strouhal number (a) and relative lift coefficient amplitude (b), A C l , R = A C l / A C l , N B , against non-dimensional base bleed rate. Results for constant (-□-) [19] and pulsating base bleeds at 100 Hz (-△-), 150 Hz (-×-) and 200 Hz (-▽-).
Applsci 12 06760 g007
Figure 8. Main dimensions of the model and location of numerical probes for flow monitoring. Regions for jet flow analysis are highlighted in blue, and the location of the wake analysis probe is named F w .
Applsci 12 06760 g008
Figure 9. Frequency spectrograms taken at location F w (see Figure 8) during four actuation cycles, for a pulsating base bleed of f = 100 Hz and different non-dimensional base bleed rates. (a) C b = 0.00 . (b) C b = 0.13 . (c) C b = 0.90 .
Applsci 12 06760 g009
Figure 10. (a) Absolute value of the jet angle, | β | , (continuous lines) and averaged lift coefficient, C l ¯ , against non-dimensional base bleed rate (dashed lines). Results for constant (-□-) [19] and pulsating base bleeds at 100 Hz (-△-), 150 Hz (-×-), and 200 Hz (-▽-). (b) Snapshot of base region velocity contours, illustrating base bleed jet angle variations.
Applsci 12 06760 g010
Figure 11. Dissipated power, P D , against injection power, P I , for constant (□) [19] and pulsating base bleeds at 100 Hz (△), 150 Hz (×), and 200H z (▽).
Applsci 12 06760 g011
Publisher’s Note: MDPI stays neutral with regard to jurisdictional claims in published maps and institutional affiliations.

