Article

Influence of Wake Intensity on the Unsteady Flow Characteristics of the Integrated Aggressive Interturbine Duct

1
Key Laboratory of Light-Duty Gas Turbine, Institute of Engineering Thermophysics, C.A.S., Beijing 100190, China
2
School of Aeronautics and Astronautics, University of Chinese Academy of Sciences, Beijing 100049, China
*
Authors to whom correspondence should be addressed.
Appl. Sci. 2022, 12(13), 6655; https://doi.org/10.3390/app12136655
Submission received: 26 May 2022 / Revised: 25 June 2022 / Accepted: 27 June 2022 / Published: 30 June 2022
(This article belongs to the Special Issue Flow Control, Active and Passive Applications)

Abstract

:
The interturbine transition duct (ITD), located between the high-pressure (HP) and low-pressure (LP) turbines of aeroengines, tends to be designed as an aggressive ITD integrated with wide-chord struts to meet the requirements of civil aeroengines for high bypass ratios and thrust–weight ratios. This paper presents a detailed unsteady numerical investigation of the effects of the HP rotor trailing-edge radius on the unsteady flow characteristics in the integrated aggressive interturbine transition duct (AITD), including the transport and dissipation of HP rotor wakes, the control mechanism of HP rotor wakes on flow separation and the influence of wake parameters. A sweeping rod, with a nondimensional diameter ranging from d/s = 0.056~0.143 (based on the pitch (s) of wide-chord struts at the midspan) and a reduced frequency ( f ) of 1.07, is used to simulate the HP rotor wake to decouple its influence from other secondary flows. Using the k-ω SST turbulence model and gamma–theta transition model, a structured grid with 6.3 million nodes can achieve similar global results. The wake in the lower part of the AITD channel dissipates rapidly because of the stretching between its own circumferential motion and the radial upward secondary flow, especially for a small d/s. Only the residual wake in the upper part can reach wide-chord struts in the case with large d/s. A sweeping rod with a large d/s can reduce the radial pressure gradient in the AITD, inhibit the internal secondary flow to a certain extent, reduce the dissipation rate of the wake, enhance its suppression effect on flow separation on a wide-chord strut, and decrease the flow loss. However, the wake can also enhance the passage vortex due to the increasing circumferential pressure gradient in the wide-chord strut channel, resulting in increasing blade profile loss. In the scope of this study, the aerodynamic gain of the wake is still not enough to compensate for its loss increment (including its own dissipation loss). Therefore, selecting a small trailing-edge radius of the HP rotor is conducive to improving the aerodynamic performance of the integrated AITD.

1. Introduction

The interturbine transition duct (ITD) is an annular S-shaped diffuser between the high-pressure turbine (HPT) and low-pressure turbine (LPT), as shown in Figure 1. With the increase in the bypass ratio of a high-performance engine, designers often use an aggressive interturbine transition duct (AITD) to raise the LPT passage to reduce the low-pressure rotor speed and improve the LPT output power. The larger outlet-to-inlet area ratio, shorter axial length and/or larger HP-to-LP radial offset of the AITD make the axial, circumferential and radial pressure gradients more complex, which in turn affects the internal secondary flow development and loss mechanisms of the AITD.
Dominy et al. [1,2], as early investigators of the ITD, indicated that although the simulated HPT steady wake and swirl did not result in large changes in the overall loss, they were important factors that affected the structure of the secondary flow and the distribution of loss in the ITD. They also found that because of the pressure gradient inside the ITD, the simulated HPT wakes interacted with the boundary layer of the end wall, and a pair of counter vortices were generated at the hub and the casing, which affected the distribution of loss and the outlet flow angle. Zhang et al. [3] improved the understanding of the formation mechanism of the vortex pairs near the hub and shroud: the low momentum fluid near the ITD hub forms the pair of vortices driven by the radial pressure gradient, while the migrated low momentum fluid forms a three-dimensional boundary layer on the shroud and develops into a pair of vortices. Miller et al. [4] indicated that the radial migration and mixing of the flow between the midspan and the shroud caused by the radial pressure gradient was the main source of loss in it. By comparing two ITDs with different axial lengths and the same area ratio and radial offset, Norris et al. [5] found that the changes in ITD end wall curvature and diffusion rate caused by the decreased axial length were the main factors affecting the internal secondary flow in ITDs. Based on the detailed measurement data of an ITD, Zhang et al. [6] concluded that an increased mean rise angle and area ratio aggravated the flow separation on the shroud by enhancing the inverse streamwise pressure gradient. Axelsson [7,8,9], Göttlich [10] and Marn [11,12,13] studied the influence of the upstream HPT leakage flow on the internal flow of an ITD and indicated that the increase in tangential flow angle near the shroud caused by the increasing tip clearance helped to suppress the boundary layer separation of the shroud but led to an increase in the overall loss. Dominy [14], Hu [15], Zhang [16] and Bailey [17] investigated the influence of inlet swirls on the ITD flow. They found that the inlet swirl could increase the effective fluid motion path in an ITD to suppress the influence of wall curvature on its internal pressure gradient, while the increasing inlet swirl near the shroud inhibited the boundary layer separation on the shroud. Schennach et al. [18] studied the effect of the potential flow of the low-pressure turbine guide vane (LPT-GV) on the ITD flow and believed that an optimal circumferential position of the LPT-GV maximized the system performance for a specific ITD system.
Norris [19,20], Miller [21], and Walker [22] indicated that the built-in strut in an ITD changed the area distribution of flow passage, which forced the pipeline to expand, resulting in worse boundary layer separation, significantly enhanced unsteady flow, and greatly increased losses. Lengani [23,24] found that the interaction between the wakes and vortex structure of struts and the LPT rotor not only caused fluctuations in flow velocity and flow angle but also greatly affected the pressure fluctuation peak downstream. On the basis of their proposed integrated design concept of an ITD and strut, Marn et al. [25] used 18 wide-chord struts to replace 48 LPT-GVs in the original ITD, which not only ensured the outlet flow quality of the ITD but also reduced the weight of the guide vane by 20–39%. The integrated design of a wide-chord strut and ITD can enhance the secondary flow in the ITD, resulting in a deterioration in the uniformity of the outlet flow. Therefore, Spataro [26] arranged two zero-loading splitter blades between adjacent wide-chord struts, effectively improving the uniformity of ITD outlet flow. Bader [27] and Faustmann [28] further indicated that a small splitter blade could break the large passage vortices in the passage of wide-chord struts into small passage vortices, thereby improving the outlet flow uniformity at the expense of increasing flow losses. Du [29], Wang [30], Liu [31], Xu [32] and Liu [33] carried out design and flow mechanism research of the integrated AITD and noted that the convergence passage of a wide-chord strut can effectively inhibit the three-dimensional separation on the shroud and suppress the passage vortices around the blade tip by improving the radial and circumferential pressure gradient, which is conducive to reducing the flow loss in the AITD.
In an integrated AITD, the distance between the LPT-GV and the upstream HPT rotor is greatly shortened so that the wake of the HPT rotor can reach the LPT-GV before dissipation, which provides an opportunity to use the upstream sweeping wakes to inhibit its boundary layer separation. The inhibition mechanism of upstream sweeping wakes on the flow separation of high-loading LPT blades in cascade wind tunnels [34,35,36,37,38] has been studied systematically. However, different from the linear cascade flow, the AITD is an S-shaped annular passage with a strong axial reverse pressure gradient and radial pressure gradient, which inevitably affects the transport and dissipation of the HP rotors’ wakes in AITD. There were only a few studies [18,23,24] on the influence of sweeping wake on ITD flow, and most of them were generally coupled with the influence of inlet swirl or tip leakage flow, so the impact of a decoupled wake is still not particularly clear. Liu et al. [33,39,40] studied the transport mechanism of the decoupled wake in AITD and the influence of Re and FSTI (free stream turbulence intensity) on its propagation. They found that with the shortening of the axial length of AITD, the upstream wake almost existed in the full channel range, and could periodically suppress the separation bubble on the suction surface of LPT-GV. Based on their works, the effects of sweeping wakes with different HPT rotor trailing-edge radii on the internal flow field of an AITD and the boundary layer of an integrated LPT-GV will be studied in this paper.

2. Numerical Methods

This paper employed the commercial ANSYS CFX solver, a fully implicit solver coupled algebraic multigrid technique, to solve three-dimensional Reynolds-averaged Navier–Stokes (RANS) equations. The high-resolution upwind discrete scheme was used for convective and diffusive terms, and the second-order backward difference method was used for time terms. Turbulence closure was achieved through the shear stress transport (SST) k-ω two-equation turbulence model coupled with the gamma–theta transition model, since this approach can model flow structures with high-curvature endwall geometry and high turbulent dissipation in freestreams [3].

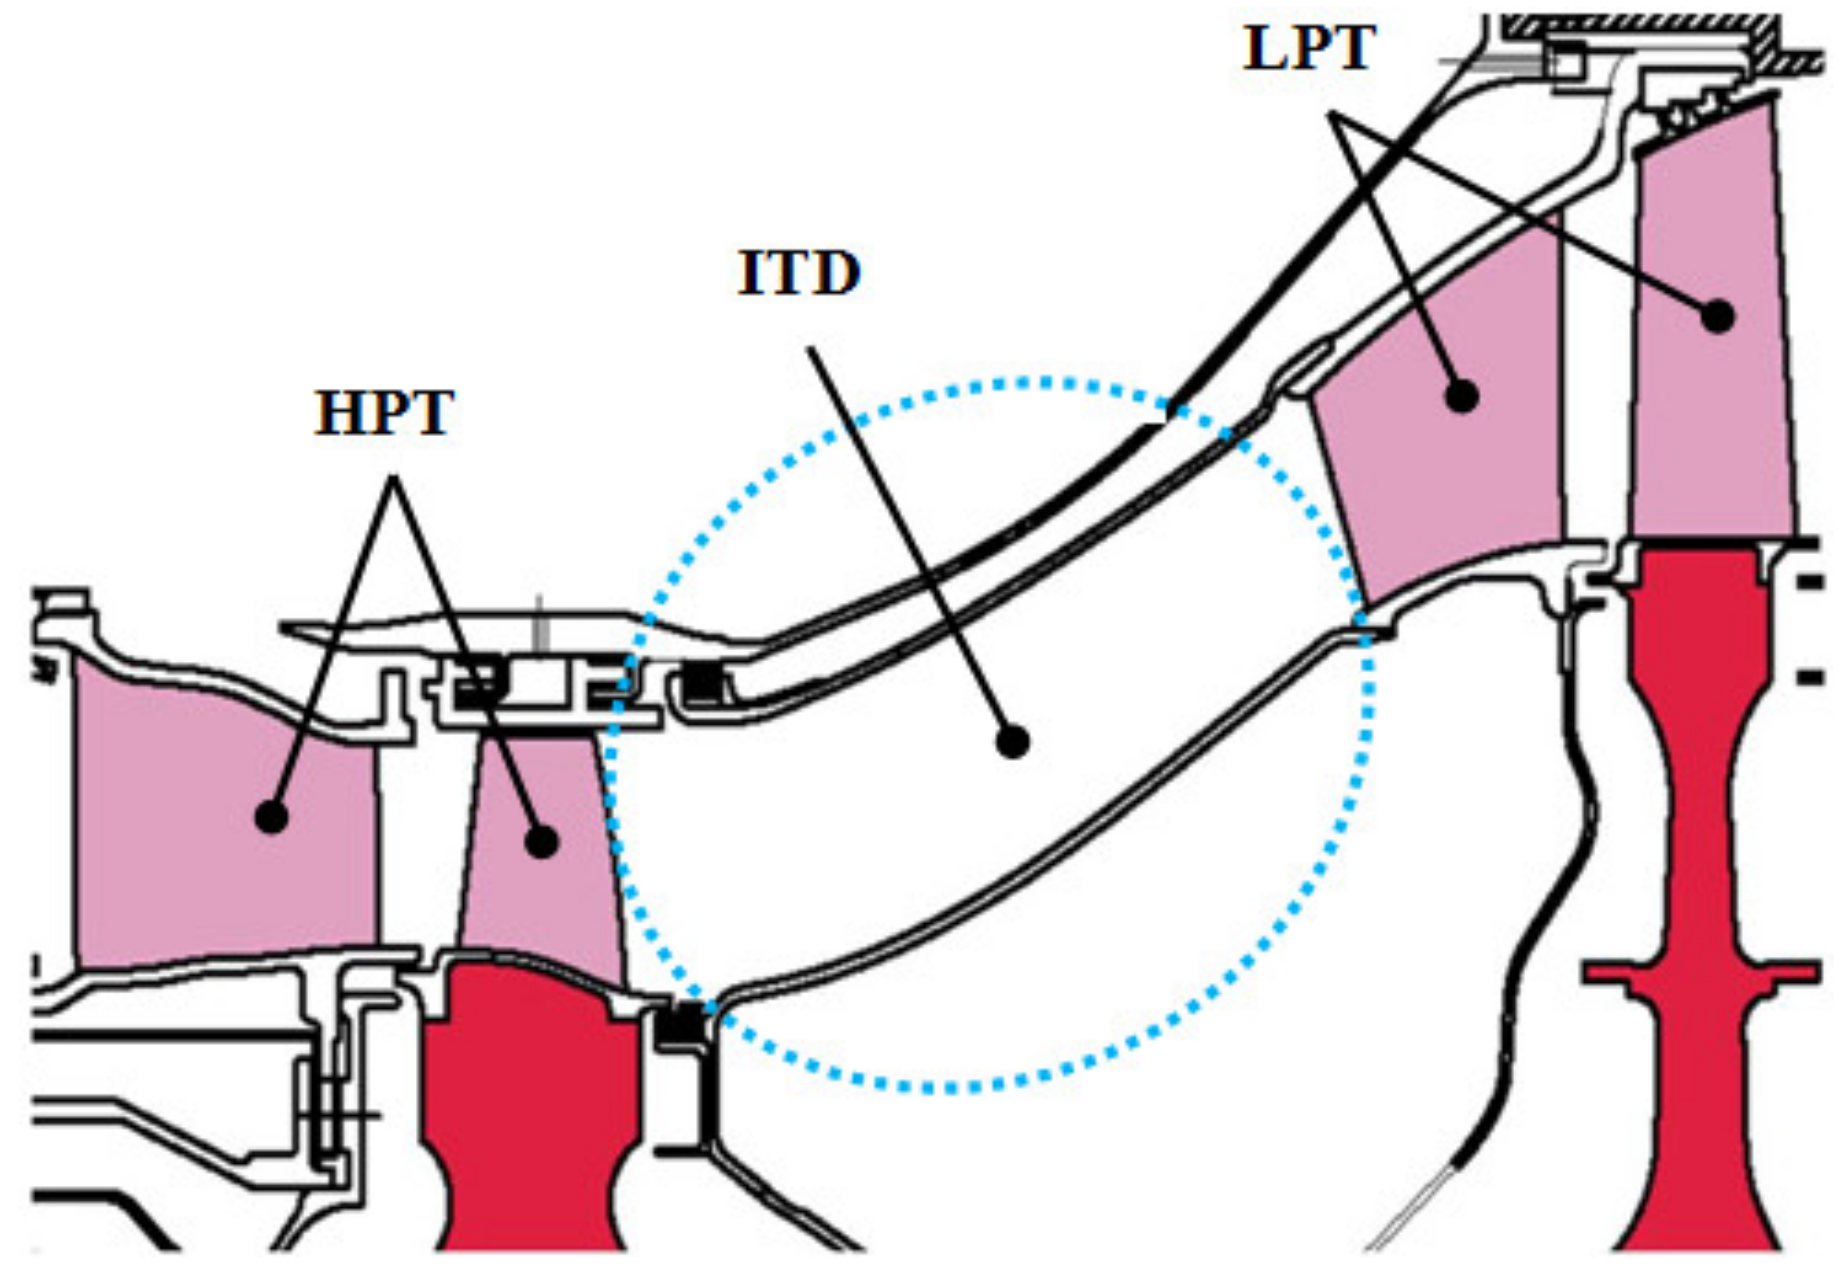
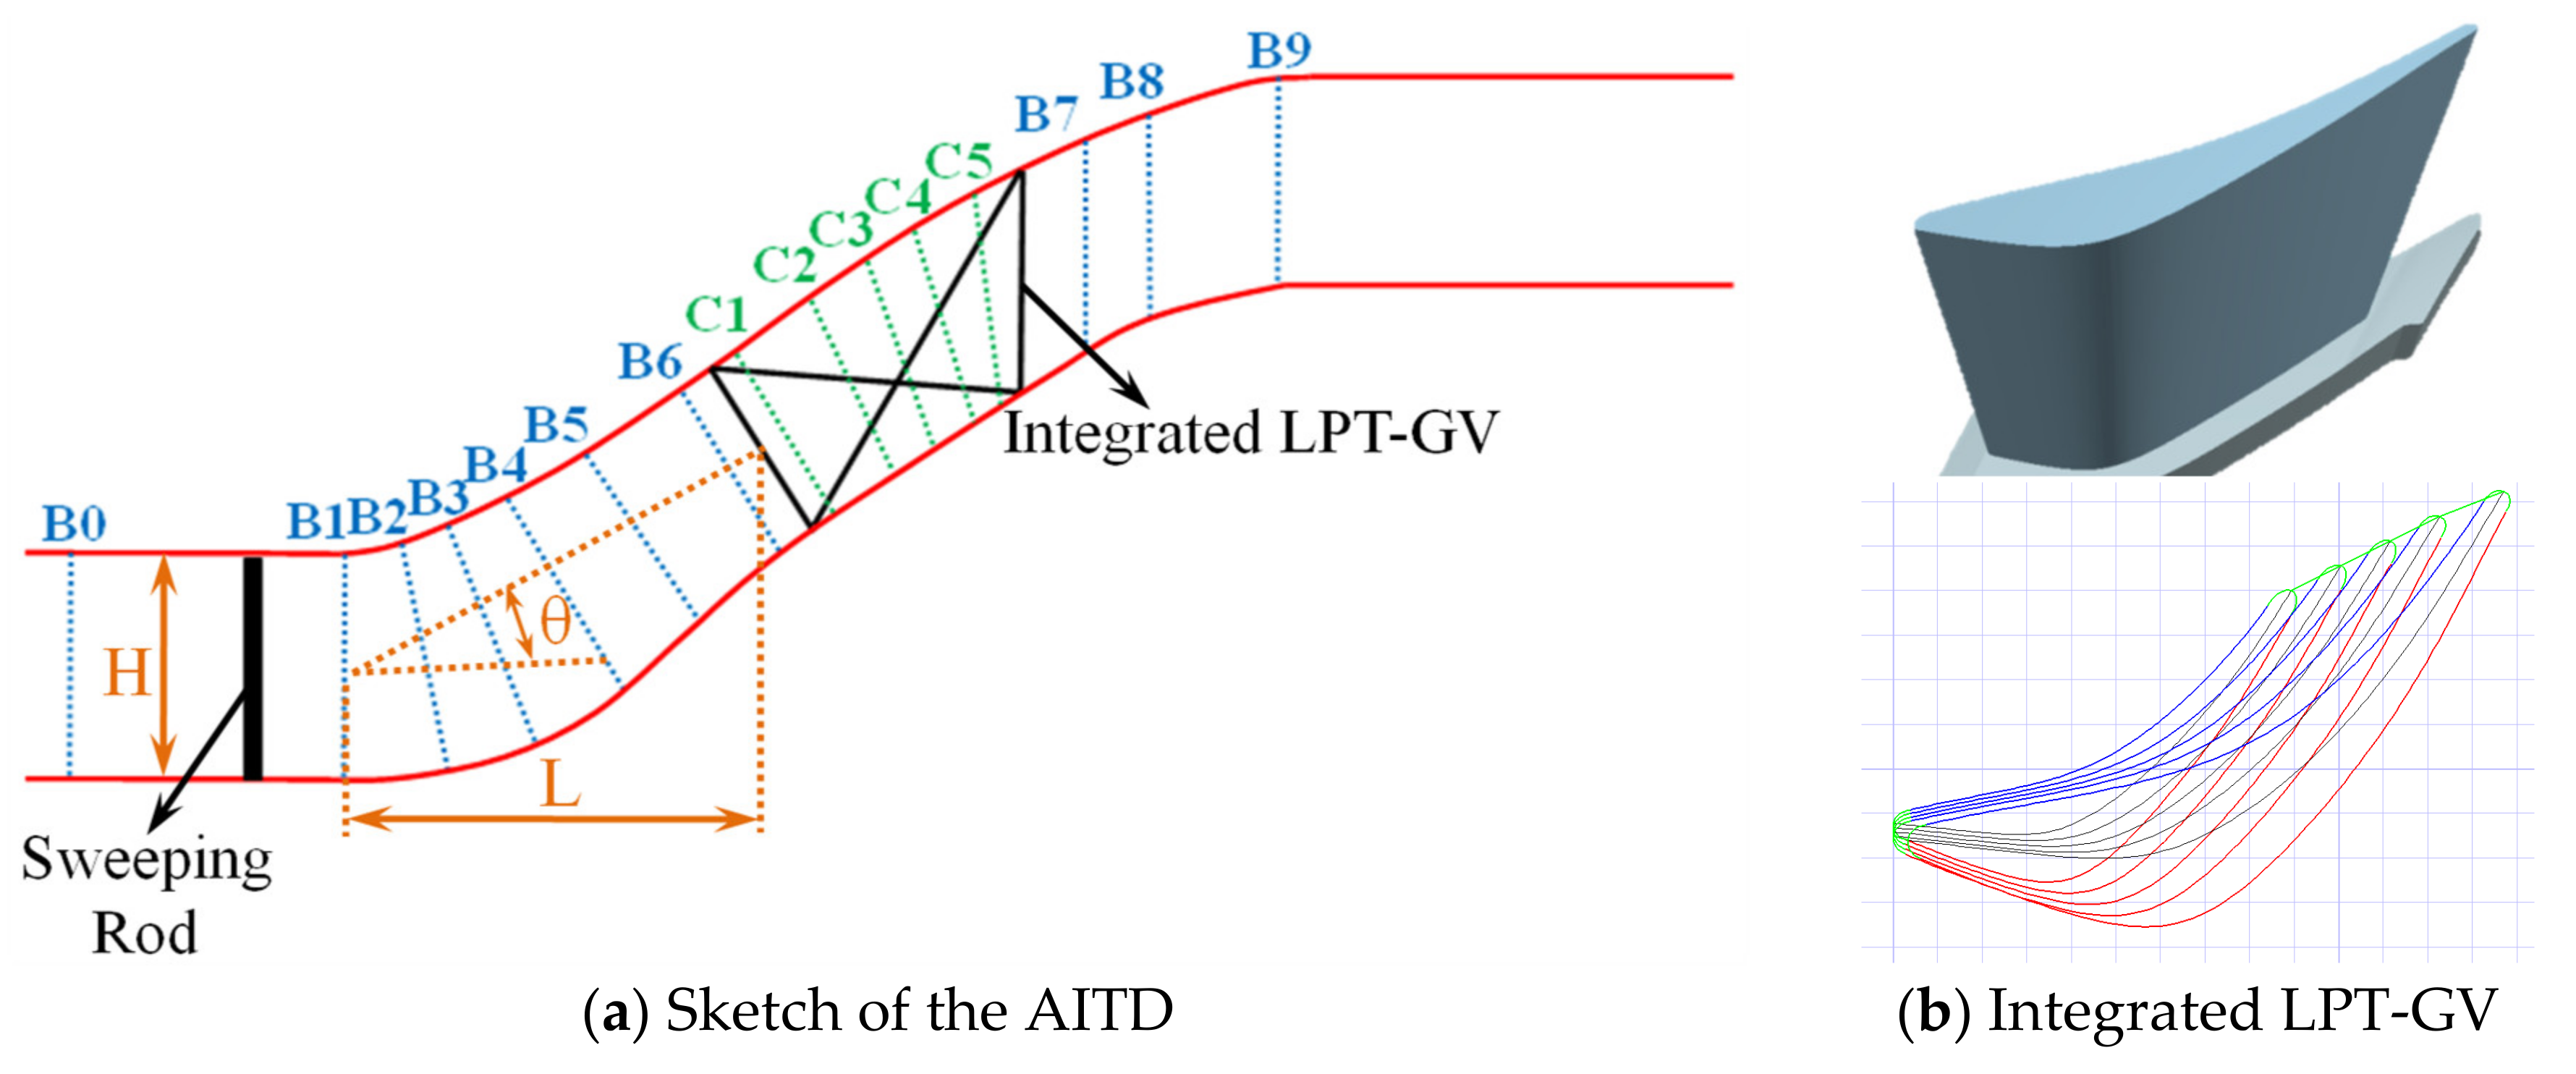
2.1. Integrated AITD

As shown in Figure 2a,b, the integrated AITD, which was designed based on the original ITD of a turbofan engine, includes the aggressive intermediate-turbine duct and the integrated LPT-GV. For the AITD, its inlet aspect ratio (Rhub/Rtip) was 0.656, and the inlet channel height (H) was 85 mm. The nondimensional duct length (L/H, ITD axial length/inlet annulus height) was 1.97, and the mean rise angle (θ) was 28.08° with an outlet-to-inlet area ratio (AR) of 1.34. Based on the above parameters, the red dot in Figure 3 shows the comparison between the design parameters of this AITD and those of other turbofan engines, where cp* is the best AR Line of ITD for the given L/hin, and cp** is the best L/hin line for the given AR. The design parameters of the conventional ITD are generally located between these two lines, while the ITD (with small L/hin and large AR) studied in this paper is marked by the red dot on the left side of the cp* line, which indicates that it is in the category of an AITD. The design parameters in Table 1 of the integrated LPT-GV refer to the prototype guide vane of the turbofan engine with its inlet and outlet metal angles unchanged. Figure 2b shows the geometric model of the integrated LPT-GV and the blade profiles for sections in the spanwise direction.
To decouple the sweeping wakes from other secondary flows, such as the tip leakage flow, sweeping rods were used to simulate the wakes of HPT rotors to isolate the effects of the sweeping wakes. Previous studies have demonstrated that when the flow resistance of the rod is the same as that of the blade, the structure of the rod’s wake is the same as that of the blade [34]. As shown in Figure 2, the sweeping rod was arranged 0.4H upstream of the AITD inlet, and its diameter (d) was calculated according to the measured airfoil loss (Y) of the HPT rotor by the following equation:
Y = C d d S b Z 1 0.25 C d d S b Z 1 Z 2 1
where C d represents the resistance coefficient of the rod (approximately 1.05 in the range of Re values studied in this paper),   S b is the rod spacing, and Z is the cosecant of the relative flow angle at the HPT outlet. Under the design conditions, the diameter of the sweeping rod is 4.6 mm (d/s = 0.10) with a rotating speed of 220 RPM, which is equivalent to a reduced frequency of f = f H P T C x / u e = 1.07 . To study the wake effect of the HPT rotor with different trailing-edge radii, this paper also carried out unsteady simulations for d/s values of 0.056, 0.078, 0.122 and 0.143.
As shown in Figure 2a, fifteen sections (B0–B9, C1–C5) in the streamwise direction were selected for characterizing the flow field in the integrated AITD. Section B0 is located at an inlet of the computational domain and would be used as a reference plane; Section B1 is located at the AITD inlet; Sections B2-B6 are located inside the AITD, roughly perpendicular to the shroud and hub; Sections C1-C5 are located in the passage of the integrated LPT-GV; Sections B7–B9 are located at 25%Cx, 50%Cx and 100%Cx (Cx is the axial chord of the LPT-GV midspan) downstream of the LPT-GV, respectively.

2.2. Boundary Conditions and Grid Independence
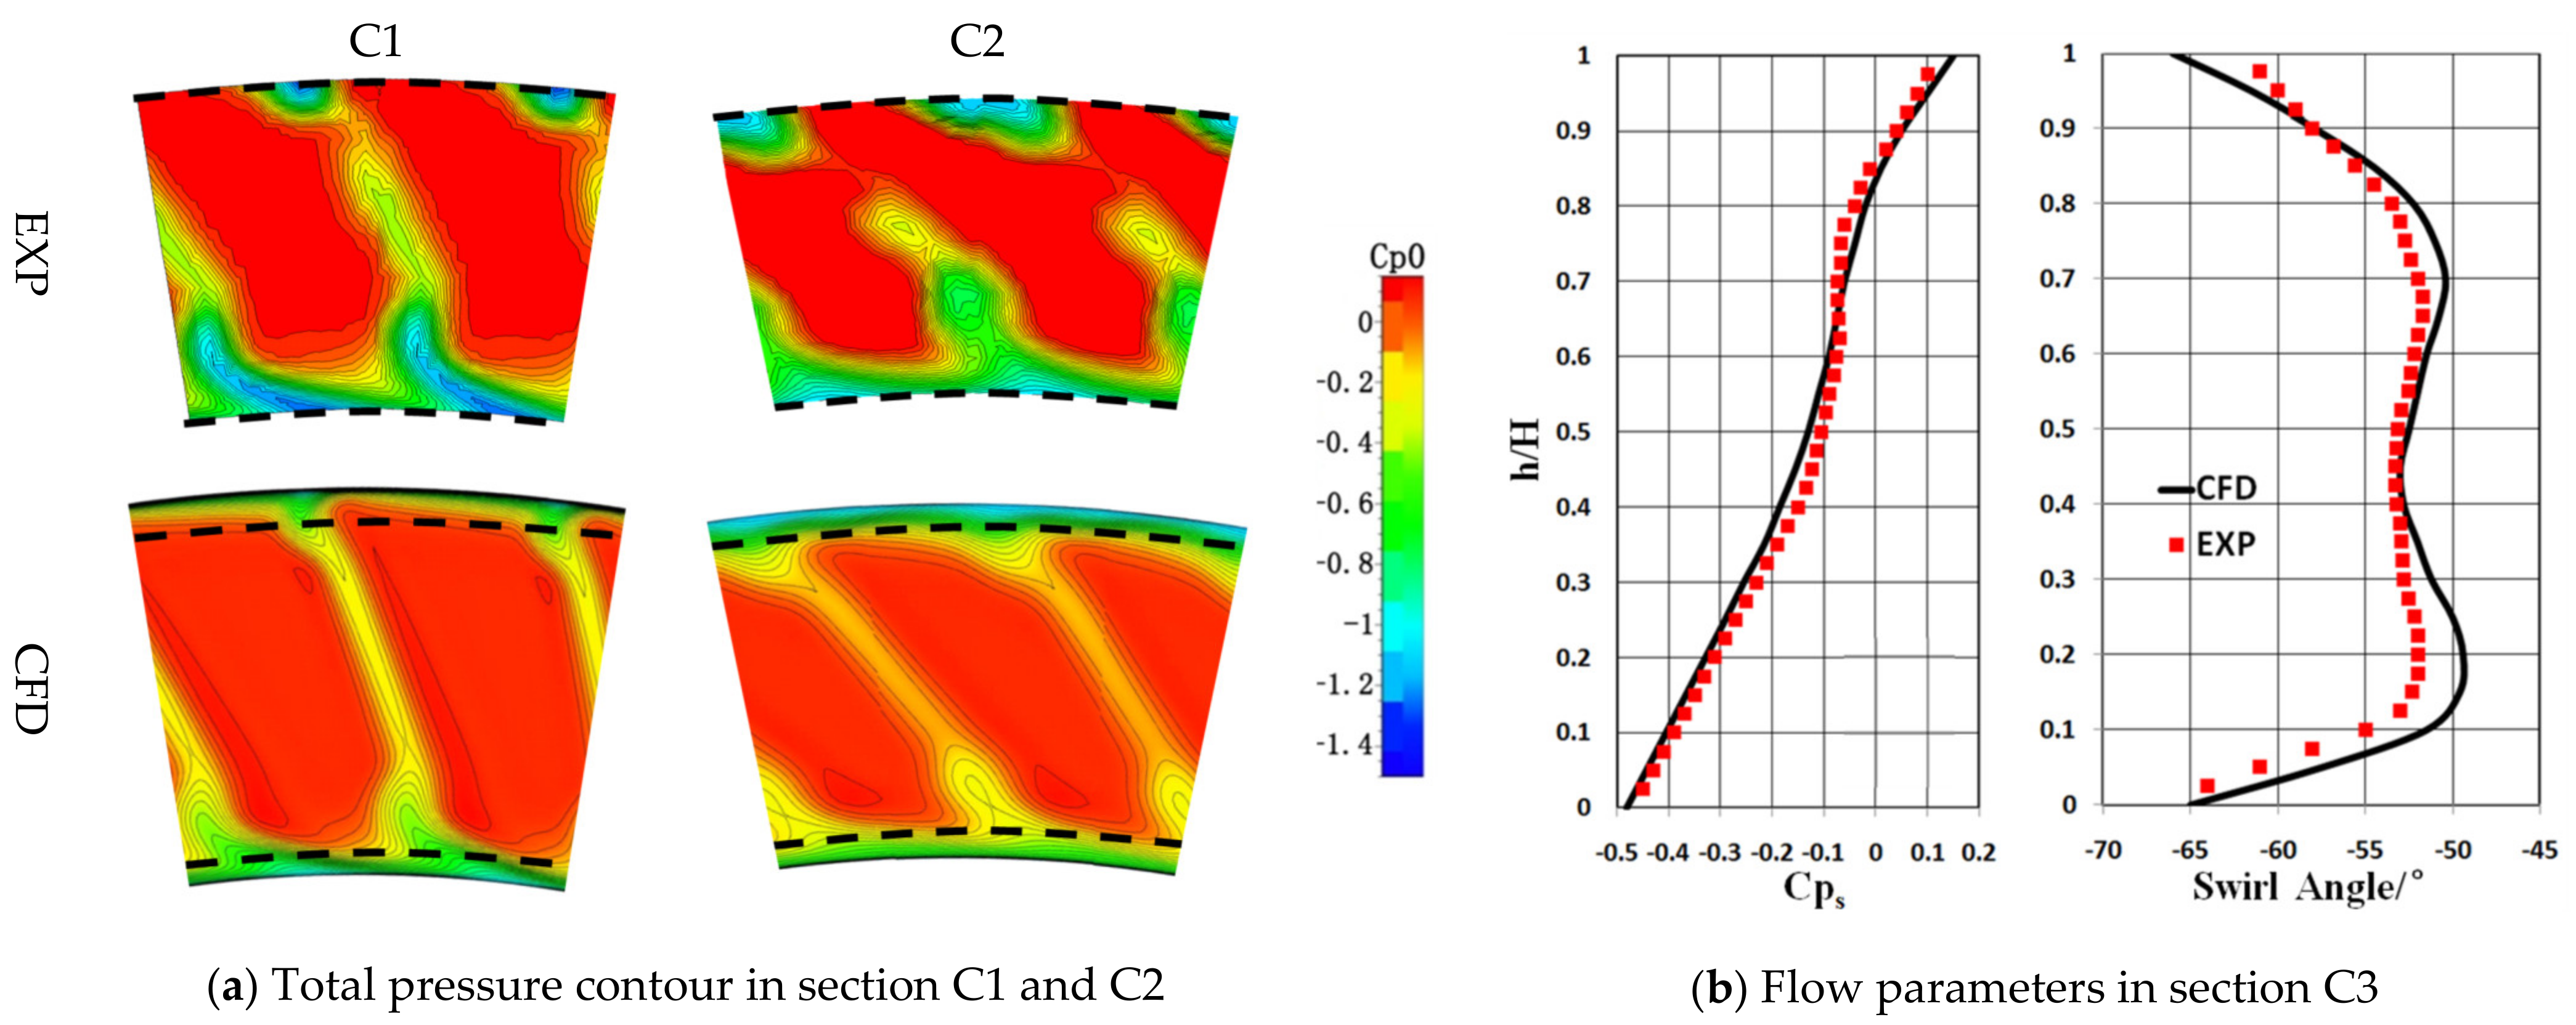
The computational domain consisted of a rotating domain of the sweeping rod and a static domain of the integrated AITD, as shown in Figure 4. Its inlet, located 1.5H upstream of the sweeping rod, was prescribed as Re = 7.16 × 10⁴ (based on the inlet annulus height) and FSTI = 3%. The outlet, located 2.5Cx downstream of the integrated LPT-GV, was set at uniform atmospheric pressure. No-slip and no-heat transfer conditions were imposed at the solid boundaries. The rotation speed of the sweeping rod was set to 220 RPM, and the reduced frequency was 1.07. In the unsteady calculation, the total duration was 0.389 s, and the minimum physical time step (Δt = 6.5 × 10⁻⁵ s) was set to 20 times the Karman vortex street frequency downstream of the round rod calculated by classical boundary layer theory.
Using the commercial software Numeca/AutoGrid, the computational domain of the integrated AITD was meshed with an HOH-type structured grid. Numerical simulations with 12.2, 6.3 and 3.1 million nodes were conducted to investigate the grid independence. As the results with 12.2 million nodes were only slightly different from those with 6.3 million nodes, the latter grid was chosen for further calculations. In the chosen grid, the numbers of circumferential, spanwise and streamwise nodes were 73, 133 and 552, respectively, and the numbers of O-type nodes around the LPT-GV and rod were 369 and 81, respectively. In the boundary layer, the grid thickness of the first layer was 0.002 mm, and the growth ratio was 1.15, which ensured that y+ <1 for all cases studied in this paper.

2.3. Validation

To verify the numerical method used in this paper, confirmatory calculations were carried out for the AITD model (Figure 5) experimentally studied in the paper [32]. Figure 6 compares the predicted limiting streamlines and the oil flow visualization on the surface of the shroud and hub. The bending position and the trend of the limiting streamlines driven by the circumferential pressure gradient were in good agreement with the oil flow visualization. Figure 7a shows the total pressure coefficient (Cp0) contour on Sections C1 and C2, and the measurement boundary of each section is marked with the dotted line. The predicted Cp0 distribution had good similarity with the experimental results, especially in the freestream region. However, the measured total pressure in the regions of wake and passage vortices was lower than the predicted value, and the range of this low total pressure region was larger than that of the numerical result. Figure 7b shows the radial distribution of the predicted pitchwise-averaged static pressure coefficient (Cps) and flow angle at the AITD outlet (Section C3) and compares them with the experimental results. The predicted Cps was in good agreement with the experimental result in Section C3. The trend of the predicted flow angle was basically consistent with the experimental results, especially in the middle region. However, the measured flow angle in the regions with large velocity gradients (such as the endwall region and passage vortices) was larger than the predicted flow angle. The reasons for the above differences might be that for the seven-hole probe with a diameter of 2.5 mm, its different measuring holes would be in different velocity zones in the regions with large velocity gradients (such as the wake, boundary layer, and passage vortices), and this velocity difference was interpreted as the flow angle when solving the measured flow field, resulting in the measured flow angle being larger than the actual value and the measured total pressure being lower. Therefore, the numerical method used in this paper could accurately model the flow field of an AITD with a high-curvature geometry.

3. Results and Discussion

In this paper, unsteady calculations were carried out for five conditions with the diameter of the sweeping rod ranging from d/s = 0.056~0.143. Typical cases with d/s = 0.078, 0.10 and 0.122 are adopted to elaborate on the influence of the trailing-edge radius of the HPT on the unsteady wake transportation and the internal flow mechanism in the integrated AITD.

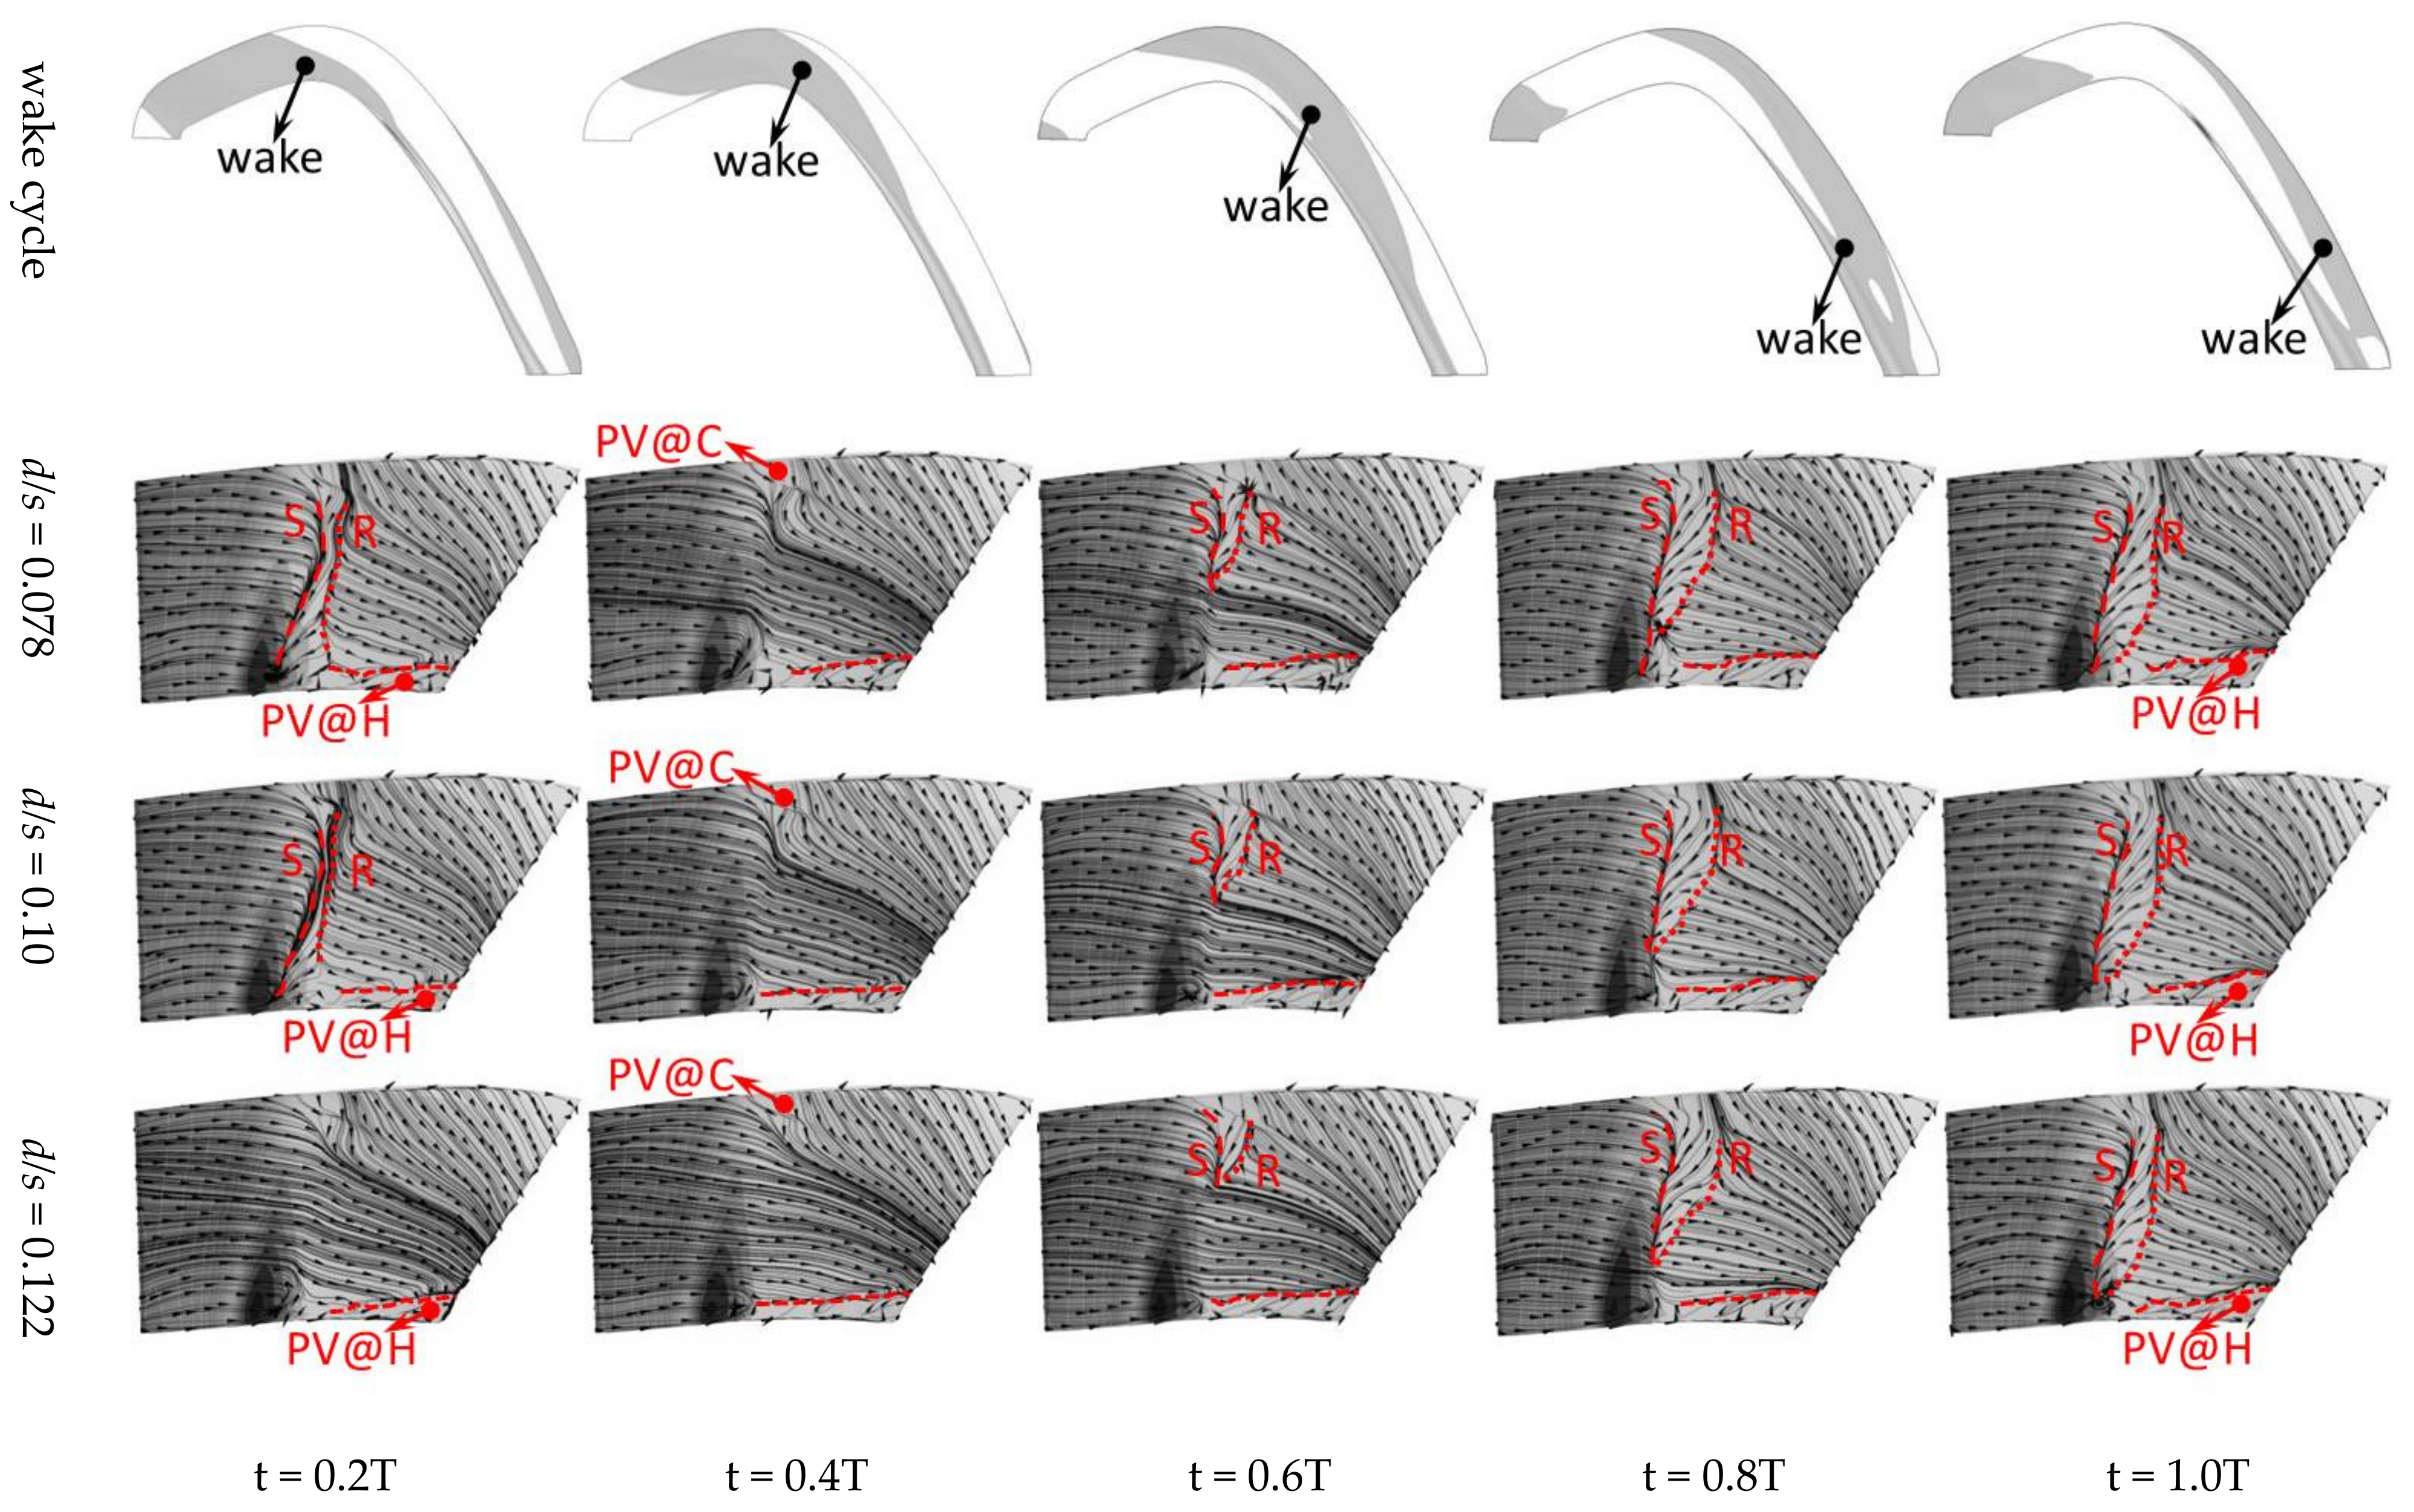
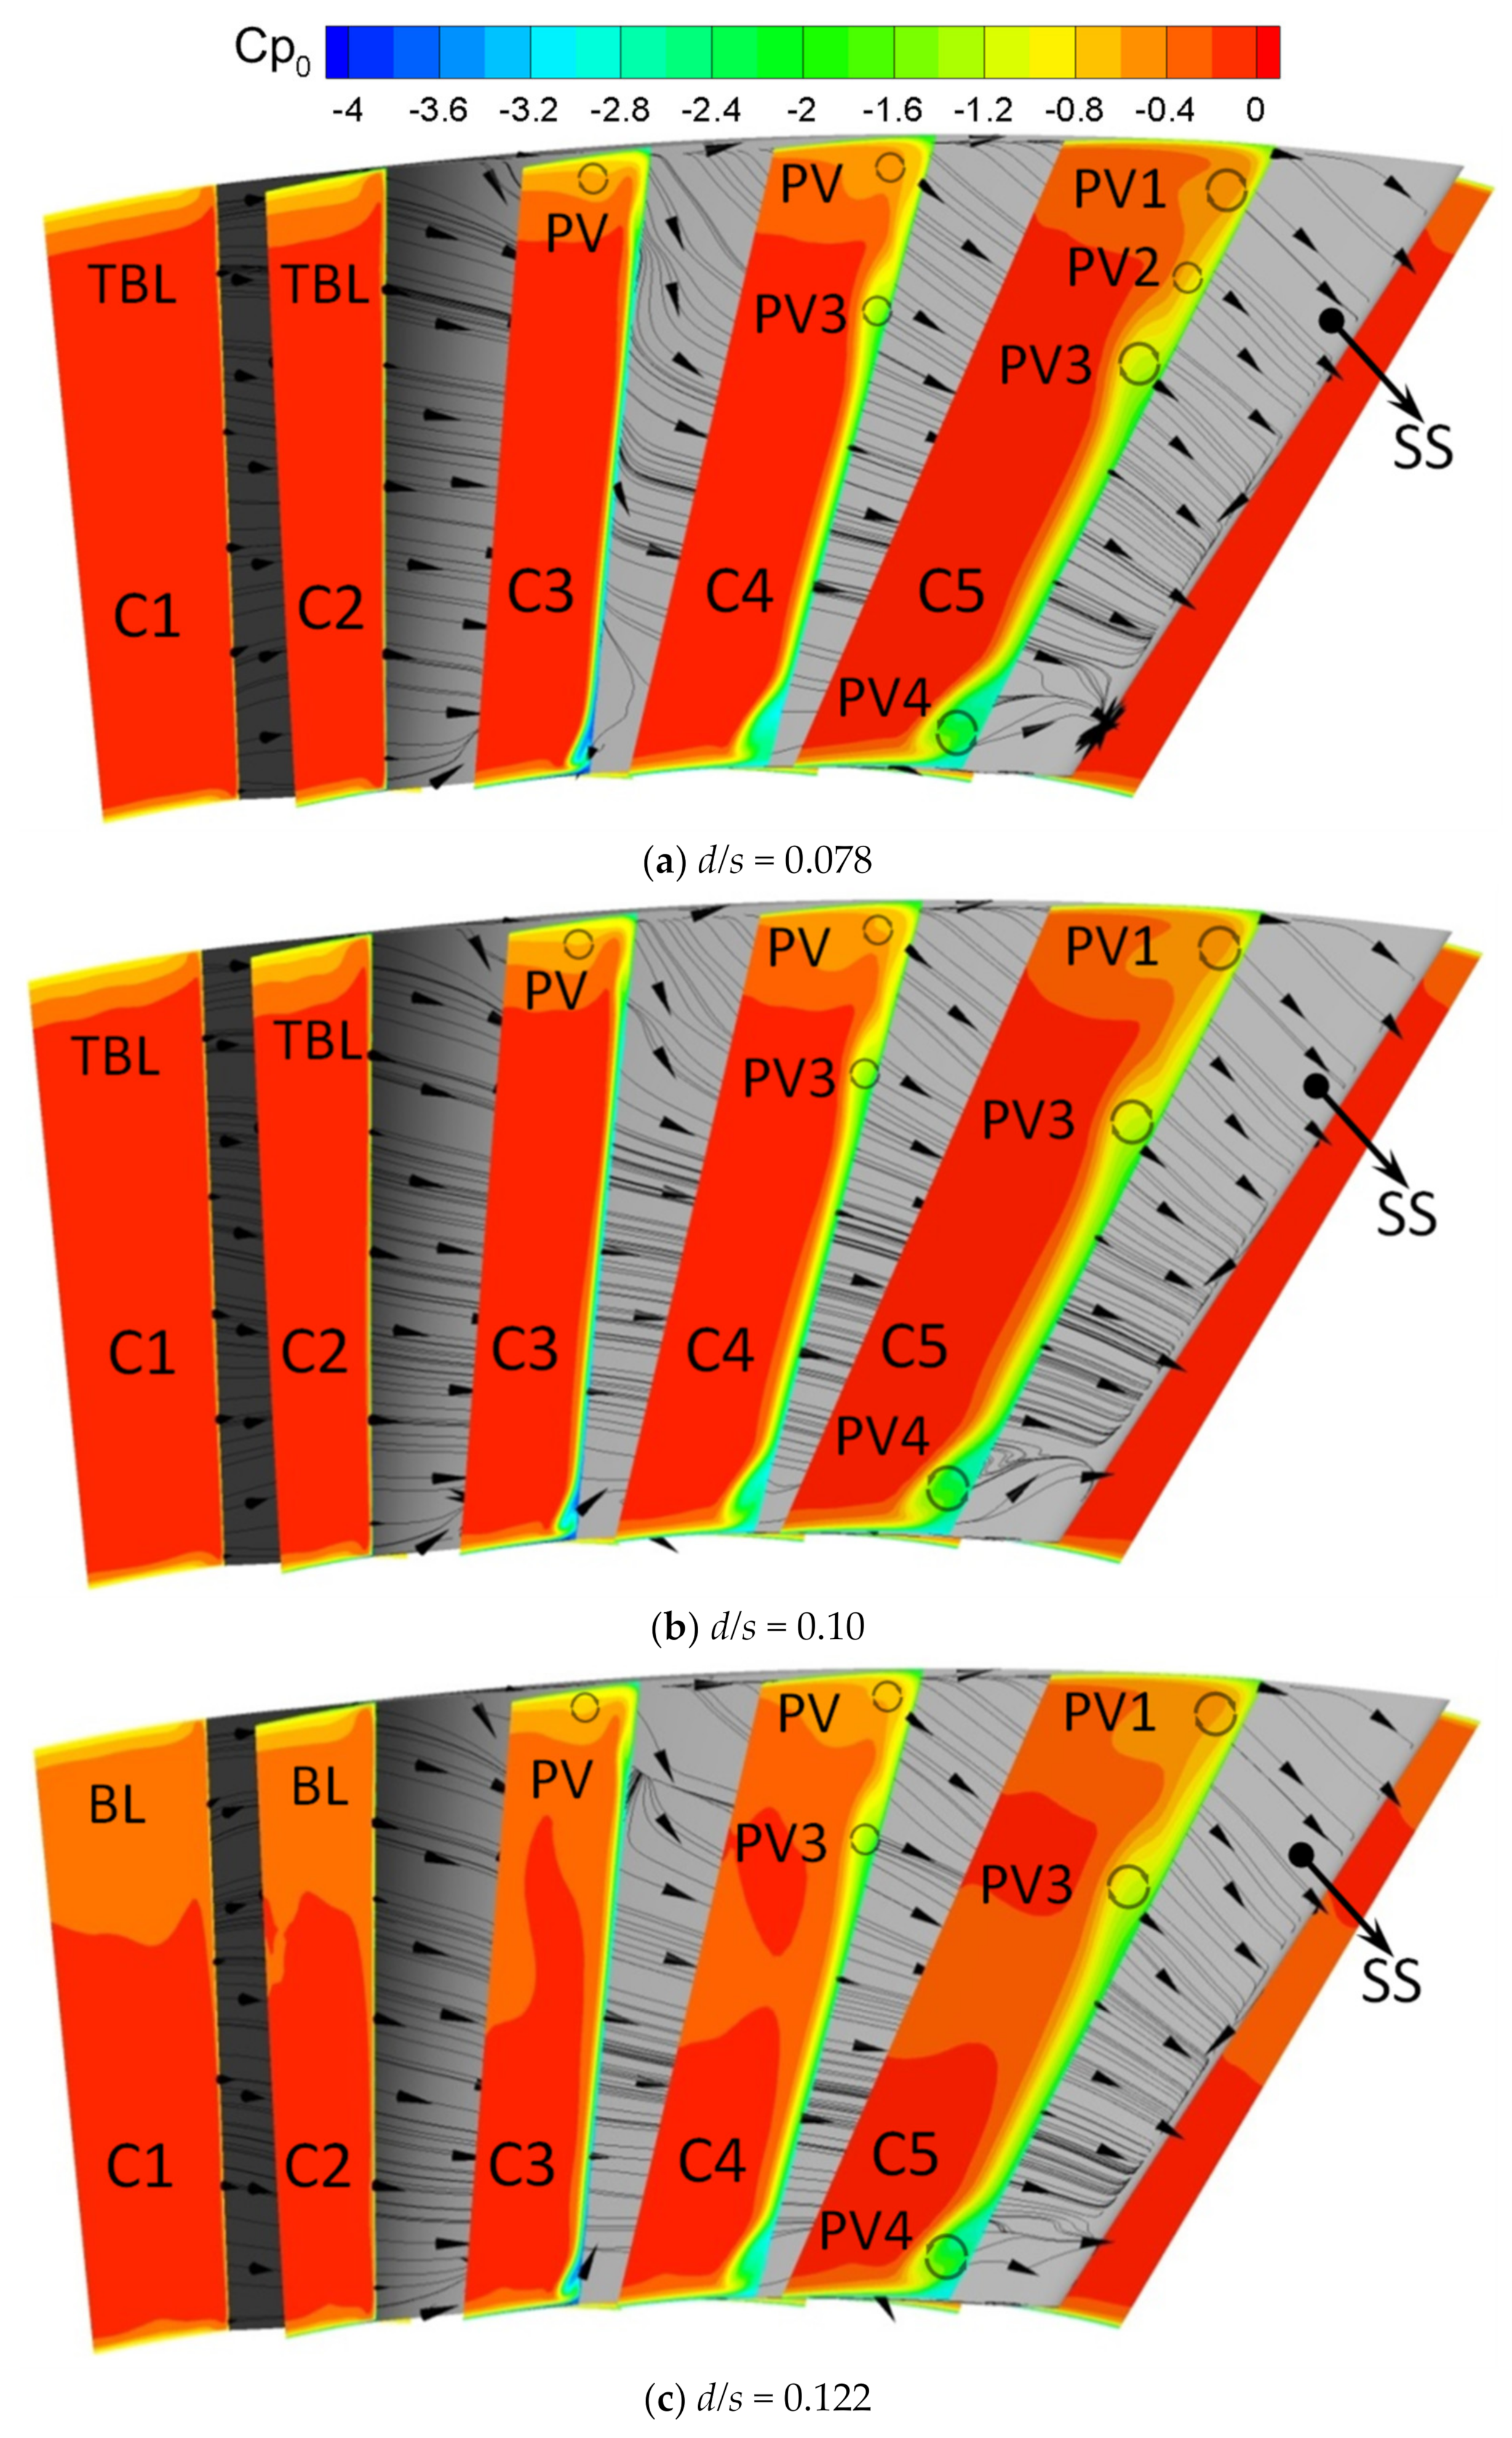
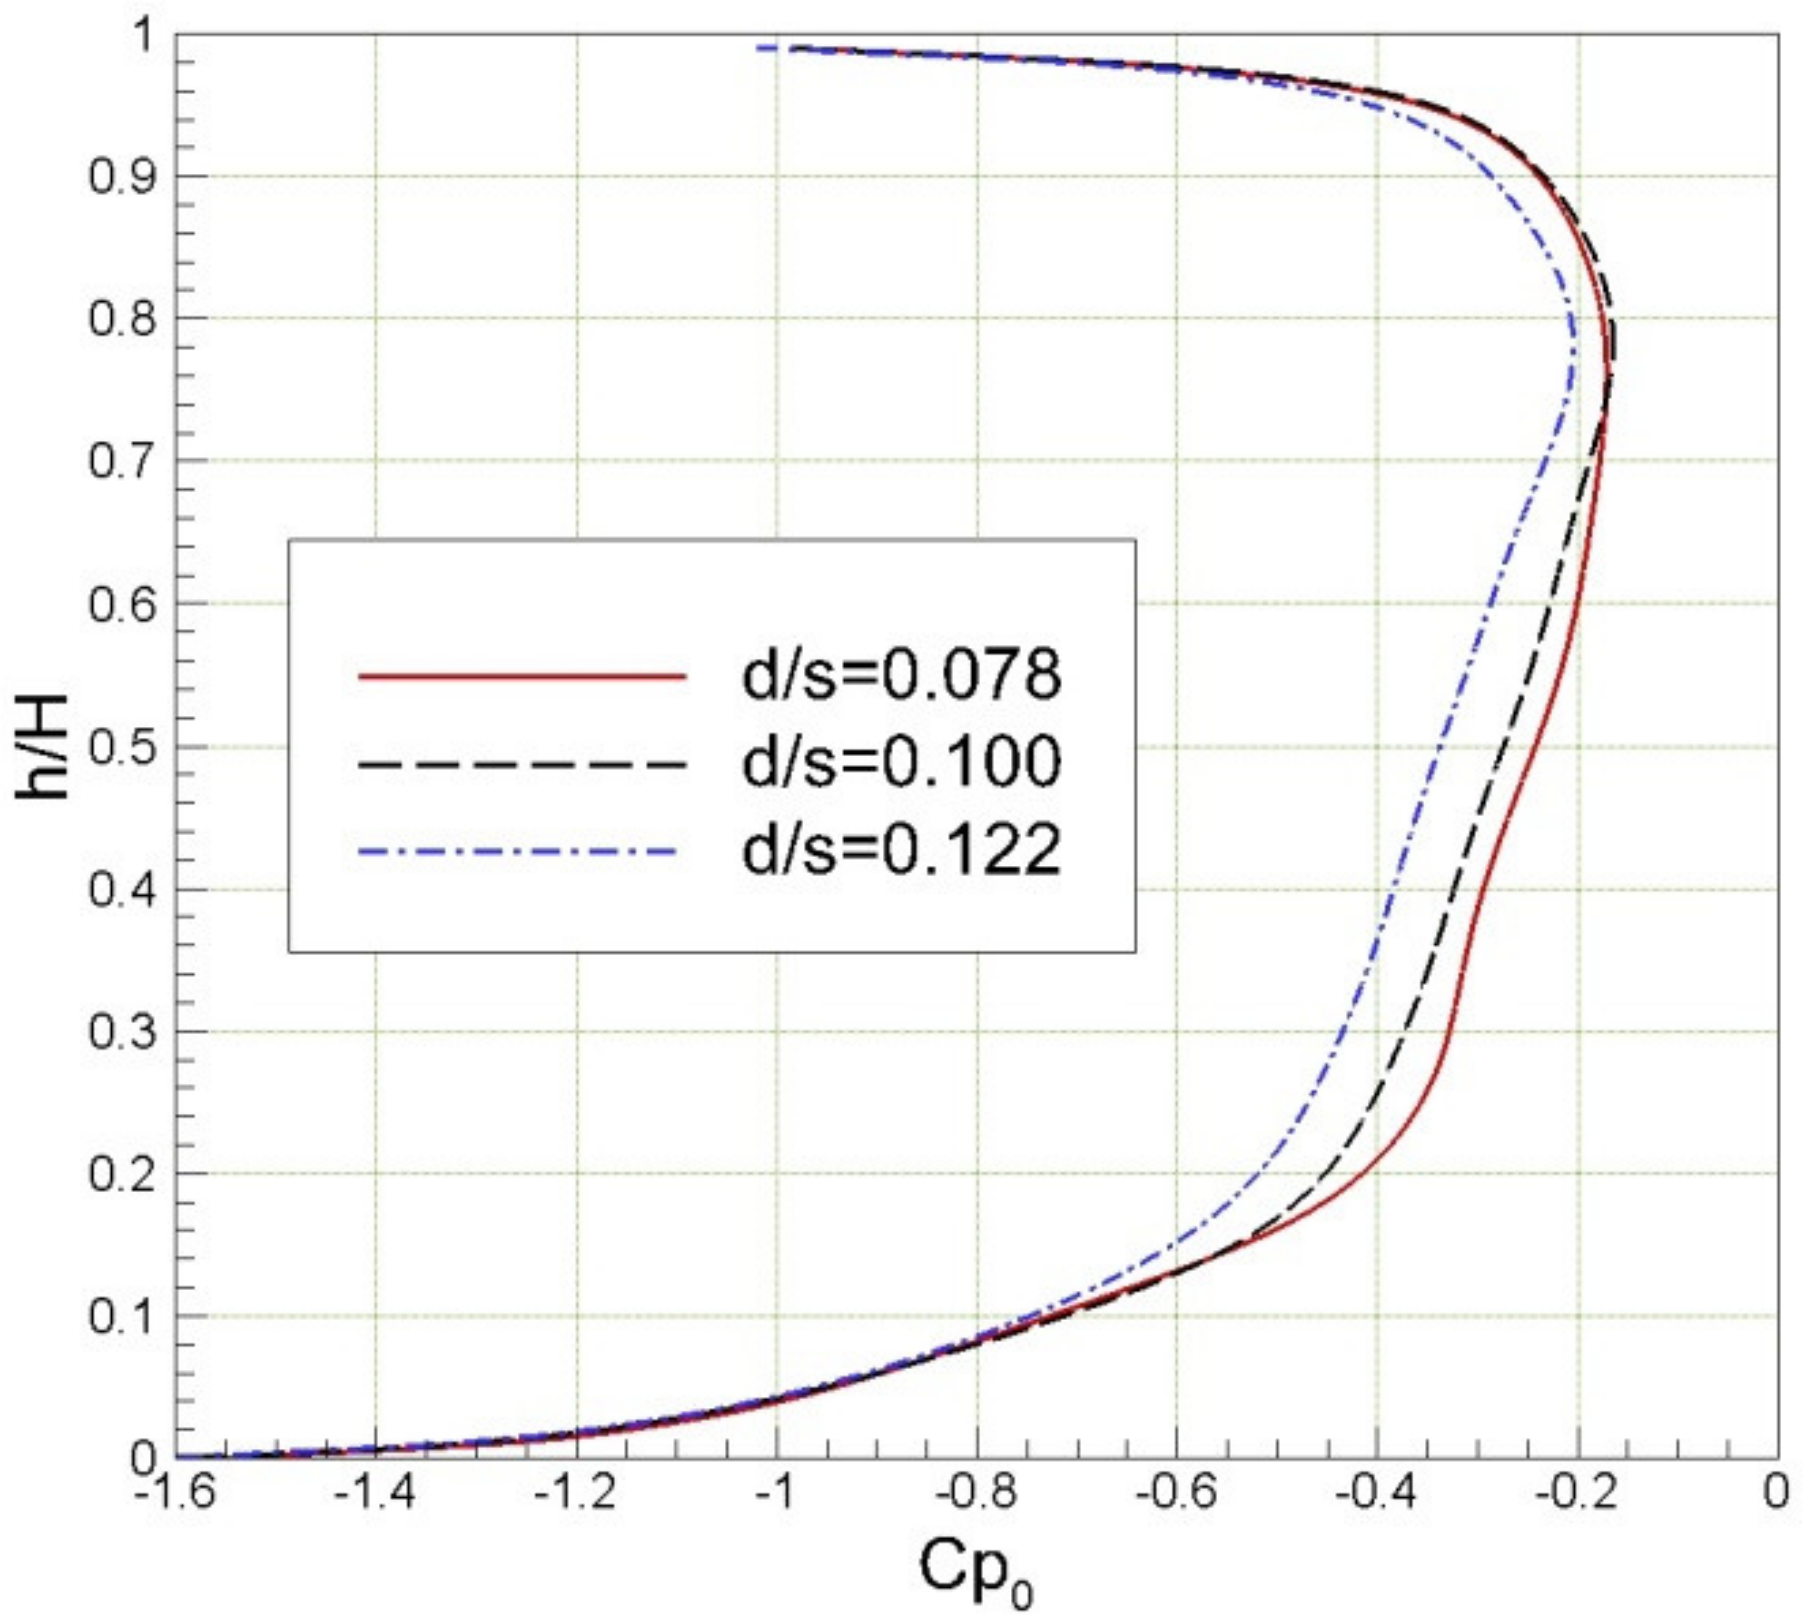
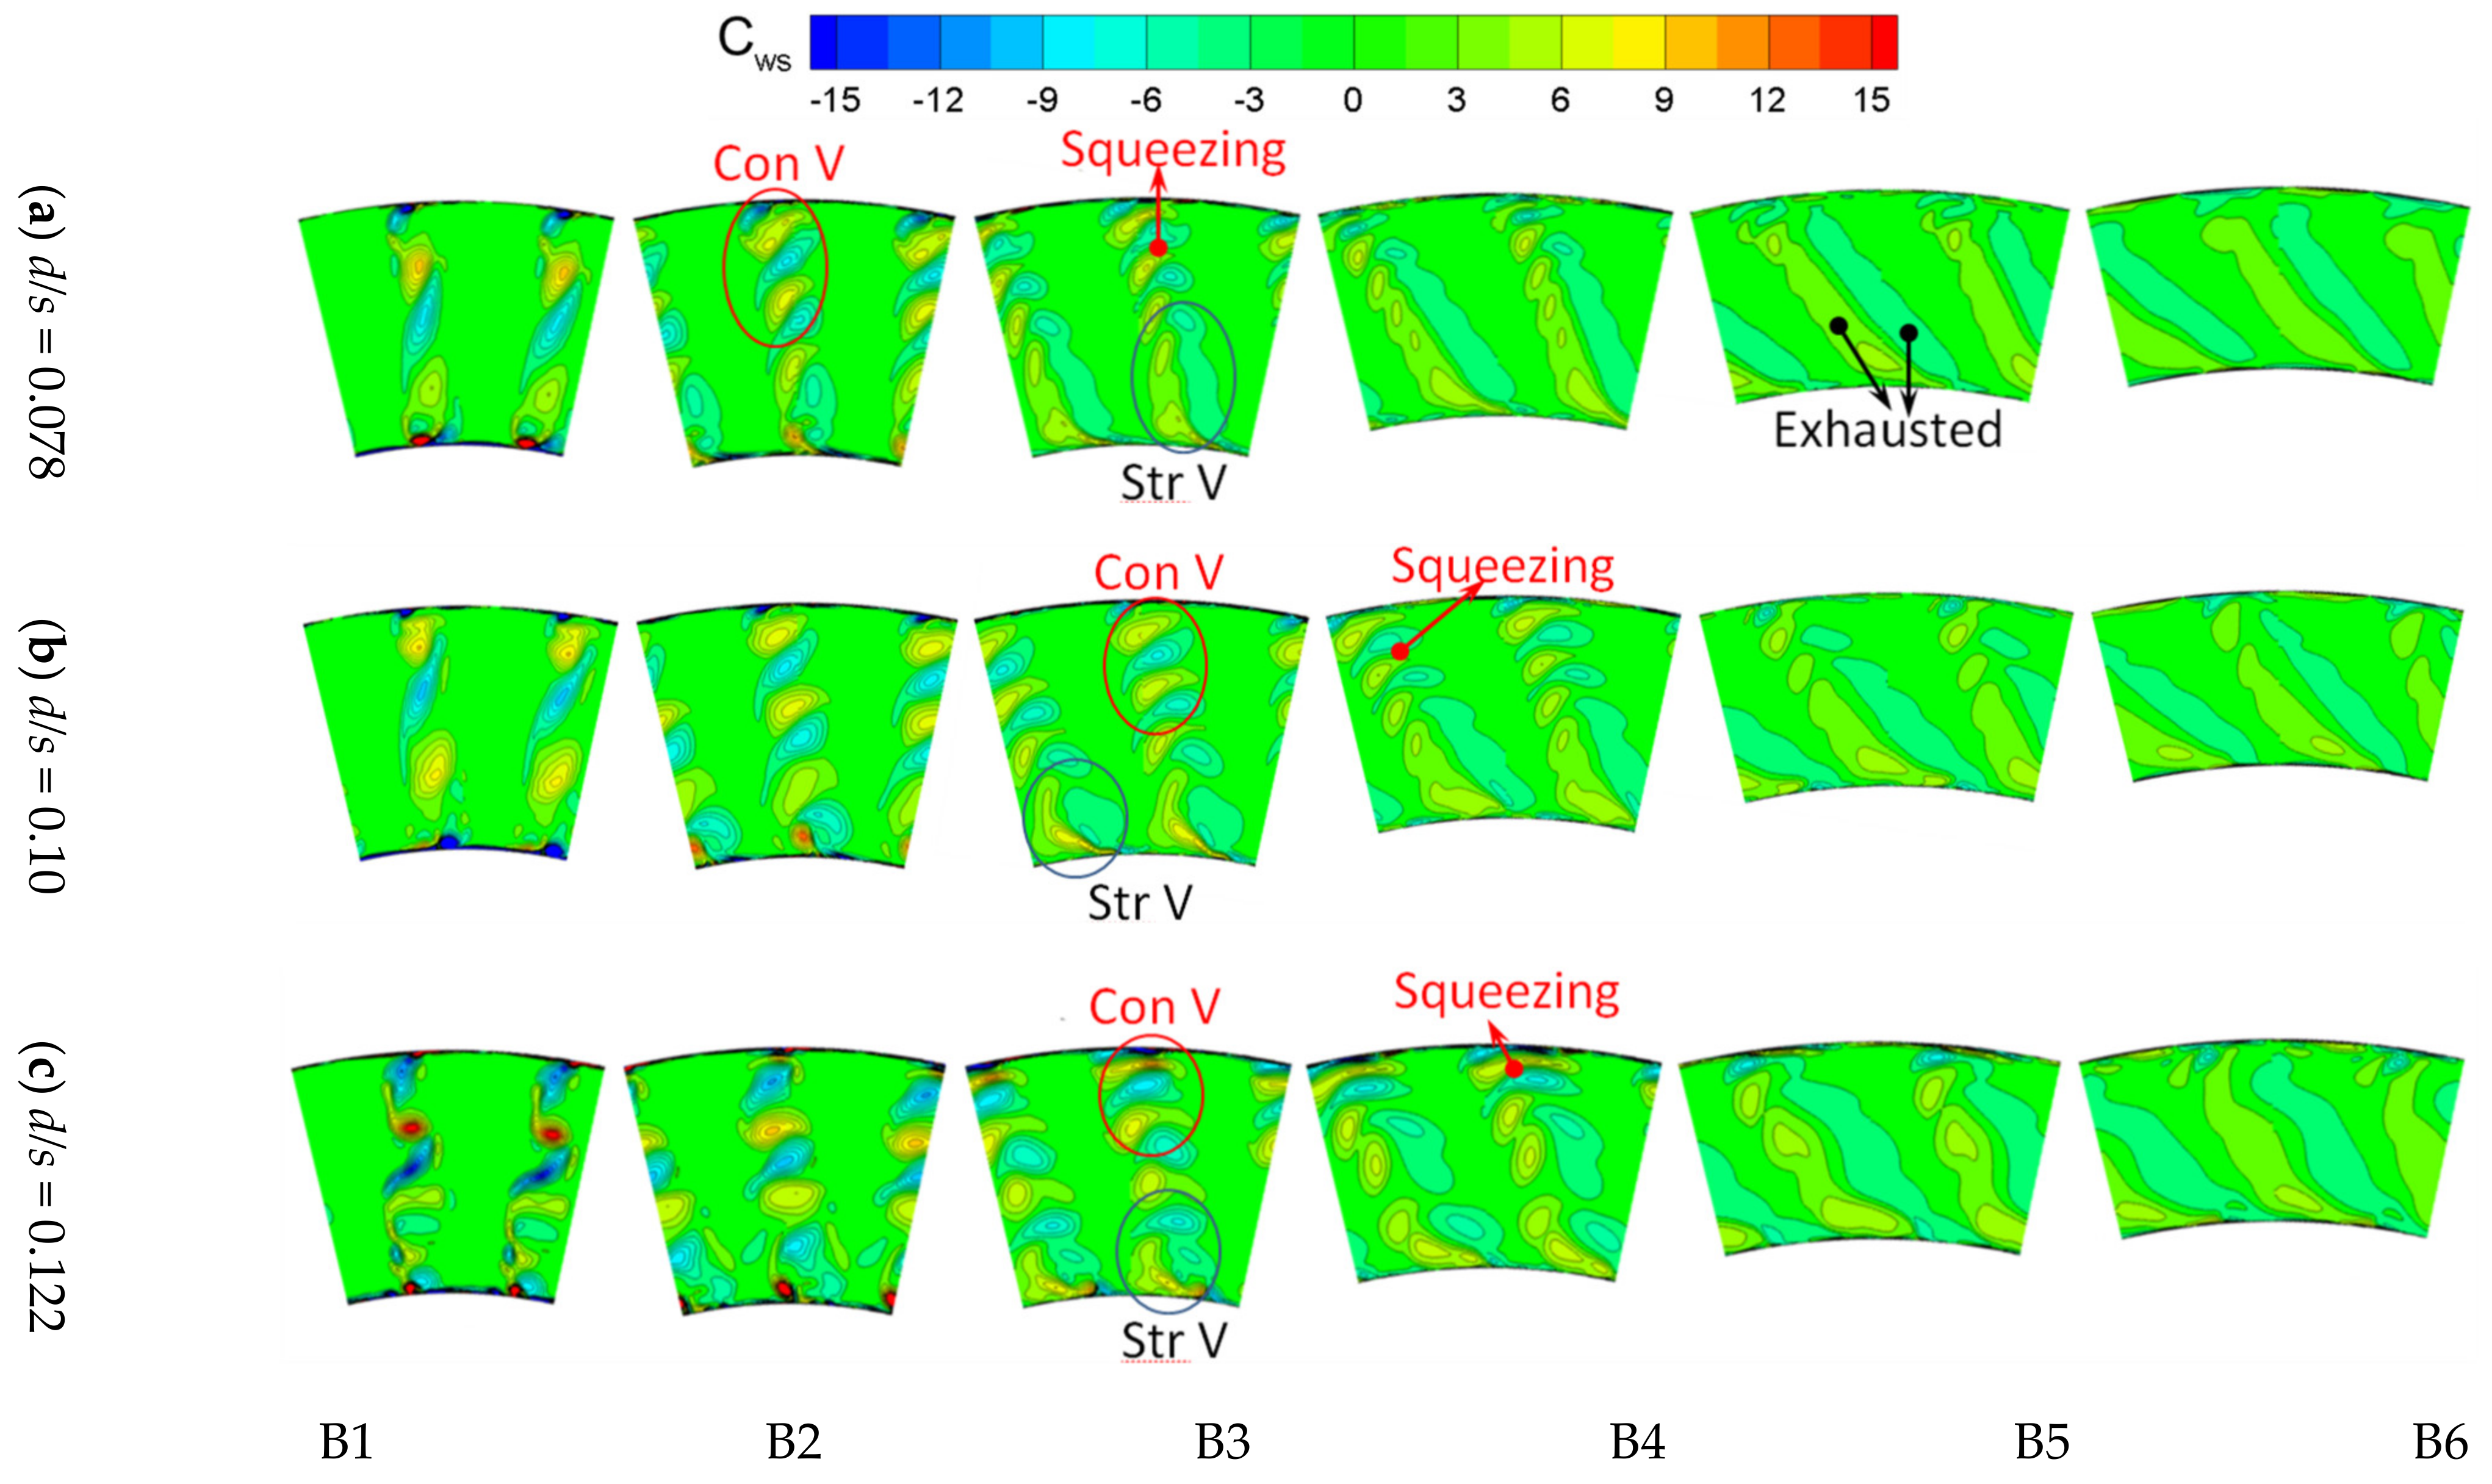
3.1. Influence on Unsteady Wake Transport in AITD

Figure 8 shows the circumferential distribution of the turbulence intensity (Tu) at the midspan of different streamwise sections inside the AITD. As shown in Section B1, the width and intensity of the wakes increased significantly with increasing d/s value. Taking the case of d/s = 0.122 as an example, the wake width (w/s = 0.464) and the peak turbulence intensity (18.86%) increased by 28.9% and 42.8% compared with the case of d/s = 0.078 in this section, respectively. With the transport inside the AITD, the wakes moved downstream in a clockwise direction (as viewed in the flow direction), as shown by the red and black straight arrow lines in Figure 8, because of the tangential velocity due to the rotation of the sweeping rod. Meanwhile, they were also diffusing continuously, as shown by their increasing width and decreasing peak turbulence intensity in Sections B2-B6 of Figure 8. In comparison, the high turbulence intensity of the wake when d/s was large often meant faster energy exchange with the surrounding fluid, which made its diffusion speed and dissipation rate greater than the cases with a small d/s. Compared with the case of d/s = 0.078, the wake width was increased by 36.4% and the reduction of peak turbulence intensity was increased by 2.5% in Section B6 of Figure 8 when d/s = 0.122. When d/s ≥ 0.10, the adjacent swept wakes in the AITD diffused to contact each other at a certain position upstream of Section B5, the interaction between wakes occurred, and the dissipation of their turbulence intensity was further enhanced. This behavior was another reason for the increasing dissipation rate of the wake peak turbulence intensity in the case of a large d/s.
Figure 9 shows the distribution of the time-averaged static pressure coefficient on the hub and shroud of the AITD for different d/s values. The sweeping wake, which blocked the effective flow area of the AITD as a low-energy fluid mass, not only led to a decrease in total pressure but also caused an increase in velocity (constant flow) by blocking the flow area, which inevitably resulted in a decrease in static pressure in the AITD. With the increase in d/s, the increasing width and intensity of the sweeping wakes further enhanced their blockage effect, resulting in a greater reduction in the static pressure coefficient. As shown in Figure 9, the static pressure coefficients on the AITD shroud and hub decreased with increasing d/s in all cases, which supported the above inference. However, the different surfaces in the AITD had different responses to the wake blocking effect: (1) At the first bend of the AITD (x/Cx = 0~1.8), the static pressure coefficient on the hub decreased more than that of the shroud with increasing d/s, which reduced the radial pressure gradient from the hub to the shroud. The differential Cps was 0.62, 0.61 and 0.57 at x/Cx = 0.4 when d/s was 0.078, 0.10 and 0.122, respectively. (2) In contrast, at the second bend of the AITD (x/Cx = 2.0~3.0), the static pressure coefficient on the shroud decreased more than that of the hub with increasing d/s, which reduced the radial pressure gradient from the shroud to the hub. The differential Cps was 0.84, 0.84 and 0.83 at x/Cx = 2.8 when the d/s values were 0.078, 0.10 and 0.122, respectively. Under the different sweeping wake conditions, the change in the radial pressure gradient in the AITD would affect the development of internal secondary flow and the vortex migration and interaction process, which will be analyzed in detail below.
Figure 10 shows the time-averaged streamwise vorticity contour at different streamwise sections of the AITD under the different sweeping wake conditions. Comparing the wake shapes of different sections shows that the inclination of the wake increased continuously with its diffusion in the AITD. This increase occurred because the tangential velocity at the hub and shroud did not decrease proportionally with the rise of the AITD’s passage, where it decreased more at the shroud than at the hub. This tangential velocity difference also led to the circumferential stretching of the wake vortices, especially in the middle and lower regions of the AITD passage, as shown by the significantly stretched vortices (marked as “Str V”) in Sections B3–B5 in Figure 10. This stretching effect was conducive to promoting the mixing and dissipation of the wake vortices, resulting in the streamwise vorticity in the corresponding regions of Sections B3–B5 in Figure 10 being significantly smaller than that in its upper half region. Meanwhile, the stretching shape and dissipation rate of the wake vortices in this region were not consistent in the cases with different d/s, which indicated that these processes were also affected by the factors related to the wake intensity. Based on the analysis conclusion of Figure 9, the AITD passage between Sections B1 and B6 was always subject to a radial pressure gradient from the hub to the shroud, which could drive the low momentum fluid from the hub to the shroud along the wake. In the lower half region of the AITD passage, this radial secondary flow drove the wake vortices to move upward, coupling with the abovementioned clockwise circumferential stretching effect, resulting in the wake vortices showing an obvious stretching phenomenon, as shown by “Str V” in Sections B3–B5 in Figure 10. This radial pressure gradient in the AITD passage decreased with increasing d/s, which suggested that the radial pressure gradient was larger and the radial secondary flow was more significant under the condition of a small d/s (e.g., d/s = 0.078). Therefore, compared with the condition of a large d/s (e.g., d/s = 0.122), the wake vortex shown by “Str V” in Figure 10 was longer, and its dissipation was also faster under the corresponding condition of a small d/s (e.g., d/s = 0.078). In Figure 10, the wake had no obvious vortex core in Section B5 when d/s = 0.078, while a relatively clear vortex core remained in this section when d/s = 0.122. The wake vortices in the upper half region moved upward and gradually converged because of the radial upward secondary flow, as shown by ‘Con V’ in Figure 10. This phenomenon was even conducive to accelerating the dissipation of wake vortices, especially in the case of a small d/s: (1) When d/s = 0.078, the wake vortices (as shown by ‘Con V’) had gathered together in Section B2, began to squeeze and merge in Section B3, and were almost exhausted in Section B5; (2) in the case of d/s = 0.122, the wake vortices did not converge until Section B3, the squeezing and merging occurred in Section B4, and an obvious vortex structure remained in the upper region of Section B5. For a large d/s, the decrease in the radial pressure gradient weakened the radial secondary flow and delayed the dissipation process of the wake vortices, resulting in an obvious wake vortex structure at the inlet of the LPT nozzle (Section B6), which provided an opportunity to use the sweeping wake of HPT to suppress the flow separation on the suction surface of LPT-GV.
Figure 11 shows the radial distribution of the pitchwise mass-averaged total pressure coefficient and its contour in Section B6. For a small d/s, the strong radial secondary flow led to the accumulation of low-energy fluid masses (such as wake vortices) near the shroud. Taking the condition of d/s = 0.078 as an example, a large range of low total pressure coefficient regions were near the shroud (h/H > 0.7) in the total pressure contour, and the pitchwise mass-averaged Cp0 in the corresponding region was also significantly lower than that in other regions. As d/s increased to 0.1, the accumulation of low-energy fluid in the upper region (h/H > 0.7) decreased with the radial pressure gradient, and the wake dissipation did not increase much, so the pitchwise mass-averaged Cp0 from h/H = 0.7~0.9 in this case was greater than that of d/s = 0.078. When d/s was large (i.e., d/s > 0.10), the radial and circumferential distribution range of the low momentum region was significantly larger, and the pitchwise mass-averaged Cp0 was also lower than that in the cases of a small d/s because of the strong dissipation of wake vortices. On the other hand, because of the weakening radial transport process of wake vortices when the d/s was large, the low-energy fluid in the AITD passage gathering toward the shroud was not as obvious as in the cases of a small d/s but was almost evenly distributed in the radial range of h/H = 0.2~1.0. However, the transport of the radial secondary flow still existed, some low-energy fluids accumulated in the upper region (h/H > 0.6), and the pitchwise mass-averaged Cp0 also decreased in this region compared with the other regions in these cases.

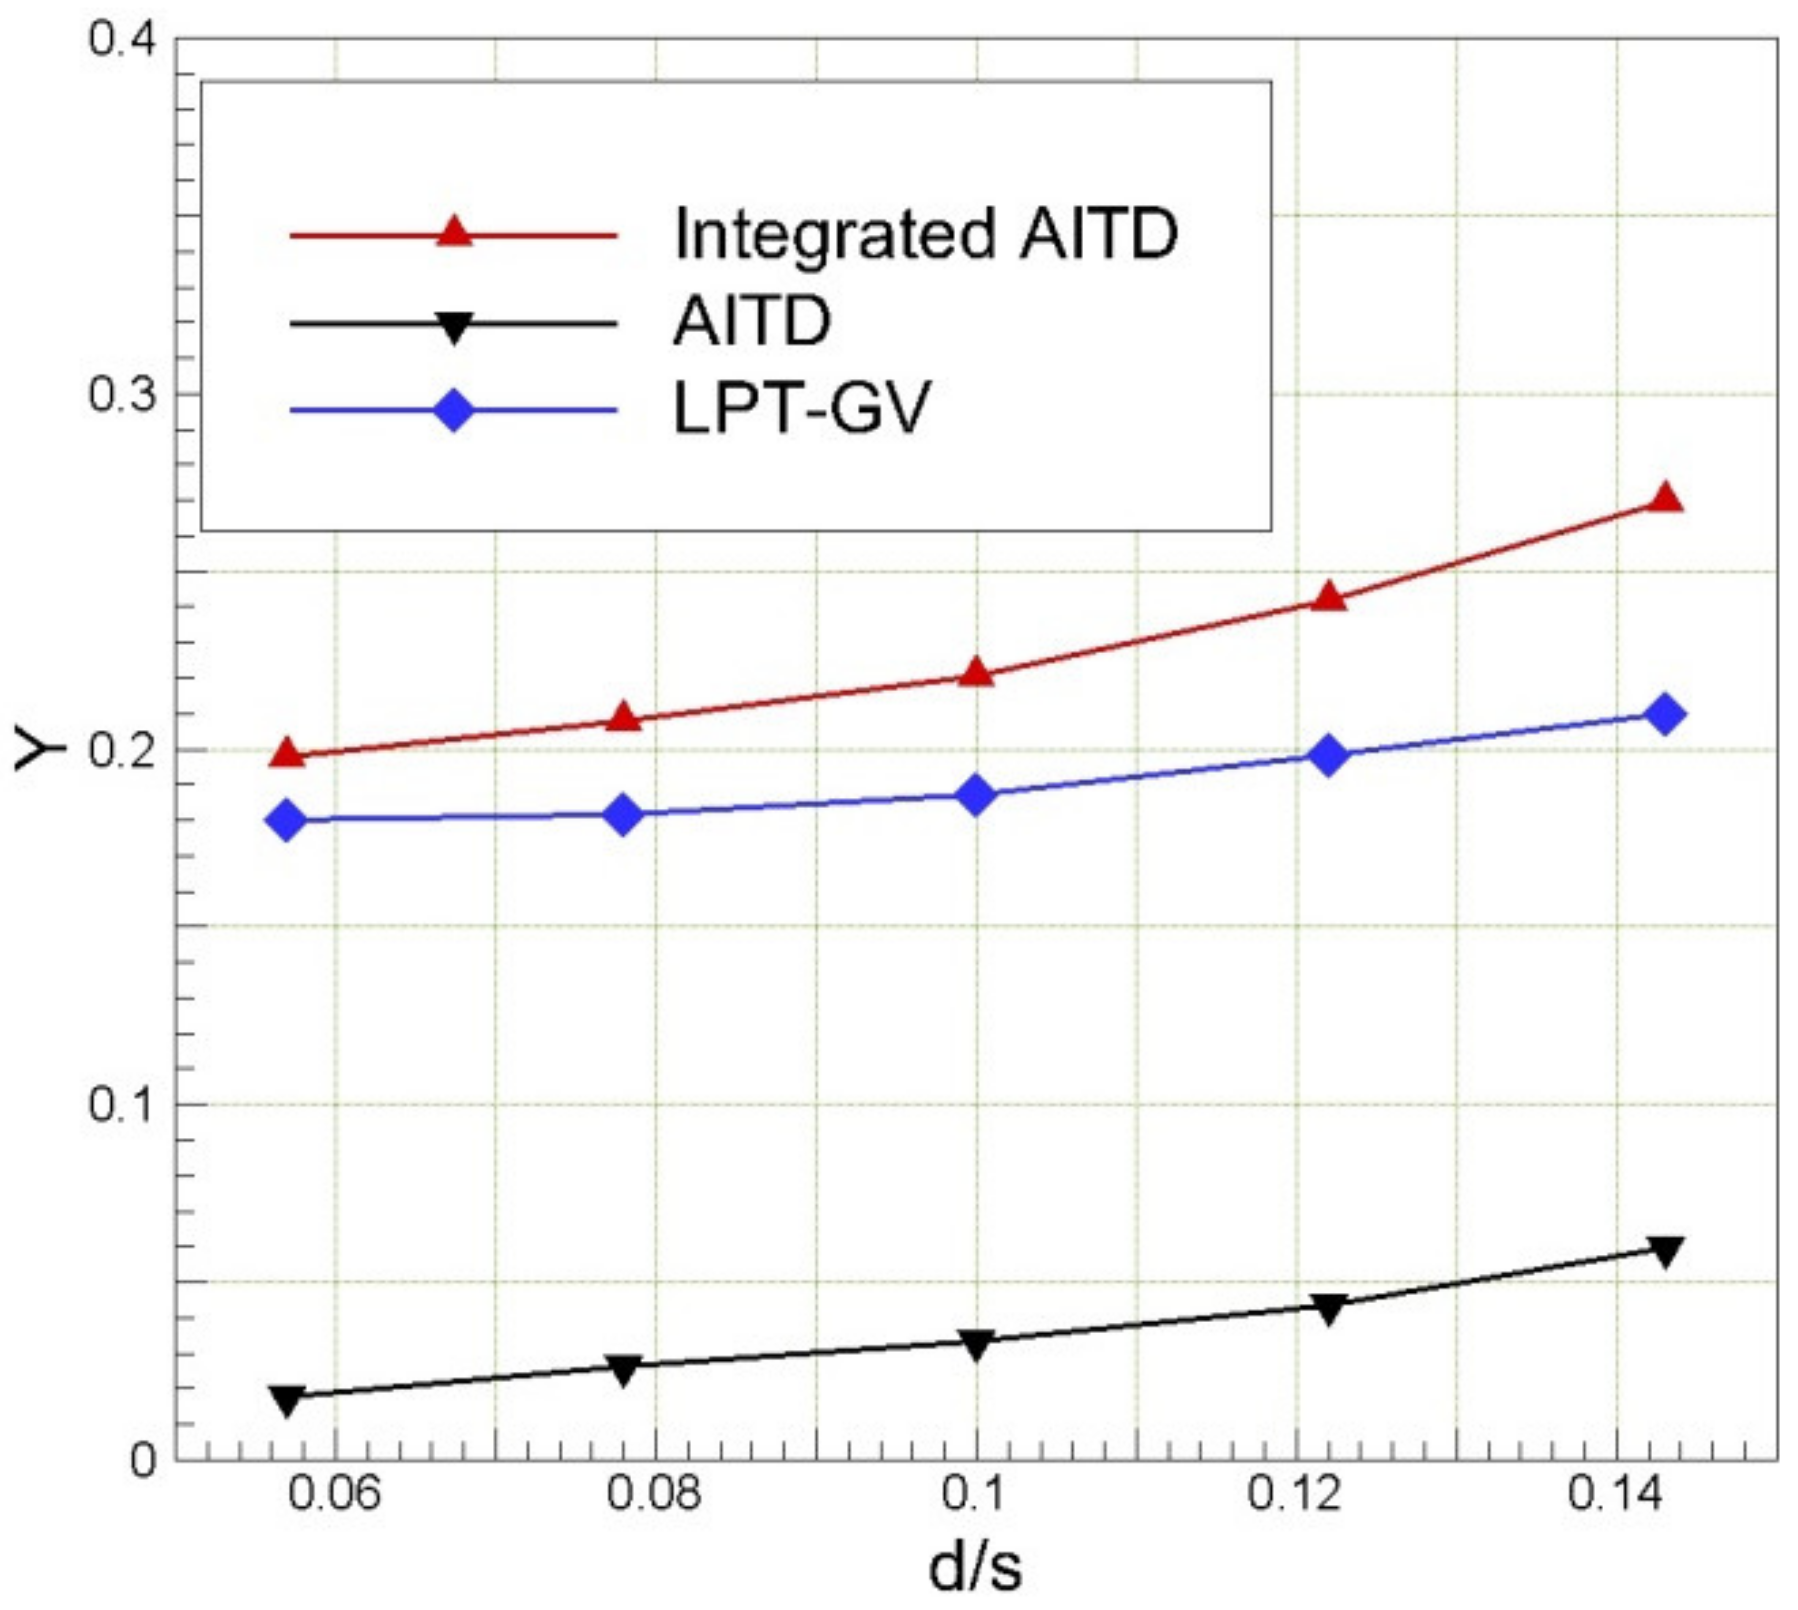
3.2. Effect of Wake on the Integrated LPT-GV

Based on the above analysis conclusions about the transport mechanism of sweeping wakes with different d/s values and their influence on the internal flow of the AITD, the effect of the remaining wake on the flow characteristics of the integrated LPT-GV, especially the boundary layer separation, viscosity loss and vortex structure in blade passages, is described in detail below.
Figure 12 shows the distribution of the time-averaged static pressure coefficient on the integrated LPT-GV in the AITD under different sweeping wake conditions. A pressure plateau appeared on the Cps curve of the suction surface in all cases, and the area of the plateau decreased with increasing d/s. This result meant that the residual wakes still could not completely suppress the flow separation on the suction surface, but the stronger wake in the case of a larger d/s had a better suppressing effect on the separation bubble. The reduction in separation bubbles increased the effective flow area of the LPT-GV passage to a certain extent, which improved the static pressure coefficient of the LPT-GV. As the mass flow rate was constant, the wake blockage effect increased the velocity in the LPT-GV passages, resulting in a decrease in the static pressure coefficient. In the case of d/s = 0.10, the static pressure coefficients at the three sections were almost the same as those when d/s = 0.078 because the flow passage blockage caused by the enhanced wake in this case could offset its effect of increasing the flow area by suppressing separation. When d/s = 0.122, the static pressure coefficient was significantly lower than that of the other two cases, as shown in Figure 12, which indicated that the reduction in the flow area caused by the blockage effect of the strong wake was significantly greater than the increase in the flow area caused by its inhibition of the flow separation bubble in this case. Moreover, in this case, the decrease in the static pressure coefficient on the suction surface was larger than that on the pressure surface, which indicated that the pressure gradient from the pressure surface to the suction surface increased, especially in the section of a 15% span.
Figure 13 shows the limiting streamline and static pressure coefficient contour on the suction surface of the integrated LPT-GV when d/s = 0.078, 0.10 and 0.122. A passage vortex, marked by ‘PV@C’ in Figure 13, appeared on the upper part of the LPT-GV suction surface in all cases, and this vortex disappeared on the suction surface as it broke away from the wall downstream (discussed in detail below). Comparing the cases with different d/s values, the area of these passage vortices decreased with increasing d/s. The area of PV@C was significantly smaller when d/s = 0.122 compared to the other two cases, as shown in the figure where t = 0.2T. This difference arose because when d/s was large due to the reduced radial pressure gradient from the hub to the shroud, the accumulation of low-energy fluid near the shroud and the horseshoe vortex at the leading edge of the LPT-GV were weakened, and the passage vortex developed by the horseshoe vortices entraining low-energy fluids was bound to be reduced. At the midspan of the LPT-GV, the residual wake could well inhibit the boundary layer separation on the suction surface in all cases, and the stronger wake could inhibit the flow separation earlier and more persistently in the cases with larger d/s. For example, the midspan flow separation was completely suppressed from t = 0.15T to t = 0.75T when d/s = 0.122, while the separation bubble was not completely inhibited until t = 0.30T and recovered at t = 0.54T when d/s = 0.078. In the lower region of the LPT-GV, a passage vortex (marked by PV@H in Figure 13) was near the hub even during the sweeping wake cycle in all cases. Because of the radial secondary flow from the AITD shroud to the hub, this passage vortex hardly expanded in the radial direction downstream. For the same reason, the decrease in the radial pressure gradient also led to the weakening of this passage vortex, which could also be proven because the passage vortex at the lower part of the LPT-GV was smallest when d/s = 0.122.
As the midspan was the most significant region of the integrated LPT-GV affected by the sweeping wakes, its boundary layer was analyzed in detail below to reveal the influence of unsteady wakes. Figure 14 shows the space-time diagram of the boundary layer shape factor (H12) and loss coefficient (ξ) at the midspan of the integrated LPT-GV when d/s = 0.078, 0.10 and 0.122. The leading edge/centerline/trailing edge of the wake (Lines A, L and B, respectively), the boundary of the calm zone (Line C) and the transition position (Line T) induced by the wake are also shown in Figure 14 according to the empirical judgment criterion. The shape factor was the ratio of the displacement thickness of the boundary layer to its momentum thickness: the lower the shape factor was, the fuller the velocity profile of the boundary layer; in contrast, the velocity profile was concave, which often indicated that flow separation might have occurred in the boundary layer. Based on the conclusions verified by the experiment, when the shape factor was greater than 3.5, boundary layer separation of the LPT blade often occurred [34]. In all cases, the shape factor was relatively small (H12 < 3.5) in the wake sweeping cycle, as shown by the blue area between Line A and Line C in the space-time diagram of the shape factor, indicating that the sweeping wake could well inhibit the flow separation at the midspan of LPT-GV. With the increase in d/s, the width and turbulence intensity of the sweeping wake increased, as did its influence range. When d/s increased from 0.078 to 0.122, the area between Line A and Line C, representing the influence range of the sweeping wake, increased from 0.24T to 0.5T at x = 0.55Cx in the upper row of Figure 14. This prolongation of wake inhibition apparently helped to reduce losses due to flow separation on LPT-GVs. In the gap of the sweeping wake, the shape factor increased and exceeded 3.5 in all cases, as shown in the area circled by the isoline of H12 = 3.5 in the upper row of Figure 14, which meant that the boundary layer separation bubble recovered again. With increasing d/s, the separation bubble zone delineated by the isoline of H12 = 3.5 not only significantly reduced the time range (due to the increased influence range of the wake) but also continuously reduced its axial range (representing the size of the separation bubble) and peak value (representing the thickness of the separation bubble). This result was obtained for the following reason: although in the wake gap, the mixing and dissipation of the wake upstream enhanced the turbulence intensity of the main flow at the inlet of LPT-GV to a certain extent, with increasing d/s, the further enhanced turbulence intensity was conducive to promoting energy exchange between the boundary layer and the main flow and induced the boundary layer transition earlier, resulting in better suppression of the size and thickness of the boundary layer separation bubble.
The loss coefficient of the boundary layer represented the viscosity loss in the boundary layer. Because of the wake dissipation and the interaction between the roll-up vortex induced by wake vortices [34] and the boundary layer, the boundary layer loss coefficient was high in the wake sweeping cycle, especially after the wake-induced transition (Line T), as shown in the green and red color blocks between Line A and Line B in the lower row of Figure 14. Comparing the different cases, with increasing d/s, the enhanced wake promoted the early transition of the boundary layer, and the wet area of the turbulent boundary layer with a high boundary layer loss coefficient (the red block behind Line T) expanded in the lower row of Figure 14. For example, when d/s = 0.122, the front point of the boundary layer transition was 0.065Cx earlier than that of the d/s = 0.078 case. Overall, wakes could not only reduce the losses by suppressing separation bubbles but also increase viscosity loss due to the increasing wet area of the turbulent boundary layer, which indicated that a comprehensive balance of these two factors was the key to the effective use of sweeping wakes.
Before discussing the influence of the upstream wake on vortices, its origin and distribution in the integrated LPT-GV passage must be briefly introduced. Figure 15 shows the vortex distribution in the LPT-GV passage when d/s = 0.078. The upstream boundary layer rolled up at the leading edge of the LPT-GV and moved downstream along the blade, resulting in a horseshoe vortex in the upper and lower regions. This vortex with a small scale was generally confined in the boundary layer of the hub or shroud. In the upper-end region of LPT-GV, the pressure surface branch of the horseshoe vortex moved toward the suction surface under the circumferential pressure gradient, continuously entrained the low momentum fluid in the end region, and then developed into a passage vortex. After reaching the suction surface, because of the radial secondary flow from the shroud to the hub at the rear of the LPT-GV, this passage vortex moved down radially and finally split into two vortices: one of the vortices moved down radially, as shown by PV3 in Figure 15; the other vortex continued to move downstream along the blade root and then split into two vortices again by the pull of radial secondary flow when it grew large enough, as shown by PV1 and PV2 in Figure 15. Because of the weakening radial pressure gradient, this passage vortex only split once when d/s ≥ 0.10, resulting in PV1 and PV3 vortices in Figure 15. A small-scale corner vortex was near the shroud. In the lower end region, there was also a passage vortex based on the same formation mechanism mentioned above. Under the radial pressure gradient at the rear of the LPT-GV, this passage vortex did not grow upward radially but concentrated around the blade root. There were also two small-scale vortices—the counter vortex and the corner vortex—as shown in Figure 15. For the interaction and mixing process between different vortices, the readers can refer to [32,39,41].
Figure 16 shows the total pressure coefficient contour of five streamwise sections in the LPT-GV channel when d/s = 0.078, 0.10 and 0.122. When d/s ≤ 0.10, due to the abovementioned radial upward secondary flow, the low-energy fluid was enriched near the shroud (as shown in Figure 11b,c), resulting in a thick boundary layer on the shroud, as shown by ‘TBL’ in Sections C1 and C2 in Figure 16. In contrast, when d/s > 0.10, because the radial pressure gradient was weakened by the stronger sweeping wake, the boundary layer of the shroud (as shown by ‘BL’ in Sections C1 and C2 in Figure 16) was thinner than that of the case with a small d/s, but the total pressure coefficient near the shroud (h/H = 0.7~1.0) still decreased because of the dissipation of strong wakes. In the tip region of the LPT-GV, the passage vortices (marked by ‘PV’ in Section C3 of Figure 16) entrained a large amount of low momentum fluid in the boundary layer of the end wall, resulting in the boundary layer of Section C3 being thinner than that of Section C2 in all cases. Comparing these passage vortices in different cases, the PV area in Section C3 decreased with increasing d/s. This result was obtained because the boundary layer thickness of the end wall and radial pressure gradient, which are two important factors for the formation of passage vortices, decreased with increasing d/s. Similarly, the strength and range of PV3 split from the passage vortices downstream of Section C3 and decreased with increasing d/s. Unlike PV3, the influence range of the residual passage vortex increased with d/s, as shown by the yellow contour marked by ‘PV1′ in Figure 15. This result was obtained mainly because many low momentum fluids were in the region around the shroud, which could be entrained by PV1, due to the dissipation of the residual wake vortices (as shown in Section B6 of Figure 10) when d/s was large. This result also showed that the influence of wake on the vortices in the LPT-GV’s tip region had an obvious two-sidedness: (1) it could weaken the passage vortices by reducing the radial pressure gradient; (2) the low-momentum fluid could enhance the passage vortices in the LPT-GVs’ tip region due to its own strong dissipation.
In the midspan of the LPT-GV, the boundary layer of the suction surface continuously thickened from Section C3 to Section C5 in Figure 16 because of the inverse pressure gradient (as shown in Figure 16). Moreover, with increasing d/s, the boundary layer thickness of the suction surface increased in the same axial section. This result was obtained because the wake could trigger the earlier transition of the boundary layer with increasing d/s, which increased the growth time of the turbulent boundary layer under an inverse pressure gradient. At the root of the LPT-GV with increasing d/s, the decreasing radial pressure gradient, as mentioned above, also weakens the passage vortices in this region (as shown by ‘PV4’ in Figure 16), which is conducive to reducing the total pressure loss in the corresponding regions.
Figure 17 shows the radial distribution of the pitchwise mass-averaged total pressure coefficient at the integrated AITD outlet. From the general trend, the total pressure coefficient decreased with increasing d/s, but the mechanism of flow loss differed between regions: (1) Near the hub (h/H < 0.1), the wake dissipated rapidly in all cases and was exhausted before reaching the inlet of LPT-GV, so the loss in this region was hardly affected by the sweeping wake, as shown by the coincident total pressure coefficient curves of this region in Figure 17. (2) In the middle region (h/H = 0.2~0.7), the loss mainly came from wake dissipation and boundary layer separation. Although the sweeping wake could further inhibit the time and space range of separation bubbles when d/s was large, the aerodynamic income was still insufficient to compensate for the total pressure loss caused by the wake dissipation. Therefore, the total pressure coefficient in this region decreased with increasing d/s. (3) Near the shroud (h/H > 0.7), the loss mainly came from the passage vortex and the wake mixing. Based on the above conclusions, strong residual wake vortices were still in this region at the inlet of the LPT-GV, which can bring total pressure gain by suppressing the passage vortex and separation bubble, and this aerodynamic profit was significantly greater than that in the middle region, so the total pressure coefficient in this region was higher than that in the middle region. However, when d/s was large, the total pressure coefficient was still smaller than that in the case of a small d/s, which indicated that the aerodynamic benefit brought by increasing the intensity of wakes was still insufficient to offset the total pressure loss caused by its dissipation near the shroud. Given this situation, to improve the aerodynamic performance of AITD by using the sweeping wake, the authors believed that the following methods could be adopted: (1) Reduce the blade loading of the LPT-GV by increasing the number of blades, thereby suppressing the size of the passage vortex near the hub and separation bubble in the middle of the blade section, reducing the loss of the LPT-GV’s middle and lower sections; then, use the HPT wakes with a small trailing-edge radius to control the separation bubble on the blades’ middle section to suppress the loss of the separation bubble when reducing the loss caused by the wake dissipation. (2) Further shorten the axial distance between the HPT and LPT-GV so that the wakes of the HPT can reach the LPT-GV before being completely dissipated to make full use of the HPT wake with a small trailing-edge radius to suppress flow separation and passage vortices, reduce the wake dissipation loss and improve the aerodynamic gain brought by the flow control using HPT wakes.
Figure 18 shows the total pressure loss of the integrated AITD and its components in all cases. The total pressure loss of AITD increased with increasing d/s, and the loss of the integrated LPT-GV was the main loss source, accounting for more than 82.9% (@d/s = 0.144). If the design condition with d/s = 0.10 was used as a benchmark, then reducing the d/s value of the sweeping rod helped to decrease the total pressure loss of the integrated AITD, which indicated that the radius of the HPT trailing edge should be minimized to reduce the additional loss caused by the wake dissipation within the scope of this paper. When d/s ≤ 0.078, the loss of the integrated LPT-GV remained basically unchanged, which indicated that the aerodynamic gain of wakes could offset their dissipation. Whether a further reduction of the d/s value can lead to the reverse overshoot of aerodynamic gain needs to be further studied. When d/s > 0.078, the aerodynamic gain of the sweeping wake was obviously insufficient to compensate for its dissipation, resulting in increased loss of the integrated LPT-GV with increasing d/s. For the AITD upstream of the LPT-GV, the loss mainly included the wall friction loss and the wake dissipation loss and increased with increasing d/s.

4. Conclusions

A detailed unsteady numerical study was carried out to investigate the effects of the HP rotor trailing-edge radius on the unsteady flow characteristics in the integrated AITD. The HP rotor wake was simulated by a sweeping rod to decouple its influence from other secondary flows. The radial pressure gradient in the integrated AITD passage decreased with increasing rod diameter (d/s), especially at its first bend. The wake in the lower part of the AITD channel was exhausted rapidly before reaching the LPT-GV inlet because of the stretching between its own circumferential motion and the radial upward secondary flow for all values of d/s, especially when d/s was small. For the upper part of the AITD channel, the wake vortices were gathered, squeezed and dissipated because of the stronger radially upward secondary flow when d/s was small. When d/s was large, these processes were delayed because of the stronger wake that reduced the radial pressure gradient, and some residual wake vortices in the upper part of the channel could reach the LPT-GV.
For the LPT-GV, the pressure gradient from the pressure surface to the suction surface was enhanced with increasing d/s, especially in the lower region of the blade passage. In the blade tip region, the passage vortices were significantly enhanced in the small d/s cases because of the enrichment of low momentum fluid and the stronger radial pressure gradient. In the blade root region, the difference between the passage vortices was small because the wake vortices had been dissipated upstream of the LPT-GV in all cases. In the midspan of the blade, the length, thickness and existence time of the separation bubble decreased with increasing d/s, resulting in a reduction in the loss of the separation bubble; however, the strong wake induced the boundary layer transition to occur earlier, increasing the wet area of the turbulent boundary, which in turn led to an increase in losses.
The flow loss in the integrated AITD was dominated by wake dissipation, passage vortices and boundary layer separation and increased with increasing d/s. In the scope of this study, as the aerodynamic gain of the wake was still not enough to compensate for its loss increment, the authors suggested that selecting a small trailing-edge radius of HPT is conducive to improving the aerodynamic performance of the integrated AITD.

Author Contributions

Conceptualization, Z.L.; validation, H.L. and G.L.; formal analysis, J.G. and Y.Z.; writing-original draft preparation, Z.L.; writing-review and editing H.L. and G.L.; project administration, X.L.; supervision, G.L., G.X. and J.Z. All authors have read and agreed to the published version of the manuscript.

Funding

This research was funded by “the National Natural Science Foundation of China, grant number 51906242” and “the National Science and Technology Major Project, grant number J2019-II-0007-0027 and J2019-III-0020-0064”.

Conflicts of Interest

The authors declare no conflict of interest.

Nomenclature

AR: outlet-to-inlet area ratio
AITD: aggressive Interturbine transition duct
C d : resistance coefficient of the sweeping rod
C p 0 = p 0 p s , ref / p 0 , ref p s , ref : total pressure coefficient
C ps = p s p s , ref / p 0 , ref p s , ref 
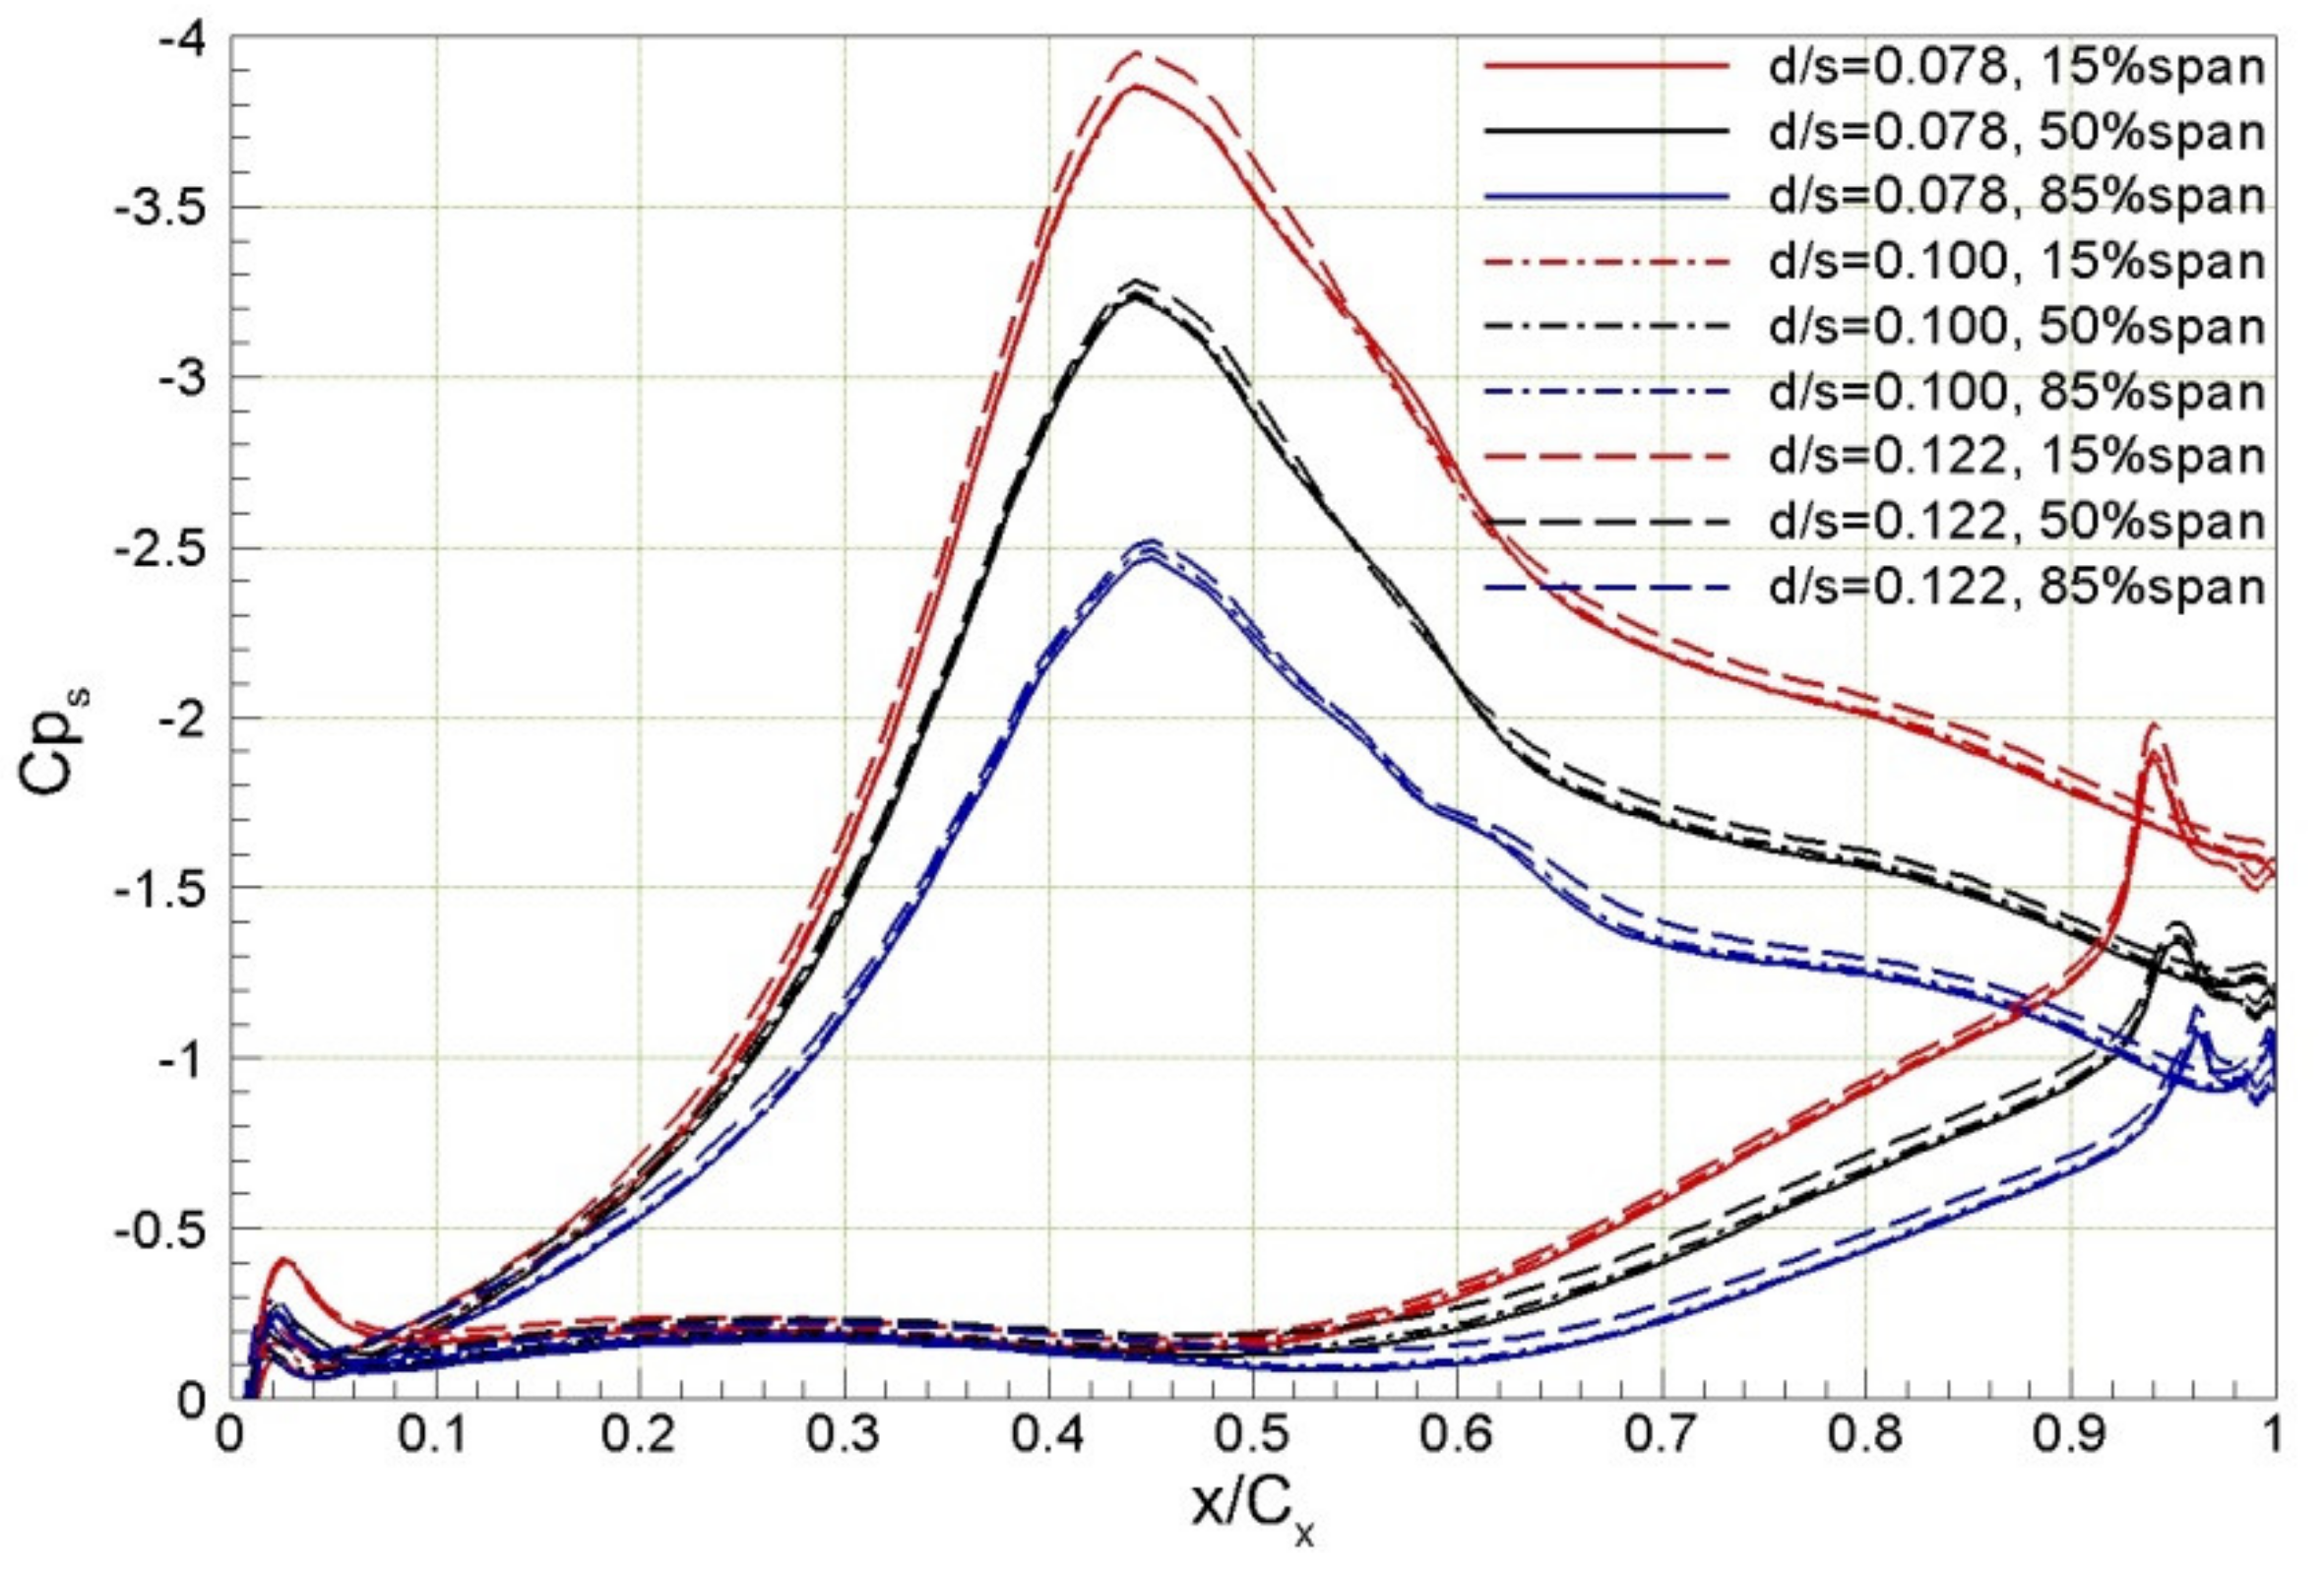
: static pressure coefficient
C ω s = v x ω x + v y ω y + v z ω z · H / u e · v x 2 + v y 2 + v z 2 : streamwise vorticity coefficient
C x : axial chord
d : diameter of the sweeping rod
d / s : nondimensional diameter of the sweeping rod
f : reduced frequency
f H P T : passing frequency of the HPT rotor
FSTI: free stream turbulence intensity
h : height relative to hub
H : annulus height of the ITD inlet
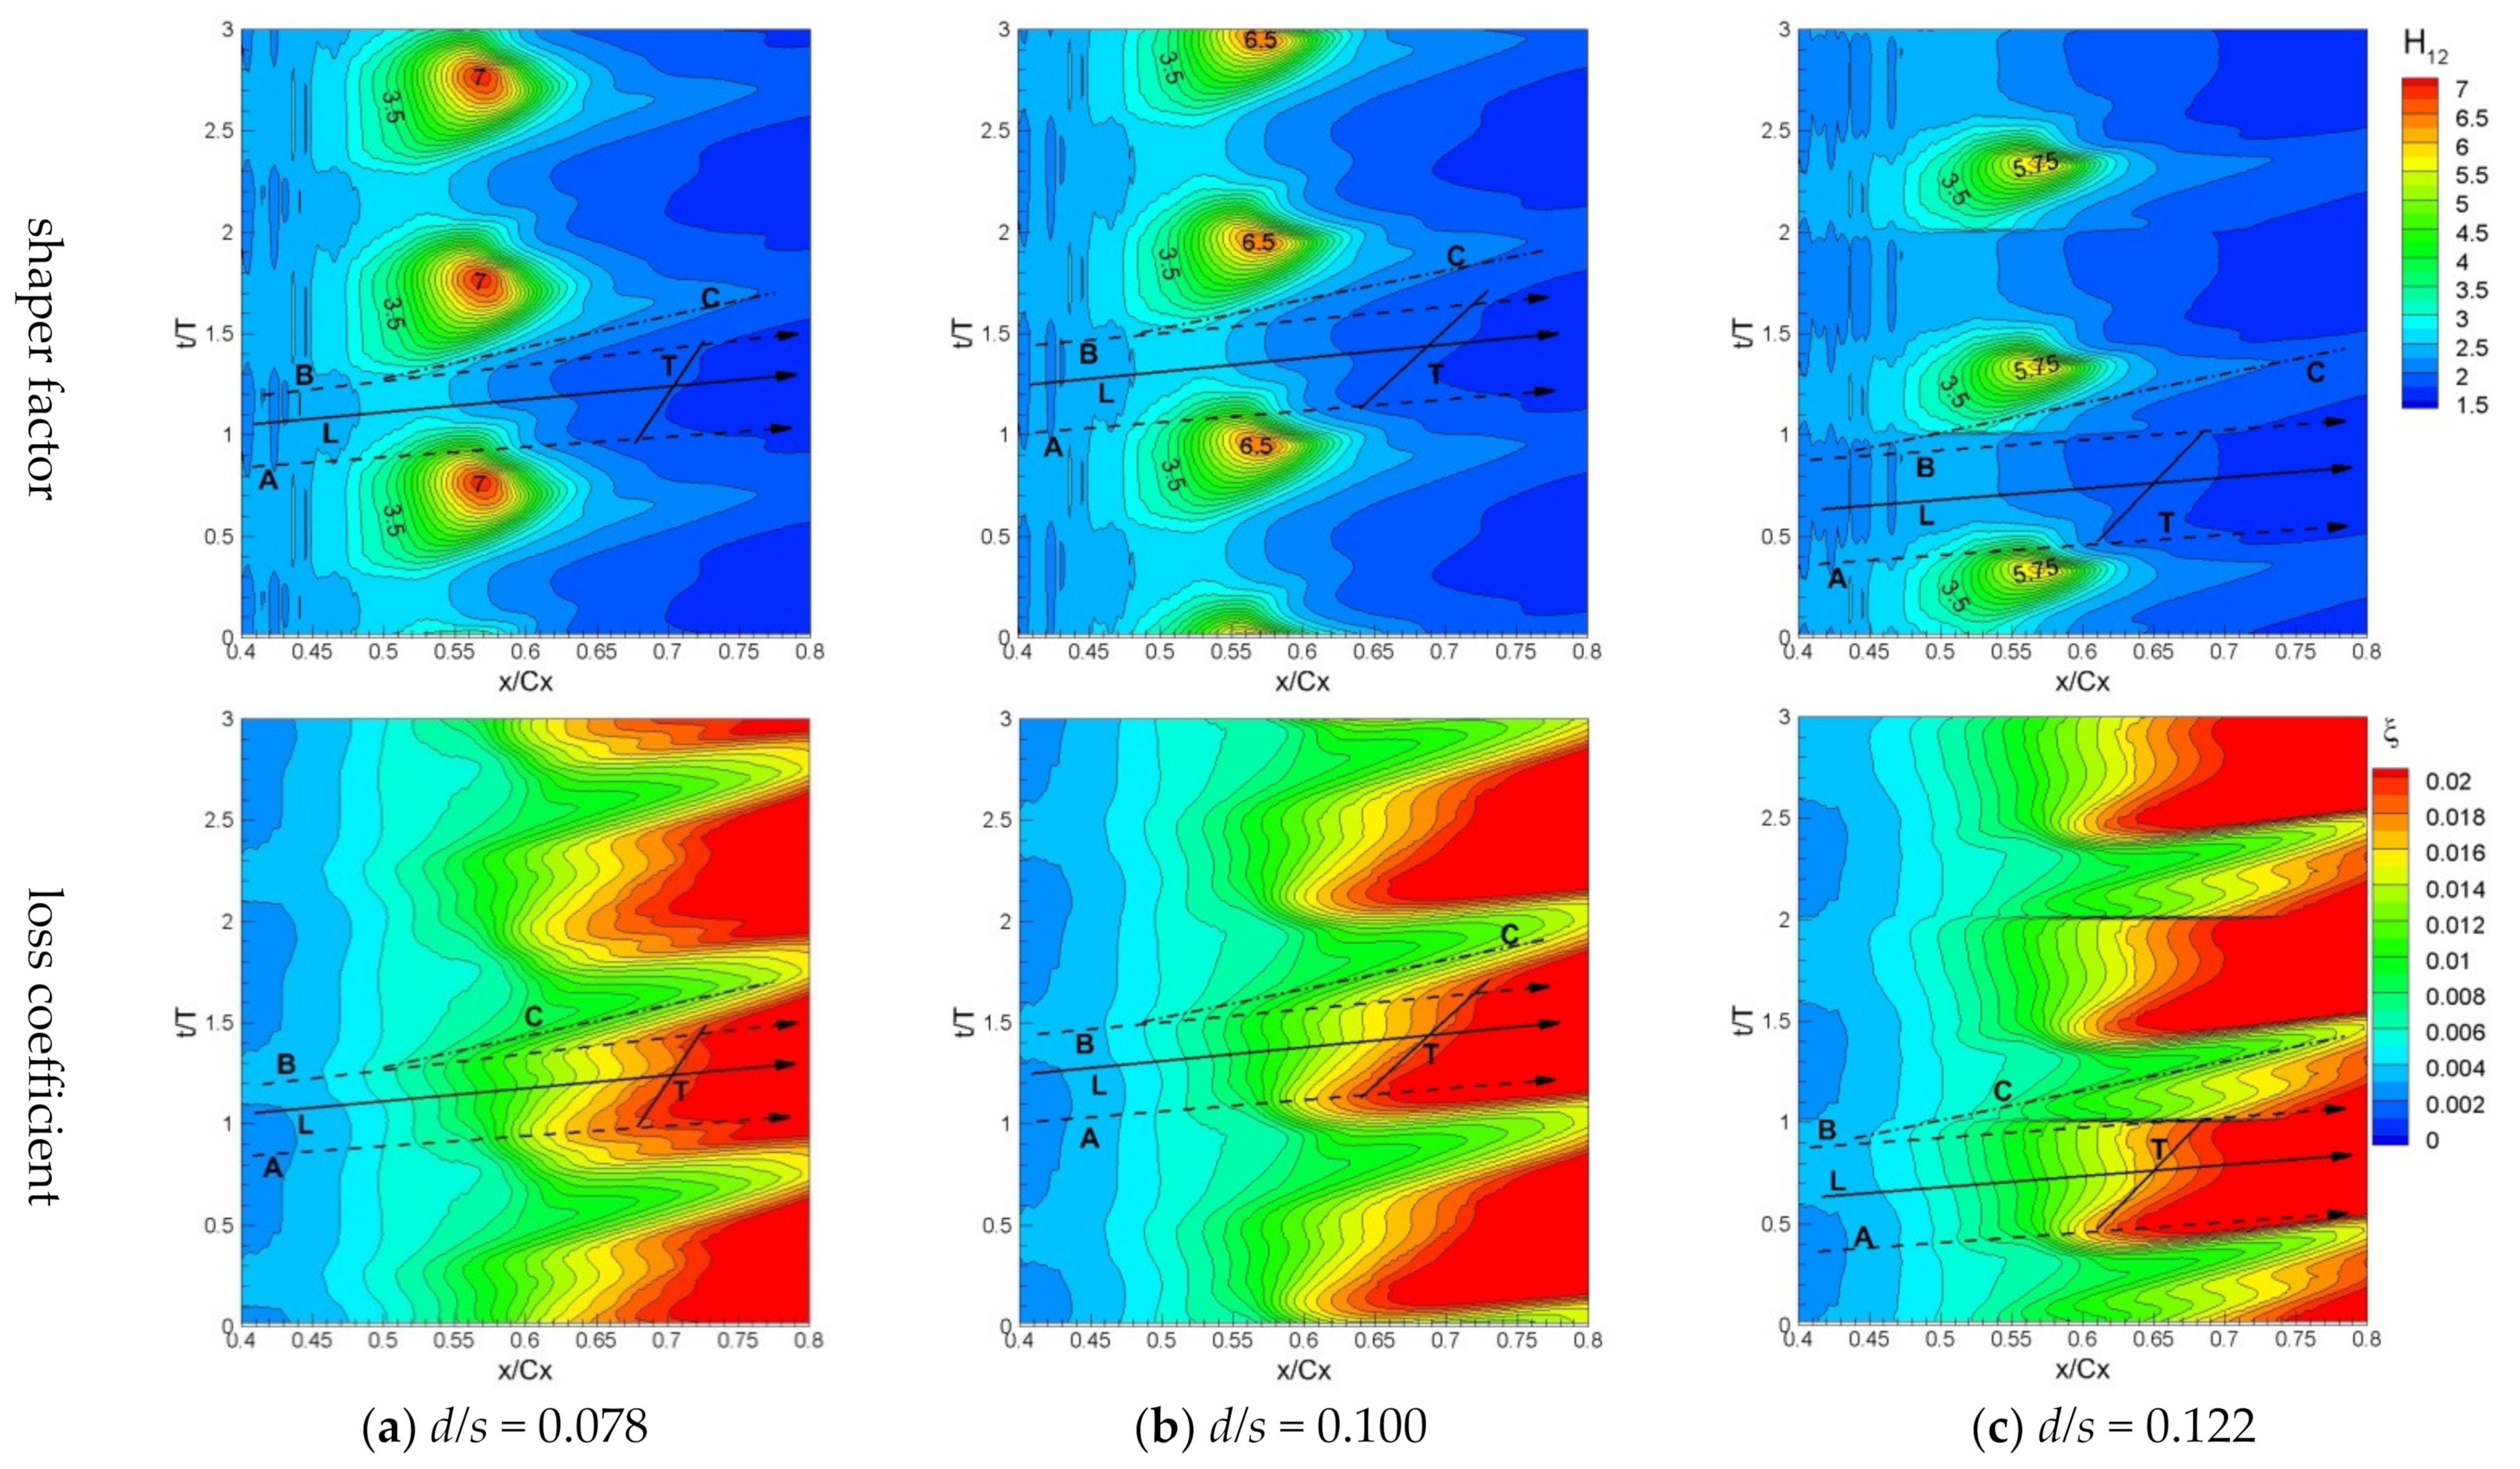
H 12 : shape factor
HP: high pressure
HPT: high pressure turbine
ITD: Interturbine transition duct
L: axial length of ITD
L/H: nondimensional axial length of ITD
LP: low pressure
LPT: low pressure turbine
LPT-GV: low pressure turbine-guide vane
R hub : radius of hub at the ITD’s inlet
R tip : radius of casing at the ITD’s inlet
r e f : reference plane (Plane B0)
s : pitch of LPT-GV at midspan
s b : the sweeping rod spacing at midspan
T: the time of full cycle sweeping wake
T u : turbulence intensity
u e : mass-averaged exit velocity
w : width of wake
w / s : nondimensional width of wake
Y : total pressure loss
y + : nondimensional thichness of the first layer grid on the wall
Z : cosecant of the relative flow angle at HPT outlet
θ : mean rise angle/momentum thickness
β e : the exit flow angle
ξ = 2 θ / s · c o s β e : loss coefficient
Δ t : the minimum physical time step

References

  1. Dominy, R.G.; Kirkham, D.A. The Influence of Blade Wakes on the Performance of Inter-turbine Diffusers. J. Turbomach. 1996, 118, 347–352. [Google Scholar] [CrossRef]
  2. Dominy, R.G.; Kirkham, D.A.; Smith, A.D. Flow Development through Inter-turbine Diffusers. J. Turbomach. 1998, 120, 298–304. [Google Scholar] [CrossRef]
  3. Zhang, X.; Hu, S.; Benner, M.; Gostelow, P.; Vlasic, E. Experimental and Numerical Study on an Inter-turbine Duct. In Proceedings of the ASME 2010 International Mechanical Engineering Congress and Exposition, Vancouverm, BC, Canada, 12–18 November 2010; Paper No.: IMECE2010-37322. pp. 679–690. [Google Scholar]
  4. Miller, R.J.; Moss, R.W.; Ainsworth, R.W.; Harvey, N.W. The Development of Turbine Exit Flow in a Swan-Necked Inter-stage Diffuser. In Proceedings of the ASME Turbo Expo 2003: Power for Land, Sea, and Air, Atlanta, GA, USA, 16–19 June 2003; Paper No.: GT2003-38174. pp. 863–875. [Google Scholar]
  5. Norris, G.; Dominy, R.G. Diffusion Rate Influences on Inter-Turbine Diffusers. Proc. Inst. Mech. Eng. Part A J. Power Energy 1997, 211, 235–242. [Google Scholar] [CrossRef]
  6. Zhang, Y.; Hu, S.; Mahallati, A.; Zhang, X.; Vlasic, E. Effects of Area Ratio and Mean Rise Angle on the Aerodynamics of Inter-Turbine Ducts. J. Turbomach. 2018, 140, 091006. [Google Scholar] [CrossRef]
  7. Axelsson, L.U.; Osso, C.A.; Cadrecha, D.; Johansson, T.G. Design, Performance Evaluation and Endwall Flow Structure Investigation of an S-shaped Intermediate Turbine Duct. In Proceedings of the ASME Turbo Expo 2007: Power for Land, Sea, and Air, Montreal, QC, Canada, 14–17 May 2007; Paper No.: GT2007-27650. pp. 693–701. [Google Scholar]
  8. Axelsson, L.U.; Johansson, T.G. Experimental Investigation of the Time-Averaged Flow in an Intermediate Turbine Duct. In Proceedings of the ASME Turbo Expo 2008: Power for Land, Sea, and Air, Berlin, Germany, 9–13 June 2008; Paper No.: GT2008-50829. pp. 1313–1322. [Google Scholar]
  9. Axelsson, L.U.; George, W.K. Spectral Analysis of the Flow in an Intermediate Turbine Duct. In Proceedings of the ASME Turbo Expo 2008: Power for Land, Sea, and Air, Berlin, Germany, 9–13 June 2008; Paper No.: GT2008-51340. pp. 1419–1426. [Google Scholar]
  10. Göttlich, E.; Marn, A.; Pecnik, R.; Malzacher, F.; Schennach, O.; Pirker, H. The Influence of Blade Tip Gap Variation on the Flow through an Aggressive S-Shaped Intermediate Turbine Duct Downstream a Transonic Turbine Stage: Part II—Time-Resolved Results and Surface Flow. In Proceedings of the ASME Turbo Expo 2007: Power for Land, Sea, and Air, Montreal, QC, Canada, 14–17 May 2007; Paper No.: GT2007-28069. pp. 843–853. [Google Scholar]
  11. Marn, A.; Göttlich, E.; Pecnik, R.; Malzacher, F.; Schennach, O.; Pirker, H. The Influence of Blade Tip Gap Variation on the Flow through an Aggressive S-Shaped Intermediate Turbine Duct Downstream a Transonic Turbine Stage: Part I—Time-Averaged Results. In Proceedings of the ASME Turbo Expo 2007: Power for Land, Sea, and Air, Montreal, QC, Canada, 14–17 May 2007; Paper No.: GT2007-27405. pp. 575–585. [Google Scholar]
  12. Göttlich, E.; Heitmeir, F.; Malzacher, F.; Marn, A. Comparison between the Flow through an Aggressive and a Super-Aggressive Intermediate Turbine Duct. In Proceedings of the International Symposium on Air Breathing Engines, Montreal, QC, Canada, 7–11 September 2009. Paper No.: ISABE-2009-1259. [Google Scholar]
  13. Marn, A.; Göttlich, E.; Malzacher, F.; Pirker, H. The Effect of Rotor Tip Clearance Size onto the Separated Flow through a Super-Aggressive S-Shaped Intermediate Turbine Duct Downstream of a Transonic Turbine Stage. J. Turbomach. 2012, 134, 051019. [Google Scholar] [CrossRef]
  14. Dominy, R.G.; Kirkham, D.A. The Influence of Swirl on the Performance of Inter-Turbine Diffusers. VDI Berichte. 1995, 1186, 107–122. [Google Scholar]
  15. Hu, S.; Zhang, Y.; Zhang, X.; Vlasic, E. Influences of Inlet Swirl Distributions on an Inter-Turbine Duct: Part I—Casing Swirl Variation. In Proceedings of the ASME Turbo Expo 2011: Power for Land, Sea, and Air, Vancouver, BC, Canada, 6–10 June 2010; Paper No.: GT2011-45554. pp. 619–630. [Google Scholar]
  16. Zhang, Y.; Hu, S.; Zhang, X.; Vlasic, E. Influences of Inlet Swirl Distributions on an Inter-Turbine Duct: Part II—Hub Swirl Variation. In Proceedings of the ASME Turbo Expo 2011: Power for Land, Sea, and Air, Vancouver, BC, Canada, 6–10 June 2010; Paper No.: GT2011-45555. pp. 631–641. [Google Scholar]
  17. Bailey, D.W.; Carrotte, J.F. The Influence of Inlet Swirl on the Flow within an Annular S-Shaped Duct. In Proceedings of the International Gas Turbine and Aeroengine Congress and Exhibition, Birmingham, UK, 10–13 June 1996. Paper No.: 96-GT-060. [Google Scholar]
  18. Schennach, O.; Pecnik, R.; Paradiso, B.; Göttlich, E.; Marn, A.; WoisetschläGer, J. The Effect of Vane Clocking on the Unsteady Flow Field in a One-and-a-Half Stage Transonic Turbine. J. Turbomach. 2008, 130, 031022. [Google Scholar] [CrossRef]
  19. Norris, G.; Dominy, R.G.; Smith, A.D. Strut Influences within a Diffusing Annular S-Shaped Duct. In Proceedings of the International Gas Turbine and Aeroengine Congress and Exhibition, Stockholm, Sweden, 2–5 June 1998. Paper No.: 98-GT-425. [Google Scholar]
  20. Norris, G.; Dominy, R.G.; Smith, A.D. Flow Instability within a Diffusing, Annular S-Shaped Duct. In Proceedings of the International Gas Turbine and Aeroengine Congress and Exhibition, Indianapolis, IN, USA, 7–10 June. Paper No.: 99-GT-070.
  21. Miller, R.J.; Moss, R.W.; Ainsworth, R.W.; Harvey, N.W. The Effect of an Upstream Turbine on a Low-Aspect Ratio Vane. In Proceedings of the ASME Turbo Expo 2004: Power for Land, Sea, and Air, Vienna, Austria, 14–17 June 2004; Paper No.: GT2004-54017. pp. 1417–1428. [Google Scholar]
  22. Walker, A.D.; Barker, A.G.; Mariah, I.; Peacock, G.L.; Northall, R. An Aggressive S-Shaped Compressor Transition Duct with Swirling Flow and Aerodynamic Lifting Struts. In Proceedings of the ASME Turbo Expo 2014: Power for Land, Sea, and Air, Düsseldorf, Germany, 16–20 June 2014. Paper No.: GT2014-25844. [Google Scholar]
  23. Lengani, D.; Santner, C.; Spataro, R.; Paradiso, B.; Göttlich, E. Experimental Investigation of the Unsteady Flow Field Downstream of a Counter-Rotating Two-Spool Turbine Rig. In Proceedings of the ASME Turbo Expo 2012: Power for Land, Sea, and Air, Copenhagen, Denmark, 11–15 June 2012; Paper No.: 2545-2554. pp. 2545–2554. [Google Scholar]
  24. Lengani, D.; Santner, C.; Spataro, R.; Ttlich, E.G. Analysis Tools for the Unsteady Interactions in a Counter-Rotating Two-Spool Turbine Rig. Exp. Therm. Fluid Sci. 2012, 42, 248–257. [Google Scholar] [CrossRef]
  25. Marn, A.; Göttlich, E.; Cadrecha, D.; Pirker, H.P. Shorten the Intermediate Turbine Duct Length by Applying an Integrated Concept. In Proceedings of the ASME Turbo Expo 2008: Power for Land, Sea, and Air, Berlin, Germany, 9–13 June 2008; Paper No.: GT2008-50269. pp. 1041–1051. [Google Scholar]
  26. Spataro, R.; Santner, C.; Lengani, D.; Göttlich, E. On the Flow Evolution through a LP Turbine with Wide-Chord Vanes in an S-Shaped Channel. In Proceedings of the ASME Turbo Expo 2012: Turbine Technical Conference and Exposition, Copenhagen, Denmark, 11–15 June 2012; Paper No.: GT2012-68178. pp. 1011–1020. [Google Scholar]
  27. Bader, P.; Sanz, W.; Spataro, R.; Göttlich, E. Flow Evolution through a Turning Mid Turbine Frame with Embedded Design. In Proceedings of the ASME Turbo Expo 2014: Power for Land, Sea, and Air, Düsseldorf, Germany, 16–20 June 2014. Paper No.: GT2014-25009. [Google Scholar]
  28. Faustmann, C.; Zerobin, S.; Spataro, R.; Marn, A.; Heitmeir, F.; Göttlich, E. On the Acoustics of a Turning Mid Turbine Frame with Embedded Design in a Two-Stage Test-Turbine. Proc. Inst. Mech. Eng. Part A J. Power Energy 2015, 229, 529–538. [Google Scholar] [CrossRef]
  29. Du, Q.; Wang, P.; Gong, J.; Zhu, J. Design Performance Evaluation and Vortex Structure Investigation of Different S-Shaped Intermediate Turbine Ducts. Sci. China Technol. Sci. 2012, 55, 3510–3520. [Google Scholar] [CrossRef]
  30. Wang, P. Design and Flow Mechanism of Integrated Aggressive Intermediate Turbine Duct; Institute of Engineering Thermophysics, C.A.S.: Beijing, China, 2014. [Google Scholar]
  31. Liu, J.; Wang, P.; Du, Q.; Liu, G.; Zhu, J. Effects of Rising Angle on Upstream Blades and Intermediate Turbine Duct. J. Therm. Sci. 2016, 25, 293–301. [Google Scholar] [CrossRef]
  32. Xu, Q.; Wang, P.; Du, Q.; Liu, J.; Liu, G. Effects of Axial Length and Integrated Design on the Aggressive Intermediate Turbine Duct. Proc. IMechE Part A J. Power Energy 2018, 233, 443–456. [Google Scholar] [CrossRef]
  33. Liu, H.; Liu, J.; Ji, L.; Du, Q.; Liu, G.; Wang, P. Influence of Reynolds Number on the Unsteady Aerodynamics of Integrated Aggressive Intermediate Turbine Duct. J. Therm. Sci. 2018, 27, 294–303. [Google Scholar] [CrossRef]
  34. Mahallati, A. Aerodynamics of a Low Pressure Turbine Airfoil Under steady and Periodically Unsteady Conditions. Ph.D. Thesis, Carleton University, Ottawa, ON, Canada, 2004. [Google Scholar]
  35. Meyer, R.J. The Effect of Wakes on the Transient Pressure and Velocity Distributions in Turbomachines. ASME J. Basic Eng. 1958, 80, 1544–1552. [Google Scholar] [CrossRef]
  36. Stieger, R.D. The Effects of Wakes on Separating Boundary Layers in Low Pressure Turbines. Ph.D. Thesis, Cambridge University, Cambridge, UK, 2002. [Google Scholar]
  37. Zhong, S.; Kittichaikarn, C.; Hodson, H.P.; Ireland, P. A study of unsteady wake-induced boundary layer transition with thermochromic liquid crystals. Proc. Inst. Mech. Eng. Part G J. Aerosp. Eng. 1999, 213, 163–171. [Google Scholar] [CrossRef]
  38. Roberts, S.K.; Yaras, M.I. Large-Eddy Simulation of Transition in a Separation Bubble. ASME J. Fluids Eng. 2006, 128, 232–238. [Google Scholar] [CrossRef]
  39. Liu, H.; Liu, J.; Du, Q.; Liu, G.; Wang, P. Unsteady Flow Mechanism of the integrated Aggressive Inter-turbine Duct in Low Reynolds number condition. Proc. Inst. Mech. Eng. Part G J. Aerosp. Eng. 2020, 234, 1507–1517. [Google Scholar] [CrossRef]
  40. Liu, H.; Liu, J.; Du, Q.; Liu, G.; Wang, P. Impact of Turbulence Intensity on the Unsteady Flow Characteristics of the integrated Aggressive Inter-turbine Duct. Proc. Inst. Mech. Eng. Part A J. Power Energy 2020, 234, 490–499. [Google Scholar] [CrossRef]
  41. Jeon, W.; Shin, C.B. Design and Simulation of Passive Mixing in Microfluidic Systems with Geometric Variations. Chem. Eng. J. 2009, 152, 575–582. [Google Scholar] [CrossRef]
Figure 1. Typical ITD in a turbofan aeroengine.
Applsci 12 06655 g001
Figure 2. Cross section of the integrated AITD and measurement locations.
Applsci 12 06655 g002
Figure 3. ITD design parameters of some turbofan engines [30].
Applsci 12 06655 g003
Figure 4. Calculation domain and grid of the integrated AITD.
Applsci 12 06655 g004
Figure 5. Sketch and grid of the AITD.
Applsci 12 06655 g005
Figure 6. Flow visualization and computed limiting streamline on the ITD.
Applsci 12 06655 g006
Figure 7. Comparison between experimental and numerical results.
Applsci 12 06655 g007
Figure 8. Circumferential distribution of turbulence intensity at the midspan of different passages inside the AITD.
Applsci 12 06655 g008
Figure 9. Time-averaged wall static pressure coefficient on the hub and shroud of the AITD.
Applsci 12 06655 g009
Figure 10. Time-averaged streamwise vorticity contour in different sections of the AITD.
Applsci 12 06655 g010
Figure 11. Distribution of the pitchwise mass-averaged total pressure coefficient and its contour in Section B6.
Applsci 12 06655 g011
Figure 12. Distribution of the time-averaged static pressure coefficient on the integrated LPT-GV in the AITD.
Applsci 12 06655 g012
Figure 13. Limited streamline and static pressure coefficient contour on the suction surface of the integrated LPT-GV.
Applsci 12 06655 g013
Figure 14. Space-time diagram of the boundary layer shape factor and loss coefficient when d/s = 0.078, 0.10 and 0.122.
Applsci 12 06655 g014
Figure 15. Vortices in the integrated LPT-GV passage when d/s = 0.078.
Applsci 12 06655 g015
Figure 16. Total pressure coefficient contour of the integrated LPT-GV passages.
Applsci 12 06655 g016
Figure 17. Radial distribution of the pitchwise averaged total pressure coefficient at the outlet of the AITD.
Applsci 12 06655 g017
Figure 18. Total pressure loss of the integrated AITD and its components in all cases.
Applsci 12 06655 g018
Table 1. Design parameters of the integrated LPT-GV.
Chord
(mm)
Leading-Edge Radius
(mm)
Trailing-Edge Radius
(mm)
Stagger Angle
(°)
Inlet Metal Angle
(°)
Outlet Metal Angle
(°)
Tmax/ChordThroat/PitchSolidity
Root74.53.52.535°−6°62°0.2000.4441.348
Midspan94.13.52.535°−6°62°0.1970.4271.457
Tip112.83.52.535°−6°62°0.1940.4101.566
Publisher’s Note: MDPI stays neutral with regard to jurisdictional claims in published maps and institutional affiliations.

