Article

Salt-Induced Homogeneous Liquid–Liquid Microextraction of Piroxicam and Meloxicam from Human Urine Prior to Their Determination by HPLC-DAD

by
Natalia Manousi
1,
Sotiria V. Tsiona
2 and
Constantinos K. Zacharis
2,*
1
Laboratory of Analytical Chemistry, Department of Chemistry, Aristotle University of Thessaloniki, 54124 Thessaloniki, Greece
2
Laboratory of Pharmaceutical Analysis, Department of Pharmaceutical Technology, School of Pharmacy, Aristotle University of Thessaloniki, 54124 Thessaloniki, Greece
*
Author to whom correspondence should be addressed.
Appl. Sci. 2022, 12(13), 6658; https://doi.org/10.3390/app12136658
Submission received: 30 May 2022 / Revised: 22 June 2022 / Accepted: 29 June 2022 / Published: 30 June 2022
(This article belongs to the Special Issue Advances in Bioanalysis: Extraction and Sample Preparation)

Abstract

:
A salt-induced homogeneous liquid–liquid microextraction (SI-HLLME) protocol combined with high-performance liquid chromatography–diode array detection is presented for the first time for the determination of piroxicam and meloxicam in human urine. The main parameters affecting the performance of the sample preparation protocol were optimized by means of a two-step experimental design (i.e., 2-level fractional factorial design and Box–Behnken design). Following its optimization, the proposed method was thoroughly validated in terms of the total error concept in order to take into consideration the random and systematic errors. For the target analytes, accuracy profiles were constructed, and they were used as graphical decision-making tools. In all cases, the β-expectation tolerance intervals complied with the acceptance criteria of ±15%, proving that 95% of future results will fall within the defined bias limits. The limits of detection were 0.02 μg mL−1 and 0.03 μg mL−1 for piroxicam and meloxicam, respectively. The relative standard deviations were lower than 4.4% in all cases, and the mean relative biases ranged between −5.7 and 3.4% for both drugs. The proposed scheme is simple and rapid, while it is characterized by high sample throughput. Moreover, SI-HLLME requires reduced sample and reagent consumption, according to the requirements of Green Analytical Chemistry.

1. Introduction

Piroxicam and meloxicam are non-steroidal anti-inflammatory drugs (NSAIDs) and analgesic agents belonging to a class of compounds called oxicams [1,2]. Oxicams are structurally related to the enolic acid class of 4-hydroxy-1,2-benzothiazine carboxamides, and they are clinically used for the treatment of both acute and chronic inflammation through the inhibition of the activity of the two cyclooxygenase (COX) isoforms, COX-1 and COX-2 [3]. These drugs are generally used for the treatment of osteoarthritis and rheumatoid arthritis, as well as for other painful conditions including dental infections, injuries and cancer surgery [1,2]. Meloxicam is metabolized extensively in the liver and its metabolites are excreted both in urine and in feces [4,5]. In the last few years, the determination of NSAIDs in biological samples (e.g., urine, whole blood and plasma) has gained increasing popularity, which can be attributed to the long-term side effects of those compounds that are associated with gastrointestinal and cardiovascular complications [6]. Among the different available analytical techniques for determining these analytes in biosamples, high-performance liquid chromatography (HPLC) is the most widely used in modern laboratories. However, due to the high complexity of biological fluids combined with the relatively low concentration of the target analytes in these samples, a sample preparation step is generally required before their analytical determination [7].
Solid-phase extraction (SPE) and liquid–liquid extraction (LLE) are the major conventional sample preparation techniques that are nowadays considered well-established in bioanalysis [8]. However, both techniques show some inherent disadvantages including the increased consumption of hazardous solvents, as well as having time-consuming and labor intensive steps [9]. After the introduction of the Green Analytical Chemistry (GAC) principles [10], increasing attention has been devoted towards the replacement of these techniques with the so-called “green” microextraction techniques. Following this trend, a wide variety of novel sample preparation techniques have been developed and applied in bioanalysis, aiming to replace the less environmentally friendly SPE and LLE approaches. Typical examples of green extraction techniques used for the determination of drugs in biological matrices include sorbent-based approaches such as solid-phase microextraction [11], fabric phase sorptive extraction (FPSE) [12], capsule phase microextraction (CPME) [13], magnetic solid-phase extraction (MSPE) [14], stir bar sorptive extraction (SBSE) [15], pipette tip-based microextraction [16] and liquid-based approaches such as dispersive liquid–liquid microextraction (DLLME) [17], electromembrane extraction (EME) [18], homogeneous liquid–liquid microextraction (HLLME), etc. [19]. The advances in sample preparation techniques for bioanalytical purposes has recently been reviewed [20].
HLLME typically utilizes small volumes of hydrophilic solvents as extractants that are miscible with water [21]. Due to the infinitely large surface area among the different phases, increased accessibility of this solvent to the target analytes can be achieved, resulting in a high extraction efficiency, high mass and rapid equilibrium [22,23]. Moreover, HLLME overcomes the need for analyte back-extraction due to the compatibility of the solvent with most chromatographic systems [21]. Common types of HLLME include the salt-induced HLLME (SI-HLLME) [24] and the sugar-induced HLLME [25], in which phase separation is achieved by the addition of salts and sugars, respectively. Other paths for the induction of the formation of the extractant phase include the reduction in temperature, the introduction of small amounts of hydrophobic solvents, the addition of buffer solutions for the acidification of the sample solution and the introduction of aprotic solvents [21,23]. Due to its inherent benefits, SI-HLLME has established itself as a useful bioanalytical tool. Typical applications of SI-HLLME include the extraction of azole antimicrobial drugs [19], amphetamines [26], fluoroquinolones [27], antiepileptic drugs [28], amantadine [29], etc. It is noteworthy that HLLME is also in good agreement with some principles of green sample preparation (GSP) that promotes the minimization of waste generation and energy demand, the achievement of high sample throughput and the miniaturization and simplification of the analytical procedure [30].
In this work, an SI-HLLME sample preparation scheme is proposed for the simultaneous extraction of piroxicam and meloxicam from human urine followed by their determination by HPLC-PDA. Initially, a screening 2-level fractional factorial experimental design was used to evaluate which parameters significantly affect the extraction procedure. These parameters were finally optimized by means of a Box–Behnken experimental design. The herein developed SI-HLLME method was validated following the total error concept approach, aiming to take into consideration the random and systematic errors and the accuracy profiles of the target analytes that were constructed.

2. Materials and Methods

2.1. Reagents and Solutions

All inorganic salts, urea, lactic acid and citric acid were purchased from Merck (Darmstadt, Germany). Methanol (MeOH) and acetonitrile (ACN) were purchased from Honeywell (Morris Plains, NJ, USA). Sodium hydroxide (NaOH) (1 mol L−1), hydrochloric acid (HCl) (1 mol L−1) and acetone (>99%), were purchased from Sigma-Aldrich (Steinheim, Germany). Milli-Q water was produced by a B30 water purification system (Adrona SIA, Riga, Latvia). Piroxicam and meloxicam (≥98.0%) were purchased from Sigma-Aldrich. Nimesulide (≥98.0%) was also obtained from Sigma-Aldrich and it was employed as an internal standard (ISTD).
A stock solution of piroxicam (250 μg mL−1) was made in methanol and a stock solution of meloxicam (250 μg mL−1) was made in 0.5% (v/v) NaOH (1 M) in methanol. A stock solution of nimesulide (100 mg L−1) was made in acetonitrile. All solutions were kept at 4 °C. The multi-analyte working solutions were made from the stock solution after appropriate dilution in water. Artificial urine samples were made based on Brooks and Keevil [31] by dissolving urea (5 g), lactic acid (0.05 g), NaHCO3 (1.05 g), citric acid (0.2 g), NH4Cl (0.65 g), MgSO4·7H2O (0.25 g), KH2PO4 (0.48 g), NaCl (2.6 g), Na2SO4 10H2O (1.6 g), K2HPO4 (0.6 g) and CaCl2 2H2O (0.19 g) in 500 mL H2O followed by pH adjusting to 6.0 using HCl.

2.2. Instrumentation and HPLC Conditions

The separation and determination of the target analytes were conducted utilizing a Shimadzu HPLC-PDA (Kyoto, Japan) system equipped with two high-pressure pumps (LC-20AD), an autosampler (SIL-20AC HT), a column oven (CTO-20AC) and a PDA detector (SPD-20A). System operation and data processing were performed using LC Solutions software (vs. 1.25 SP4). A BDS Hypersil column (100 × 4.6 mm, 3 μm) (Thermo Fisher Scientific, Waltham, MA, USA) was used as stationary phase. During sample analysis the column was maintained at 30 °C. The mobile phase was 20 mM KH2PO4 (A) and methanol (B). Analytes’ separation was conducted according to the following gradient elution program: initial composition 55% v/v (B) (constant for 3 min), then the composition changed to 70% v/v (B) at 6.0 min (constant until 8 min). The composition returned to the initial conditions at 10 min and it was equilibrated up to 15 min. The mobile phase flow rate was 1 mL min−1. The injection volume was 10 μL. The analytes and the ISTD were quantitatively determined at 360 nm.

2.3. Sample Collection

Blank human urine samples were collected from five healthy volunteers (n = 5) and they were stored at −18 °C, after centrifugation (5 min at 4000 rpm). The volunteers were thoroughly informed about the procedures followed in this study and their written ethical consent was obtained. The volunteers were not under medication with piroxicam and meloxicam. A pooled drug-free urine sample was prepared by mixing equal volumes of the collected samples. The pooled sample was employed in method validation. Prior to the SI-HLLME process, the human urine samples were 5-fold diluted using Milli-Q water.

2.4. SI-HLLME Procedure

Initially, an aliquot of 500 μL of a diluted human urine sample (CISTD = 5 μg mL−1) was placed in a 2.0 mL Eppendorf tube. For the SI-HLLME procedure, 600 μL of acetonitrile was added to the sample forming a homogeneous mixture. The obtained mixture was vortexed for 10 s and phase separation was achieved by adding 480 μL of sodium sulfate (2.5 mol L−1) into the Eppendorf tube, followed by centrifugation at 2000× g for 1 s. Subsequently, 400 μL of the organic layer was mixed with an equal amount of mobile phase A and the sample was injected to the HPLC column. Following this process, extraction was performed in <3 min and parallel handling of samples was possible resulting in high sample throughput.

3. Results and Discussion

Preliminary experiments involved the exploration of the effects of the kind of extraction solvent and the salt on the extraction performance for both analytes. These experiments were carried out using the one-variable-at-a-time approach. In the next stage, a two-step experimental design was adopted for screening and optimizing the microextraction-based method. Method optimization was performed using artificial urine spiked with both analytes at a concentration of 5 μg mL−1.

3.1. Influence of Extraction Solvent and Salt Type

The selection of the most appropriate and efficient extraction solvent is a crucial parameter affecting the extraction performance of the analytes [22]. The extraction solvent should normally show appropriate extraction efficiency and it must be compatible with the analytical technique. Furthermore, it must form a consistent layer after the step of phase separation. Regarding the agents used for phase formation, they must demonstrate high solubility in water and negligible solubility in the extraction solvent. In our study, different organic solvents were initially examined including methanol, isopropanol, acetonitrile and acetone. Moreover, the phase-forming agents such as sodium chloride, magnesium sulfate, zinc sulfate, ammonium chloride, ammonium sulfate and sodium sulfate were examined for their performance and suitability. Such experiments were performed by using aliquots of 500 μL of artificial urine mixed with 500 μL of the examined extraction solvents. An aliquot of 200 μL of the aforementioned salts was added in each mixture (Csalt = 2 mol L−1).
When methanol was used, no phase separation was observed, while phase separation was observed using isopropanol, acetonitrile and acetone in the presence of sulfate salts. However, the addition of magnesium sulfate and zinc sulfate in the salt solution resulted in an organic upper layer that contained a high water amount and was almost twice its initial volume. This phenomenon has also been reported elsewhere [19], and it can be attributed to the simultaneous extraction of polar interferences that could result in a significant matrix effect. Based on these results, both zinc sulfate and magnesium sulfate were excluded from the consequent trials. Analogous results were also obtained in the cases of isopropanol and acetone when mixed with sodium sulfate. On the other hand, the combination of acetonitrile/sodium sulfate resulted in an organic layer with low water content (460 ± 30 μL), providing a more suitable option for sample clean-up and the effectiveness of the SI-HLLME procedure. Additionally, acetonitrile exhibited compatibility with the mobile phase used during HPLC analysis, and it was finally adopted for the method development.

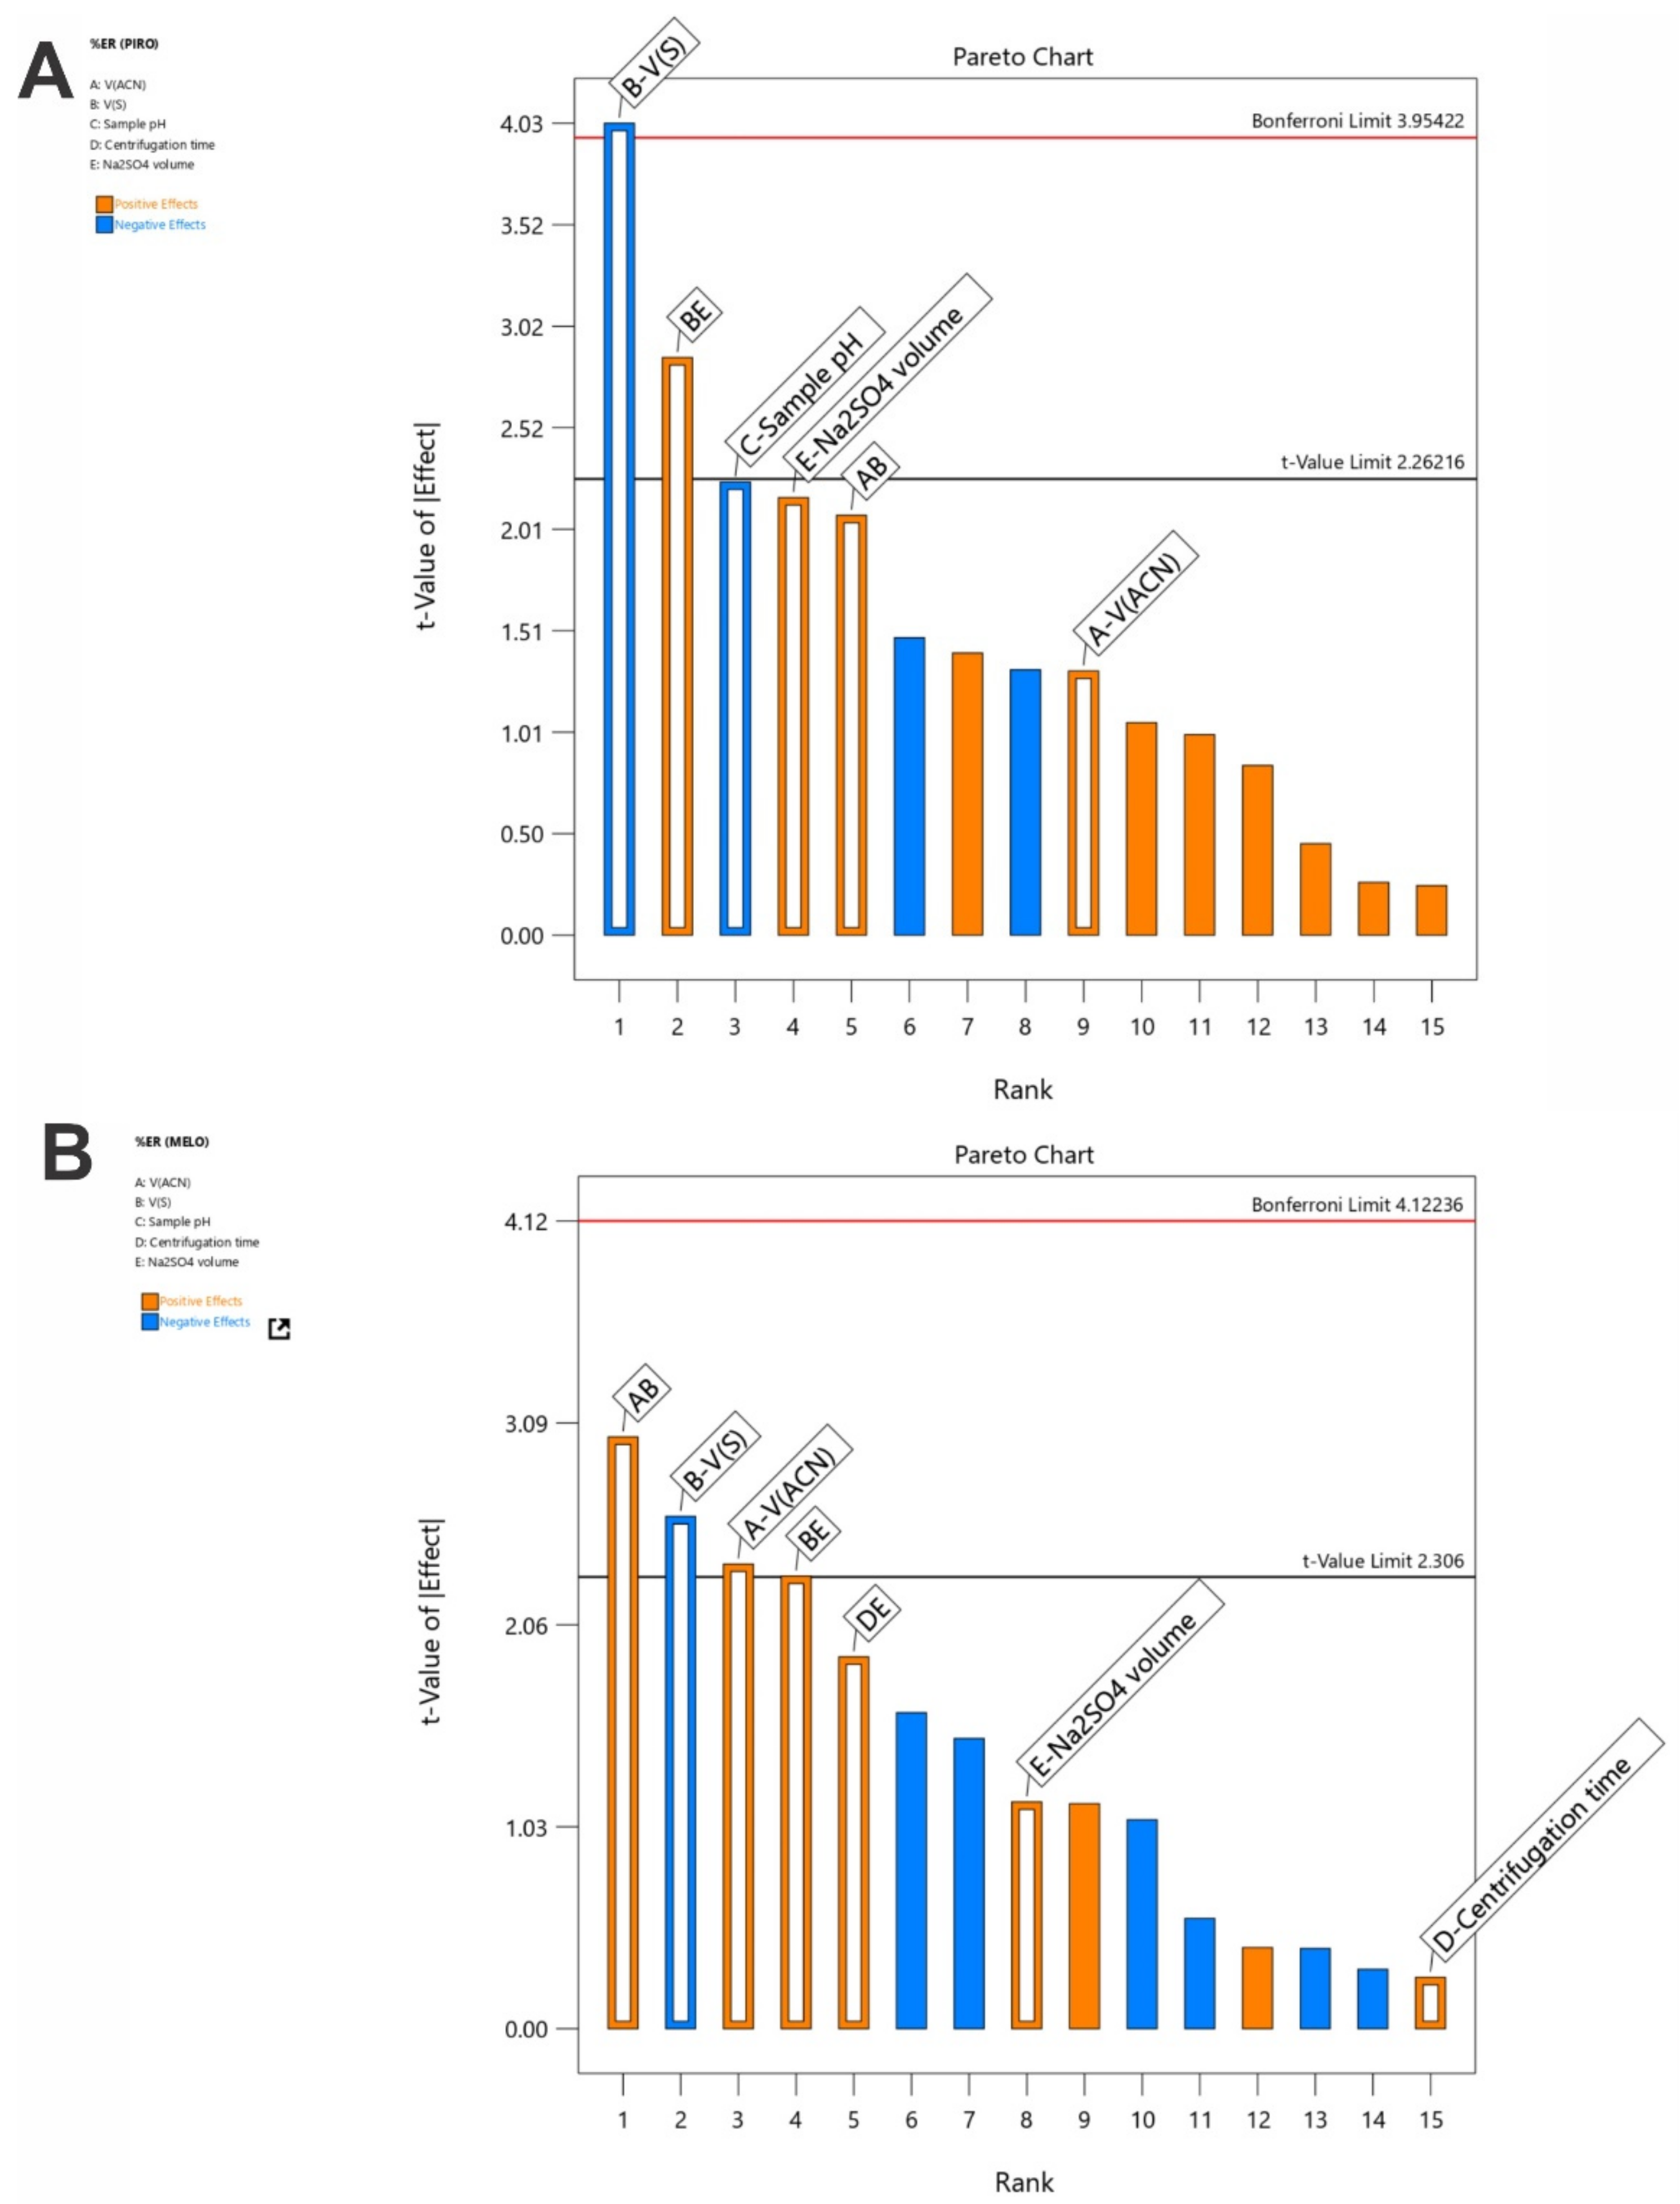
3.2. Examination of the SI-HLLME Parameters Using 2-Level FFD

Initially, a fractional factorial design (FFD) was constructed to find the significant parameters affecting the extraction efficiency. Five experimental parameters were investigated including the sample pH, the sample volume (VS), the acetonitrile volume (VACN), the centrifugation time and the volume (Vsalt) of the salt solution. In order to ensure phase separation at each experimental run of the domain, a concentration of 2.5 mol L−1 sodium sulfate was used. Table 1 summarizes the evaluated parameters, their respective levels and the experimental sequence. A random order of the experiments was used to reduce potential errors. During the screening of the SI-HLLME parameters, the extraction recoveries (ER%) of the analytes were calculated. The calculation of the ER% values is described in the Supplementary Material. Figure 1 shows the effects of the examined parameters after multivariate regression analysis (Pareto ranking plots).
In these charts, the bar length is proportional to the absolute value of the estimated standardized effects and the black line (vertical line) is used for the judgment of the statistical significance at a confidence level of 95%. As shown in Figure 1, the volume of the sample (VS) was found to be statistically significant (p < 0.05), exhibiting negative effects on the ER% of both analytes. This mean that the increase in VS led to a decrease in the extraction recoveries. Oppositely, the volume of acetonitrile (VACN) had a positive effect on the ER% of meloxicam, meaning that the extraction efficiency improved at elevated acetonitrile volumes. In both cases, the interactions of factors A, B and E were statistically significant, and these parameters were further investigated using response surface methodology (RSM). The sample pH and the centrifugation time were found to be non-significant (p > 0.05) within the studied ranges. In order to avoid the pH adjustment of the urine samples before the extraction, the pH value of 6 was finally chosen. The centrifugation time was set to 1 min to accelerate the sample throughput.

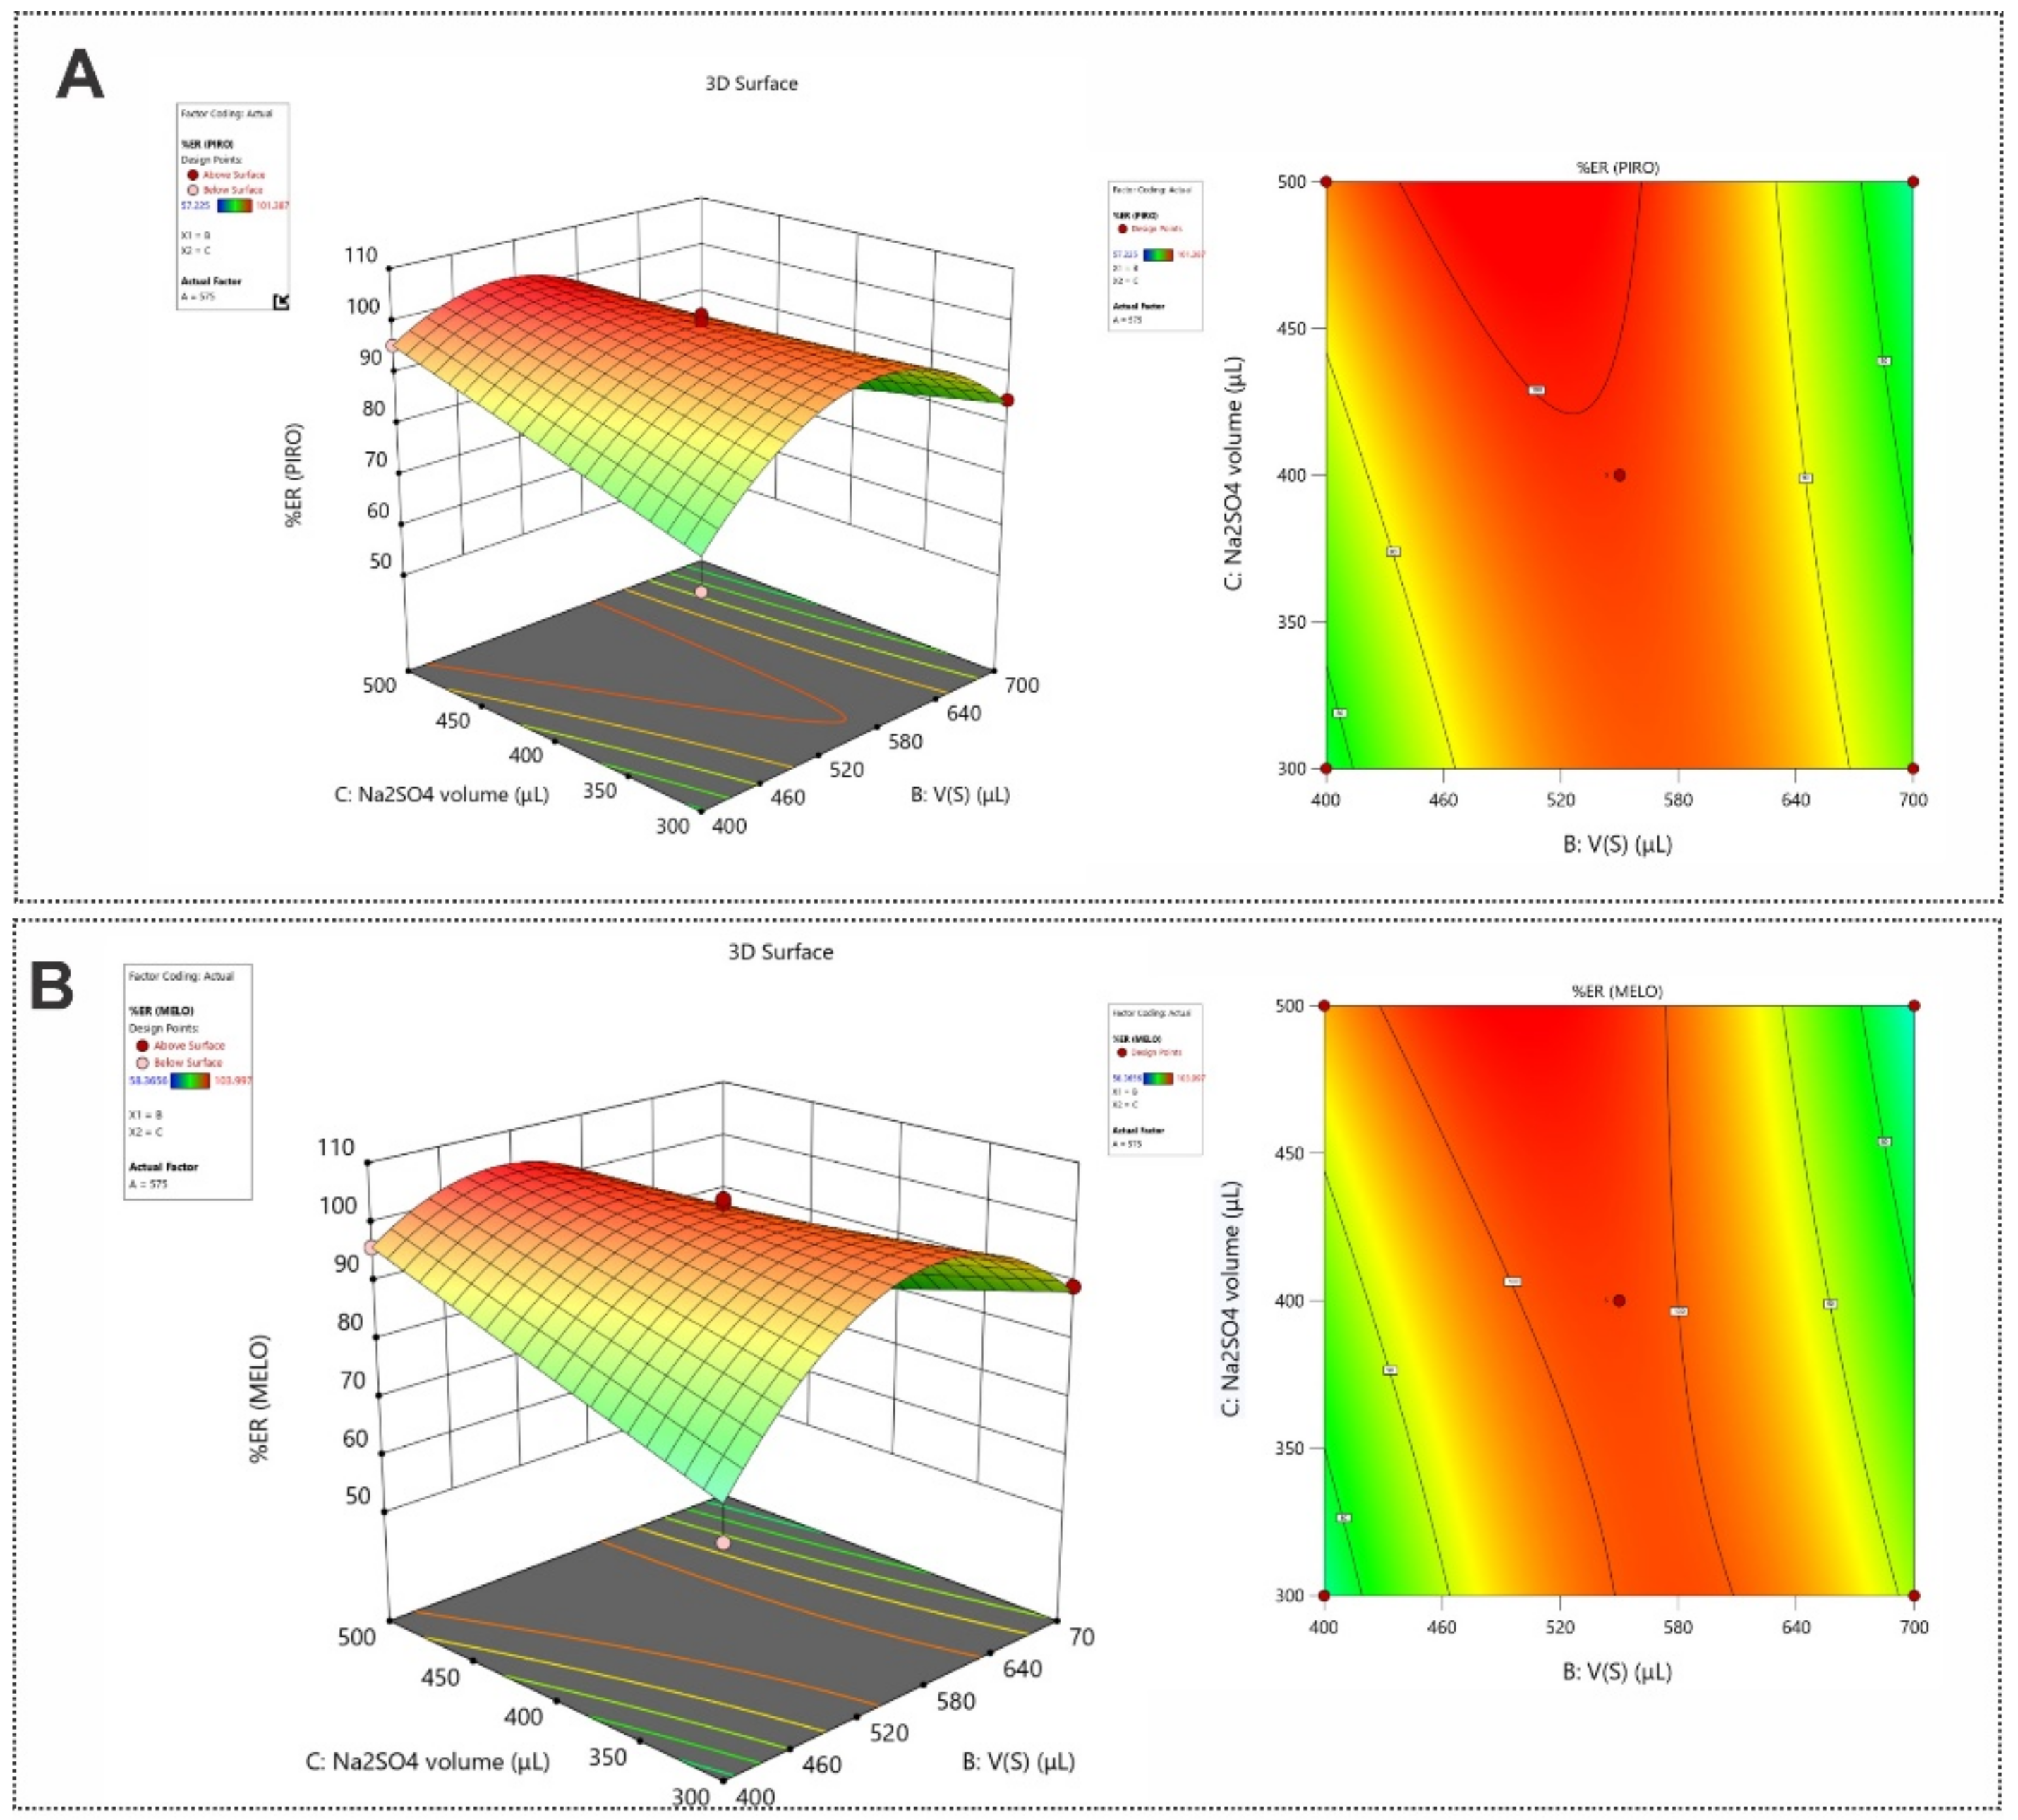
3.3. Optimization of the SI-HLLME Parameters Using Box–Behnken Design

In order to optimize the three parameters (VS, VACN, Vsalt) selected by the 2-level FFD, an RSM consisting of a Box–Behnken design (BBD) was further utilized due to its widespread application for the optimization of sample preparation [32]. A total of 17 experimental runs were performed and each parameter was examined at three levels (−1, 0, +1). The experiments were randomized to avoid systematic error. The examined parameters, their respective levels and the matrix of the BBD are shown in Table 2. Multivariate regression analysis was used to construct a fitted second-order polynomial quadratic model, as follows
y X 1 i 3 = β ο + i = 1 3 β i X i + i = 1 3 β i i X i 2 + 1 3 j = 1 i 1 β i j X i X j + ε
where the experimental response is indicated by y(X1≤i≤3), the factor is indicated by Xi, the constant is indicated by βο, the linear coefficients are indicated by βi, the quadratic coefficients are indicated by βii and βij and the random error is indicated by ε. Augmentation of the design was proposed for both analytes since high-order models were aliased.
For the statistical analysis and the experimental designs, the Design-Expert® 13 software (Stat-Ease Inc, Minneapolis, MN, USA) was utilized. The estimates of the coefficients for the models were calculated using least squares multi-linear regression and analysis of variance (ANOVA) was used for model validation (Tables S1 and S2, Supplementary Material). In order to obtain a more “realistic” model, exclusion of the non-significant factors (p > 0.05) was performed by means of the “backward elimination” process.
The calculated R2 and the adjusted R2 were estimated to be 0.9033 and 0.8452 for PIR and 0.9149 and 0.8638 for MEL, respectively, showing that the resulted models adequately explain the response. The validity of the models was assessed through the examination of the plot of the residuals in comparison with the predicted values and the normal probability plot of residuals. As can be observed from Figures S2 and S3 (Supplementary Material), proper model fitting was indicated as revealed by the random scattering of the data around the line. Good correlation among the predicted and the actual responses was achieved, as can be observed from the monotonous scattering of data around the line. The 3D response surface and contour plots for both analytes are illustrated in Figure 2. As can be seen, the maximum extraction performance of both compounds was achieved at a moderate volume of samples and higher volumes of sodium sulfate solution.
Derringer’s desirability function (D) was used to find the optimum conditions for the SI-HLLME procedure. The desirability graphs and the prediction profiles are shown in Figure 3. The optimum values of VACN, VS and Vsalt were estimated to be 598, 505 and 485 μL, respectively. For simplicity, the above values were rounded off to 600, 500 and 480 μL and adopted. The confirmation of this set of experimental conditions was conducted by performing six repetitive extractions. The variations between the experimental and the predicted values were <5%, which is considered satisfactory.

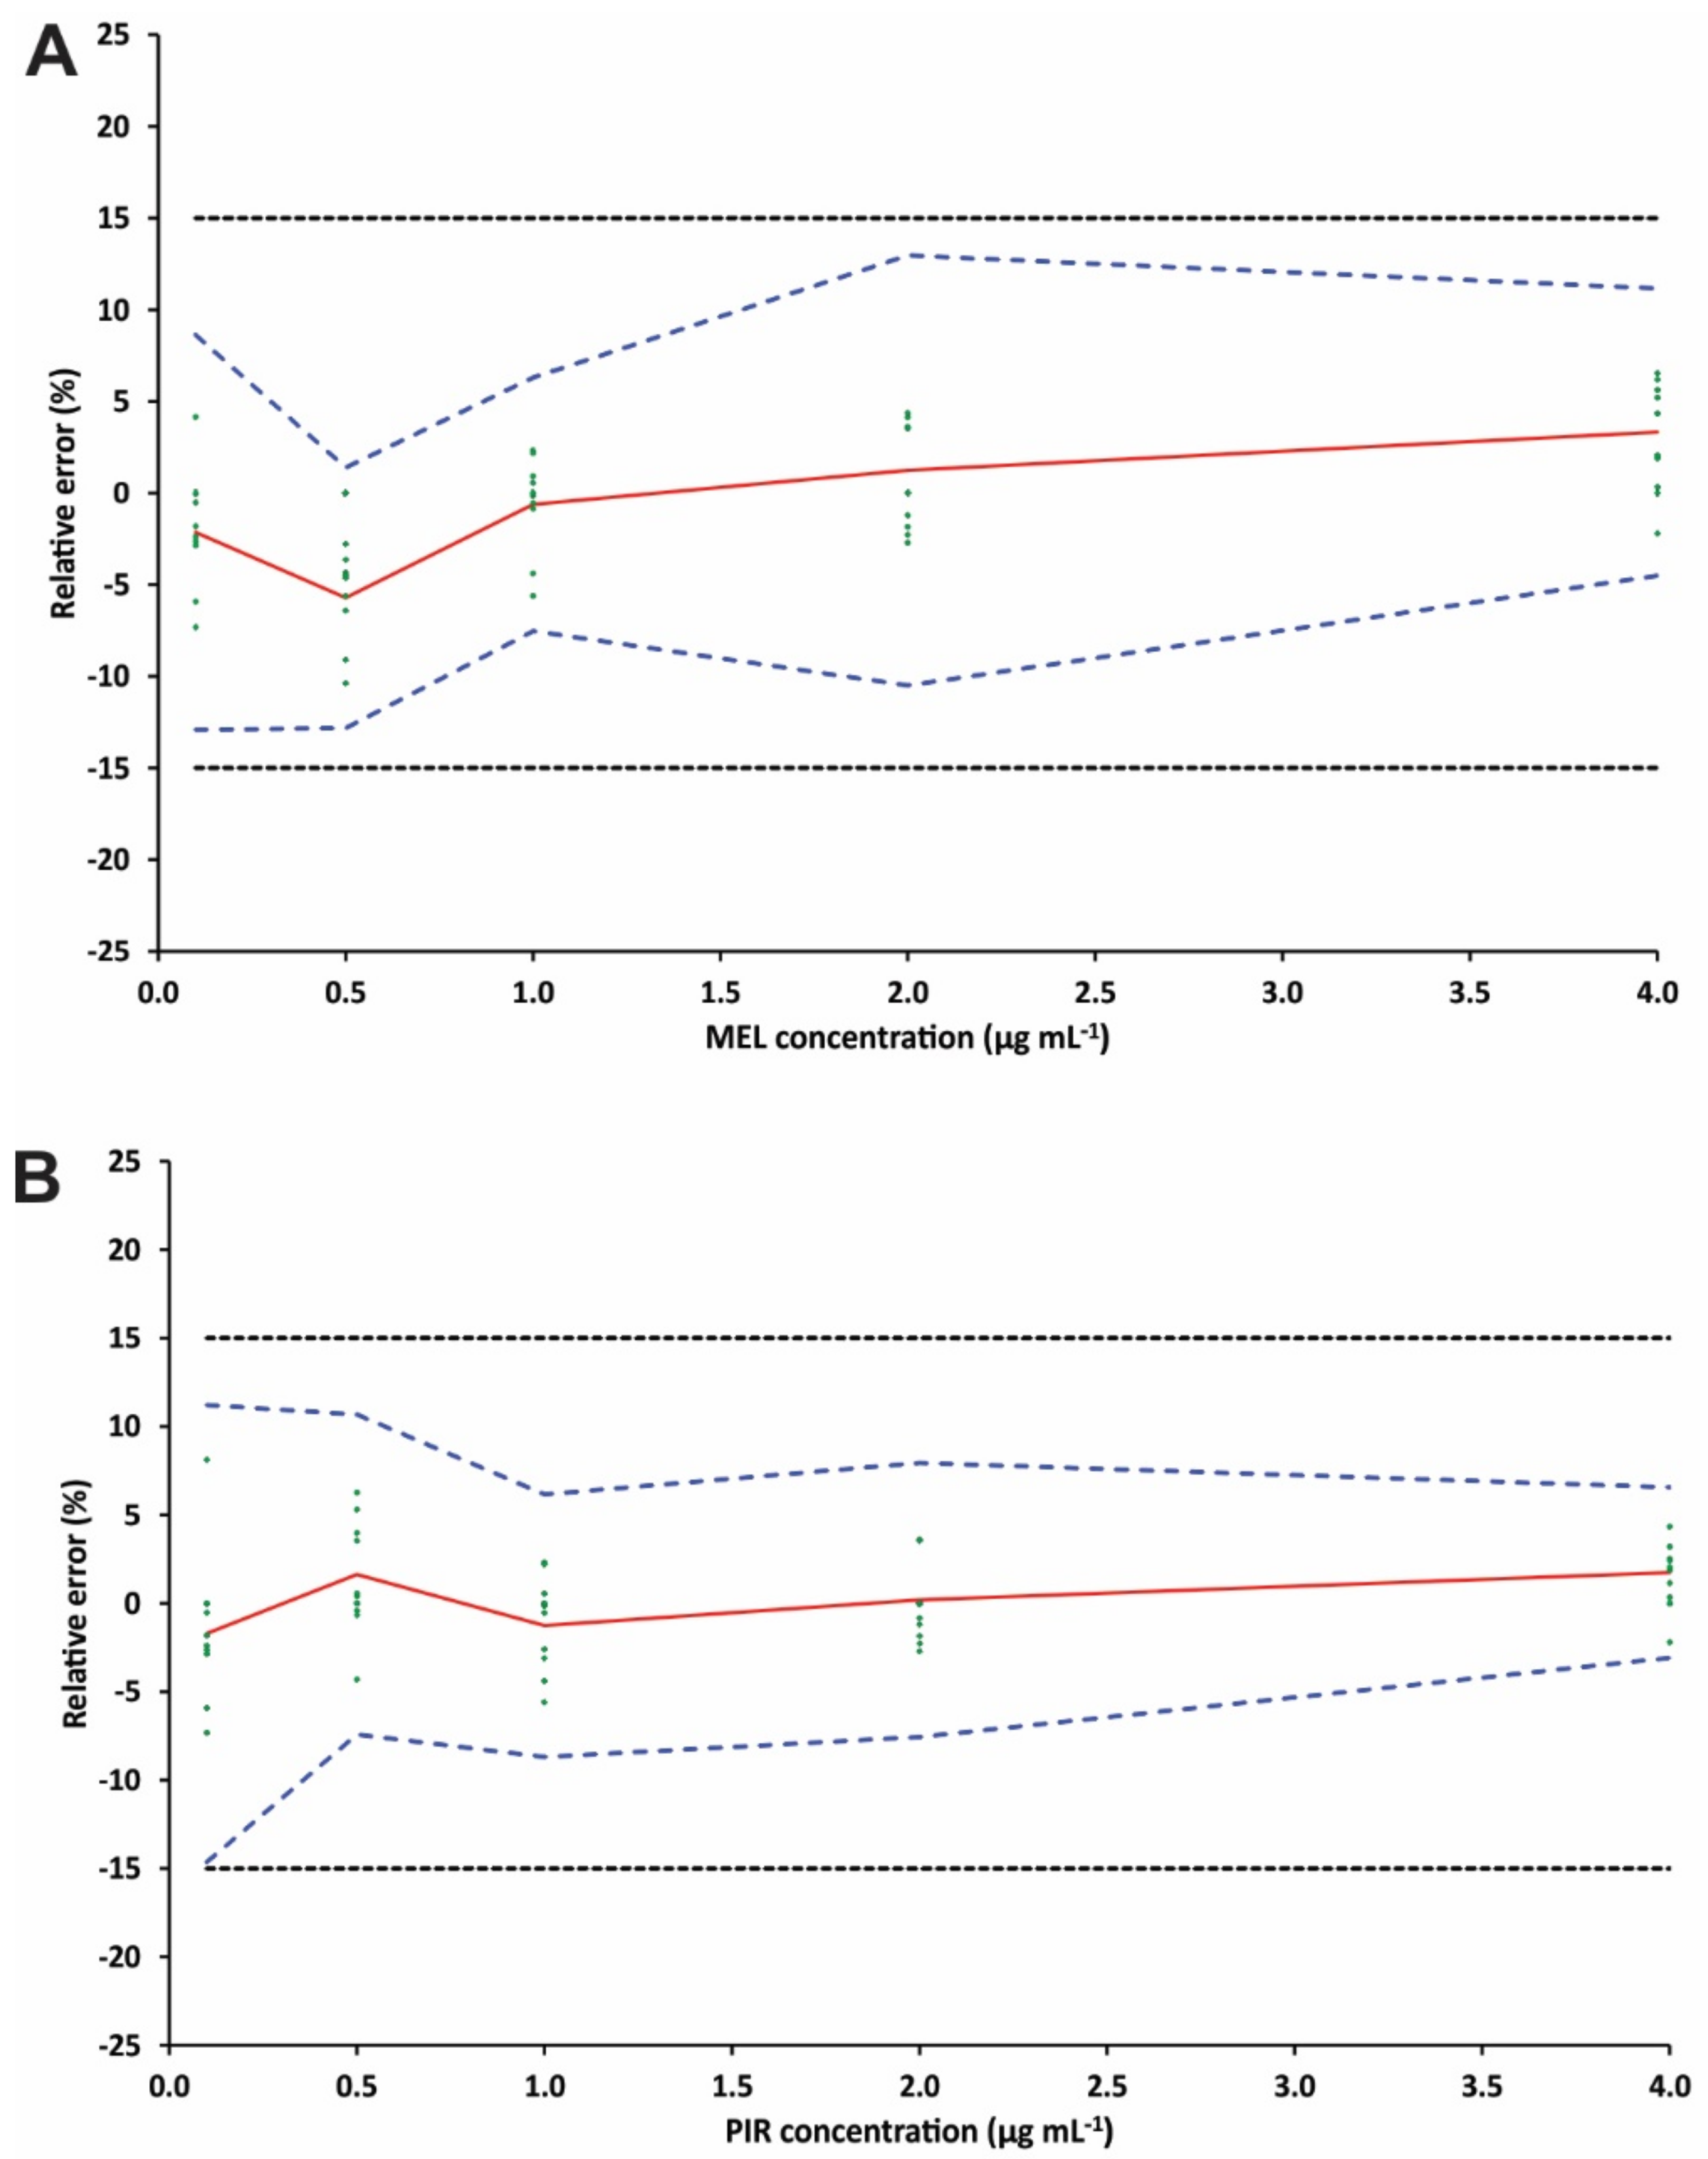
3.4. Method Validation

Validation of the proposed SI-HLLME protocol was conducted by constructing accuracy profiles. The theory behind this concept is described in the Supplementary Material. In brief, the dashed blue lines are representative of the β-expectation tolerance limits (95% probability level) and the red lines are representative of the relative bias. When former lines fall inside the black dotted lines that correspond to a 15% acceptance limit, the proposed bioanalytical method is considered to be valid [33].
Calibration curves were prepared in triplicate (n = 3) for each experiment series (k = 3) using mixture standards at the following concentrations (n = 5): 0.1, 0.5, 1.0, 2.0 and 4.0 μg mL−1. These standards were in three series made using pooled blank urine samples and by spiking them with the appropriate quantity of MEL and PIR and ISTD. Table 3 and Table S3 (Supplementary Materials) summarize the validation results for PIR and MEL, respectively.
Six drug-free human urine samples (n = 6) were used in equal volumes to prepare a pooled blank sample for the assessment of the method’s selectivity. Figure 4 shows overlaid representative chromatograms of human urine samples spiked with ISTD only and ISTD and MEL and PIR, respectively. As can be observed, no interfering peaks were found within the region of elution of the target analytes and the ISTD, confirming the selectivity of the herein proposed SI-HLLME method.
Subsequently, the linearity of the SI-HLLME methodology was studied through the selection of the response function that is the most appropriate. This study aimed to minimize the risk of undesired errors that might occur in the future. The following regression models were investigated: weighted (1/X) and weighted (1/X2) linear regression, and simple unweighted. The respective models were constructed by plotting the peak area ratio of each analyte versus the ISTD peak area. The upper and the lower β-ETI for each regression model were calculated using the back-calculated concentrations, as well as the intermediate precision (sR%) and the mean relative bias. As illustrated in Figure 5, the unweighted linear regression models fitting profiles for both, resulted in results’ scattering that for all levels fell within the acceptance limits. To ensure simplicity and high method performance in terms of precision and trueness, the unweighted linear regression model was chosen for both analytes. Since the absolute β-ETI fell within the absolute acceptance limits (Figure S4), the linearity of the proposed method was confirmed. Regarding the calculation of the LOD and the lower LOQ (LLOQ) of MEL and PIR the signal-to-noise ratio criteria (S/N) of 3 and 10 were used, respectively. The LODs were estimated to be 0.02 and 0.03 μg mL−1 for PIR and MEL, respectively, and the LLOQ was estimated to be 0.1 μg mL−1 for both drugs.
The herein developed SI-HLLME protocol exhibited good method trueness since the relative biases for MEL ranged between −1.7 and 1.7% and for PIR between −5.7 and 3.4%. Moreover, sufficient method precision was achieved for the examined concentration levels. Specifically, the method precision (sr, %) was better than 3.9% and the time-dependent intermediate precision (sR, %) was better than 4.4% in all cases. Finally, the lower and upper β-ETIs were within the acceptance limits of ±15%, demonstrating good method accuracy for the selected drugs within the examined concentration range.

3.5. Stability Studies

The stability of the studied drugs in human urine was investigated by storing unprocessed samples at 25 °C for up to 12 h and at 4 °C for up to 24 h. The experiments indicated that the analytes and the ISTD were stable at these storage conditions. The % relative recoveries of PIR and MEL ranged between the lower and the upper specification limit of the method accuracy (±15%).

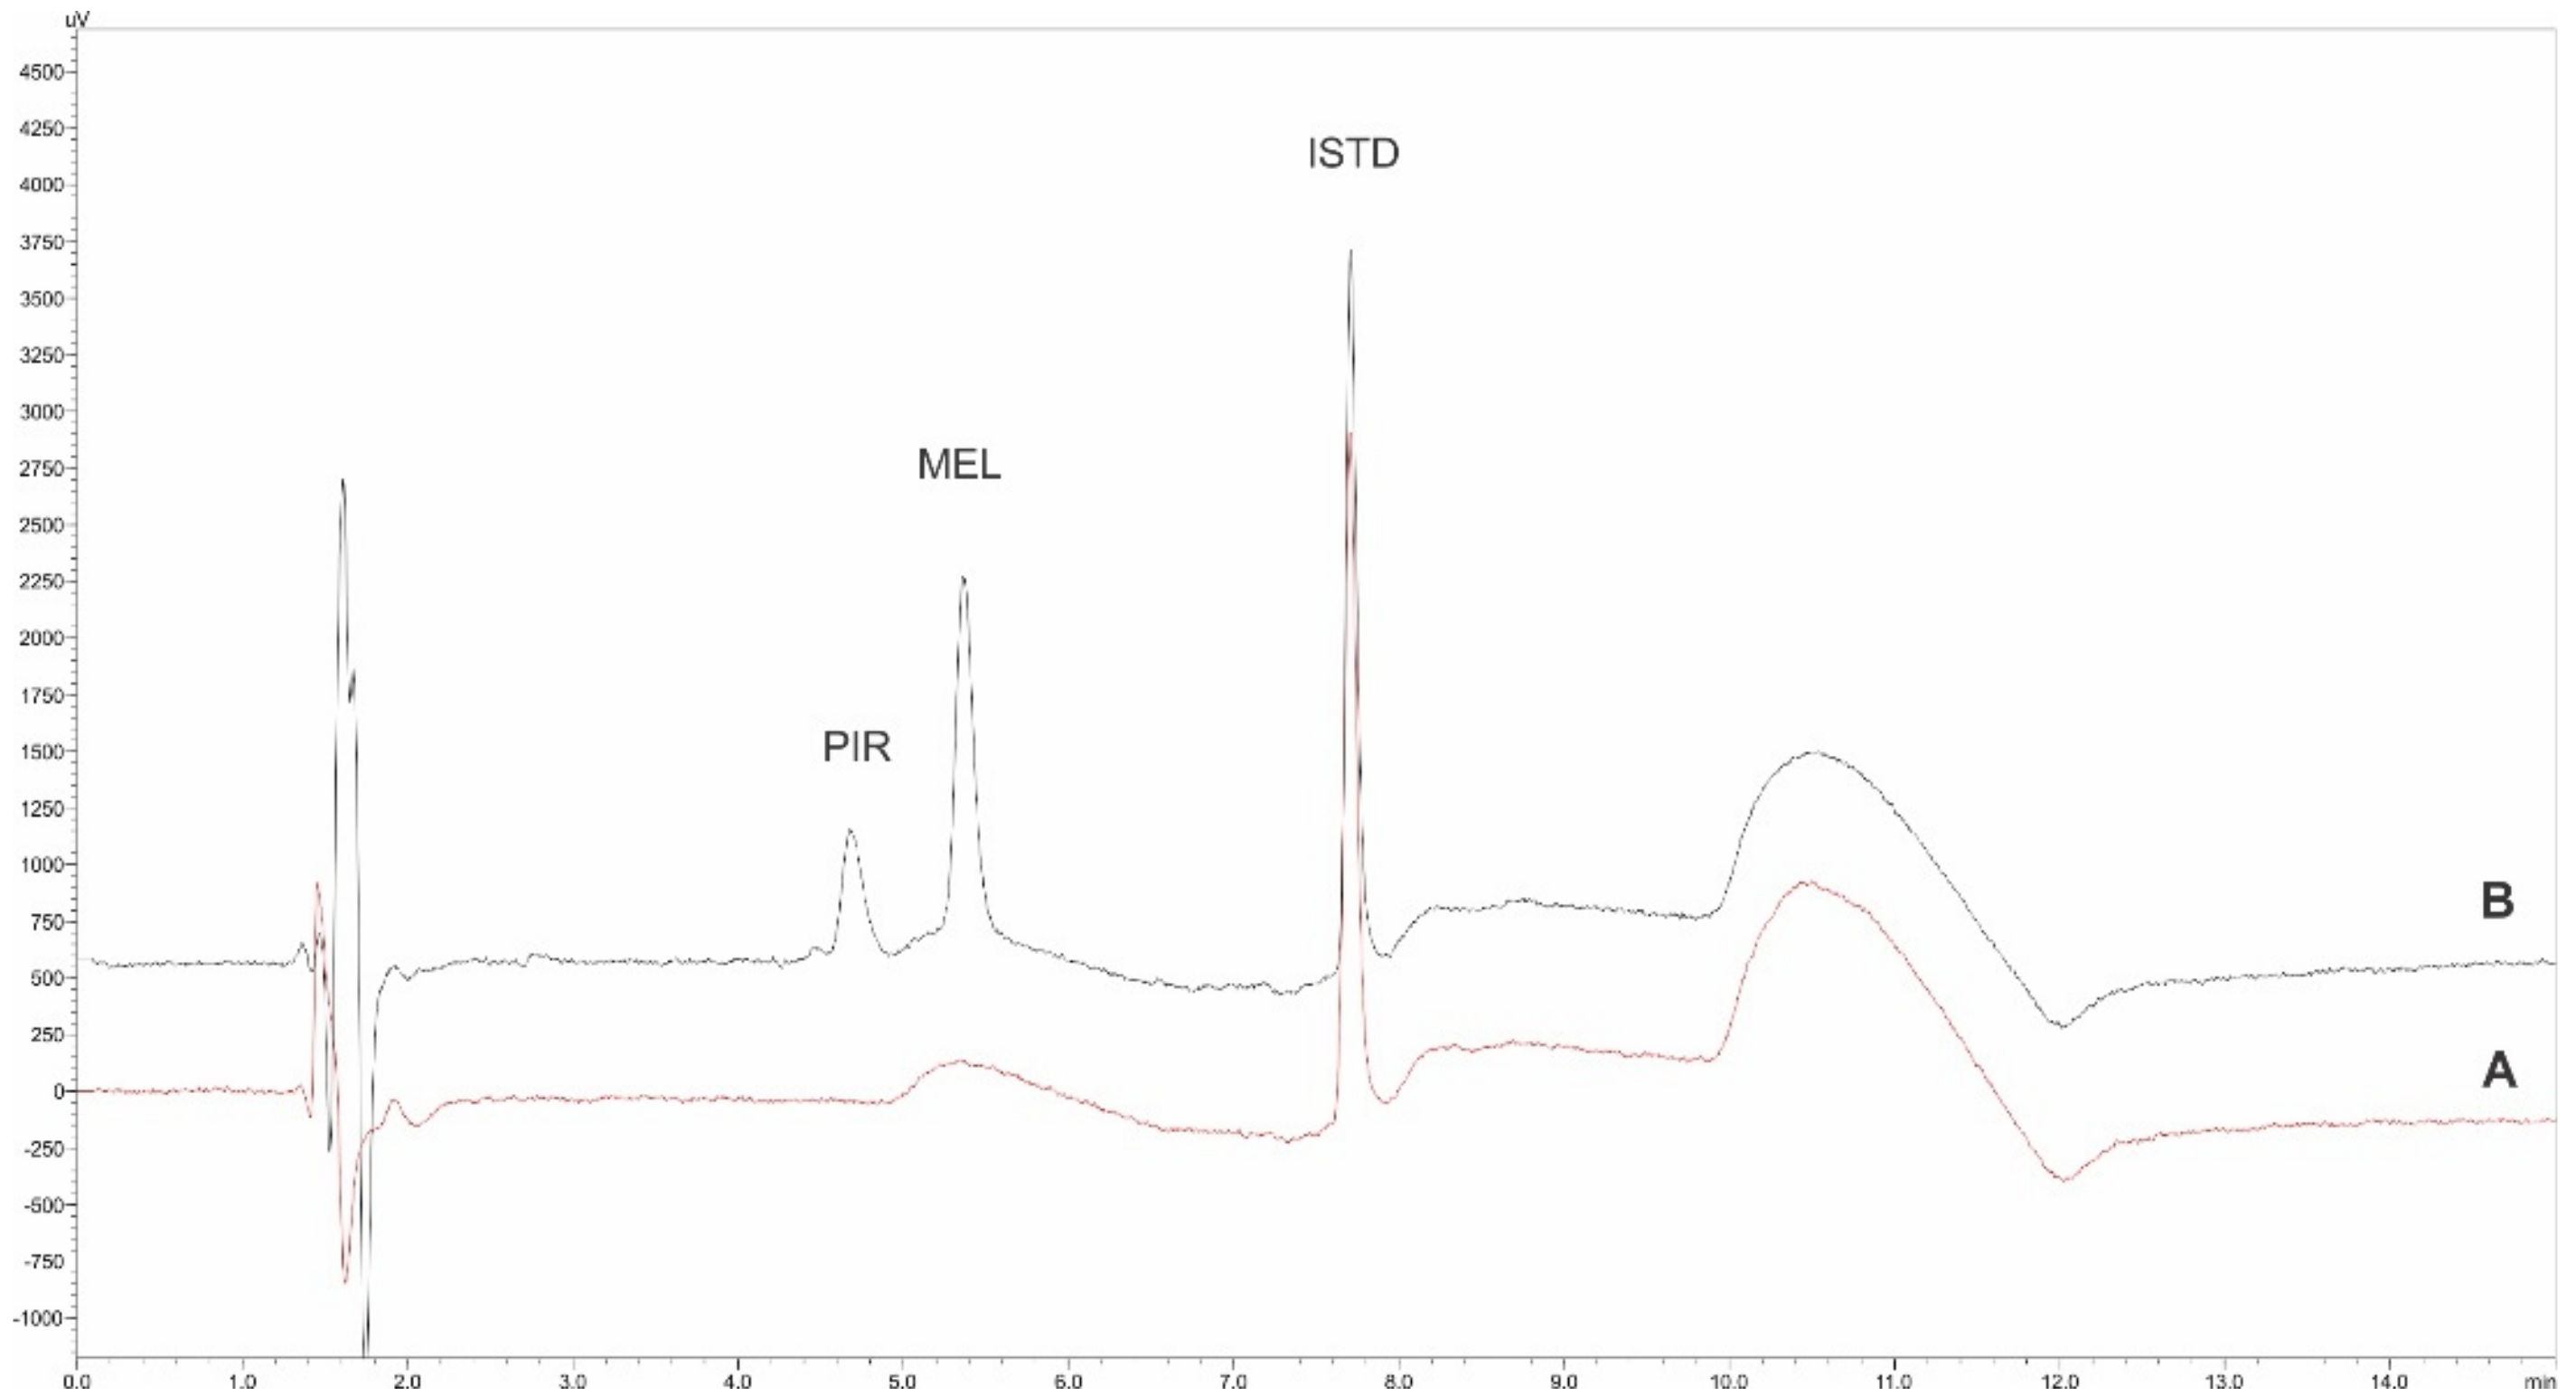
3.6. Application to Real Urine Analysis

The applicability of the validated method was further assessed by analyzing spiked real urine samples at different concentration levels in the range of 0.1–4 μg mL−1. For all spiked levels, the average recoveries were 87.3–114.9% and the RSD% was lower than 8.9%, demonstrating the absence of matrix effects due to the good recovery of the target analytes. All things considered, the herein developed SI-HLLME protocol can be successfully used for the quantitative determination of the target analytes.

3.7. Comparison of the Proposed Method with Other Studies

The proposed SI-HLLME sample preparation protocol was compared with other novel extraction approaches used for the monitoring of PIR and MEL. Table 4 summarizes the results of the comparative study.
As can be observed, the proposed method exhibited comparable LOD values to References [34,37], lower LOD values compared to Reference [2] but higher LOD values compared to References [35,36]. Moreover, the proposed protocol exhibited good accuracy. The relative recovery values of this study were better than those of References [35,36] and comparable to the values of the other studies. The RSD% values of this study can also be considered satisfactory in comparison with those obtained in the other studies. Apart from the satisfactory figures of merit, the proposed protocol is characterized by the inherent benefits of the SI-HLLME including the simplicity of the process, the rapid analyte extraction and the possibility to perform parallel handling of a high number of samples resulting in increased sample throughput. These advantages are of utmost importance for routine laboratories working in the field of bioanalysis.

3.8. Investigation of the Green Potential of the Developed SI-HLLME-HPLC-DAD Protocol

The green potential of the proposed SI-HLLME sample preparation protocol combined with HPLC-DAD analysis was evaluated using the GAPI index [38]. This tool is used for the evaluation of the reagents, the procedures and the instrumentation of an analytical procedure by taking into consideration different factors including the energy requirements, the type and amount of waste, and the chemical and environmental hazards of the chemicals [39]. Figure 6 shows a pictorial illustration of the GAPI pictogram for the herein developed SI-HLLME-HPLC-DAD method. Each part of the different pentagrams shows the impact of different criteria, while the color scale ranges between green, yellow or red showing low, medium and high environmental impact, respectively. Among the green aspects of the proposed protocol lie the low operational hazards, the absence of requirement for chemical or physical sample preservation, the possibility to store the samples under normal conditions and the absence of a requirement for other sample pretreatment steps. Moreover, microextraction is used, which results in relatively low consumption of hazardous organic solvents. Future directions for the reduction in the environmental impact of the herein developed methodology include the replacement of the organic solvents with deep eutectic and natural deep eutectic solvents [40] that are considered to be “greener” alternatives and the replacement of HPLC with ultra-high-performance liquid chromatography (UHPLC) that efficiently minimizes solvent consumption [41].

4. Conclusions

In the proposed work, a rapid, simple and green SI-HLLME methodology based on the utilization of a hydrophilic organic solvent under high salinity conditions was reported for the extraction of MEL and PIR from urine samples prior to their determination by HPLC. For the extraction procedure, a small quantity of organic solvent was required in accordance with the principles of GAC. Two-level fractional factorial design and BBD experimental designs were utilized to find the optimum extraction conditions to achieve high method sensitivity. Accuracy profiles were employed to carry out method validation and the trueness, precision, accuracy, linearity and sensitivity of the SI-HLLME method were examined. Under optimum conditions, satisfactory figures of merit were observed. Finally, the proposed method was successfully employed for determining the target analytes in real urine samples. It can be concluded that the herein developed analytical scheme can serve as a good alternative to conventional protocols used in routine bioanalytical applications.

Supplementary Materials

The following supporting information can be downloaded at: https://www.mdpi.com/article/10.3390/app12136658/s1, Figure S1: Chemical structure of meloxicam (MEL), piroxicam (PIR) and the nimesulide (ISTD); Figure S2: Normal probability plots for the ER% of (A) PIR and (B) MEL; Figure S3: Residuals vs. predicted plots of (A) PIR and (B) MEL; Figure S4: Linearity profile of (A) MEL and (B) PIR. The plain blank line corresponds to the identity line (Y = X), the blue dashed line represents the accuracy profile (β-ΕΤΙ) and the dotted curves illustrate the acceptance limits λ ± 15% expressed in μg mL−1; Table S1: Analysis of variance (ANOVA) for BBD for ER% of MEL; Table S2: Analysis of variance (ANOVA) for BBD for ER% of PIR; Table S3: Validation results for the determination of MEL in human urine. Reference [42] is cited in the supplementary materials.

Author Contributions

Conceptualization, C.K.Z.; methodology, N.M. and C.K.Z.; software, C.K.Z.; validation, N.M. and S.V.T.; formal analysis, N.M. and S.V.T.; investigation, N.M.; resources, C.K.Z.; data curation, N.M.; writing—original draft preparation, N.M.; writing—review and editing, C.K.Z.; visualization, C.K.Z.; supervision, C.K.Z.; project administration, C.K.Z. All authors have read and agreed to the published version of the manuscript.

Funding

This research received no external funding.

Institutional Review Board Statement

Not applicable.

Informed Consent Statement

Not applicable.

Data Availability Statement

Not applicable.

Conflicts of Interest

The authors declare no conflict of interest.

References

  1. Cox, S.; Hayes, J.; Yarbrough, J.; Veiga-Parga, T.; Greenacre, C. High-Performance Liquid Chromatography Determination of Meloxicam and Piroxicam with Ultraviolet Detection. Chromatogr. Res. Int. 2014, 2014, 1–7. [Google Scholar] [CrossRef]
  2. Tabrizi, A.B.; Tutunchi, N.S. Analysis of piroxicam in pharmaceutical formulation and human urine by dispersive liquid-liquid microextraction combined with spectrophotometry. Adv. Pharm. Bull. 2013, 3, 37–44. [Google Scholar]
  3. Xu, S.; Rouzer, C.A.; Marnett, L.J. Oxicams, a class of nonsteroidal anti-inflammatory drugs and beyond. IUBMB Life 2014, 66, 803–811. [Google Scholar] [CrossRef] [PubMed]
  4. Bae, J.W.; Kim, M.J.; Jang, C.G.; Lee, S.Y. Determination of meloxicam in human plasma using a HPLC method with UV detection and its application to a pharmacokinetic study. J. Chromatogr. B Anal. Technol. Biomed. Life Sci. 2007, 859, 69–73. [Google Scholar] [CrossRef]
  5. Milligan, P.A. Determination of piroxicam and its major metabolites in the plasma, urine and bile of humans by high-performance liquid chromatography. J. Chromatogr. B Biomed. Sci. Appl. 1992, 576, 121–128. [Google Scholar] [CrossRef]
  6. Martinez-Sena, T.; Armenta, S.; de la Guardia, M.; Esteve-Turrillas, F.A. Determination of non-steroidal anti-inflammatory drugs in water and urine using selective molecular imprinted polymer extraction and liquid chromatography. J. Pharm. Biomed. Anal. 2016, 131, 48–53. [Google Scholar] [CrossRef]
  7. Andruch, V.; Varfalvyová, A.; Halko, R.; Jatkowska, N.; Płotka-Wasylka, J. Application of deep eutectic solvents in bioanalysis. TrAC Trends Anal. Chem. 2022, 154, 116660. [Google Scholar] [CrossRef]
  8. Martin, P.D.; Jones, G.R.; Stringer, F.; Wilson, I.D. Comparison of extraction of a β-blocker from plasma onto a molecularly imprinted polymer with liquid-liquid extraction and solid phase extraction methods. J. Pharm. Biomed. Anal. 2004, 35, 1231–1239. [Google Scholar] [CrossRef]
  9. Câmara, J.S.; Perestrelo, R.; Berenguer, C.V.; Andrade, C.F.P.; Gomes, T.M.; Olayanju, B.; Kabir, A.; Rocha, C.M.R.; Teixeira, J.A.; Pereira, J.A.M. Green Extraction Techniques as Advanced Sample Preparation Approaches in Biological, Food, and Environmental Matrices: A Review. Molecules 2022, 27, 2953. [Google Scholar] [CrossRef]
  10. Armenta, S.; Garrigues, S.; de la Guardia, M. Green Analytical Chemistry. TrAC-Trends Anal. Chem. 2008, 27, 497–511. [Google Scholar] [CrossRef]
  11. Queiroz, M.E.C.; de Souza, I.D.; de Oliveira, I.G.; Grecco, C.F. In vivo solid phase microextraction for bioanalysis. TrAC Trends Anal. Chem. 2022, 153, 116656. [Google Scholar] [CrossRef]
  12. Rigkos, G.; Alampanos, V.; Kabir, A.; Furton, K.G.; Roje, Ž.; Vrček, I.V.; Panderi, I.; Samanidou, V. An improved fabric-phase sorptive extraction protocol for the determination of seven parabens in human urine by HPLC–DAD. Biomed. Chromatogr. 2021, 35, e4974. [Google Scholar] [CrossRef] [PubMed]
  13. Manousi, N.; Kabir, A.; Furton, K.G.; Samanidou, V.F.; Zacharis, C.K. Exploiting the capsule phase microextraction features in bioanalysis: Extraction of ibuprofen from urine samples. Microchem. J. 2021, 172, 106934. [Google Scholar] [CrossRef]
  14. Giakisikli, G.; Anthemidis, A.N. Magnetic materials as sorbents for metal/metalloid preconcentration and/or separation. A review. Anal. Chim. Acta 2013, 789, 1–16. [Google Scholar] [CrossRef] [PubMed]
  15. He, M.; Wang, Y.; Zhang, Q.; Zang, L.; Chen, B.; Hu, B. Stir bar sorptive extraction and its application. J. Chromatogr. A 2021, 1637, 461810. [Google Scholar] [CrossRef]
  16. Turoňová, D.; Kujovská Krčmová, L.; Švec, F. Application of microextraction in pipette tips in clinical and forensic toxicology. TrAC Trends Anal. Chem. 2021, 143, 116404. [Google Scholar] [CrossRef]
  17. Mansour, F.R.; Khairy, M.A. Pharmaceutical and biomedical applications of dispersive liquid–liquid microextraction. J. Chromatogr. B Anal. Technol. Biomed. Life Sci. 2017, 1061, 382–391. [Google Scholar] [CrossRef]
  18. Pedersen-Bjergaard, S.; Huang, C.; Gjelstad, A. Electromembrane extraction–Recent trends and where to go. J. Pharm. Anal. 2017, 7, 141–147. [Google Scholar] [CrossRef]
  19. Manousi, N.; Vlachaki, A.; Kika, F.S.; Markopoulou, C.K.; Tzanavaras, P.D.; Zacharis, C.K. Salting-out homogeneous liquid-liquid microextraction for the determination of azole drugs in human urine: Validation using total error concept. J. Sep. Sci. 2022, 45, 1240–1251. [Google Scholar] [CrossRef]
  20. Li, N.; Zhang, T.; Chen, G.; Xu, J.; Ouyang, G.; Zhu, F. Recent advances in sample preparation techniques for quantitative detection of pharmaceuticals in biological samples. TrAC Trends Anal. Chem. 2021, 142, 116318. [Google Scholar] [CrossRef]
  21. Dmitrienko, S.G.; Apyari, V.V.; Gorbunova, M.V.; Tolmacheva, V.V.; Zolotov, Y.A. Homogeneous Liquid–Liquid Microextraction of Organic Compounds. J. Anal. Chem. 2020, 75, 1371–1383. [Google Scholar] [CrossRef]
  22. Zacharis, C.K. Extraction In Aqueous Two-Phase Extraction; Worsfold, P., Poole, C., Townshend, A., Miró, M.B.T.-E., Third, E., Eds.; Academic Press: Oxford, UK, 2019; pp. 47–51. ISBN 978-0-08-101984-9. [Google Scholar]
  23. Hammad, S.F.; Abdallah, I.A.; Bedair, A.; Mansour, F.R. Homogeneous liquid–liquid extraction as an alternative sample preparation technique for biomedical analysis. J. Sep. Sci. 2021, 45, 1–25. [Google Scholar] [CrossRef] [PubMed]
  24. Pasupuleti, R.R.; Gurrani, S.; Tsai, P.-C.; Ponnusamy, V.K. Novel Salt-Assisted Liquid-Liquid Microextraction Technique for Environmental, Food, and Biological Samples Analysis Applications: A Review. Curr. Anal. Chem. 2022, 18, 577–587. [Google Scholar] [CrossRef]
  25. Zhu, Z.; Zhang, Y.; Wang, J.; Li, X.; Wang, W.; Huang, Z. Sugaring-out assisted liquid-liquid extraction coupled with high performance liquid chromatography-electrochemical detection for the determination of 17 phenolic compounds in honey. J. Chromatogr. A 2019, 1601, 104–114. [Google Scholar] [CrossRef] [PubMed]
  26. Akramipour, R.; Fattahi, N.; Pirsaheb, M.; Gheini, S. Combination of counter current salting-out homogenous liquid-liquid extraction and dispersive liquid-liquid microextraction as a novel microextraction of drugs in urine samples. J. Chromatogr. B Anal. Technol. Biomed. Life Sci. 2016, 1012, 162–168. [Google Scholar] [CrossRef]
  27. Tsanaktsidou, E.; Markopoulou, C.K.; Tzanavaras, P.D.; Zacharis, C.K. Homogeneous liquid phase microextraction using hydrophilic media for the determination of fluoroquinolones in human urine using HPLC-FLD. Microchem. J. 2022, 172, 106906. [Google Scholar] [CrossRef]
  28. Feriduni, B.; Farajzadeh, M.A.; Jouyban, A. Determination of two antiepileptic drugs in urine by homogenous liquid-liquid extraction performed in a narrow tube combined with dispersive liquid-liquid microextraction followed by gas chromatography-flame ionization detection. Iran. J. Pharm. Res. 2019, 18, 620–630. [Google Scholar]
  29. Sorouraddin, S.M.; Farajzadeh, M.A.; Hassanyani, A.; Afshar Mogaddam, M.R. Combination of homogenous liquid-liquid extraction and dispersive liquid-liquid microextraction for extraction and preconcentration of amantadine from biological samples followed by its indirect determination by flame atomic absorption spectrometry. RSC Adv. 2016, 6, 108603–108610. [Google Scholar] [CrossRef]
  30. López-Lorente, Á.I.; Pena-Pereira, F.; Pedersen-Bjergaard, S.; Zuin, V.G.; Ozkan, S.A.; Psillakis, E. The ten principles of green sample preparation. TrAC-Trends Anal. Chem. 2022, 148, 11653. [Google Scholar] [CrossRef]
  31. Brooks, T.; Keevil, C.W. A simple artificial urine for the growth of urinary pathogens. Lett. Appl. Microbiol. 1997, 24, 203–206. [Google Scholar] [CrossRef]
  32. Ferreira, S.L.C.; Bruns, R.E.; Ferreira, H.S.; Matos, G.D.; David, J.M.; Brandão, G.C.; da Silva, E.G.P.; Portugal, L.A.; dos Reis, P.S.; Souza, A.S.; et al. Box-Behnken design: An alternative for the optimization of analytical methods. Anal. Chim. Acta 2007, 597, 179–186. [Google Scholar] [CrossRef] [PubMed]
  33. FDA. Bioanalytical Method Validation Guidance. Available online: https://www.fda.gov/regulatory-information/search-fda-guidance-documents/bioanalytical-method-validation-guidance-industry (accessed on 11 January 2022).
  34. Stege, P.W.; Lapierre, A.V.; Martinez, L.D.; Messina, G.A.; Sombra, L.L. A combination of single-drop microextraction and open tubular capillary electrochromatography with carbon nanotubes as stationary phase for the determination of low concentration of illicit drugs in horse urine. Talanta 2011, 86, 278–283. [Google Scholar] [CrossRef] [PubMed]
  35. Zeeb, M.; Farahani, H.; Mirza, B.; Papan, M.K. Quantification of Meloxicam in Human Plasma Using Ionic Liquid-Based Ultrasound-Assisted In Situ Solvent Formation Microextraction Followed by High-Performance Liquid Chromatography. J. Chromatogr. Sci. 2018, 56, 443–451. [Google Scholar] [CrossRef] [PubMed] [Green Version]
  36. Song, X.Y.; Shi, Y.P.; Chen, J. A novel extraction technique based on carbon nanotubes reinforced hollow fiber solid/liquid microextraction for the measurement of piroxicam and diclofenac combined with high performance liquid chromatography. Talanta 2012, 100, 153–161. [Google Scholar] [CrossRef] [PubMed]
  37. Zhang, H.; Choi, H.K. Analysis of meloxicam by high-performance liquid chromatography with cloud-point extraction. Anal. Bioanal. Chem. 2008, 392, 947–953. [Google Scholar] [CrossRef]
  38. Płotka-Wasylka, J. A new tool for the evaluation of the analytical procedure: Green Analytical Procedure Index. Talanta 2018, 181, 204–209. [Google Scholar] [CrossRef]
  39. Płotka-Wasylka, J.; Wojnowski, W. Complementary green analytical procedure index (ComplexGAPI) and software. Green Chem. 2021, 23, 8657–8665. [Google Scholar] [CrossRef]
  40. Plastiras, O.; Andreasidou, E.; Samanidou, V.F. Microextraction Techniques with Deep Eutectic Solvents. Molecules 2020, 25, 6026. [Google Scholar] [CrossRef]
  41. Cielecka-Piontek, J.; Zalewski, P.; Jelińska, A.; Garbacki, P. UHPLC: The greening face of liquid chromatography. Chromatographia 2013, 76, 1429–1437. [Google Scholar] [CrossRef] [Green Version]
  42. Hubert, P.; Nguyen-Huu, J.J.; Boulanger, B.; Chapuzet, E.; Chiap, P.; Cohen, N.; Compagnon, P.A.; Dewe, W.; Feinberg, M.; Lallier, M.; et al. Harmonization of strategies for the validation of quantitative analytical procedures: A SFSTP proposal—Part I. J. Pharm. Biomed. Anal. 2004, 36, 579–586. [Google Scholar] [CrossRef]
Figure 1. Pareto charts regarding the main effects of the SI-HLLME parameters for (A) piroxicam and (B) meloxicam using 2-level FFD. Orange and blue bars indicate the positive and negative effects, respectively.
Applsci 12 06658 g001
Figure 2. Three-dimensional response surface and contour plots for (A) PIR and (B) MEL determination using BBD.
Applsci 12 06658 g002
Figure 3. Contour desirability plots for PIR and MEL determination using BBD.
Applsci 12 06658 g003
Figure 4. Representative HPLC-PDA chromatograms of a sample spiked with (A) ISTD and (B) ISTD and mixture of PIR and MEL at a concentration level of 0.1 μg mL−1.
Applsci 12 06658 g004
Figure 5. Accuracy profiles for the determination of (A) MEL and (B) PIR in human urine samples using unweighted linear regression models. The relative error (%) is represented by the red plain lines, the accuracy profiles are represented by the blue dashed lines and the acceptance limits λ (±15%) are represented by the blank dotted lines.
Applsci 12 06658 g005
Figure 6. GAPI pictogram for the SI-HLLME-HPLC-DAD method.
Applsci 12 06658 g006
Table 1. Plans of experiments generated by 2-level FFD for the screening of SI-HLLME procedure.
Standard RunVACN (μL)VS (μL)Sample pHCentrifugation TimeVsalt (μL)
14700400610300
10700400310500
345070031300
545040061300
15450700610300
270040031300
11450700310500
870070061300
670040061500
745070061500
13450400610500
145040031500
12700700310300
16700700610500
470070031500
9450400310300
Table 2. Experimental runs generated by BBD for the optimization of SI-HLLME procedure.
Standard RunVACN (μL)VS (μL)Vsalt (μL)% ER (PIR)% ER (MEL)
1157540050095.4595.93
745055050082.2784.33
14575550400100.38103.25
15575550400101.38103.99
470070040076.7776.55
145040040078.2676.83
345070040057.2258.36
6700550300100.88101.43
1357555040098.1699.66
1657555040099.92100.29
545055030085.7888.05
957540030070.4268.56
870055050098.8497.62
1757555040094.8197.41
1257570050079.4278.63
270040040085.0482.28
1057570030084.9689.31
Table 3. Validation results for the determination of PIR in urine.
Validation Criteria
Response function (linear regression)SlopeIntercept (×103)r2
(k a = 3; m = 5; n = 3) (0.1–4.0 μg mL−1)
Day 10.6971−0.03750.9998
Day 20.7015−0.03670.9996
Day 30.7066−0.03990.9995
Precision (k = 3; n = 3)
C (μg mL−1)sr (%) bsR (%) c
0.12.52.6
0.52.94.4
12.83.9
22.02.8
42.82.6
Trueness (k = 3; n = 3)
C (μg mL−1)Relative bias (%)
0.1−2.2
0.5−5.7
1−0.62
2+ 1.2
4+ 3.4
Accuracy (k = 5; n = 3)
C (%)Relative β-ΕΤΙ (%)
0.1[−12.92, 8.61]
0.5[−12.82, 1.40]
1[−7.54, 6.30]
2[−10.49, 12.96]
4[−4.50, 11.16]
Linearity (k = 3; n = 3; m = 5)
(0.1–4.0 μg mL−1)
Slope1.042
Intercept−0.024
r20.9998
LOD (μg mL−1)0.02
LLOQ (μg mL−1)0.1
ak: number of experiments, m: calibration levels and n: replicates. b sr (%): relative standard deviation for repeatability. c sR (%): relative standard deviation for intermediate.
Table 4. Comparison of the SI-HLLME method with other microextraction approaches.
AnalyteSampleSample Preparation 1Analytical Determination 2RR%RSD%LOD
(μg mL−1)
Ref.
PIRHorse urineSDMECEC-DAD94.8<4.320.01764[34]
MELHuman plasmaIL-UA-ISFMEHPLC-UV82.1–93.6<5.10.0001[35]
PIRWater samplesHF-SLPMEHPLC-DAD70.02–110.98<4.270.00458[36]
MELHuman serumCloud-point extractionHPLC-UV>926.90.01[37]
PIRPharmaceutical formulations, human urineDLLMESpectrophotometry97–1102.830.058[2]
PIR
MEL
Human urineSI-HLLMEHPLC-DAD94.3–103.4<4.40.02–0.03This study
1 SDME: single drop microextraction, IL-UA-ISFME: ionic liquid-based ultrasound-assisted in situ solvent formation microextraction, HF-SLPME: hollow fiber solid/liquid microextraction, DLLME: dispersive liquid–liquid microextraction, SI-HLLME: salt-induced homogeneous liquid–liquid microextraction. 2 CEC-DAD: capillary electrochromatography–diode array detection, HPLC-DAD: high-performance liquid chromatography–diode array detection, HPLC-UV: high-performance liquid chromatography–ultraviolet detection.
Publisher’s Note: MDPI stays neutral with regard to jurisdictional claims in published maps and institutional affiliations.

