
Seismic Response Analyses of a Large-Span Powerhouse Cavern Considering Rock–Structure Interaction

Abstract
:1. Introduction
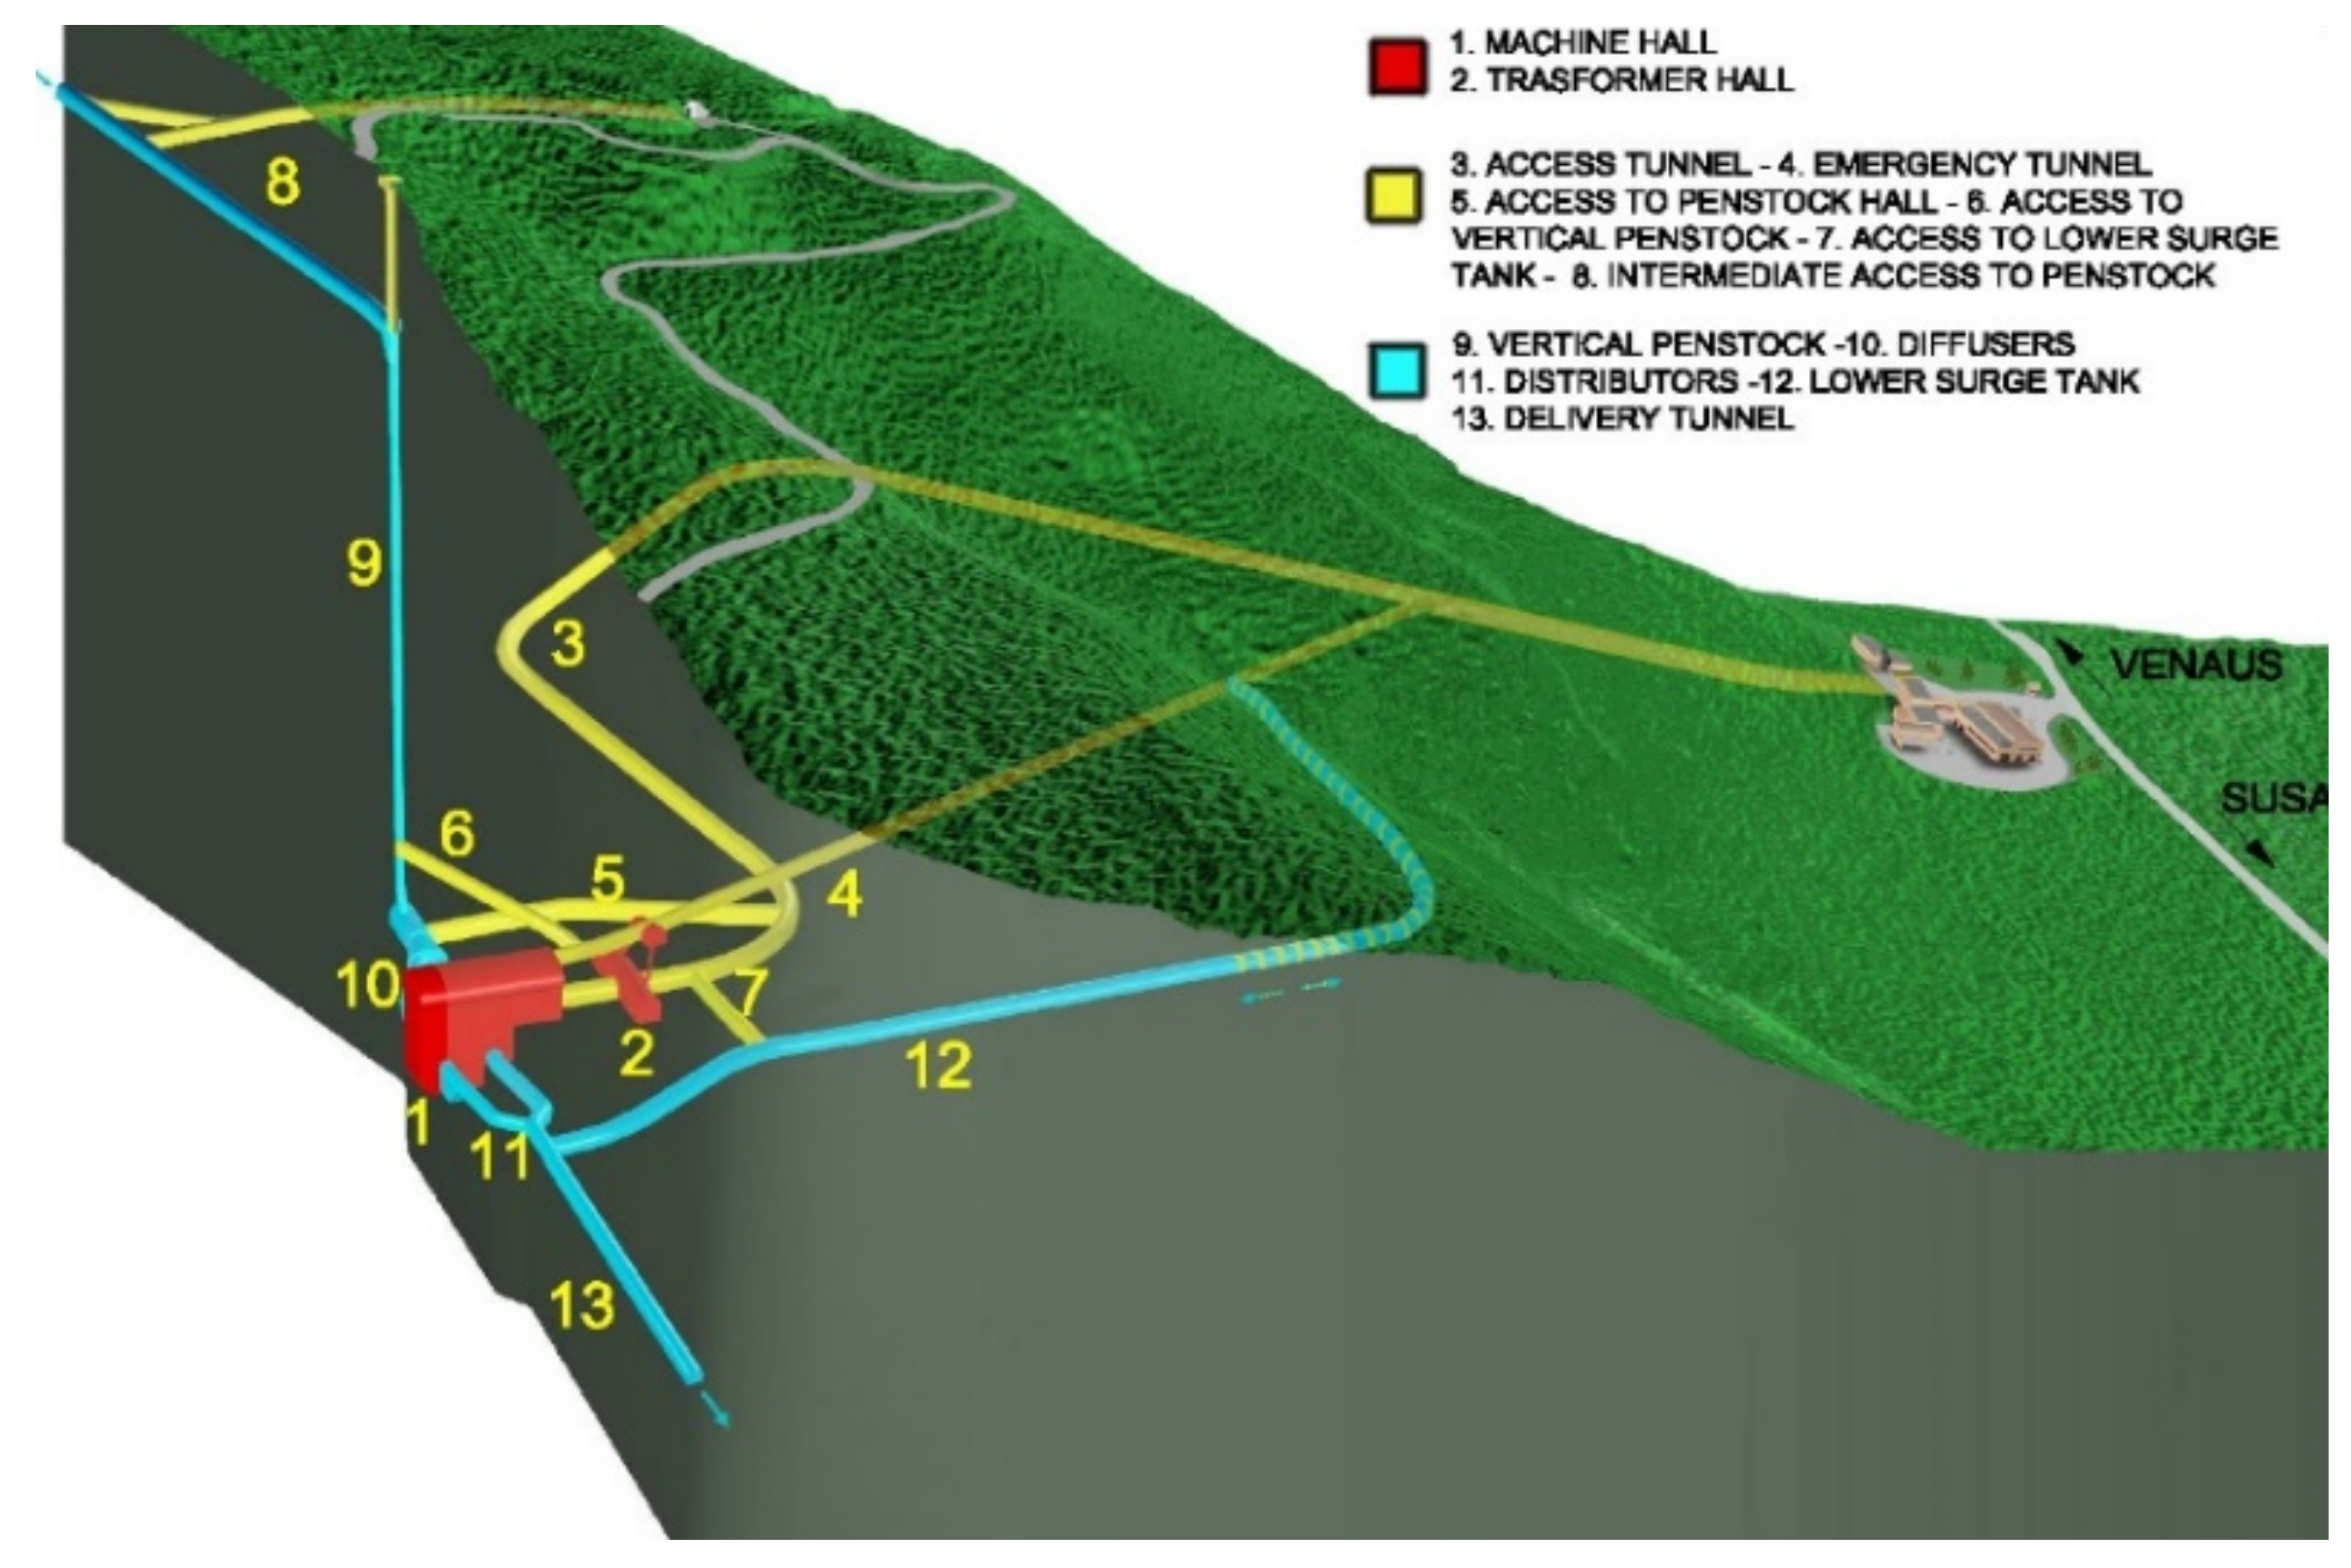
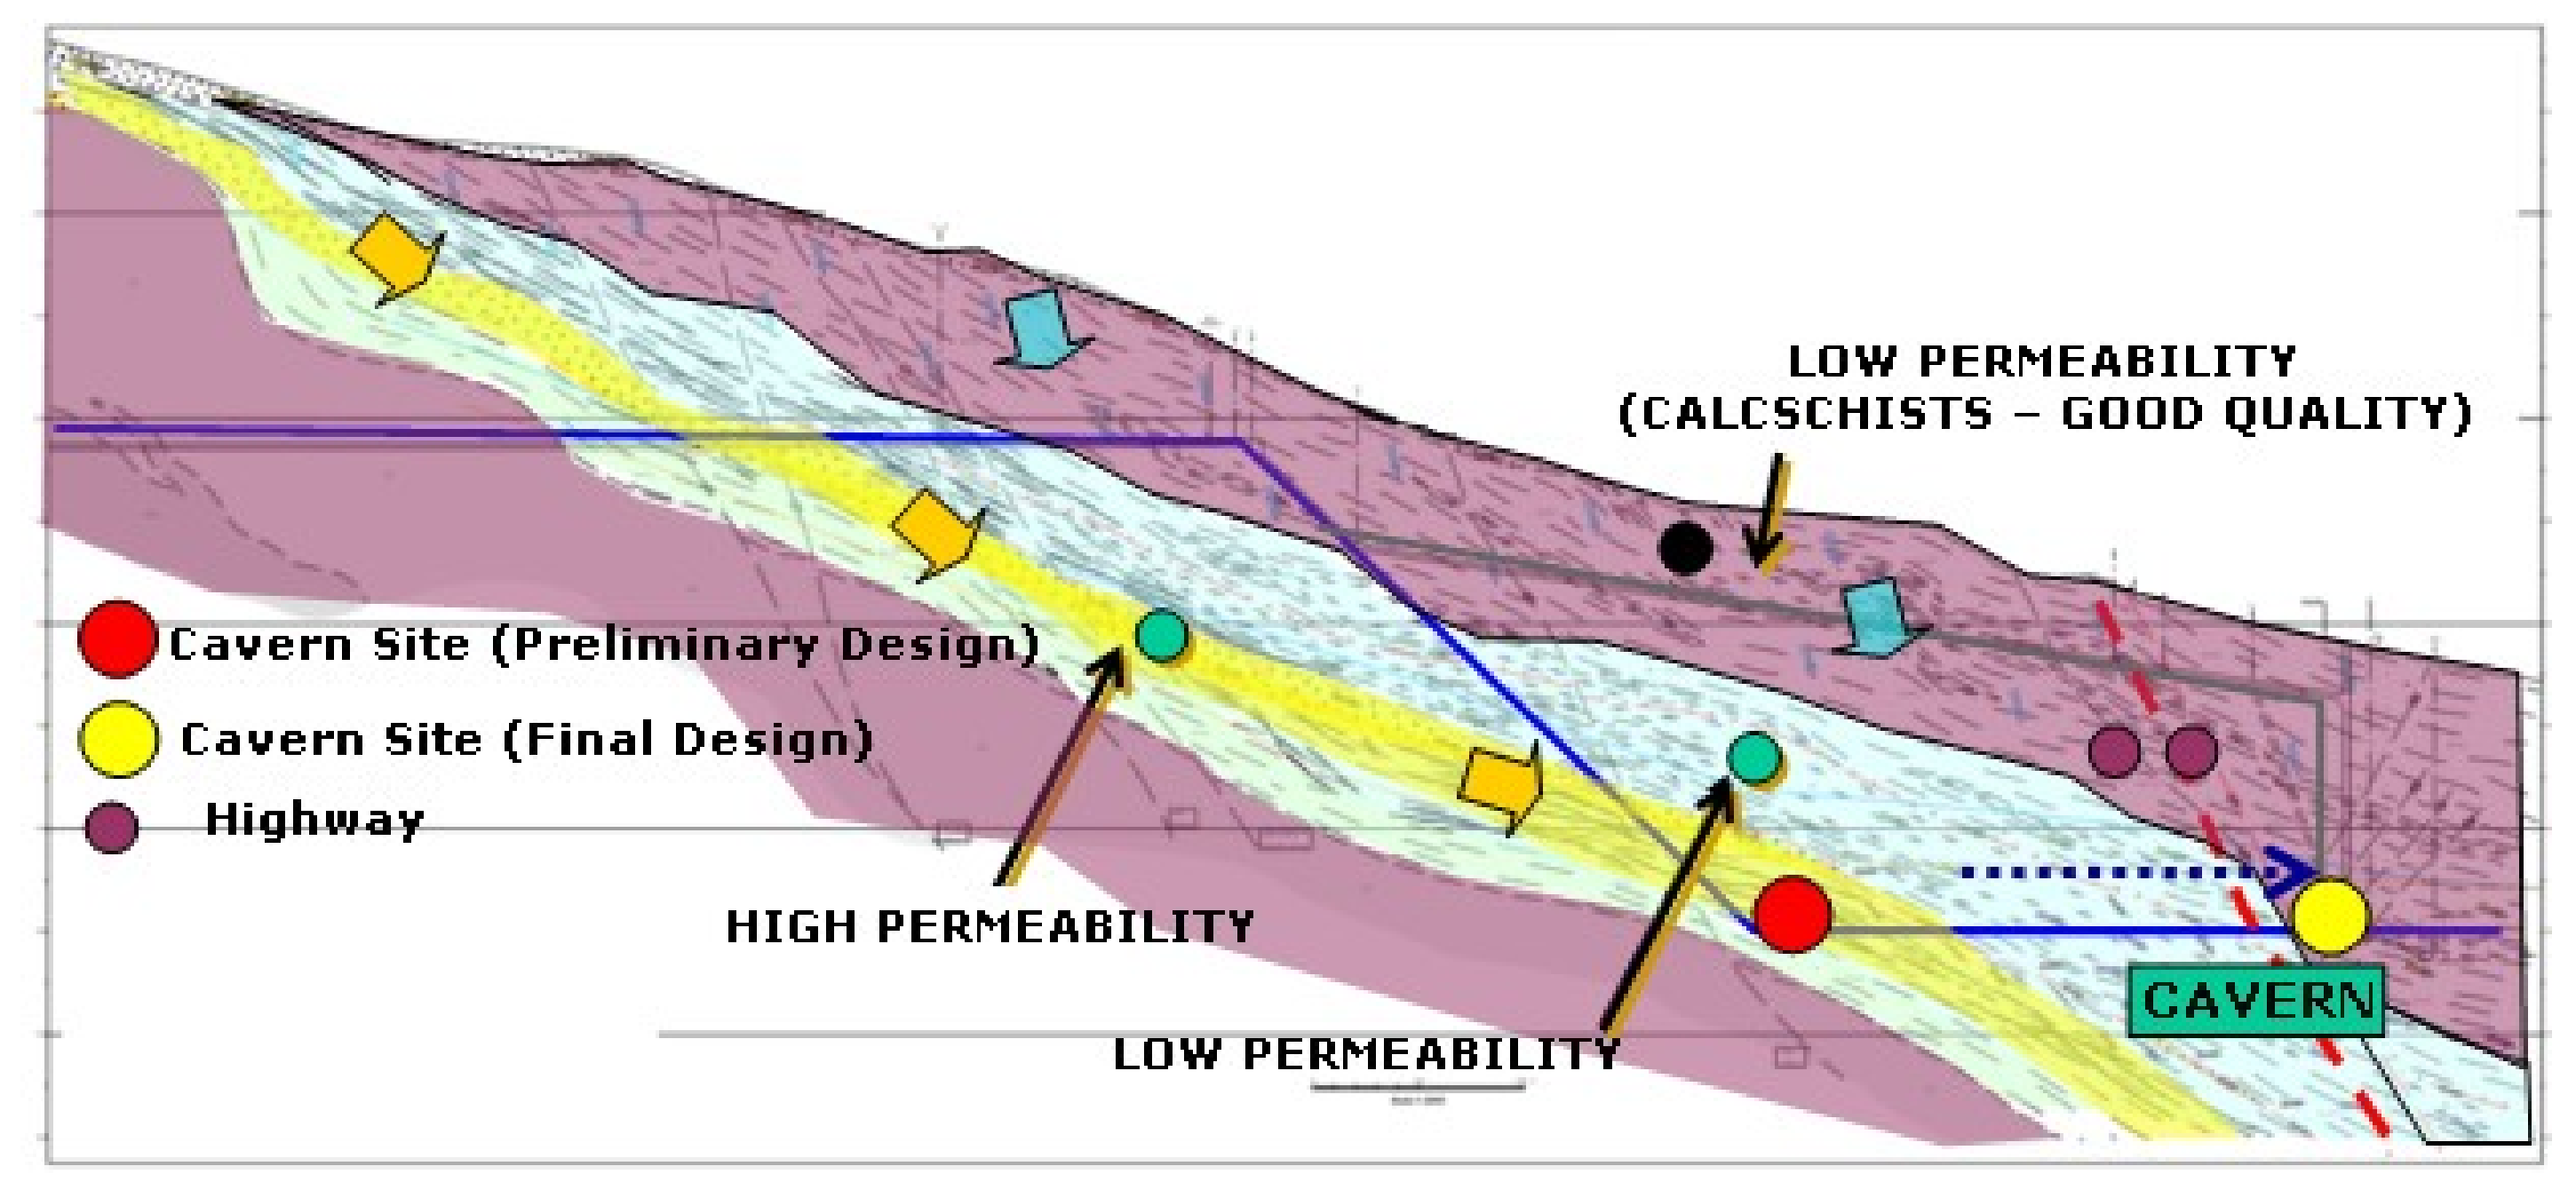
2. Project Background
3. Rock Mass Properties
4. Numerical Modeling
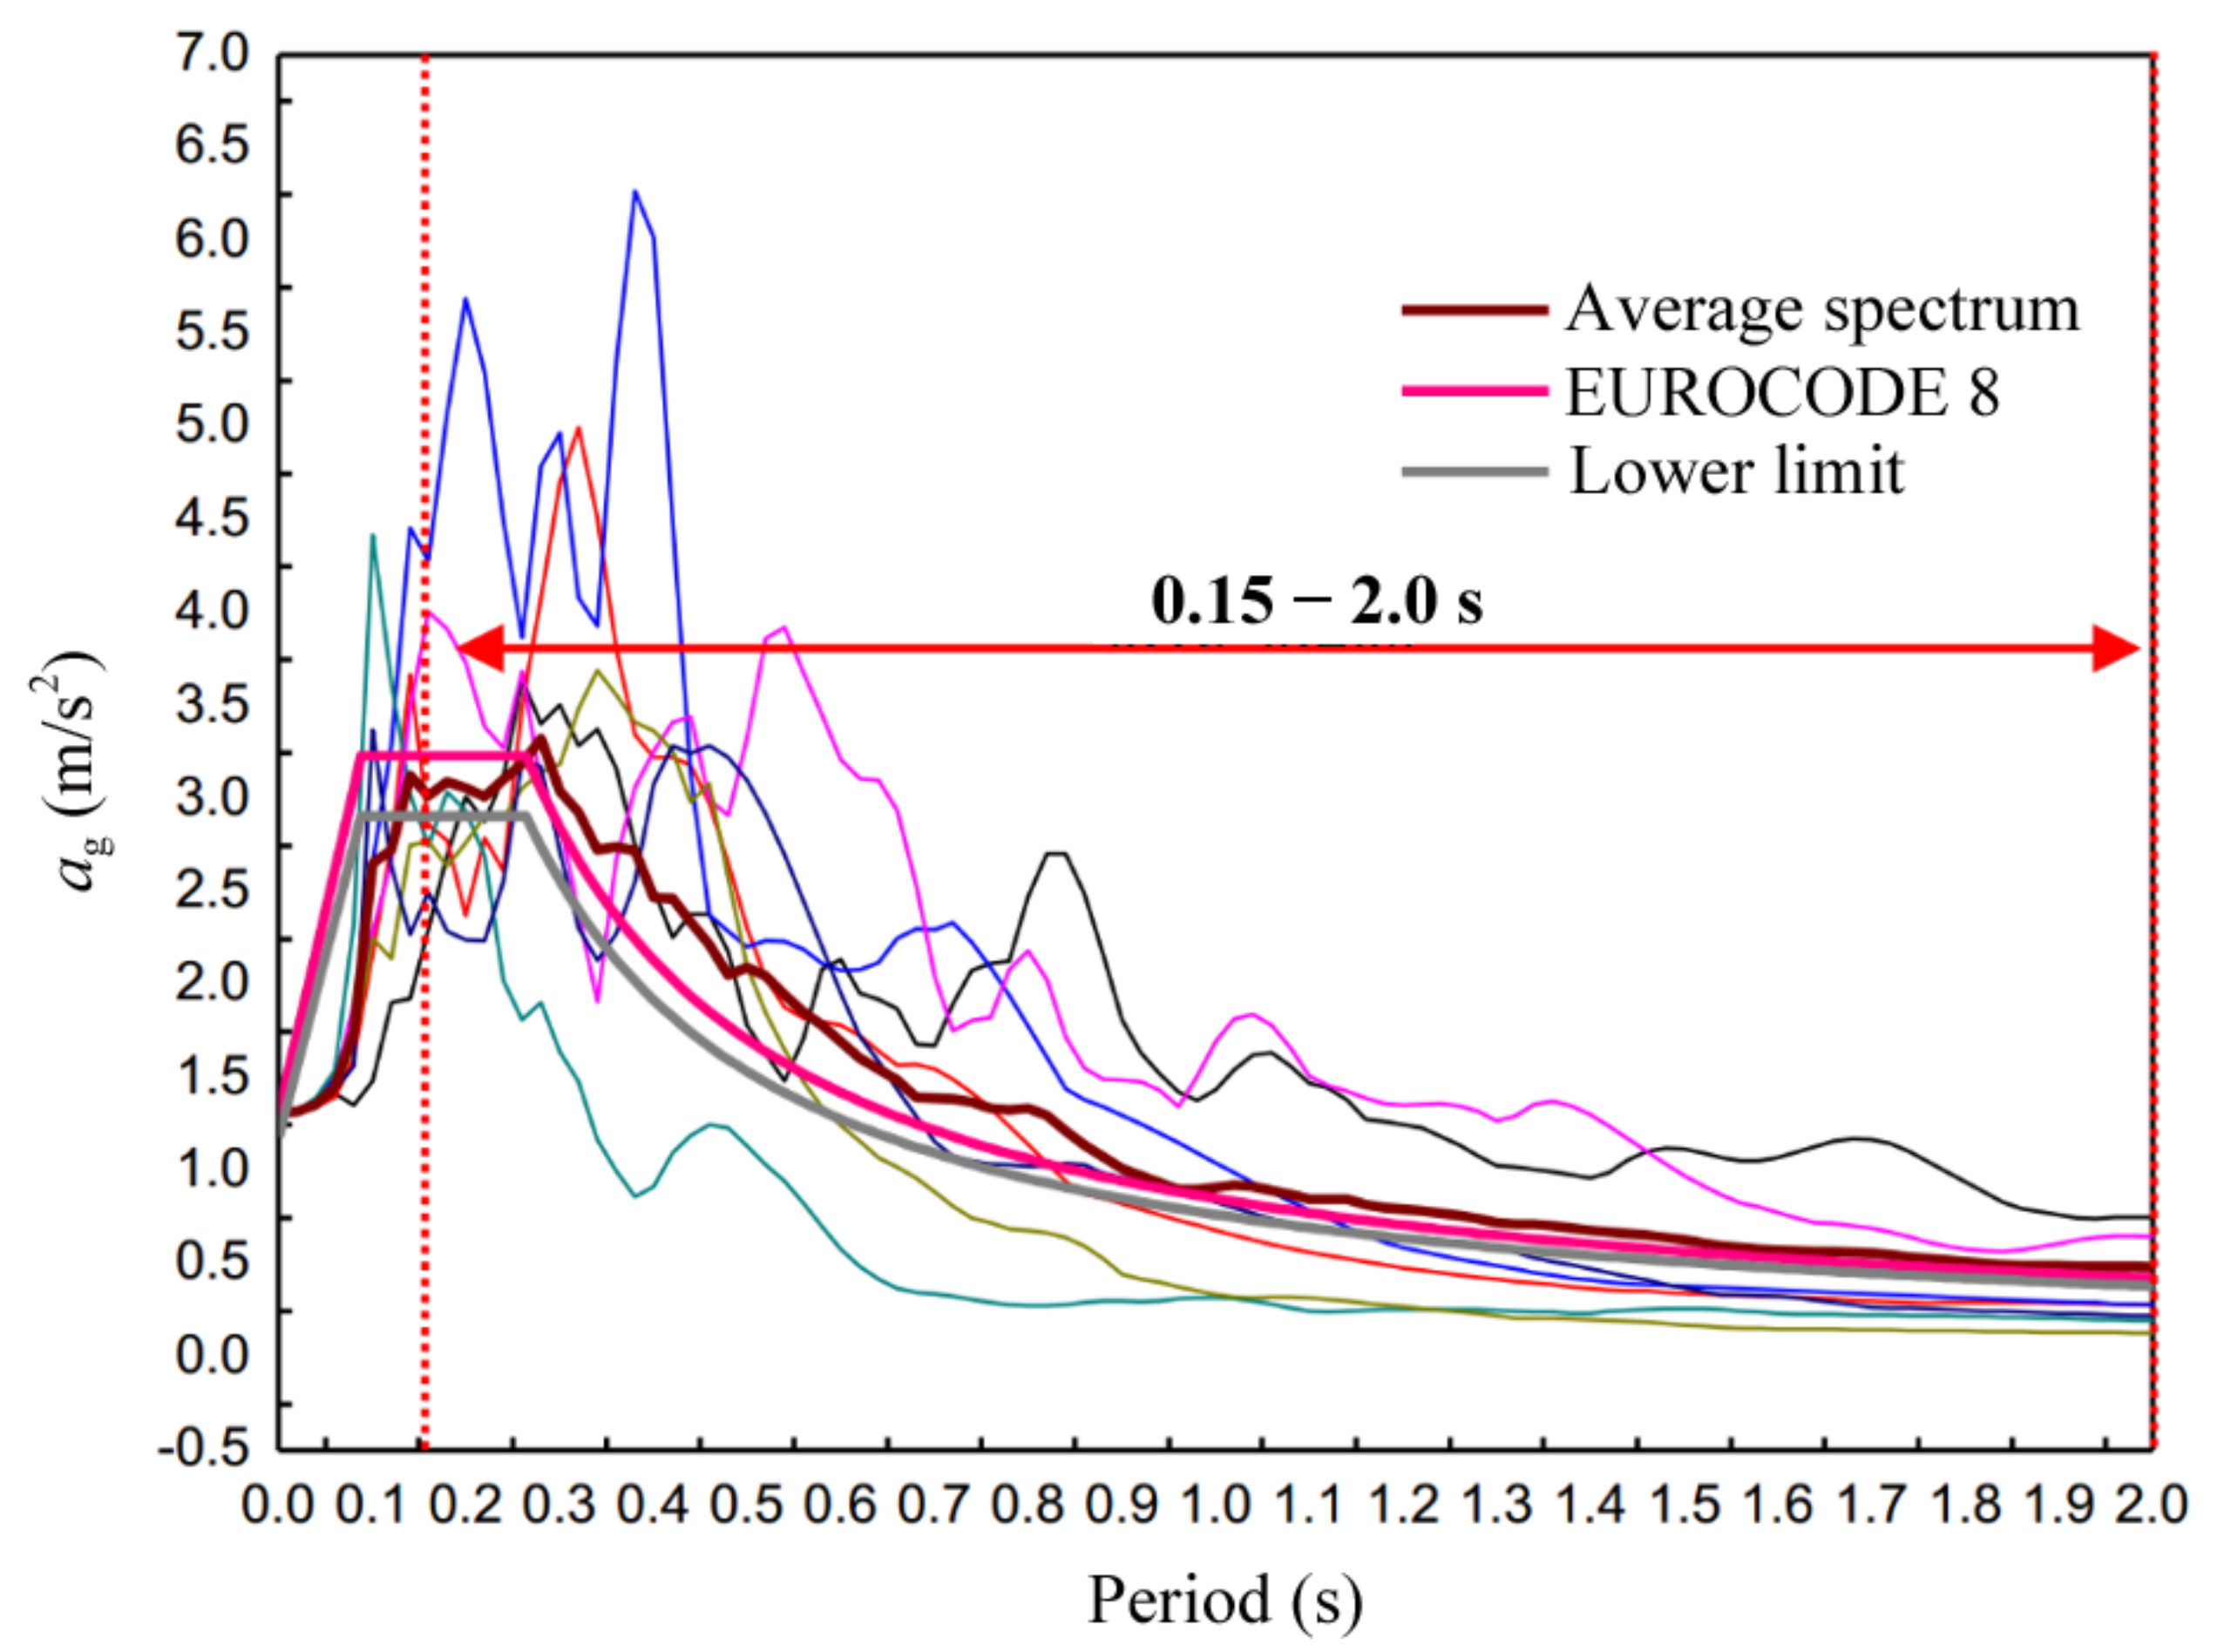
4.1. Selection of the Seismic Input
Selection of Seismic Inputs
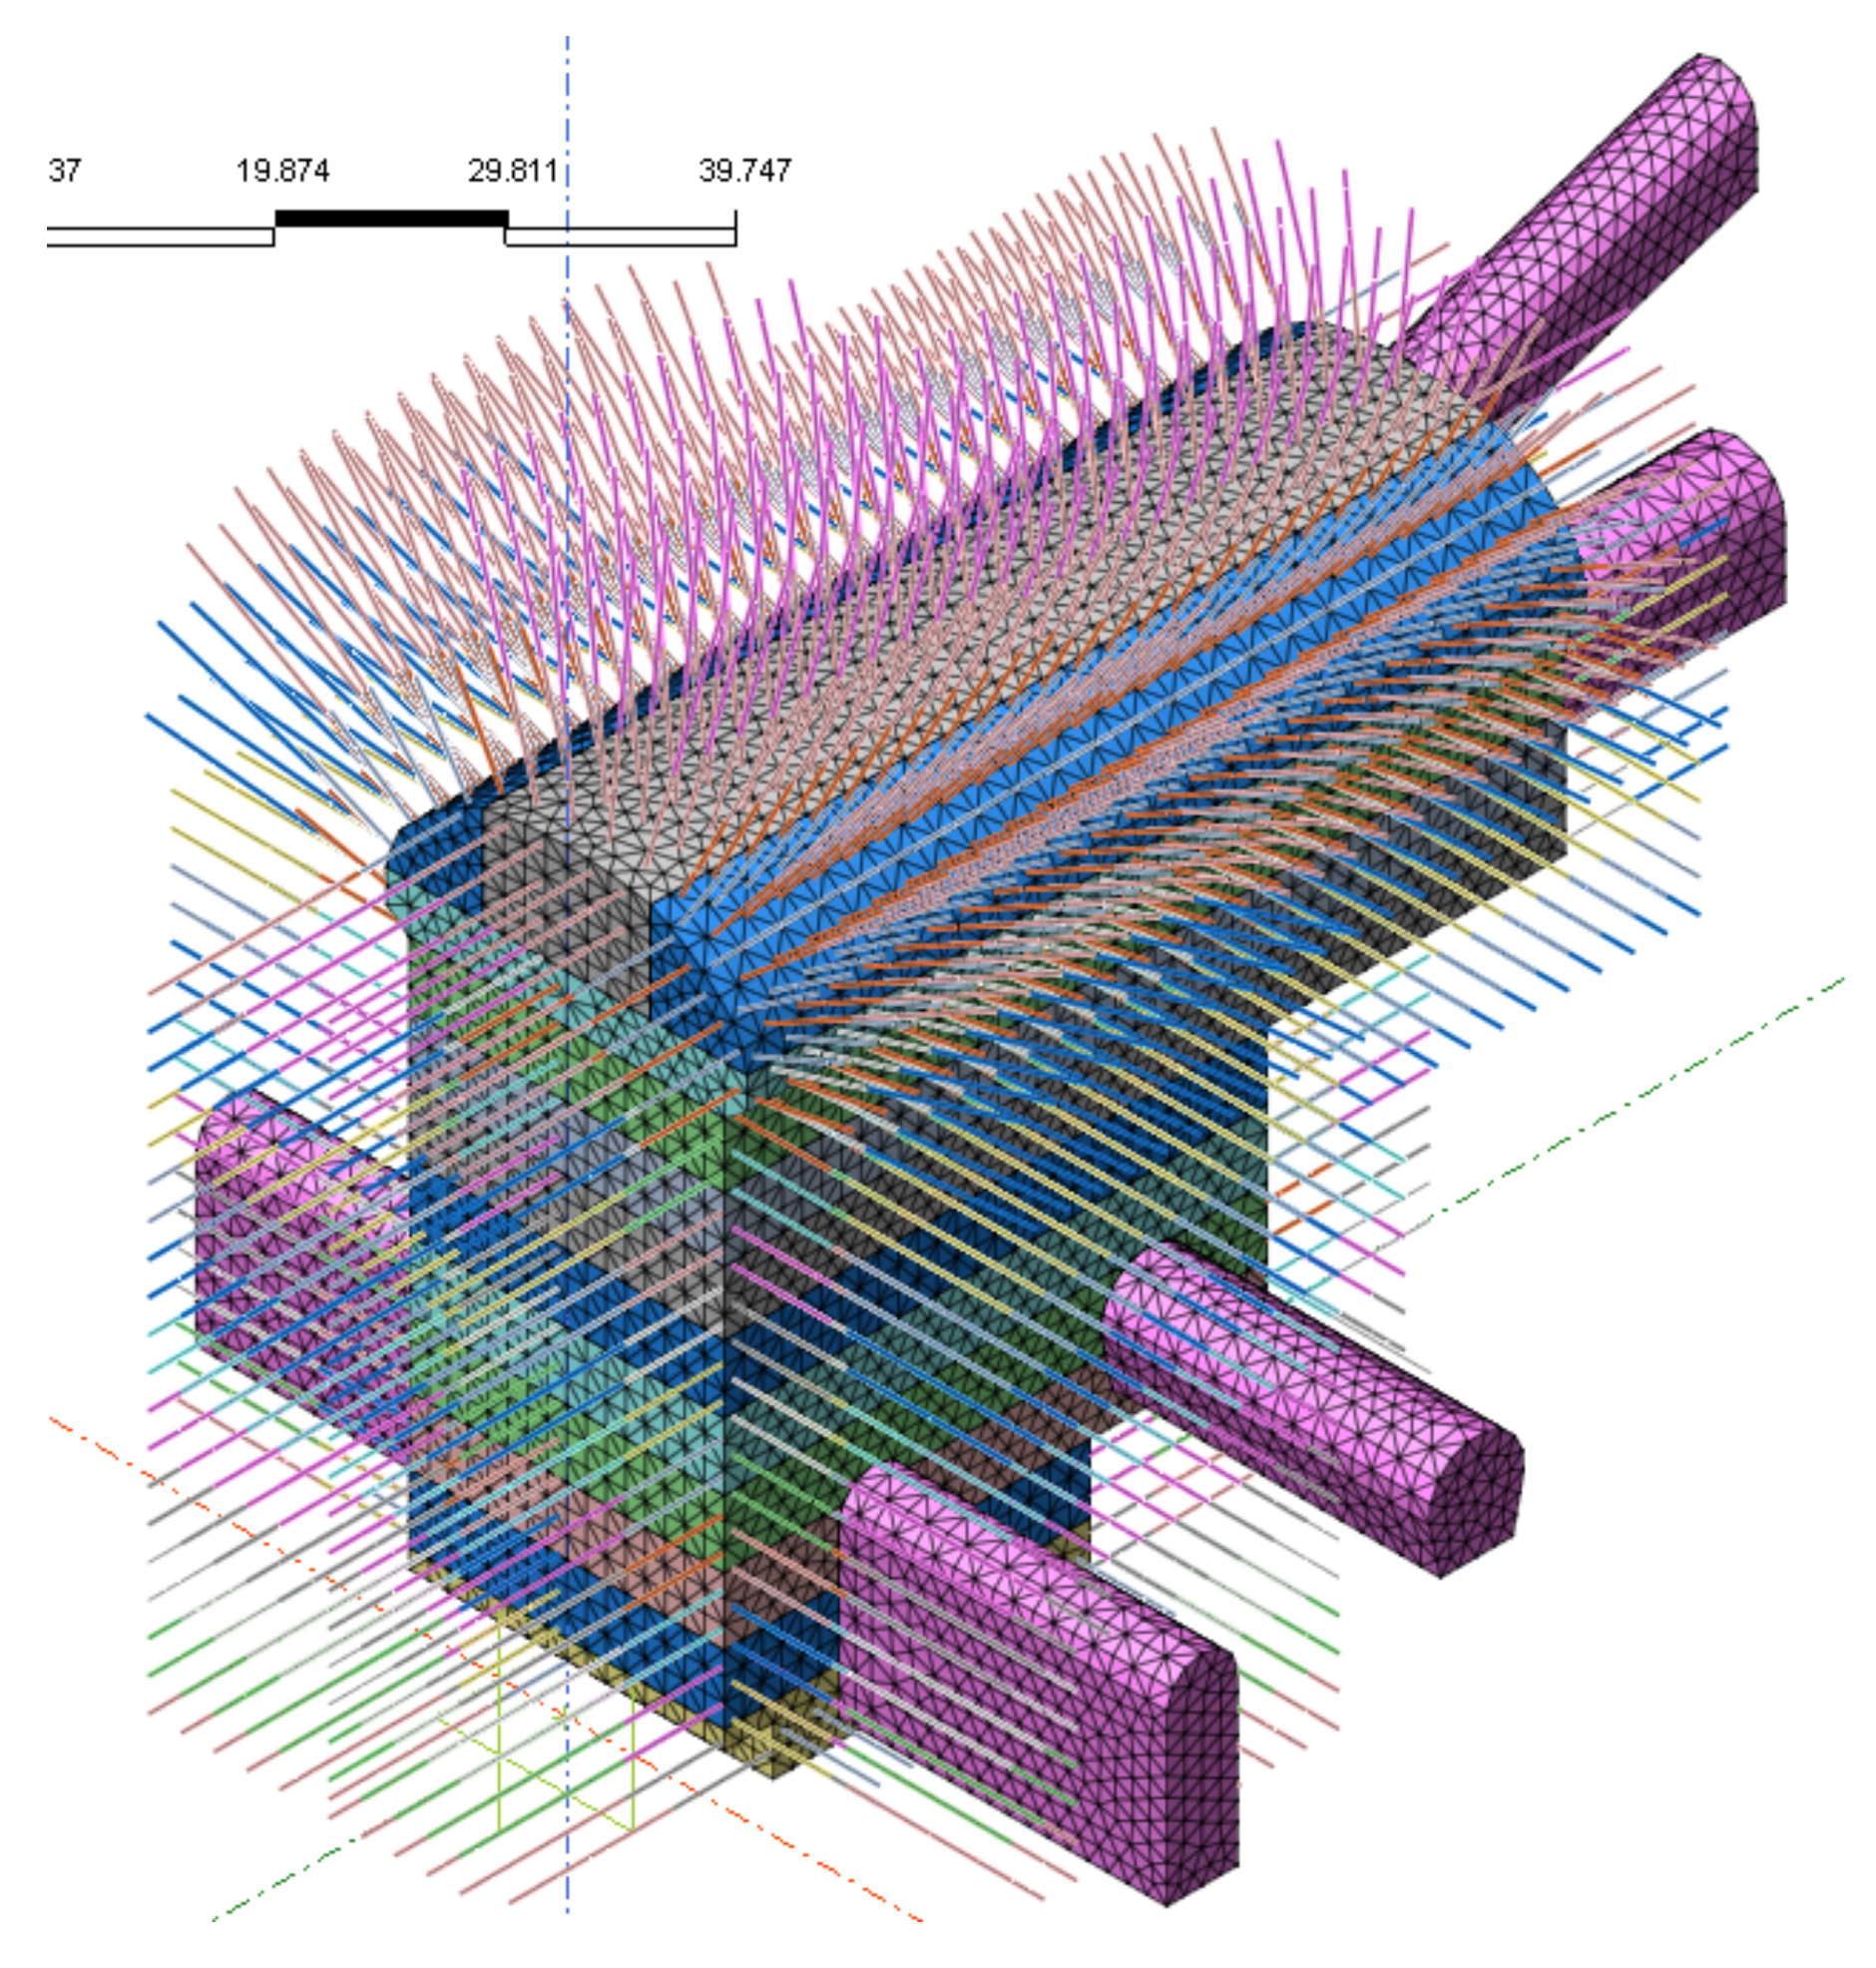
4.2. 2D and 3D Finite Element Modeling
5. Results and Discussion
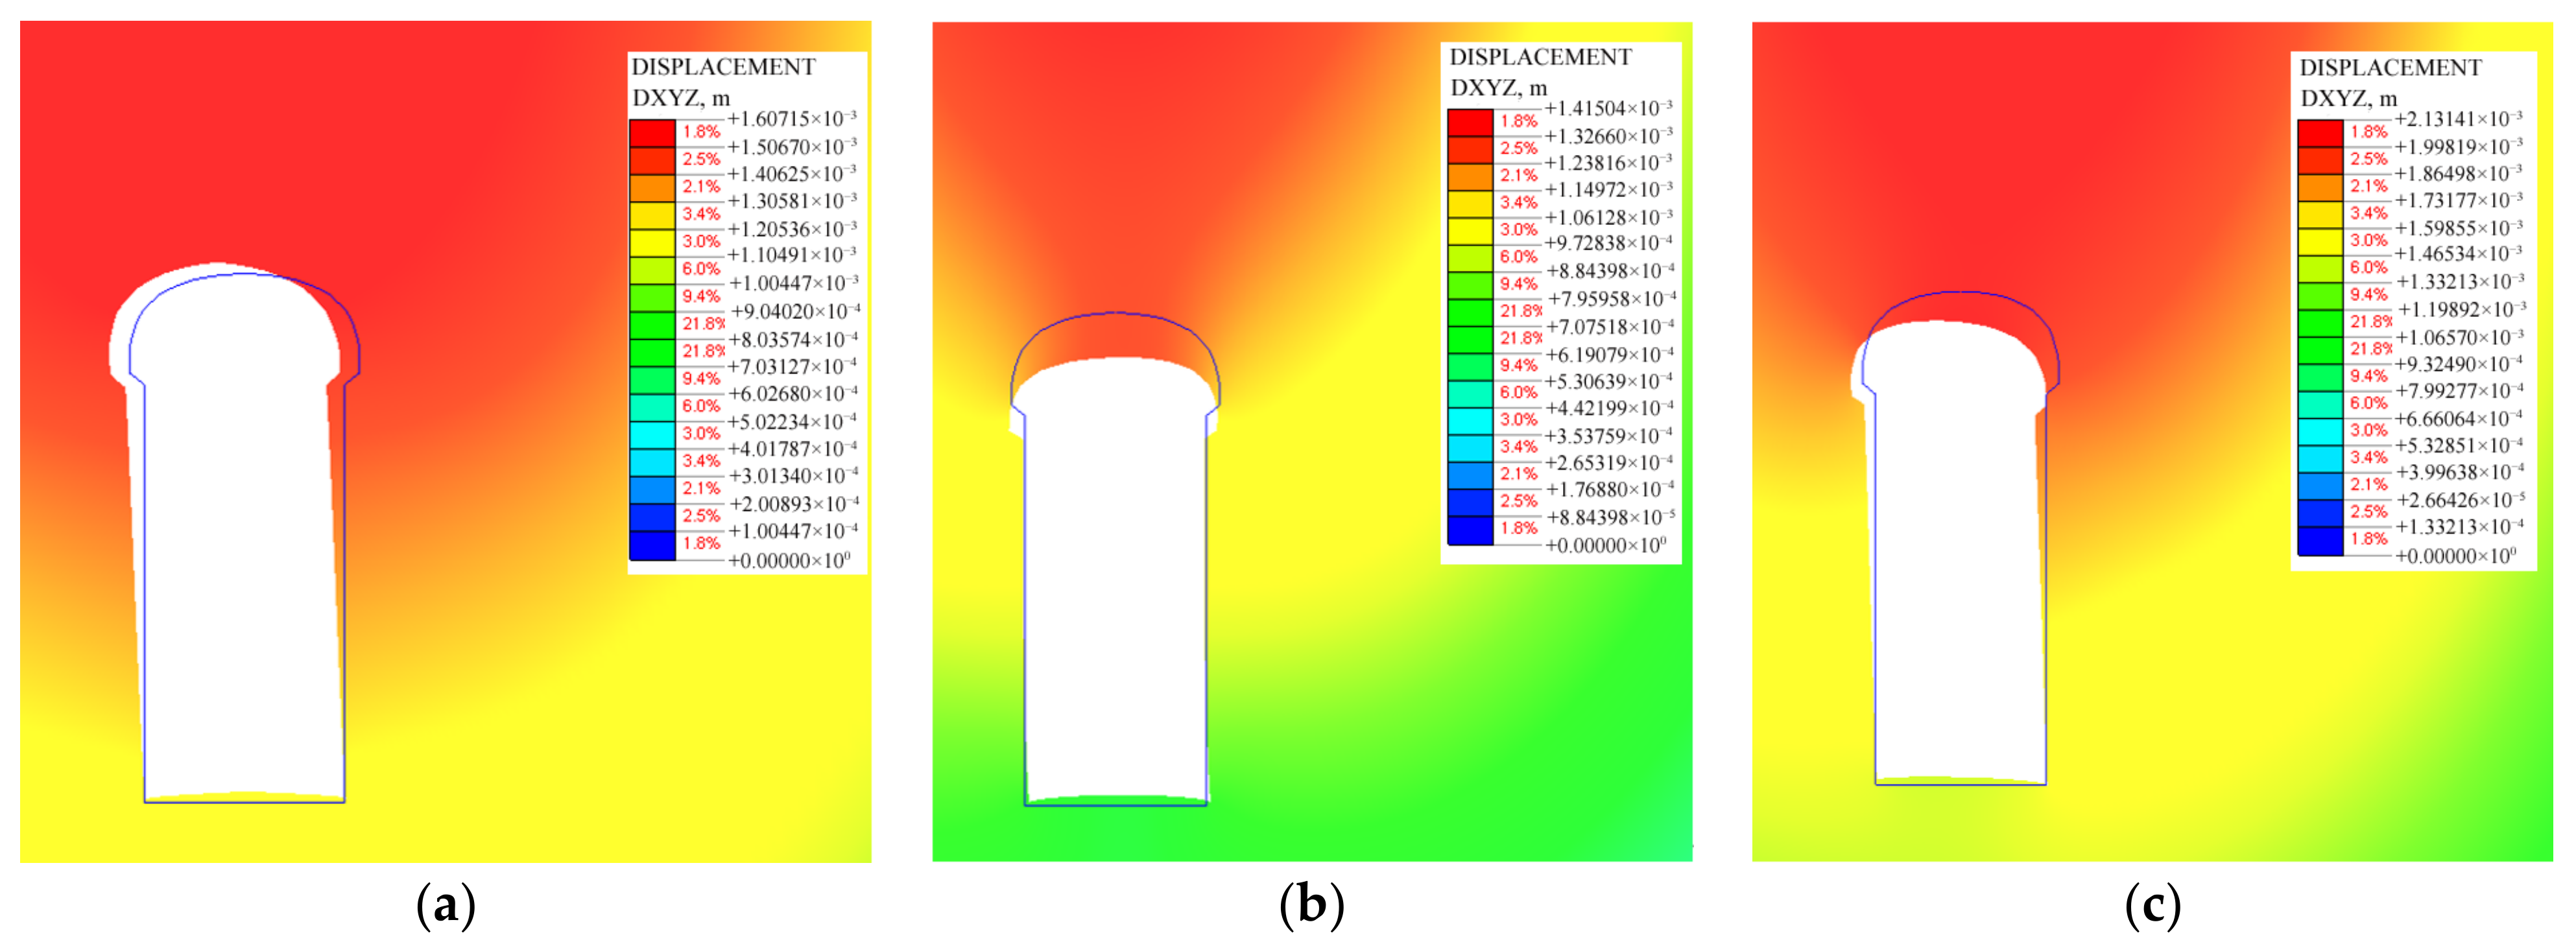
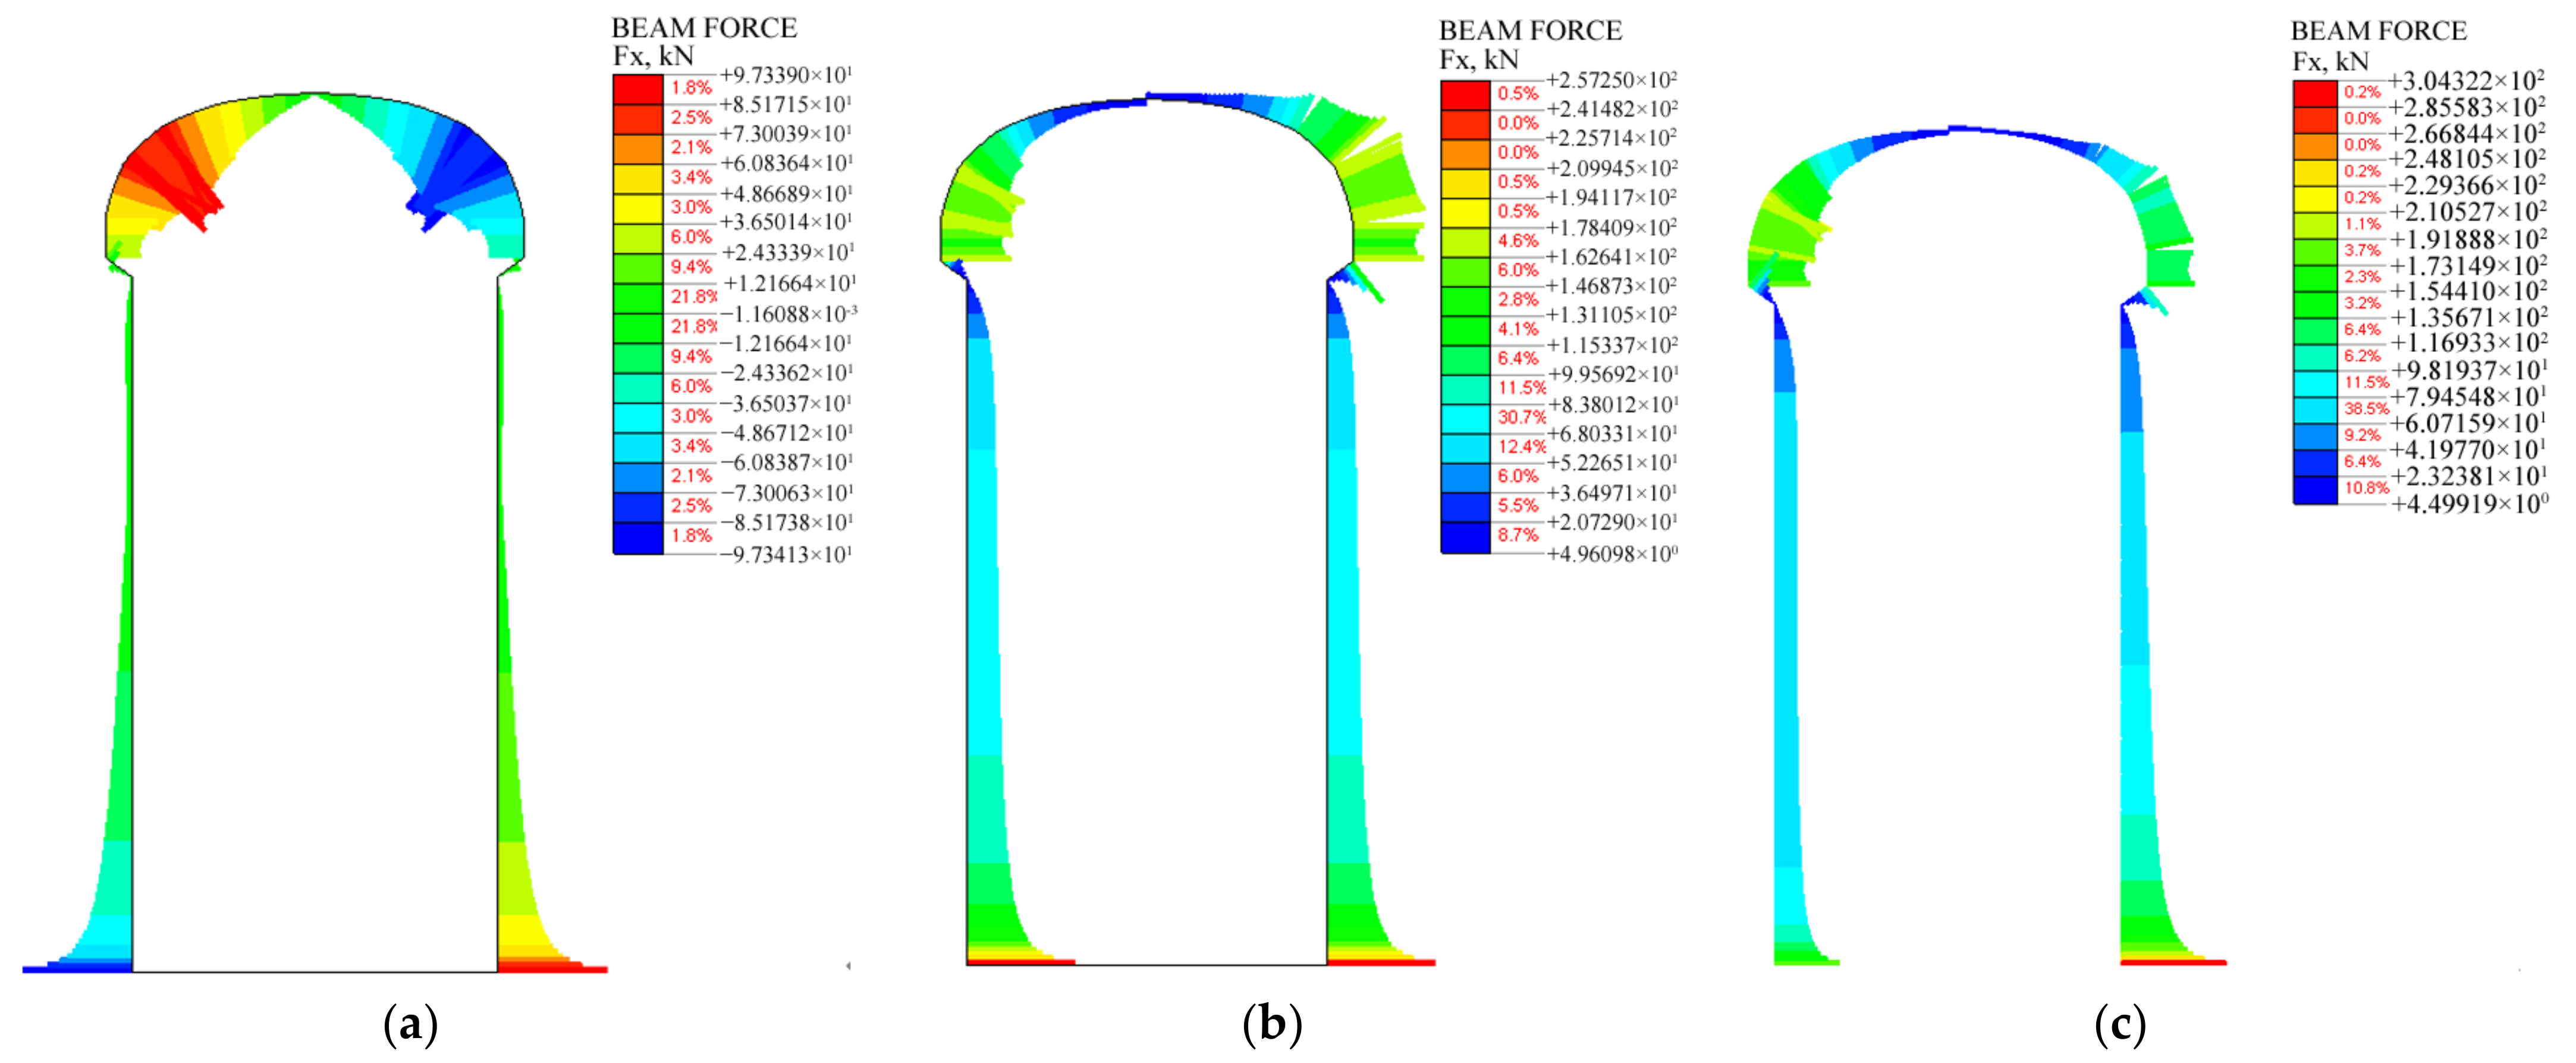
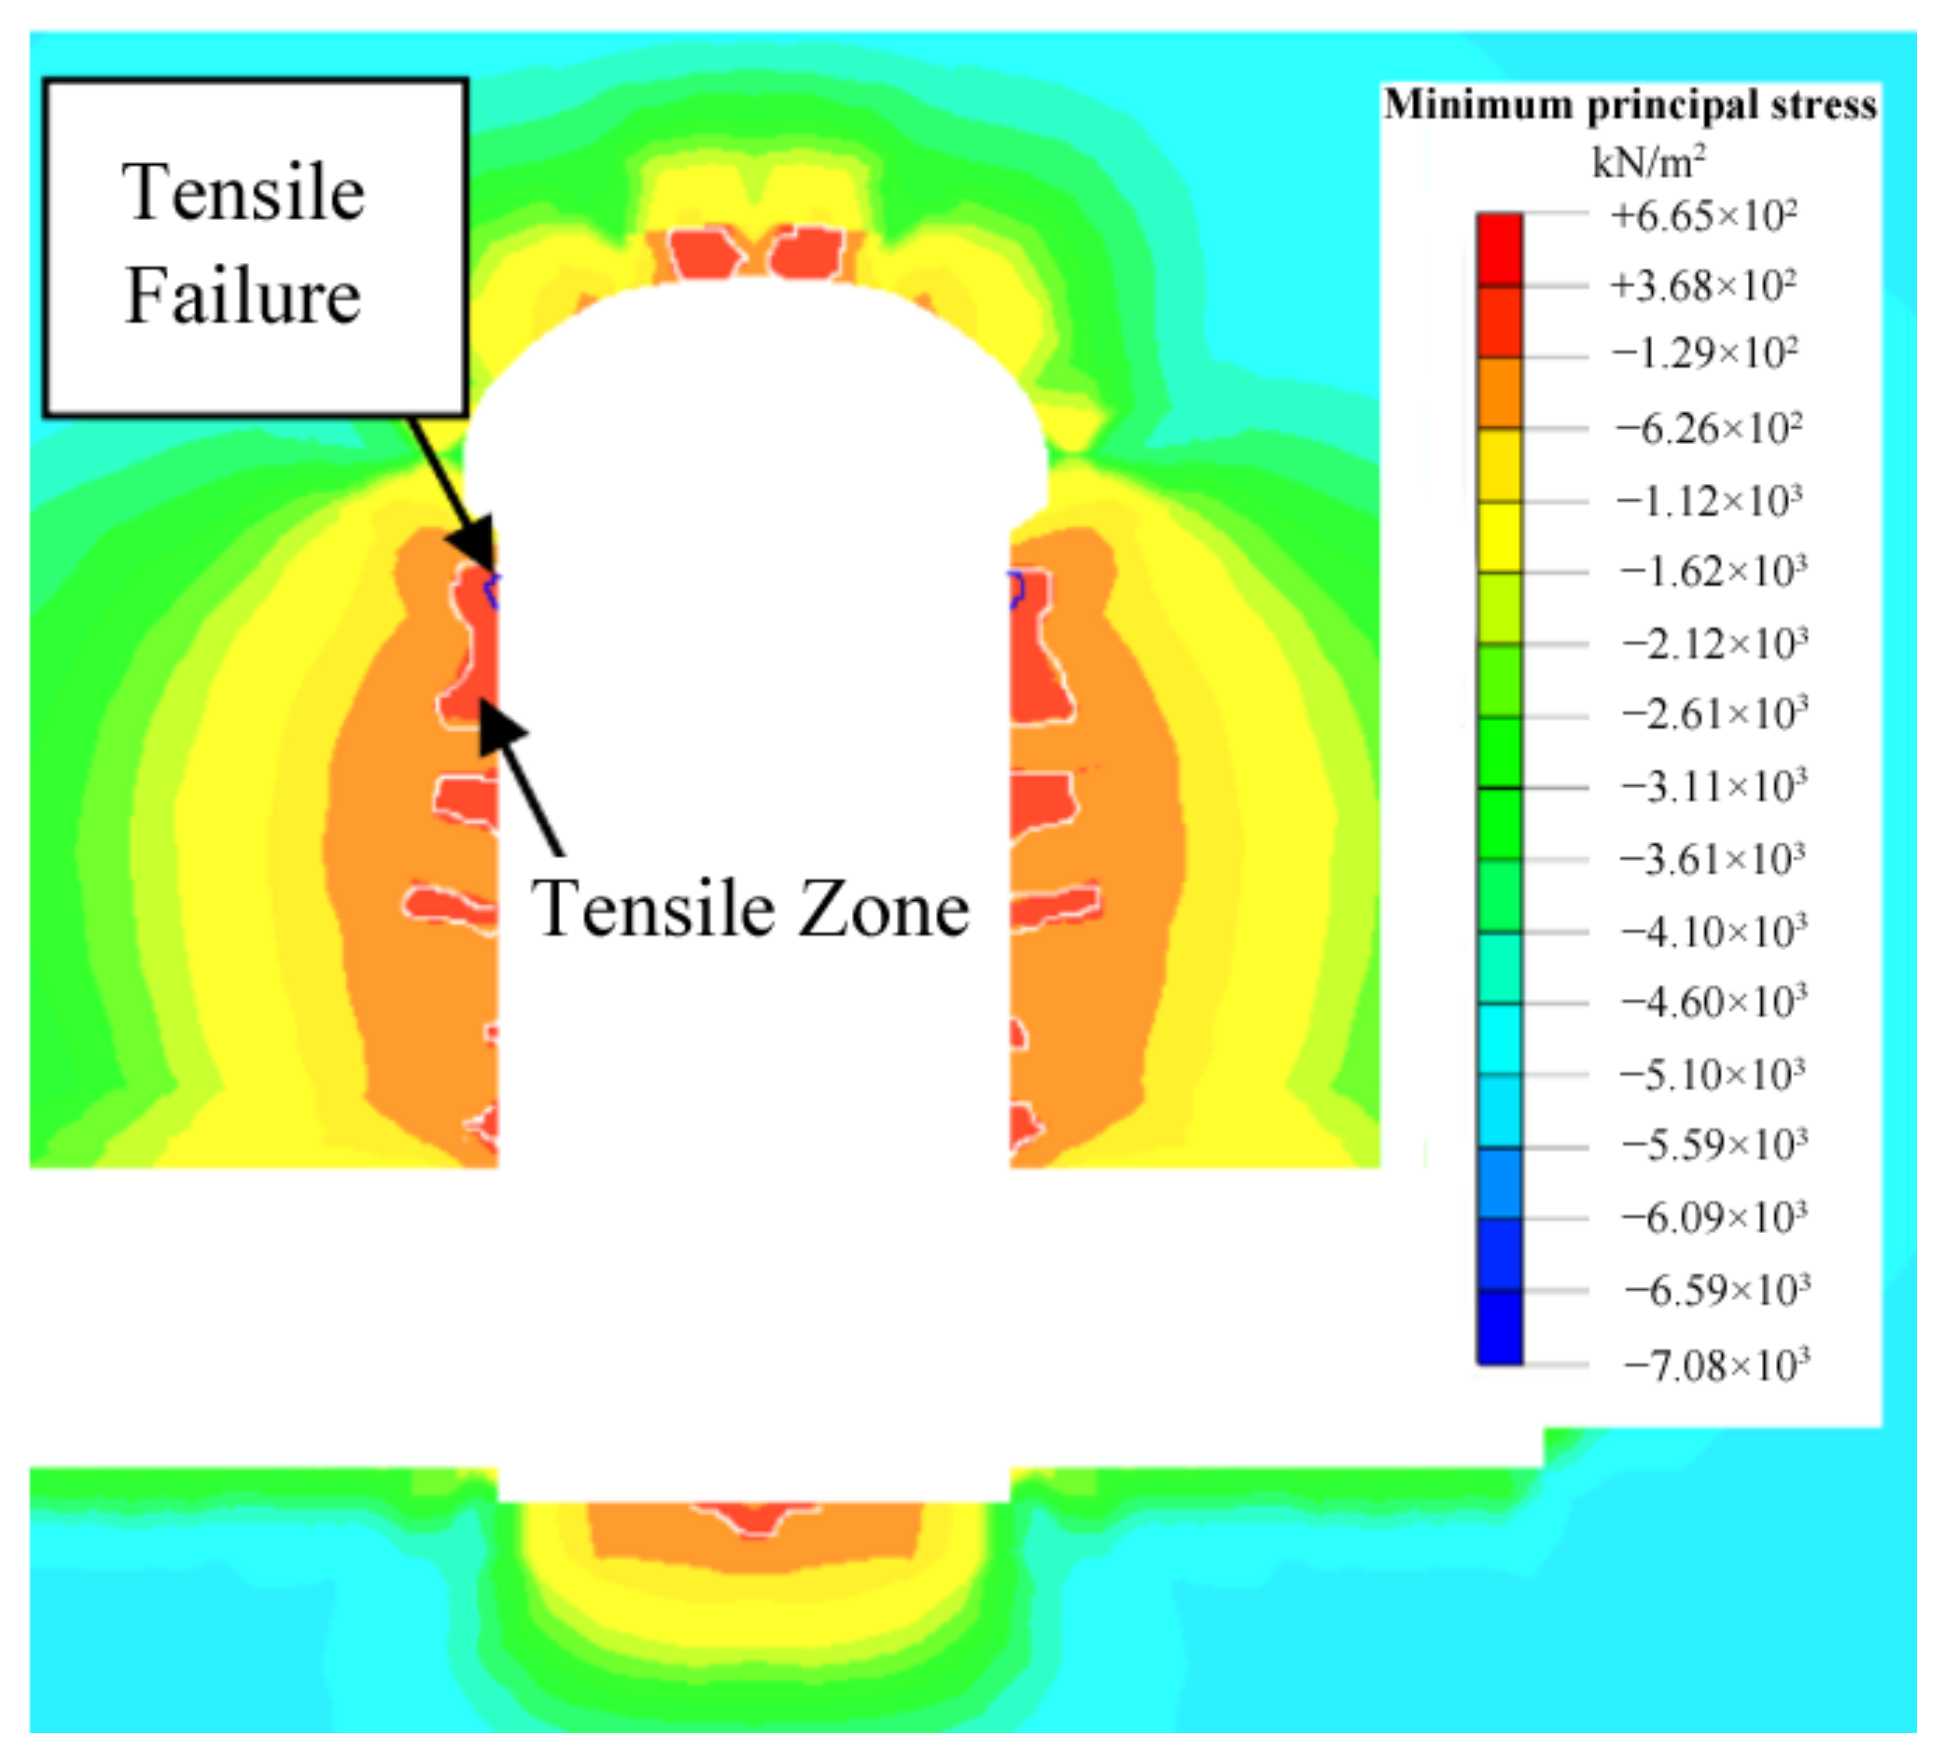
5.1. 2D Analyses
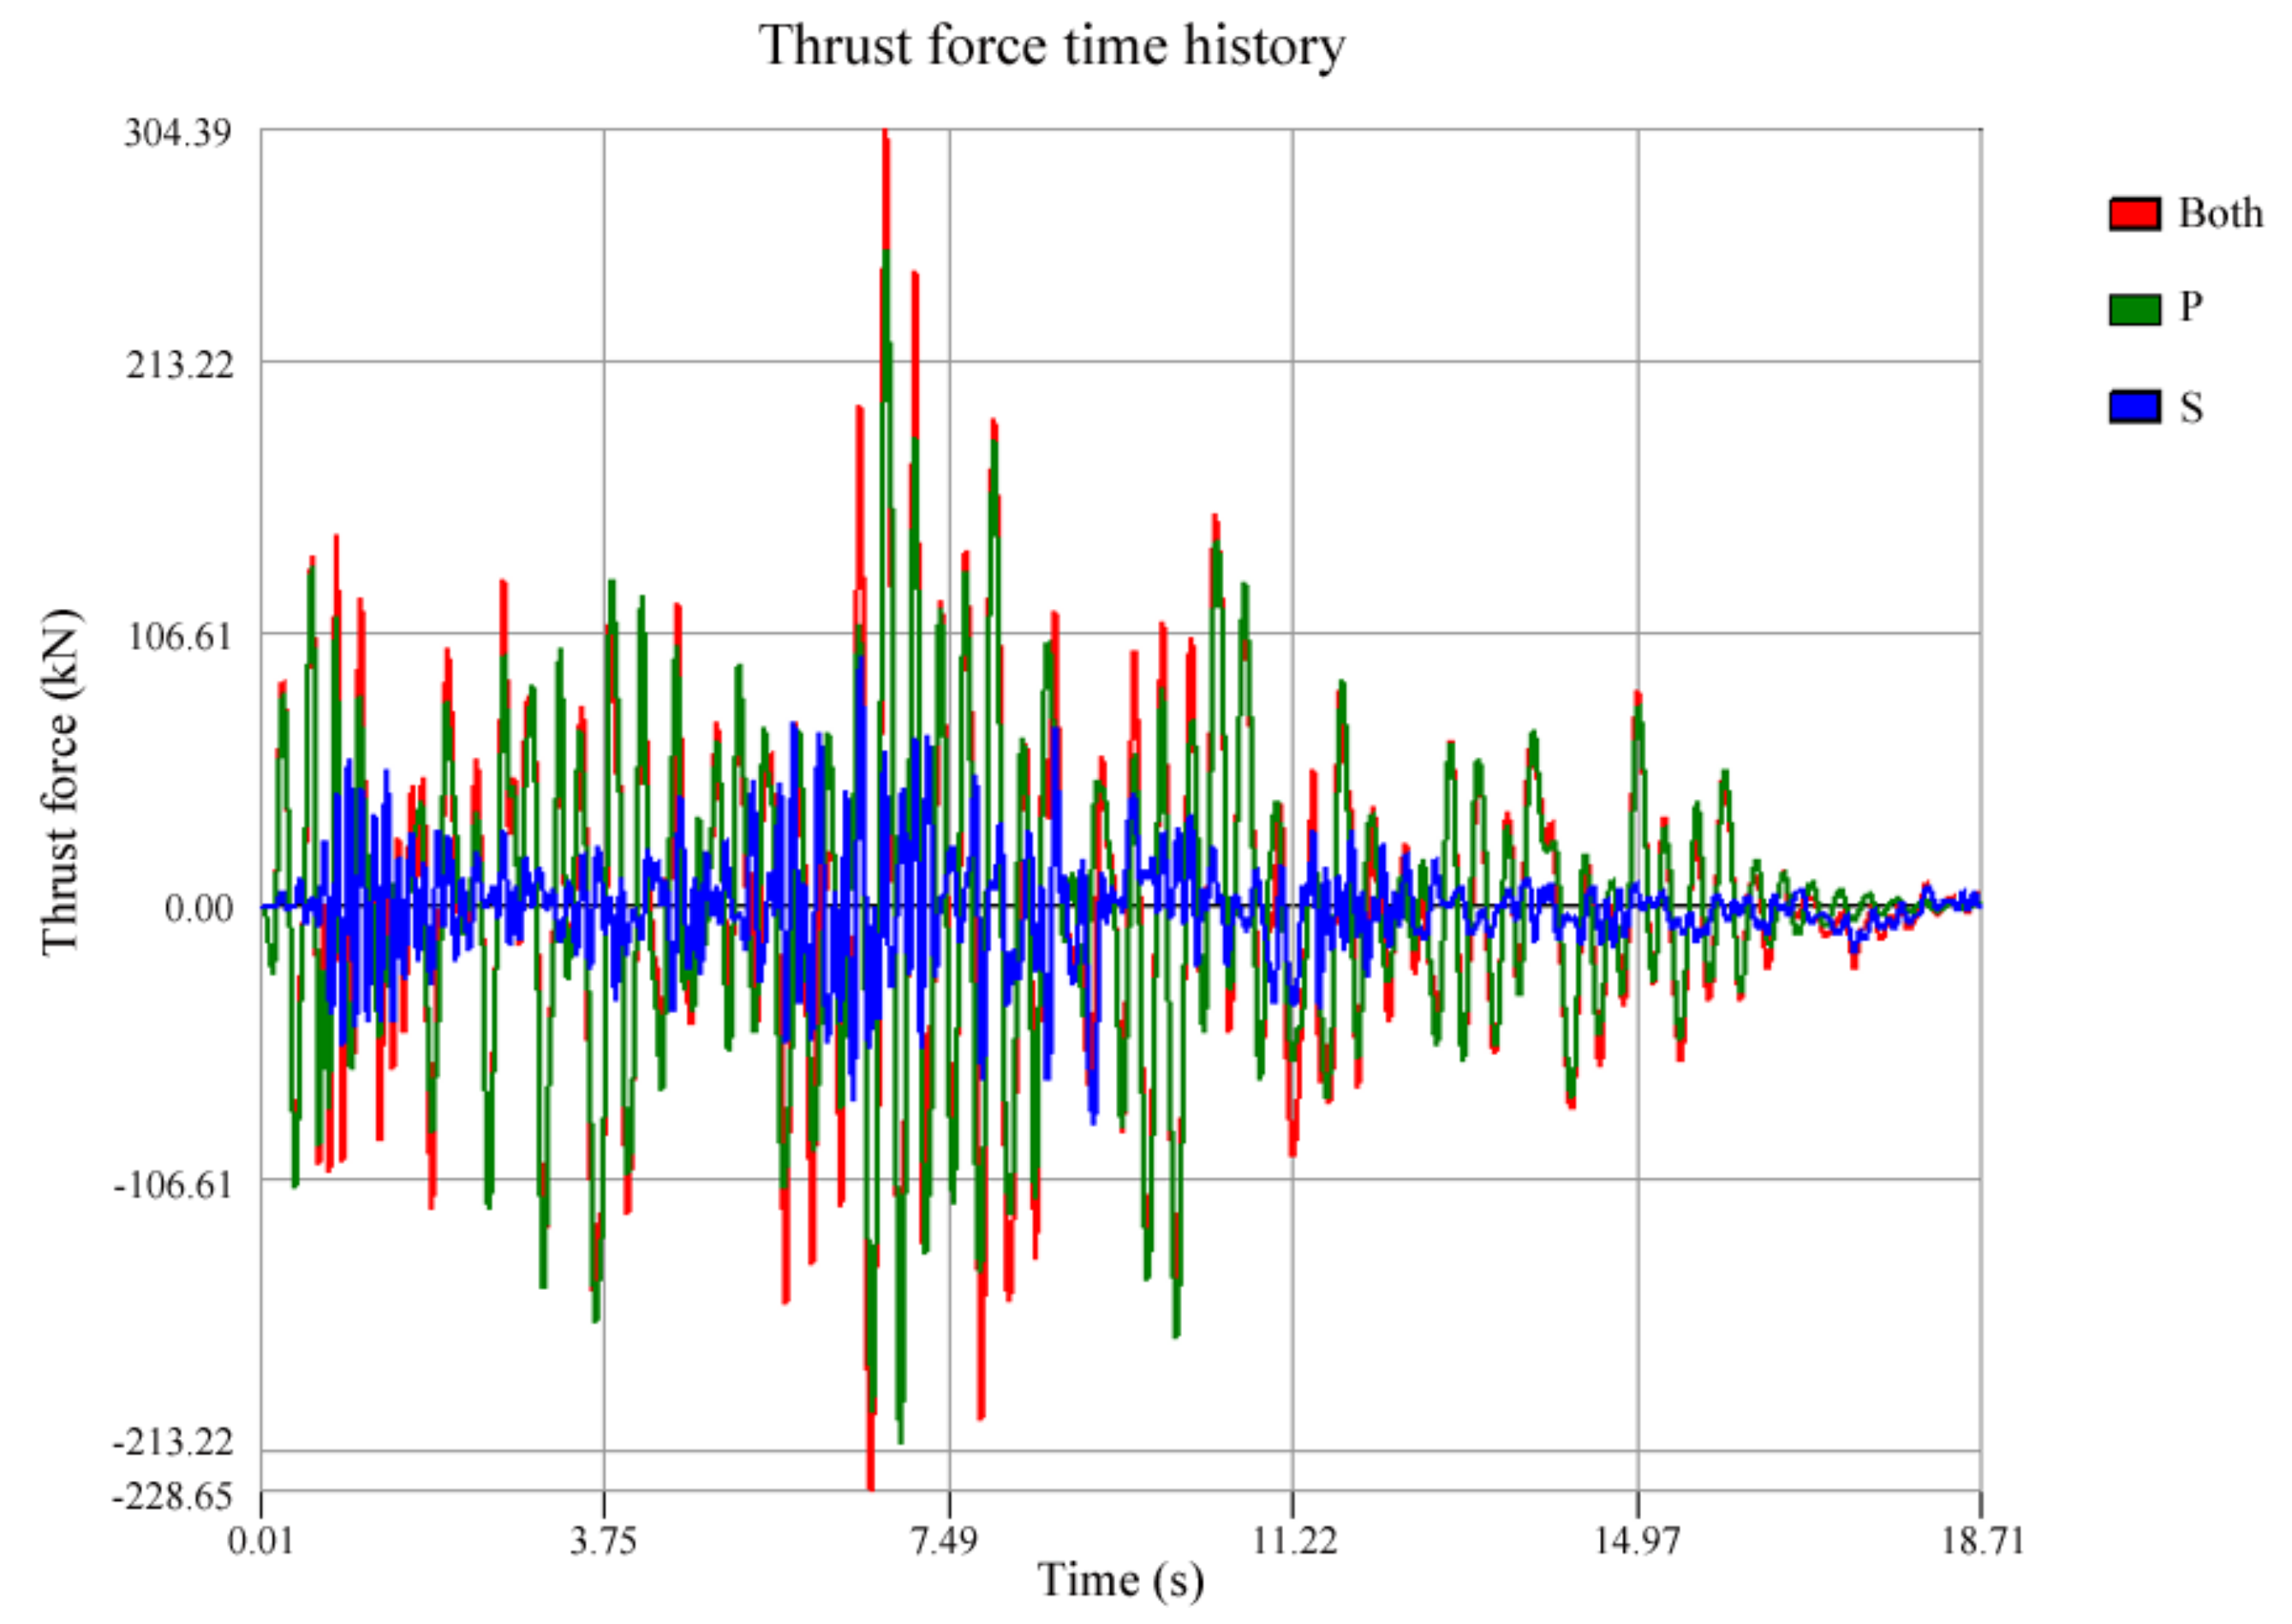
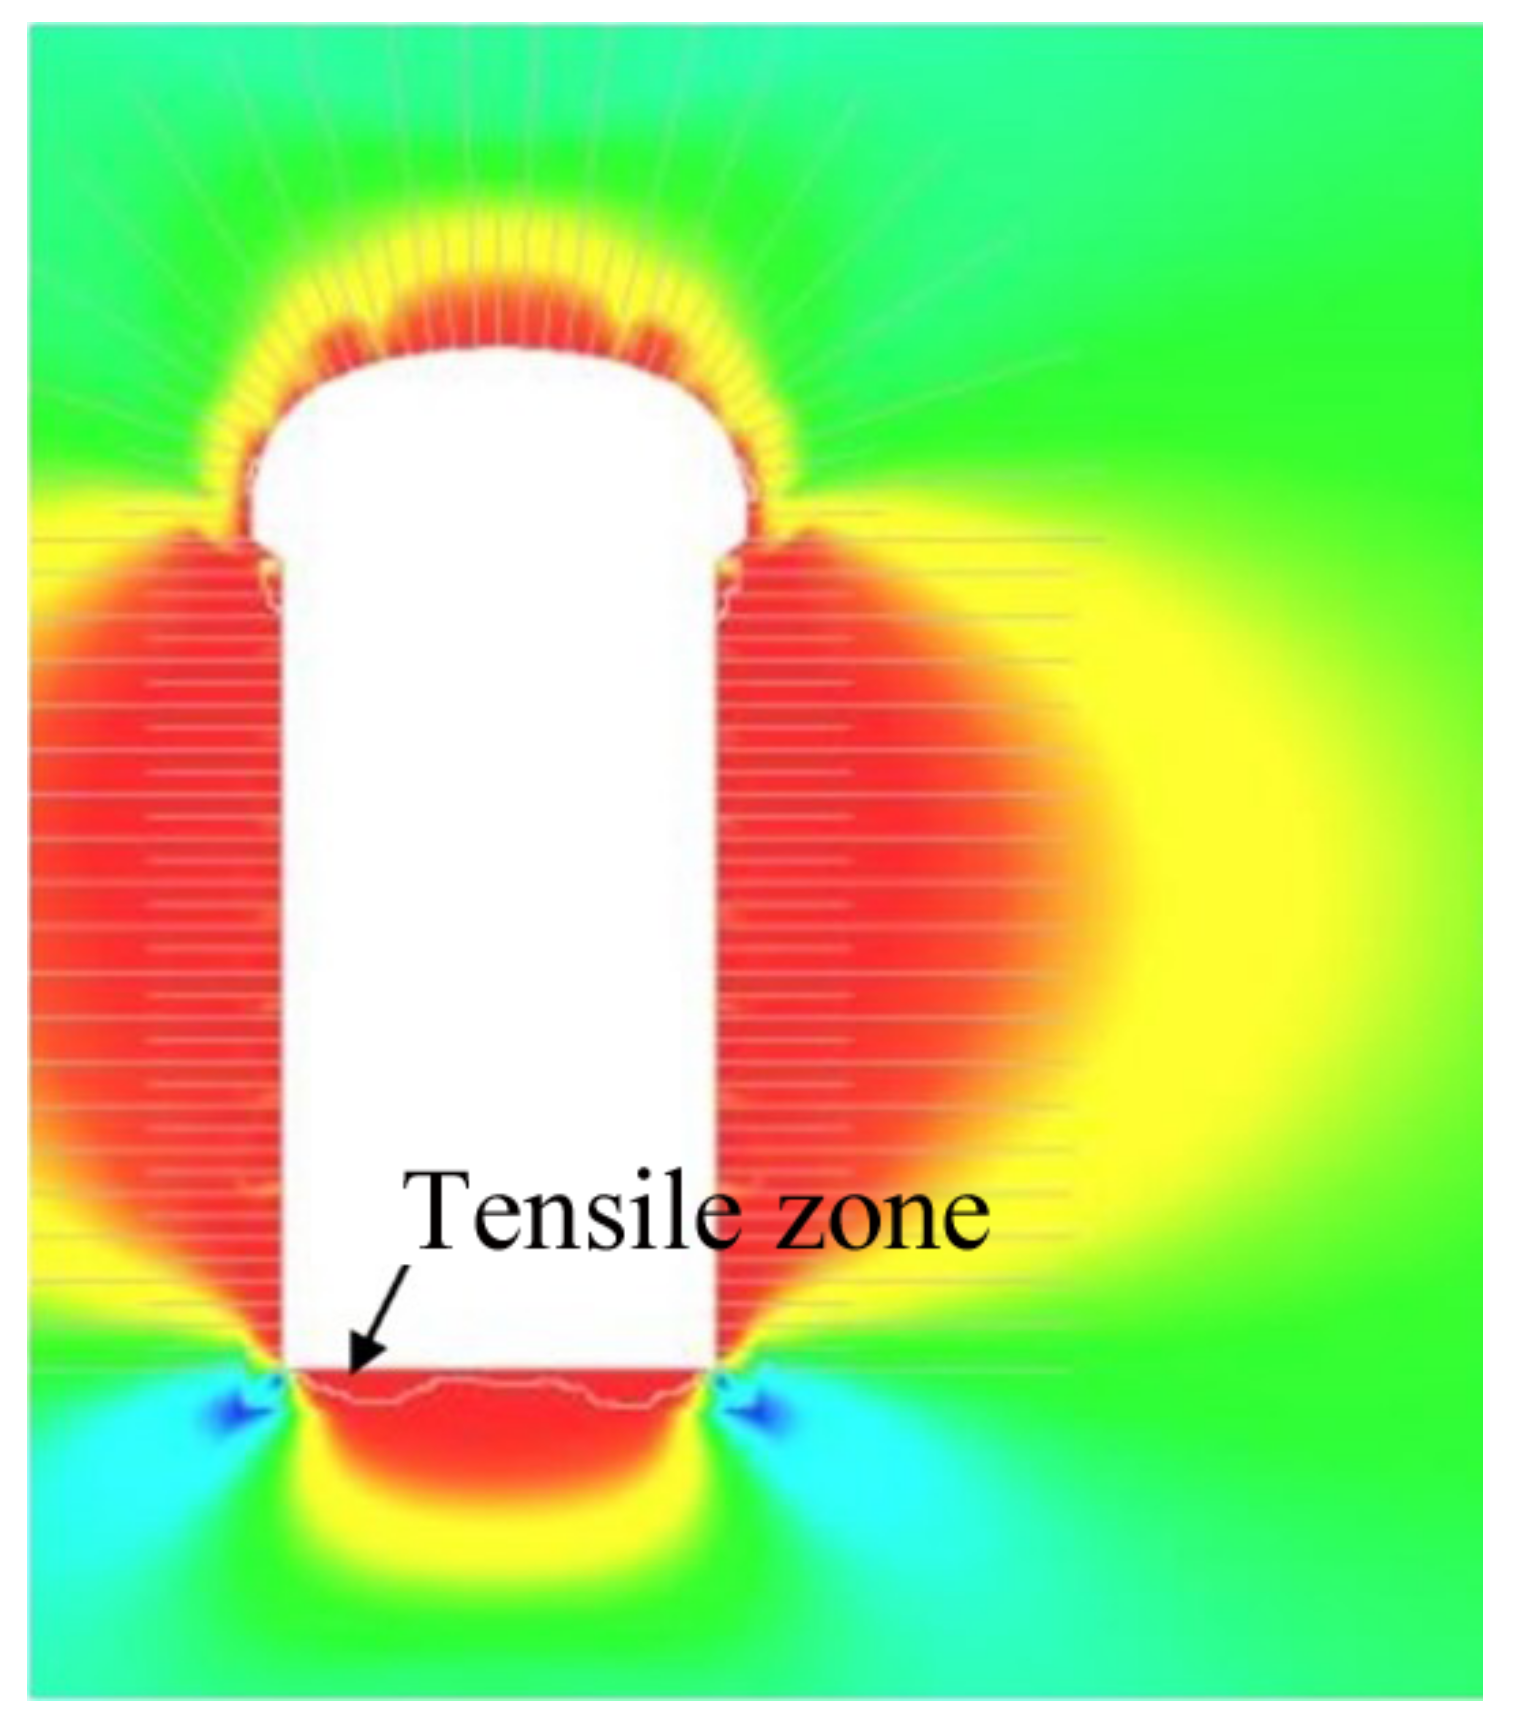
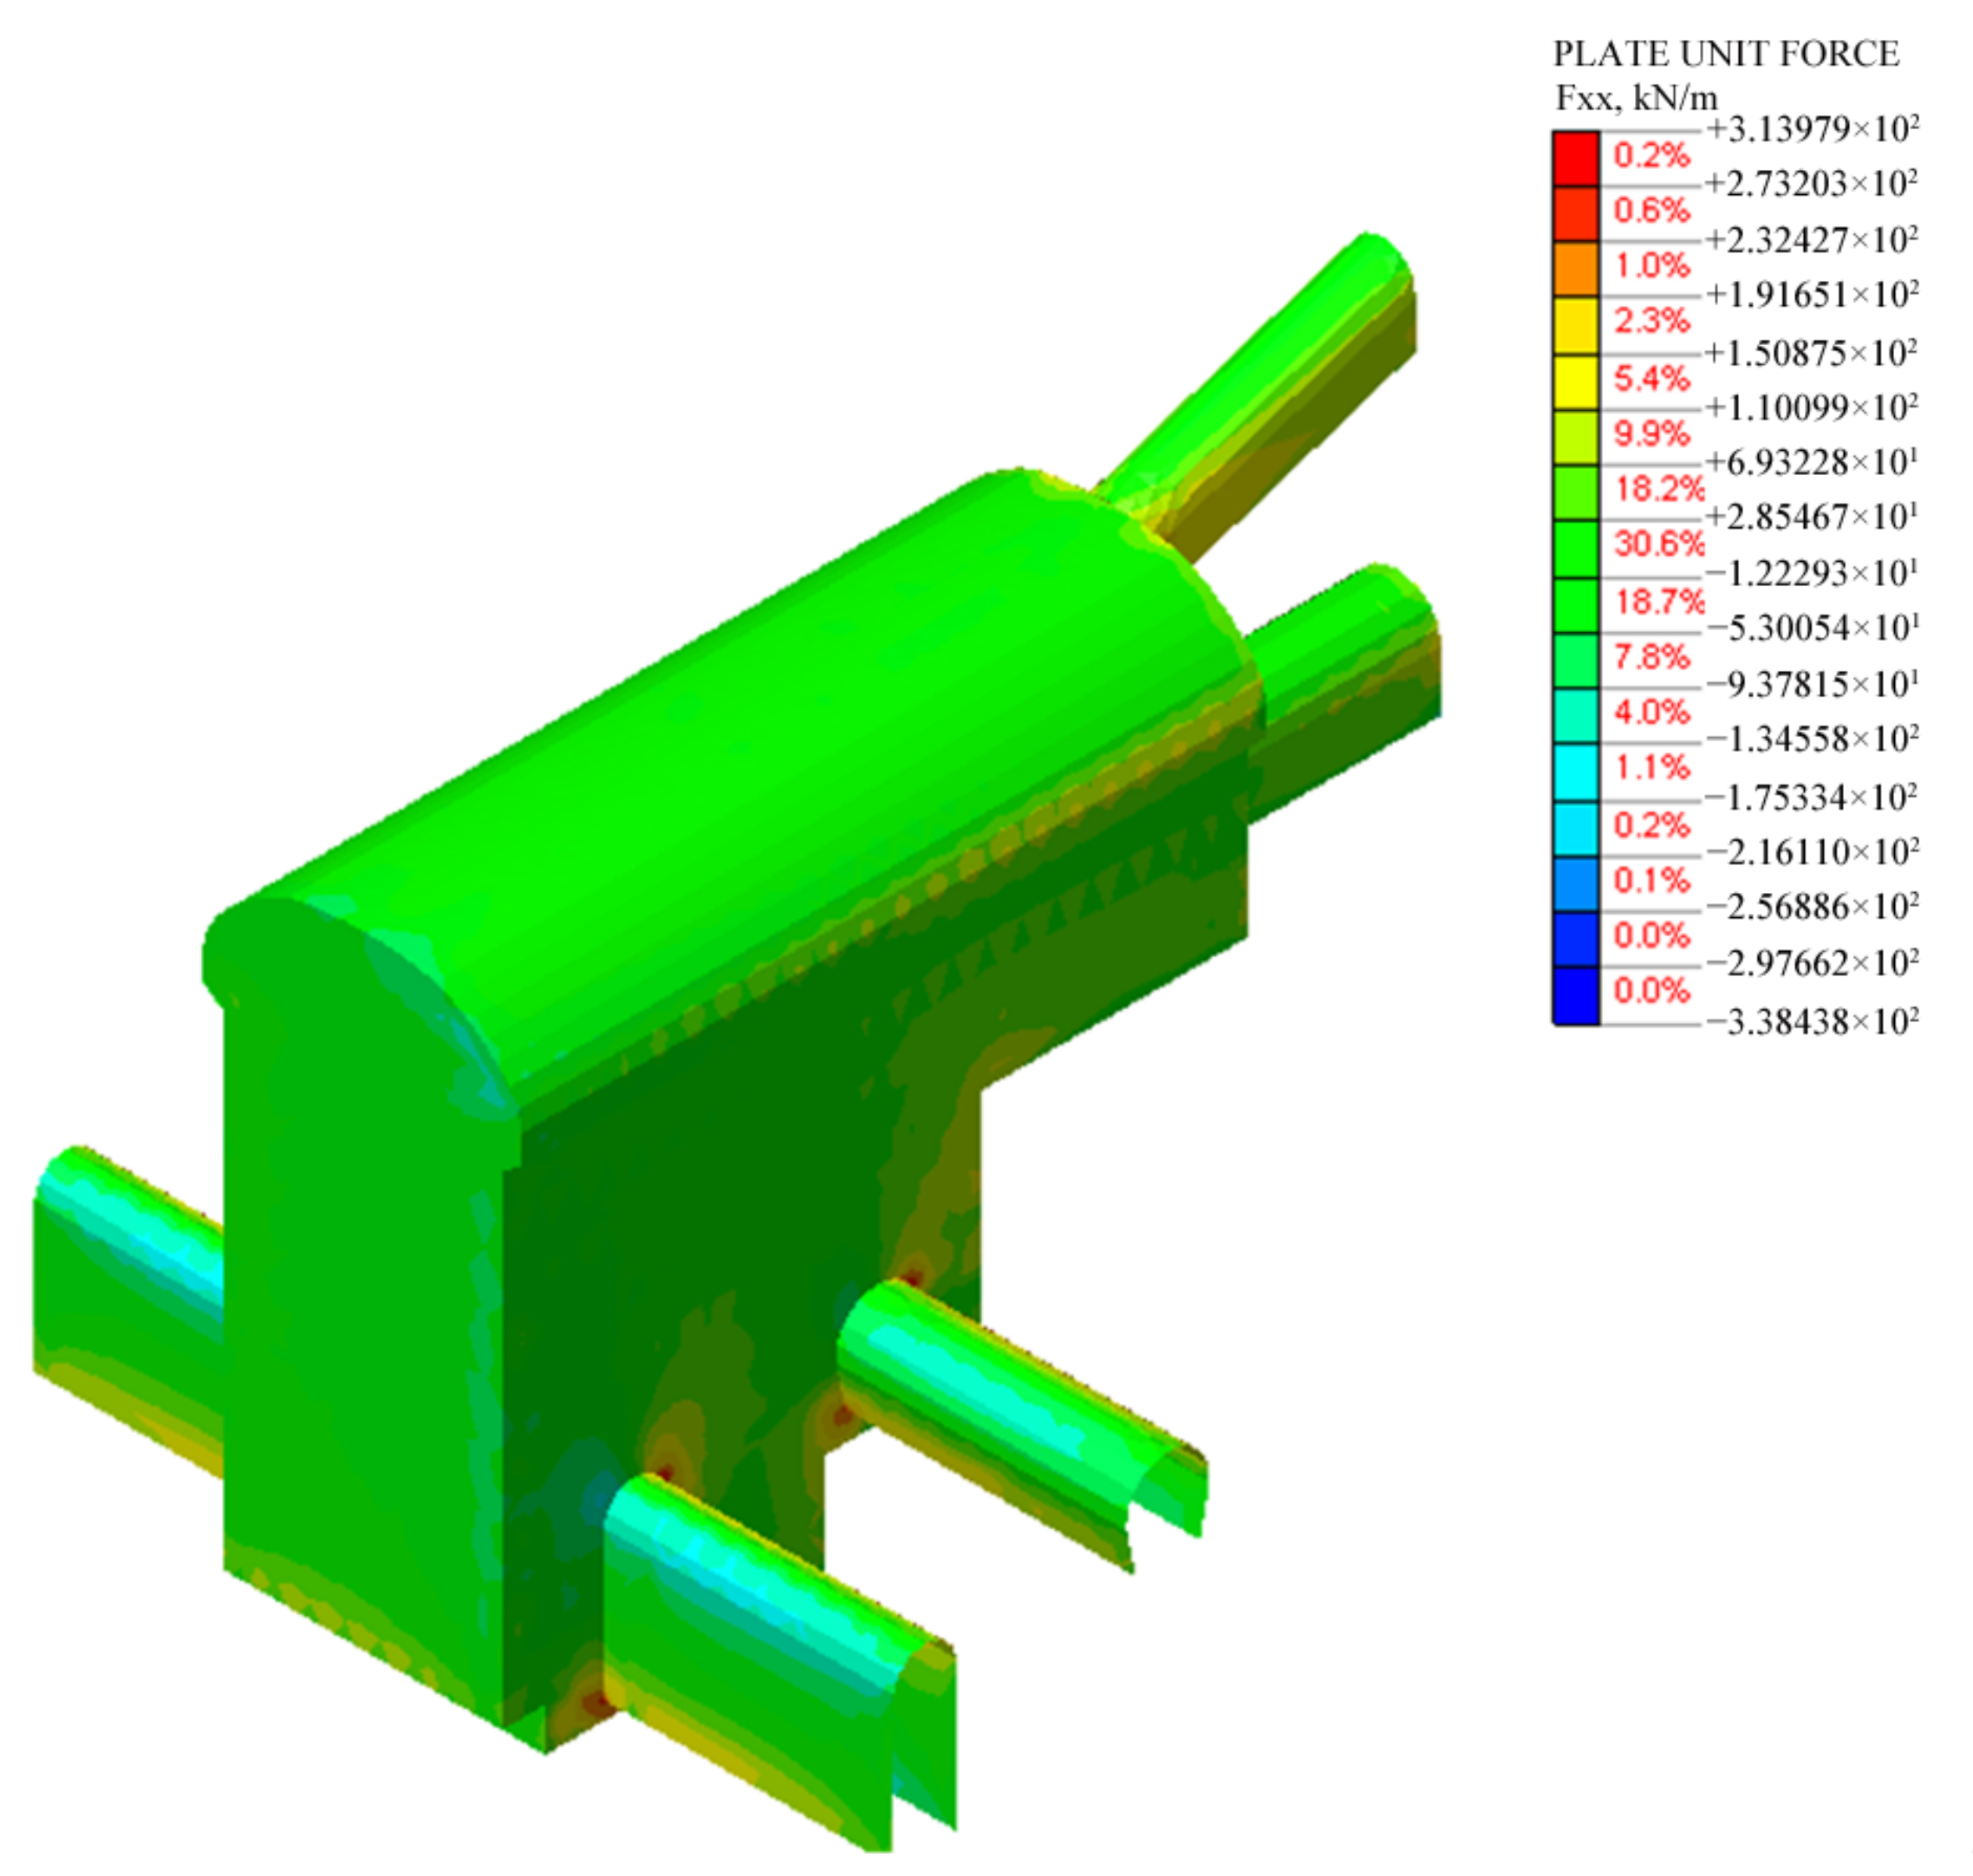
5.2. 3D Analyses
6. Concluding Remarks
Author Contributions
Funding
Institutional Review Board Statement
Informed Consent Statement
Data Availability Statement
Acknowledgments
Conflicts of Interest
References
- Hashash, Y.; Hook, J.; Schmidt, B.; Yao, J. Seismic design and analysis of underground structures. Tunn. Undergr. Space Technol. 2001, 16, 247–293. [Google Scholar] [CrossRef]
- Wang, W.; Wang, T.; Su, J.; Lin, C.; Seng, C. Assessment of damages in mountain tunnels due to the Taiwan Chi-Chi earthquake. Tunn. Undergr. Space Technol. 2001, 163, 133–150. [Google Scholar] [CrossRef]
- Lanzano, G.; Bilotta, E.; Russo, G. Tunnels under seismic loading: A review of damage case histories and Protection methods. In Workshop of Mitigation of the Earthquake Effects in Towns and in Industrial Regional Districts; University of Zagreb: Dubrovnik, Croatia, 2008; Volume 1971, pp. 1–10. [Google Scholar]
- Liu, J.W.; Wang, Z.M.; Xie, F.R.; Li, Y.J. Seismic Hazard and risk Assessments in North China Based on the Historical Intensity Observations. China Earthq. Eng. J. 2014, 36, 134–143. [Google Scholar]
- Zou, Y.; Jing, L.P.; Cui, J.; Li, Y.Q. Seismic Response Analysis of Box Tunnels in Saturated Sand. China Earthq. Eng. J. 2015, 37, 329–335. [Google Scholar]
- Zhao, K.; Wang, Q.Z.; Chen, Q.; Zhuang, H.Y.; Chen, G.X. Simplified effective stress modeling of shear wave propagation in saturated granular soils. Geotech. Lett. 2021, 11, 1–9. [Google Scholar] [CrossRef]
- Zhang, X.; Jiang, Y.J.; Sugimoto, S. Seismic damage assessment of mountain tunnel: A case study on the Tawarayama tunnel due to the 2016 Kumamoto Earthquake. Tunn. Undergr. Space Technol. 2018, 71, 138–148. [Google Scholar] [CrossRef] [Green Version]
- Callisto, L.; Ricci, C. Interpretation and back-analysis of the damage observed in a deep tunnel after the 2016 Norcia earthquake in Italy. Tunn. Undergr. Space Technol. 2019, 89, 238–248. [Google Scholar] [CrossRef]
- Dowding, C.H.; Rozen, A. Damage to rock tunnels from earthquake shaking. American Society of Civil Engineers. ASCE J. Geotech. Eng. Div. 1978, 104, 175–191. [Google Scholar] [CrossRef]
- John, C.M.; Zahrah, T.F. Aseismic design of underground structures. Tunn. Undergr. Space Technol. 1987, 2, 165–197. [Google Scholar] [CrossRef]
- Xiao, W.; Cheng, P. Review of seismic damage characteristics and influence factors of mountain tunnels. Arab. J. Geosci. 2022, 15, 478. [Google Scholar]
- Yu, H.T.; Chen, G. Pseudo-static simplified analytical solution for seismic response of deep tunnels with arbitrary cross-section shapes. Comput. Geotech. 2021, 137, 104306. [Google Scholar] [CrossRef]
- Yang, J.; Zhuang, H.Y.; Wang, W.; Zhou, Z.; Chen, G.X. Seismic performance and effective isolation of a large multilayered underground subway station. Soil Dyn. Earthq. Eng. 2021, 141, 106560. [Google Scholar]
- Tiwari, R.; Lam, N. Displacement based seismic assessment of base restrained retaining walls. Acta Geotech. 2022, 1–20. [Google Scholar] [CrossRef]
- Zhuang, H.Y.; Yang, J.; Chen, S.; Dong, Z.; Chen, G.X. Statistical numerical method for determining seismic performance and fragility of shallow-buried underground structure. Tunn. Undergr. Space Technol. 2021, 116, 104090. [Google Scholar] [CrossRef]
- Conte, E.; Pugliese, L.; Troncone, A. Earthquake-induced permanent displacements of embedded cantilever retaining walls. Géotechnique 2022, 21, 1–10. [Google Scholar] [CrossRef]
- Miao, Y.; He, H.; Liu, H.; Wang, S. Reproducing ground response using in-situ soil dynamic parameters. Earthq. Eng. Struct. Dyn. 2022, 1–17. [Google Scholar] [CrossRef]
- Hoek, E.; Brown, E.T. Practical estimates of rock mass strength. Int. J. Rock Mech. Min. 1997, 34, 1165–1186. [Google Scholar] [CrossRef]
- ISRM. ISRM suggested methods for rock stress estimation. Int. J. Rock Mech. Min. Sci. 2003, 40, 991–1025. [Google Scholar] [CrossRef]
- Barla, G.; Fava, A.; Peri, G. Design and construction of the Venaus powerhouse cavern in calcschists. Geomech. Tunn. 2008, 1, 400–406. [Google Scholar] [CrossRef]
- CEN. Eurocode 8: Design of Structures for Earthquake Resistance: Part 1: General Rules, Seismic Actions and Rules for Buildings; European Committee for Standardization: Brussels, Belgium, 2004. [Google Scholar]
- Reiter, L. Earthquake Hazard Analysis—Issues and Insights; Columbia University Press: New York, NY, USA, 1990; Volume 254. [Google Scholar]
- Midas-GTS. Geotechnical and Tunnel Analysis System; Midas Information Technology Co., Ltd.: Seongnam, Korea, 2010. [Google Scholar]
- Day, R.A.; Potts, D.M. Zero thickness interface elements-numerical stability and application. Int. J. Numer. Anal. Method Geomech. 1994, 18, 689–708. [Google Scholar] [CrossRef]
- Kuhlmeyer, R.L.; Lysmer, J. Finite element method accuracy for wave propagation problems. ASCE J. Soil Mech. Found. Div. 1973, 99, 421–427. [Google Scholar] [CrossRef]
- Zhao, K.; Wang, Q.Z.; Zhuang, H.Y.; Li, Z.Y.; Chen, G.X. A fully coupled flow deformation model for seismic site response analyses of liquefiable marine sediments. Ocean Eng. 2022, 251, 111144. [Google Scholar] [CrossRef]
- Perino, A. Wave Propagation through Discontinuous Media in Rock Engineering. Ph.D. Thesis, Politecnico di Torino, Turin, Italy, May 2011. [Google Scholar]


| Deformation Modulus (GPa) | Possion’s Ratio | Intact Rock Compressive Strength (MPa) | Hoek–Brown Model | ||||
|---|---|---|---|---|---|---|---|
| Undisturbed | Disturbed | ||||||
| Undisturbed | Disturbed | m | s | m | s | ||
| 22 | 14 | 0.25 | 72.3 | 1.18 | 0.012 | 0.28 | 0.002 |
| 6.11 | 6.05 | 10.58 | 1.38 | −1.87 | −1.23 | 11.8 | 6.4 | 4.8 |
| F0 | ag (g) | TB (s) | TC (s) | TD (s) | S | η |
|---|---|---|---|---|---|---|
| 2.462 | 0.134 | 0.088073 | 0.264218 | 2.137759 | 1 | 1 |
| Code | Acc. | Name | Distance | Date | Mb | ML | MS | MW |
|---|---|---|---|---|---|---|---|---|
| 410Y | A1 | Golbasi (Turkey) | 29 | 5 May 1986 | 5.7 | 5.90 | ||
| 428X | A2 | Aetolia (Greece) | 23 | 18 May 1988 | 5.4 | 5.3 | 5.00 | |
| 594X | A3 | Apennines | 11 | 26 September 1997 | 5.7 | 5.8 | 5.90 | 5.7 |
| 765Y | A4 | Apennines | 11 | 12 October 1997 | 5.2 | 5.1 | 5.20 | 5.3 |
| 854X | A5 | Apennines | 21 | 3 April 1998 | 5.1 | 5.2 | 4.80 | 5.1 |
| 858X | A6 | Apennines | 36 | 3 April 1998 | 5.1 | 5.2 | 4.80 | 5.1 |
| 1314Y | A7 | Athens (Greece) | 23 | 7 September 1999 | 5.8 | 5.60 | 5.9 |
Publisher’s Note: MDPI stays neutral with regard to jurisdictional claims in published maps and institutional affiliations. |
© 2022 by the authors. Licensee MDPI, Basel, Switzerland. This article is an open access article distributed under the terms and conditions of the Creative Commons Attribution (CC BY) license (https://creativecommons.org/licenses/by/4.0/).
Share and Cite
Lv, Y.; Wang, L.; Chen, Y.; Gong, L.; Li, S. Seismic Response Analyses of a Large-Span Powerhouse Cavern Considering Rock–Structure Interaction. Appl. Sci. 2022, 12, 6649. https://doi.org/10.3390/app12136649
Lv Y, Wang L, Chen Y, Gong L, Li S. Seismic Response Analyses of a Large-Span Powerhouse Cavern Considering Rock–Structure Interaction. Applied Sciences. 2022; 12(13):6649. https://doi.org/10.3390/app12136649
Chicago/Turabian StyleLv, Yumei, Lichuan Wang, Yu Chen, Lun Gong, and Shibo Li. 2022. "Seismic Response Analyses of a Large-Span Powerhouse Cavern Considering Rock–Structure Interaction" Applied Sciences 12, no. 13: 6649. https://doi.org/10.3390/app12136649
APA StyleLv, Y., Wang, L., Chen, Y., Gong, L., & Li, S. (2022). Seismic Response Analyses of a Large-Span Powerhouse Cavern Considering Rock–Structure Interaction. Applied Sciences, 12(13), 6649. https://doi.org/10.3390/app12136649