Abstract
Age prediction from X-rays is an interesting research topic important for clinical applications such as biological maturity assessment. It is also useful in many other practical applications, including sports or forensic investigations for age verification purposes. Research on these issues is usually carried out using high-resolution X-ray scans of parts of the body, such as images of the hands or images of the chest. In this study, we used low-resolution, dual-energy, full-body X-ray absorptiometry images to train deep learning models to predict age. In particular, we proposed a preprocessing framework and adapted many partially pretrained convolutional neural network (CNN) models to predict the age of children and young adults. We used a new dataset of 910 multispectral images that were weakly annotated by specialists. The experimental results showed that the proposed preprocessing techniques and the adapted approach to the CNN model achieved a discrepancy between chronological age and predicted age of around 15.56 months for low-resolution whole-body X-rays. Furthermore, we found that the main factor that influenced age prediction scores was spatial features, not multispectral features.
1. Introduction
Dual-energy X-ray absorptiometry (DXA) is the most widely used clinical tool to diagnose osteoporosis. It permits a precise in vivo quantification of mineralization in bones surrounded by soft tissue. DXA utilizes two different X-ray energies in order to separate bone from soft tissue. The lower-energy beam is preferentially attenuated by bone; however, the contributions of soft tissue to beam attenuation can be mathematically derived. Radiation exposure to the patient is very small, usually of a magnitude similar to daily background radiation. Older generation DXA scanners provided low-resolution images that were solely used for patient positioning verification or regions of interest (ROI) placement. The obtaining of images of much better quality from modern DXA scanners has led to the development of many new diagnostic applications, such as the trabecular bone score or vertebral morphometry [1].
Special DXA protocols permit the quantification of bone mineralization, fat mass, and fat distribution. Improving the image quality and shortening the scanning time allows a full-body scan to be performed and to quantify its components. Contemporary DXA images of the full-body, containing information about the quantity and spatial distribution of body components, opens the field for research on the new use of this old method.
This work is part of a larger project that addresses the following research question: how deep learning methods could improve the diagnostic knowledge extraction from whole-body, low resolution, dual-energy X-ray absorptiometry data, potentially related to a lower radiation dose for patients. Related diagnostic knowledge could be represented in many forms. For example, it could be organized as a set of parameters that include bone density (e.g., bone mineral density (BMD), bone mineral content (BMC)), fat density, muscle density, osteoporosis scores, bone age, etc. The scanners used for testing allow a digital version of the image to be obtained, but it is only used to check correct positioning of the patient setting and correct placement of the regions of interest (ROI). The bone density results are computed by specialized software based on the X-ray attenuation data that the detector receives. For BMD measurement, it is important to eliminate soft tissue input, a measurement based on bone alone. This is possible by scanning at two different X-ray photon energies, followed by mathematical manipulation of the recorded signal; different attenuations for bones and soft tissues at different photon energies are used. Furthermore, the radiation dose for DXA is considerably lower than the radiation dose for conventional radiography. Many other information and dependencies can be extracted from such images that are not used in determining BMD. Many researchers focus on extracting information from DXA and X-ray images.
In [2] the authors presented a study that described the comparison of the use of DXA images together with X-ray images to assess bone age in children using the Bland and Altman statistical methods. A high agreement was obtained between the bone age assessments performed by DXA and the X-ray. Other studies also considered the problem of using statistical methods, this time involving only BMD measurements. Castillo et al. in [3] investigated whether there were correlations between age and gender and BMD, and whether you could use this solution in forensic anthropology. The research was carried out on 70 subjects and showed bone mineral density to be a useful technique for gender and age data in forensic anthropology. Neural networks can also be used to analyze X-ray images. Navega et al. in [4] used neural networks to create a method to estimate age at death. The data sample consisted of 100 femora of female individuals. The authors used a modified general regression neural network as a model for age prediction. Using a nonprobabilistic artificial neural network, the mean absolute difference achieved between the real and estimated age ranged from 9.19 to 12.03 years, depending on the variables used in the modelling. The use of classic X-ray images is also applicable. Lee et al. in [5] proposed using hand X-ray images to predict bone age. The images were preprocessed (region of interest (ROI) segmentation, standardization and preprocessing of input radiographs) and analyzed by the neural network, GoogLeNet. The solution was validated using 8325 data samples. The accuracy achieved by the classification model was within 2 years (<98%) and within 1 year (<90%) for a group of women and men. A similar solution was presented by Iglovikov et al. in [6]. Bone age prediction was performed using a database provided by the Radiological Society of North America (RSNA). Initially, the images were processed: hand masks were extracted and all other objects were removed (using positive mining utilizing U-Net architecture), key points were detected, and the hands were placed on the images in one orientation and size (network inspired by the VGG model). Bone age assessment was performed using two types of convolutional neural network (CNN), regression and classification, as well as image division into three areas (whole hand, carpal bones, metacarpals, and proximal phalanges). The smallest mean absolute error (MAE) was obtained for the ensemble of classification and regression models and the ensemble of regional models. This solution had the best accuracy with an MAE equal to 6.10 months. Human age can also be estimated on the basis of chest images using CNNs. In solution [7], Karargyris et al. created such a solution based on the DenseNet-169 model, which was pretrained on ImageNet. They used the Chest X-ray dataset from the National Institutes of Health, which includes 10,000 chest images from 30,000 different people. They obtained the following results: for a margin of ±4 years, a sensitivity equal to 0.6745 and for ±9 years the value was −0.9441. Similarly, Xue et al. [8] used X-rays to classify gender. The dataset contained 2066 chest X-ray images (1097 women and 969 men). The images were preprocessed and then the features were extracted from them using the following neural networks: AlexNet, VggNet, GoogLeNet, and ResNet (for comparison). The classification was carried out using a support vector machine (SVM) and a random forest. The best result was obtained for the VGGNet-16 + SVM classifier, which had an accuracy of 86.6% with 5 times cross-validation. The VGGNet-16 is a version of VGG family of models (Visual Geometry Group, from the Department of Science and Engineering of Oxford University) with 16 layers (13 convolutional layers and 3 dense layers). Spine X-ray images can also be used to classify gender. Xue et al. in [9] developed a sequential CNN model, trained from scratch using spine images. An accuracy of 88.9% was obtained for the original spine images. Data analysis using the DenseNet-121 model pre-overtrained in the ImageNet data range gave an accuracy of 99% for cervical images and 98% for lumbar images. In [10] Marouf et al. proposed a hybrid methodology for gender classification and bone age estimation, using the trained VGG-16 model and the RSNA dataset. They achieved an accuracy of 99% for the gender classification and for age classification they achieved an MAD 0.50 years and an RMS of 0.67 years. In [11] Mumtaz et al. proposed to examine a method based on CNNs and left-hand radiographs of children to determine gender. Using class activation mapping (CAM) they showed that the lower part of the palm around the wrists (wrist) was more important in determining the gender of the child. The model accuracy was 98%, given the unfinished skeleton of the children. Age can also be determined from whole-body CT scans. In [12], Nguyen et al. presented a solution based on deep hierarchical features. They used data from an anonymous hospital that contained 813 whole-body CT bone images. They tested the fine-tuned VGGNet, ResNet, and GoogLeNet models and a modified model, which was based on VGGNet for automatic BAA. The best result was achieved for modified VGGNet with hierarchical features, which had an MAE of 4.856 months. Castillo et al. proposed a model for predicting bone age based on the VGG16 with an attention mapping-focused architecture. Using the RSNA dataset [13] they achieved an MAE equal to 11.45 months for both genders. Liu et al. evaluated a proposed two-stage bone age assessment network with ranking learning using the same dataset. They achieved an average MAE of 6.05 months [14]. Salim and Hamza introduced a two-stage approach for bone age assessment using segmentation and ridge regression [15]. The MAE of the proposed solution was equal to 6.38 months.
Here, we focused on age prediction for children and young adults from dual-energy X-ray images. This could be important in many applications, including in the proper assessment of a child’s development. The agreement between chronological age and developmental advancement is an important indicator of the health condition of children. However, under pathological conditions, age predictions based on other methods (e.g., bone age) may better reflect biological maturity [16]. In this work, our contributions were as follows:
- We built a dataset of low-resolution, dual-energy X-ray absorptiometry images with annotations performed by specialists. This was probably one of the first datasets containing whole-body, dual-energy X-ray absorptiometry images (to the best of our knowledge).
- We proposed a CNN-based age prediction framework for low-resolution, whole-body, dual-energy X-ray absorptiometry images.
- As a result of our experiments, we demonstrated that age could be successfully predicted from low-resolution images, so potentially even less radiation energy could be used at the data-acquisition phase.
2. Materials and Methods
2.1. Data Acquisition
All data used in this study were obtained from the Hologic QDR 4500 X-ray Bone Densitometer (Hologic Inc., Marlborough, MA, USA). This model has a single switched pulse, dual-energy X-ray tube operating at 100 and 140 kVp. The average tube current is equal to 5 mA at a 50% duty cycle. It can be used to scan the lumbar spine (in anterior-posterior and lateral projections), the proximal femur, and the whole body. The maximum scan area is 195 cm × 65 cm. Each original sample generated by this device contains high- and low-resolution data. In this study we focused on raw, low-resolution, whole-body data. Each sample contained six images that were not preprocessed, corresponding to high- and low-energy beams passing through a rotating drum filter with three different segments that had radio-opacities equivalent to tissue, bone, and air and then a patient (Figure 1). In the remaining part of the paper, we refer to these by combining the keywords of energy level and the segment of the drum filter (e.g., the low bone image corresponds to low energy passing through the segment of the filter with radio-opacities equivalent to bone). The height of the low-resolution images was variable from 84 to 128 pixels. The width was constant and was equal to 106 pixels.
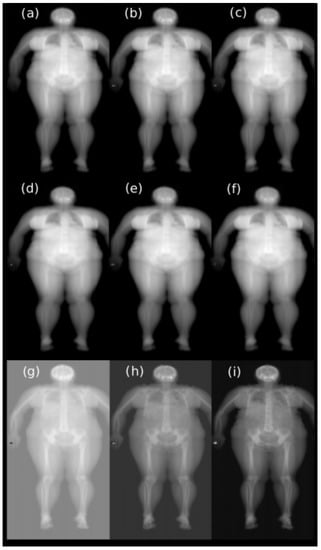
Figure 1.
The first six images correspond to low- and high-energy beams passing through different segments of the filter and the patient: (a) low air, (b) low tissue, (c) low bone, (d) high air, (e) high tissue, (f) high bone. Images (g–i) are a result of the subtraction of high-energy images from low-energy images.
2.2. Dataset
The dataset consisted of 1455 samples of the full body DXA scan, but according to the objective of this study we only used examples from young subjects (patients up to 230 months old at the time of the DXA scan). After reduction, the dataset included 910 samples, 570 for males and 370 for females (the mean age was equal to 140.4 ± 42.1 months). This dataset is referenced further in the text as the DXA dataset. Considering a small number of samples, the influence of data augmentation on the analyzed deep learning models was tested. The data augmentation operations (selected experimentally) were rotation of the image by an angle of 0 to 5 degrees and random horizontal flip of the image. The augmented dataset is further referenced in the text as the augDXA dataset. The age of the subjects at the time of the DXA scan, which was used as labels, was determined by subtracting the birth date from the date of the DXA scan. All retrospectively used clinical and image data were collected from 2015 to 2020 at Gdansk Medical University. The use of DXA scans in the study was approved by the Independent Bioethics Committee for Scientific Research at the Medical University of Gdańsk.
To obtain an appropriate representation of the data in the training and validation sets, the samples were categorized by age of the subject as follows: group 1—age from 0 to 96 months (170 samples), group 2—age from 97 to 132 months (215 samples), group 3—age from 133 to 156 months (177 samples), group 4—age from 157 to 180 months (168 samples), and group 5—age from 181 to 230 months (184 samples), see Figure 2. The samples in all groups were proportionally divided into a training set (80%) and a validation set (20%) in a five-fold cross-validation experiment. Validation samples were not used during the training. The validation set was used as a test set (during the training the validation set was used only to monitor the training process, it was not used in any decision making, e.g., early stopping, etc.).
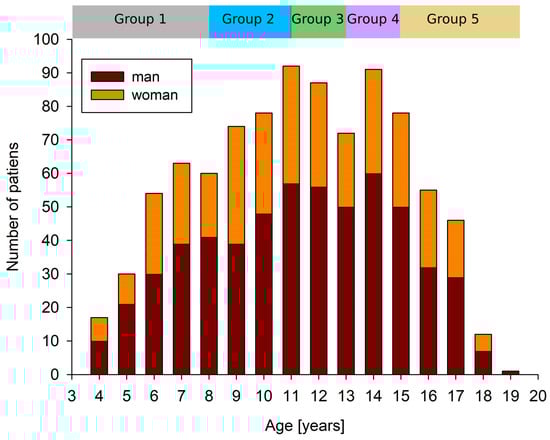
Figure 2.
The data in groups with a similar number of samples were divided proportionally into training and validation datasets based on age.
Data Preparation
Three different variants of the three-channel images were investigated. In the first case the arrays corresponding to high energy were subcontracted from arrays corresponding to low energy for each filter. In the second case, the three-channel images were assembled from the low- and high-energy arrays separately. In the third variant, the images were assembled from three copies of the same array (e.g., three copies of a low tissue array).
Next, in all cases, the obtained images were normalized globally to a value from −1 to 1, channel-wise. The normalization range was selected on the basis of the model used. Lastly, the images were cropped symmetrically and padded to a size of pixels. Each channel of a single image was padded with a constant value equal to the mean of 24 pixels selected from the background image.
2.3. Tested Model and Training Procedure
In our study we adopted different base models (MobileNetV2 [17], VGG16 [18], InceptionV3 [19], ResNet50V2 [20], and InceptionResNetV2 [21]) without top layers, loaded with ’ImageNet’ weights and added layers (Figure 3). Added layers included the following: a global average pooling layer (GA) or depthwise convolution layer (DW) with a or a filter (depending on the base model), two dropout layers with a 0.35 dropout parameter, a dense layer with 128 filters, and a regression layer with 1 filter. The ReLU activation function was used in both the convolution layers and the linear activation function was used in the depthwise convolution layer. The number of convolutional and dropout layers, as well as the number of filters and dropout parameters, were selected after multiple experiments. The loss function was defined as the mean square error, and the metric as the mean absolute error.

Figure 3.
Scheme of proposed models used in the study. A preprocessed input image was first processed by the base model. Five different base models were investigated as indicated by the blue block. Features extracted by the base model were provided as an input for the head model. The first layer of the head model was either depthwise convolution or global average pooling. Both methods were investigated together with the fixed set of remaining layers of the head model presented in the figure.
The first experiment (Experiment I) consisted of a five-fold cross-validation using different base models with added layers and the DXA dataset. In the second experiment (Experiment II), the influence of data augmentation on the selected model (MobileNetV2 DW) was evaluated. In both experiments, the number of epochs was set to 200, and the base learning rate was set to 0.0001. All layers in the base models were frozen. The number of parameters in each model is presented in Table 1. In the third experiment (Experiment III), we evaluated the one selected model on the RSNA 2017 [22] bone age dataset. The depthwise convolution layer was adjusted to larger images ( filter), and the number of epochs was reduced to 50. Additionally, we evaluated the model presented in [13] (the attention-based model) using the DXA and augDXA datasets. The images were padded to pixels and the model was adapted to the same size. In the fourth experiment (Experiment IV), we investigated whether the usage of the DXA images improved prediction of age in comparison to single-energy X-ray images. For this purpose, the five-fold cross-validation (the MobileNetV2 DW model) was conducted using the images obtained by concatenating the low- and high-energy arrays separately. Similarly, the images consisting only of the copies of arrays corresponding to low/high energy passing one of the filters were tested. All calculations were performed at the NVIDIA DGX-1 station available at the AI Living Lab, Gdansk University of Technology.

Table 1.
Number of parameters for each of the adapted models.
3. Results
The performance of each model was evaluated with the mean absolute error (MAE) [23] expressed in months. For each fold, the experiment was conducted five times and the mean MAE value and related standard deviation were calculated. Additionally, the mean MAE value and standard deviation were calculated for all folds. The vanilla gradient method [24] was used to inspect the resulting models, in which body parts were processed to obtain the final regression results. To use the vanilla gradient method, the regression model (MobileNetV2 DW) was converted to a classification model.
3.1. Experiment I—DXA Dataset
The results of Experiment I are presented in Table 2. The best mean result was achieved for the MobileNetV2 DW model. The calculated average MAE ranged from 13.39 months to 16.67 months (the mean MEA was equal to 15.56 months). The lowest standard deviation calculated for all folds was achieved for the ResNet50V2 DW model (−0.58 months). It is important to underline that the mean MAE obtained for the MobileNetV2 DW was lower by 1.52 months than that for MobileNetV2 GA. Figure 4 shows the learning curves for MobileNetV2 DW.
Table 2.
Average values and standard deviations of MAE obtained in Experiment I—different models, DXA dataset. The mean MAE and standard deviation in the last row were calculated from all folds.
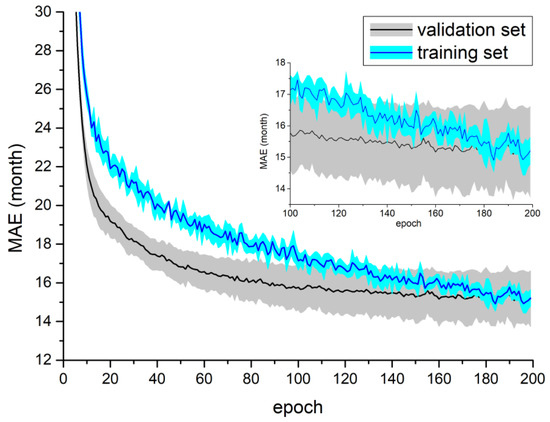
Figure 4.
Training process for the MobileNetV2 DW model using the DXA dataset. Both figures present mean and standard deviation calculated from all folds in a single test. The top right part of the figure shows the scaled part of the plot for the last 100 epochs.
3.2. Experiment II—augDXA Dataset
The results of Experiment II are presented in Table 3. After data augmentation, improvement could be observed (a decrease in the average MAE up to 1.2 months) for each fold with the exception of the first (the model MobileNetV2 DW).The calculated average MAE ranged from 13.77 months to 15.82 months (the mean MEA was equal to 15.02 months). Figure 5 shows the learning curves for the model MobileNetV2 DW using the augDXA dataset.
Table 3.
Average values and standard deviations of MAE obtained in Experiment II—MobileNetV2 DW model, augDXA dataset. The mean MAE and standard deviation in the last row were calculated from all folds.
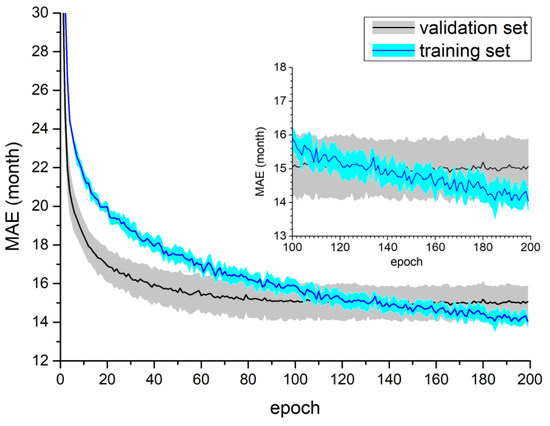
Figure 5.
Training process for the MobileNetV2 DW model using the augDXA dataset. Both figures present mean and standard deviation calculated from all folds in a single test. The top right part of the figure shows the scaled part of the plot for the last 100 epochs.
3.3. Experiment III—RSNA 2017 Challenge Dataset and Attention Model
The results of Experiment III are presented in Table 4. The MobileNetV2 DW model obtained a mean MAE equal to 16.29 months using the RSNA 2017 dataset. Figure 6 shows the learning curves for the MobileNetV2 DW model for the RSNA 2017 dataset. The attention-based model achieved a mean MAE that was equal to 19.48 months for the DXA dataset and 17.05 months for the augDXA dataset. It should be noted that the mean MAE obtained for the attention-based model (the DXA dataset) was greater by 3.92 months than the MobileNetV2 DW model. The learning curves are shown in Figure 7—the temporal increase in MAE for the validation dataset can be observed after the fourth epoch.
Table 4.
Mean values and standard deviations of MAE obtained in Experiments I, II, and III.
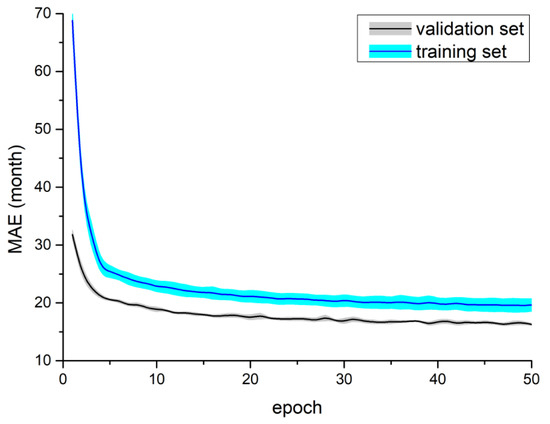
Figure 6.
Training process for the MobileNetV2 DW model using the RSNA 2017 challenge dataset—mean and standard deviation calculated from five tests.
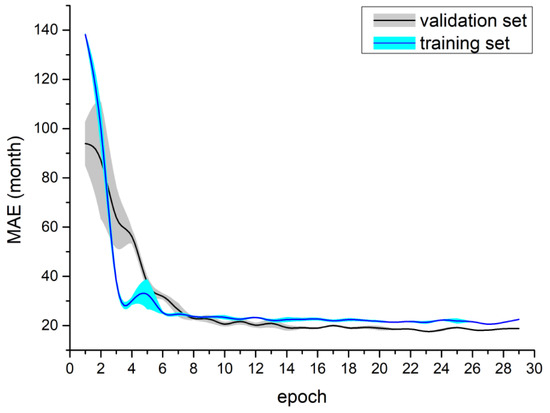
Figure 7.
Training process for the attention model using the DXA dataset—mean and standard deviation calculated from five tests.
3.4. Experiment IV—The Single Energy X-ray Images
The results of Experiment IV are presented in Table 5. Regardless of the type of image used in the prediction, the obtained values of mean MAE and standard deviation differed only slightly (the maximum difference in mean MAE was equal to 0.5 months).
Table 5.
Mean values and standard deviations of MAE obtained in Experiment IV—MobileNetV2 DW, different images.
3.5. Vanilla Gradient
The results of the vanilla gradient algorithm are shown in Figure 8. Analyzing the results of the algorithm, it could not be clearly stated which body parts were processed to obtain the final classification result, but it was noted that the features determining the classification of the DXA image were mostly within the outline of the body. This confirmed that the model predicted, based on the image of the human body, not the background.
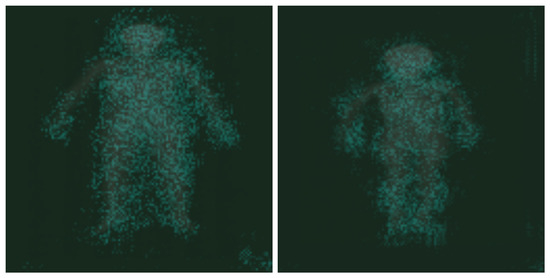
Figure 8.
The results of the vanilla gradient algorithm were placed on top of the original image, and its colour was changed to teal.
4. Discussion
The proposed solution achieved satisfying results for the age estimation using the full-body, low-resolution DXA scan with a mean MAE equal to 15.56 months. First, the results obtained were the best among all evaluated models. Second, obtaining an MAE = 0 was not expected due to differences in the body development of young subjects (including pathological changes). For example, hypothyroidism delays skeletal development and thyrotoxicosis accelerates bone maturation [25]. The analyses of samples with greater differences between actual and predicted age could, for example, indicate a connection between the MAE and different disorders, such as the bias in bone mineralization during maturation. Therefore, the difference between chronological age and DXA-related biological age could be potentially important for diagnostics purposes [25,26].
It it necessary to point out that the prediction of age using single X-ray and DXA images yielded similar results. This might suggest that spatial (geometrical) features are the dominant factor in age prediction using the investigated CNNs. The results of the vanilla gradient algorithm seemed to confirm this statement, as the distribution of the points of interest, though not perfectly even, lacked any clusters. The issues related to the connection of DXA images and different parameters (e.g., BMD) will be the subject of future work.
Different configurations of the models were investigated. Firstly, we investigated different base models, which proved to be efficient for other computer vision tasks in healthcare (MobileNetV2 [17], VGG16 [18], InceptionV3 [19], ResNet50V2 [20], and InceptionResNetV2 [21]). All of these base models showed similar results. However, introducing the depthwise convolution layer instead of the global pooling layer improved the model quality, reducing the MAE value by 1.52 months. Investigated data-augmentation methods also reduced the MAE value (by 0.54 months).
The proposed framework was compared with known experiments for the RSNA 2017 dataset. The result of the cross-check analysis showed the importance of adjusting model architecture to the analyzed dataset. For example, the validation results of the retrained attention-based model [13] for our dataset showed much worse results than for the proposed model. The difference in the related mean MAE values was approximately 4 months. In the cross-check we validated our framework for the RSNA 2017 dataset. The results obtained were worse by less than 5 months (mean MAE value). Other different models were proposed for the RSNA 2017 dataset. For example, in [14] the authors achieved a mean MAE equal to 6.05 months. In another paper [15] authors obtained mean MAE equal to 6.38. However, it is important to underline that the images in the RSNA 2017 dataset had a minimal resolution pixels and represented a slightly different domain (only the hand). For comparison purposes only, the size of the hand in images used for this study was, e.g., about pixels.
For the MobileNetV2 DW model, the list of five samples from the validation set with the greatest MEA was determined for each fold in two out of five repetitions of Experiment I (a total of 25 samples—14 females and 11 males). In both repetitions, exactly the same samples were determined, although their position on the list was different (with the exception of the sample with the greatest MEA for each fold, they remained at the same position). The difference between the mean age of all samples and the mean age of the 25 worst samples was within the standard deviation. Similarly, also for augDXA DW the list of five samples from the validation set with the greatest MEA was determined for each fold. Of the total of 25 samples on the list in Experiment I, 17 were repeated on the list in Experiment II (including the sample with the greatest MEA for each fold). Ten of the samples with the greatest MAE were submitted for consultation with the radiologist. The consultations indicated that the majority of those samples were obtained from subjects that were too tall or too short for their age. This also supported the statement that the convolutional neural network predicted age on the basis of geometric features.
5. Conclusions
It was shown that it was possible to estimate the age of a subject based on their low-resolution image obtained from a DXA scan, although the convolutional neural network focused on spatial features in the area of the whole body. As it was experimentally verified, for low-resolution images the multispectral features did not improve the final results. It is worth noting that both the usage of the depthwise convolution layer and data augmentation improved results. Future work should focus on extraction information correlated dual-energy X-ray absorptiometry, by taking into account the different parameters (e.g., bone mineral density) and additional metadata (e.g., gender), coupled with image segmentation. We also plan to expand the conducted study, by investigating different regression models. It is necessary to point out that all data used in this study were collected with the same densitometer. To properly validate the proposed solution, the DXA data from other sources should be obtained and tested. Lastly, the additional experiments should be conducted using higher resolution images (e.g., DXA scans of body parts).
Author Contributions
Conceptualization, J.R., K.J. and T.N.; methodology, J.R. and K.J.; software, K.J.; validation, J.R. and T.N.; formal analysis, J.R. and P.W.; investigation, K.J. and J.R.; resources, T.N. and P.W.; writing—original draft preparation, K.J. and N.G.; writing—review and editing, K.J., P.W., J.R., T.N. and N.G.; visualization, K.J. and T.N.; supervision, J.R.; project administration, J.R.; data acquisition, P.W. All authors have read and agreed to the published version of the manuscript.
Funding
This research received no external funding.
Institutional Review Board Statement
This study was approved by the Independent Bioethics Committee for Scientific Research at the Medical University of Gdańsk (Approval No. NKBBN/124/2022).
Informed Consent Statement
Not applicable.
Data Availability Statement
The DXA dataset is not released because data samples contain patients personal data. Publicly available RSNA 2017 dataset was also analyzed in this study. This data can be found here: https://www.rsna.org/education/ai-resources-and-training/ai-image-challenge/rsna-pediatric-bone-age-challenge-2017, accessed on 17 May 2022.
Acknowledgments
This work has been partially supported by Gdansk University of Technology, the Faculty of Electronics, Telecommunications, and Informatics.
Conflicts of Interest
The authors declare no conflict of interest.
Abbreviations
The following abbreviations are used in this manuscript:
| DXA | dual-energy X-ray absorptiometry; |
| MAE | mean absolute error; |
| CNN | convolutional neural network; |
| ROI | regions of interest |
| BMD | bone mineral density |
| BMC | bone mineral content |
| RSNA | Radiological Society of North America |
References
- Briot, K. DXA Parameters: Beyond Bone Mineral Density. Jt. Bone Spine 2013, 80, 265–269. [Google Scholar] [CrossRef] [PubMed]
- Heppe, D.H.M.; Taal, H.R.; Ernst, G.D.S.; Akker, E.L.T.V.D.; Lequin, M.M.H.; Hokken-Koelega, A.C.S.; Geelhoed, J.J.M.; Jaddoe, V.W.V. Bone Age Assessment by Dual-Energy X-ray Absorptiometry in Children: An Alternative for X-ray? Br. J. Radiol. 2012, 85, 114–120. [Google Scholar] [CrossRef] [Green Version]
- Castillo, R.F.; Ruiz, M.D.C.L. Assessment of Age and Sex by Means of DXA Bone Densitometry: Application in Forensic Anthropology. Forensic Sci. Int. 2011, 209, 53–58. [Google Scholar] [CrossRef] [PubMed]
- Navega, D.; Coelho, J.D.O.; Cunha, E.; Curate, F. DXAGE: A New Method for Age at Death Estimation Based on Femoral Bone Mineral Density and Artificial Neural Networks. J. Forensic Sci. 2017, 63, 497–503. [Google Scholar] [CrossRef] [PubMed]
- Lee, H.; Tajmir, S.; Lee, J.; Zissen, M.; Yeshiwas, B.A.; Alkasab, T.K.; Choy, G.; Do, S. Fully Automated Deep Learning System for Bone Age Assessment. J. Digit. Imaging 2017, 30, 427–441. [Google Scholar] [CrossRef] [PubMed] [Green Version]
- Iglovikov, V.I.; Rakhlin, A.; Kalinin, A.A.; Shvets, A.A. Paediatric bone age assessment using deep convolutional neural networks. In Deep Learning in Medical Image Analysis and Multimodal Learning for Clinical Decision Support; Springer: Cham, Switzerland, 2018; pp. 300–308. [Google Scholar]
- Karargyris, A.; Kashyap, S.; Wu, J.T.; Sharma, A.; Moradi, M.; Syeda-Mahmood, T. Age prediction using a large chest X-ray dataset. In Proceedings of the Medical Imaging 2019: Computer-Aided Diagnosis, San Diego, CA, USA, 16–21 February 2019; Volume 10950. [Google Scholar]
- Xue, Z.; Antani, S.; Long, L.R.; Thoma, G.R. Using deep learning for detecting gender in adult chest radiographs. In Proceedings of the Medical Imaging 2018: Imaging Informatics for Healthcare, Research, and Applications, Houston, TX, USA, 10–15 February 2018; Volume 10579. [Google Scholar]
- Xue, Z.; Rajaraman, S.; Long, R.; Antani, S.; Thoma, G. Gender Detection from Spine X-ray Images Using Deep Learning. In Proceedings of the 2018 IEEE 31st International Symposium on Computer-Based Medical Systems (CBMS), Karlstad, Sweden, 18–21 June 2018; pp. 54–58. [Google Scholar]
- Marouf, M.; Siddiqi, R.; Bashir, F.; Vohra, B. Automated Hand X-ray Based Gender Classification and Bone Age Assessment Using Convolutional Neural Network. In Proceedings of the 2020 3rd International Conference on Computing, Mathematics and Engineering Technologies (iCoMET), Sukkur, Pakistan, 29–30 January 2020; pp. 1–5. [Google Scholar]
- Kaloi, M.A.; He, K. Child Gender Determination with Convolutional Neural Networks on Hand Radio-Graphs. arXiv 2018, arXiv:1811.05180. [Google Scholar]
- Nguyen, H.; Soohyung, K. Automatic Whole-body Bone Age Assessment Using Deep Hierarchical Features. arXiv 2019, arXiv:1901.10237. [Google Scholar]
- Castillo, J.; Tong, Y.; Zhao, J.; Zhu, F. RSNA Bone-age Detection using Transfer Learning and Attention Mapping. 2018. Available online: http://noiselab.ucsd.edu/ECE228_2018/Reports/Report6.pdf (accessed on 7 April 2021).
- Liu, B.; Zhang, Y.; Chu, M.; Bai, X.; Zhou, F. Bone Age Assessment Based on Rank-Monotonicity Enhanced Ranking CNN. IEEE Access 2019, 7, 120976–120983. [Google Scholar] [CrossRef]
- Salim, I.; Ben Hamza, A. Ridge Regression Neural Network for Pediatric Bone Age Assessment. Multimed. Tools Appl. 2021, 80, 30461–30478. [Google Scholar] [CrossRef]
- Satoh, M. Bone Age: Assessment Methods and Clinical Applications. Clin. Pediatr. Endocrinol. 2015, 24, 143–152. [Google Scholar] [CrossRef] [PubMed] [Green Version]
- Sandler, M.; Howard, A.; Zhu, M.; Zhmoginov, A.; Chen, L.C. MobileNetV2: Inverted Residuals and Linear Bottlenecks. In Proceedings of the 2018 IEEE/CVF Conference on Computer Vision and Pattern Recognition, Salt Lake City, UT, USA, 18–22 June 2018. [Google Scholar]
- Simonyan, K.; Zisserman, A. Very Deep Convolutional Networks for Large-Scale Image Recognition. arXiv 2014, arXiv:1409.1556. [Google Scholar]
- Szegedy, C.; Vanhoucke, V.; Ioffe, S.; Shlens, J.; Wojna, Z. Rethinking the Inception Architecture for Computer Vision. In Proceedings of the 2016 IEEE Conference on Computer Vision and Pattern Recognition (CVPR), Las Vegas, NV, USA, 27–30 June 2016. [Google Scholar]
- He, K.; Zhang, X.; Ren, S.; Sun, J. Identity Mappings in Deep Residual Networks. arXiv 2016, arXiv:1603.05027. [Google Scholar]
- Szegedy, C.; Ioffe, S.; Vanhoucke, V.; Alemi, A. Inception-v4, Inception-ResNet and the Impact of Residual Connections on Learning. In Proceedings of the AAAI Conference on Artificial Intelligence, San Francisco, CA, USA, 4–9 February 2017. [Google Scholar]
- Halabi, S.S.; Prevedello, L.M.; Kalpathy-Cramer, J.; Mamonov, A.B.; Bilbily, A.; Cicero, M.; Pan, I.; Pereira, L.A.; Sousa, R.T.; Abdala, N.; et al. The RSNA Pediatric Bone Age Machine Learning Challenge. Radiology 2019, 290, 498–503. [Google Scholar] [CrossRef]
- Geron, A. Hands-On Machine Learning with Scikit-Learn, Keras and TensorFlow: Concepts, Tools, and Techniques to Build Intelligent Systems, 2nd ed.; O’Reilly: Sebastopol, CA, USA, 2019. [Google Scholar]
- Sicara/Tf-Explain, GitHub. Available online: github.com/sicara/tf-explain (accessed on 7 April 2021).
- Williams, G.R. Actions of thyroid hormones in bone. Endokrynol. Pol. 2009, 60, 380–388. [Google Scholar]
- Hill, R.J.; Brookes, D.S.; Lewindon, P.J.; Withers, G.D.; Ee, L.C.; Connor, F.L.; Cleghorn, G.J.; Davies, P.S.W. Bone Health in Children with Inflammatory Bowel Disease: Adjusting for Bone Age. J. Pediatr. Gastroenterol. Nutr. 2009, 48, 538–543. [Google Scholar] [CrossRef] [PubMed]
Publisher’s Note: MDPI stays neutral with regard to jurisdictional claims in published maps and institutional affiliations. |
© 2022 by the authors. Licensee MDPI, Basel, Switzerland. This article is an open access article distributed under the terms and conditions of the Creative Commons Attribution (CC BY) license (https://creativecommons.org/licenses/by/4.0/).