Article

Pan-Cancer Analysis for Immune Cell Infiltration and Mutational Signatures Using Non-Negative Canonical Correlation Analysis

Department of Bionformatics & Life Science, Soongsil University, Seoul 06978, Korea
Appl. Sci. 2022, 12(13), 6596; https://doi.org/10.3390/app12136596
Submission received: 24 May 2022 / Revised: 27 June 2022 / Accepted: 28 June 2022 / Published: 29 June 2022
(This article belongs to the Special Issue New Challenges in Integrative Biomedical Data Analysis)

Abstract

:

Simple Summary

Mutational signatures have been used to infer links between tumor development and mutational processes. However, the functional roles of mutational signatures in tumor cells and their influence on the tumor microenvironment remain unclear. This study investigates the impact of tumor microenvironments and immune activities on mutational signatures using integrative analysis of whole-exome sequencing and RNA sequencing data obtained from the same patients. This study applies non-negative canonical correlation analysis to the datasets and identifies the mutational signatures related to the immune cell infiltration in each tumor type. This approach helps to search for the survival and immunological aspects of the mutational signatures in tumors.

Abstract

Mutational signatures indicate the mutational processes and substitution patterns in cancer cell genomes. However, the functional consequences of mutational signatures remain unclear, and there have been no comprehensive systematic studies to examine the relationships between the mutational signatures and the immune cell infiltration. Here, the relationship between mutational signatures and immune cell infiltration using non-negative canonical correlation analysis based on 8927 patients across 25 tumor types was investigated. By inspecting mutational signatures with the maximal coefficients determined by the non-negative canonical correlation analysis, the study identified mutational signatures related to immune cell infiltration composed of tumor microenvironments. The analysis was validated by showing that the genes associated with the identified mutational signatures were linked to overall survival by a Kaplan–Meier curve and a log-rank test and were mainly related to immunity by gene set enrichment analysis. These results will help expand our knowledge of tumor biology and recognize the functional roles and associations of immune systems with mutational signatures.

1. Introduction

The causes of somatic mutations in patients with tumors are only partially known. For example, exogenous mutagens are introduced by tobacco smoking or ultraviolet exposure, and endogenous mutagens are introduced by spontaneous methylcytosine deamination in the 5 -CG dinucleotide context, resulting in C-to-T mutations [1,2]. Furthermore, DNA repair deficiency occurs through homologous recombination deficiency or DNA mismatch repair deficiency, and enzymatic DNA editing is caused by the functional activity of the APOBEC protein family induced by cytidine deaminase enzymes [3,4]. However, the complete identification of many mutational processes is very difficult.
To address these difficulties, mutation signatures representing specific patterns have been developed from a large catalog of mutations generated by several types of cancer genome sequencing [1,5,6]. Mutational signatures are distinctive combinations of somatic alteration resulting from a specific cause raised generally in the cancer genome. Single nucleotide variants (SNVs) are generally classified into six mutational spectra (C:G > A:T, C:G > G:C, C:G > T:A, T:A > A:T, T:A > C:G, T:A > G:C); in the trinucleotide context, 96 combinations of SNVs are possible. Tumor samples with 96 variables are then decomposed using a non-negative matrix factorization (NMF) method, and new matrices are generated using mutational signatures [7]. Mutational signatures have helped understand the mutational processes and causes of tumors; many cancer researchers have also used mutational signatures for their analyses [8,9,10].
Recent studies have revealed that the apolipoprotein B mRNA editing enzyme, catalytic polypeptide-like (APOBEC) mutational signature is potentially associated with immune responses in non-small cell lung cancer [11,12]. Two members of the APOBEC family, APOBEC3A and APOBEC3B, are known to contribute to mutations in cancers by generating C > T and C > G mutations in TCN trinucleotides [13,14]. The authors characterized the APOBEC mutational signatures related to the response to immune checkpoint blockade therapy. These studies were mostly conducted on non-small cell lung cancer and demonstrated the potential of APOBEC signatures. However, the functional characteristics of most mutational signatures remain unknown. Moreover, until now, to my knowledge, there have been no systematic analyses to examine the connections between the mutational signatures and the immune cell infiltration.
Here, this study investigated the immunological effects of mutational signatures. Firstly, the mutational signatures and the immune cell infiltration were inferred from somatic mutation and gene expression profiles in each tumor sample, respectively. Then, the relationships between the mutational signatures and the immune cell infiltration were examined based on canonical correlation analysis (CCA). CCA is a useful approach to determining the correlation between two multivariate datasets [15]. Both datasets are projected into lower-dimensional spaces, where their correlation is maximal. Generally, CCA is considered as a dimensionality reduction method [16,17], however, it has been applied for various purposes, including classification and clustering [18,19,20]. CCA has also been employed to solve many biological problems, mainly using the integrative analysis of multi-omics datasets [21,22,23]. As shown in some previous works using CCA, the estimated coefficients of the variables by the CCA can reveal the importance of the variables for another input dataset of the CCA. Thus, this study applied the CCA to infer the functional roles of each mutational signature. However, traditional CCA is sensitive to outliers and noise. In addition, the occurrence of negative values of the coefficients hinders the intuitive interpretation of the results [24]. This study used regularization strategies to solve the ill-posed problem and non-negative constraints that force all input elements and coefficients to be zero or positive values, as suggested by Sigg et al. [25]. Experiments with 8927 tumor patients across 25 tumor types in The Cancer Genome Atlas (TCGA) showed that these methods could be useful for identifying mutational signatures related to immune cell infiltration in each tumor type.
To date, potential implications of mutational signatures for their functional and immunological effects remain to be addressed in tumor patients. Hence, the main objective of this study is to decipher mutational signatures related to immune cell infiltration in each tumor type and to assess their functional and clinical effects.

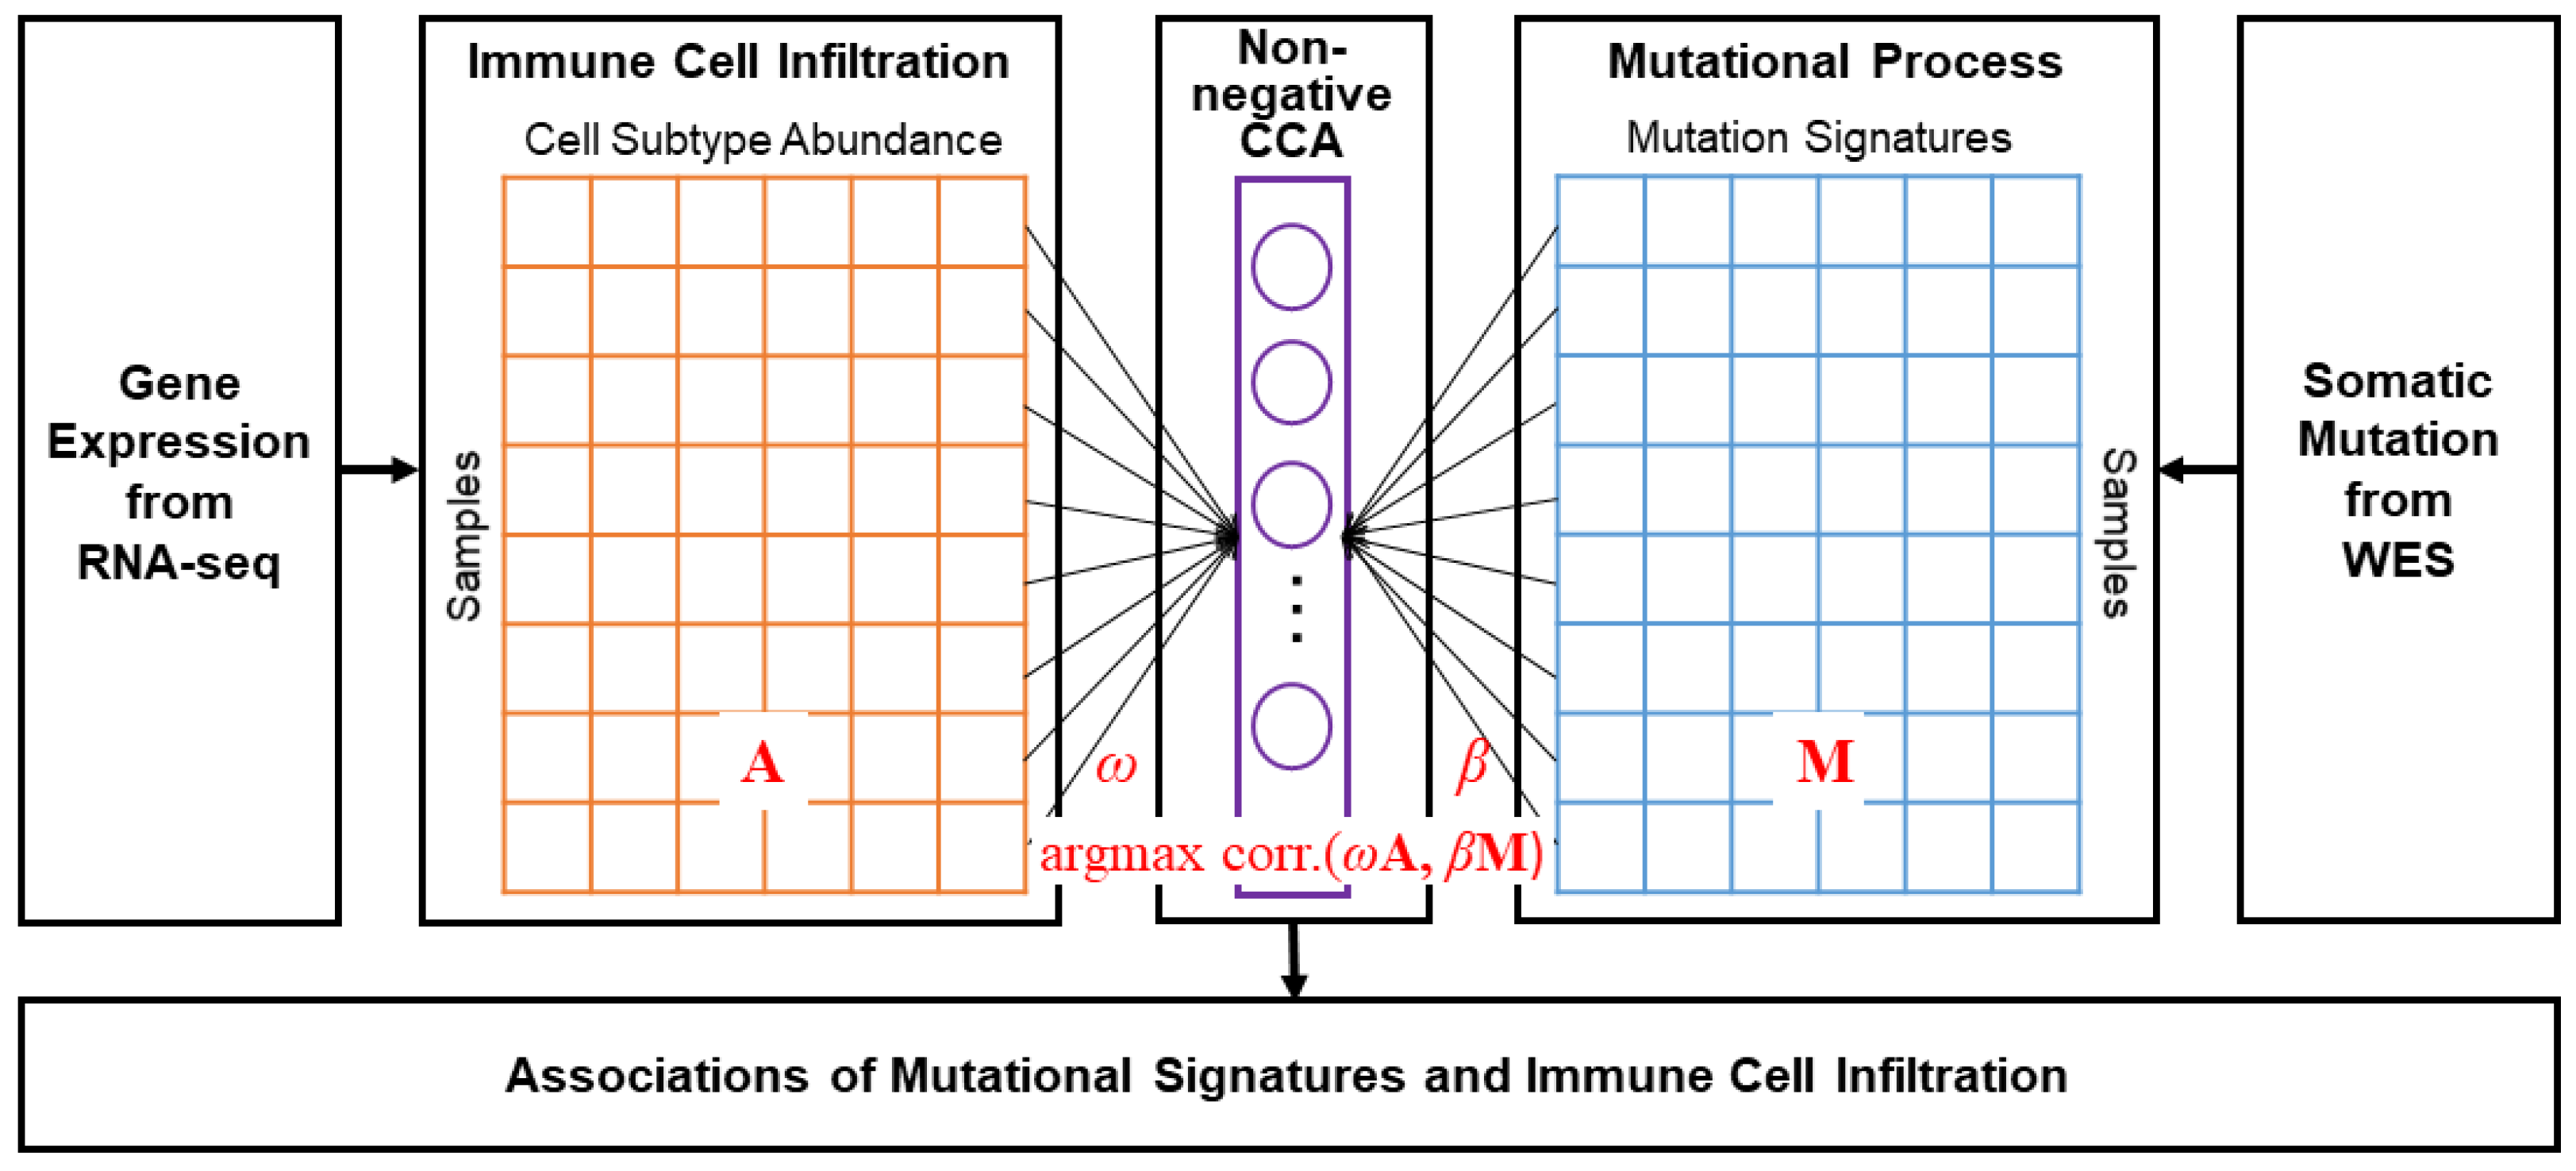
2. Materials and Methods

2.1. Data Preparation

Somatic mutation calls and gene expression profiles for Genomic Data Commons (GDC) TCGA tumor samples were obtained from UCSC Xena [26]. UCSC Xena provide the somatic mutation data detected from whole-exome sequencing, and for this experiment, the somatic mutation called using MuTect2 was downloaded. The gene expression profiles were achieved from RNAseq datasets processed using the HTseq [27] pipeline. Although the downloaded expression levels were represented as fragments per kilobase of transcript per million fragments mapped (FPKM), these were transformed to transcripts per kilobase million (TPM) values for further analyses [28,29].
Among these TCGA tumor samples, the experiments were carried out with 8927 tumor patients across 25 major tumor types, wherein more than 100 patients had identical TCGA barcode IDs between somatic mutation data and gene expression profiles. The tumor types and numbers of samples used in the experiments are shown in Table 1.

2.2. Estimation of Mutational Signatures and Immune Cell Infiltration

All subsequent analyses were performed using R 3.6.3. Among the somatic mutations, SNVs were only extracted to determine the mutational processes in each tumor sample, and the mutational process was inferred, using the R package deconstructSigs 1.8.0 [30], from the SNVs. deconstructSigs estimates the similarity to the known Catalogue of Somatic Mutations in Cancer (COSMIC) mutational process version 2 [31] in individual tumor samples. The approach uses a multiple linear regression model to iteratively explore coefficients of pre-defined mutational signatures that are restricted to positive values.
From the gene expression profile, the TPM values were used as an input of EPIC [32], a tool for estimating cell subtype abundance from bulk gene expression profiles. EPIC predicts the composition of each cell type, B cells, CD4 T cells, CD8 T cell, endothelial cells, macrophages, natural killer (NK) cells, cancer-associated fibroblasts (CAFs), and other cells. The experiments were performed using the R package EPIC 1.1.5.

2.3. Non-Negative CCA and Estimation of Coefficients

Figure 1 is an overview of the analysis of the relationships between the immune cell infiltration and mutational signatures. The basic methods and the estimation of the coefficients were proposed by Siggs et al., and the experiments were carried out using the R package nscancor 0.6.1–25 [25,33], followed by regularization using L2-norm. The non-negative CCA approach to capture the relationships between mutational signatures and immune cell infiltration is outlined as follows:
The traditional CCA finds relationships between two multidimensional variables to maximize their correlation with the linear combination as follows:
argmax ω , β c o r r ( ω A , β M )
where A and M are the matrices of the cell subtype abundance and mutational signatures, respectively. ω and β are coefficient vectors for the linear projections of the two variables. The main objective of the CCA is to detect the coefficient vectors ω and β that maximize the correlation between ω A and β M using linear projections. The optimal solution for CCA can be discovered by the direct transformation to a generalized eigenvalue problem [34].
However, in contrast to the conventional CCA, in this study, ω and β must be equal to or larger than zero for the non-negative constraint. Thus, ω and β were determined using an iterative regression solver based on a least-squares formulation that was extended using regularization techniques [25,35,36,37]. The optimization problem in Equation (1) can be reformulated equivalently using the following equation:
( ω ^ , β ^ ) = argmin ω , β | | ω A β M | | 2 .
Equation (1) was converted to a problem to search for a minimum distance in a projection space using the linear transformation of A and M, similar to finding the coefficients using the least-squares methods in a linear regression problem.
For a given value of ω ^ , Equation (2) can be optimized by finding the minimum mean-squared error for the regression coefficients β as follows:
β ^ = argmin β | | ω ^ A β M | | 2 .
In Equation (3), β ^ is estimated using the following rescaling step:
β ^ : = β ^ | | β ^ M | | .
For example, at the (t+1)th iteration step, ω ^ t is a constant, and a regression step is performed to estimate the coefficient β ^ t + 1 . Then, β ^ t + 1 is considered a fixed constant, and the coefficient ω ^ t + 1 is determined to be similar to that in Equations (3) and (4), respectively. The procedure is iteratively continued until the coefficients ω and β converge.
To apply a penalty term at the regression coefficients for regularization, Equation (3) is modified as follows:
β ^ = argmin β ( | | ω ^ A β M | | 2 + λ 1 g = 1 G | | β g | | 2 ) ,
where β g is the coefficient of the gth component of CCA. Similarly, an optimal ω vector can be determined by adding the constraint as follows:
ω ^ = argmin ω ( | | β ^ M ω A | | 2 + λ 2 h = 1 H | | ω h | | 2 ) ,
where ω h is the coefficient of the hth component of CCA represented as the ω vector. λ 1 and λ 2 are the shrinkage parameters for regularization in Equations (5) and (6).
A high coefficient for a mutational signature indicates that it is highly linked to the immune cell infiltration. In the experiments, many of the mutational signatures were observed as zero; therefore, mutational signatures with the number of non-zero values exceeding 20% of the total samples of the tumor type were used. The glmnet() function’s parameter alpha was specified as zero for Ridge regression, while the other parameters were left as defaults.

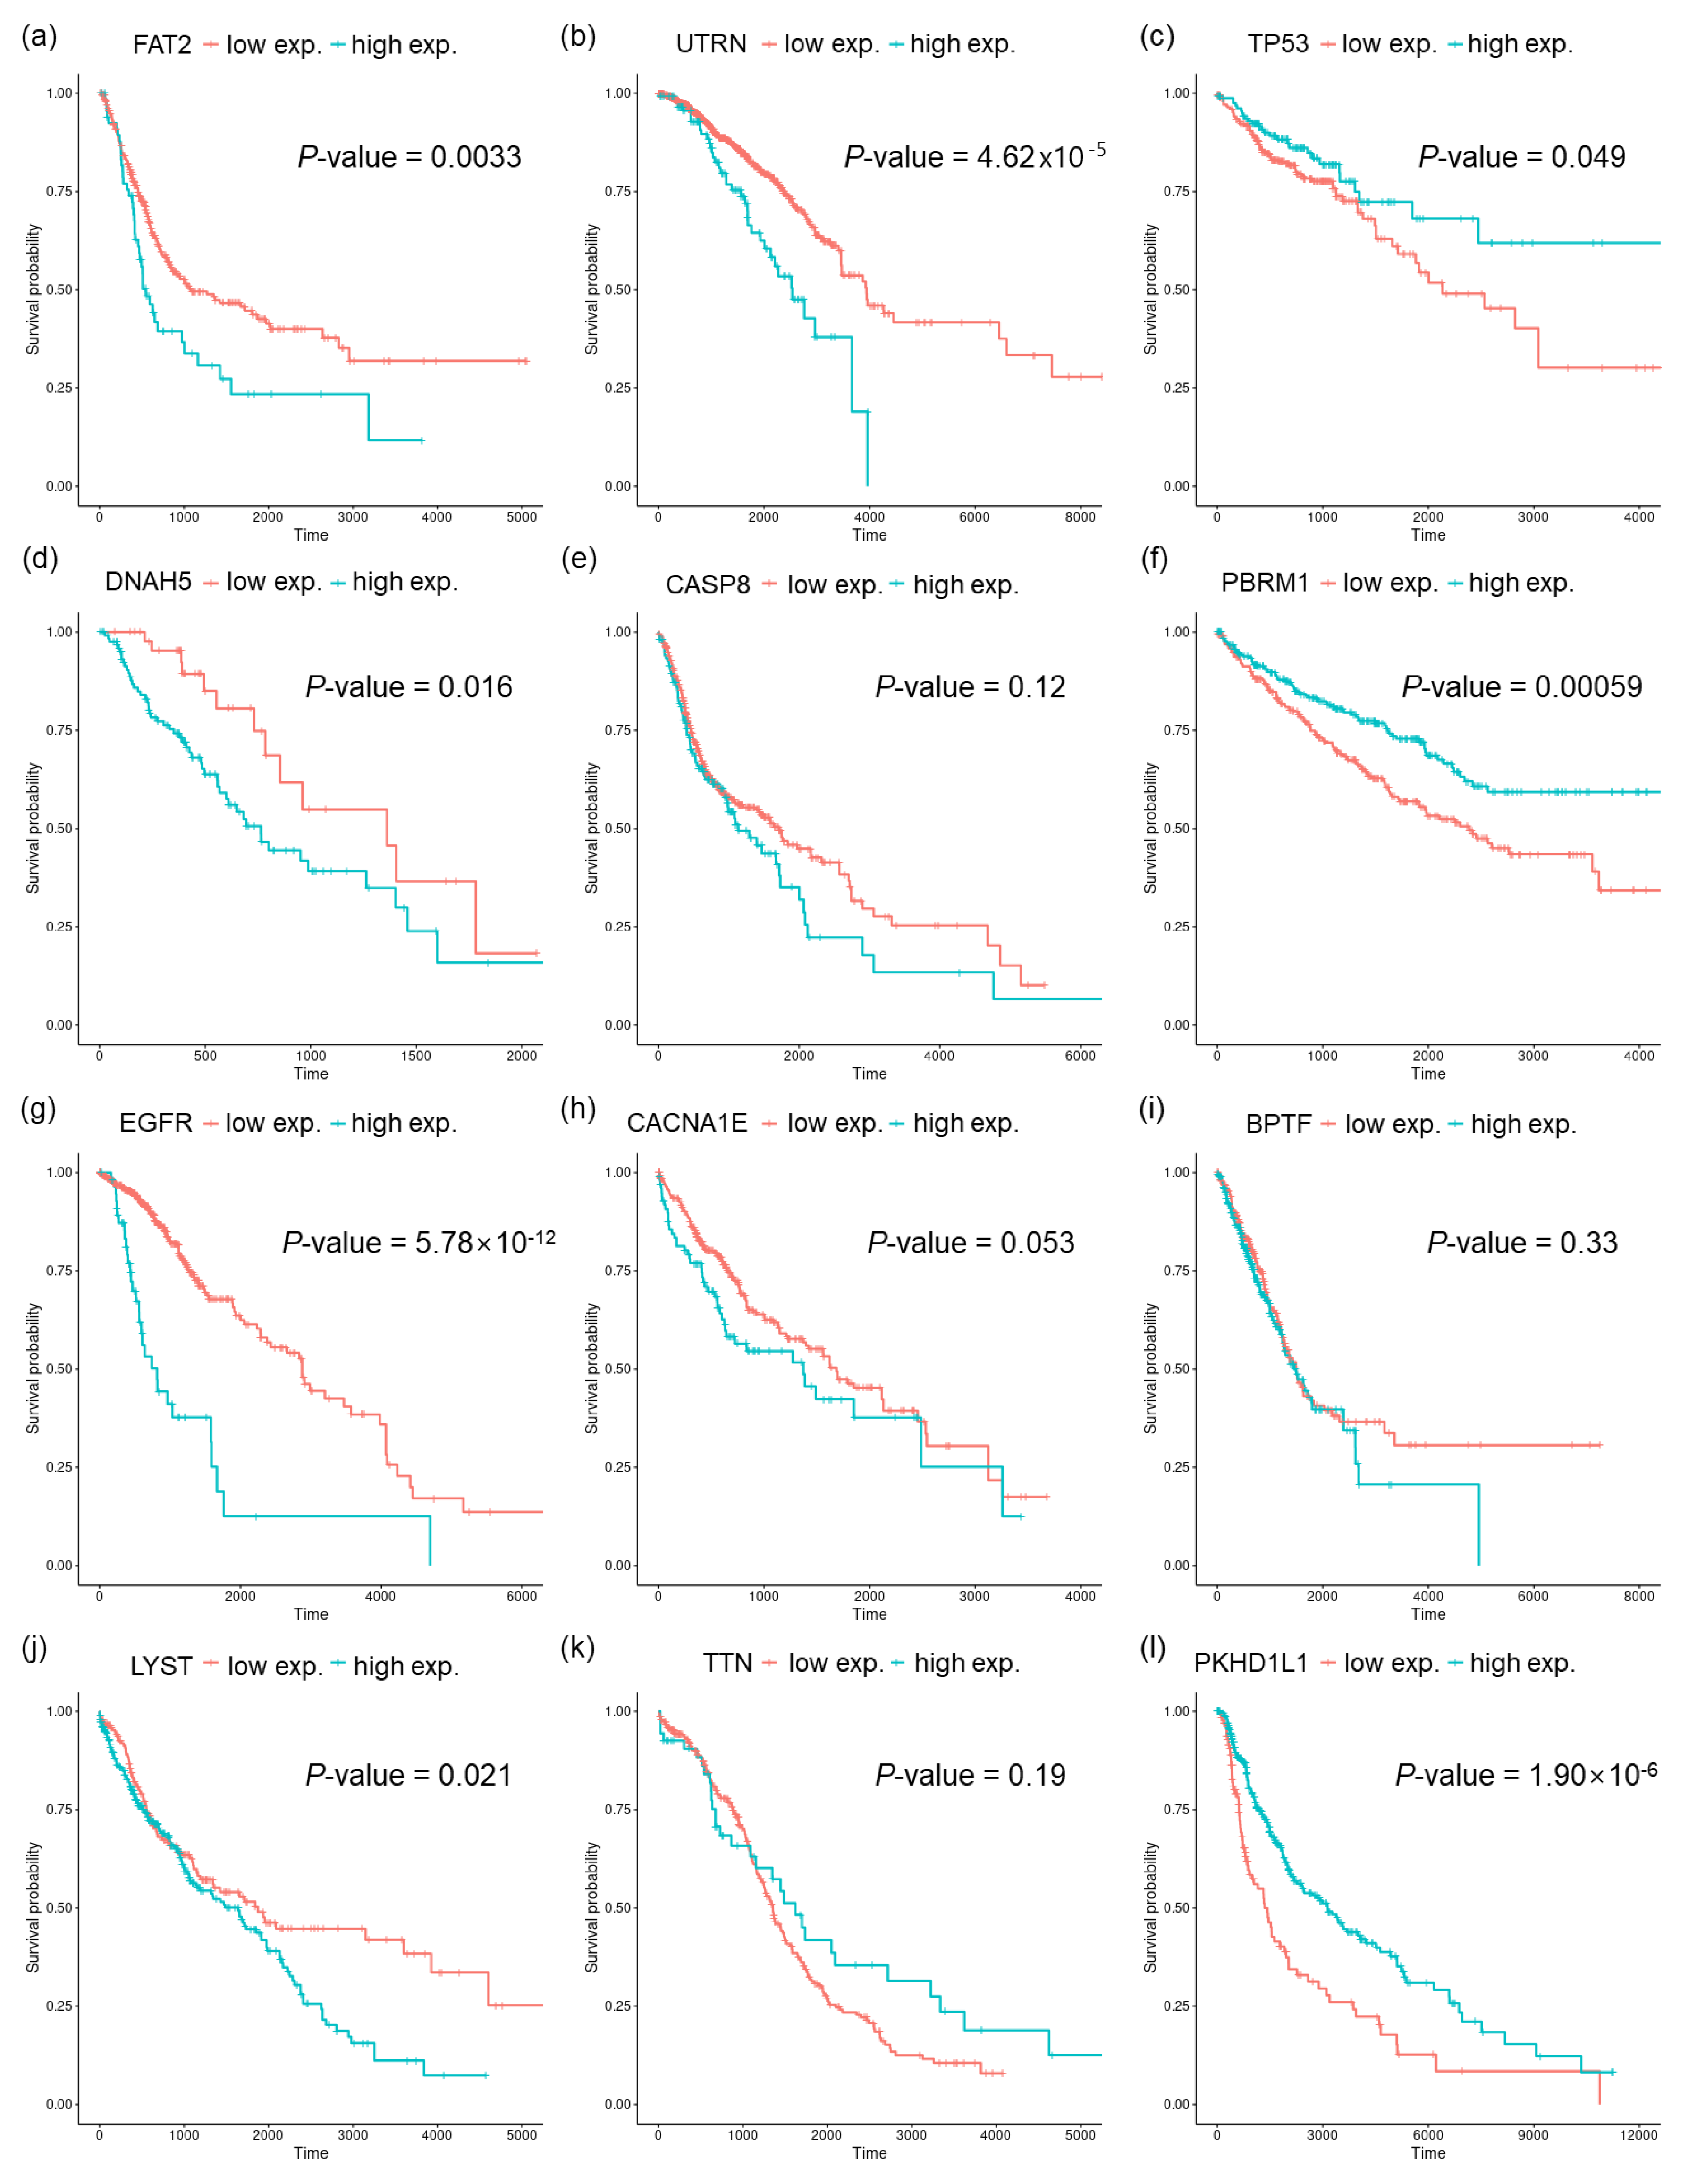
2.4. Finding Genes Correlated to Mutational Signatures and Survival Analysis

The Pearson correlation coefficient (PCC) was measured between the number of somatic mutations in a gene and the mutational signature value inferred by deconstructSigs. Genes with the highest PCC, whose value was more than 0.1 in each tumor type, were selected for further survival analysis. Overall survival (OS) information was obtained using UCSC Xena [26]. The samples were divided into two groups based on the gene expression levels of the highest correlated genes using the R package maxstat 0.7–25, which estimates a optimal cut point based on maximally selected rank statistics [38]. The statistical significance (p-value) of the survival analysis was calculated using a log-rank test.

2.5. Geneset Enrichment Analysis Using a Pre-Ranked Gene List
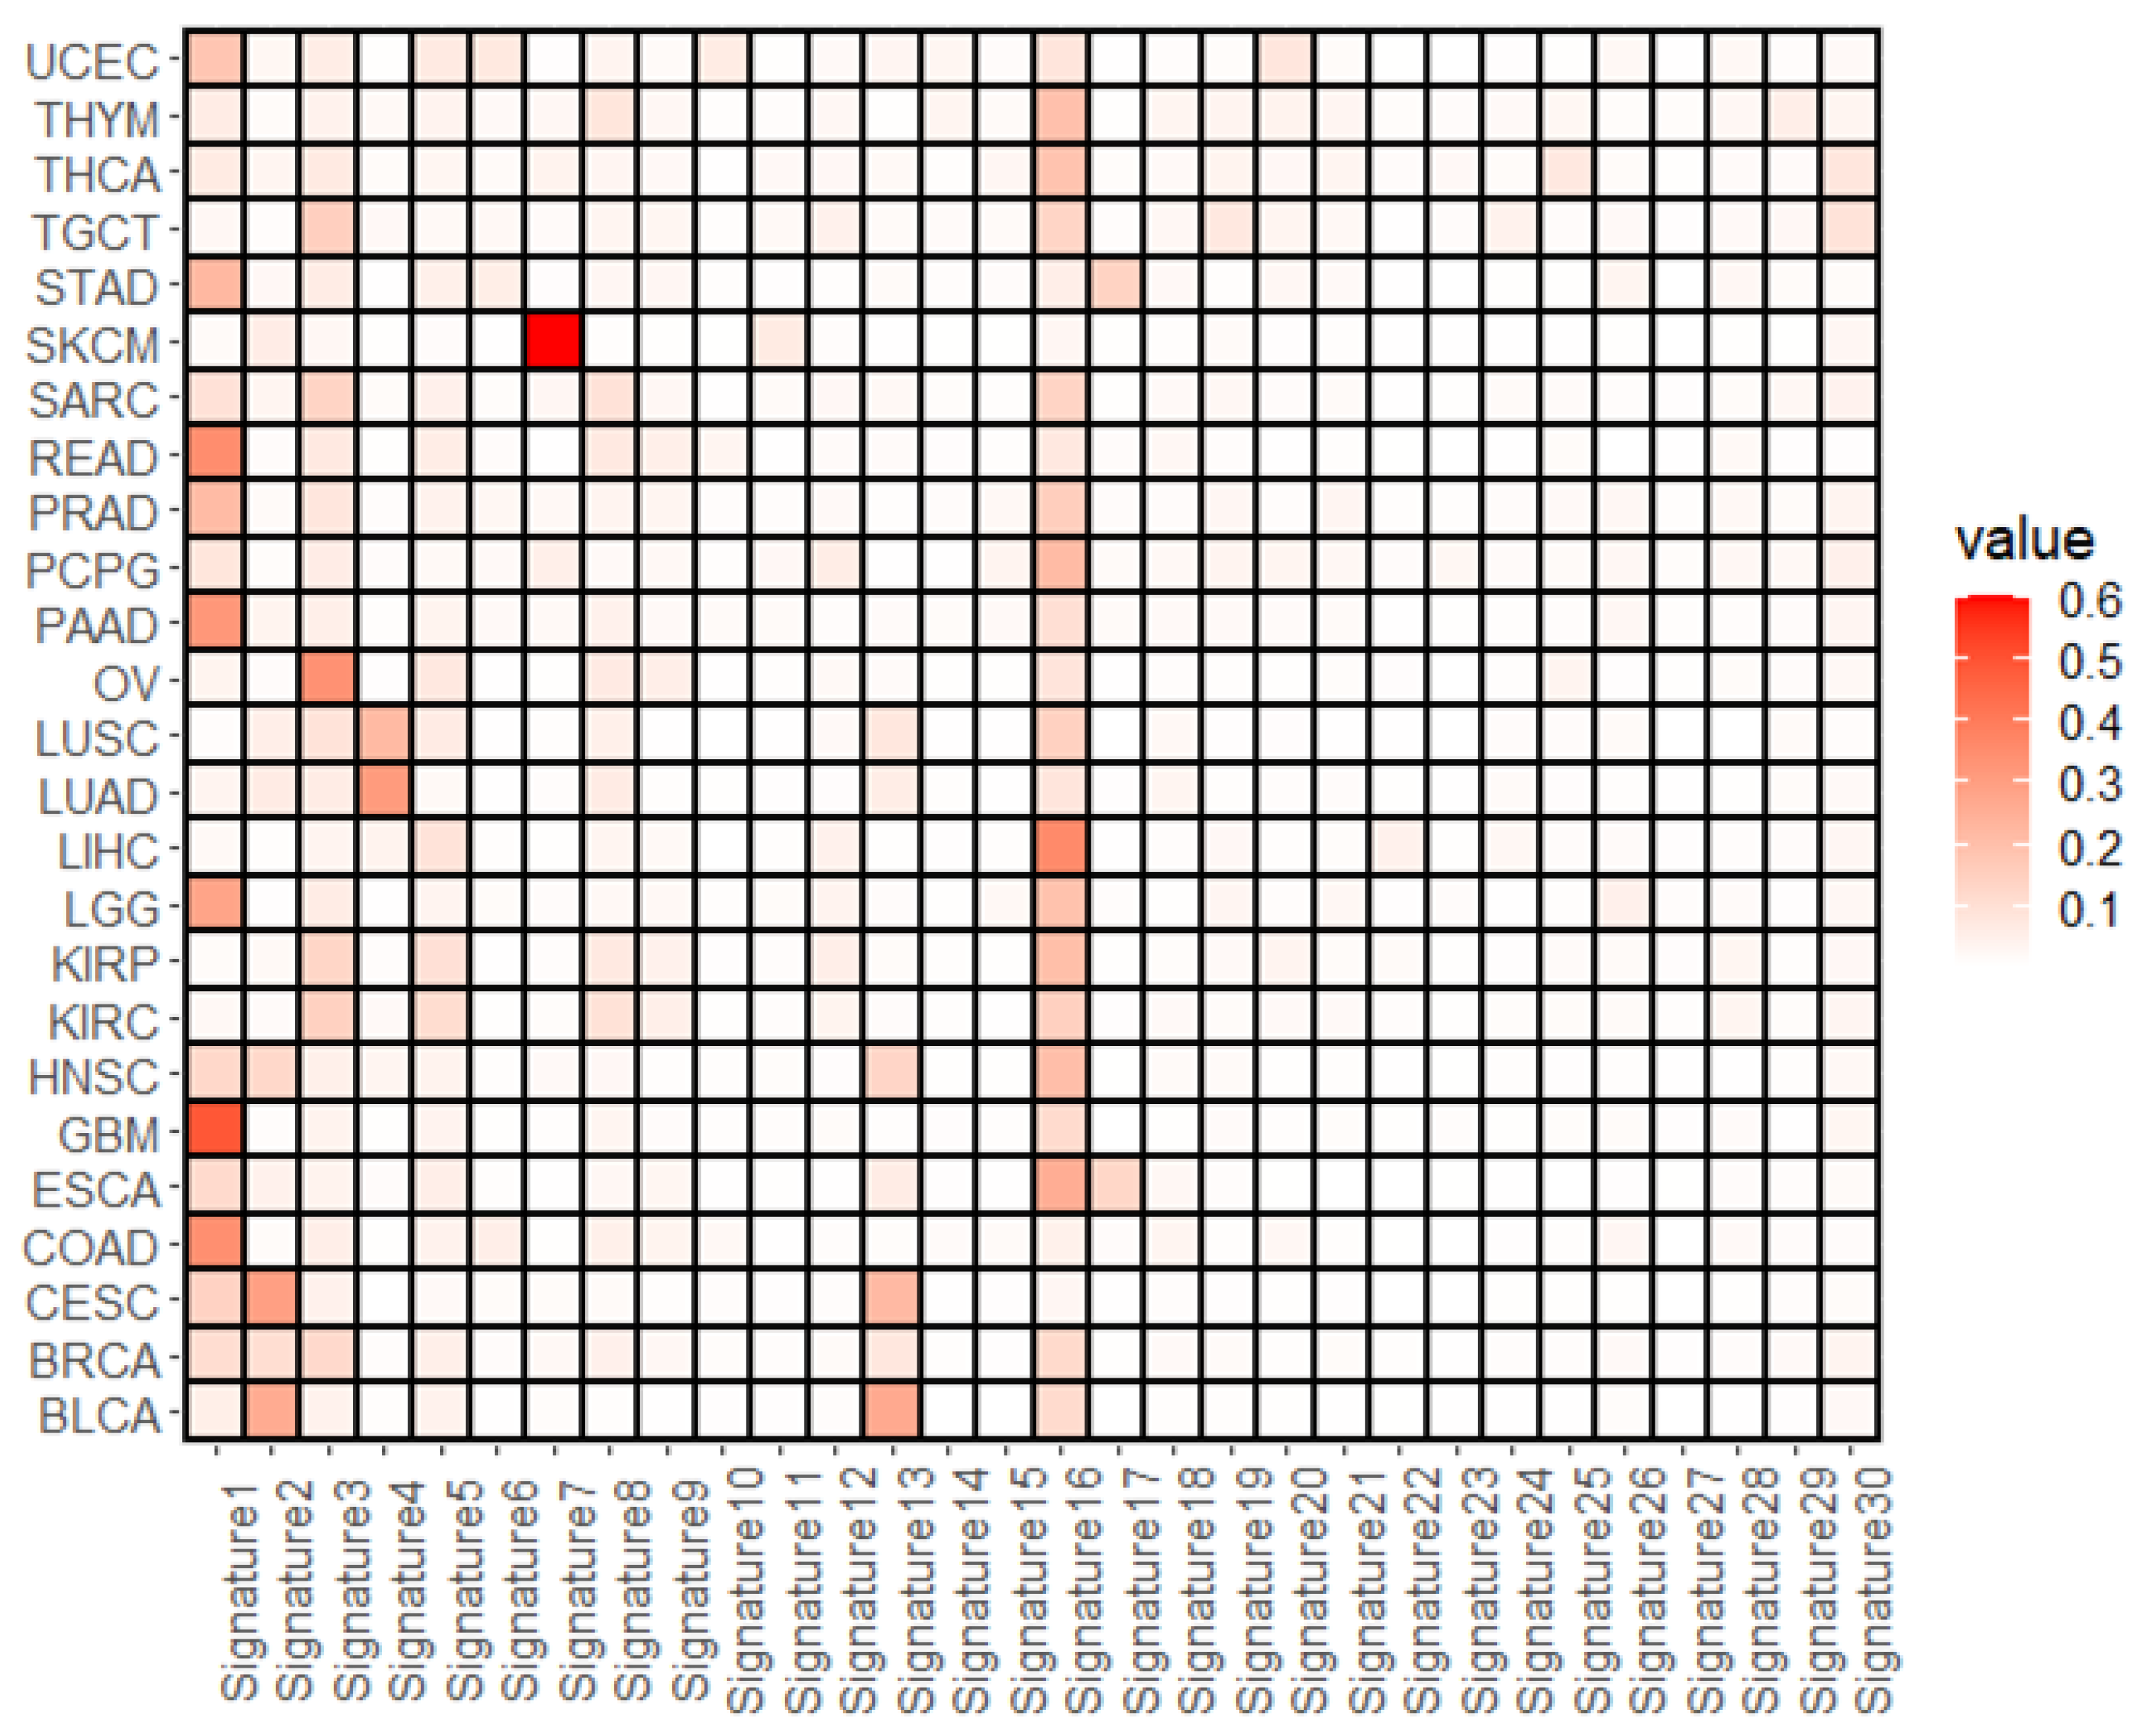
The GSEApreranked approach was used to identify genesets associated with the identified mutational signatures in each tumor type. Basically, gene set enrichment analysis (GSEA) is a method that is used to identify overrepresented genesets from gene expression data using the Kolmogorov–Smirnov statistic [39,40]. However, GSEApreranked executes GSEA against a ranked list of genes and calculates an enrichment score based on the pre-defined genesets. In this experiment, the ranking was measured by the PCC between the gene expression levels and the values of the mutational signatures estimated by deconstructSigs. The GSEApreranked experiment was carried out using the Java-based GSEA 4.2.3 tool (Broad Institute, Cambridge, MA, USA) with default parameters. For the genesets, c5.go.bp.v7.5.1 derived from Gene Ontology (GO) biological process (BP) were used, which were annotated in the Molecular Signatures Database (MSigDB) [41].

3. Results

3.1. Overall Representation of Mutational Signatures

This study first examined the prevalence of mutational signatures and cell subtype abundances in 25 TCGA tumor types using deconstructSigs and EPIC, respectively. Table 2 shows the average occurrence of mutational signatures across 25 tumor types, and Figure 2 presents the tumor type-specific profiles. Mutation signatures 16 and 1 were predominantly represented, as shown in Table 2, with mean values of 0.1335 and 0.1250, respectively. Next, tumor type-specific over- and underrepresented mutational signatures were investigated, and the representatives were substantially different. Mutational signatures 16 and 1 were widely represented in many tumor types, with values greater than 0.1 for 17 (BLCA, BRCA, ESCA, GBM, HNSC, KIRC, KIRP, LGG, LIHC, LUSC, PAAD, PCPG, PRAD, SARC, TGCT, THCA, THYM) and 12 tumor types (BRCA, CESC, COAD, ESCA, GBM, HNSC, LGG, PAAD, PRAD, READ, STAD, UCEC), respectively. Furthermore, the number of tumor types with maximal values for mutational signatures 16 or 1 was eight (ESCA, HNSC, KIRC, KIRP, LIHC, PCPG, THCA, THYM for signature 16; COAD, GBM, LGG, PAAD, PRAD, READ, STAD, UCEC for signature 1). However, signature 3 was the best for BRCA, OV, SARC, and TGCT, and signature 4 was the best for LUAD and LUSC. Signature 3 is related to BRCA1 and BRCA2 mutations, which are generally observed in breast and ovarian tumors [42,43], whereas signature 4 is related to tobacco smoking [44]. Moreover, BLCA, CESC, and SKCM showed the best occurrence of signatures 13, 2, and 7, respectively, in contrast to other tumor types. Signatures 13 and 2 are known as APOBEC mutation signatures, whereas signature 7 is known as a UV signature.
Next, the study investigated which genes were commonly mutated and which sequence alteration was mainly observed. Supplementary Figure S1 shows PCCs between the mutational signatures and the highly mutated top 20 genes, and Supplementary Figure S2 represents the correlation between the mutational signatures and the sequence alteration. As expected, tumor-related genes such as TP53, PIK3CA, and KRAS were highly mutated in each tumor type, and the genes were positively correlated with certain mutational signatures. For example, in SKCM, signature 7 (UV signature) was the most representative (Figure 2), and the signature was positively correlated with most of the top 20 genes. However, this property was not observed in any of the tumor types. For instance, although GBM was overrepresented in signature 1 (aging signature), positively correlated genes among the top 20 genes were detected in signatures 10 and 14. When the genomic modifications were examined, the amount of PCC was not identical to the representative signatures (Supplementary Figure S2).

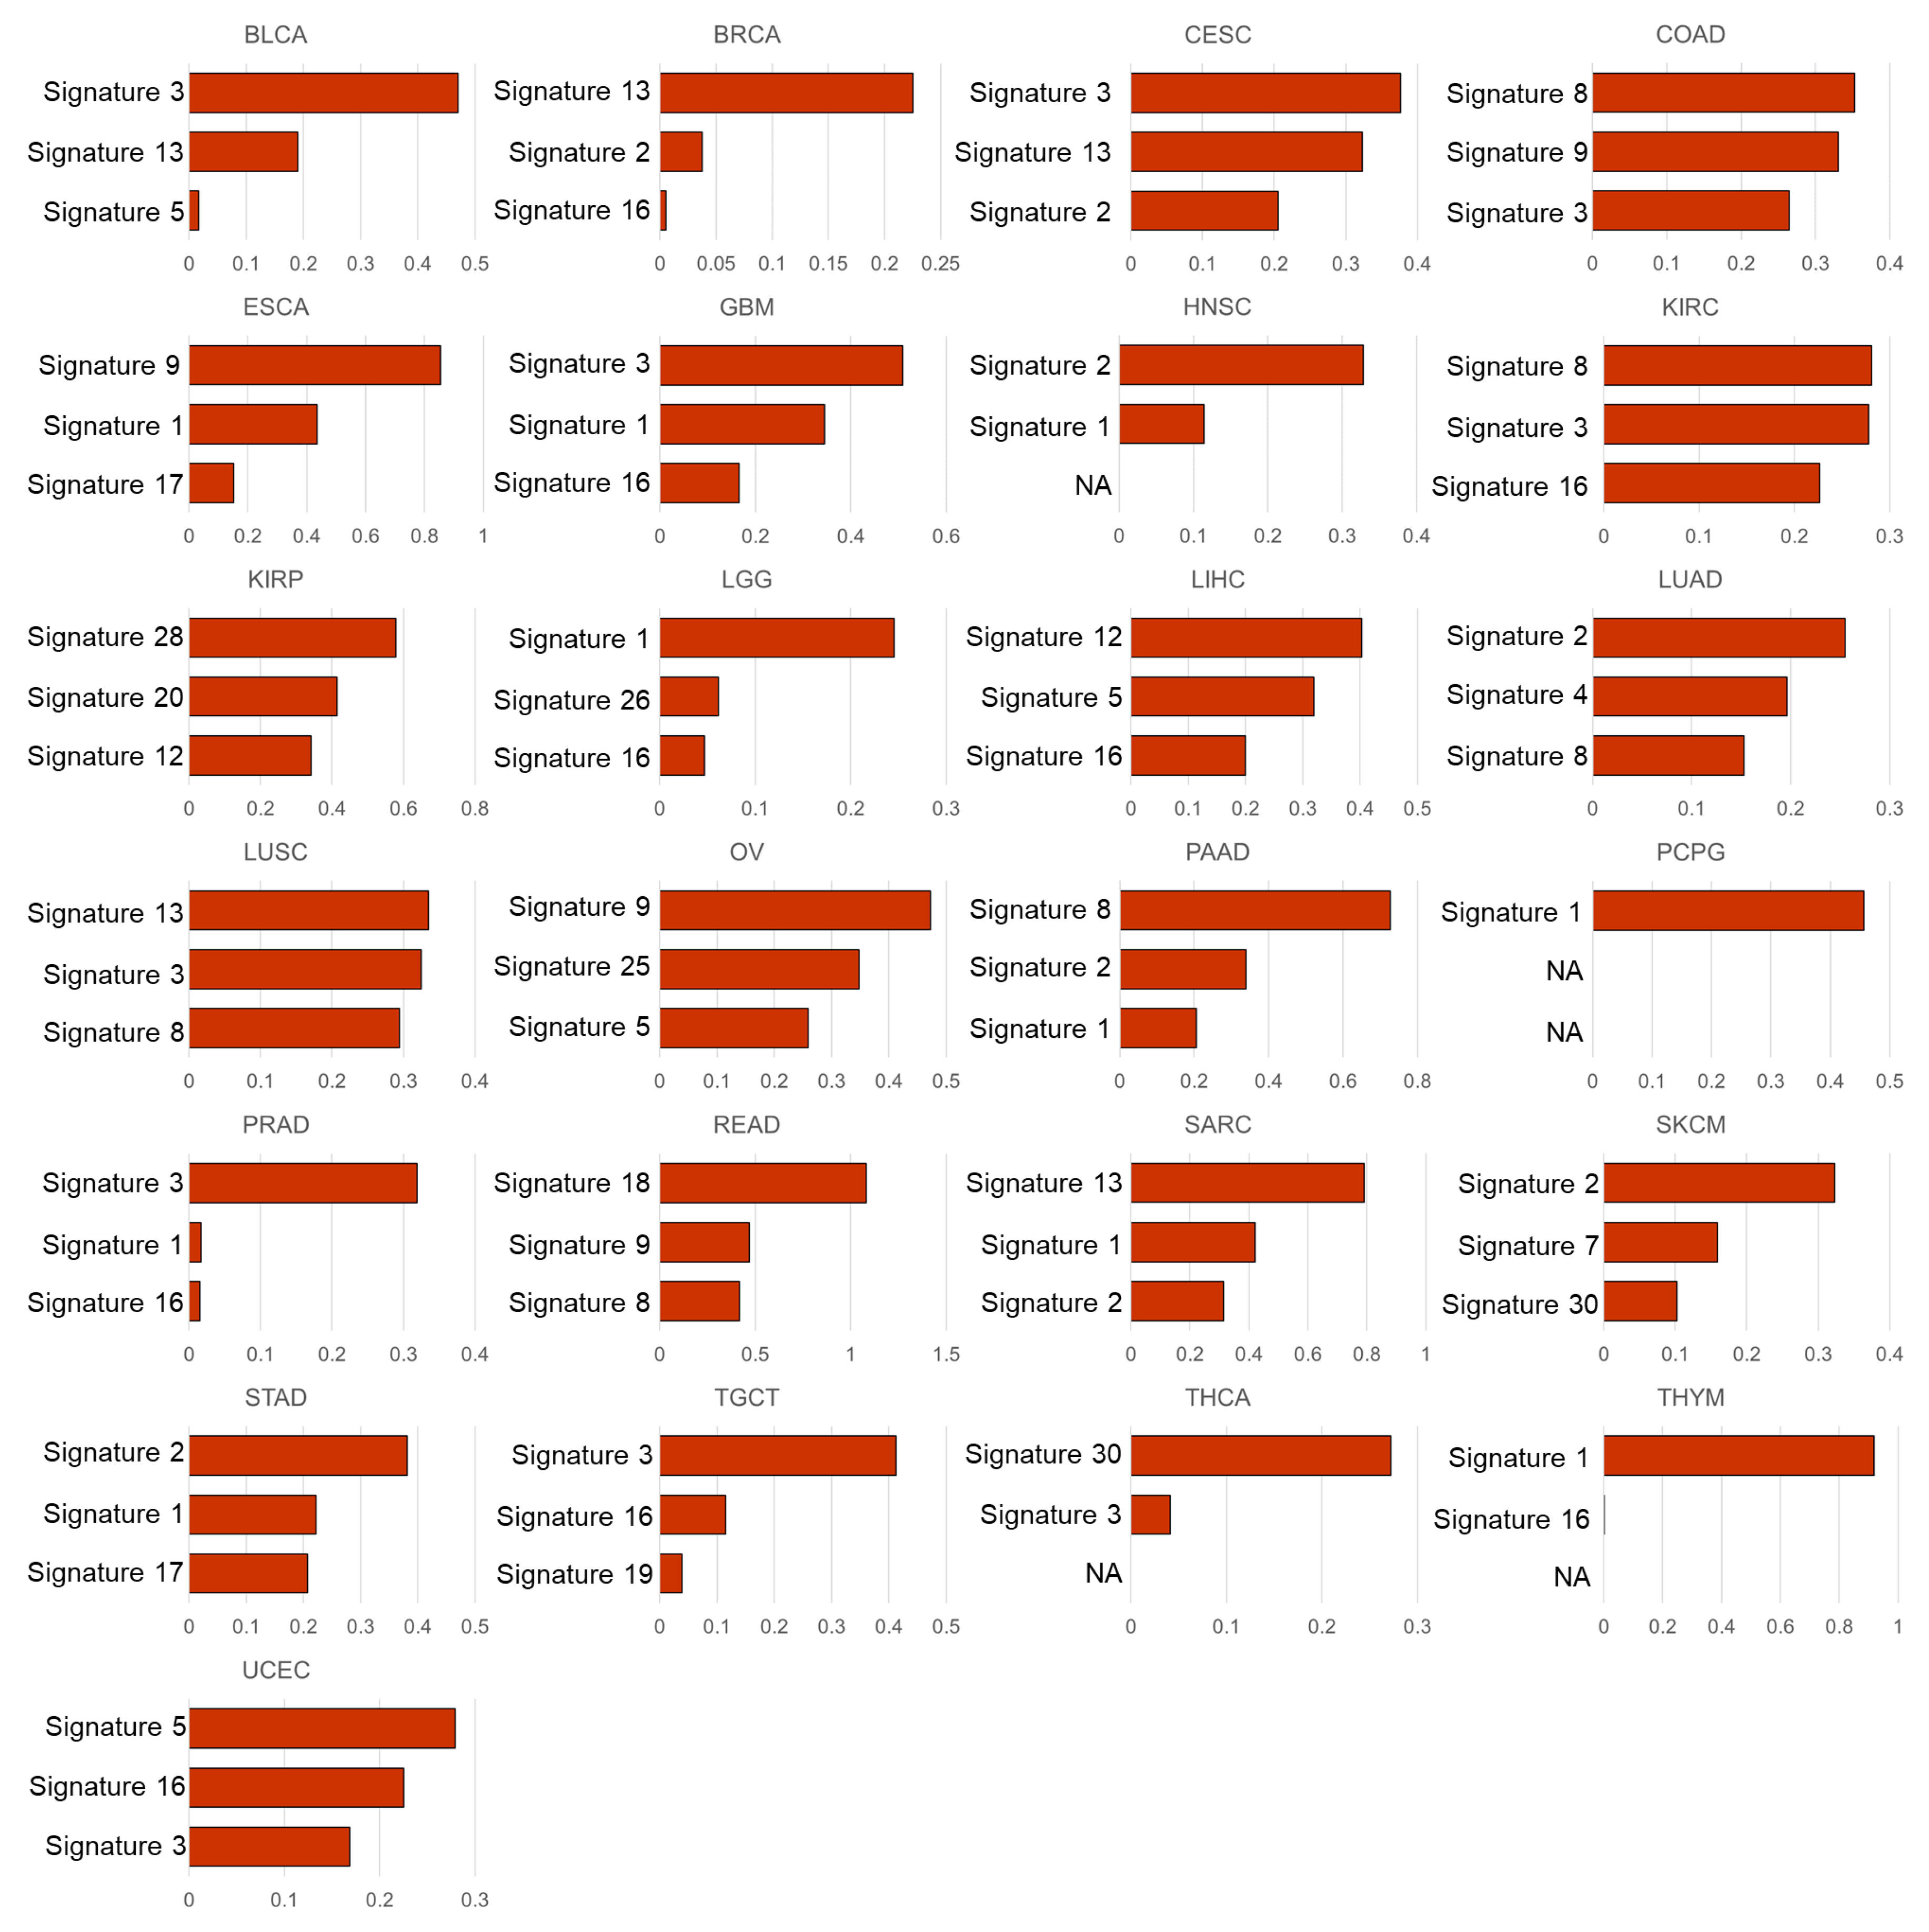
3.2. Mutational Signatures Associated with the Cell Subtype Composition

To the mutational process and cell subtype abundance datasets for each tumor type, this study applied non-negative CCA and identified the mutational signatures associated with immune cell infiltration based on a canonical correlation analysis. Across the 25 tumor types, signatures 2, 1, and 13, in descending order, were the most highly ranked mutational signatures. Among these, signatures 2 and 13 are APOBEC signatures, whose associations with immunity have been previously reported [11,12]. However, the absolute values of the three coefficients were small (0.0477, 0.0468, 0.0407), and it was difficult to clearly determine the activities of mutational signatures in immunity and tumor microenvironments by this experiment.
Therefore, the same experiments were performed for each tumor type. Supplementary Figure S3 represents the canonical correlation coefficients and their p-values in each tumor type. These were statistically significant in all tumor types (p-values range from 1.10 × 10 14 to 3.14 × 10 2 ). Figure 3 shows the coefficients of the first canonical component of the mutational signature dataset, and Supplementary Figure S3 is the coefficients of the second canonical component. Notably, the mutational signatures associated with immune cell infiltration identified by this non-negative CCA approach showed different patterns with the overall abundance of mutational signatures (shown in Figure 2) in each tumor type, as well as across the 25 tumor types (shown in Table 2).
In the experimental results, in LUSC, the mutational signature with the highest coefficients in the first canonical component of our CCA results was signature 13, well-known as an APOBEC signature, with a coefficient of 0.3348. The results were in line with previous studies that were mentioned above [11,12]. In addition, in the second canonical component, another APOBEC signature, signature 2, appeared to have the highest coefficient (0.3292) (Supplementary Figure S3). The APOBEC signatures were also observed as the highest coefficients in the first component of several tumor types, such as BRCA (signature 13, coeff. = 0.2253), HNSC (signature 2, coeff. = 0.3287), STAD (signature 2, coeff. = 0.3819), SKCM (signature 2, coeff. = 0.3233), SARC (signature 13, coeff. = 0.7919), as well as LUSC.
Next, we performed survival analysis based on the gene with the highest correlation to the identified mutational signatures. For several tumor types, all PCCs were very low (<0.1), and were thus excluded from the survival analysis. Figure 4 shows the Kaplan–Meier plots for each tumor type. The genes with the highest PCC in each tumor type were clearly different from the highly mutated genes represented in the row labels of Supplementary Figure S1. Although some genes, such as TP53, were observed among the highly mutated genes, most of the genes with the highest PCCs were not detected among the top 20 highly mutated genes. Survival analysis using Kaplan–Meier plots and log-rank tests showed statistically significant differences (p-value < 0.05) in many tumor types (FAT2 in BLCA, UTRN in BRCA, TP53 in COAD, DNAH5 in ESCA, PBRM1 in KIRC, EGFR in LGG, LYST in LUSC, and PKHDL1 in SKCM), and the p-value for CACNA1E in LIHC was also very close to 0.05. It was noted that TP53, PBRM1, and EGFR were involved in the Cancer Gene Census in the COSMIC database [45].

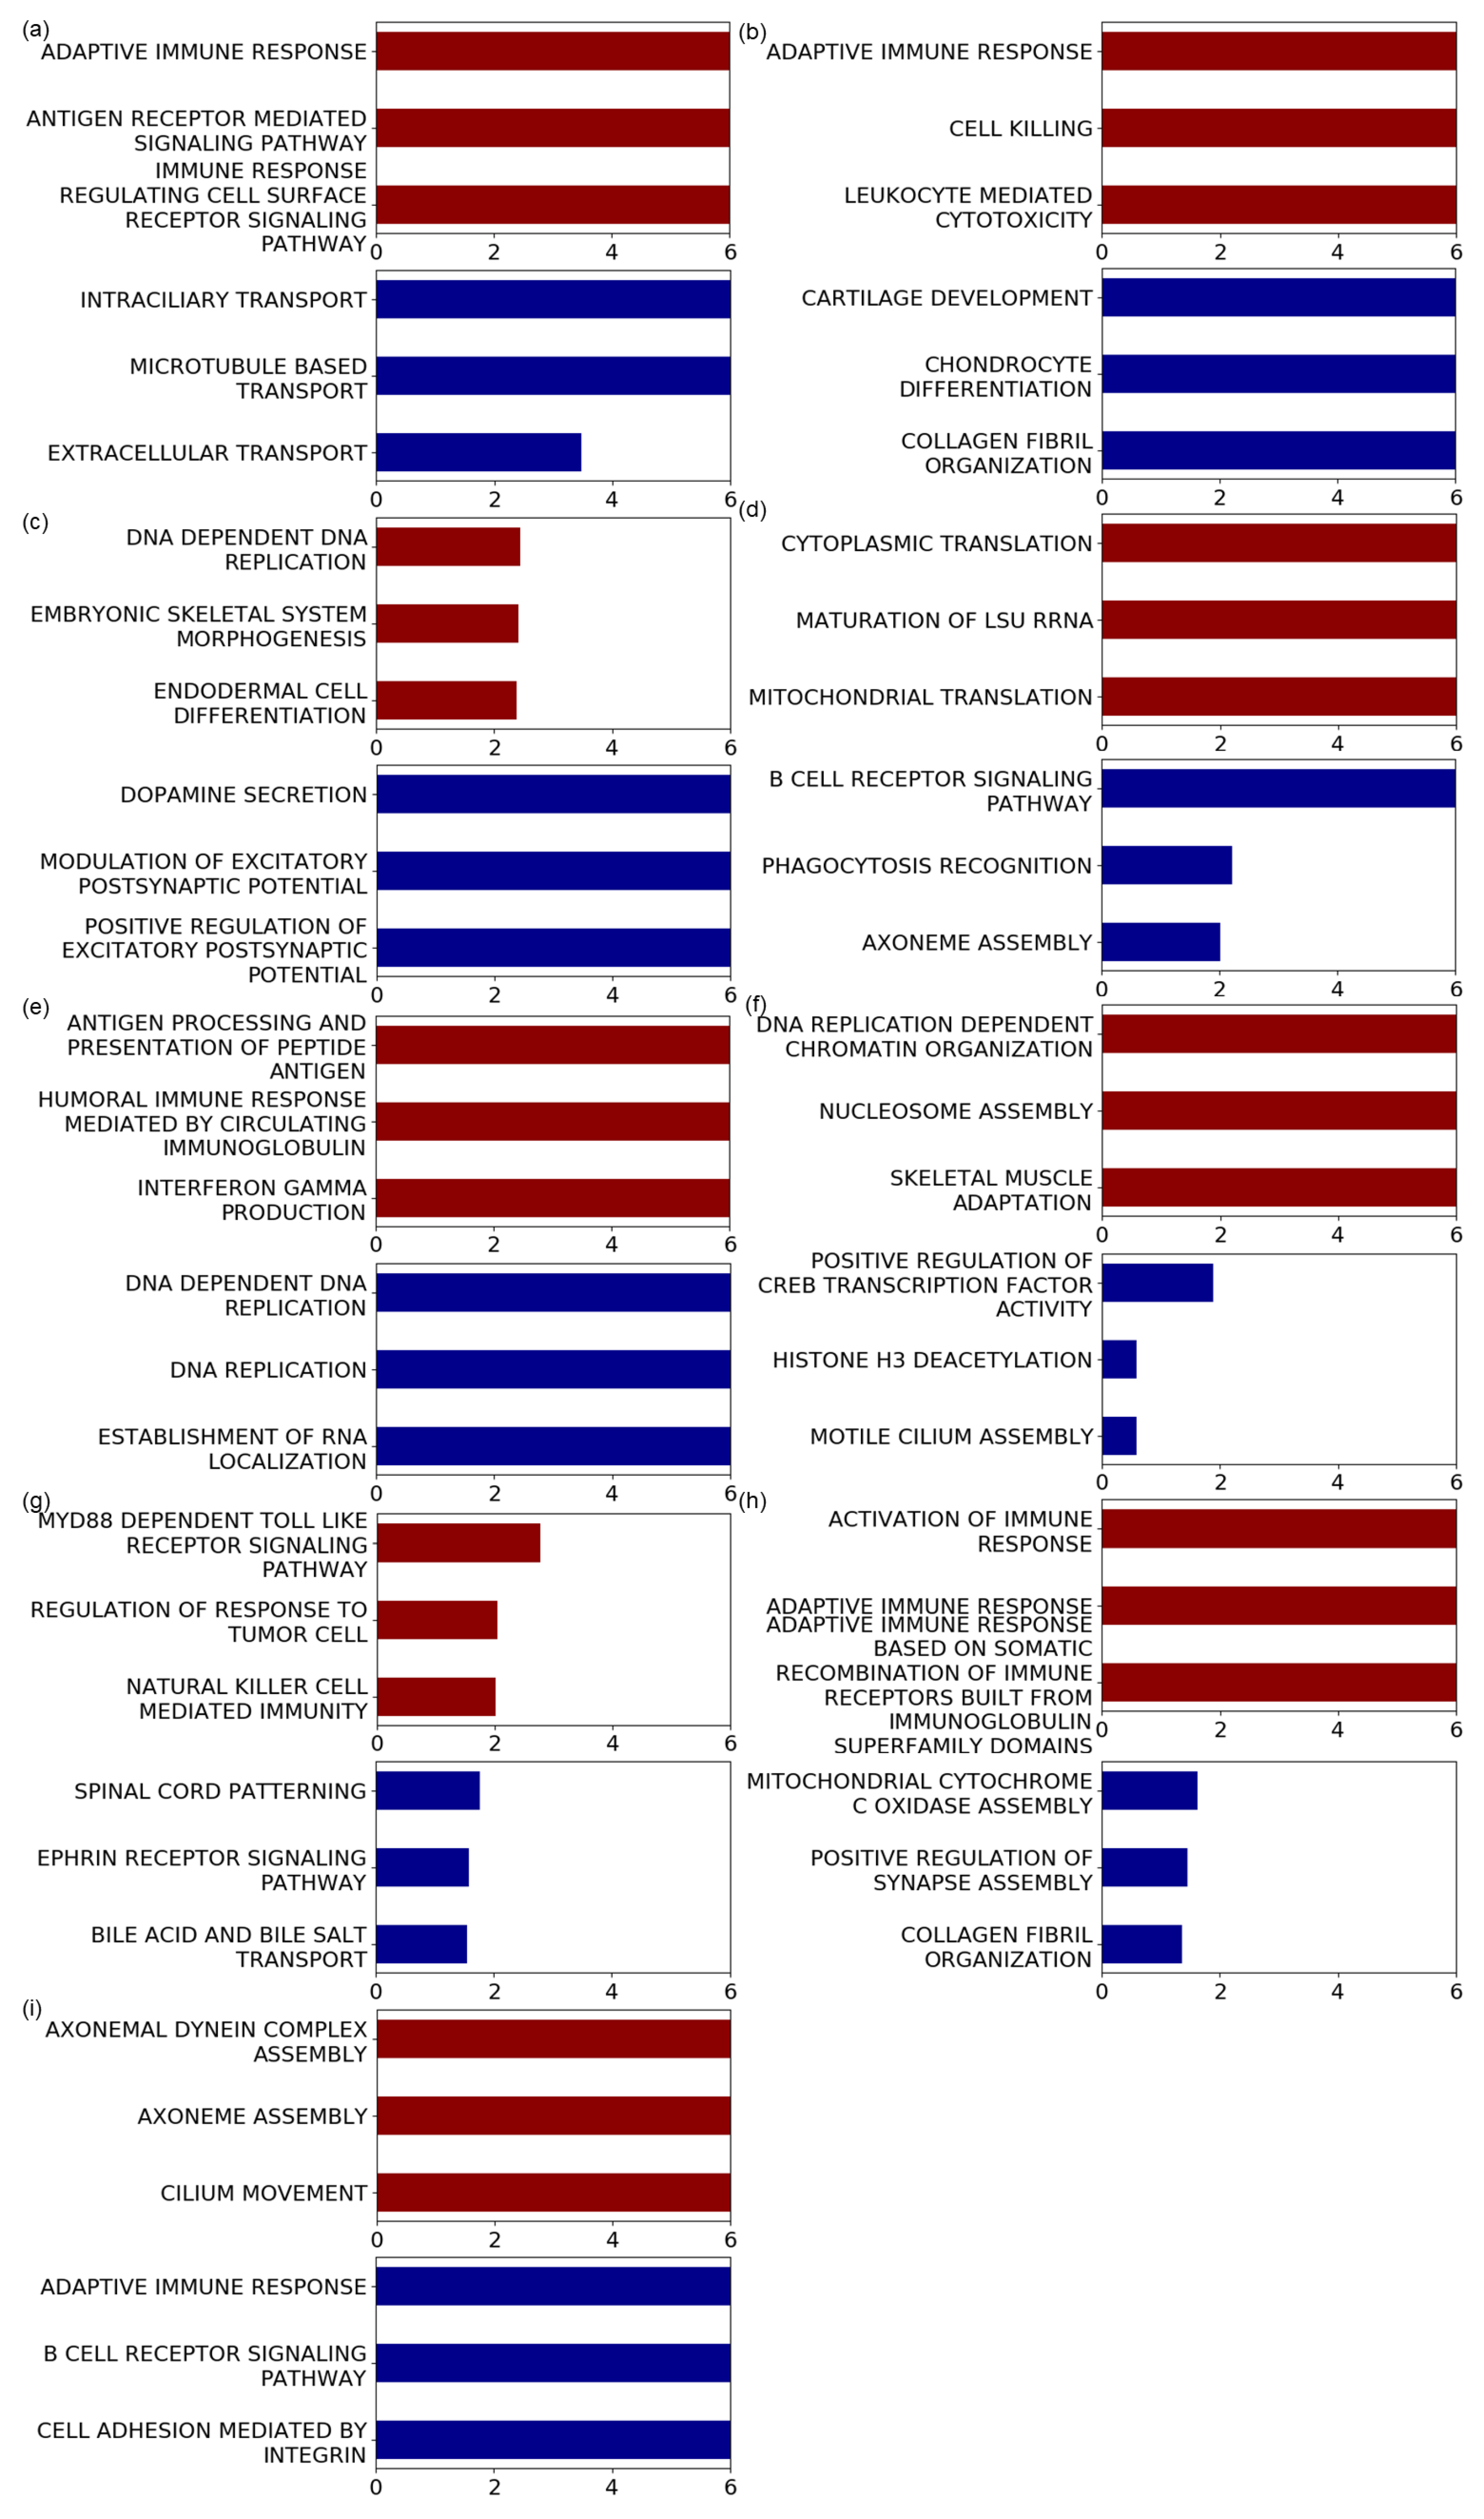
3.3. Genesets Associated with the Identified Mutational Signatures

To further validate the approach used, this study performed GSEA [40] against a pre-ranked list of genes (GSEApreranked) by the PCCs between the mutational signatures and the expression values of the genes. Figure 5 shows the results of GSEApreranked with pre-defined GO BP genesets for nine tumor types (BRCA, HNSC, LGG, LUAD, LUSC, PRAD, SKCM, THCA, and UCEC) with the largest number of samples (>450 samples), and Supplementary Tables S1–S50 show the complete results with FDR < 0.25 for all tumor types.
When firstly showing the enriched GO BP terms based on the positively correlated gene, in BRCA, immune-related terms such as adaptive immune response, antigen receptor-mediated signaling pathway, and immune response regulating cell surface receptor signaling pathway were mainly observed. These properties have also been observed in other tumor types. For example, in HNSC and LUSC, the GO BP terms with the lowest FDR values were adaptive immune response, antigen processing, and presentation of peptide antigen with FDR < 1.0 × 10 6 . For SKCM, terms such as natural killer cell-mediated immunity (FDR = 0.0094), positive regulation of natural killer cell-mediated cytotoxicity (FDR = 0.010), and regulation of natural killer cell-mediated immunity (FDR = 0.012) were among the top five GO BP terms. In addition, for THCA, GO BP terms, such as adaptive immune response, immune response regulating cell surface receptor signaling pathway, and leukocyte-mediated immunity, were uncovered with FDR < 1.0 × 10 6 . For LGG, brain-related terms, such as neurons or synapses, were primarily discovered, but some immune-related terms, including antigen processing and presentation of peptide antigen via MHC class I (FDR = 0.030) were also enriched.
In some tumor types, negatively correlated genes were mainly enriched in immune-related terms. In LUAD, the two terms with the lowest FDR values were the B cell receptor signaling pathway (FDR < 1.0 × 10 6 ) and phagocytosis recognition (FDR = 0.0060). In addition, in UCEC, terms for GO BP such as adaptive immune response (FDR < 1.0 × 10 6 ) and B cell receptor signaling pathway (FDR < 1.0 × 10 6 ) were mainly observed.
In addition, GSEApreranked results using other tumor types not represented in Figure 5 also revealed that immune-related terms were highly enriched. For instance, the top-ranked GO BP terms for positively correlated genes in BLCA were the B cell receptor signaling pathway (FDR = 0.0036). In KIRC, terms such as negative regulation of immune response (FDR = 3.01 × 10 5 ), positive regulation of interleukin 4 production (FDR = 3.12 × 10 5 ), and negative regulation of immune system processes (FDR = 3.15 × 10 5 ) were frequently observed. Furthermore, when searching for negatively correlated genes, for COAD, many of the enriched GO terms for negatively correlated genes were immune-related, including activation of the immune response, adaptive immune response, antigen receptor-mediated signaling pathway, and B cell-mediated immunity, whose FDRs were lower than 1.0 × 10 6 . As another example, STAD also revealed many immune-related terms with statistical significance, including B cell receptor signaling pathway (FDR 5.83 × 10 5 ), B cell homeostasis (FDR = 0.0050), antigen processing and presentation of exogenous antigen (FDR = 0.0053), regulation of leukocyte adhesion to vascular endothelial cells (FDR = 0.0073), and antigen processing and presentation of exogenous peptide antigen (FDR = 0.0075).

4. Discussion

The analysis of the mutational signatures of tumor patients has expanded the existing understanding of the tumor genome and provided new insights into tumor initiation and progression. However, identifying the biological processes and functions underlying somatic mutagenesis remains challenging. This study searched for mutational signatures associated with immune cell infiltration in patients with tumors using non-negative CCA and verified that the approach would be useful to uncover their functional roles in survival and immunological contexts. To my knowledge, this study is the first work to systematically investigate the functional roles of the mutational signatures. Although some variables (mutational signatures) may represent negative effects on the immune cell infiltration, the non-negative constraints of the coefficients help to interpret the influences of the variables using the magnitude of the coefficient values, similar to NMF which has commonly been used in many biological data analyses [46,47,48].
The composition of mutational signatures in each tumor sample was estimated using deconstructSigs. Although the COSMIC mutational signature version 3 was constructed recently, deconstructSigs did not support version 3. Moreover, single base substitution (SBS) signatures were partitioned into 60 signatures, which is an excessive amount of variables compared to the number of samples, and it would lead to making the interpretation difficult. Mutational signature version 2 was therefore used in this experiment.
The estimation of cell subtype composition based on the bulk gene expression profiles can facilitate advanced analysis of heterogeneous tumor samples and has the potential to provide crucial insights into functional genomics research. Despite the innovative value of tumor genome analysis, the estimation results of these approaches are not reliable. Recently, Strum et al. conducted a systematic evaluation of computational methods used to assess the abundance of cell subtypes from bulk transcriptome data [49]. They showed that EPIC was one of the most reliable methods; thus, I chose EPIC to estimate the cellular composition.
As mentioned above, the relationships between the mutational signatures and immunity were studied in LUSC [11,12], which showed that the APOBEC signature was associated with the immune response. Furthermore, recently, the relationship between APOBEC mutagenesis and the immune response in breast cancer has been reported [50], and some studies have shown an association between APOBEC mutagenesis and immunity in HNSC [51,52]. In my experimental results, the APOBEC signatures were also observed as the highest coefficients in BRCA, HNSC, as well as LUSC. Moreover, the identified mutational signatures were distinct from the abundance of mutational signatures in each tumor type, Thus, these results verified that the CCA-based approach was valid for the identification of immunity-related mutational signatures.
A limitation of this study was that it did not use molecular features or clinical information such as tumor grade, histology, and lymph node involvement. For instance, breast tumors were subdivided into luminal A, luminal B, basal-like, Her2-enriched, etc. By subgrouping the samples based on oncological features or molecular properties, subsequent analysis might obtain informative functional characteristics of the mutational signatures.
Instead, this study carried out survival analysis using the correlated genes with the mutational signatures identified by non-negative CCA. Survival analysis is a useful data-driven method for clinical trials. In our experiment, in most of tumor types, the p-values were lower than or close to 0.05, as shown in Figure 4. Although three tumor types, HNSC, LUAD, and OV, showed relatively high p-values (>0.1), relative differences between the two groups were observed in the Kaplan–Meier plots. Especially, CASP8 in HNSC is a well-known cancer-related gene included in the Cancer Gene Census whose somatic mutation is predominantly observed in oral squamous cells. Although a very low p-value was not achieved in this survival analysis, the CASP8 gene plays an important role in programmed cell death, and many studies have demonstrated that this gene is associated with tumor prognosis and immune signatures [53,54]. Similarly, it has been reported that the BPTF gene, detected in LUSC, is related to prognosis and survival in lung adenocarcinoma, non-small cell lung cancer [55,56], and tumor microenvironments [57]. Moreover, TTN identified in OV is the longest gene in the human genome, and is thus usually excluded from cancer genome analyses because of its much higher chance of being mutated. The gene with the second highest PCC in OV was MACF1, contributing to tumor progression [58]; its clinical importance and relationship to survival of the gene was recently discovered in serious ovarian cancer [59]. Thus, it would be proven that our approach was reliable to search the mutational signatures related to immunity and survival outcome. Eventually, the study might potentially be applied in clinical applications to improve patient survival.
Tumor development and progression are associated with the accumulation of the mutations, but not all the sequence alterations cause tumors. Therefore, the identification of the driver mutations and the finding of their functional roles are some of the major problems in tumor research. However, the mutational signatures did not clearly explain the acquisition of a specific driver mutation according to the mutation-causing processes. Nevertheless, a recent study explored how the molecular influences of the passenger mutations and the mutational signatures are related to the molecular functional impact [60]. Likewise, my experimental results showed the functional aspects of the mutational signatures, particularly related to immune activities, even though I did not handle the tumor driver genes directly. Moreover, on the other hand, some studies have attempted to analyze the connection between the mutational processes and the gain of the driver mutations by positive selection during cancer evolution [61,62]. By utilizing the links of the mutational signatures and the driver or passenger mutations from these kinds of studies, it would be possible to enhance the knowledge of tumor initiation, evolution, and immune activity.
A limitation of this study was that it did not consider molecular features or clinical information such as tumor grade, histology, and lymph node involvement. For instance, breast tumors were subdivided into luminal A, luminal B, basal-like, Her2-enriched, etc. By subgrouping the samples based on oncological features or molecular properties, subsequent analysis might obtain informative functional characteristics of the mutational signatures. Thus, in future works, in-depth investigations on a single cancer type should be carried out to uncover the relationships between the mutational signatures and the tumor infiltration.
To fully grasp the potential of mutational signatures, additional studies are required to develop a mechanistic understanding of how mutational signatures form. Further integrative analyses using multi-omics data and clinical information may provide novel information or insights to help understand the roles of mutational signatures in tumor biology. For instance, it might be possible to understand why distinct mutational signatures are related to different prognoses and immune reactions and can help predict patient responses to drugs or immunotherapy by combining various clinical data. Moreover, it is also necessary to determine how mutational signatures are related to previously identified clinical and molecular biomarkers. Furthermore, in future works, in-depth investigations on a single cancer type should be carried out to uncover the relationships between the mutational signatures and the tumor infiltration.

5. Conclusions

In conclusion, this research investigated the mutational signatures associated with immune cell infiltration in non-negative CCA. It is the first comprehensive analysis to investigate the relationships between mutational signatures and their functional consequences. This approach will help examine the functional roles of mutational signatures by systematically applying other types of datasets. Thus, this study serves as a basis for utilizing mutational signatures as valuable information for both scientific research and clinical applications.

Supplementary Materials

The following are available online at https://www.mdpi.com/article/10.3390/app12136596/s1, Figure S1: Correlation between mutational signatures and genes with somatic mutation, Figure S2: Correlation between mutational signatures and genomic alteration, Figure S3: Scatter plot for non-negative CCA result, Figure S4: Coefficients for second component of the mutational signatures by the non-negative CCA, Table S1: GO biological processes (BPs) associated with positively correlated genes by GSEApreranked in BLCA (FDR < 0.25), Table S2: GO BP associated with negatively correlated genes in BLCA, Table S3: GO BP associated with positively correlated genes in BRCA, Table S4: GO BP associated with negatively correlated genes in BRCA, Table S5: GO BP associated with positively correlated genes in CESC, Table S6: GO BP associated with negatively correlated genes in CESC, Table S7: GO BP associated with positively correlated genes in COAD, Table S8: GO BP associated with negatively correlated genes in COAD, Table S9: GO BP associated with positively correlated genes in ESCA, Table S10: GO BP associated with negatively correlated genes in ESCA, Table S11: GO BP associated with positively correlated genes in GBM, Table S12: GO BP associated with negatively correlated genes in GBM, Table S13: GO BP associated with positively correlated genes in HNSC, Table S14: GO BP associated with negatively correlated genes in HNSC, Table S15: GO BP associated with positively correlated genes in KIRC, Table S16: GO BP associated with negatively correlated genes in KIRC, Table S17: GO BP associated with positively correlated genes in KIRP, Table S18: GO BP associated with negatively correlated genes in KIRP, Table S19: GO BP associated with positively correlated genes in LGG, Table S20: GO BP associated with negatively correlated genes in LGG, Table S21: GO BP associated with positively correlated genes in LIHC, Table S22: GO BP associated with negatively correlated genes in LIHC, Table S23: GO BP associated with positively correlated genes in LUAD, Table S24: GO BP associated with negatively correlated genes in LUAD, Table S25: GO BP associated with positively correlated genes in LUSC, Table S26: GO BP associated with negatively correlated genes in LUSC, Table S27: GO BP associated with positively correlated genes in OV, Table S28: GO BP associated with negatively correlated genes in OV, Table S29: GO BP associated with positively correlated genes in PAAD, Table S30: GO BP associated with negatively correlated genes in PAAD, Table S31: GO BP associated with positively correlated genes in PCPG, Table S32: GO BP associated with negatively correlated genes in PCPG, Table S33: GO BP associated with positively correlated genes in PRAD, Table S34: GO BP associated with negatively correlated genes in PRAD, Table S35: GO BP associated with positively correlated genes in READ, Table S36: GO BP associated with negatively correlated genes in READ, Table S37: GO BP associated with positively correlated genes in SARC, Table S38: GO BP associated with negatively correlated genes in SARC, Table S39: GO BP associated with positively correlated genes in SKCM, Table S40: GO BP associated with negatively correlated genes in SKCM, Table S41: GO BP associated with positively correlated genes in STAD, Table S42: GO BP associated with negatively correlated genes in STAD, Table S43: GO BP associated with positively correlated genes in TGCT, Table S44: GO BP associated with negatively correlated genes in TGCT, Table S45: GO BP associated with positively correlated genes in THCA, Table S46: GO BP associated with negatively correlated genes in THCA, Table S47: GO BP associated with positively correlated genes in THYM, Table S48: GO BP associated with negatively correlated genes in THYM, Table S49: GO BP associated with positively correlated genes in UCEC, Table S50: GO BP associated with negatively correlated genes in UCEC.

Funding

This research was supported by National Research Foundation of Korea (NRF) funded by Ministry of Science and ICT (grant number NRF-2021R1C1C1008307) and by Ministry of Education (grant number 2021R1A6A1A10044154)).

Institutional Review Board Statement

Not applicable.

Informed Consent Statement

Not applicable.

Data Availability Statement

All of the data and results in these experiments are available at Zenodo (https://zenodo.org/record/6510425 (accessed on 4 May 2022)).

Acknowledgments

I appreciate Seongdo Jeong for preliminary experiments.

Conflicts of Interest

The author declares no conflict of interest.

References

  1. Poon, S.L.; McPherson, J.R.; Tan, P.; Teh, B.T.; Rozen, S.G. Mutation signatures of carcinogen exposure: Genome-wide detection and new opportunities for cancer prevention. Genome Med. 2014, 6, 24. [Google Scholar] [CrossRef] [PubMed] [Green Version]
  2. Rideout, W.M., III; Coetzee, G.A.; Olumi, A.F.; Jones, P.A. 5-Methylcytosine as an endogenous mutagen in the human LDL receptor and p53 genes. Science 1990, 249, 1288–1290. [Google Scholar] [CrossRef] [PubMed]
  3. Ma, J.; Setton, J.; Lee, N.Y.; Riaz, N.; Powell, S.N. The therapeutic significance of mutational signatures from DNA repair deficiency in cancer. Nat. Commun. 2018, 9, 1–12. [Google Scholar] [CrossRef]
  4. Cervantes-Gracia, K.; Gramalla-Schmitz, A.; Weischedel, J.; Chahwan, R. APOBECs orchestrate genomic and epigenomic editing across health and disease. Trends Genet. 2021, 37, 1028–1043. [Google Scholar] [CrossRef] [PubMed]
  5. Alexandrov, L.B.; Kim, J.; Haradhvala, N.J.; Huang, M.N.; Tian Ng, A.W.; Wu, Y.; Boot, A.; Covington, K.R.; Gordenin, D.A.; Bergstrom, E.N.; et al. The repertoire of mutational signatures in human cancer. Nature 2020, 578, 94–101. [Google Scholar] [CrossRef] [Green Version]
  6. Kim, Y.A.; Leiserson, M.D.; Moorjani, P.; Sharan, R.; Wojtowicz, D.; Przytycka, T.M. Mutational signatures: From methods to mechanisms. Annu. Rev. Biomed. Data Sci. 2021, 4, 189–206. [Google Scholar] [CrossRef]
  7. Alexandrov, L.B.; Nik-Zainal, S.; Wedge, D.C.; Aparicio, S.A.; Behjati, S.; Biankin, A.V.; Bignell, G.R.; Bolli, N.; Borg, A.; Børresen-Dale, A.L.; et al. Signatures of mutational processes in human cancer. Nature 2013, 500, 415–421. [Google Scholar] [CrossRef] [Green Version]
  8. Van Hoeck, A.; Tjoonk, N.H.; van Boxtel, R.; Cuppen, E. Portrait of a cancer: Mutational signature analyses for cancer diagnostics. BMC Cancer 2019, 19, 457. [Google Scholar] [CrossRef]
  9. Koh, G.; Degasperi, A.; Zou, X.; Momen, S.; Nik-Zainal, S. Mutational signatures: Emerging concepts, caveats and clinical applications. Nat. Rev. Cancer 2021, 21, 619–637. [Google Scholar] [CrossRef]
  10. Brady, S.W.; Gout, A.M.; Zhang, J. Therapeutic and prognostic insights from the analysis of cancer mutational signatures. Trends Genet. 2021, 38, 194–208. [Google Scholar] [CrossRef]
  11. Chen, H.; Chong, W.; Teng, C.; Yao, Y.; Wang, X.; Li, X. The immune response-related mutational signatures and driver genes in non-small-cell lung cancer. Cancer Sci. 2019, 110, 2348. [Google Scholar] [CrossRef] [PubMed]
  12. Wang, S.; Jia, M.; He, Z.; Liu, X.S. APOBEC3B and APOBEC mutational signature as potential predictive markers for immunotherapy response in non-small cell lung cancer. Oncogene 2018, 37, 3924–3936. [Google Scholar] [CrossRef] [PubMed]
  13. Roberts, S.A.; Lawrence, M.S.; Klimczak, L.J.; Grimm, S.A.; Fargo, D.; Stojanov, P.; Kiezun, A.; Kryukov, G.V.; Carter, S.L.; Saksena, G.; et al. An APOBEC cytidine deaminase mutagenesis pattern is widespread in human cancers. Nat. Genet. 2013, 45, 970–976. [Google Scholar] [CrossRef] [PubMed]
  14. Middlebrooks, C.D.; Banday, A.R.; Matsuda, K.; Udquim, K.I.; Onabajo, O.O.; Paquin, A.; Figueroa, J.D.; Zhu, B.; Koutros, S.; Kubo, M.; et al. Association of germline variants in the APOBEC3 region with cancer risk and enrichment with APOBEC-signature mutations in tumors. Nat. Genet. 2016, 48, 1330–1338. [Google Scholar] [CrossRef]
  15. Härdle, W.K.; Simar, L. Canonical correlation analysis. In Applied Multivariate Statistical Analysis; Springer: Berlin/Heidelberg, Germany, 2015; pp. 443–454. [Google Scholar]
  16. Luo, Y.; Tao, D.; Ramamohanarao, K.; Xu, C.; Wen, Y. Tensor canonical correlation analysis for multi-view dimension reduction. IEEE Trans. Knowl. Data Eng. 2015, 27, 3111–3124. [Google Scholar] [CrossRef] [Green Version]
  17. Yang, X.; Liu, W.; Liu, W.; Tao, D. A survey on canonical correlation analysis. IEEE Trans. Knowl. Data Eng. 2019, 33, 2349–2368. [Google Scholar] [CrossRef]
  18. Sun, L.; Ji, S.; Ye, J. Canonical correlation analysis for multilabel classification: A least-squares formulation, extensions, and analysis. IEEE Trans. Pattern Anal. Mach. Intell. 2010, 33, 194–200. [Google Scholar]
  19. Shen, C.; Sun, M.; Tang, M.; Priebe, C.E. Generalized canonical correlation analysis for classification. J. Multivar. Anal. 2014, 130, 310–322. [Google Scholar] [CrossRef]
  20. Chaudhuri, K.; Kakade, S.M.; Livescu, K.; Sridharan, K. Multi-view clustering via canonical correlation analysis. In Proceedings of the 26th Annual International Conference on Machine Learning, Montreal, BC, Canada, 14–18 June 2009; pp. 129–136. [Google Scholar]
  21. Rhee, J.K.; Joung, J.G.; Chang, J.H.; Fei, Z.; Zhang, B.T. Identification of cell cycle-related regulatory motifs using a kernel canonical correlation analysis. BMC Genom. Biomed. Cent. 2009, 10, S29. [Google Scholar] [CrossRef] [Green Version]
  22. Soneson, C.; Lilljebjörn, H.; Fioretos, T.; Fontes, M. Integrative analysis of gene expression and copy number alterations using canonical correlation analysis. BMC Bioinform. 2010, 11, 191. [Google Scholar] [CrossRef] [Green Version]
  23. Rodosthenous, T.; Shahrezaei, V.; Evangelou, M. Integrating multi-OMICS data through sparse canonical correlation analysis for the prediction of complex traits: A comparison study. Bioinformatics 2020, 36, 4616–4625. [Google Scholar] [CrossRef] [PubMed]
  24. Tan, H.; Zhang, X.; Lan, L.; Huang, X.; Luo, Z. Nonnegative constrained graph based canonical correlation analysis for multi-view feature learning. Neural Process. Lett. 2019, 50, 1215–1240. [Google Scholar] [CrossRef]
  25. Sigg, C.; Fischer, B.; Ommer, B.; Roth, V.; Buhmann, J. Nonnegative CCA for audiovisual source separation. In Proceedings of the 2007 IEEE Workshop on Machine Learning for Signal Processing, Thessaloniki, Greece, 27–29 August 2007; pp. 253–258. [Google Scholar]
  26. Goldman, M.J.; Craft, B.; Hastie, M.; Repečka, K.; McDade, F.; Kamath, A.; Banerjee, A.; Luo, Y.; Rogers, D.; Brooks, A.N.; et al. Visualizing and interpreting cancer genomics data via the Xena platform. Nat. Biotechnol. 2020, 38, 675–678. [Google Scholar] [CrossRef] [PubMed]
  27. Anders, S.; Pyl, P.T.; Huber, W. HTSeq—A Python framework to work with high-throughput sequencing data. Bioinformatics 2015, 31, 166–169. [Google Scholar] [CrossRef]
  28. Pachter, L. Models for transcript quantification from RNA-Seq. arXiv 2011, arXiv:1104.3889. [Google Scholar]
  29. Zhao, Y.; Li, M.C.; Konaté, M.M.; Chen, L.; Das, B.; Karlovich, C.; Williams, P.M.; Evrard, Y.A.; Doroshow, J.H.; McShane, L.M. TPM, FPKM, or normalized counts? A comparative study of quantification measures for the analysis of RNA-seq data from the NCI patient-derived models repository. J. Transl. Med. 2021, 19, 1–15. [Google Scholar] [CrossRef]
  30. Rosenthal, R.; McGranahan, N.; Herrero, J.; Taylor, B.S.; Swanton, C. DeconstructSigs: Delineating mutational processes in single tumors distinguishes DNA repair deficiencies and patterns of carcinoma evolution. Genome Biol. 2016, 17, 1–11. [Google Scholar] [CrossRef] [Green Version]
  31. Mutational Signatures v2. Available online: https://cancer.sanger.ac.uk/signatures/signatures_v2/ (accessed on 31 March 2015).
  32. Racle, J.; de Jonge, K.; Baumgaertner, P.; Speiser, D.E.; Gfeller, D. Simultaneous enumeration of cancer and immune cell types from bulk tumor gene expression data. Elife 2017, 6, e26476. [Google Scholar] [CrossRef]
  33. Mackey, L. Deflation methods for sparse PCA. In Proceedings of the 21st International Conference on Neural Information Processing Systems, Vancouver, BC, Canada, 8–10 December 2008; pp. 1017–1024. [Google Scholar]
  34. Uurtio, V.; Monteiro, J.M.; Kandola, J.; Shawe-Taylor, J.; Fernandez-Reyes, D.; Rousu, J. A tutorial on canonical correlation methods. ACM Comput. Surv. 2017, 50, 1–33. [Google Scholar] [CrossRef] [Green Version]
  35. Vía, J.; Santamaría, I.; Pérez, J. A robust RLS algorithm for adaptive canonical correlation analysis. In Proceedings of the (ICASSP’05) IEEE International Conference on Acoustics, Speech, and Signal Processing, Philadelphia, PA, USA, 23 March 2005; Volume 4, pp. iv365–iv368. [Google Scholar]
  36. Fischer, B.; Roth, V.; Buhmann, J.M. Time-series alignment by non-negative multiple generalized canonical correlation analysis. BMC Bioinform. Biomed. Cent. 2007, 8, S4. [Google Scholar]
  37. Sun, L.; Ji, S.; Ye, J. A least squares formulation for canonical correlation analysis. In Proceedings of the 25th International Conference on Machine Learning, Helsinki, Finland, 5–9 July 2008; pp. 1024–1031. [Google Scholar]
  38. Hothorn, T.; Lausen, B. On the exact distribution of maximally selected rank statistics. Comput. Stat. Data Anal. 2003, 43, 121–137. [Google Scholar] [CrossRef]
  39. Mootha, V.K.; Lindgren, C.M.; Eriksson, K.F.; Subramanian, A.; Sihag, S.; Lehar, J.; Puigserver, P.; Carlsson, E.; Ridderstråle, M.; Laurila, E.; et al. PGC-1α-responsive genes involved in oxidative phosphorylation are coordinately downregulated in human diabetes. Nat. Genet. 2003, 34, 267–273. [Google Scholar] [CrossRef] [PubMed]
  40. Subramanian, A.; Tamayo, P.; Mootha, V.K.; Mukherjee, S.; Ebert, B.L.; Gillette, M.A.; Paulovich, A.; Pomeroy, S.L.; Golub, T.R.; Lander, E.S.; et al. Gene set enrichment analysis: A knowledge-based approach for interpreting genome-wide expression profiles. Proc. Natl. Acad. Sci. USA 2005, 102, 15545–15550. [Google Scholar] [CrossRef] [Green Version]
  41. Liberzon, A.; Birger, C.; Thorvaldsdóttir, H.; Ghandi, M.; Mesirov, J.P.; Tamayo, P. The molecular signatures database hallmark gene set collection. Cell Syst. 2015, 1, 417–425. [Google Scholar] [CrossRef] [PubMed] [Green Version]
  42. Polak, P.; Kim, J.; Braunstein, L.Z.; Karlic, R.; Haradhavala, N.J.; Tiao, G.; Rosebrock, D.; Livitz, D.; Kübler, K.; Mouw, K.W.; et al. A mutational signature reveals alterations underlying deficient homologous recombination repair in breast cancer. Nat. Genet. 2017, 49, 1476–1486. [Google Scholar] [CrossRef] [PubMed]
  43. Póti, Á.; Gyergyák, H.; Németh, E.; Rusz, O.; Tóth, S.; Kovácsházi, C.; Chen, D.; Szikriszt, B.; Spisák, S.; Takeda, S.; et al. Correlation of homologous recombination deficiency induced mutational signatures with sensitivity to PARP inhibitors and cytotoxic agents. Genome Biol. 2019, 20, 1–13. [Google Scholar] [CrossRef]
  44. Alexandrov, L.B.; Ju, Y.S.; Haase, K.; van Loo, P.; Martincorena, I.; Nik-Zainal, S.; Totoki, Y.; Fujimoto, A.; Nakagawa, H.; Shibata, T.; et al. Mutational signatures associated with tobacco smoking in human cancer. Science 2016, 354, 618–622. [Google Scholar] [CrossRef] [Green Version]
  45. Sondka, Z.; Bamford, S.; Cole, C.G.; Ward, S.A.; Dunham, I.; Forbes, S.A. The COSMIC Cancer Gene Census: Describing genetic dysfunction across all human cancers. Nat. Rev. Cancer 2018, 18, 696–705. [Google Scholar] [CrossRef]
  46. Devarajan, K. Nonnegative matrix factorization: An analytical and interpretive tool in computational biology. PLoS Comput. Biol. 2008, 4, e1000029. [Google Scholar] [CrossRef] [PubMed]
  47. Yang, Z.; Michailidis, G. A non-negative matrix factorization method for detecting modules in heterogeneous omics multi-modal data. Bioinformatics 2016, 32, 1–8. [Google Scholar] [CrossRef] [Green Version]
  48. Lin, X.; Boutros, P.C. Optimization and expansion of non-negative matrix factorization. BMC Bioinform. 2020, 21, 7. [Google Scholar] [CrossRef] [PubMed] [Green Version]
  49. Sturm, G.; Finotello, F.; Petitprez, F.; Zhang, J.D.; Baumbach, J.; Fridman, W.H.; List, M.; Aneichyk, T. Comprehensive evaluation of transcriptome-based cell-type quantification methods for immuno-oncology. Bioinformatics 2019, 35, i436–i445. [Google Scholar] [CrossRef] [PubMed]
  50. DiMarco, A.V.; Qin, X.; McKinney, B.J.; Garcia, N.M.G.; van Alsten, S.C.; Mendes, E.A.; Force, J.; Hanks, B.A.; Troester, M.A.; Owzar, K.; et al. APOBEC Mutagenesis Inhibits Breast Cancer Growth through Induction of T cell–Mediated Antitumor Immune Responses. Cancer Immunol. Res. 2022, 10, 70–86. [Google Scholar] [CrossRef] [PubMed]
  51. Venkatesan, S.; Rosenthal, R.; Kanu, N.; McGranahan, N.; Bartek, J.; Quezada, S.; Hare, J.; Harris, R.; Swanton, C. Perspective: APOBEC mutagenesis in drug resistance and immune escape in HIV and cancer evolution. Ann. Oncol. 2018, 29, 563–572. [Google Scholar] [CrossRef] [PubMed]
  52. Faden, D.L.; Ding, F.; Lin, Y.; Zhai, S.; Kuo, F.; Chan, T.A.; Morris, L.G.; Ferris, R.L. APOBEC mutagenesis is tightly linked to the immune landscape and immunotherapy biomarkers in head and neck squamous cell carcinoma. Oral Oncol. 2019, 96, 140–147. [Google Scholar] [CrossRef]
  53. Li, C.; Egloff, A.M.; Sen, M.; Grandis, J.R.; Johnson, D.E. Caspase-8 mutations in head and neck cancer confer resistance to death receptor-mediated apoptosis and enhance migration, invasion, and tumor growth. Mol. Oncol. 2014, 8, 1220–1230. [Google Scholar] [CrossRef] [Green Version]
  54. Ghanekar, Y.; Sadasivam, S. In silico analysis reveals a shared immune signature in CASP8-mutated carcinomas with varying correlations to prognosis. PeerJ 2019, 7, e6402. [Google Scholar] [CrossRef] [Green Version]
  55. Dai, M.; Lu, J.J.; Guo, W.; Yu, W.; Wang, Q.; Tang, R.; Tang, Z.; Xiao, Y.; Li, Z.; Sun, W.; et al. BPTF promotes tumor growth and predicts poor prognosis in lung adenocarcinomas. Oncotarget 2015, 6, 33878. [Google Scholar] [CrossRef] [Green Version]
  56. Gong, Y.; Liu, D.; Li, X.; Dai, S. BPTF biomarker correlates with poor survival in human NSCLC. Eur. Rev. Med. Pharmacol. Sci. 2017, 21, 102–107. [Google Scholar]
  57. Mayes, K.; Alkhatib, S.G.; Peterson, K.; Alhazmi, A.; Song, C.; Chan, V.; Blevins, T.; Roberts, M.; Dumur, C.I.; Wang, X.Y.; et al. BPTF Depletion Enhances T-cell–Mediated Antitumor Immunity. Cancer Res. 2016, 76, 6183–6192. [Google Scholar] [CrossRef] [Green Version]
  58. Miao, Z.; Ali, A.; Hu, L.; Zhao, F.; Yin, C.; Chen, C.; Yang, T.; Qian, A. Microtubule actin cross-linking factor 1, a novel potential target in cancer. Cancer Sci. 2017, 108, 1953–1958. [Google Scholar] [CrossRef] [PubMed] [Green Version]
  59. Liu, L.; Hu, K.; Zeng, Z.; Xu, C.; Lv, J.; Lin, Z.; Wen, B. Expression and Clinical Significance of Microtubule-Actin Cross-Linking Factor 1 in Serous Ovarian Cancer. Recent Patents-Anti-Cancer Drug Discov. 2021, 16, 66–72. [Google Scholar] [CrossRef] [PubMed]
  60. Kumar, S.; Warrell, J.; Li, S.; McGillivray, P.D.; Meyerson, W.; Salichos, L.; Harmanci, A.; Martinez-Fundichely, A.; Chan, C.W.; Nielsen, M.M.; et al. Passenger mutations in more than 2,500 cancer genomes: Overall molecular functional impact and consequences. Cell 2020, 180, 915–927. [Google Scholar] [CrossRef] [PubMed]
  61. Temko, D.; Tomlinson, I.P.; Severini, S.; Schuster-Böckler, B.; Graham, T.A. The effects of mutational processes and selection on driver mutations across cancer types. Nat. Commun. 2018, 9, 1–10. [Google Scholar] [CrossRef] [Green Version]
  62. Wong, J.K.; Aichmüller, C.; Schulze, M.; Hlevnjak, M.; Elgaafary, S.; Lichter, P.; Zapatka, M. Association of mutation signature effectuating processes with mutation hotspots in driver genes and non-coding regions. Nat. Commun. 2022, 13, 1–13. [Google Scholar] [CrossRef]
Figure 1. Schematic overview of the method. The two input datasets for non-negative CCA were composed of identical samples. A and M are matrices of the cell type abundance and the mutational process, respectively, and ω and β are coefficient vectors for the linear mapping.
Applsci 12 06596 g001
Figure 2. Average occurrences of mutational signatures. The figure shows the average values for the composition of the mutational signatures estimated by deconstructedSigs for each tumor type.
Applsci 12 06596 g002
Figure 3. Coefficients ( β ) of the mutational signatures by the non-negative CCA. The figures show the coefficients of the variables (mutational signatures) for the first canonical component. The signatures are represented by sorting the coefficients for each tumor type in descending order. The coefficient with a zero value is denoted as NA.
Applsci 12 06596 g003
Figure 4. Survival analyses with Kaplan–Meier plots and log-rank tests for overall survival (OS). The samples were stratified using the expression values of a gene, as indicated in the upper legend of the plot. The p-values were measured using log-rank tests for each tumor type: (a) BLCA, (b) BRCA, (c) COAD, (d) ESCA, (e) HNSC, (f) KIRC, (g) LGG, (h) LIHC, (i) LUAD, (j) LUSC, (k) OV, and (l) SKCM.
Applsci 12 06596 g004
Figure 5. Enriched genesets detected by the GSEApreranked approach. Barplots show the -log FDR values for the top three GO BP terms based on GSEApreranked. Enrichment results for positively correlated genes are represented in red, and negatively correlated genes are represented in blue. GO BP terms with the same FDR values were ordered by the absolute value of the normalized enrichment score (NES) generated using the GSEA tool. GO terms with FDR < 1.0 × 10 6 are marked as six on the x axis. Figures present the results of the tumor types whose number of samples is more than 450; (a) BRCA, (b) HNSC, (c) LGG, (d) LUAD, (e) LUSC, (f) PRAD, (g) SKCM, (h) THCA, and (i) UCEC. All GSEA results are shown in Supplementary Tables S1–S50.
Applsci 12 06596 g005
Table 1. Tumor types and the number of samples used in the experiments.
Tumor TypeSamples
Bladder urothelial carcinoma (BLCA)409
Breast invasive carcinoma (BRCA)974
Cervical squamous cell carcinoma and endocervical adenocarcinoma (CESC)287
Colon adenocarcinoma (COAD)397
Esophageal carcinoma (ESCA)161
Glioblastoma multiforme (GBM)150
Head and neck squamous cell carcinoma (HNSC)494
Kidney renal clear cell carcinoma (KIRC)333
Kidney renal papillary cell carcinoma (KIRP)279
Brain lower grade glioma (LGG)504
Liver hepatocellular carcinoma (LIHC)360
Lung adenocarcinoma (LUAD)510
Lung squamous cell carcinoma (LUSC)490
Ovarian serous cystadenocarcinoma (OV)273
Pancreatic adenocarcinoma (PAAD)170
Pheochromocytoma and paraganglioma (PCPG)179
Prostate adenocarcinoma (PRAD)493
Rectum adenocarcinoma (READ)134
Sarcoma (SARC)236
Skin cutaneous melanoma (SKCM)466
Stomach adenocarcinoma (STAD)373
Testicular germ cell tumors (TGCT)145
Thyroid carcinoma (THCA)488
Thymoma (THYM)119
Uterine corpus endometrial carcinoma (UCEC)527
Table 2. Average occurrence of mutational signatures across 25 tumor types.
Mutational SignatureAverage
Signature 10.1250
Signature 20.0605
Signature 30.0801
Signature 40.0392
Signature 50.0472
Signature 60.0174
Signature 70.0458
Signature 80.0403
Signature 90.0218
Signature 100.0106
Signature 110.0120
Signature 120.0203
Signature 130.0519
Signature 140.0083
Signature 150.0102
Signature 160.1335
Signature 170.0135
Signature 180.0169
Signature 190.0176
Signature 200.0167
Signature 210.0146
Signature 220.0069
Signature 230.0050
Signature 240.0095
Signature 250.0134
Signature 260.0175
Signature 270.0042
Signature 280.0136
Signature 290.0125
Signature 300.0282
Publisher’s Note: MDPI stays neutral with regard to jurisdictional claims in published maps and institutional affiliations.

