
A Simple Relationship to Estimate Parameters of the Optimum Compaction Point

Abstract
:1. Introduction
2. Materials and Methods
2.1. Used Data
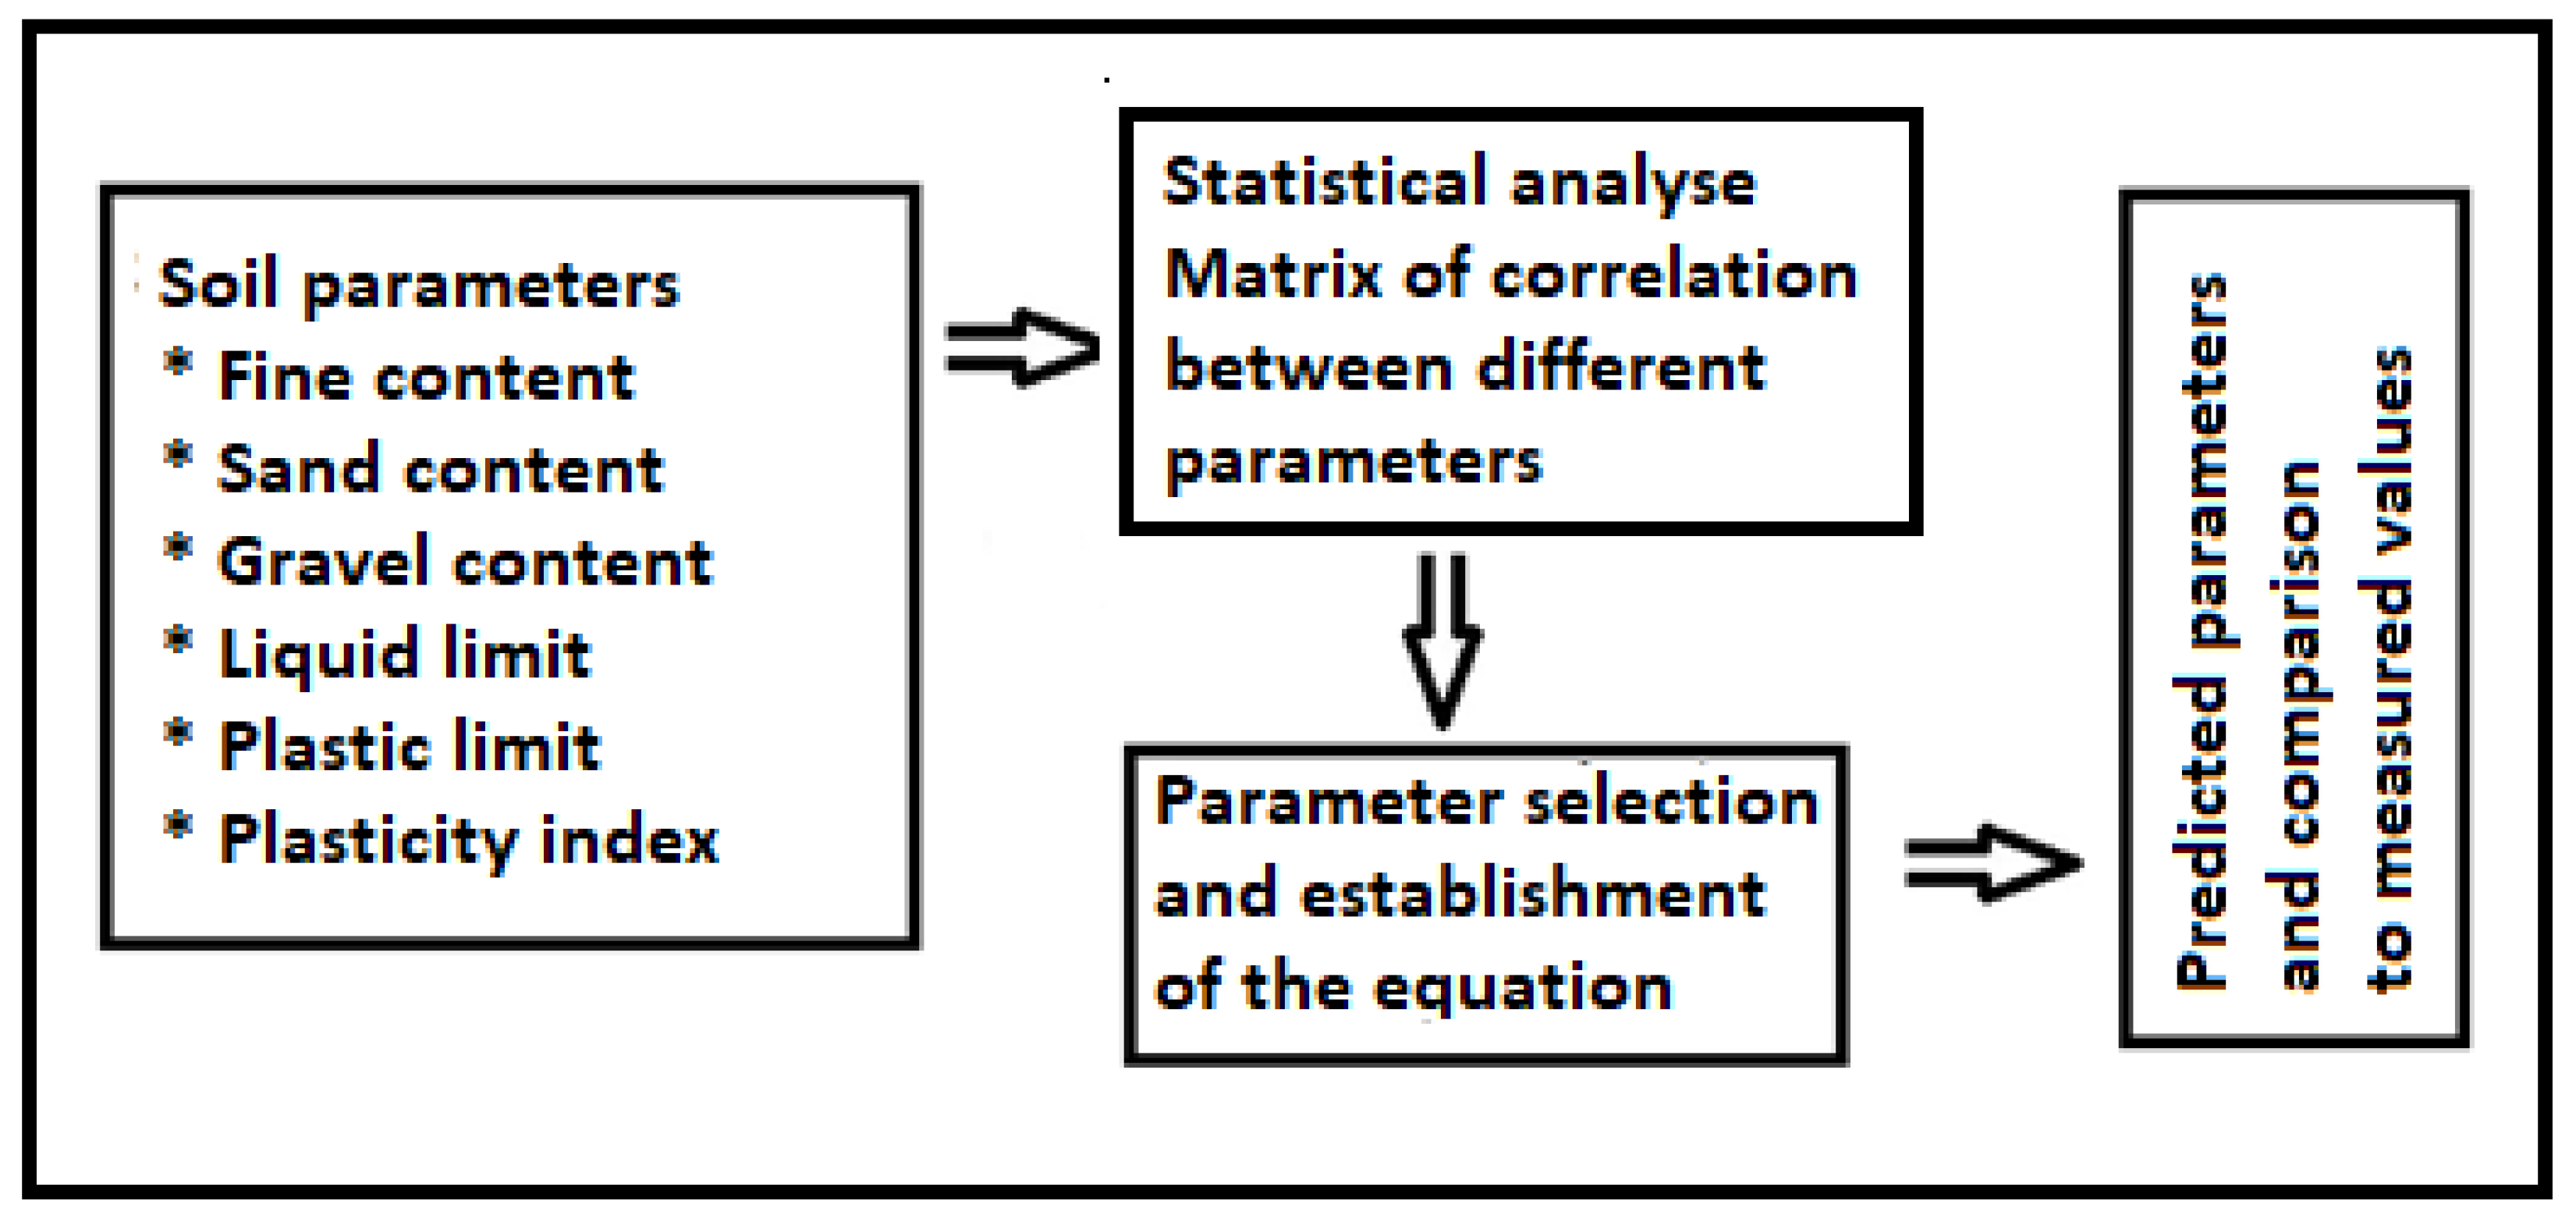
2.2. Method Used
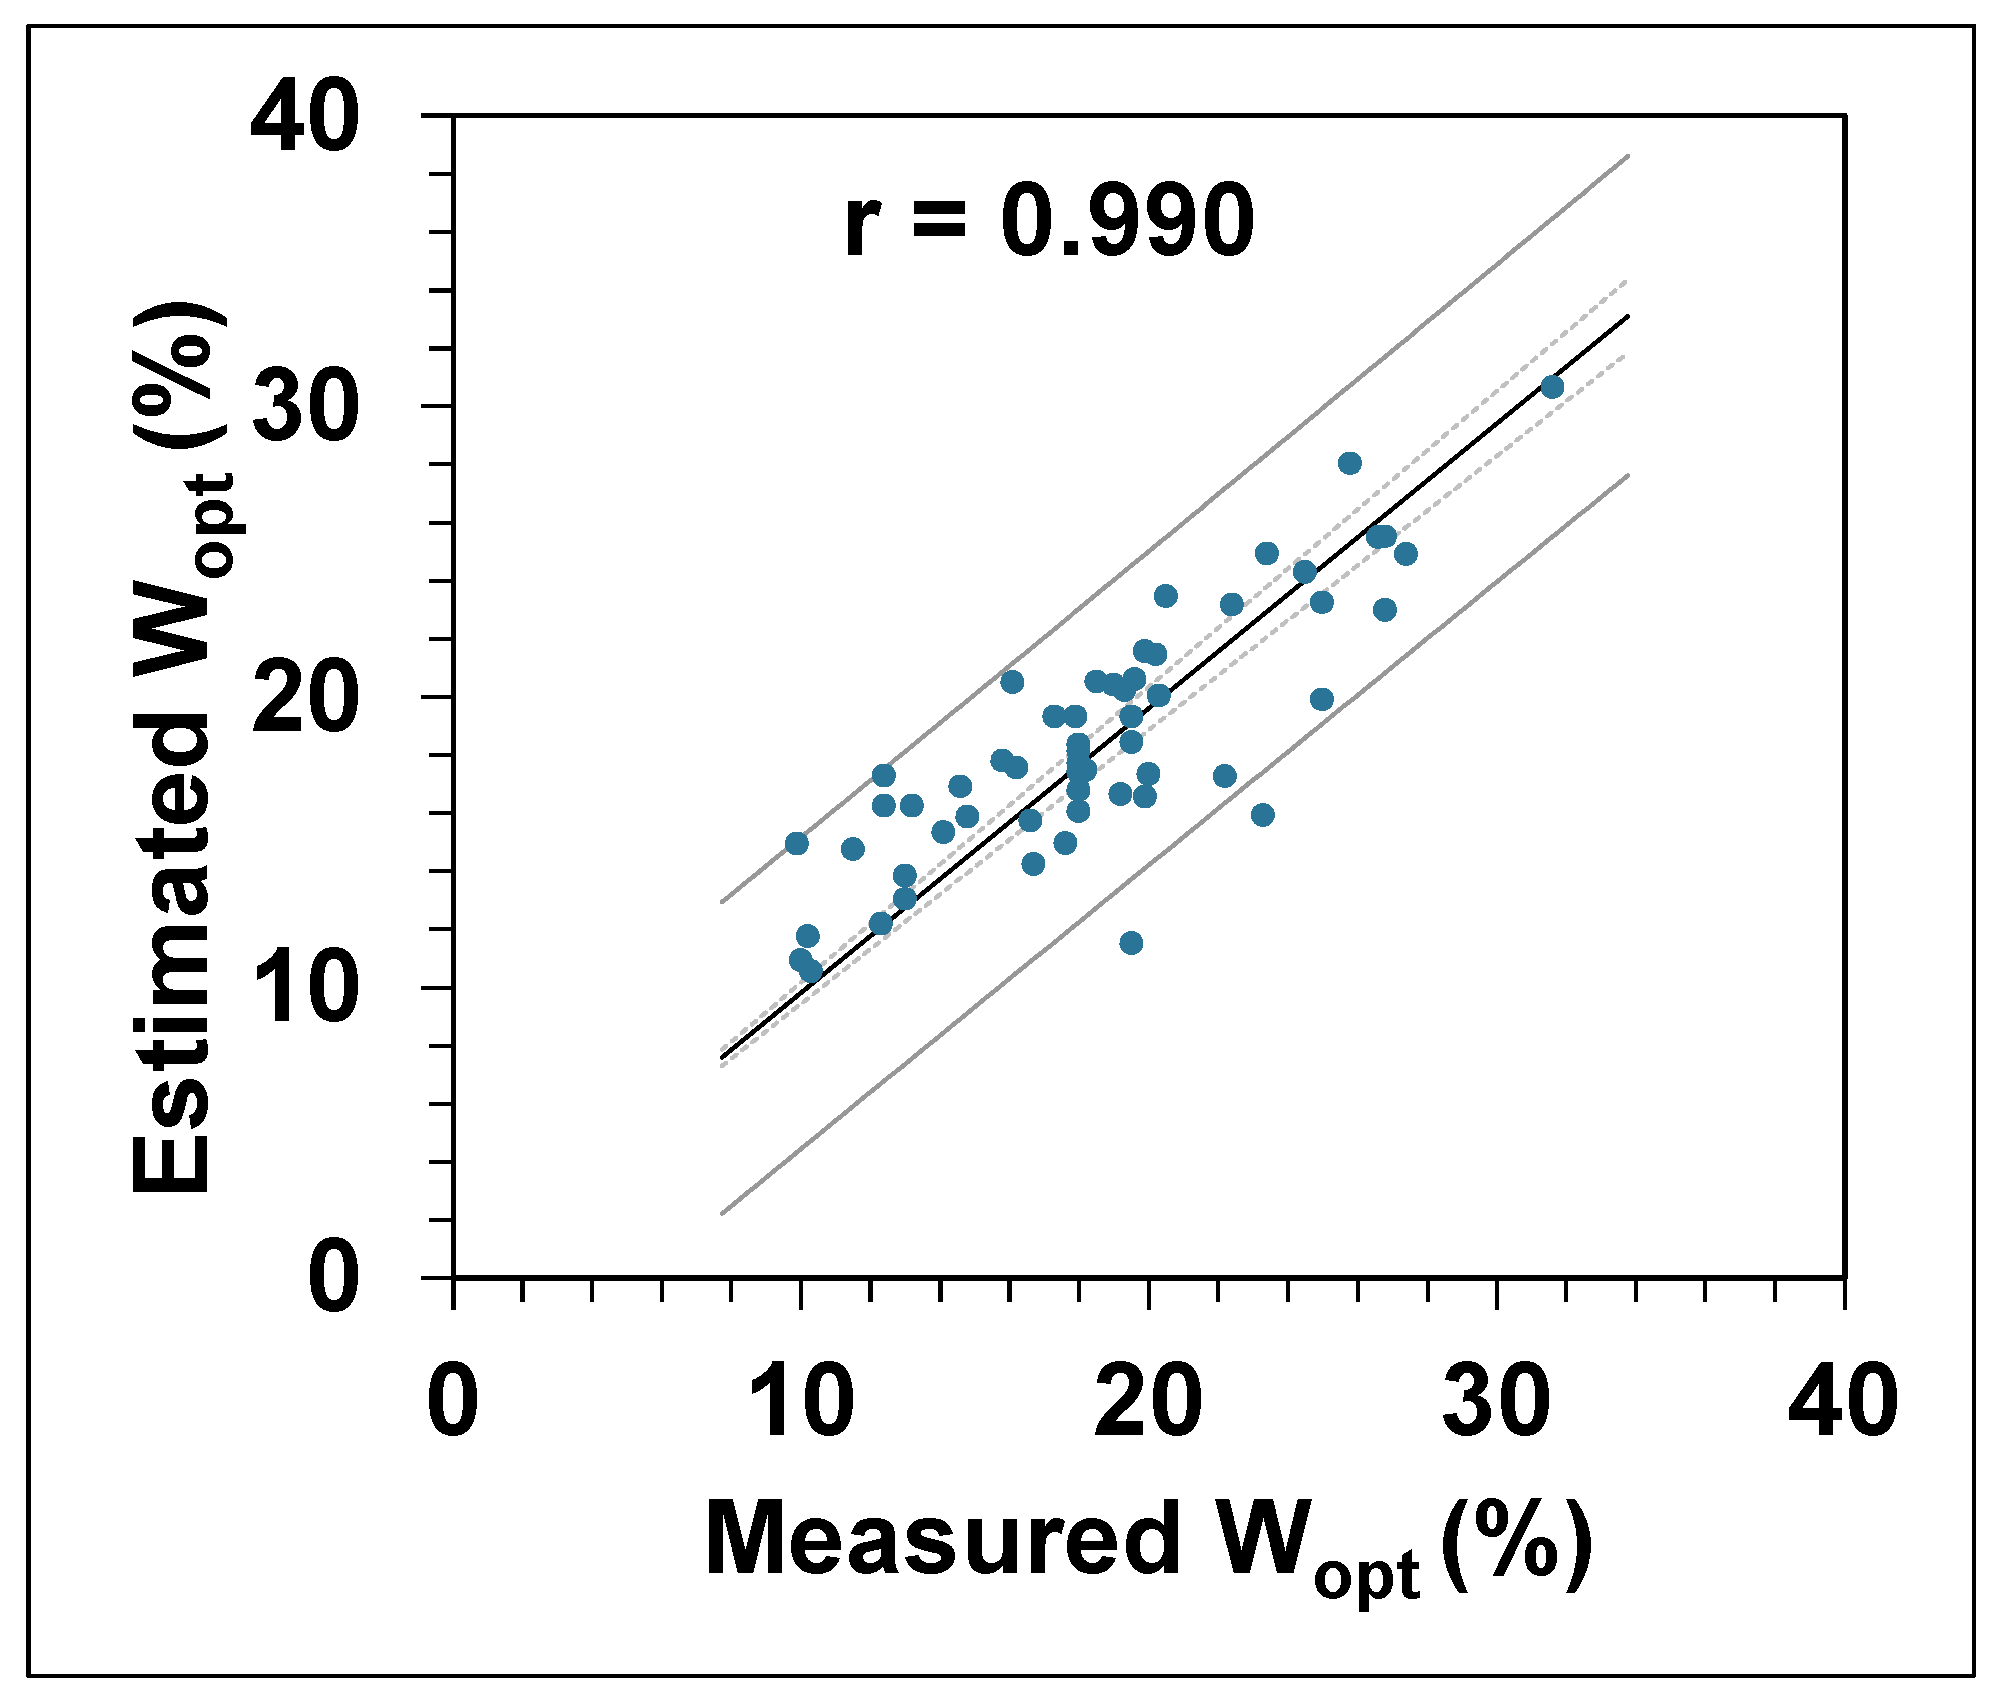
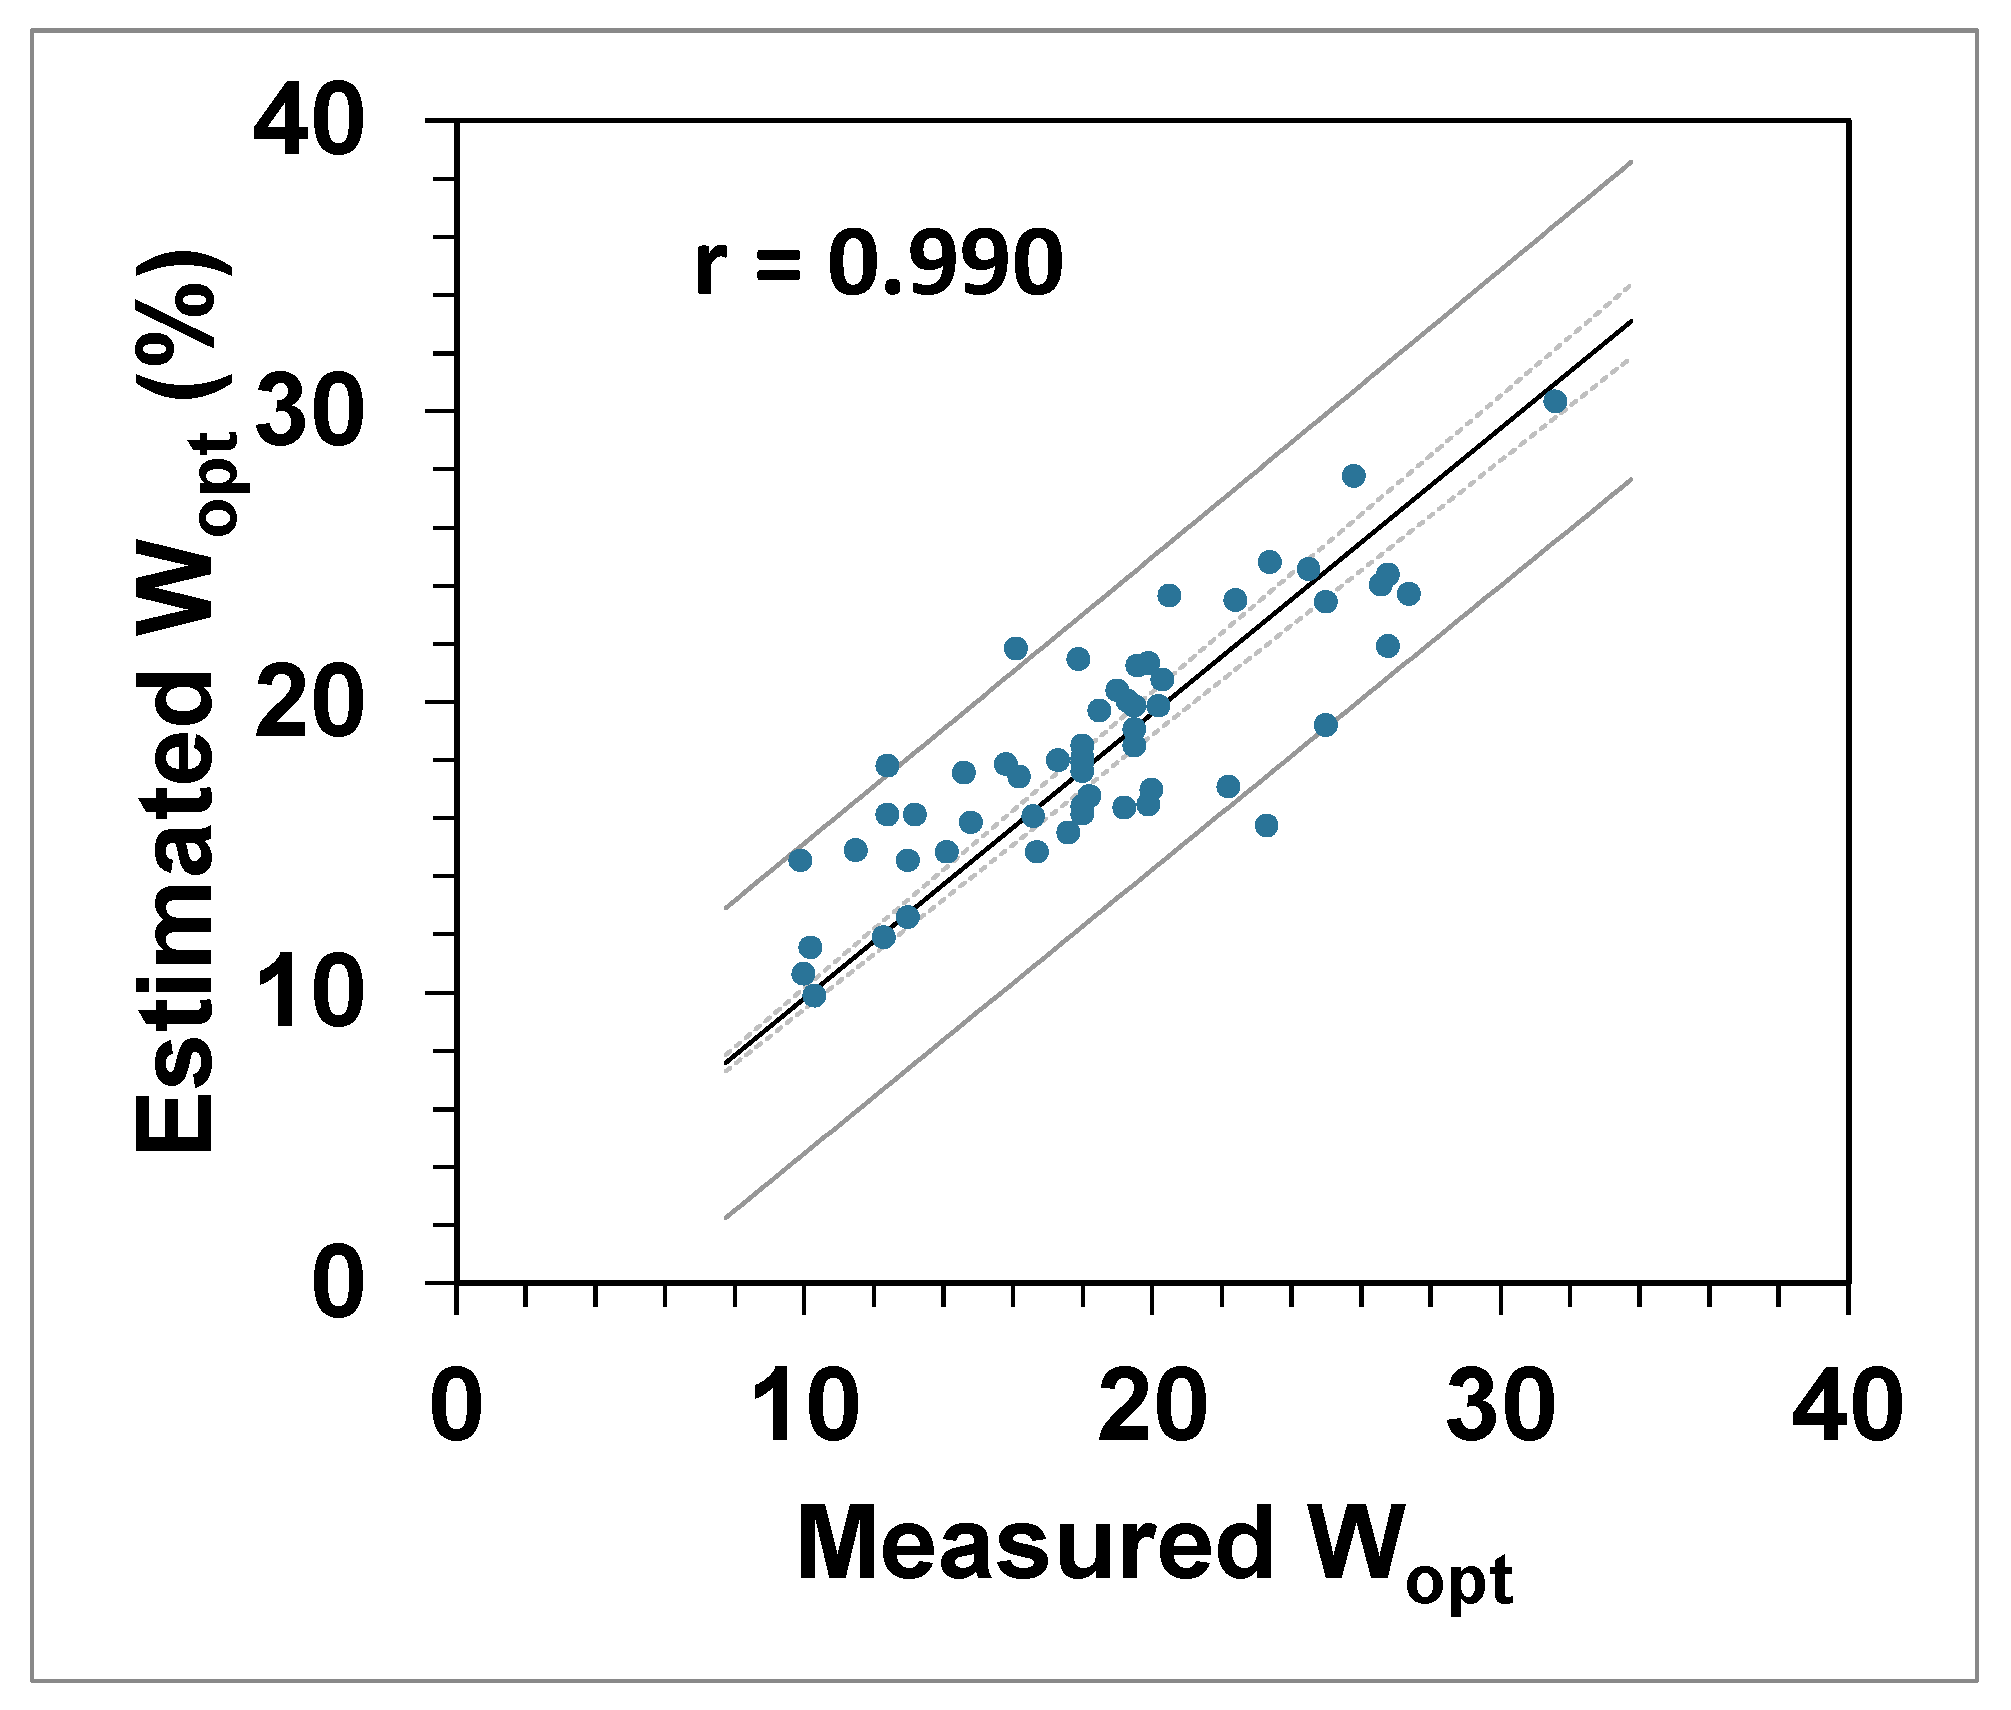
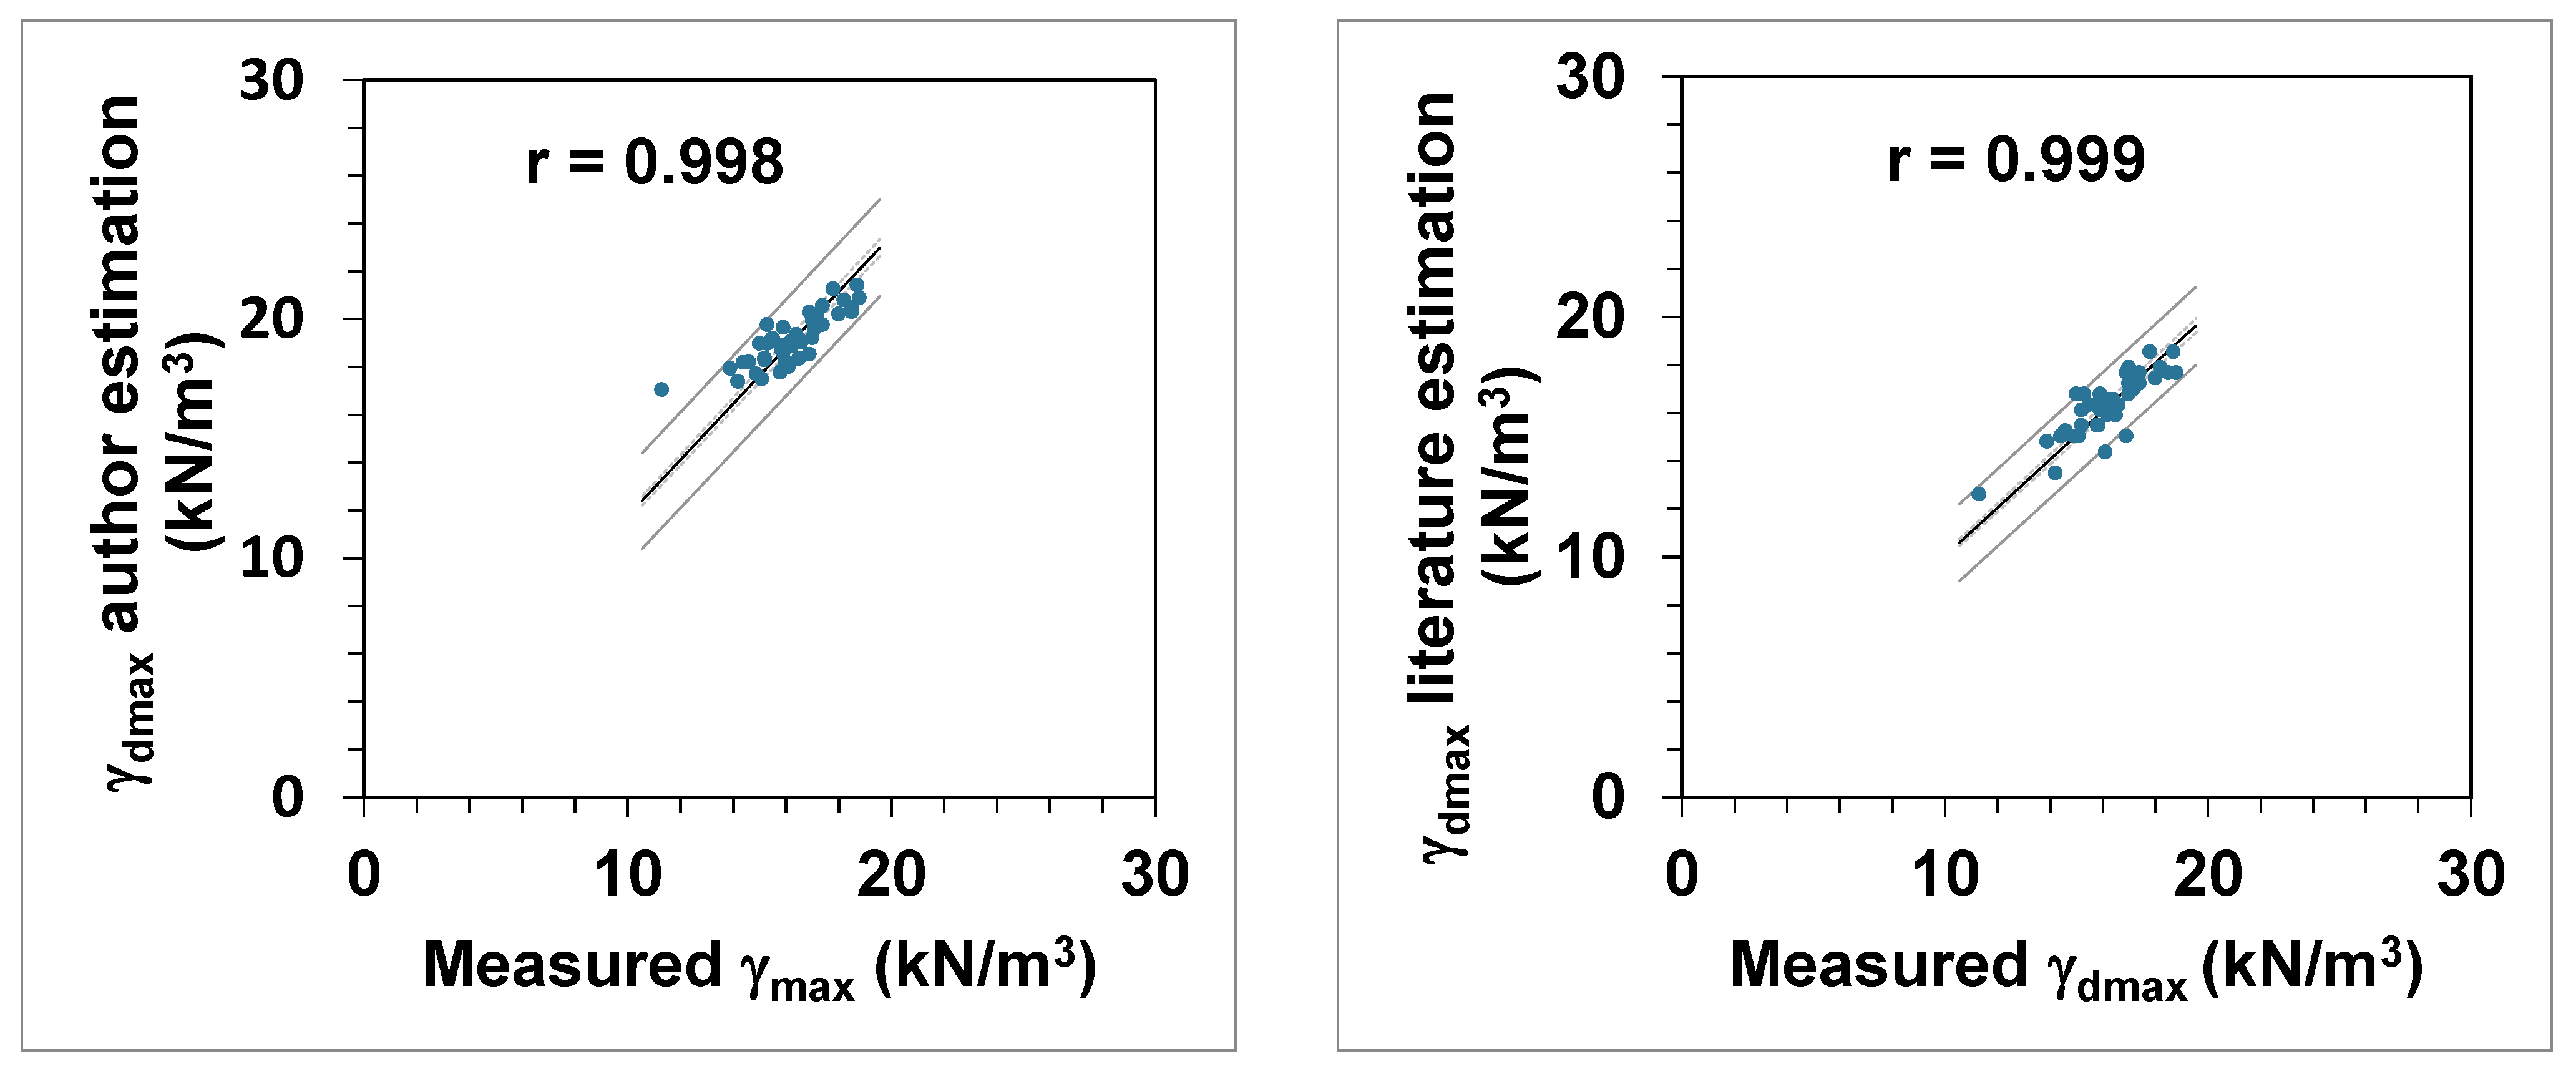
3. Investigation Results
4. Discussion
5. Conclusions
Funding
Conflicts of Interest
References
- MERN. Plan de Réaménagement et de Restauration des Sites Miniers au Québec; Gouvernement du Québec Ministère de l’Énergie et des Ressources Naturelles: Québec, QC, Canada, 2017; ISBN 978-2-550-77162-3. [Google Scholar]
- NEDEM. Acidic Drainage Research and Technology Gap Analysis, Mend Report 8.1. 2002. Available online: http://mend-nedem.org/wp-content/uploads/2013/01/8.1.pdf (accessed on 23 June 2022).
- Maqsoud, A.; Bussère, B.; Mbonimpa, M. Chapter 4, Low saturated hydraulic conductivity covers. In Hard Rock Mine Reclamation: From Prediction to Management of Acid Mine Drainage; Bussière, B., Guittonny, M., Eds.; CRC Press: Boca Raton, FL, USA, 2020. [Google Scholar]
- Lambe, T.W. The engineering behaviour of compacted clay. ASCE J. Soil Mech. Found. Div. ASCE 1958, 84, 1654-1–1654-35. [Google Scholar]
- Mitchell, J.; Hooper, D.; Campanella, R. Permeability of compacted clay. J. Soil Mech. Found. Div. ASCE 1965, 91, 41–65. [Google Scholar] [CrossRef]
- Benson, C.; Daniel, C. Water content density criteria for compacted soil liners. ASCE J. Geotech. Eng. 1990, 116, 1181–1190. [Google Scholar]
- Edwin Safari, E.; Ghazizade, M.J.; Abdoli, M.A. A performance-based method for calculating the design thickness of compacted clay liners exposed to high strength leachate under simulated landfill conditions. Waste Manag. Res. 2012, 30, 898–907. [Google Scholar] [CrossRef]
- ASTM. Standard Test Methods for Laboratory Compaction Characteristics of Soil Using Modified Effort (56,000 ft-lbf/ft3 (2700 kN-m/m3)); ASTM International: West Conshohocken, PA, USA, 2007; Available online: www.astm.org (accessed on 23 June 2022).
- ASTM. Standard Test Methods for Laboratory Compaction Characteristics of Soil Using Standard (12,400 ft-lbf/ft3 (600 kN-m/m3)); ASTM International: West Conshohocken, PA, USA, 2007; Available online: www.astm.org (accessed on 23 June 2022).
- Blotz, L.R.; Benson, C.H.; Boutwel, G.P. Estimating optimum water content and maximum dry unit weight for compacted clays. J. Geotech. Geoenviron. 1998, 124, 907–912. [Google Scholar] [CrossRef]
- Khalid, U.; ur Rehman, Z. Evaluation of compaction parameters of fine-grained soils using standard and modified efforts. Int. J. Geo-Eng. 2018, 9, 15. [Google Scholar] [CrossRef] [Green Version]
- Jalal, F.E.; Xu, Y.; Iqbal, M.; Jamhiri, B.; Javed, M.F. Predicting the compaction characteristics of expensive soils using two generic programming-based algorithms. Transp. Geotech. 2021, 3, 100608. [Google Scholar] [CrossRef]
- Shimobe, S.; Karakan, E.; Sezer, A. Improved dataset for establishing novel relationships between compaction characteristics and physical propertie of soils. Bull. Eng. Geol. Environ. 2021, 90, 8633–8663. [Google Scholar] [CrossRef]
- Nitty, S.; Sindhu, A.R. Prediction of compacted clay liners. Int. J. Eng. Sci. Comput. 2016, 6, 2333–2337. [Google Scholar]
- Verma, G.; Kumar, B. Prediction of compaction parameters for fine-grained and coarse-grained soils: A review. Int. J. Geotech. Eng. 2020, 14, 970–977. [Google Scholar] [CrossRef]
- Sivrikaya, O.; Torgrol, E.; Kayadelen, C. Estimating compaction behaviour of fine-grained soils based on compaction energy. Can. Geotech. J. 2008, 45, 877–887. [Google Scholar] [CrossRef]
- Saikia, A.; Baruah, D.; Das, K.; Rabha, H.J.; Dutta, A.; Saharia, A. Predicting compaction characteristics of fine-grained soils in terms of Atteberg limits. Int. J. Geosynth. Ground Eng. 2017, 3, 18. [Google Scholar] [CrossRef]
- Attik, U.R.; Khalid, F.; Hassan, M. Prediction of California bearing (CBR) and compaction characteristics of granular soils. Acta Geotech. Slov. 2017, 1, 63–71. [Google Scholar]
- Benson, C.H.; Daniel, D.E.; Boutwell, G.P. Field performance of compacted clay liners. J. Geotech. Geoenviron. Eng. 1999, 125, 390–403. [Google Scholar] [CrossRef]
- XLSTAT. Logiciel Statistique Pour Excel. Available online: www.xlstat.com/fr/articles/xlstat-version-2018-1 (accessed on 23 June 2022).
- Wilton and Cleide Pereira. Curve Fitting Software. Universidade Federal de Campina Grande, 2007, Brazil. Available online: http://zeus.df.ufcg.edu.br/labfit/ (accessed on 23 June 2022).
- Schaap, M.G.; Leij, F.J.; van Genuchten, M.T. Neural network analysis for hierarchical prediction of soil hydraulic properties. Soil Sci. Soc. Am. J. 1998, 62, 847–855. [Google Scholar] [CrossRef]
- Haverkamp, R.; Leij, F.-J.; Fuentes, C.; Sciortino, A.; Ross, P.-J. Soil Water Retention: I. Introduction of a Shape Index. Soil Sci. Soc. Am. J. 2005, 69, 1881–1890. [Google Scholar] [CrossRef]
- Maqsoud, A.; Bussière, B.; Mbonimpa, M.; Aubertin, M. Comparison between predictive MK model and simplified one point model to estimate water retention curve. J. Arch. Agron. Soil Sci. 2017, 63, 443–454. [Google Scholar] [CrossRef]
- Maqsoud, A.; Gervais, P.; Bussière, B.; Le Borgne, V. Performance evaluation of equipment used for volumetric water content measurements. WSEAS Trans. Environ. Dev. 2017, 13, 27–32. [Google Scholar]
- Maqsoud, A.; Bussière, B.; Mbonimpa, M.; Aubertin, M. Conversion of the Kovàcs Model to Brooks & Corey and van Genuchten model parameters for silty materials. In Proceedings of the International Ground Water Symposium, Valencia, Spain, 22–24 September 2010. [Google Scholar]
- Maqsoud, A.; Bussière, B.; Aubertin, M.; Mbonimpa, M. Conversion of the Modified Kovács model parameters to the Brooks and Corey and van Genuchten model parameters for the water retention curve of sandy and silty soils. J. Irrig. Drain. Eng. 2013, 139, 388–398. [Google Scholar]
- Maqsoud, A.; Bussière, B.; Mbonimpa, M.; Aubertin, M. Parameters conversion of Modified Kovàcs to Brooks & Corey and van Genuchten models. In Proceedings of the 60th Canadian Geotechnical Conference & 8th Joint CGS/IAH-CNC Groundwater Conference, OttawaGeo 2007, Ottawa, ON, Canada, 21–24 October 2007; pp. 1053–1060. [Google Scholar]
- Maqsoud, A.; Mbonimpa, M.; Benzaazoua, M.; Turcotte, S. Evaluation performance of a monolayer cover with an elevated water table used for the reclamation of the abandoned Aldermac mine site (Québec, Canada). Min. J. 2022, 2, 65–85. [Google Scholar] [CrossRef]
- Sivrikaya, O. Models of compacted fine-grained soils used as mineral liner for waste. Environ. Geol. 2008, 53, 1585–1595. [Google Scholar] [CrossRef]


| wL (%) | wP (%) | IP (%) | wOpt (%) | γdmax (kN/m3) | |
|---|---|---|---|---|---|
| Minimum | 21 | 28 | 7 | 9.9 | 13.4 |
| Maximum | 101 | 172 | 71 | 31.6 | 20.4 |
| Mean value | 44.9 | 71.0 | 26.4 | 18.5 | 16.9 |
| wL | wP | IP | wOpt | γdmax | Fines Content | |
|---|---|---|---|---|---|---|
| wL | 1 | |||||
| wP | 0.957 | 1 | ||||
| IP | 0.804 | 0.942 | 1 | |||
| wOpt | 0.833 | 0.802 | 0.678 | 1 | ||
| γdmax | −0.803 | −0.782 | −0.673 | −0.961 | 1 | |
| Fines content | 0.54 | 0.490 | 0.385 | 0.594 | −0.550 | 1 |
| Parameter A | SD of A | Parameter B | SD of B | |
|---|---|---|---|---|
| γdmax (wL, wP) | 0.4237 × 10² | 0.3285 × 101 | −0.1159 × 100 | 0.9958 × 10⁻² |
| wOpt (wL, wP) | 0.1733 × 101 | 0.13256 × 100 | 0.9085 × 10⁻² | 0.1622 × 10⁻² |
| wOpt (γdmax) | 0.8605 × 10³ | 0.7594 × 10² | −0.3264 × 10² | 0.4530 × 101 |
| wL (%) | wP (%) | IP (%) | wOpt (%) | γdmax (kN/m3) | |
|---|---|---|---|---|---|
| Minimum | 28 | 12 | 12 | 13 | 11.3 |
| Maximum | 74 | 39 | 46 | 40 | 18.8 |
| Mean value | 46.4 | 22.0 | 24.4 | 20.6 | 16.3 |
Publisher’s Note: MDPI stays neutral with regard to jurisdictional claims in published maps and institutional affiliations. |
© 2022 by the author. Licensee MDPI, Basel, Switzerland. This article is an open access article distributed under the terms and conditions of the Creative Commons Attribution (CC BY) license (https://creativecommons.org/licenses/by/4.0/).
Share and Cite
Maqsoud, A. A Simple Relationship to Estimate Parameters of the Optimum Compaction Point. Appl. Sci. 2022, 12, 6539. https://doi.org/10.3390/app12136539
Maqsoud A. A Simple Relationship to Estimate Parameters of the Optimum Compaction Point. Applied Sciences. 2022; 12(13):6539. https://doi.org/10.3390/app12136539
Chicago/Turabian StyleMaqsoud, Abdelkabir. 2022. "A Simple Relationship to Estimate Parameters of the Optimum Compaction Point" Applied Sciences 12, no. 13: 6539. https://doi.org/10.3390/app12136539
APA StyleMaqsoud, A. (2022). A Simple Relationship to Estimate Parameters of the Optimum Compaction Point. Applied Sciences, 12(13), 6539. https://doi.org/10.3390/app12136539