
Phase Behavior and Ionic Conductivity of Blended, Ion-Condensed Electrolytes with Ordered Morphologies


Abstract
:Featured Application
Abstract
1. Introduction
2. Results
2.1. Mixtures
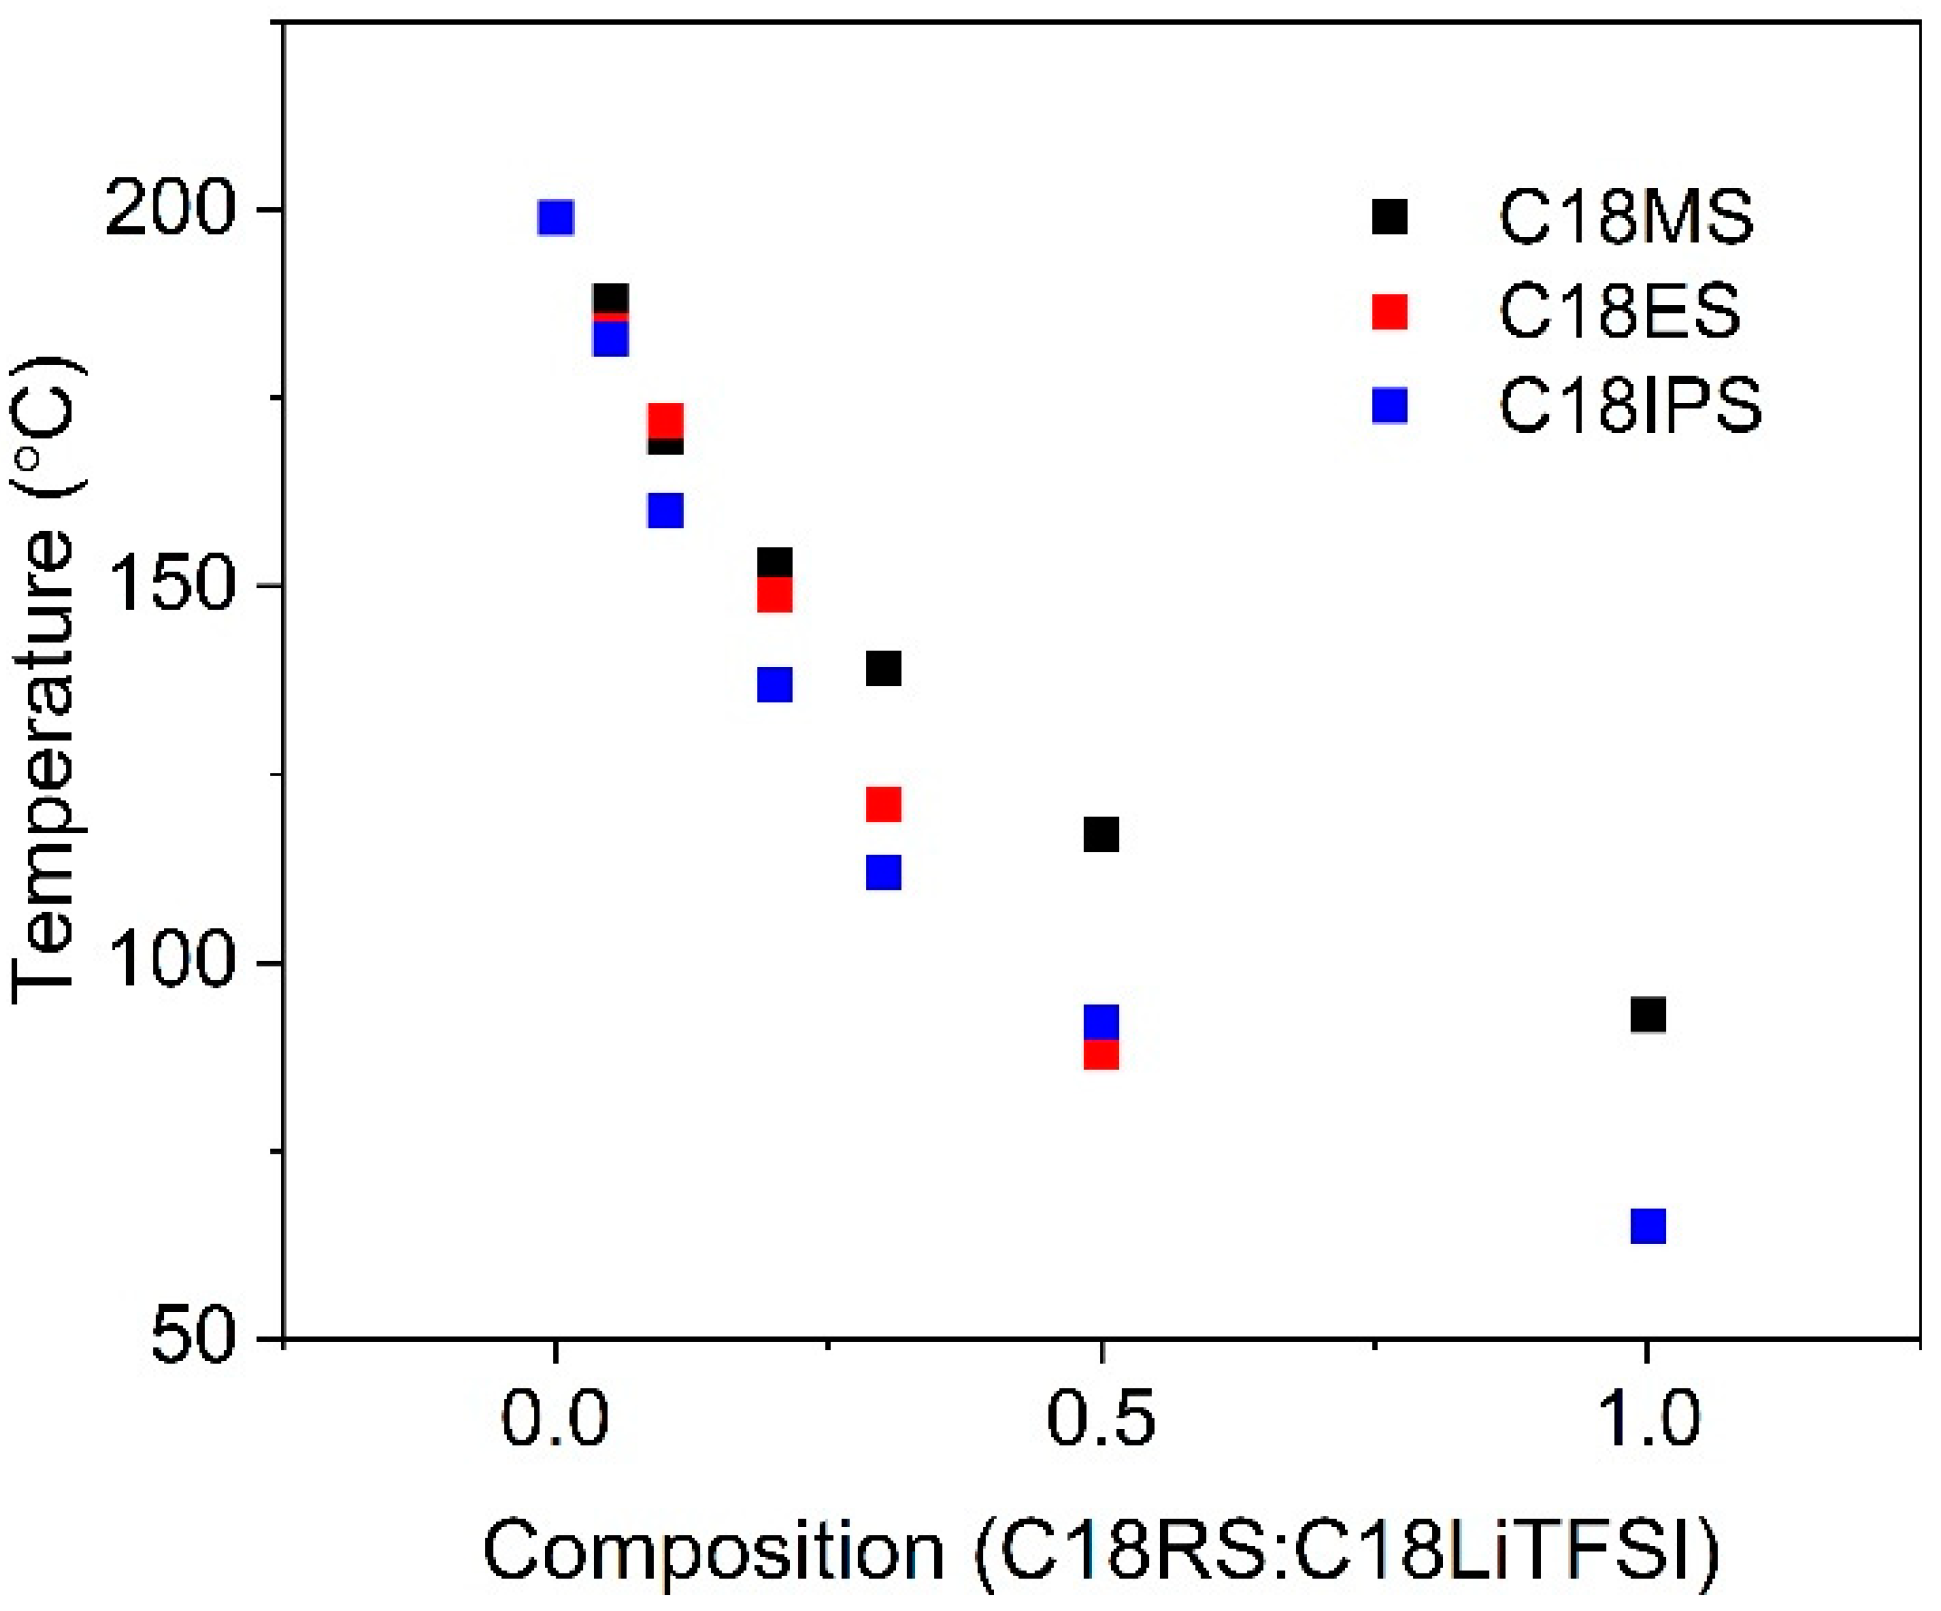
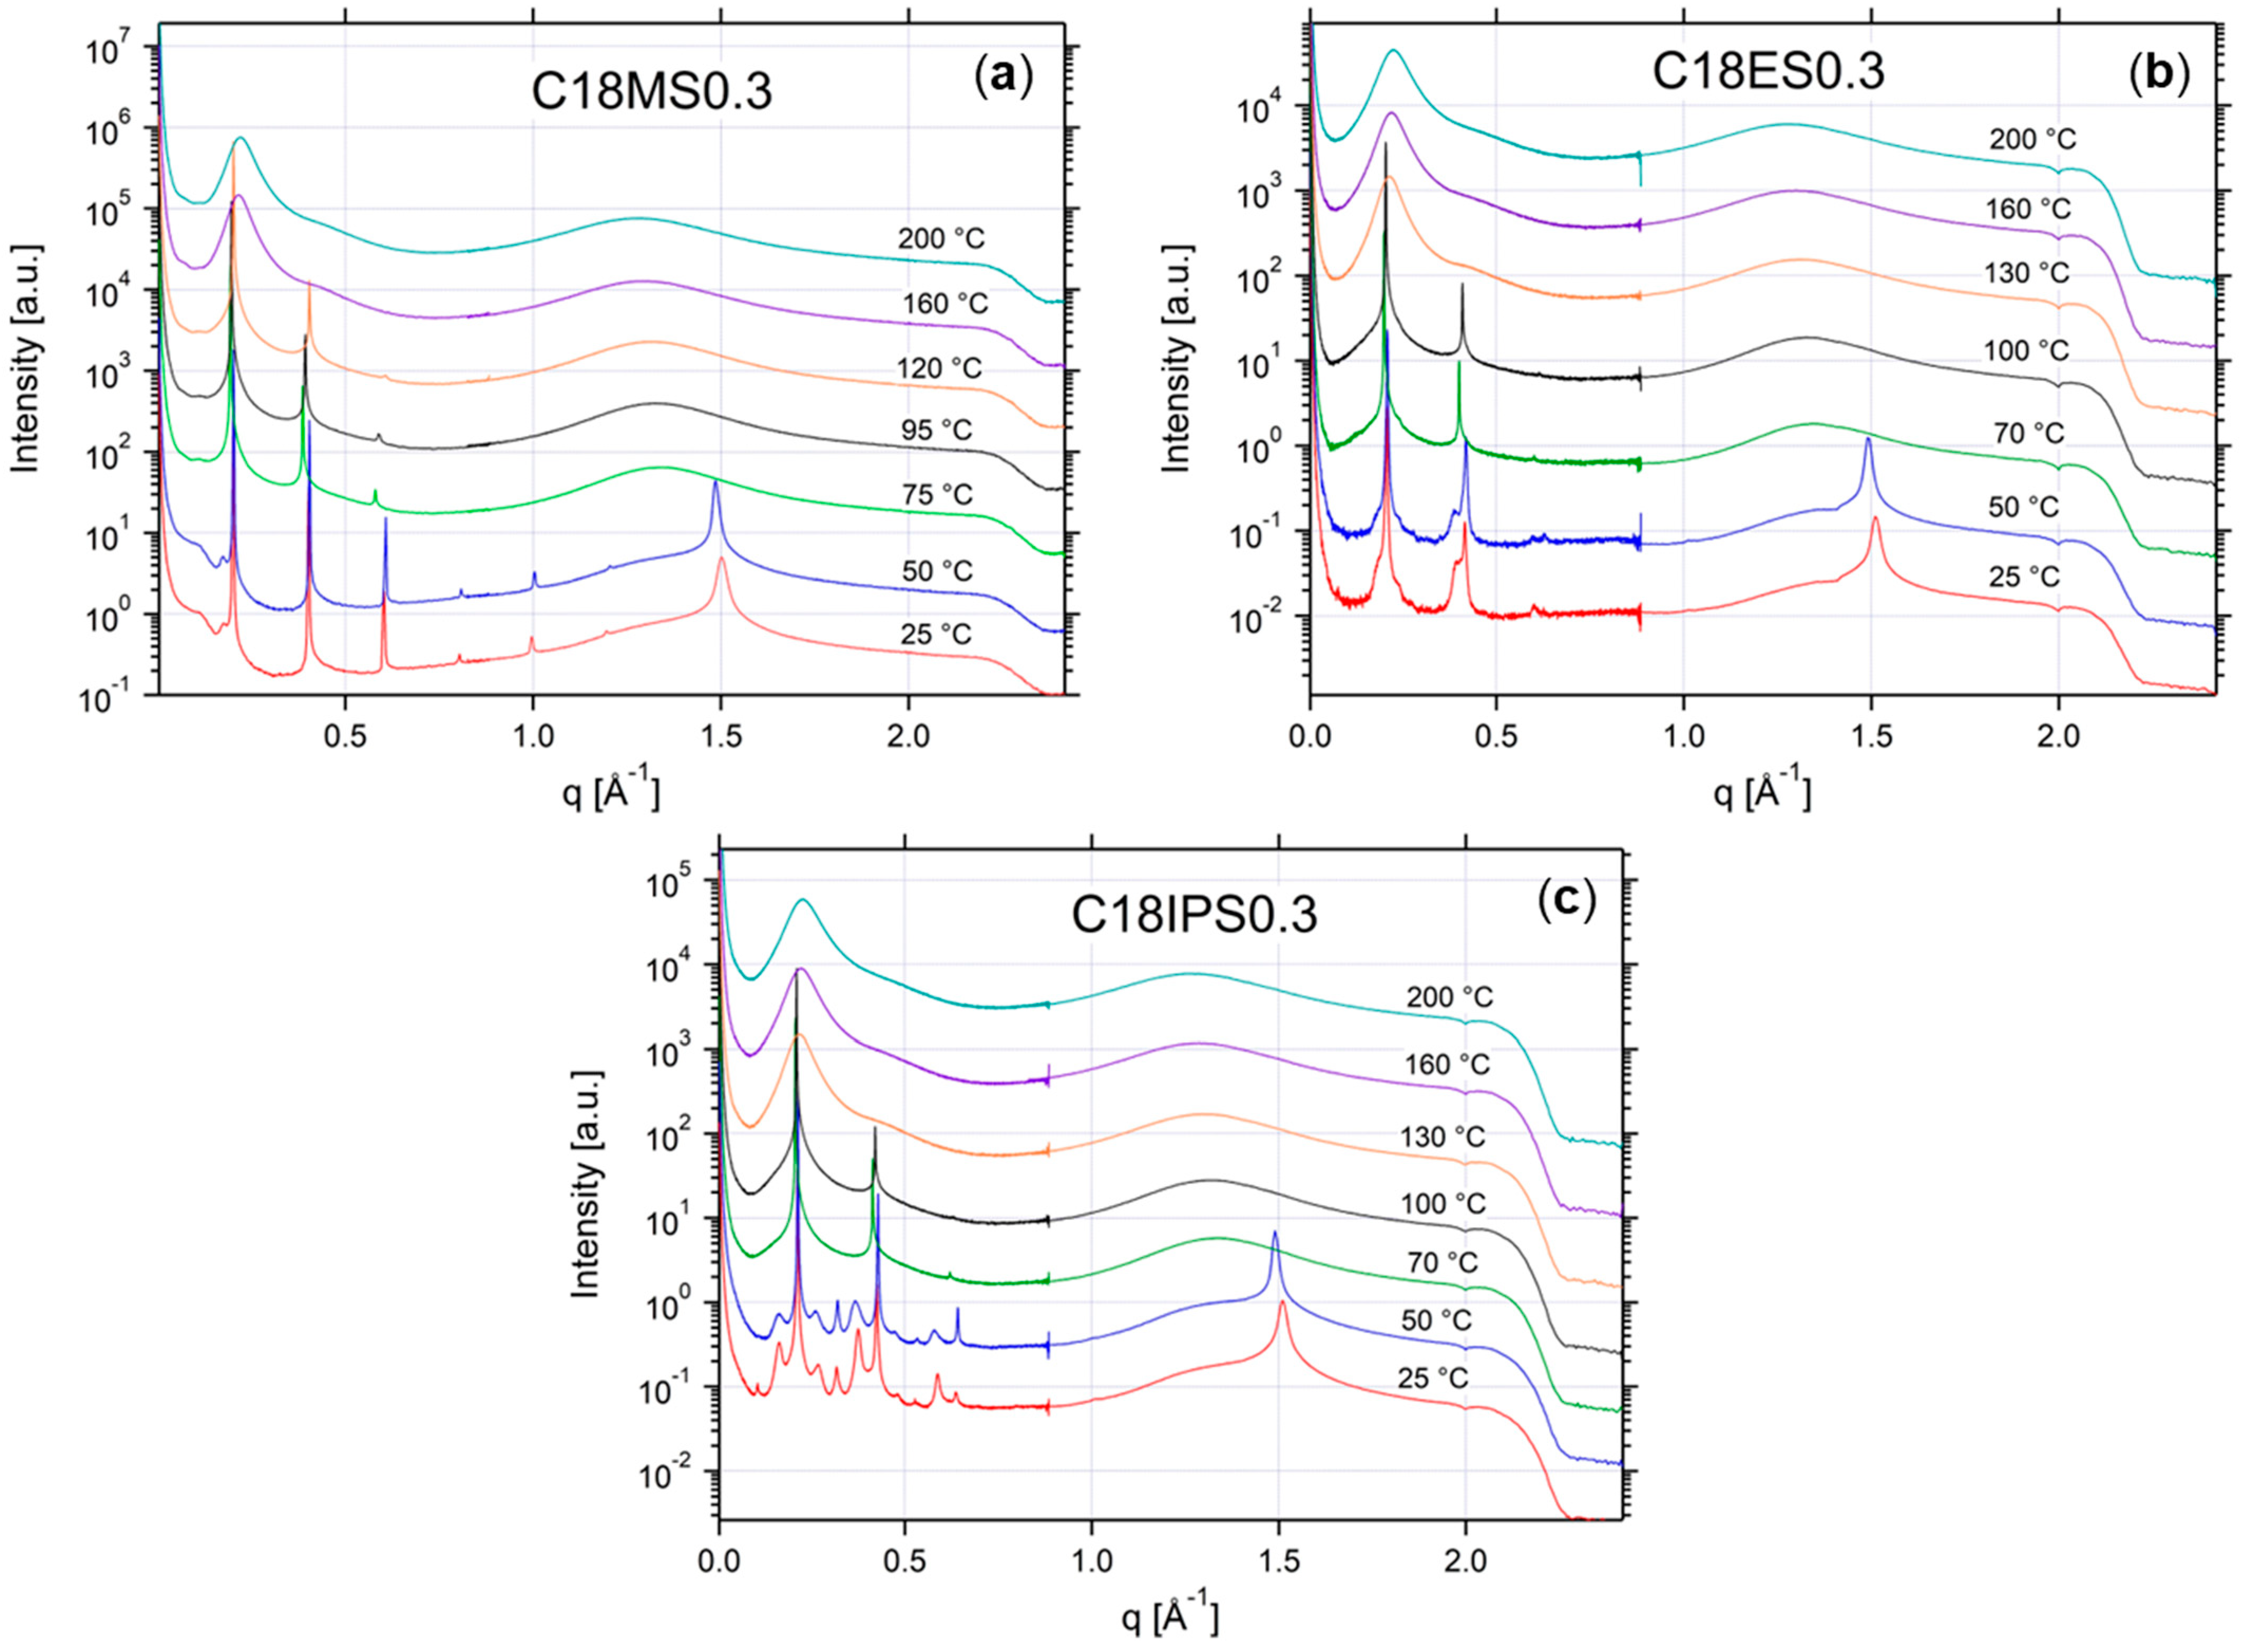
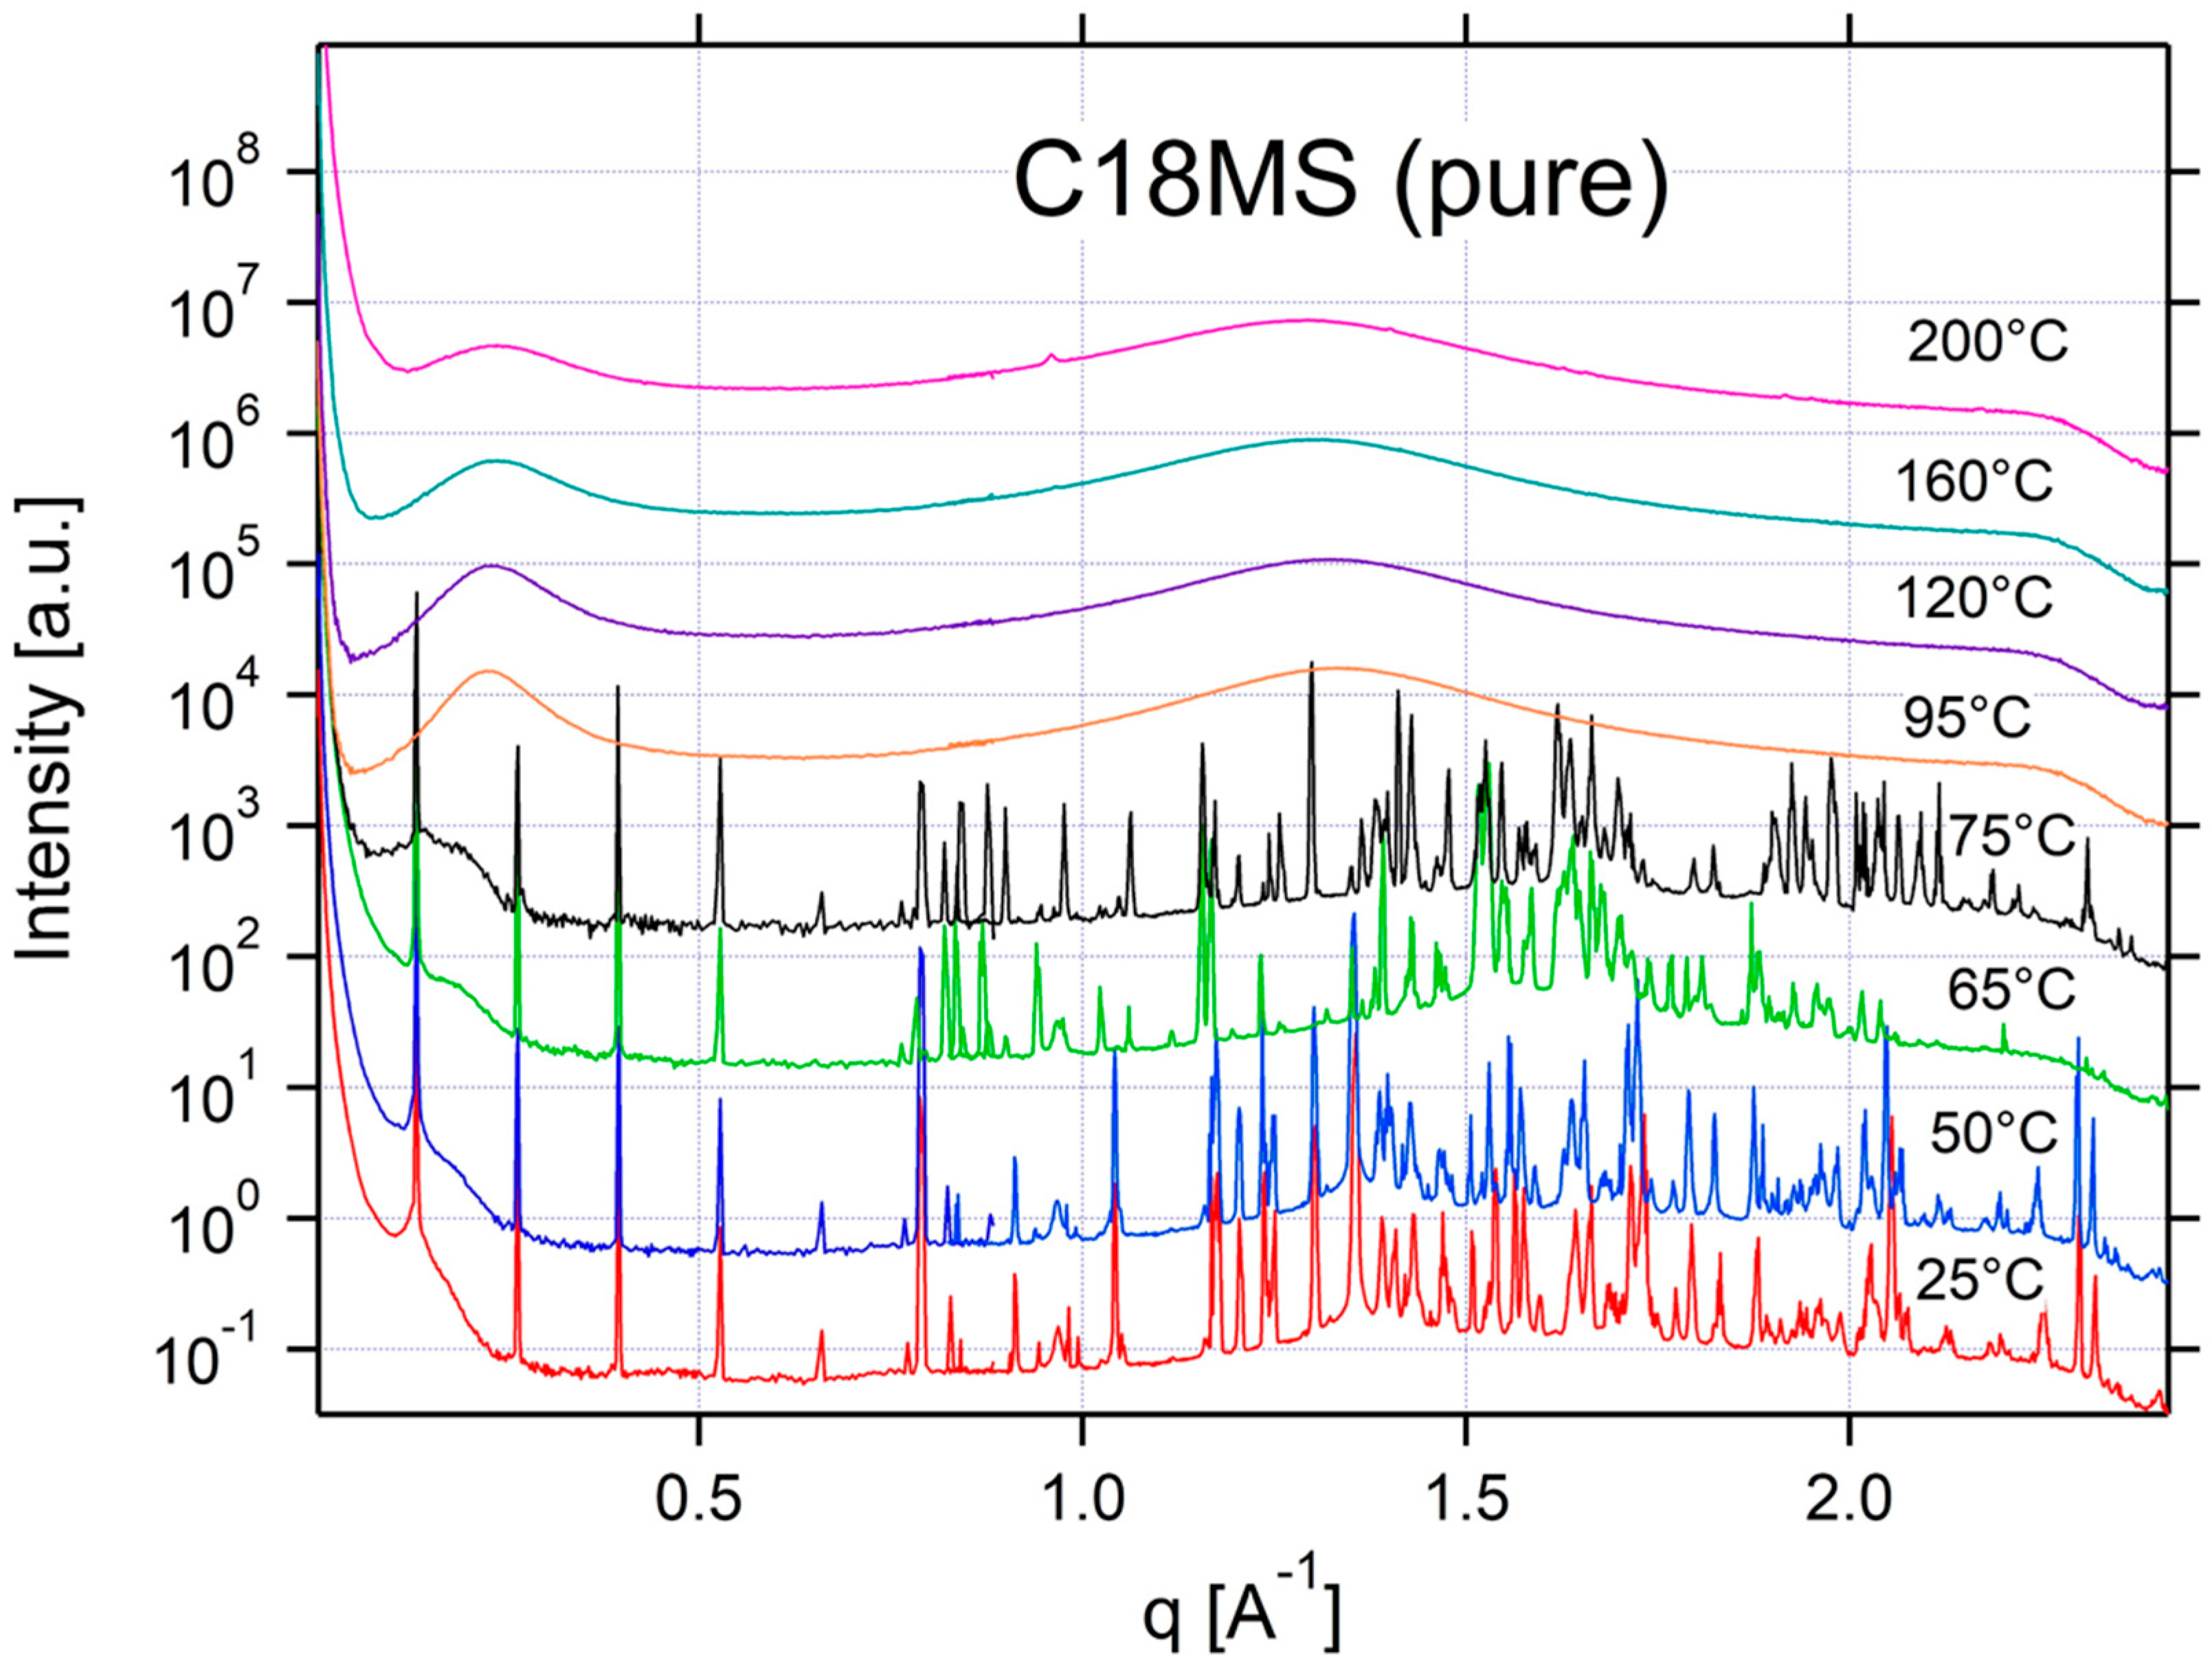
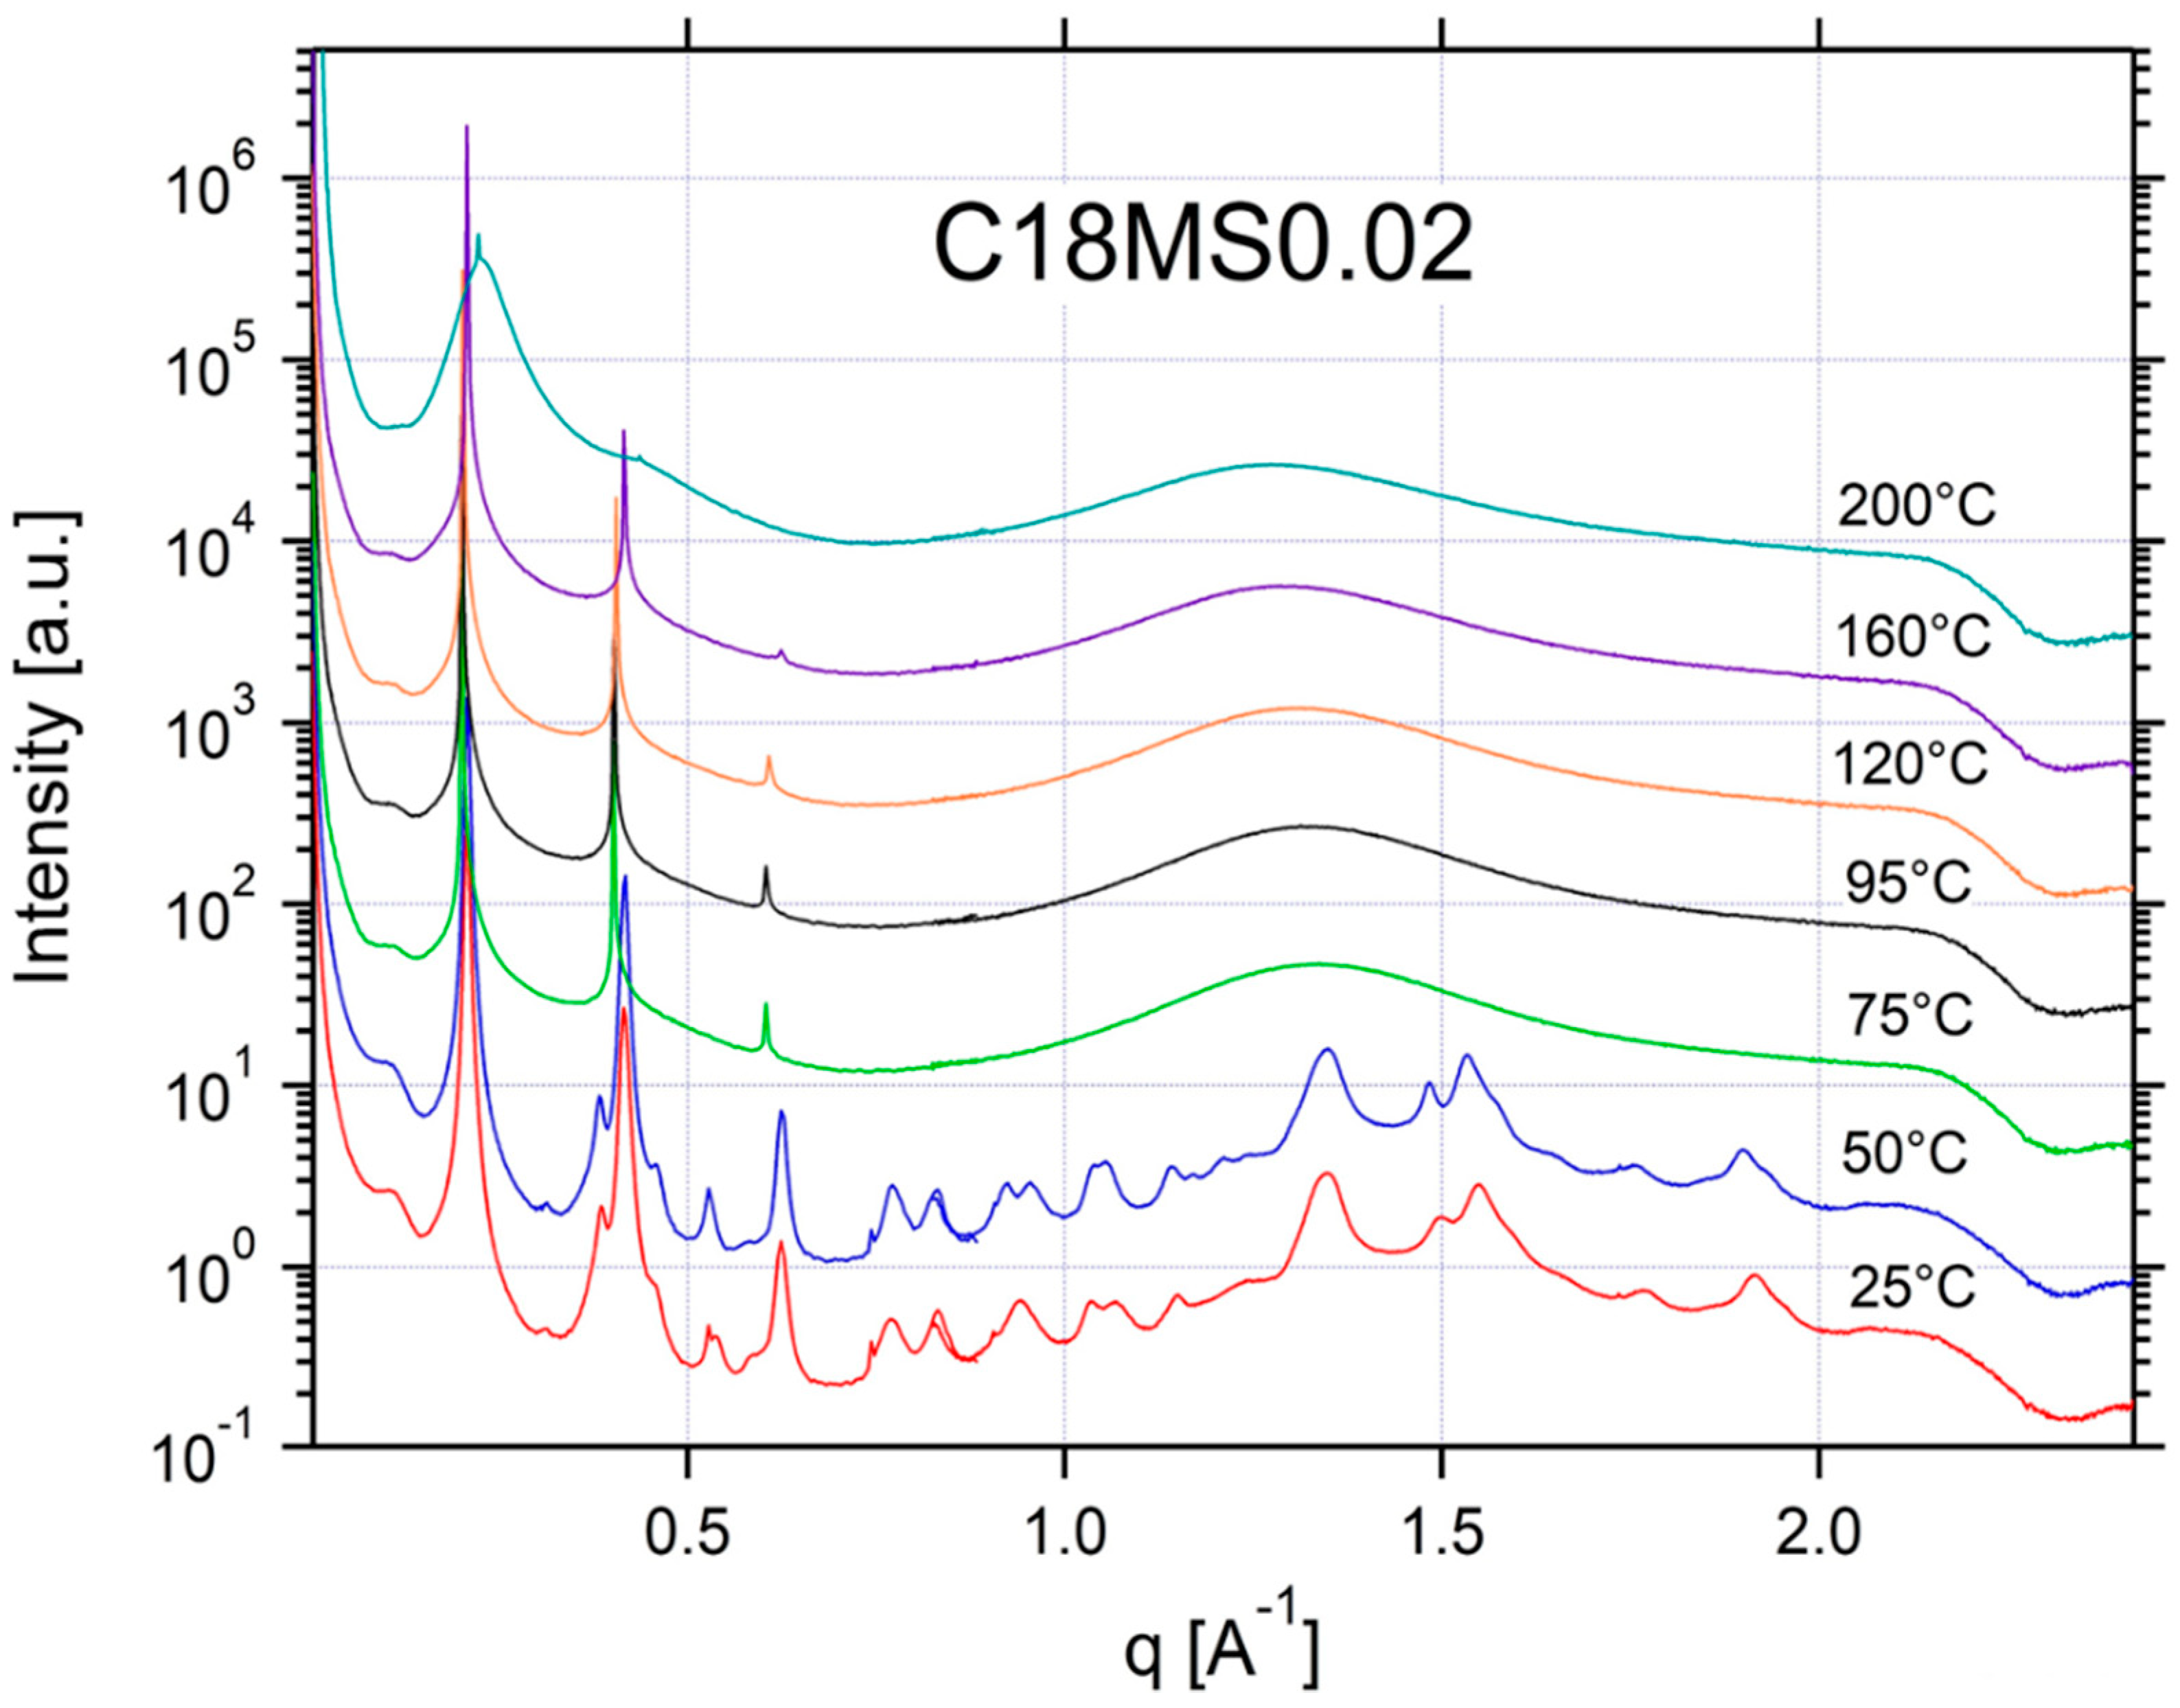
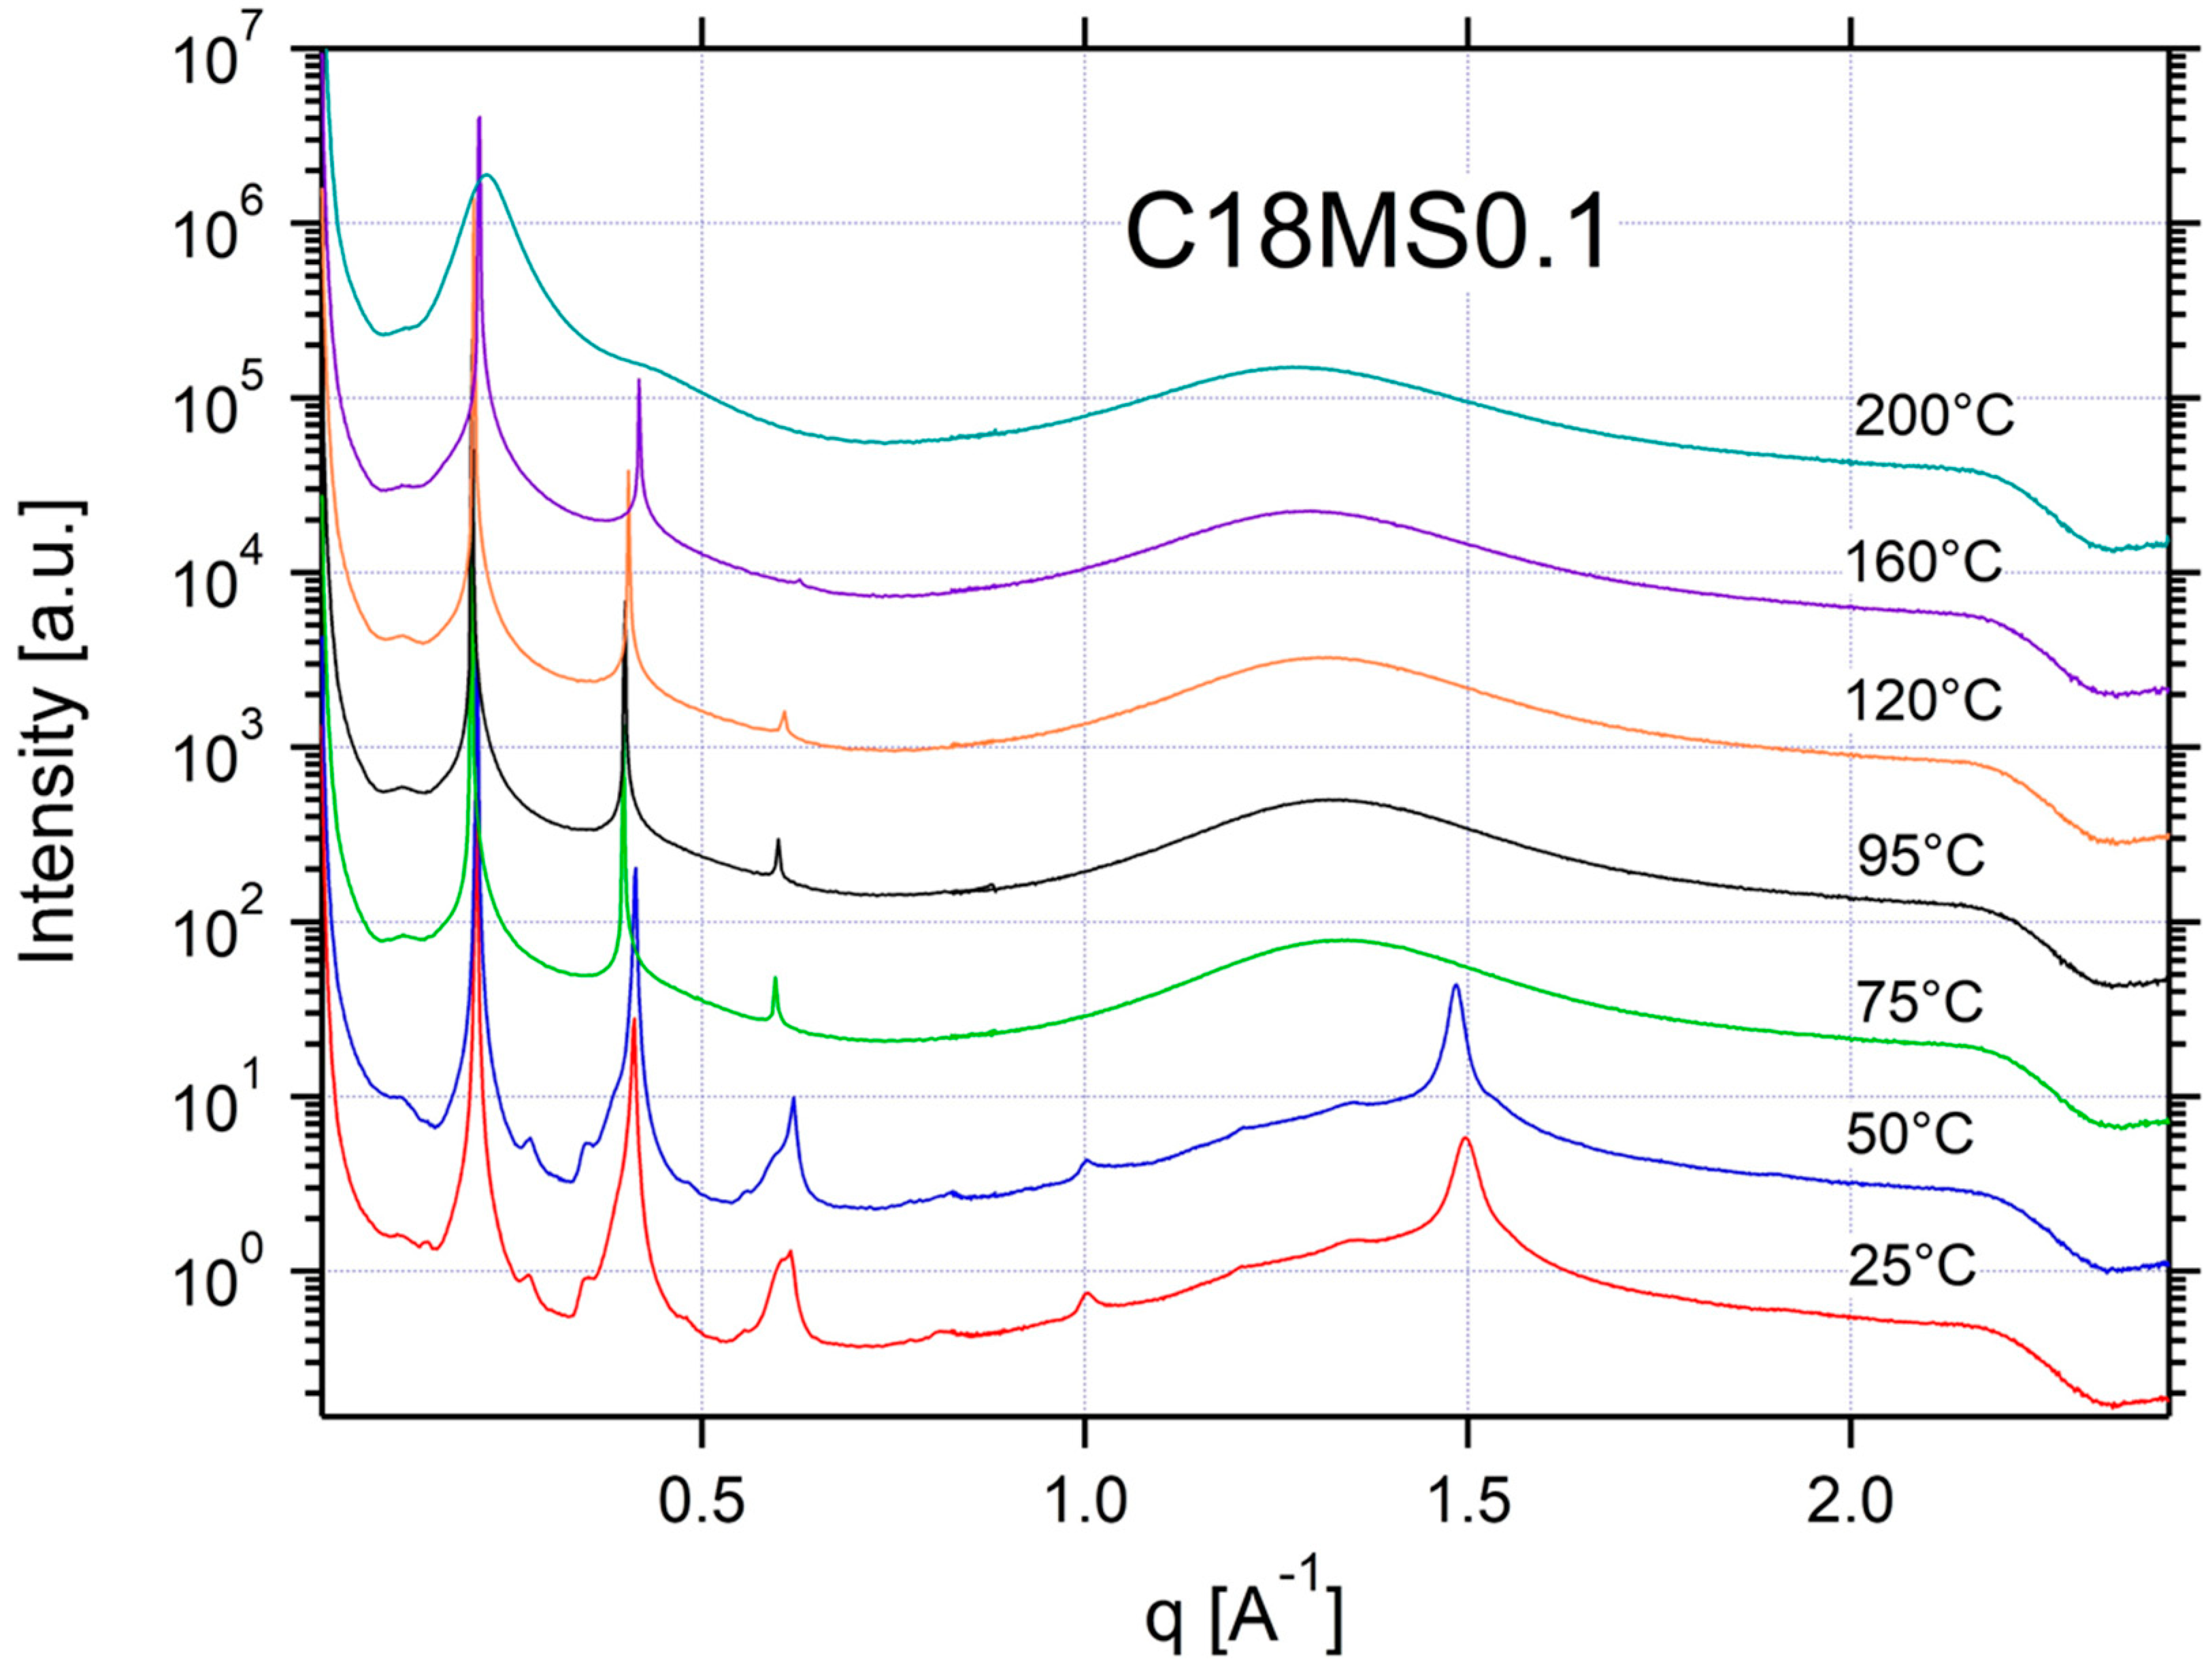
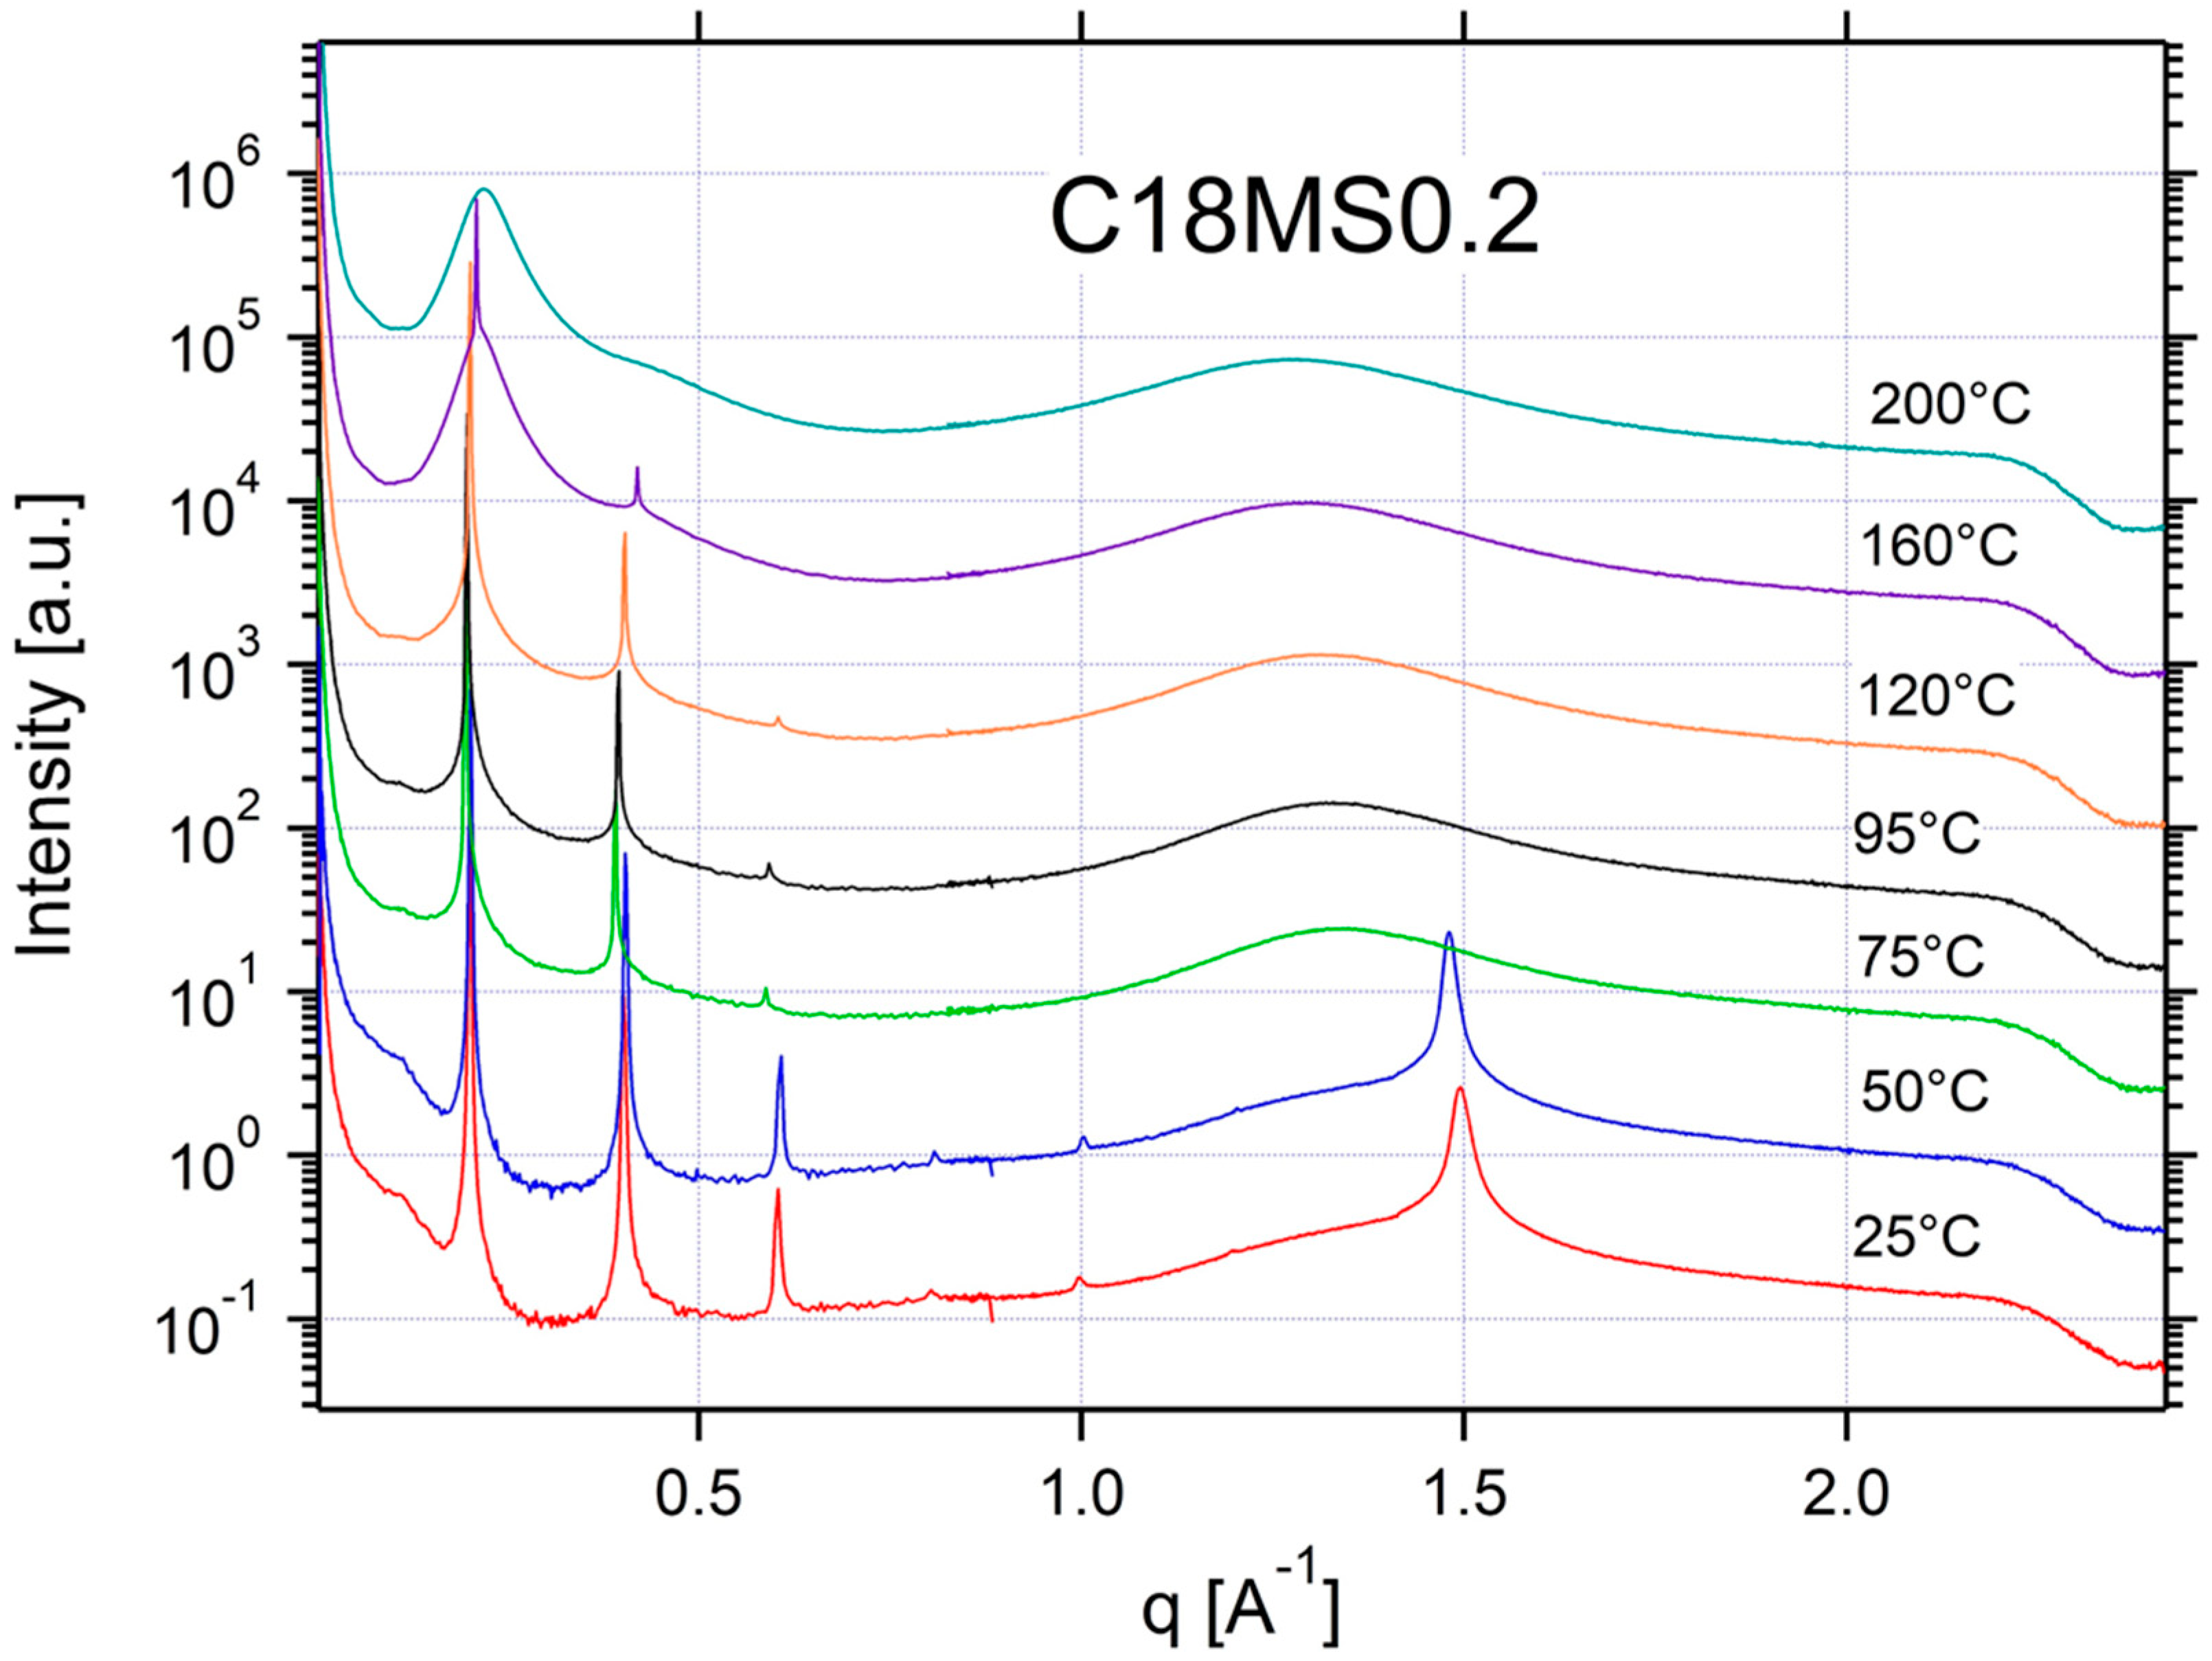
2.2. Thermal Properties and Phase Behavior
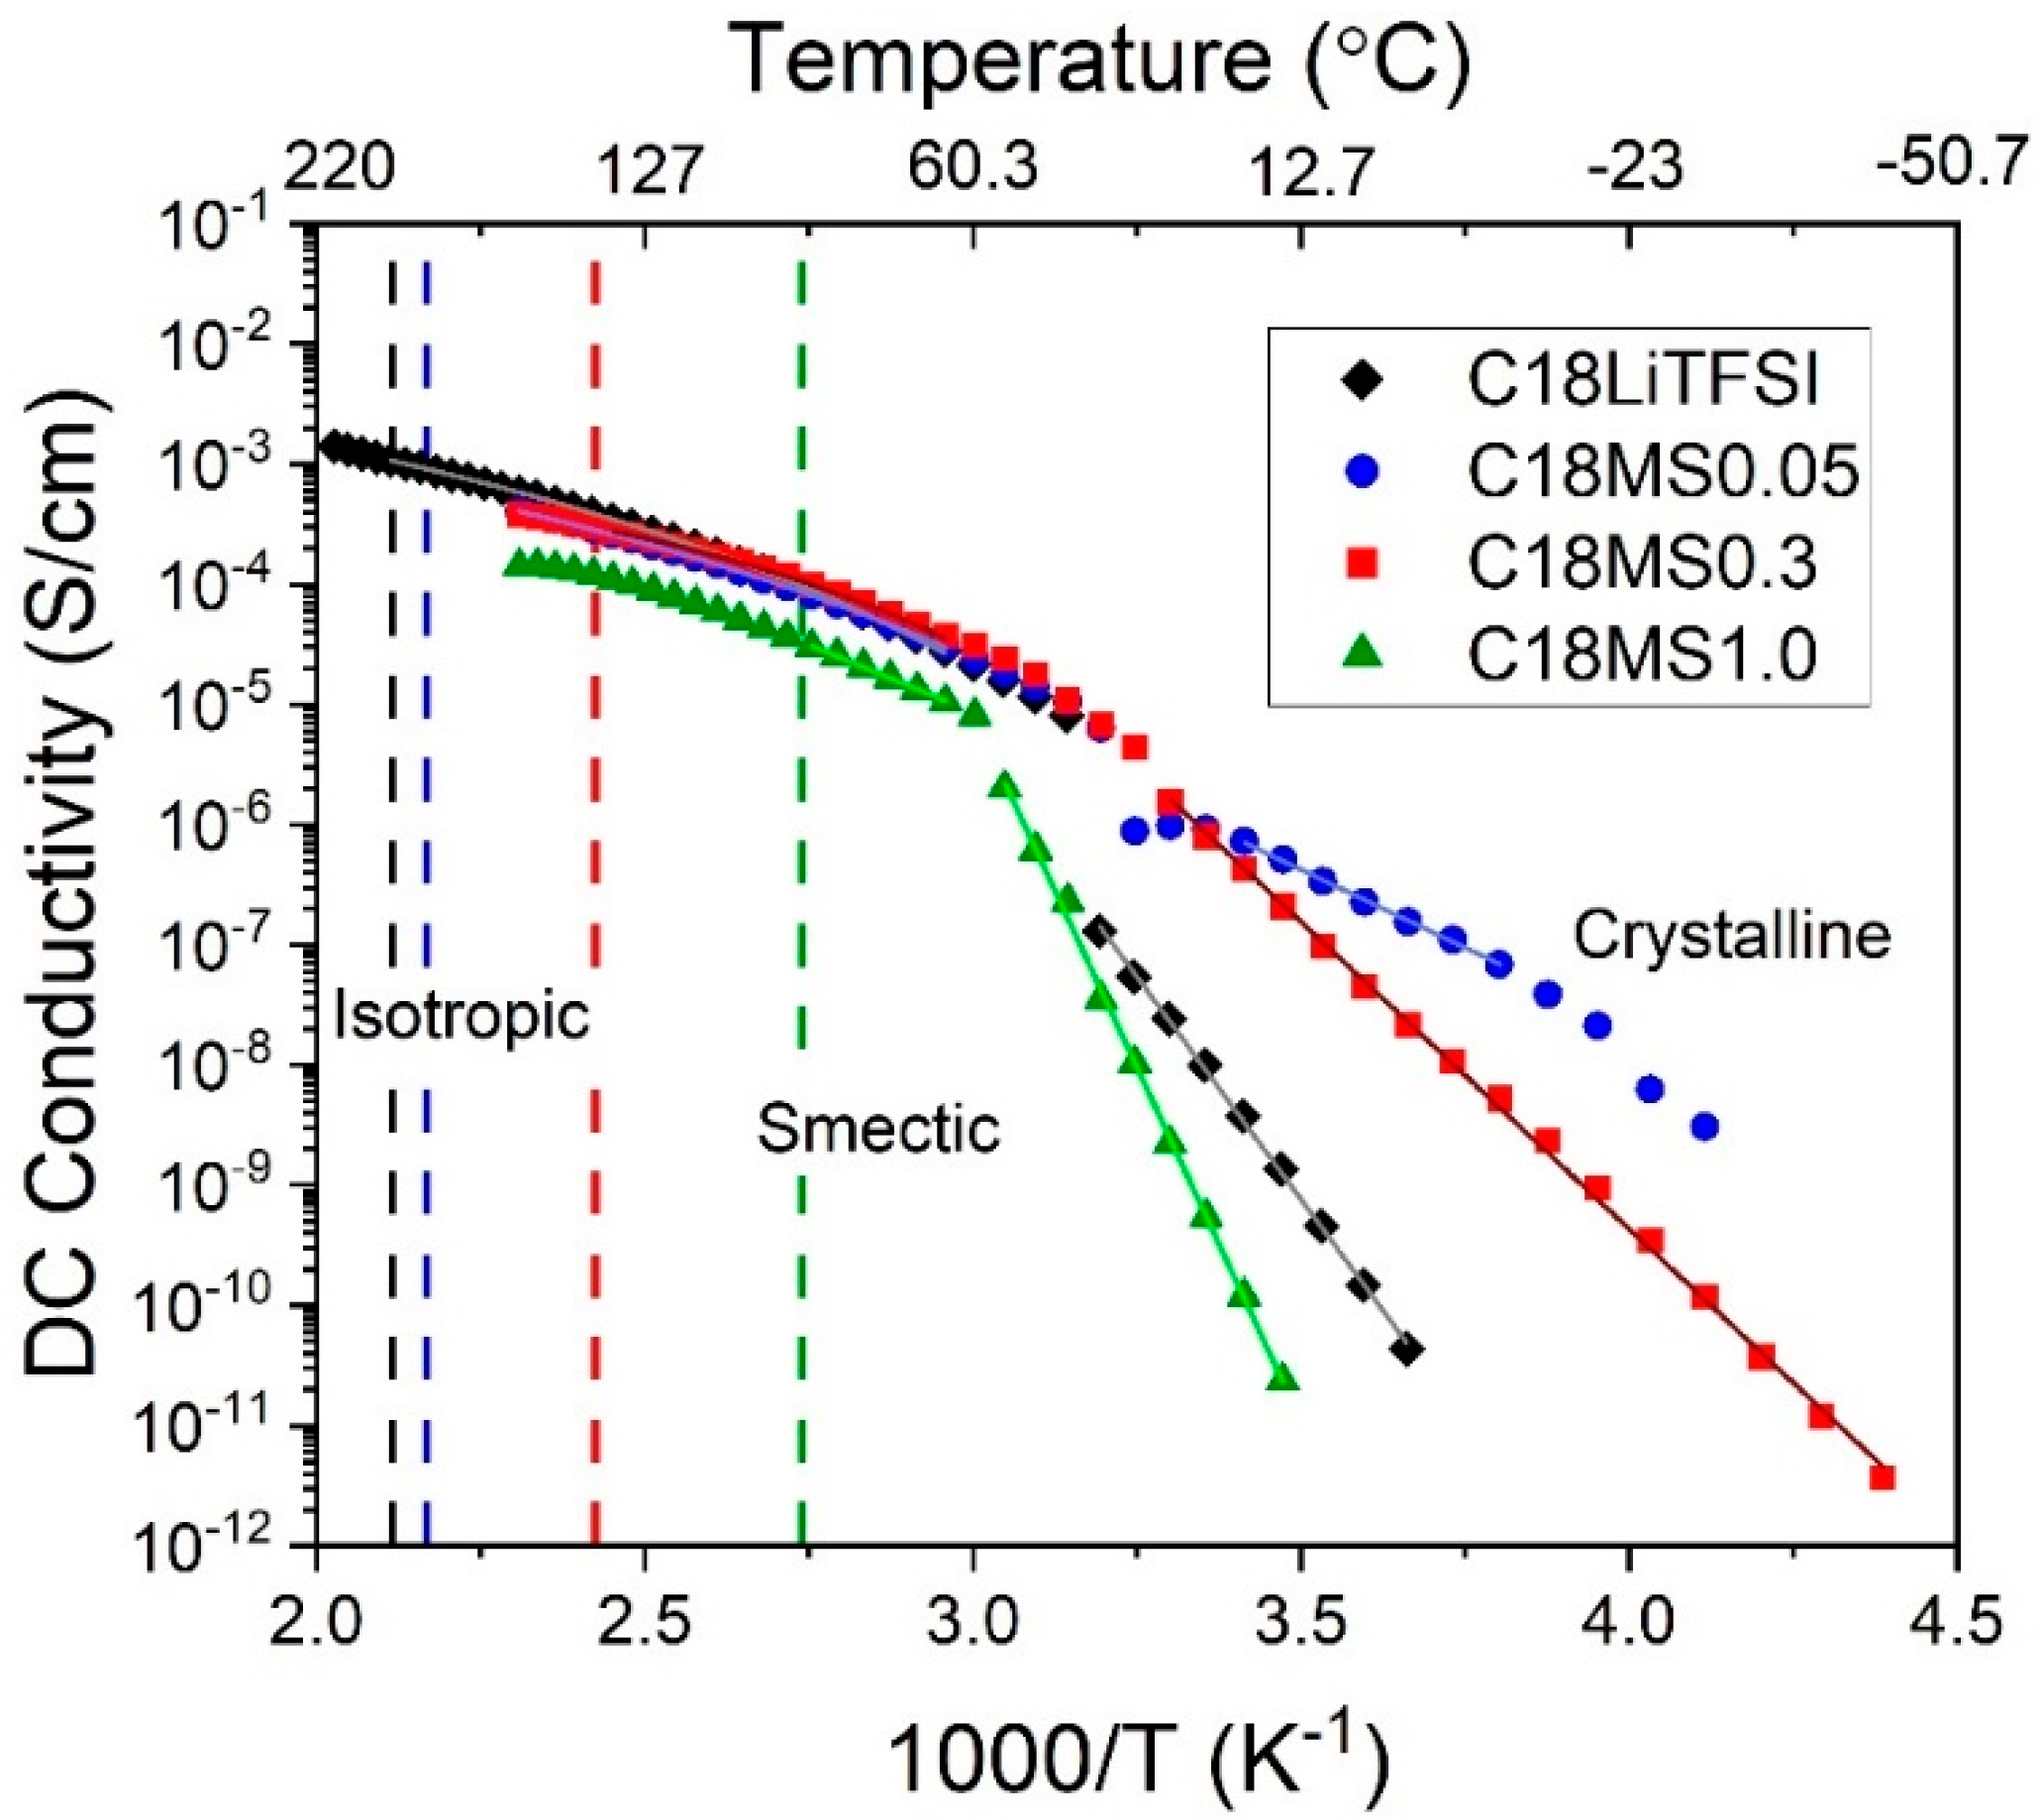
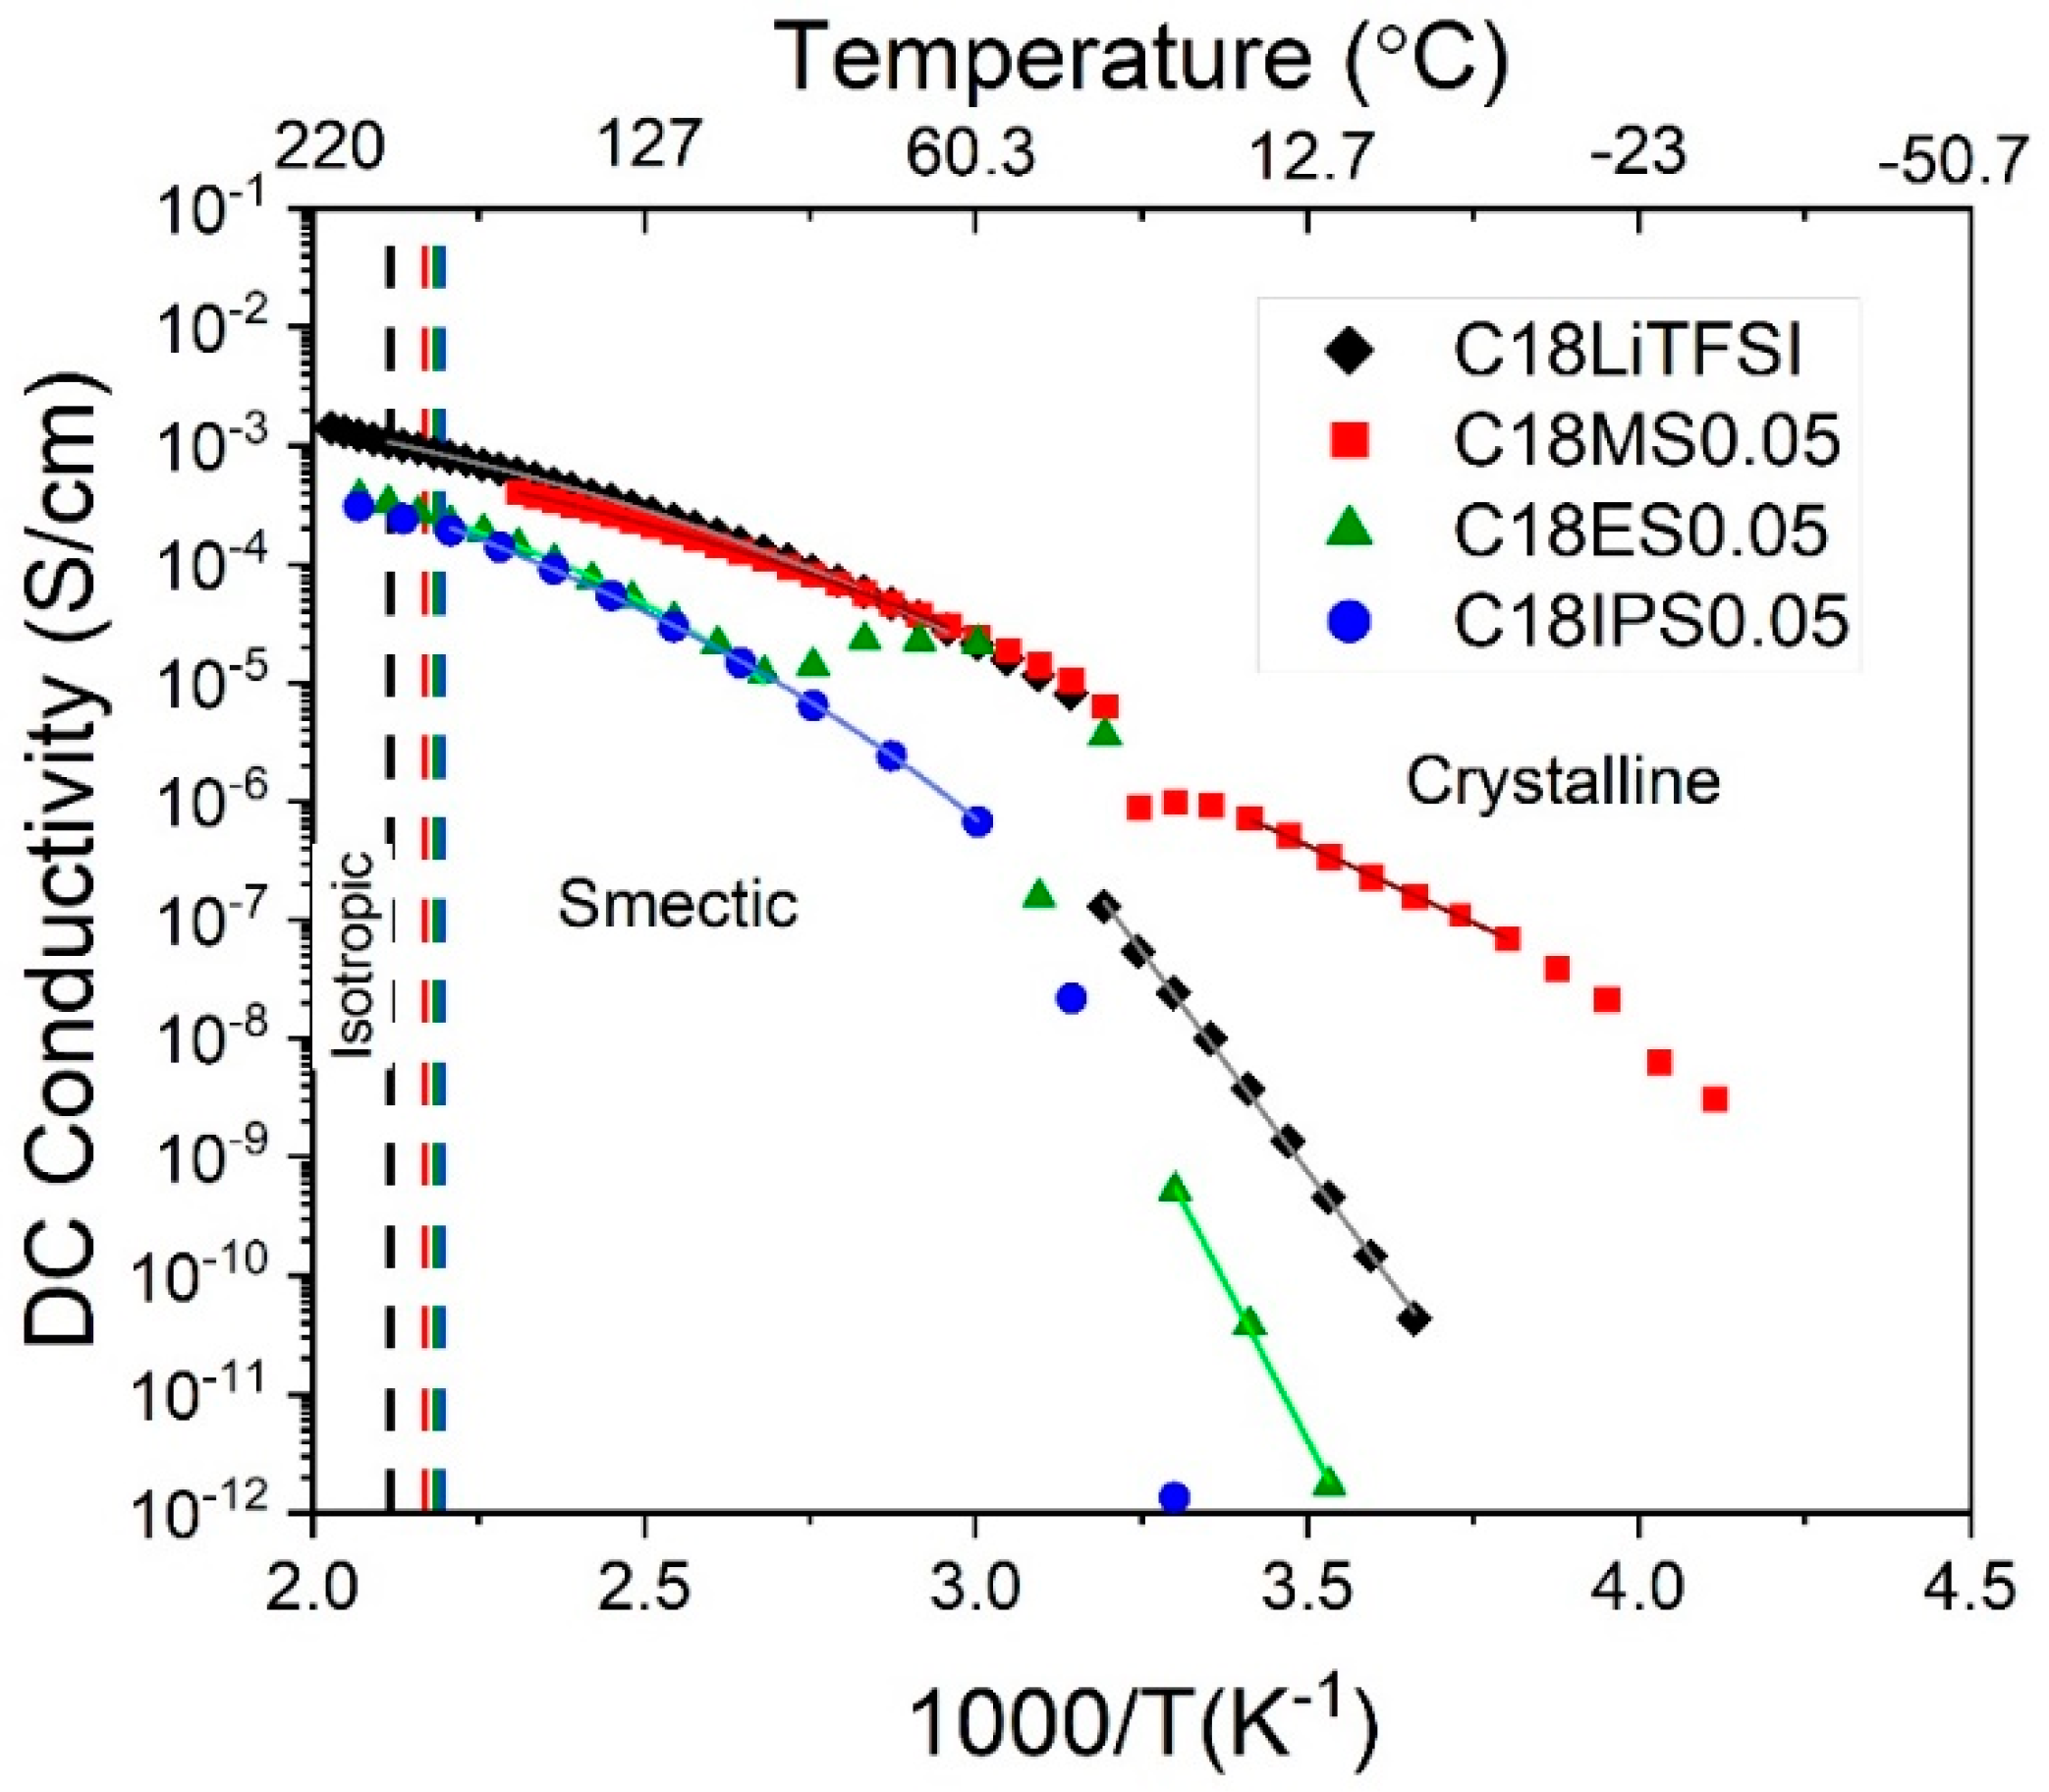
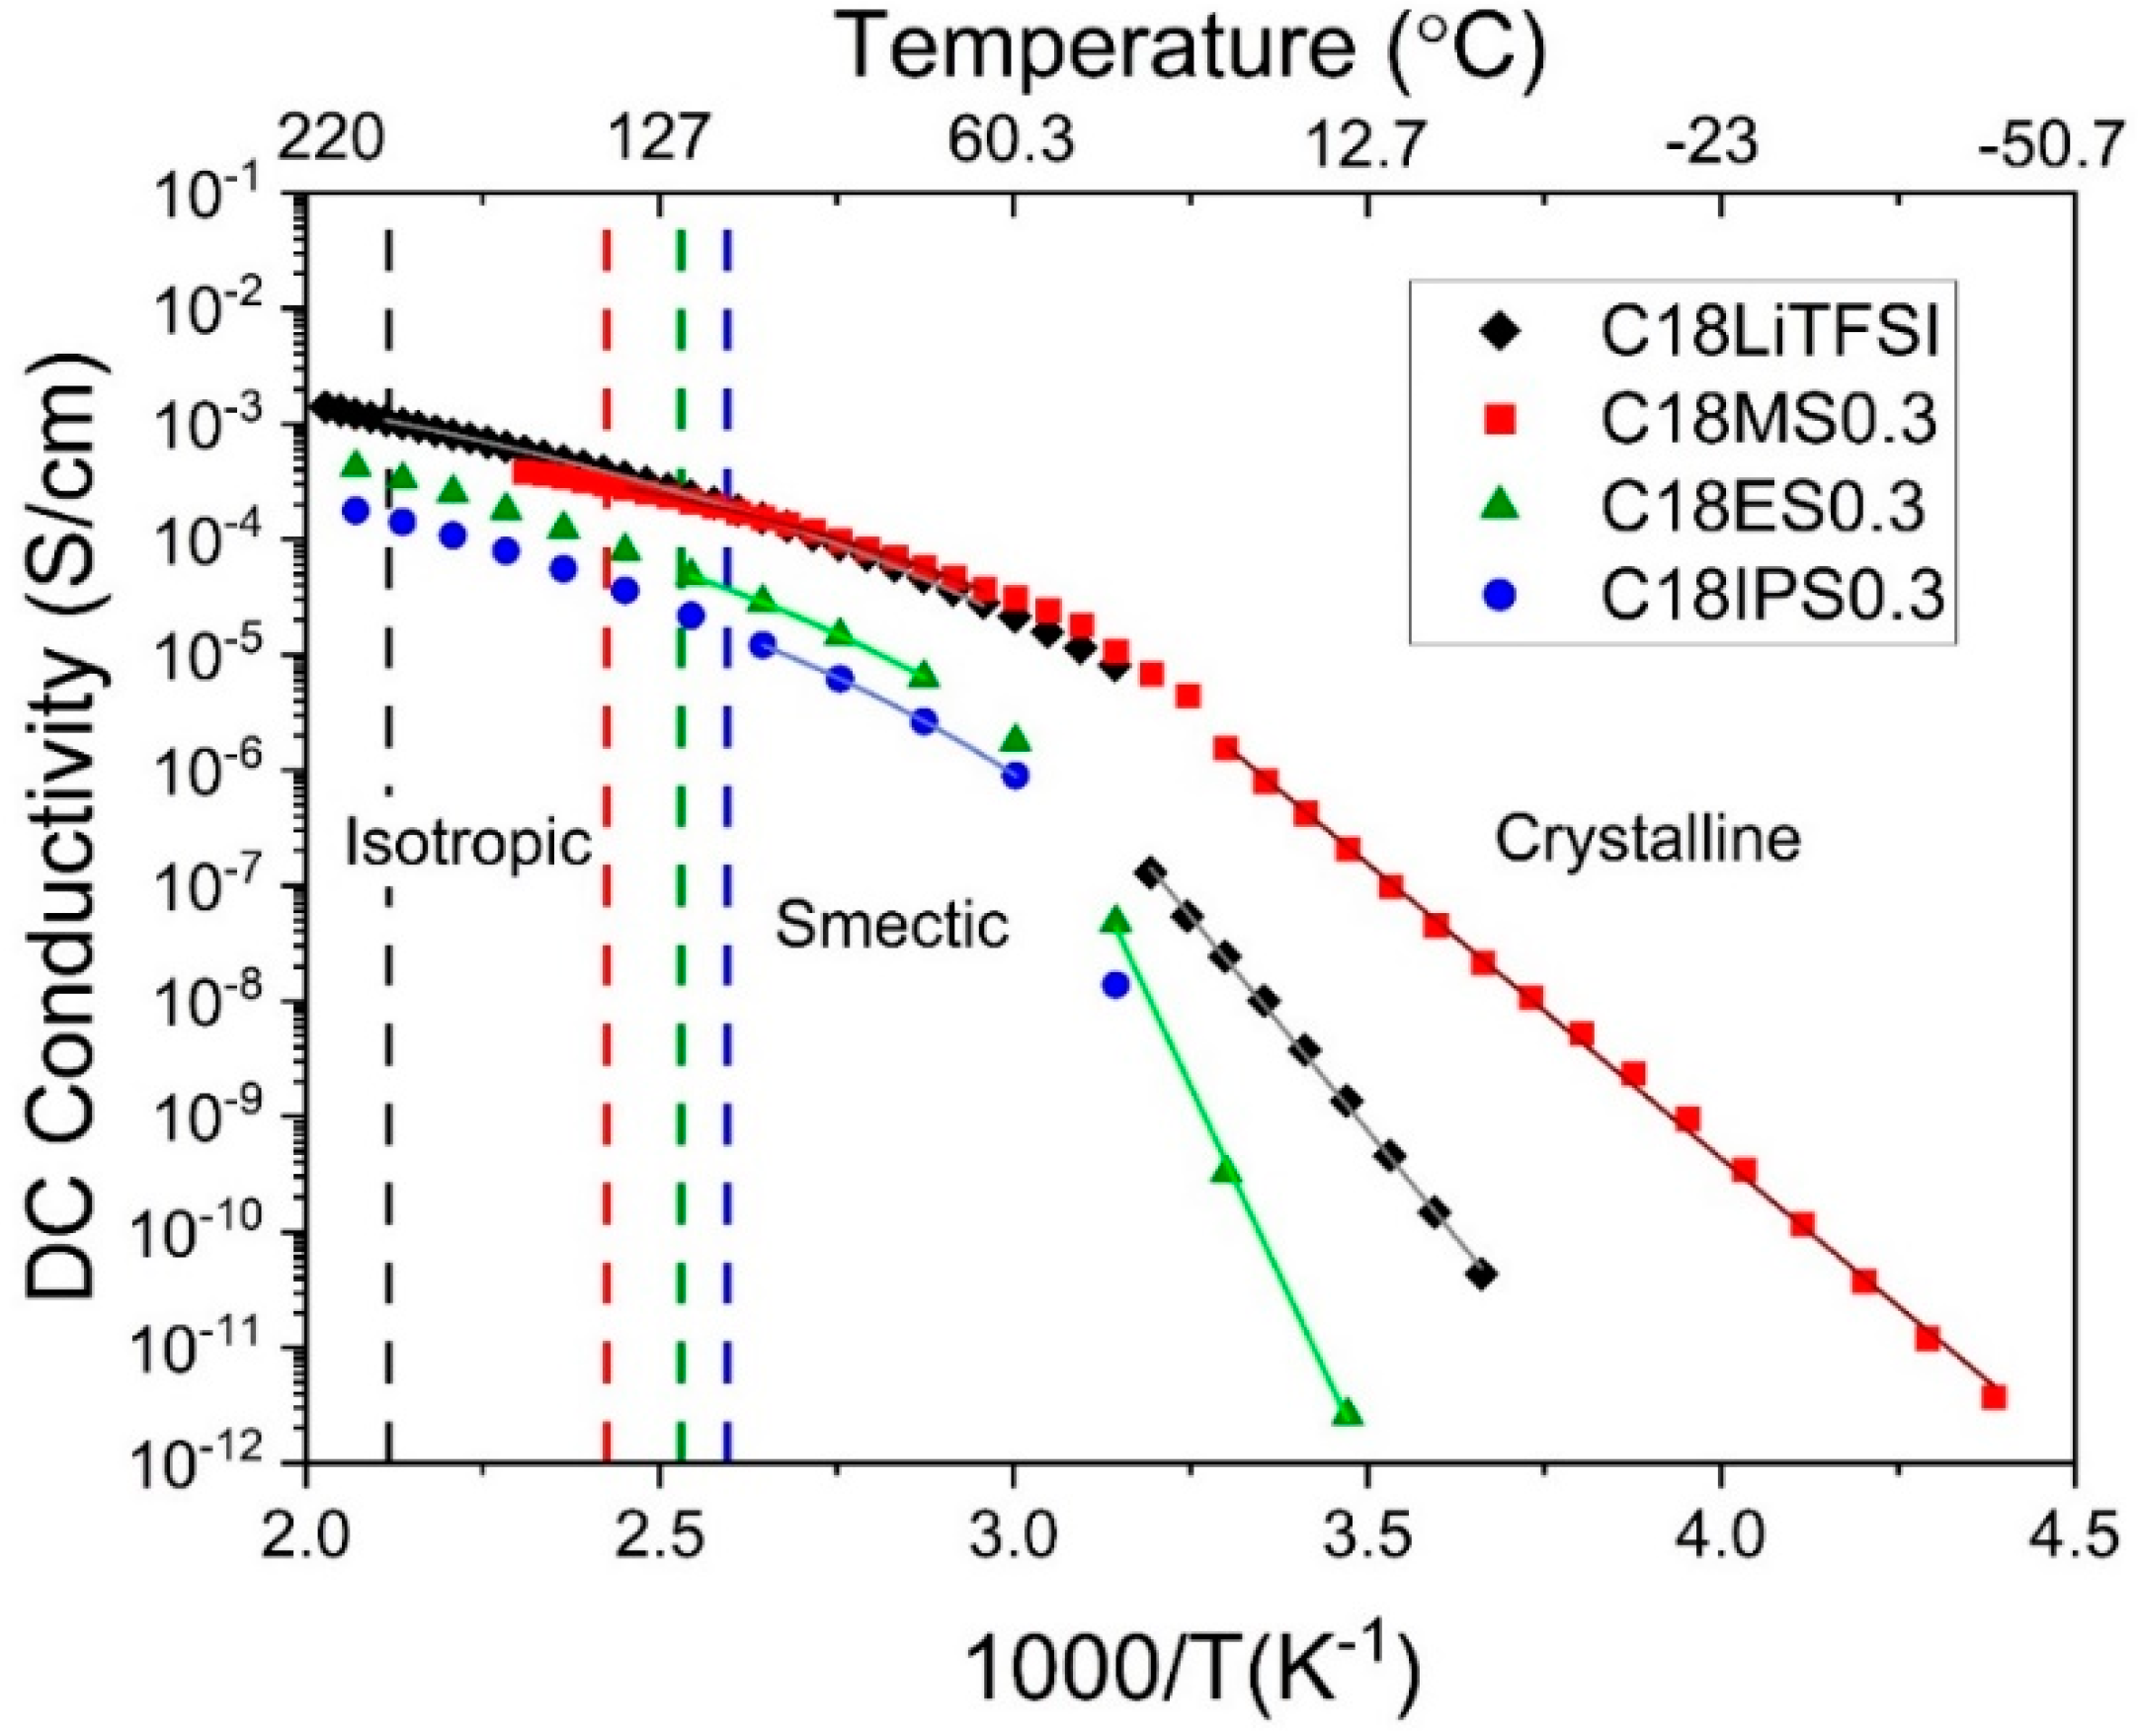
2.3. Conductivity
3. Discussion
4. Conclusions
5. Materials and Methods
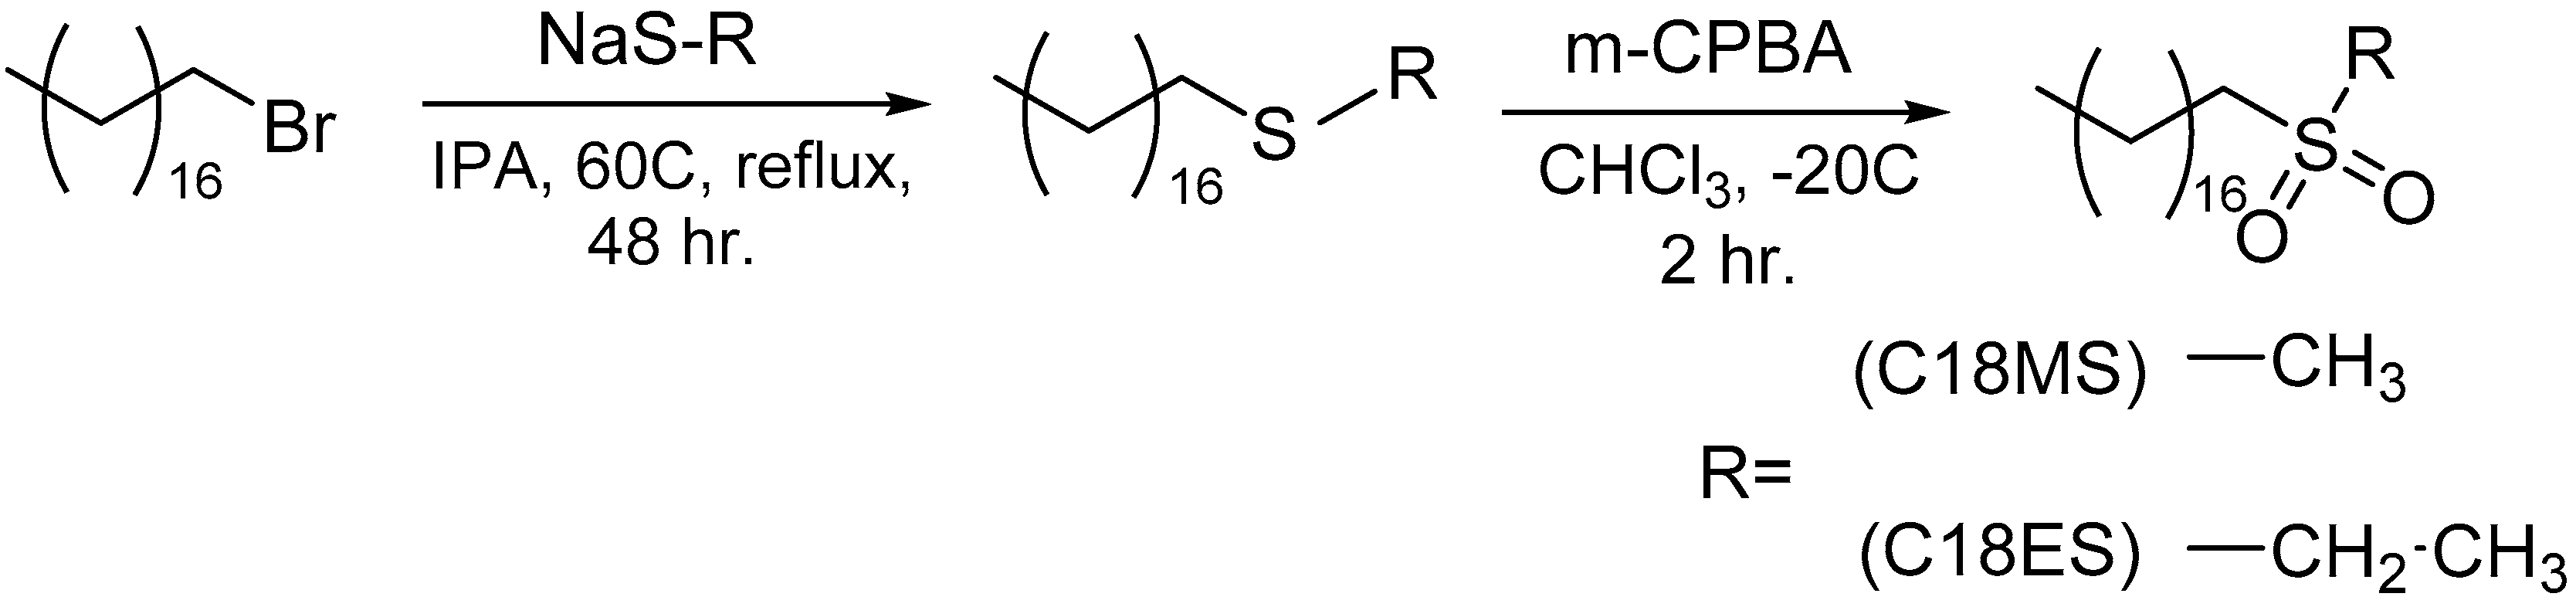
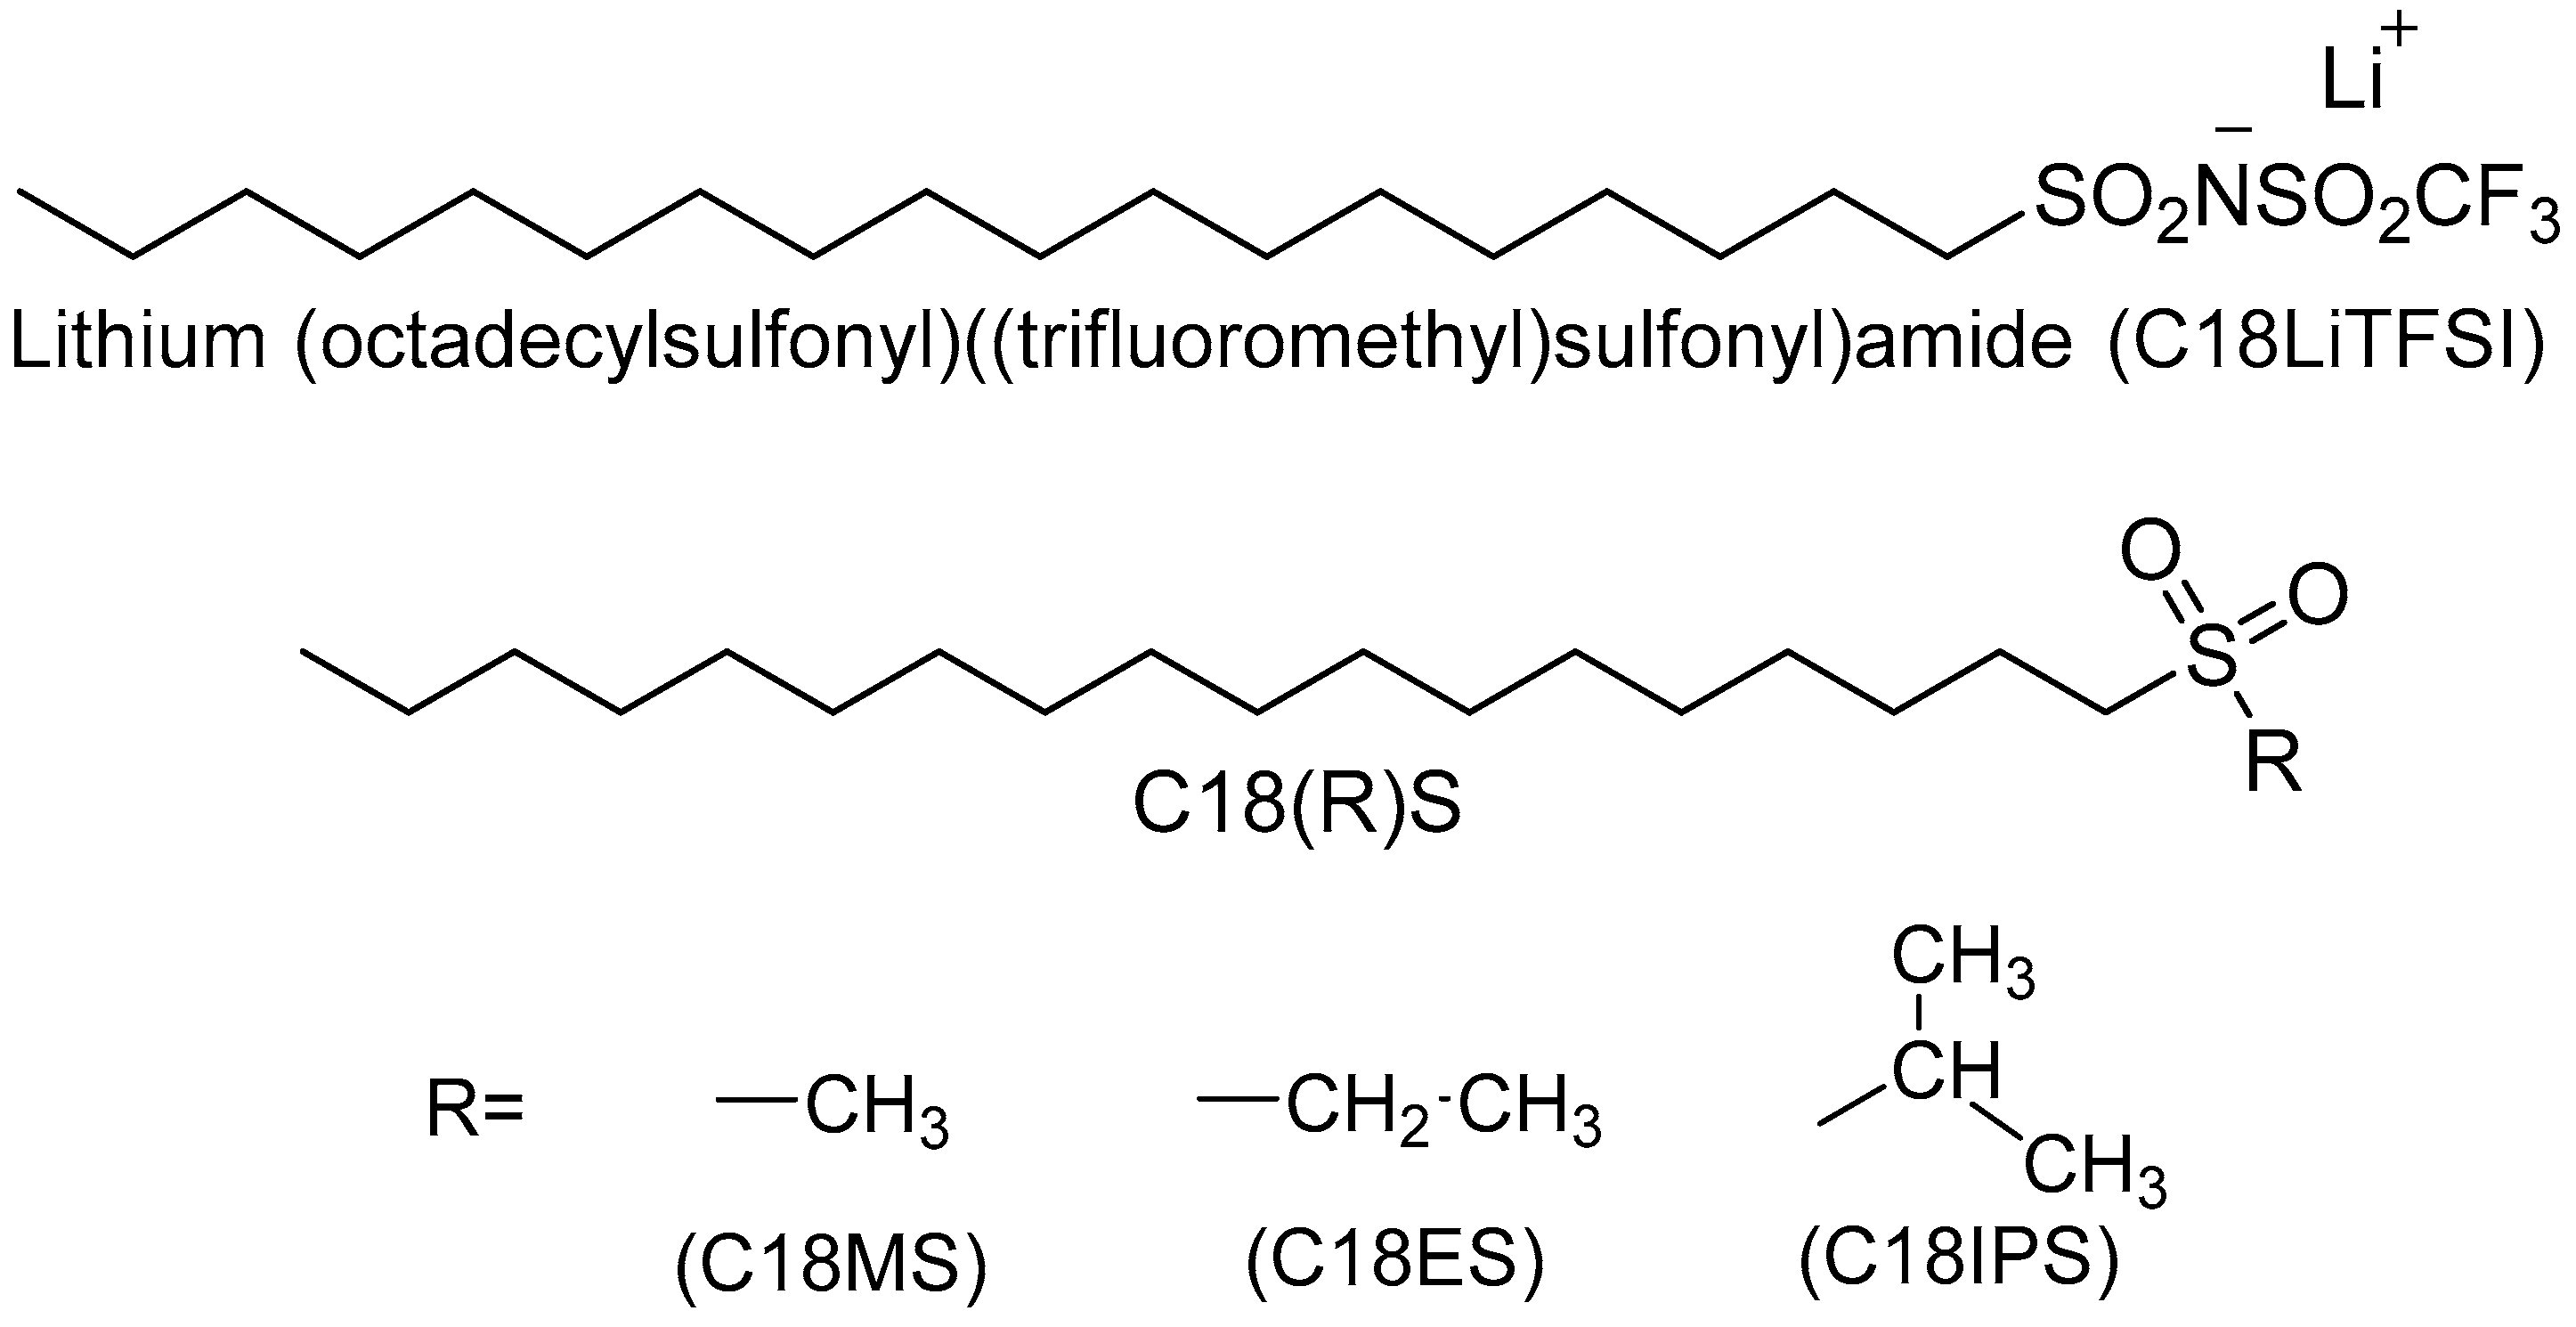
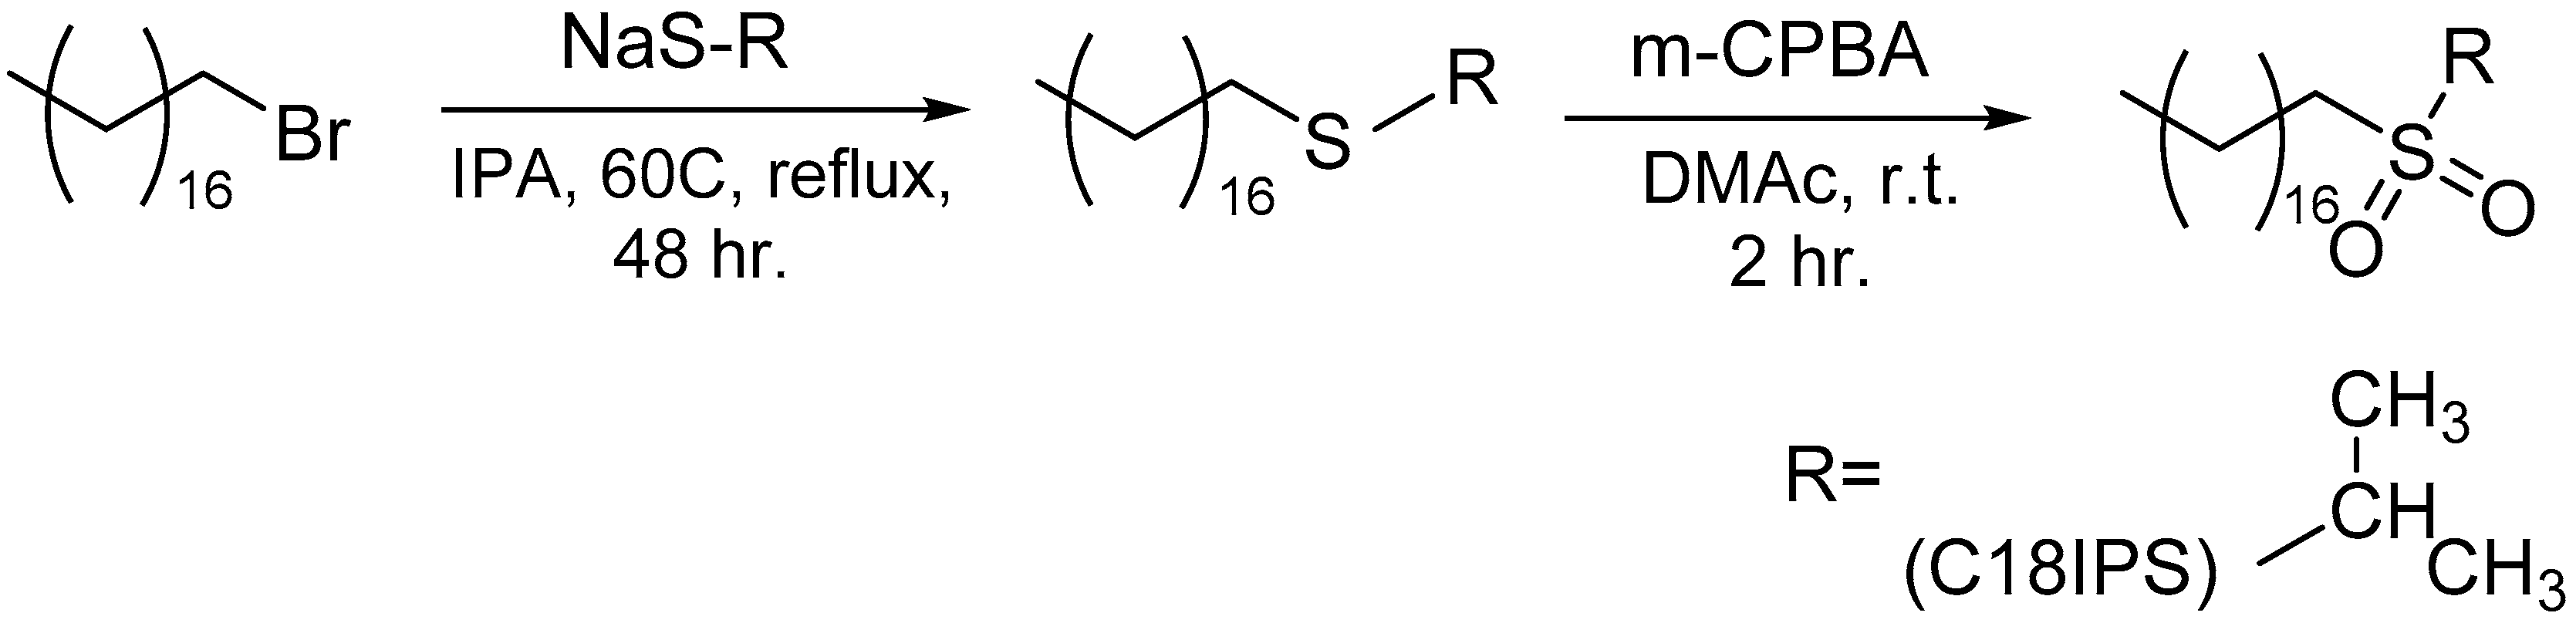
5.1. Synthesis
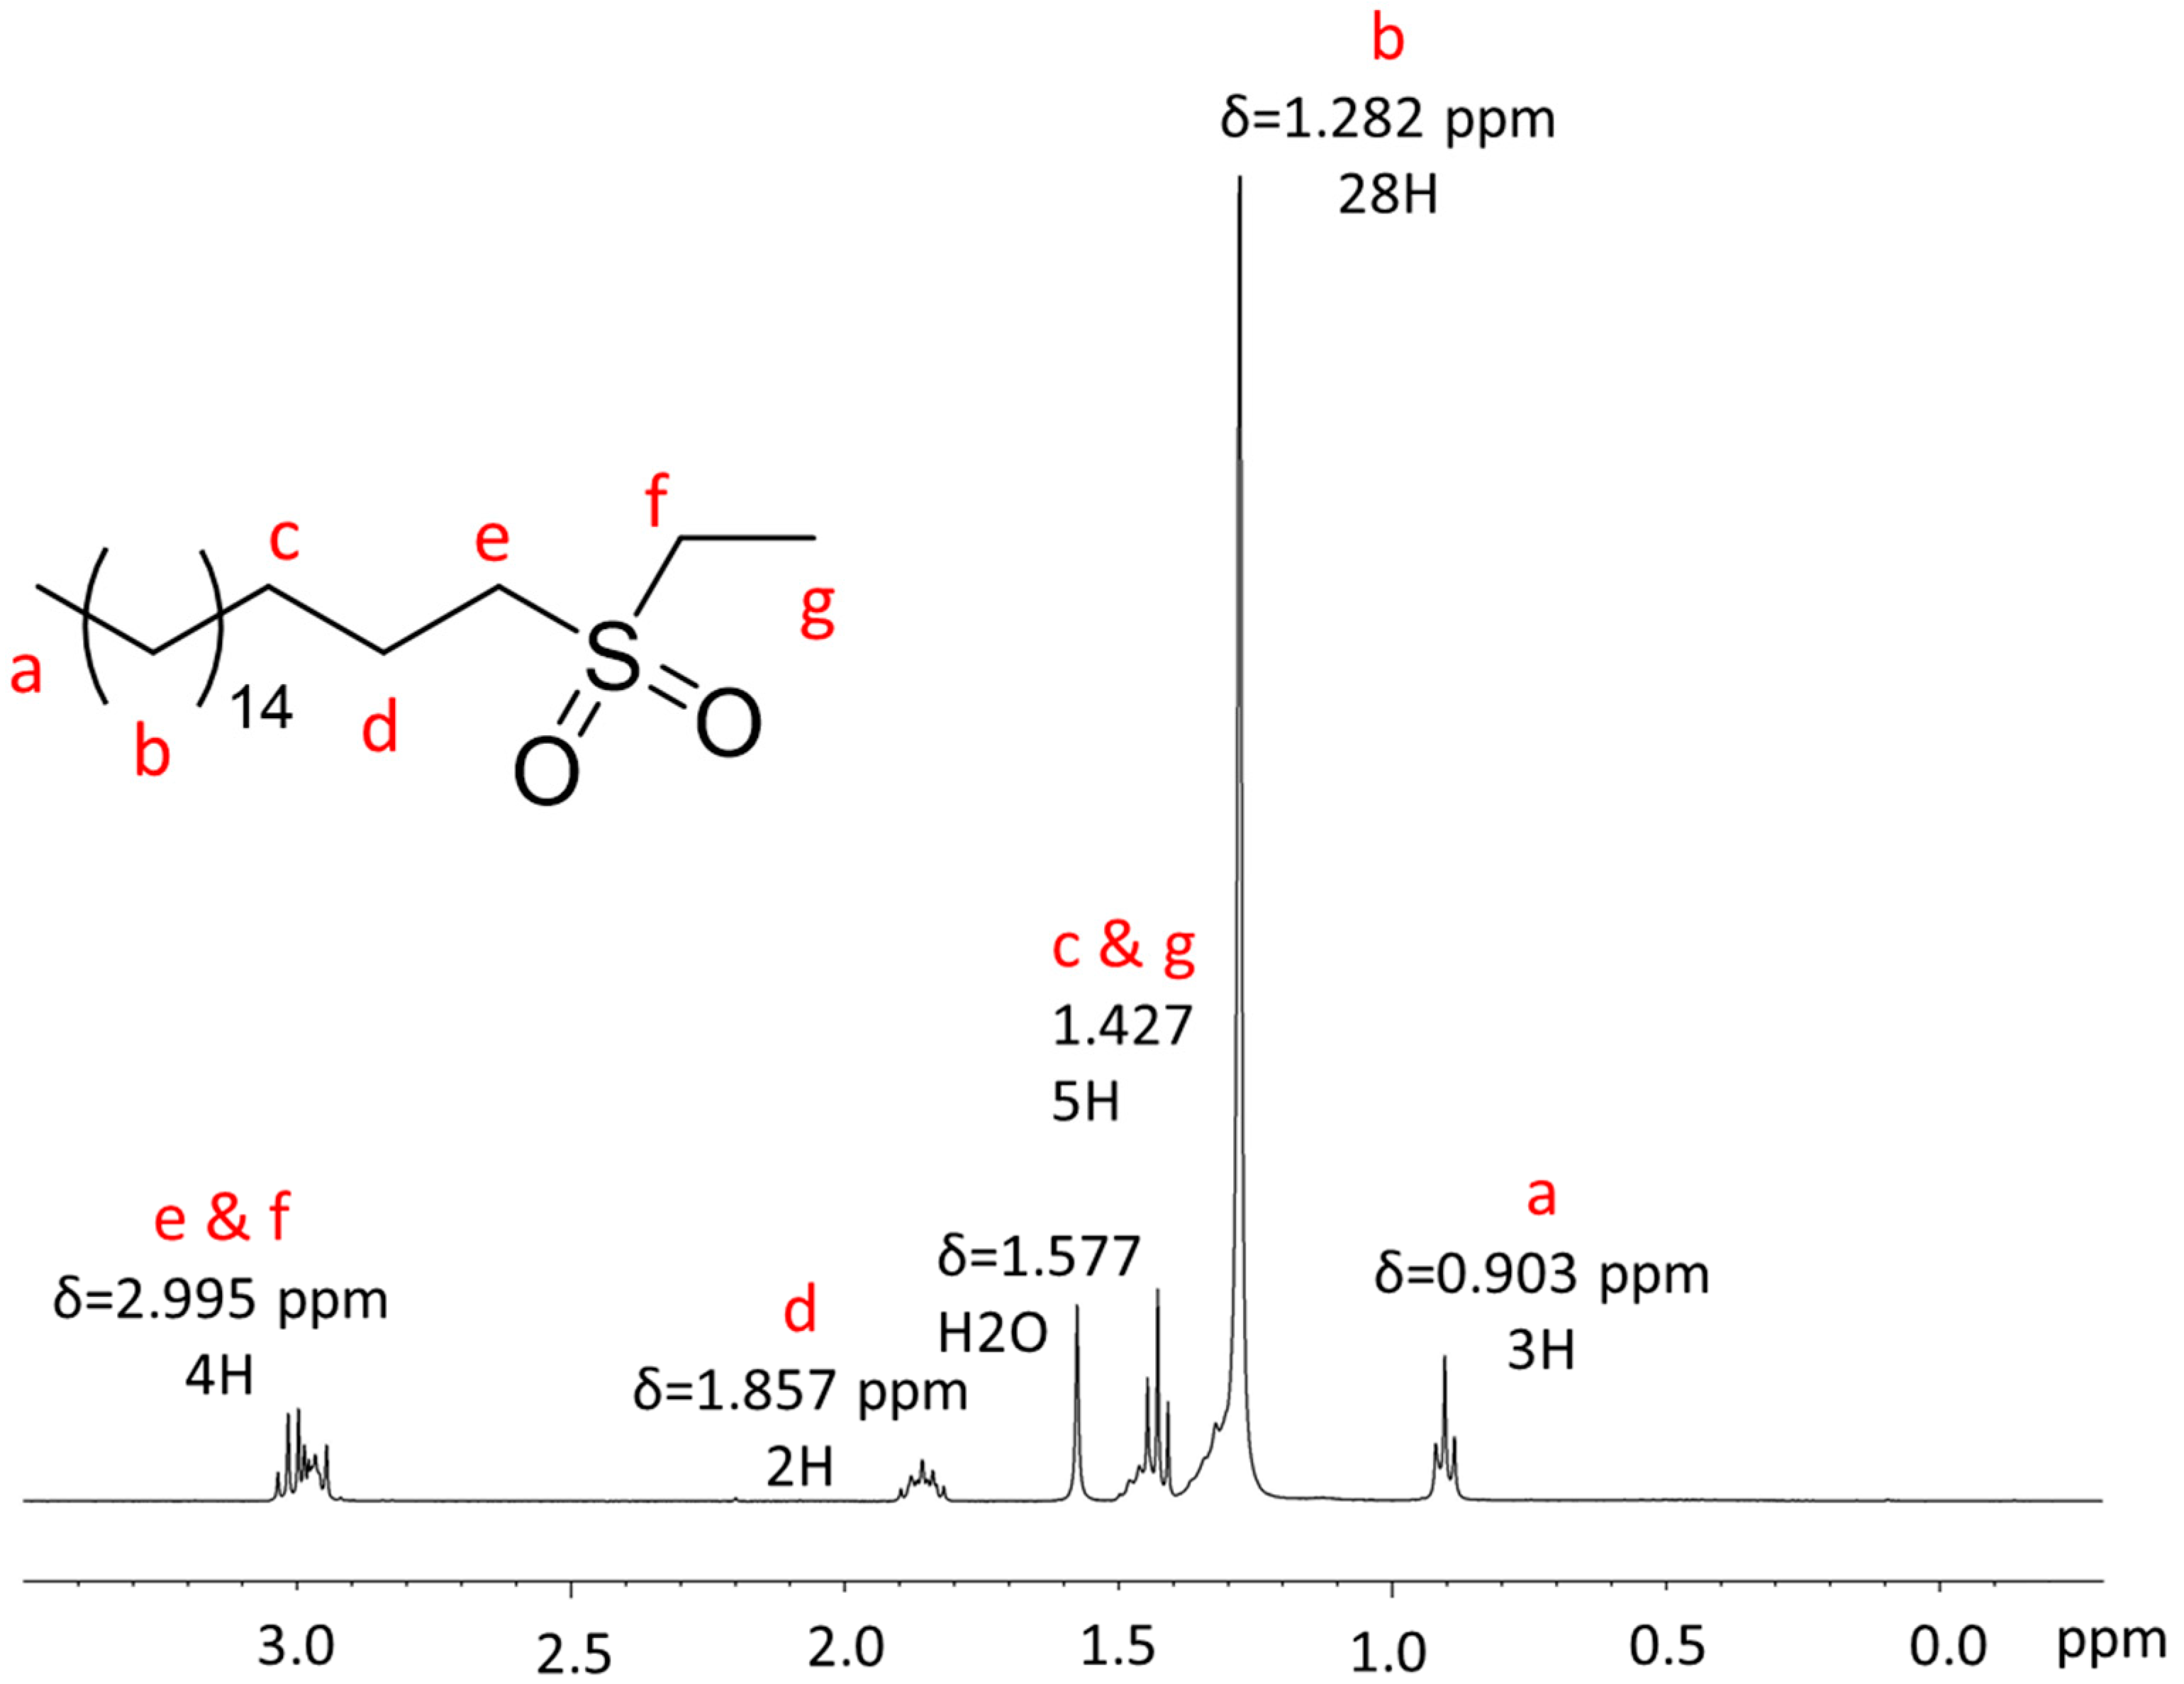
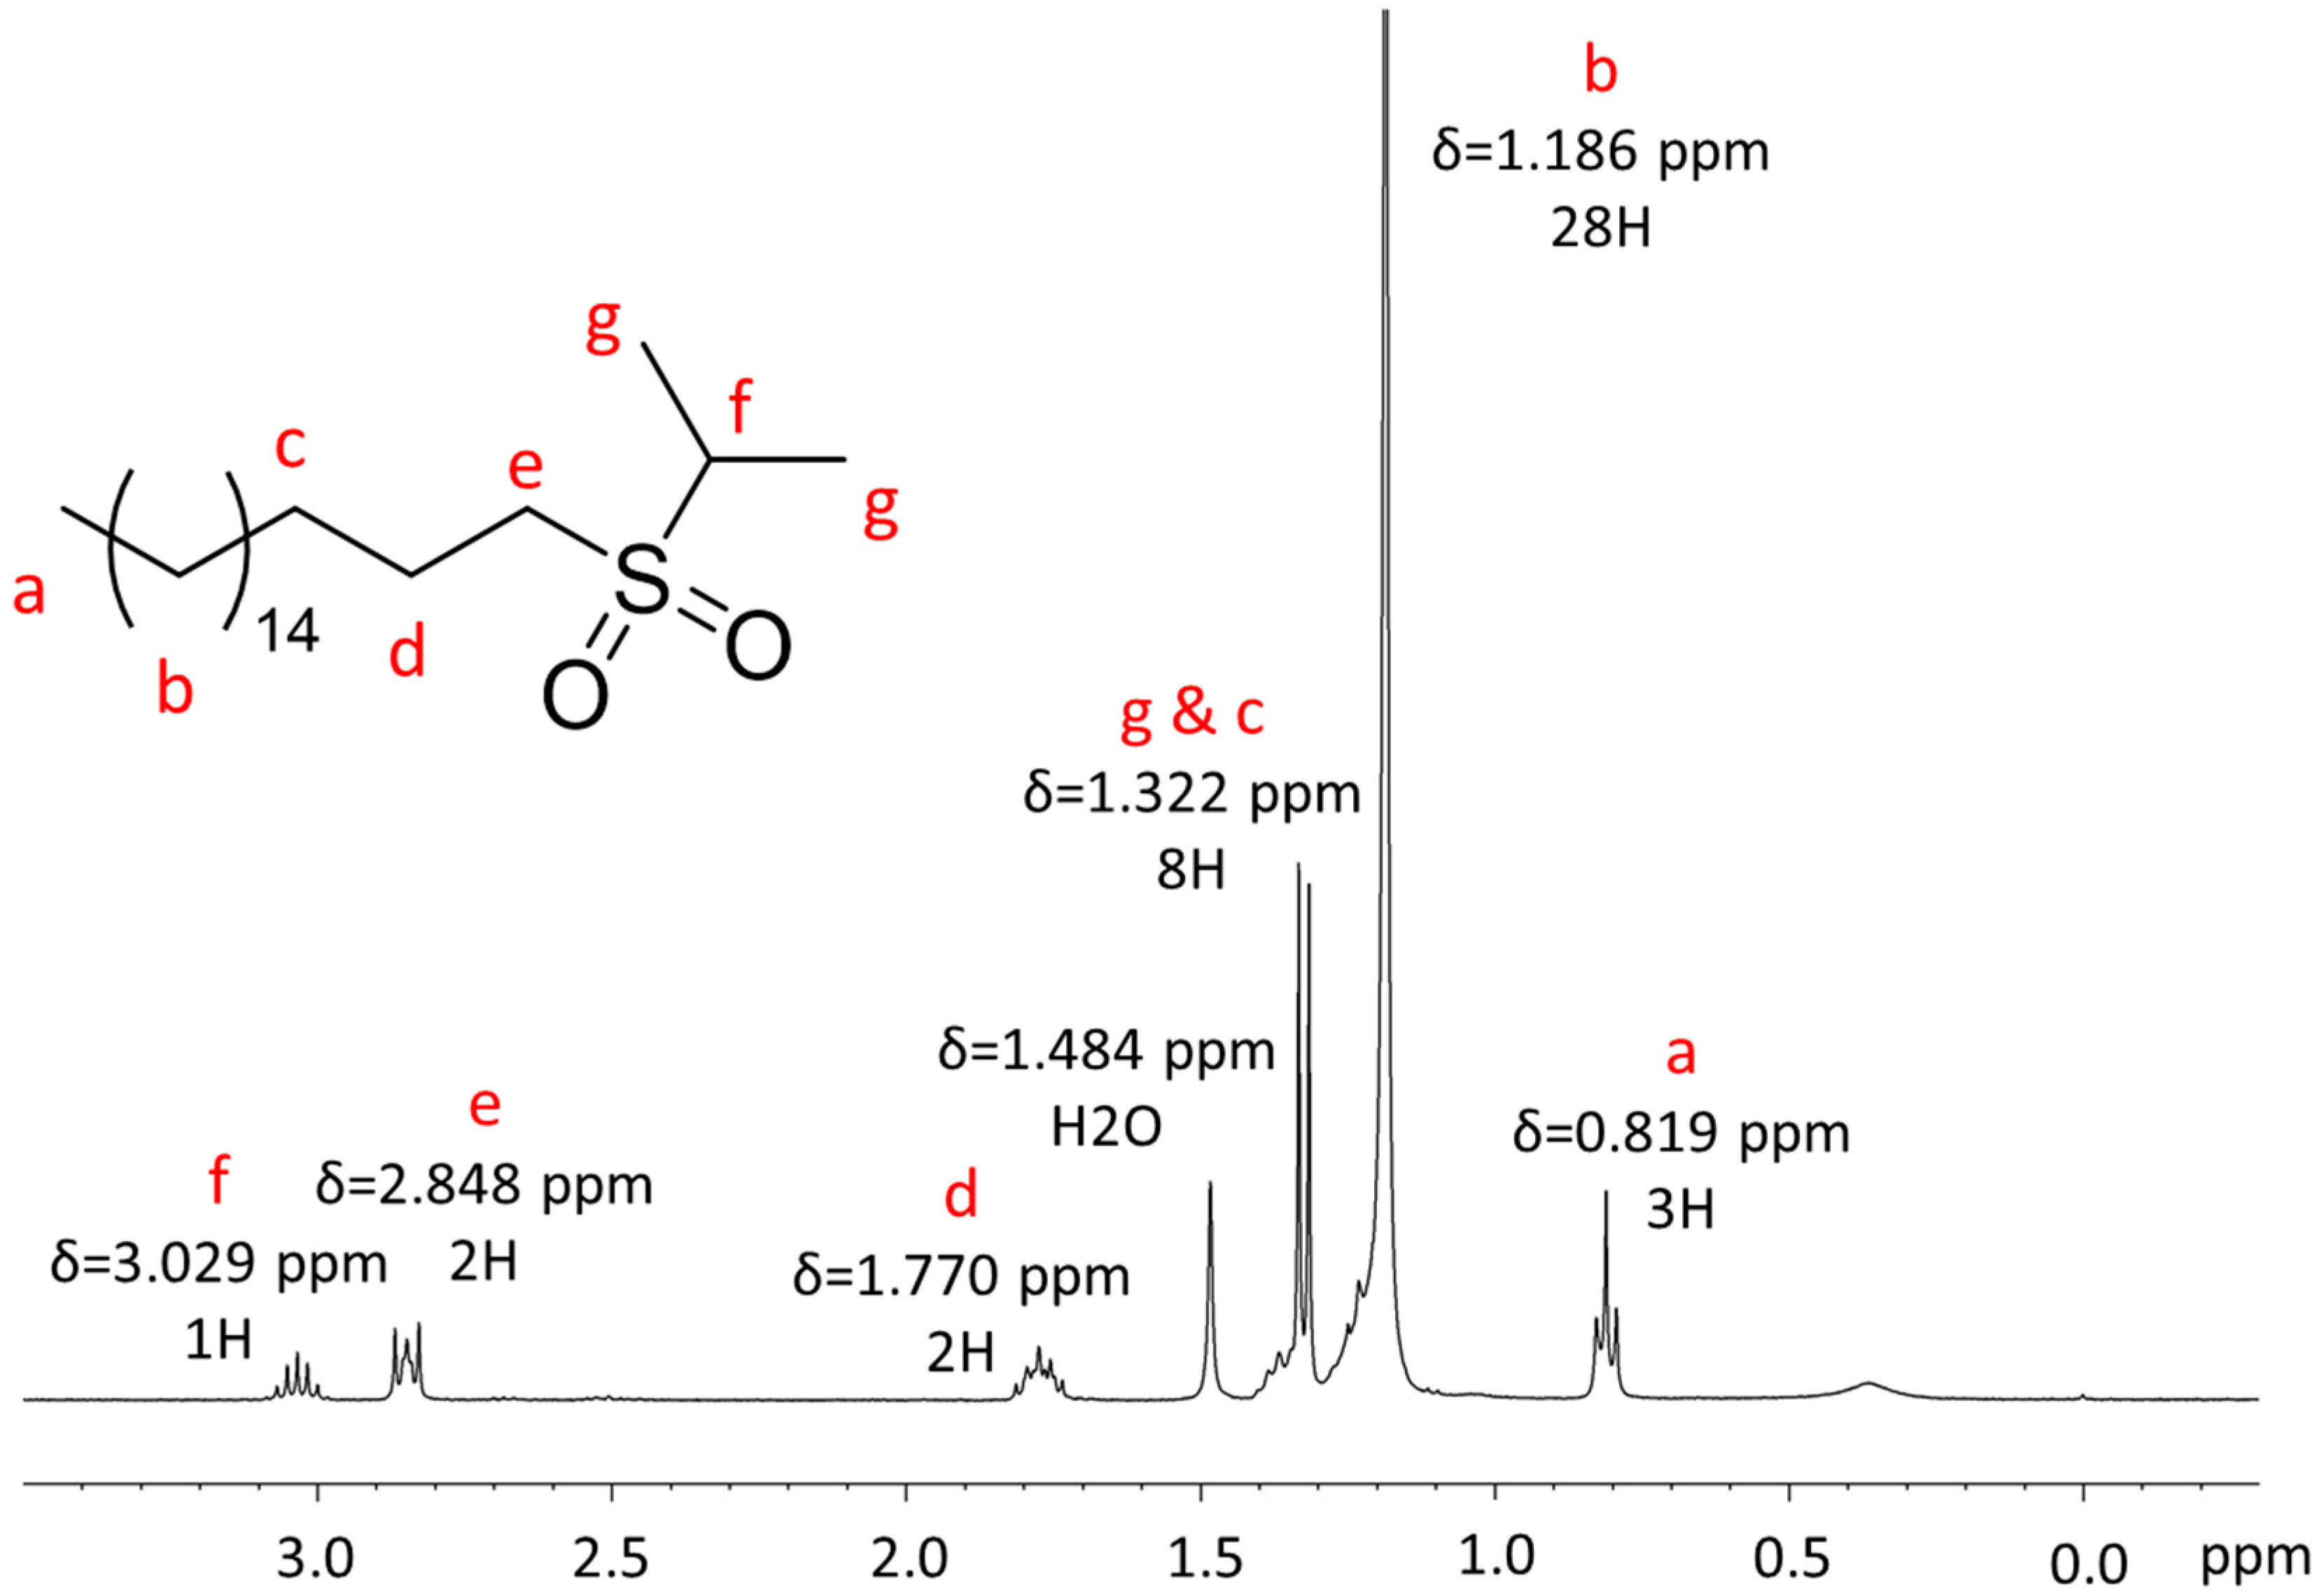
5.2. NMR Characterization
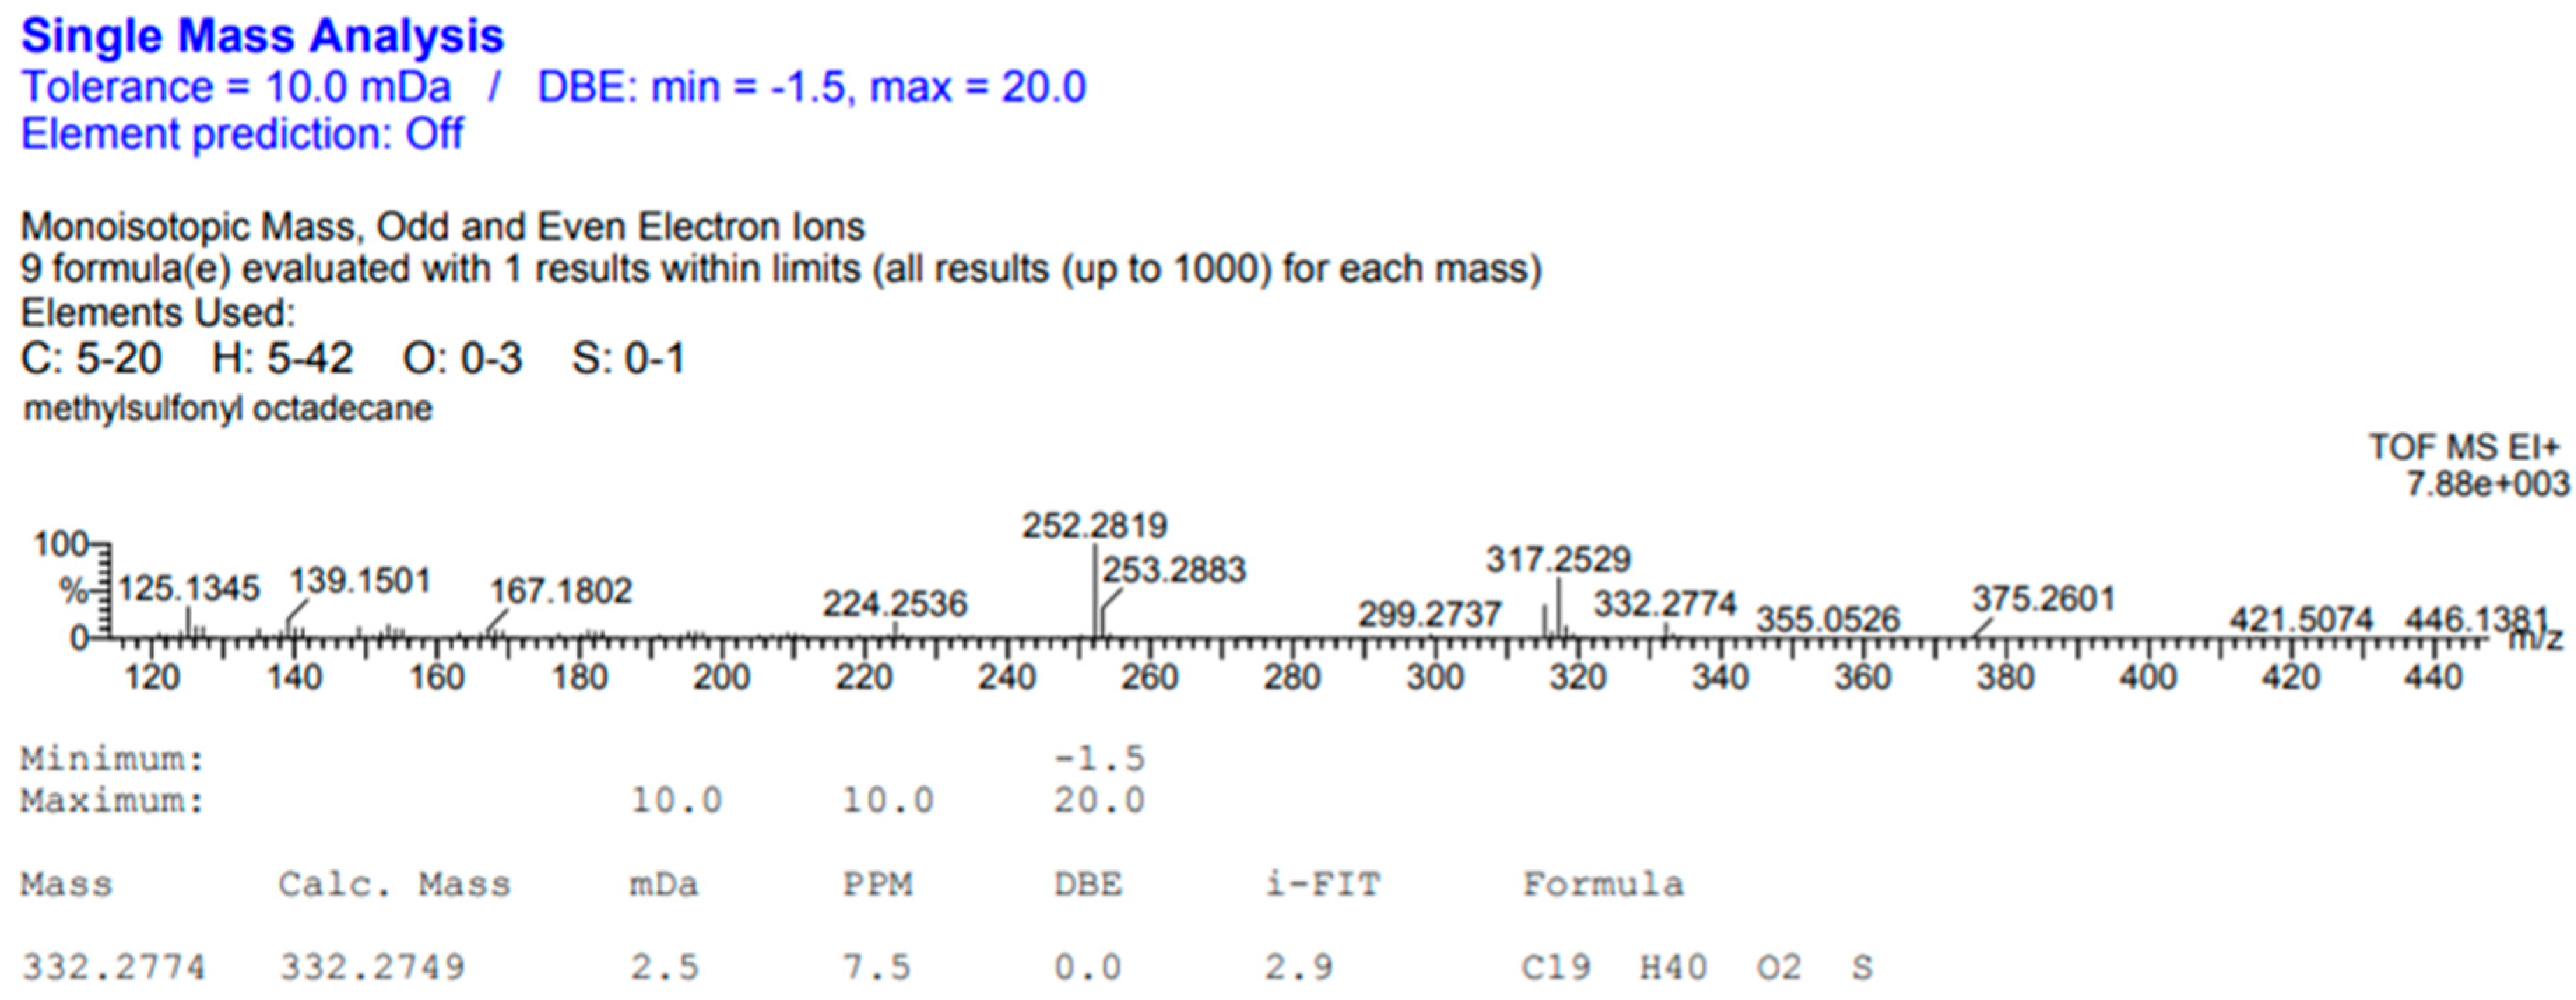
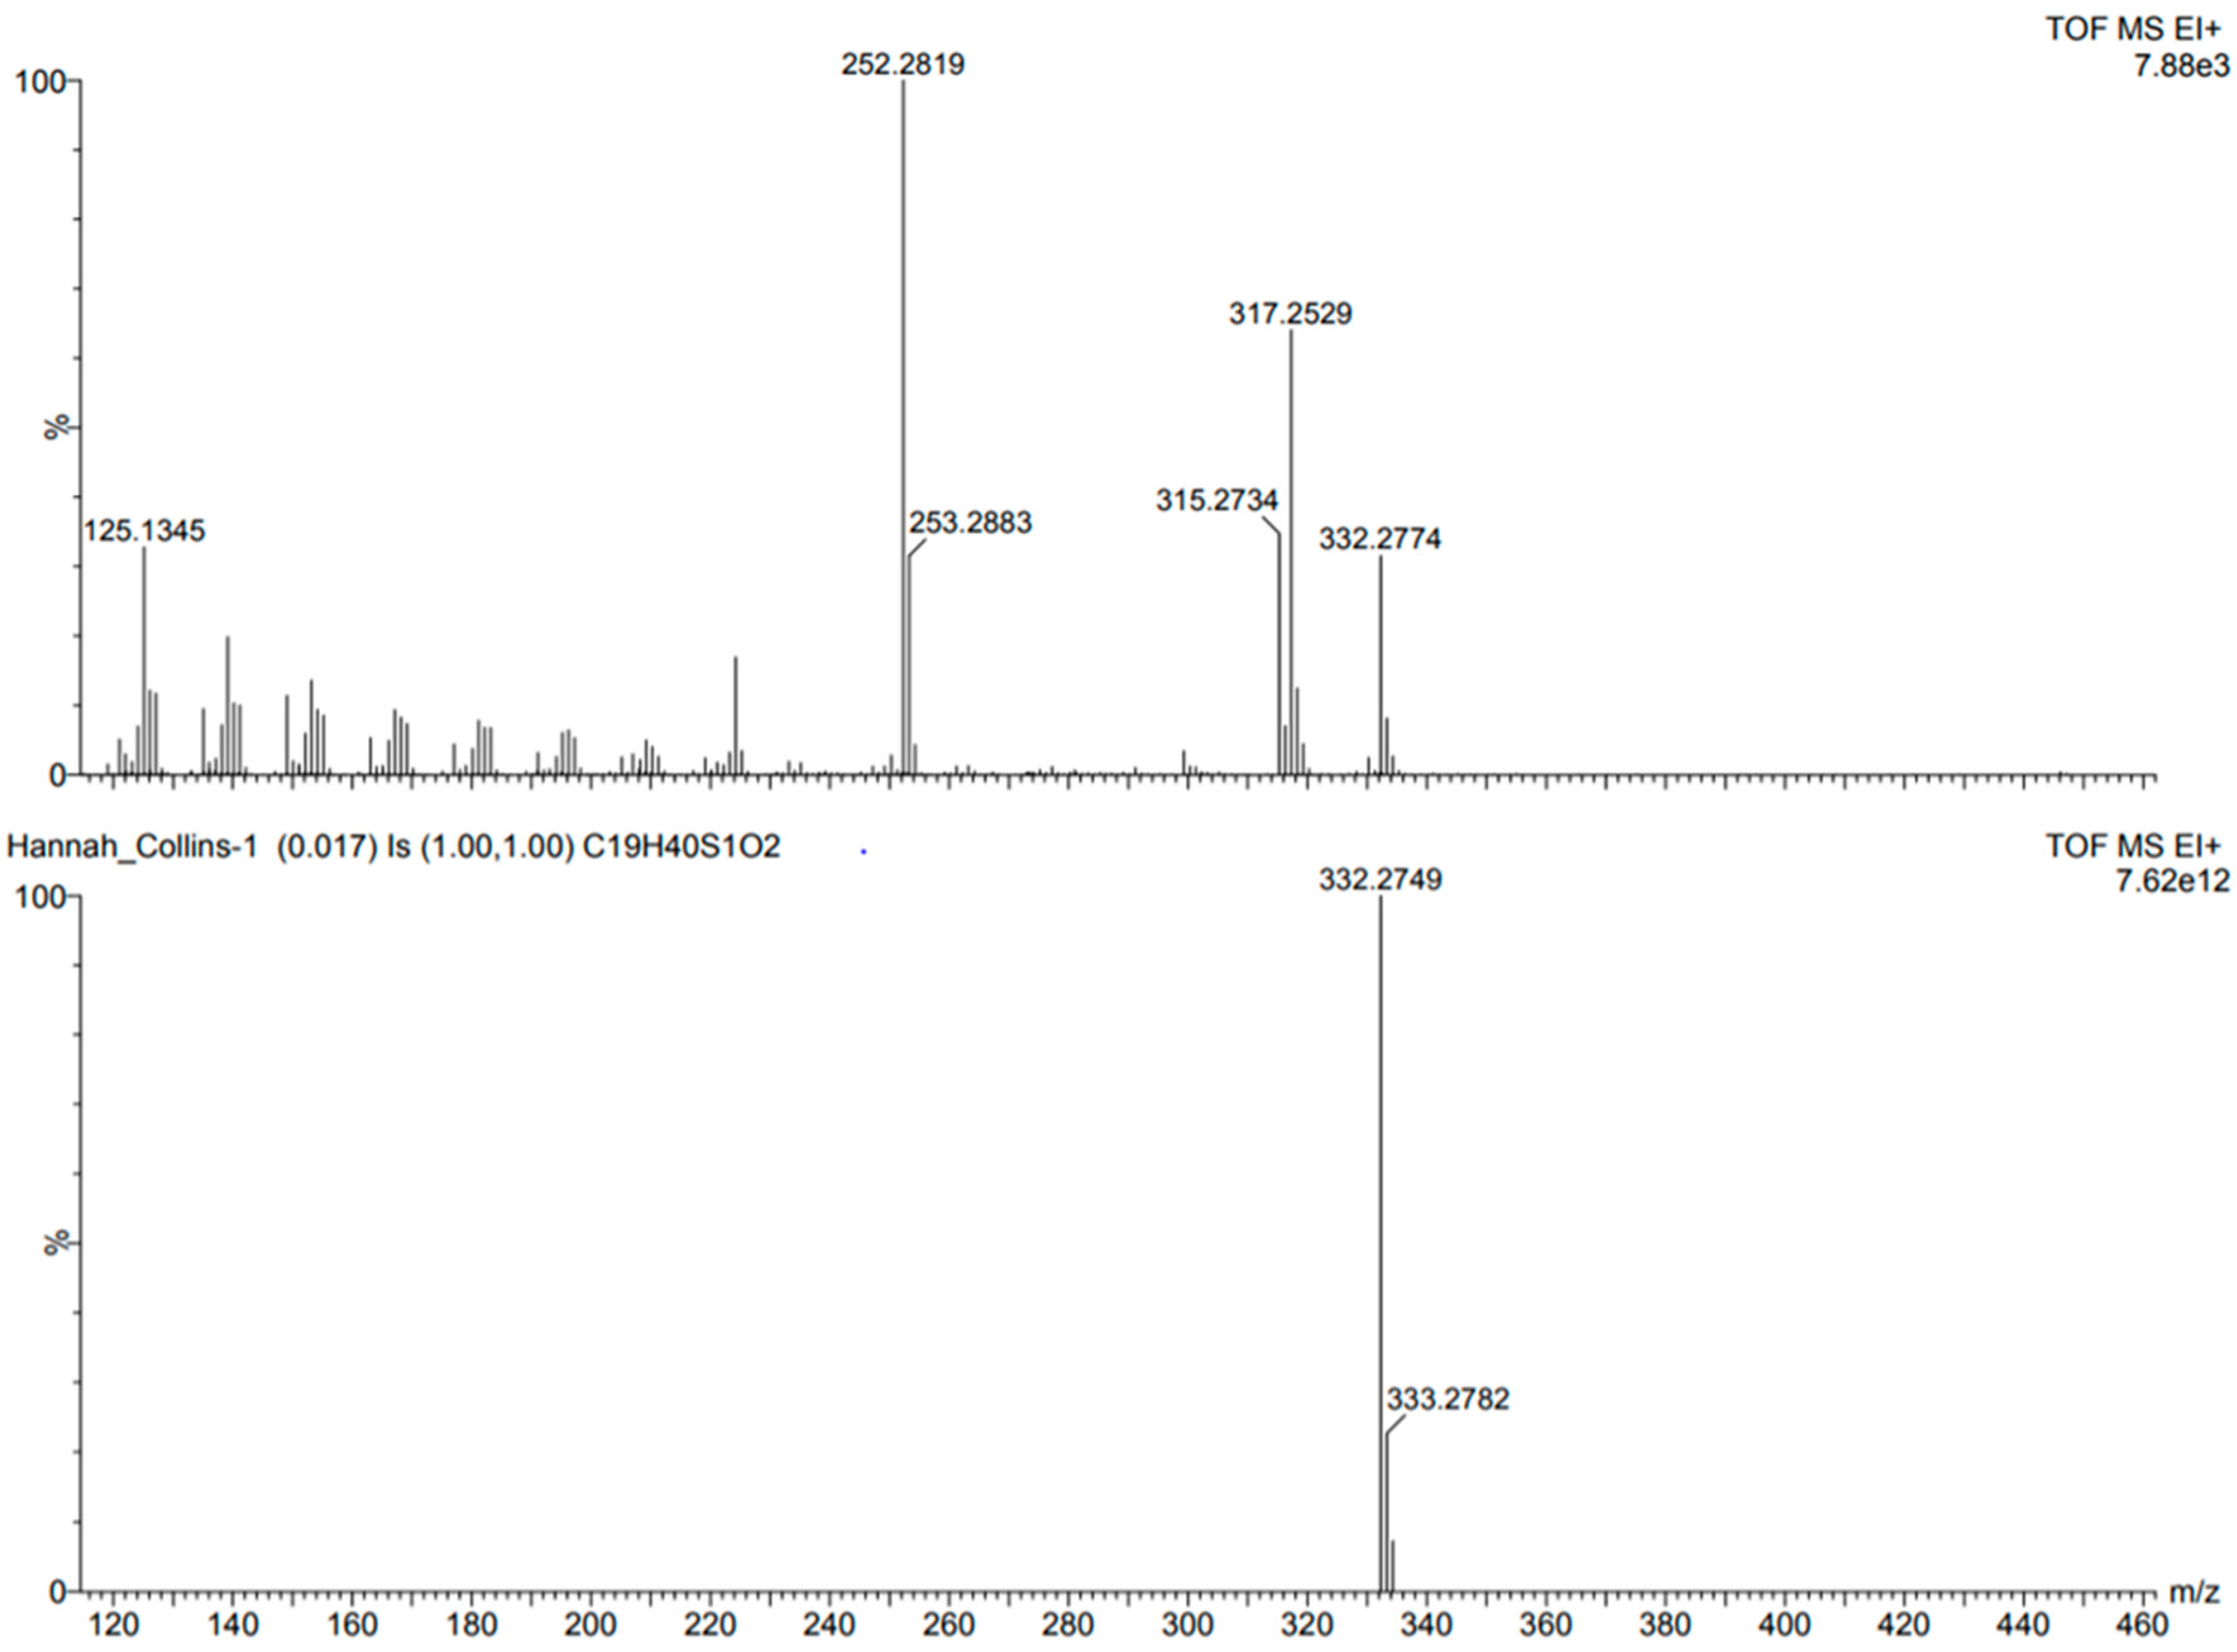
5.3. Mass Spectrometry
5.4. Thermal Characterization
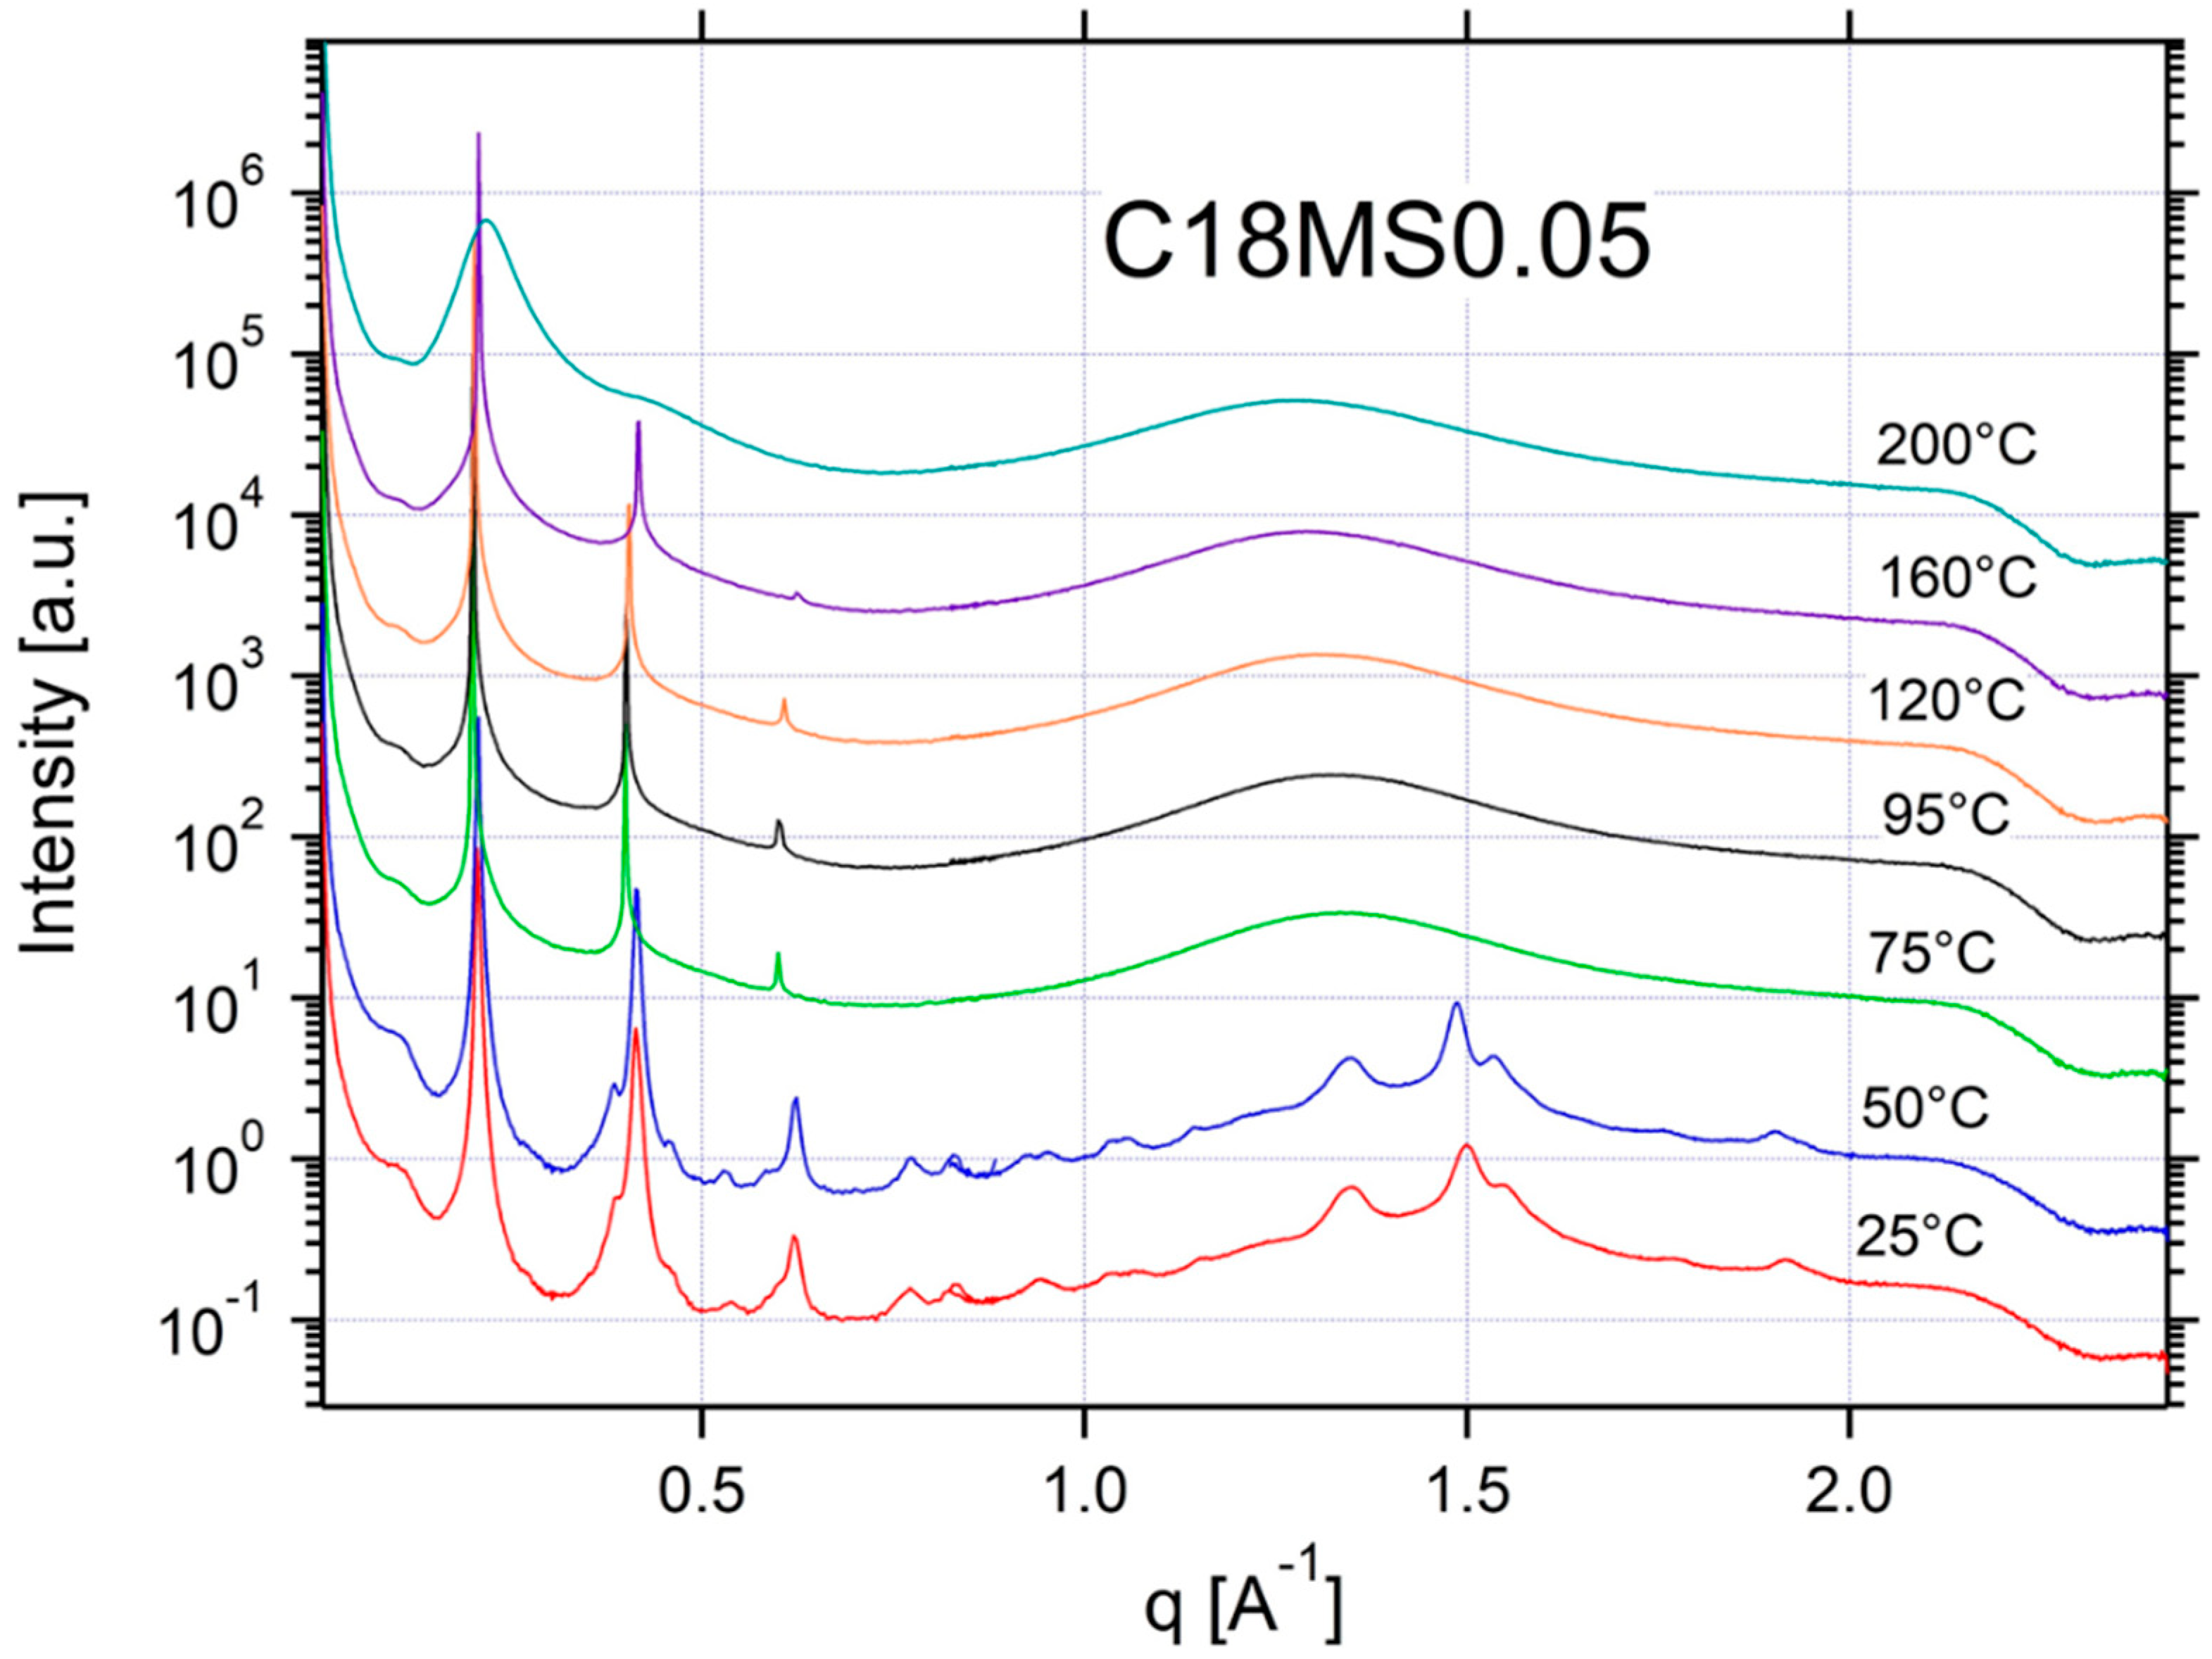
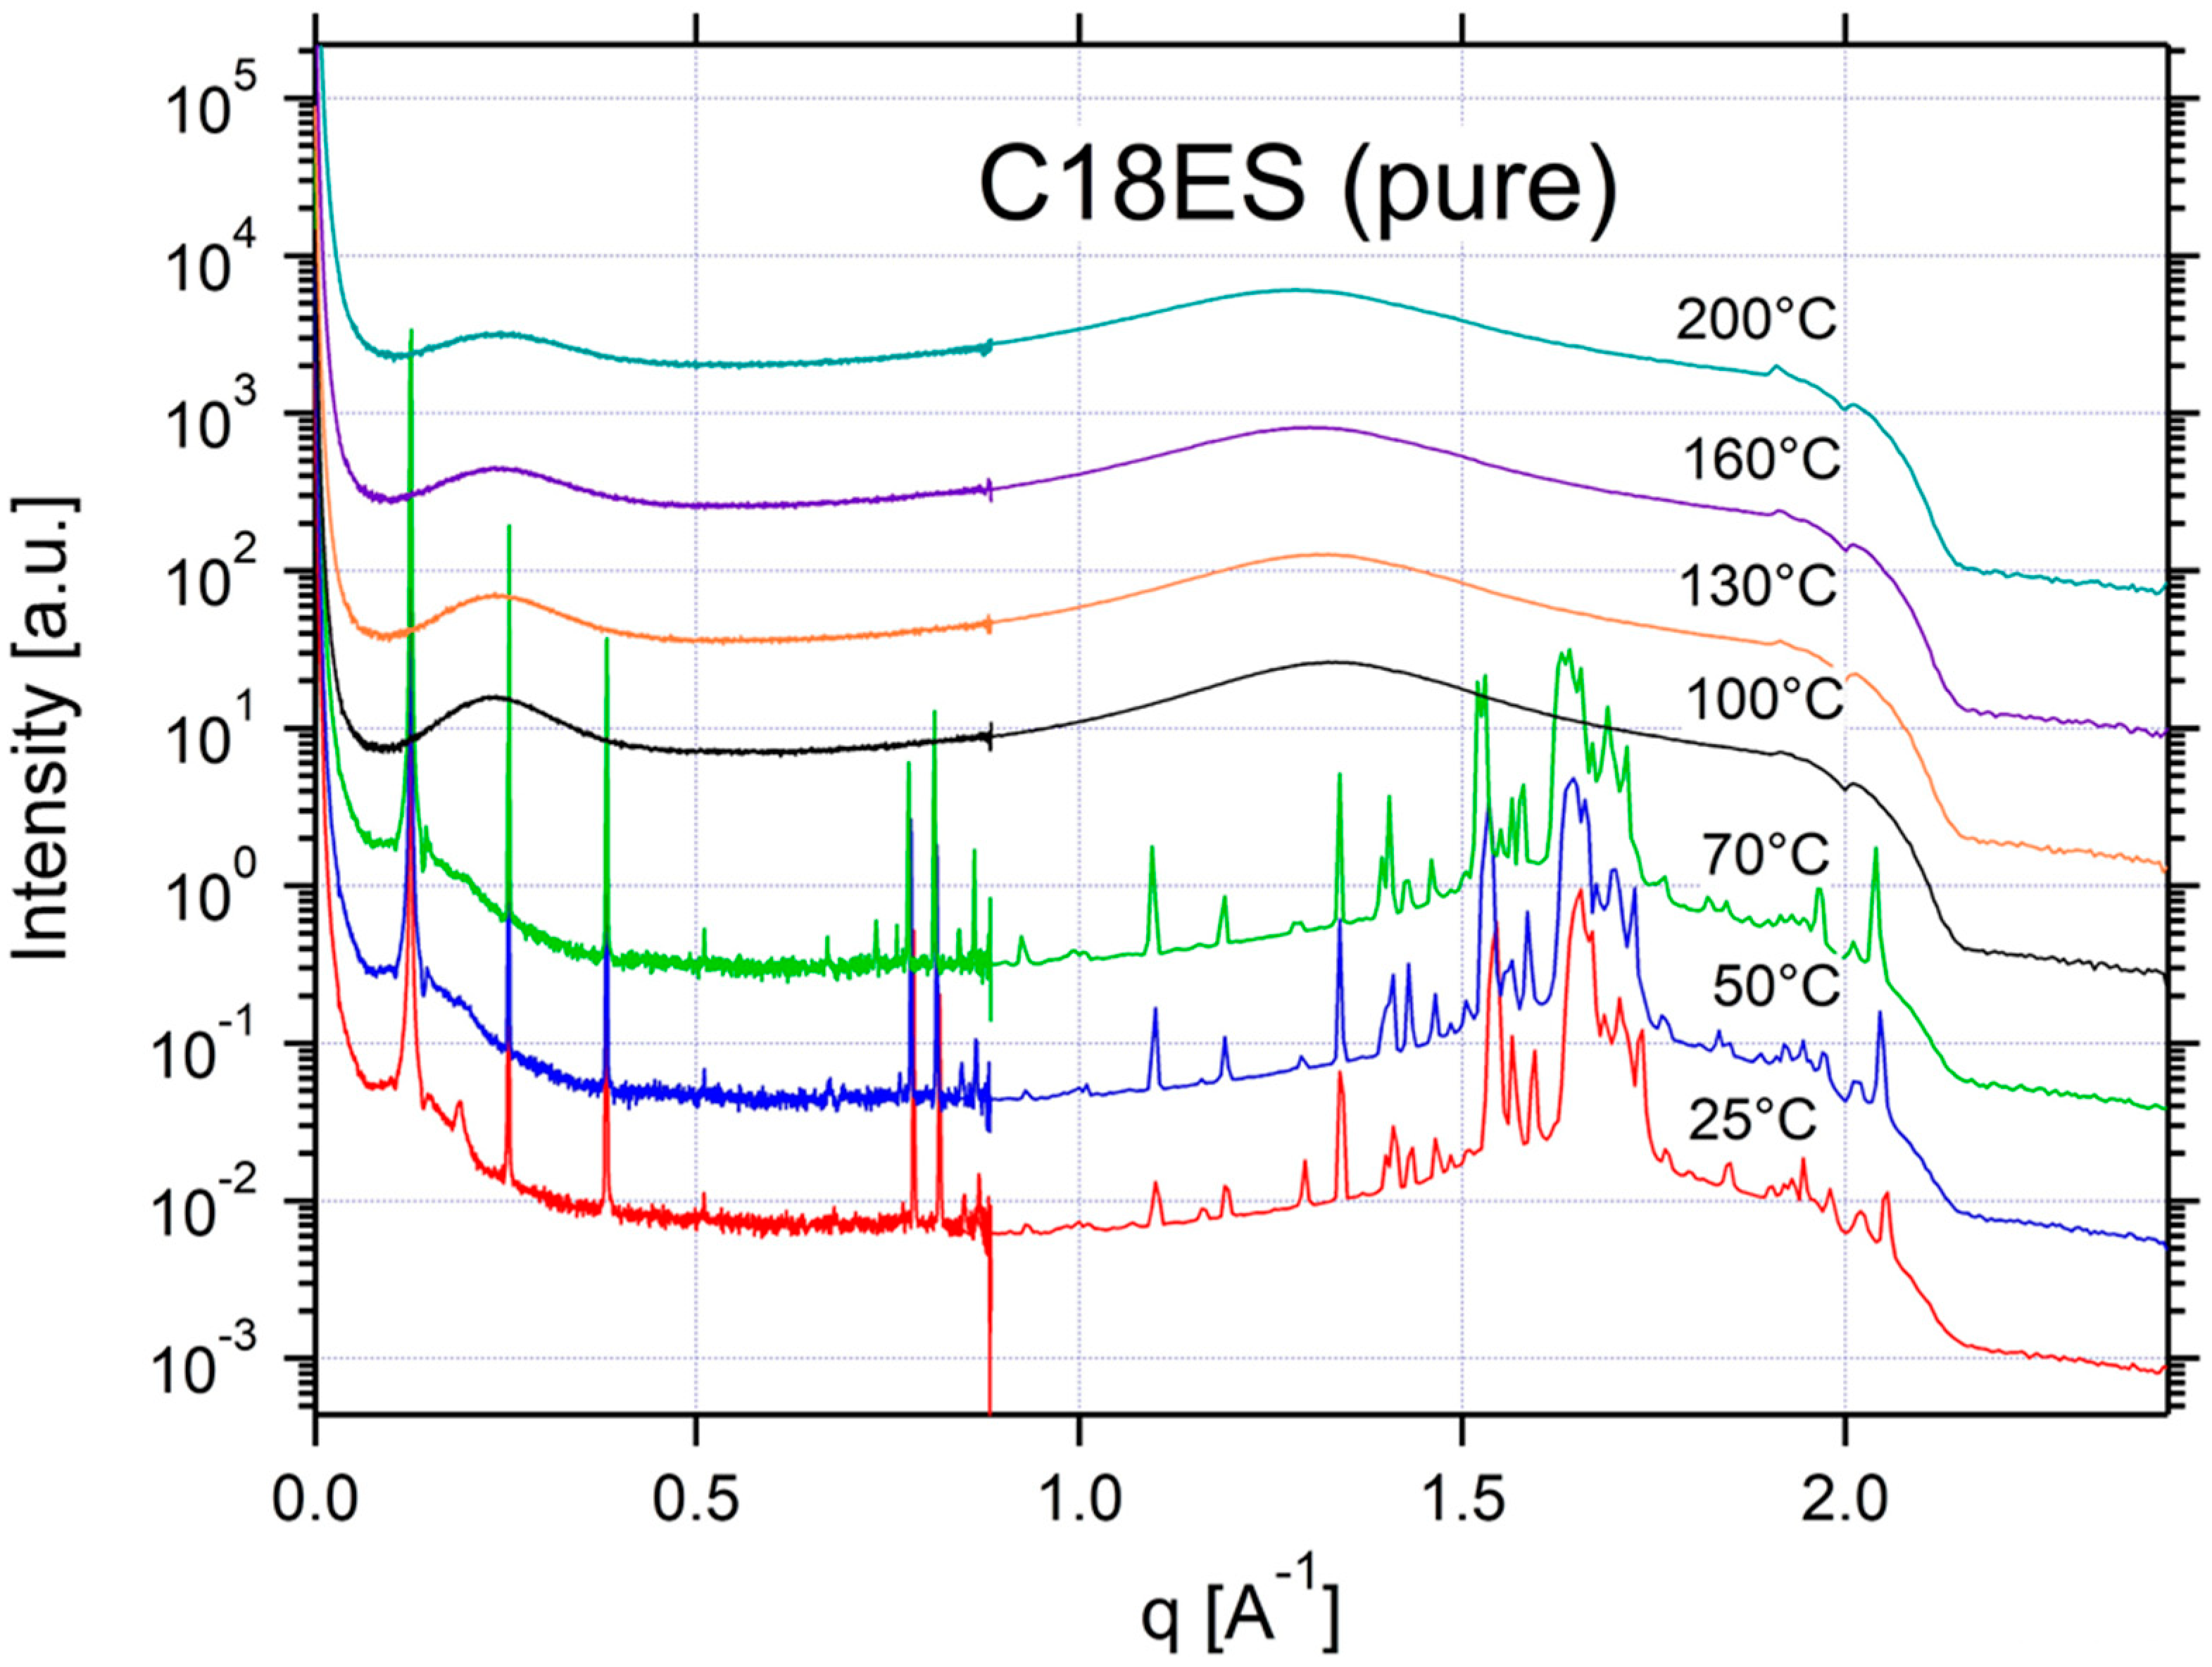
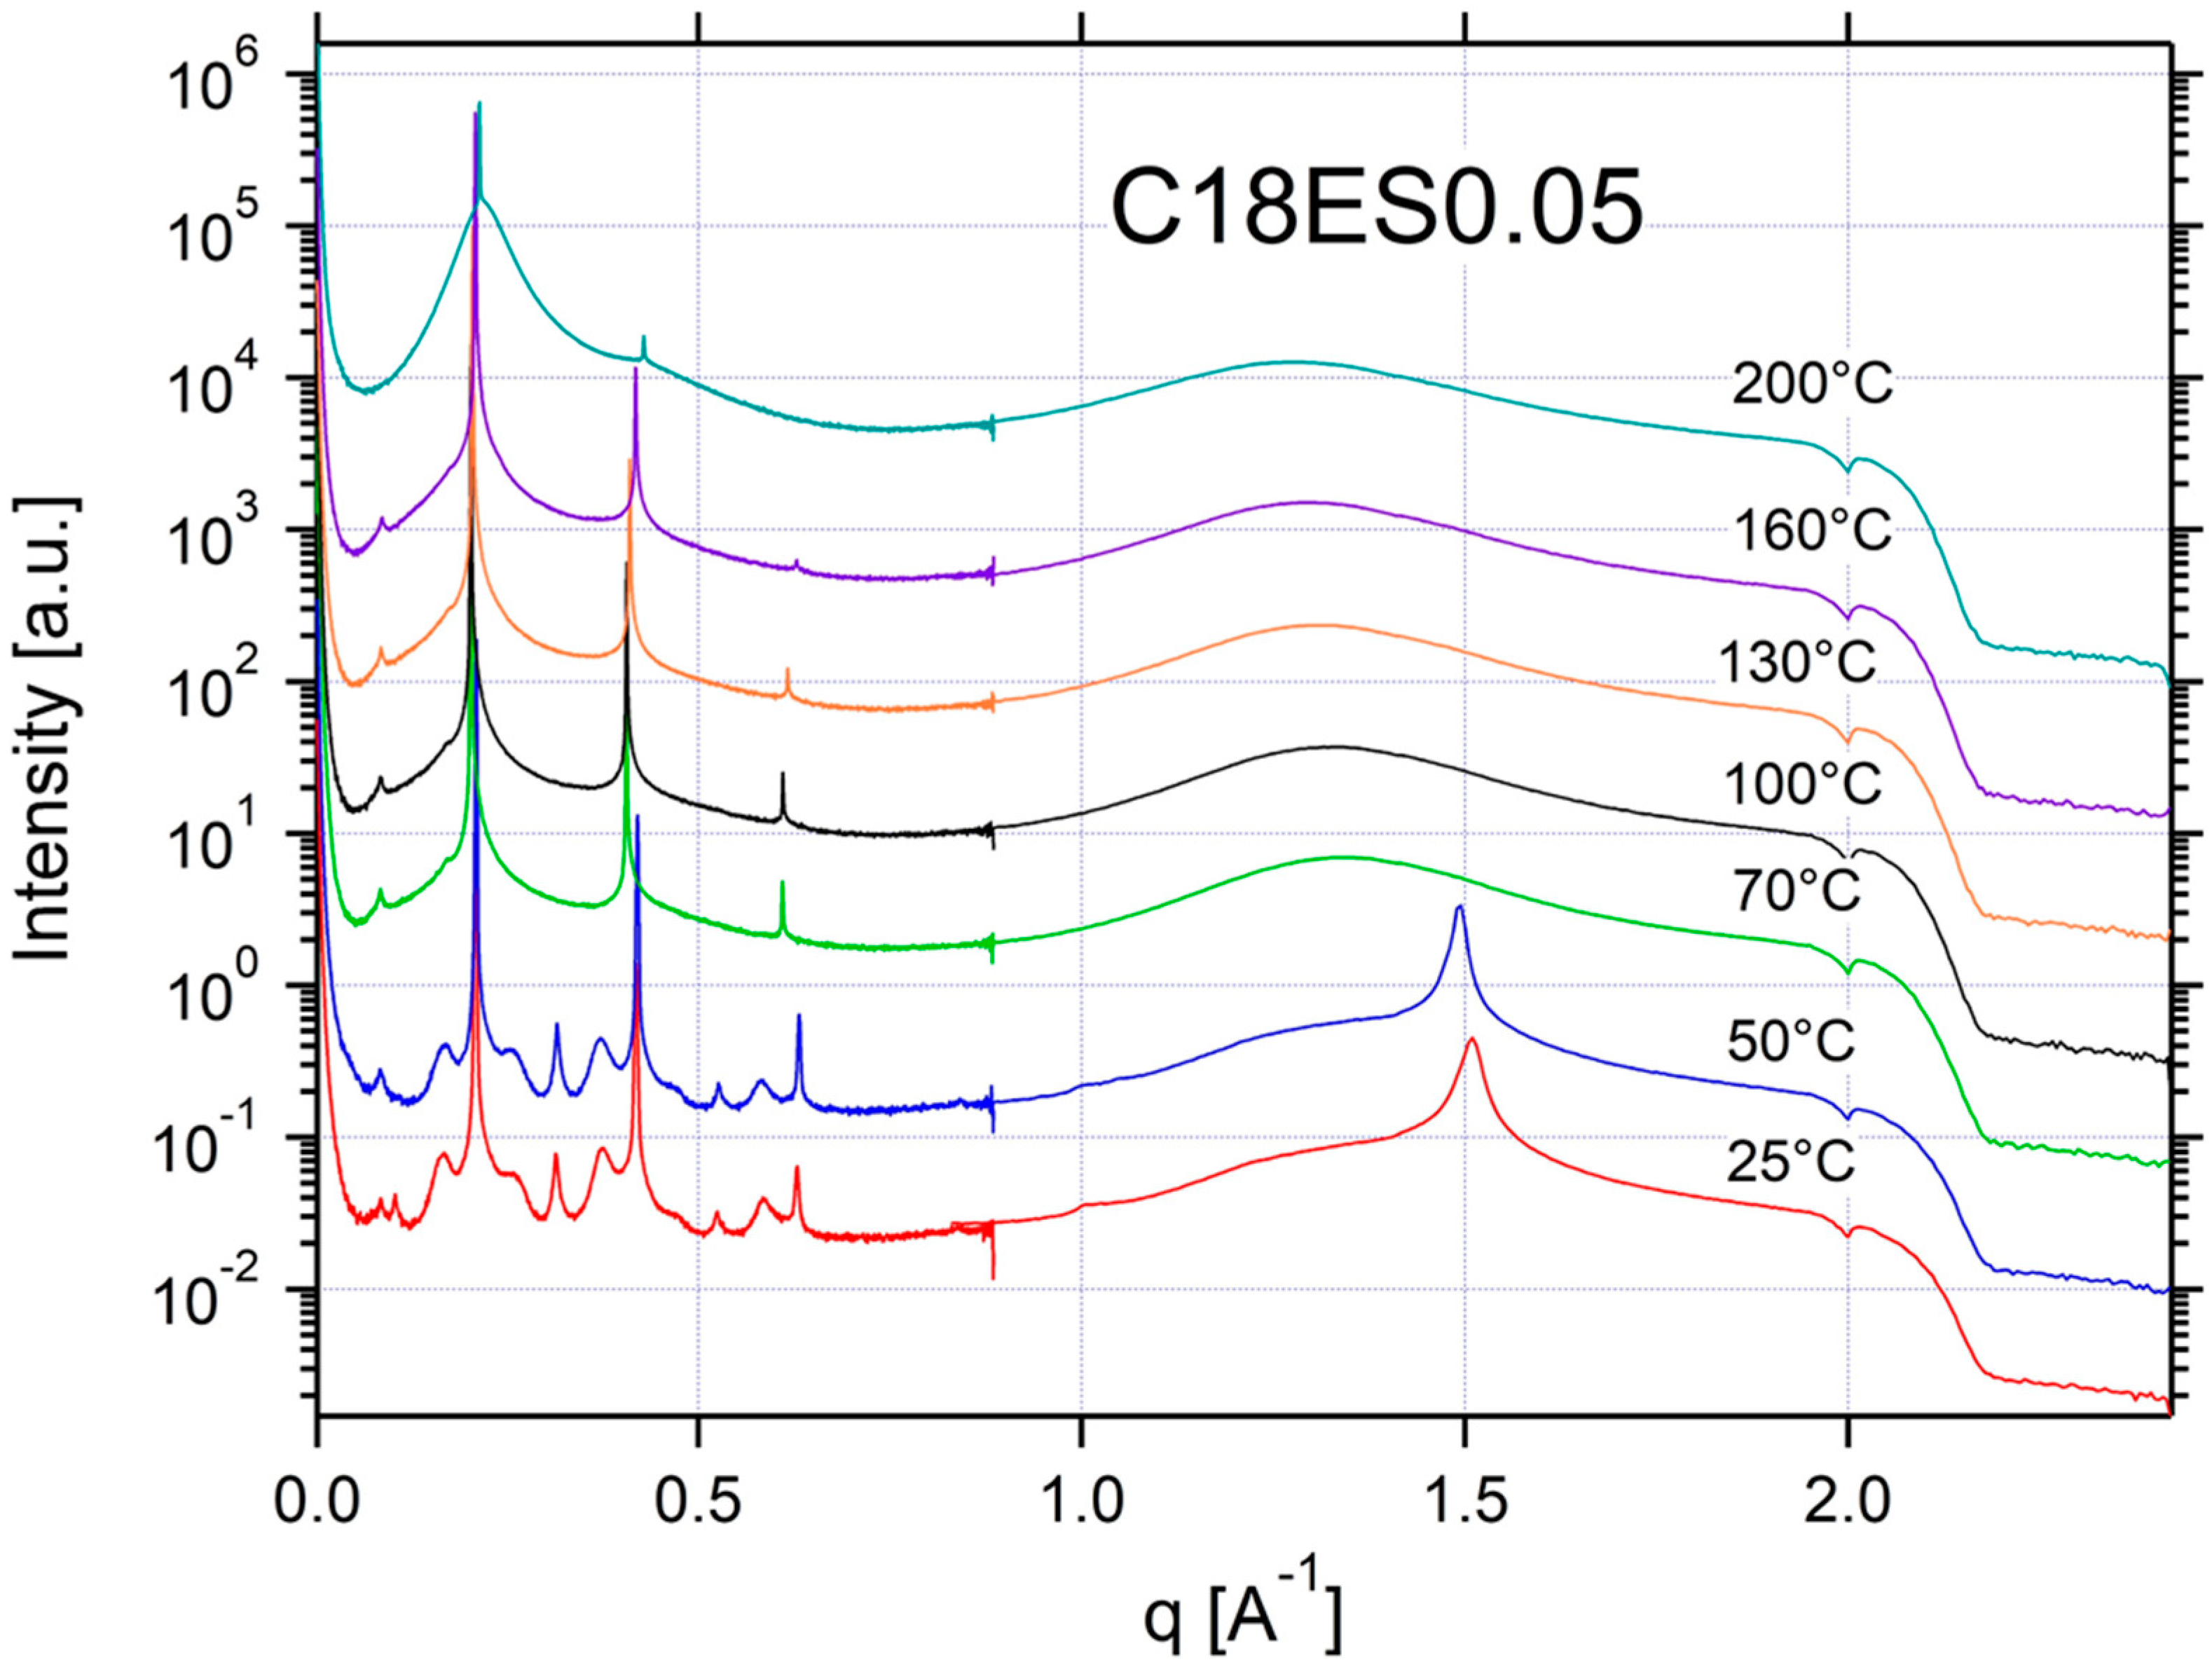
5.5. Scattering Measurements
5.6. Dielectric Spectroscopy
Author Contributions
Funding
Institutional Review Board Statement
Informed Consent Statement
Data Availability Statement
Acknowledgments
Conflicts of Interest
Appendix A
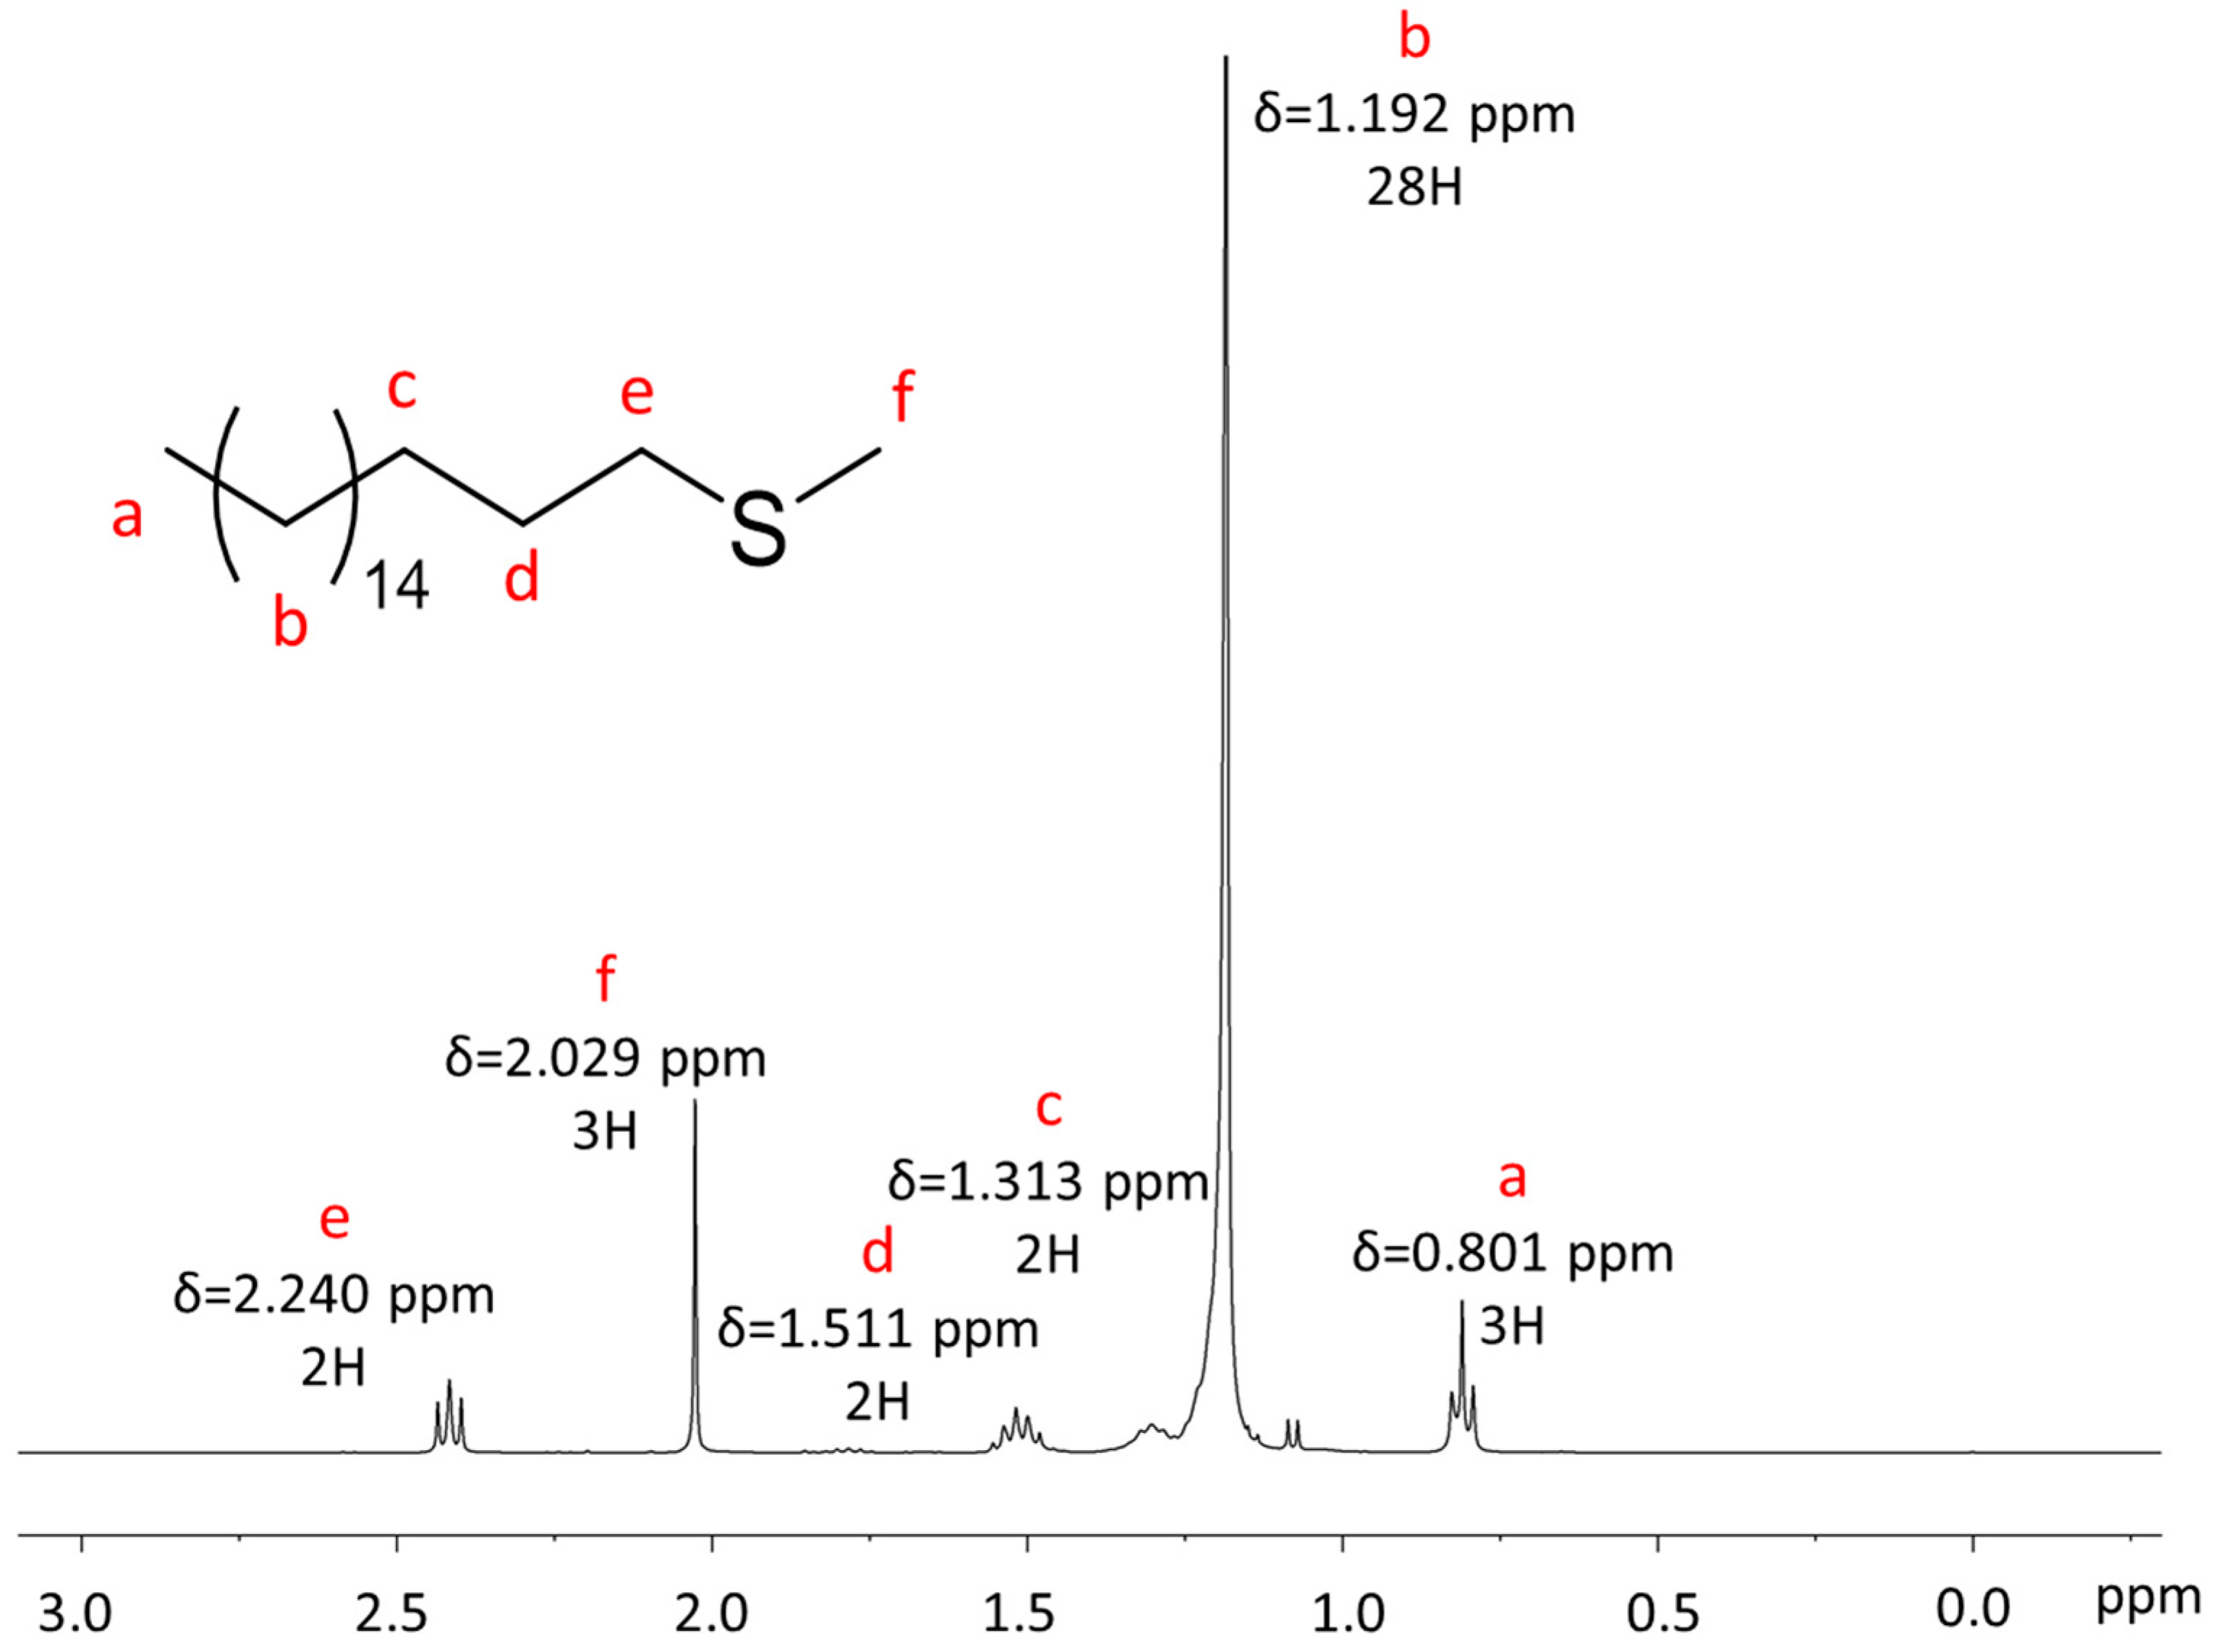
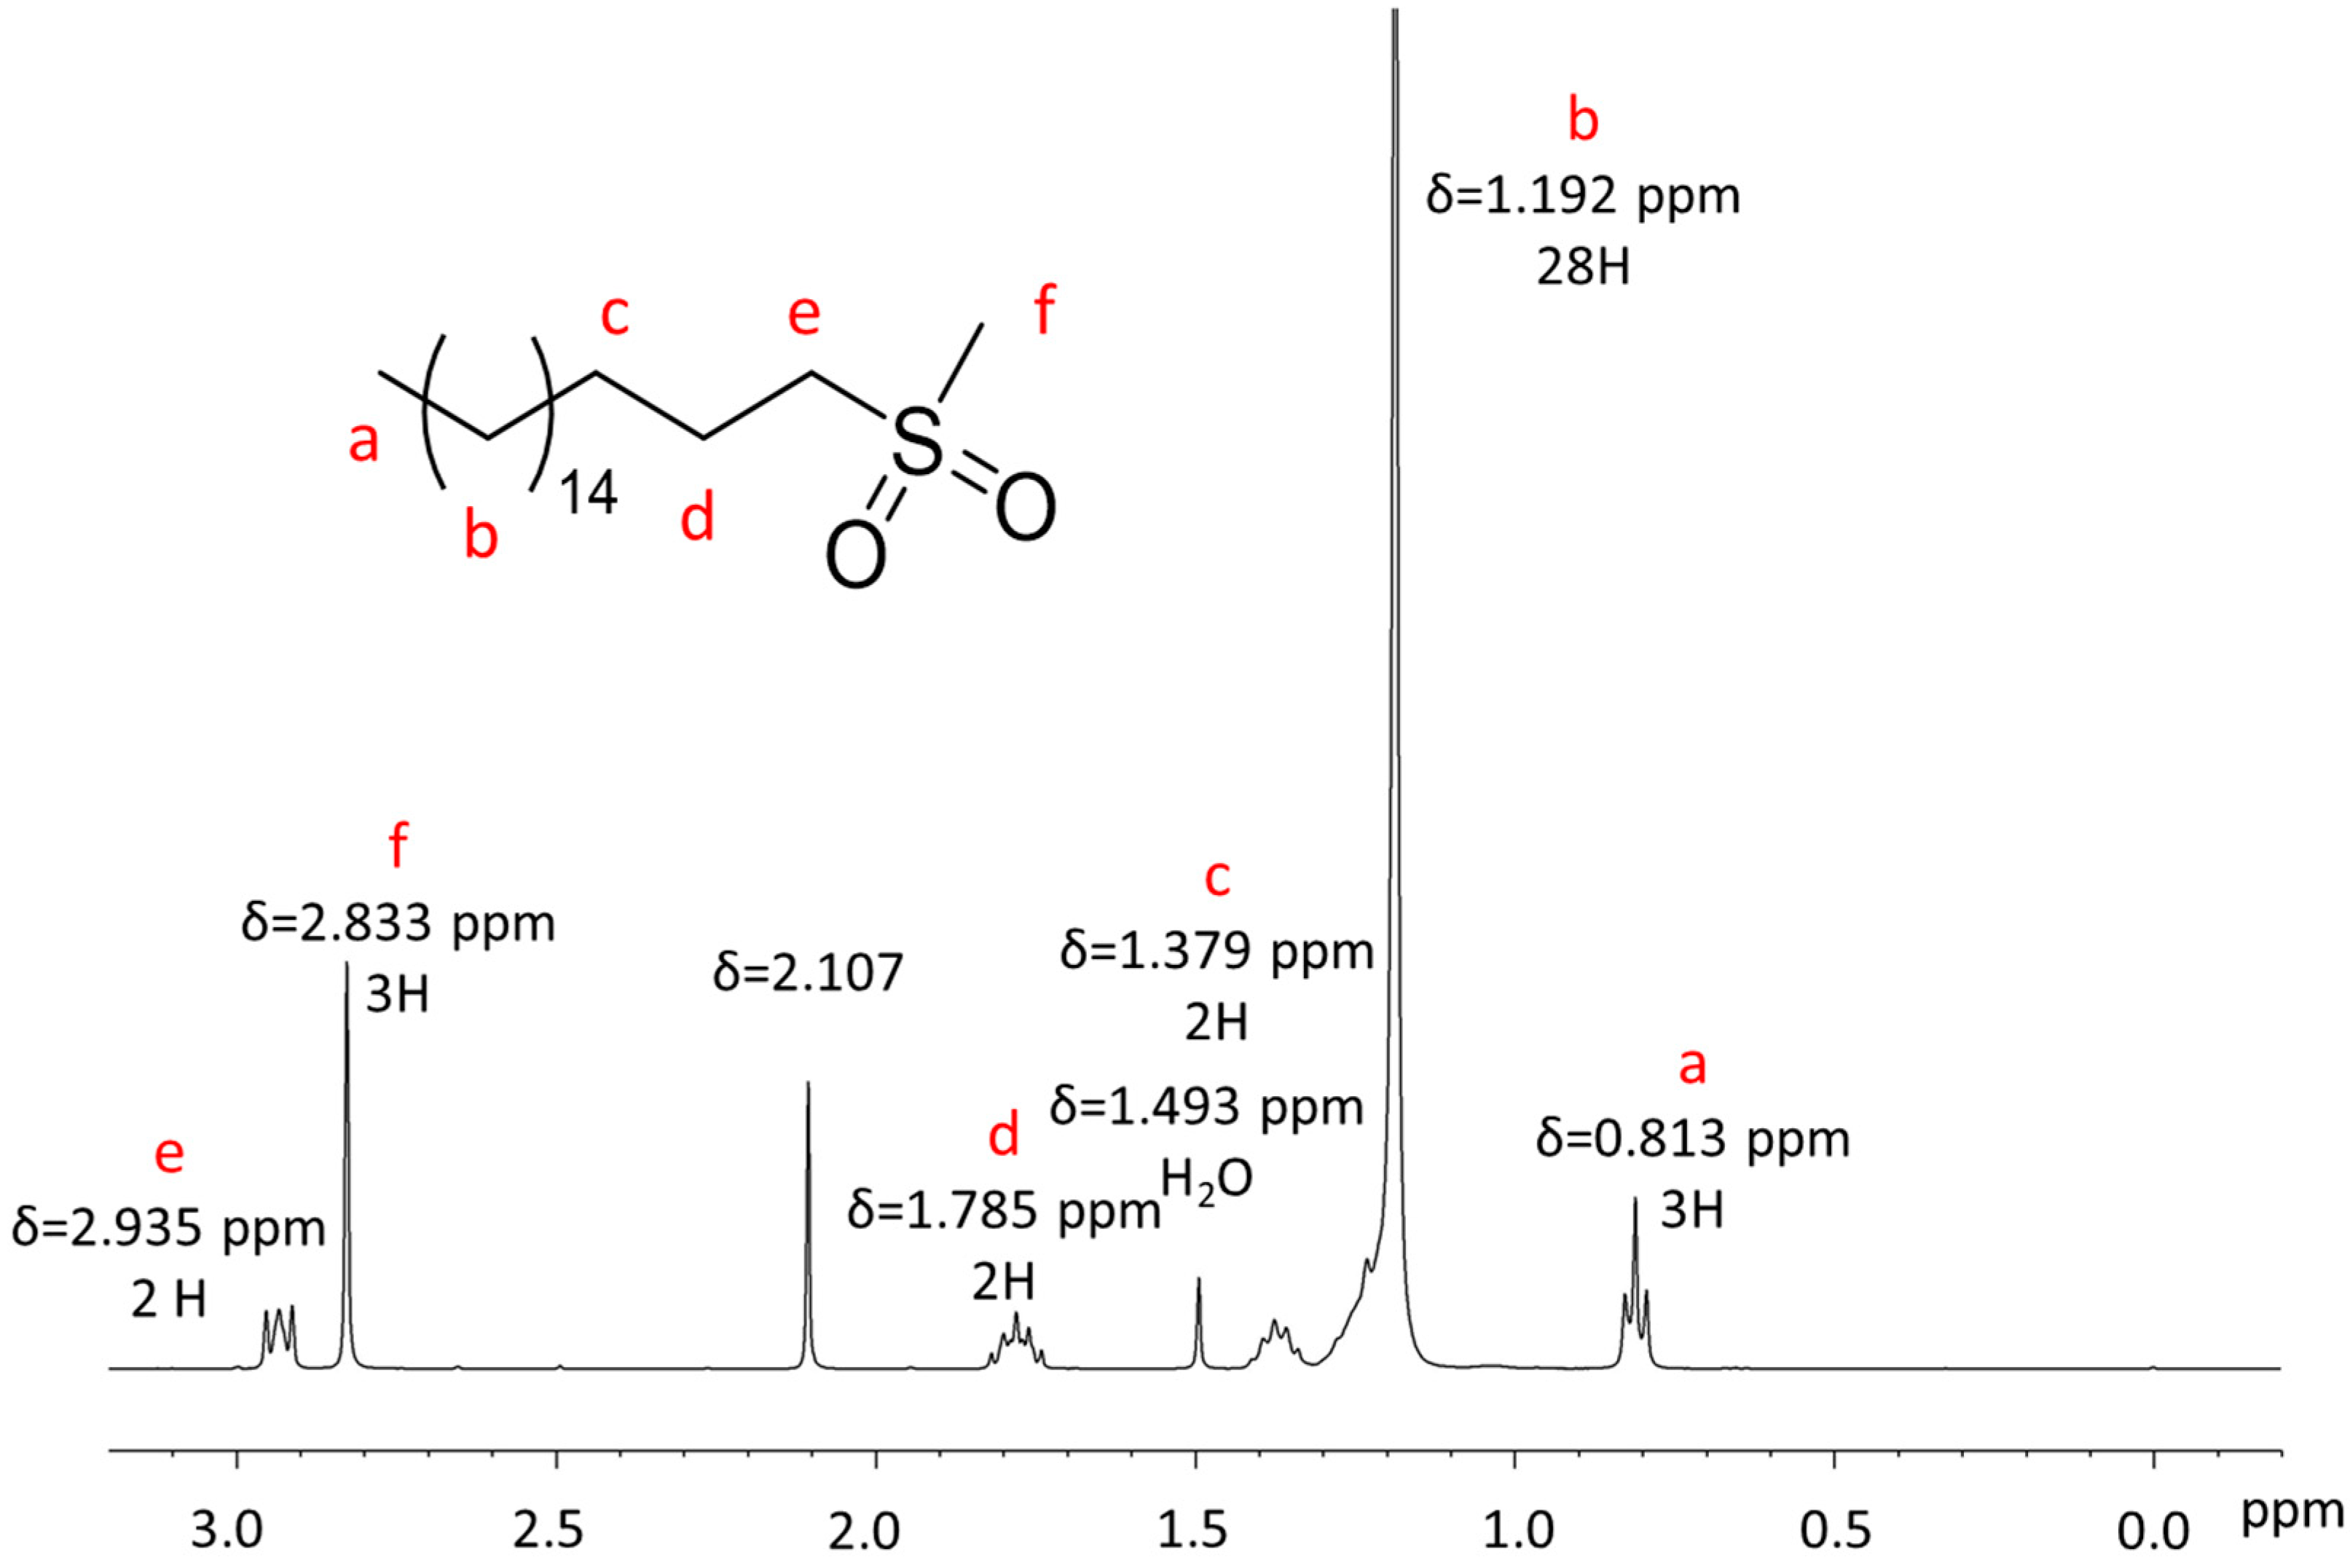
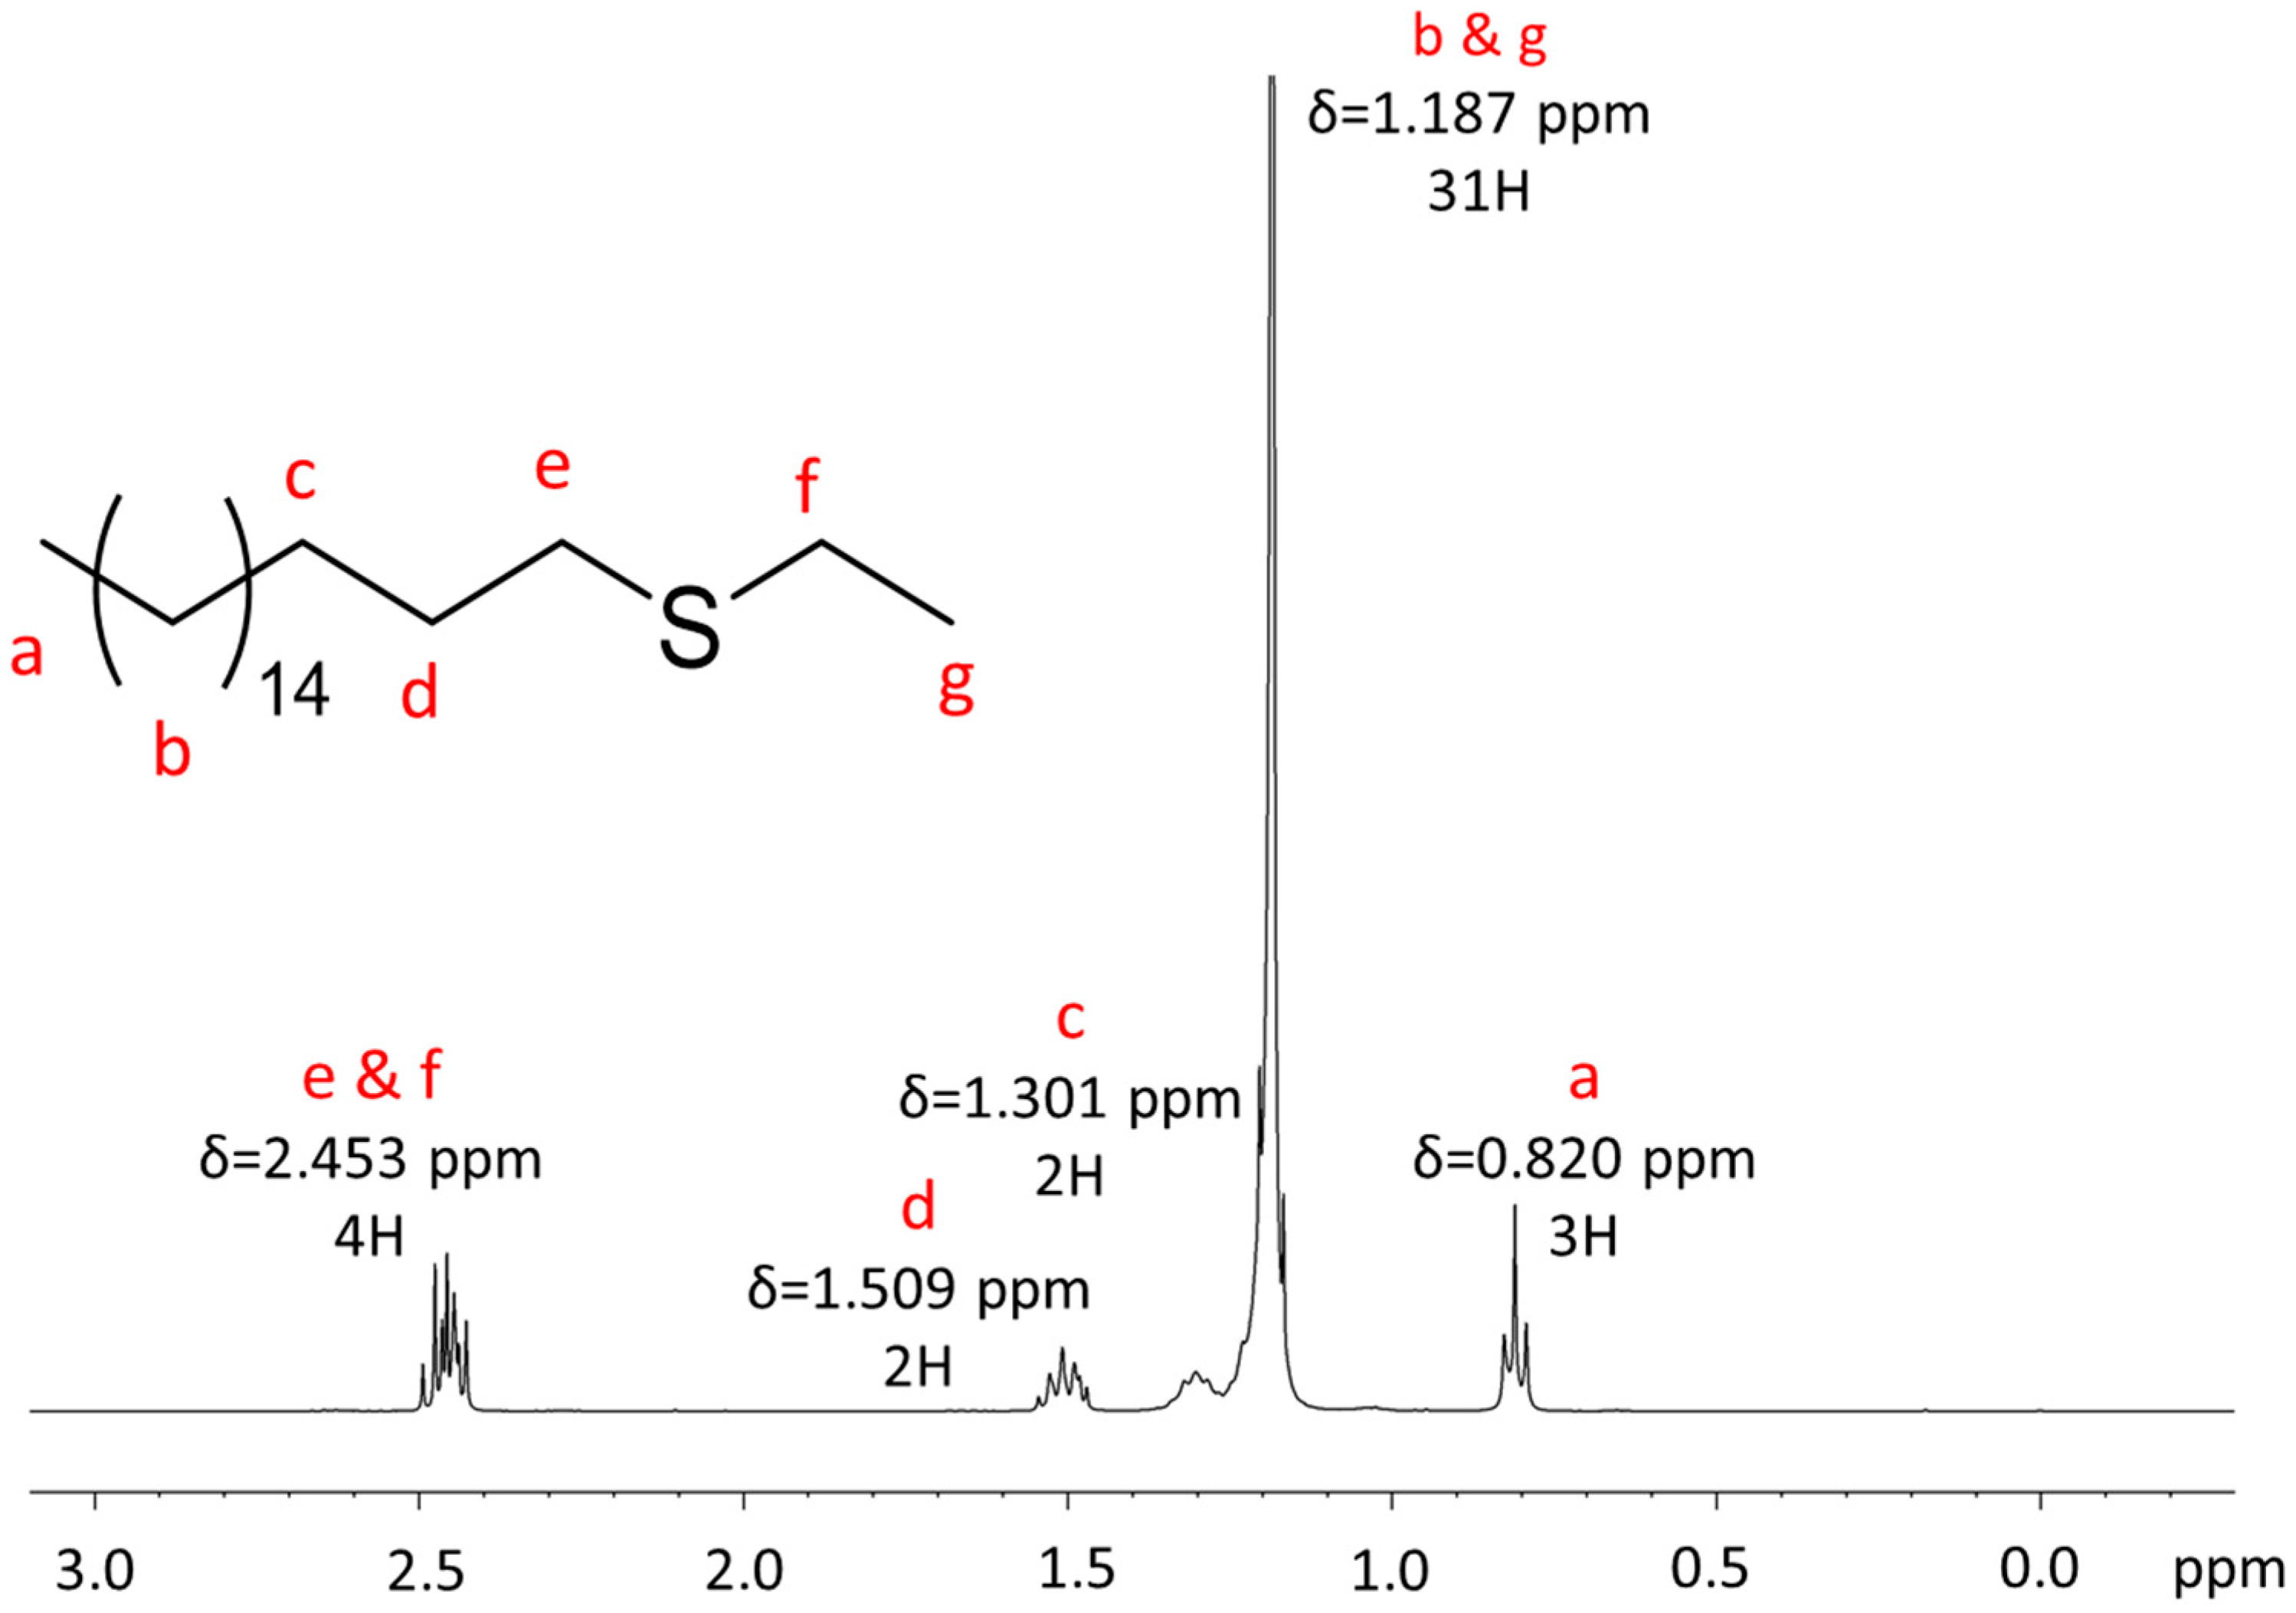
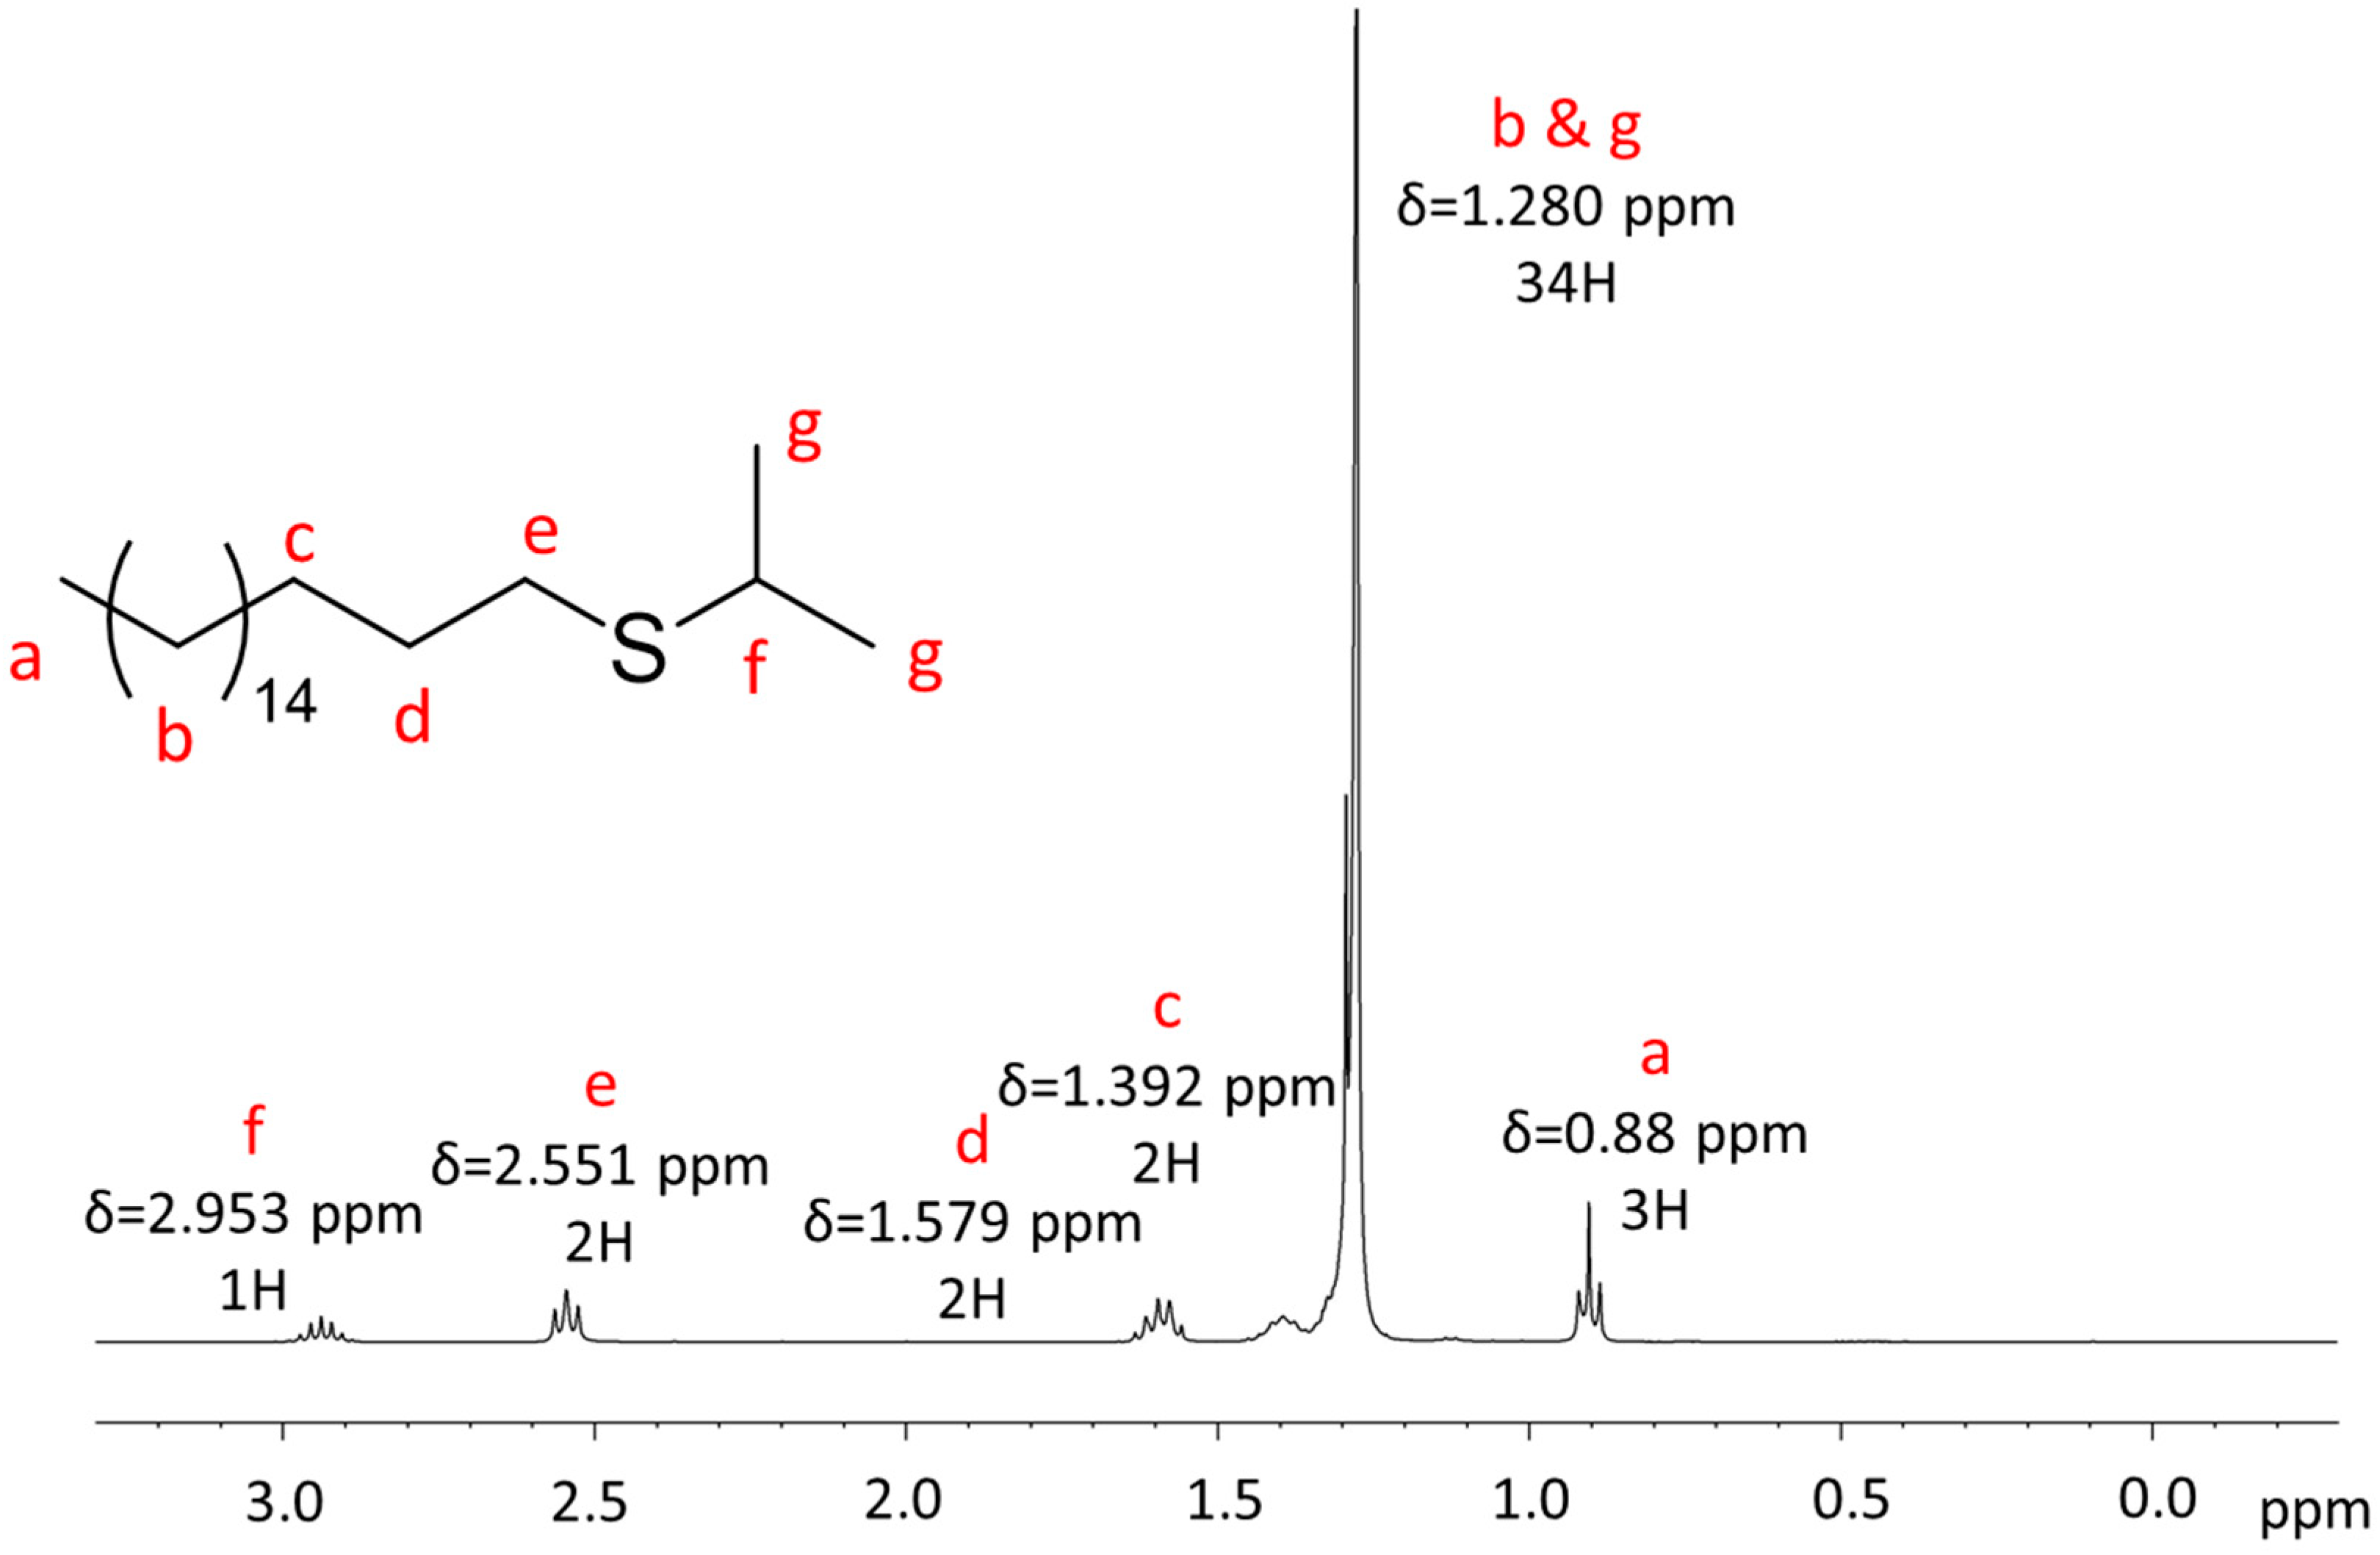
Appendix A.1. NMR Characterization


Appendix A.2. Mass Spectrometry Characterization

Appendix A.3. Additional SAXS/WAXS Characterization


References
- Tarascon, J.M. Key Challenges in future Li-battery research. Philos. Trans. R. Soc. 2010, 358, 3227–3241. [Google Scholar] [CrossRef] [PubMed] [Green Version]
- Goodenough, J.B.; Kim, Y. Challenges for Rechargeable Li Batteries. Chem. Mater. 2010, 22, 587–603. [Google Scholar] [CrossRef]
- Bates, A.M.; Preger, Y.; Torres-Castro, L.; Harrison, K.L.; Harris, S.J.; Hewson, J. Are solid-state batteries safer than lithium-ion batteries? Joule 2022, 6, 742–755. [Google Scholar] [CrossRef]
- Chen, J.; Xiong, J.; Ji, S.; Huo, Y.; Zhao, J.; Liang, L. All Solid Polymer Electrolytes for Lithium Batteries. Prog. Chem. 2020, 32, 481–496. [Google Scholar] [CrossRef]
- Tang, S.; Guo, W.; Fu, Y. Advances in Composite Polymer Electrolytes for Lithium Batteries and Beyond. Adv. Energy Mater. 2020, 11, 2000802. [Google Scholar] [CrossRef]
- Sheng, O.; Jin, C.; Ding, X.; Liu, T.; Wan, Y.; Liu, Y.; Nai, J.; Wang, Y.; Liu, C.; Tao, X. A Decade of Progress on Solid-State Electrolytes for Secondary Batteries: Advances and Contributions. Adv. Funct. Mater. 2021, 31, 2100891. [Google Scholar] [CrossRef]
- Chen, J.; Wu, J.; Wang, X.; Zhou, A.; Yang, Z. Research progress and application prospect of solid-state electrolytes in commercial lithium-ion power batteries. Energy Storage Mater. 2021, 35, 70–87. [Google Scholar] [CrossRef]
- Thangadurai, V.; Narayanan, S.; Pinzaru, D. Garnet-Type Solid-State Fast Li Ion Conductors for Li Batteries: Critical Review. Chem. Soc. Rev. 2014, 43, 4714–4727. [Google Scholar] [CrossRef]
- Niu, H.; Wang, L.; Guan, P.; Zhang, N.; Yan, C.; Ding, M.; Guo, X.; Huang, T.; Hu, X. Recent Advances in Application of Ionic Liquids in Electrolyte of Lithium Ion Batteries. J. Energy Storage 2021, 40, 102659. [Google Scholar] [CrossRef]
- Binnemans, K. Ionic Liquid Crystals. Chem. Rev. 2005, 105, 4148–4204. [Google Scholar] [CrossRef]
- Sakuda, J.; Hosono, E.; Yoshio, M.; Ichikawa, T.; Matsumoto, T.; Ohno, H.; Zhou, H.; Kato, T. Liquid-Crystalline Electrolytes for Lithium-Ion Batteries: Ordered Assemblies of a Mesogen-Containing Carbonate and a Lithium Salt. Adv. Funct. Mater. 2015, 25, 1206–1212. [Google Scholar] [CrossRef]
- Lee, J.H.; Han, K.S.; Lee, J.S.; Lee, A.S.; Park, S.K.; Hong, S.Y.; Lee, J.; Mueller, K.T.; Hong, S.M.; Koo, C.M. Facilitated Ion Transport in Smectic Ordered Ionic Liquid Crystals. Adv. Mater. 2016, 28, 9301–9307. [Google Scholar] [CrossRef] [PubMed]
- Fergus, J.W. Ceramic and polymeric solid electrolytes for lithium-ion batteries. J. Power Sources 2010, 195, 4554–4569. [Google Scholar] [CrossRef]
- Kato, T. Self-Assembly of Phase-Segregated Liquid Crystal Structures. Science 2002, 295, 2414–2418. [Google Scholar] [CrossRef]
- Abbott, L.J.; Buss, H.G.; Thelen, J.L.; McCloskey, B.D.; Lawson, J.W. Polyanion Electrolytes with Well-Ordered Ionic Layers in Simulations and Experiment. Macromolecules 2019, 52, 5518–5528. [Google Scholar] [CrossRef]
- Yoshizawa, M.; Mukai, T.; Ohtake, T.; Kanie, K.; Kato, T.; Ohno, H. Ion-conductive mechanism in liquid crystalline molecules having polyether segment. Solid State Ion. 2002, 154–155, 779–787. [Google Scholar] [CrossRef]
- Kerr, R.L.; Miller, S.A.; Shoemaker, R.K.; Elliott, B.J.; Gin, D.L. New Type of Li Ion Conductor with 3D Interconnected Nanopores via Polymerization of a Liquid Organic Electrolyte-Filled Lyotropic Liquid-Crystal Assembly. J. Am. Chem. Soc. 2009, 131, 15972–15973. [Google Scholar] [CrossRef]
- Soberats, B.; Yoshio, M.; Ichikawa, T.; Ohno, H.; Kato, T. Zwitterionic liquid crystals as 1D and 3D lithium-ion transport media. J. Mater. Chem. A 2015, 3, 11232–11238. [Google Scholar] [CrossRef] [Green Version]
- Zeeshan, A.; Zijian, H.; Venkatasubramanian, V. Design rules for liquid crystalline electrolytes for enabling dendrite-free lithium metal batteries. Proc. Natl. Acad. Sci. USA 2020, 117, 26672–26680. [Google Scholar]
- Gopalakrishnan, D.; Alkatie, S.; Cannon, A.; Rajendran, S.; Thangavel, N.K.; Bhagirath, N.; Ryan, E.M.; Arava, L.M.R. Anisotropic mass transport using ionic liquid crystalline electrolytes to suppress lithium dendrite growth. Sustain. Energy Fuels 2021, 5, 1488–1497. [Google Scholar] [CrossRef]
- Liu, J.; Upadhyay, S.; Schaefer, J. Improved conductivity of single-component, ion-condensed smectic liquid crystalline electrolytes. ChemRxiv 2022. [Google Scholar] [CrossRef]
- Nowinski, J.L.; Lightfoot, P.; Bruce, P.G. Structure of LiN(CF3SO2)2, a novel salt for electrochemistry. J. Mater. Chem. 1994, 4, 1579–1580. [Google Scholar] [CrossRef]
- Henderson, W.A.; Seo, D.M.; Zhou, Q.; Boyle, P.D.; Shin, J.; de Long, H.C.; Trulove, P.C.; Passerini, S. An Alternative Ionic Conductivity Mechanism for Plastic Crystalline Salt–Lithium Salt Electrolyte Mixtures. Adv. Energy Mater. 2012, 2, 1343–1350. [Google Scholar] [CrossRef]
- Goossens, K.; Lava, K.; Bielawski, C.W.; Binnemans, K. Ionic Liquid Crystals: Versatile Materials. Chem. Rev. 2016, 116, 4643–4807. [Google Scholar] [CrossRef] [PubMed]
- Luo, S.-C.; Sun, S.; Deorukhkar, A.R.; Lu, J.-T.; Bhattacharyya, A.; Lin, I.J.B. Ionic liquids and ionic liquid crystals of vinyl functionalized imidazolium salts. J. Mater. Chem. 2011, 21, 1866–1873. [Google Scholar] [CrossRef]
- Gleeson, H.F.; Hirst, L.S. Resonant X-ray Scattering: A Tool for Structure Elucidation in Liquid Crystals. ChemPhysChem 2006, 7, 321–328. [Google Scholar] [CrossRef]
- Kitphaitun, S.; Takeshita, H.; Nomura, K. Analysis of Ethylene Copolymers with Long-Chain α-Olefins (1-Dodecene, 1-Tetradecene, 1-Hexadecene): A Transition between Main Chain Crystallization and Side Chain Crystallization. ACS Omega 2022, 7, 6900–6910. [Google Scholar] [CrossRef]
- Yan, L.; Häußler, M.; Bauer, J.; Mecking, S.; Winey, K.I. Monodisperse and Telechelic Polyethylenes form Extended Chain Crystals with Ionic Layers. Macromolecules 2019, 52, 4949–4956. [Google Scholar] [CrossRef]
- Trigg, E.B.; Gaines, T.W.; Maréchal, M.; Moed, D.E.; Rannou, P.; Wagener, K.B.; Stevens, M.J.; Winey, K.I. Self-assembled highly ordered acid layers in precisely sulfonated polyethylene produce efficient proton transport. Nat. Mater. 2018, 17, 725–731. [Google Scholar] [CrossRef]
- Gillard Timothy, M.; Sangwoo, L.; Bates Frank, S. Dodecagonal quasicrystalline order in a diblock copolymer melt. Proc. Natl. Acad. Sci. USA 2016, 113, 5167–5172. [Google Scholar] [CrossRef] [Green Version]
- Aziz, S.B.; Woo, T.J.; Kadir, M.F.Z.; Ahmed, H.M. A conceptual review on polymer electrolytes and ion transport models. J. Sci. Adv. Mater. Devices 2018, 3, 1–17. [Google Scholar] [CrossRef]
- Aziz, S.B. Role of Dielectric Constant on Ion Transport: Reformulated Arrhenius Equation. Adv. Mater. Sci. Eng. 2016, 2016, 2527013. [Google Scholar] [CrossRef] [Green Version]
- Paren, B.A.; Häußler, M.; Rathenow, P.; Mecking, S.; Winey, K.I. Decoupled Cation Transport within Layered Assemblies in Sulfonated and Crystalline Telechelic Polyethylenes. Macromolecules 2022, 55, 2813–2820. [Google Scholar] [CrossRef]


| Material | Tc (°C) | Isotropic to Smectic Transition (°C) | Material | Tc (°C) | Isotropic to Smectic Transition (°C) | Material | Tc (°C) | Isotropic to Smectic Transition (°C) |
|---|---|---|---|---|---|---|---|---|
| C18LiTFSI | 63 | 199 | C18LiTFSI | 63 | 199 | C18LiTFSI | 63 | 199 |
| C18MS0.05 | 64 | 188 | C18ES0.05 | 63 | 184 | C18IPS0.05 | 62 | 183 |
| C18MS0.1 | 64 | 170 | C18ES0.1 | 63 | 172 | C18IPS0.1 | 62 | 160 |
| C18MS0.2 | 64 | 153 | C18ES0.2 | 62 | 149 | C18IPS0.2 | 61 | 137 |
| C18MS0.3 | 64 | 139 | C18ES0.3 | 61 | 121 | C18IPS0.3 | 59 | 112 |
| C18MS0.5 | 63 | 117 | C18ES0.5 | 59 | 88 | C18IPS0.5 | 56 | 92 |
| C18MS1.0 | 61 | 93 | C18ES1.0 | 57 | — | C18IPS1.0 | 47 | 65 |
| C18MS | 76/79 | — | C18ES | 82 | — | C18IPS | 58/31 | — |
| Material | 200 °C | 160 °C | 120 °C | 95 °C | 75 °C | 50 °C | 25 °C | q (Å−1) (75 °C) | d = 2π/q (Å) |
|---|---|---|---|---|---|---|---|---|---|
| C18MS0.02 | ISO/SM | SM | SM | SM | SM | CRYSTAL | CRYSTAL | 0.2 | 31 |
| C18MS0.05 | ISO | SM | SM | SM | SM | CRYSTAL | CRYSTAL | 0.20 | 31 |
| C18MS0.1 | ISO | SM | SM | SM | SM | CRYSTAL | CRYSTAL | 0.20 | 31 |
| C18MS0.2 | ISO | ISO/SM | SM | SM | SM | CRYSTAL | CRYSTAL | 0.20 | 31 |
| C18MS0.3 | ISO | ISO | SM | SM | SM | CRYSTAL | CRYSTAL | 0.19 | 33 |
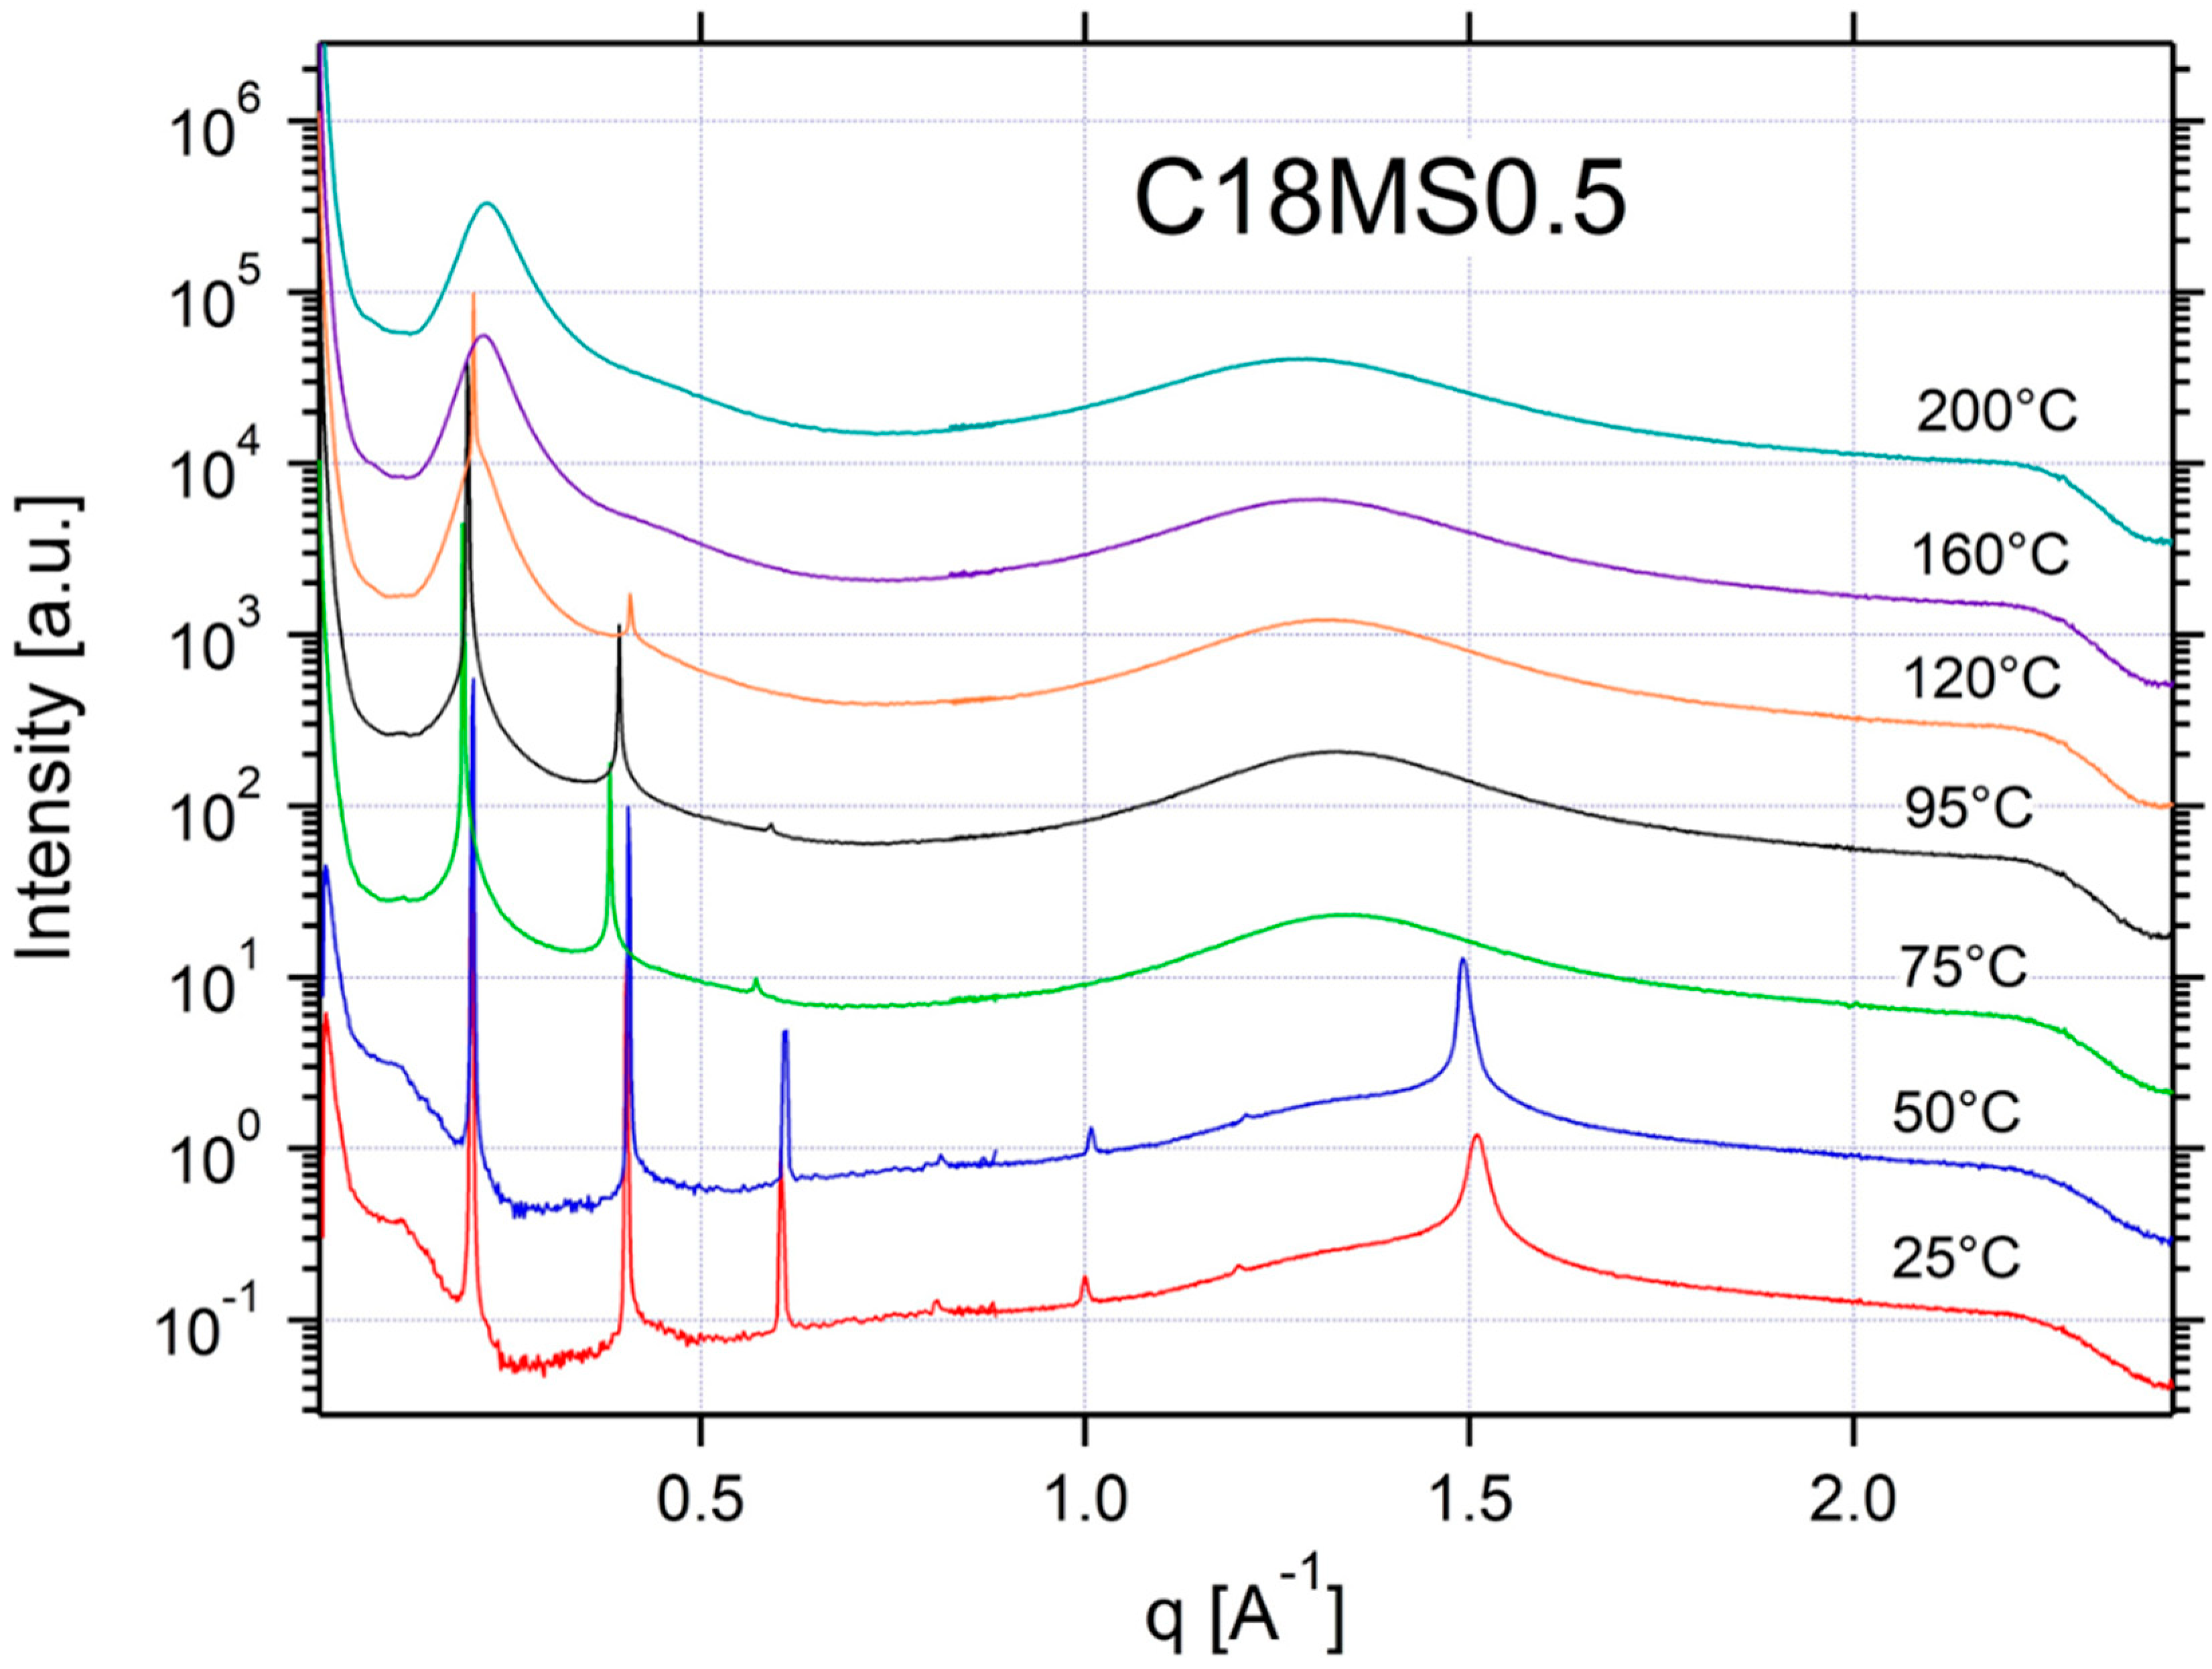
| C18MS0.5 | ISO | ISO | ISO/SM | SM | SM | CRYSTAL | CRYSTAL | 0.19 | 33 |
| C18MS | ISO | ISO | ISO | ISO | CRYSTAL | CRYSTAL | CRYSTAL | 0.13 | 48 |
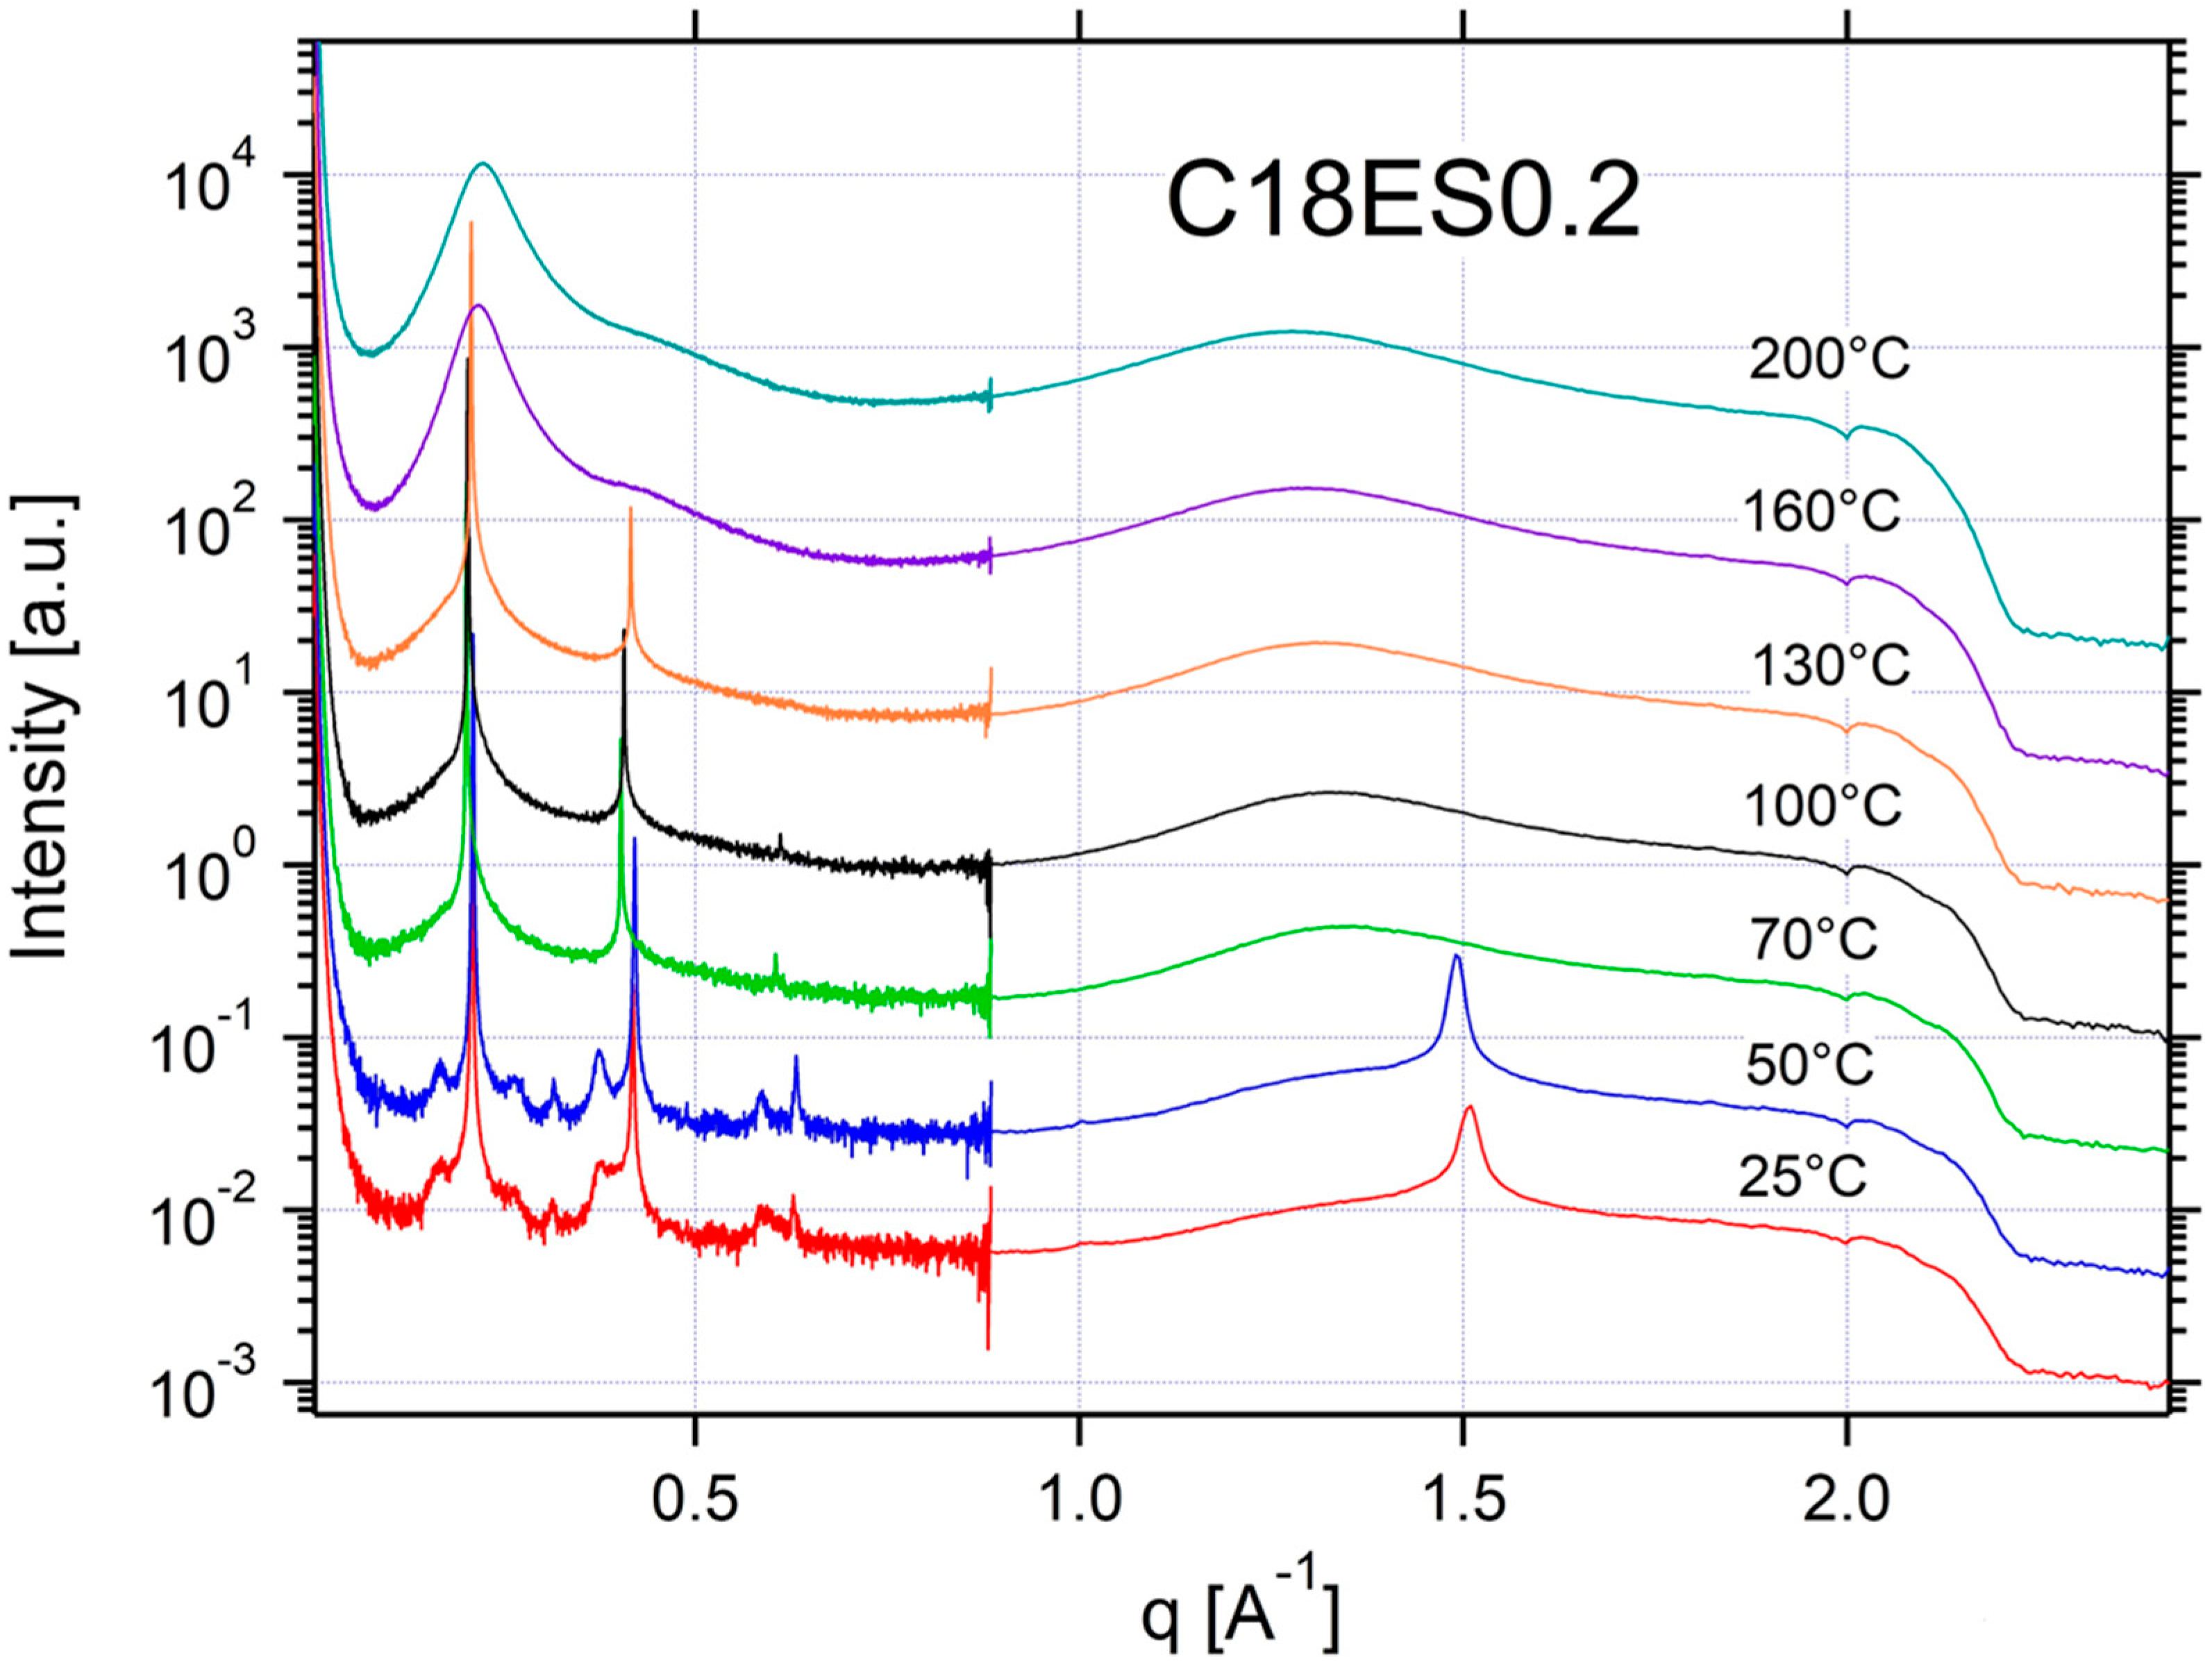
| Material | 200 °C | 160 °C | 130 °C | 100 °C | 70 °C | 50 °C | 25 °C | q (Å−1) (70 °C) | d = 2π/q (Å) |
|---|---|---|---|---|---|---|---|---|---|
| C18ES0.05 | ISO/SM | SM | SM | SM | SM | CRYSTAL | CRYSTAL | 0.20 | 31 |
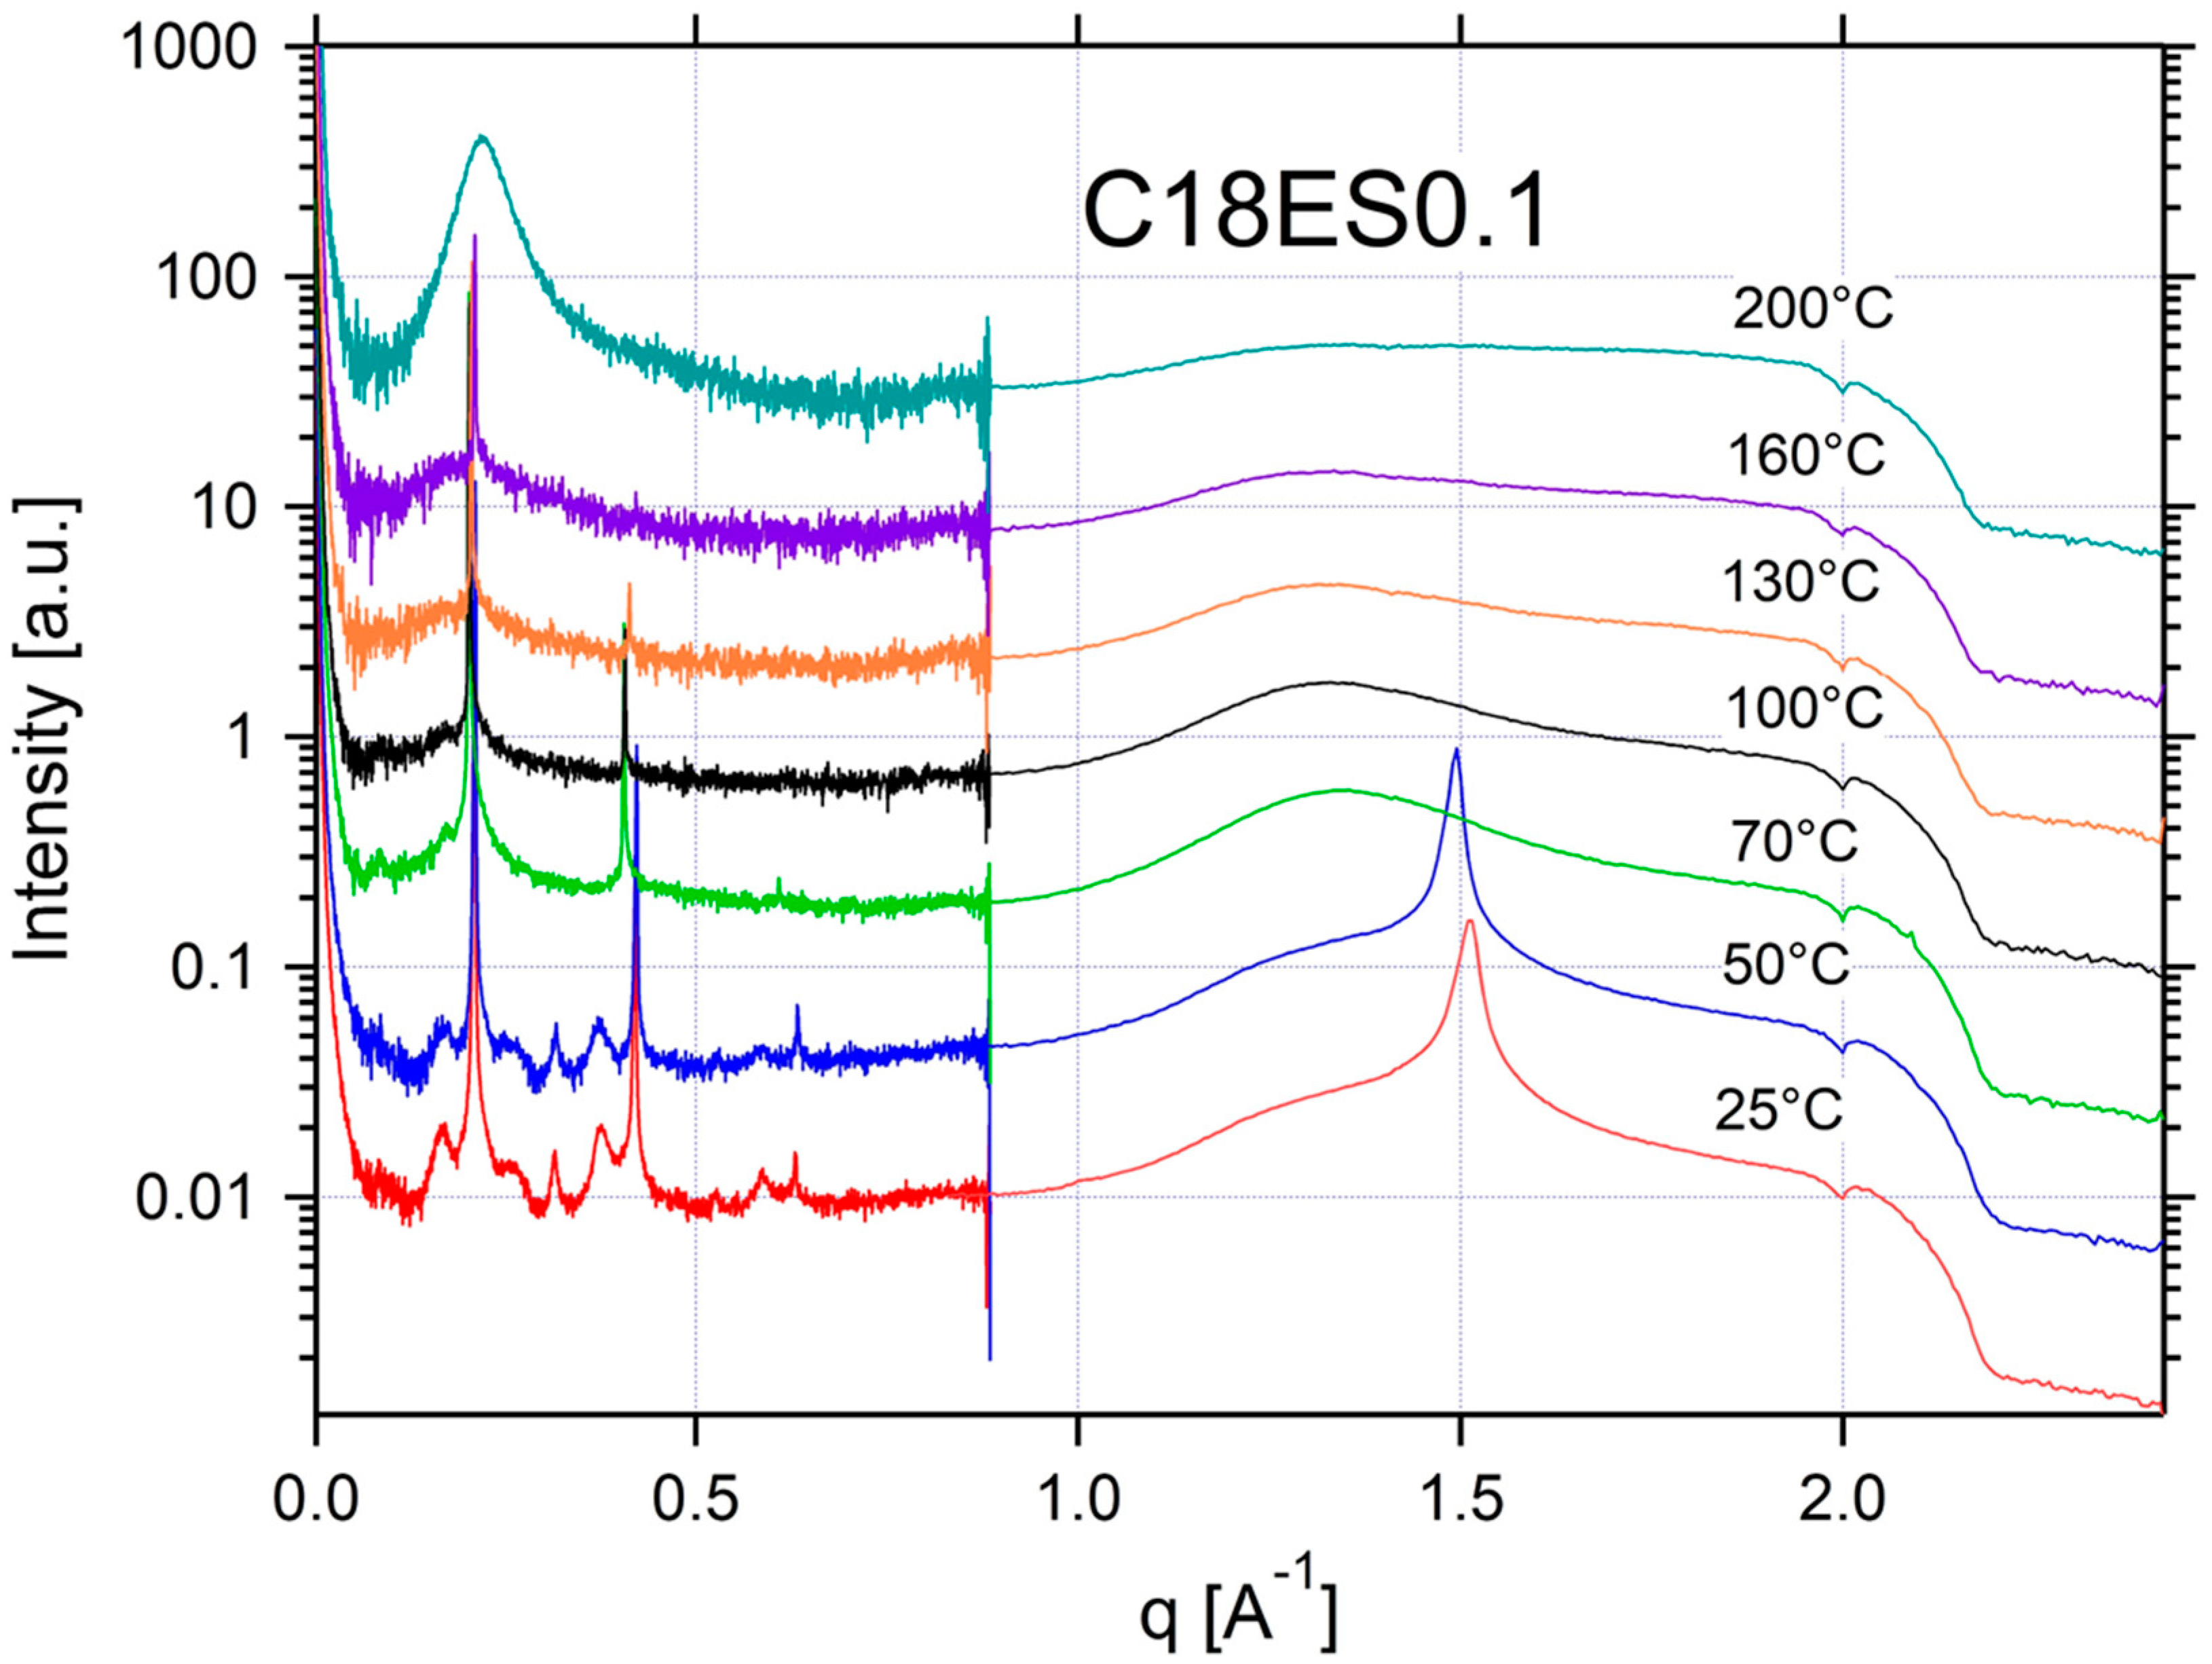
| C18ES0.1 | ISO | SM | SM | SM | SM | CRYSTAL | CRYSTAL | 0.20 | 31 |
| C18ES0.2 | ISO | ISO | SM | SM | SM | CRYSTAL | CRYSTAL | 0.20 | 31 |
| C18ES0.3 | ISO | ISO | ISO | SM | SM | CRYSTAL | CRYSTAL | 0.20 | 31 |
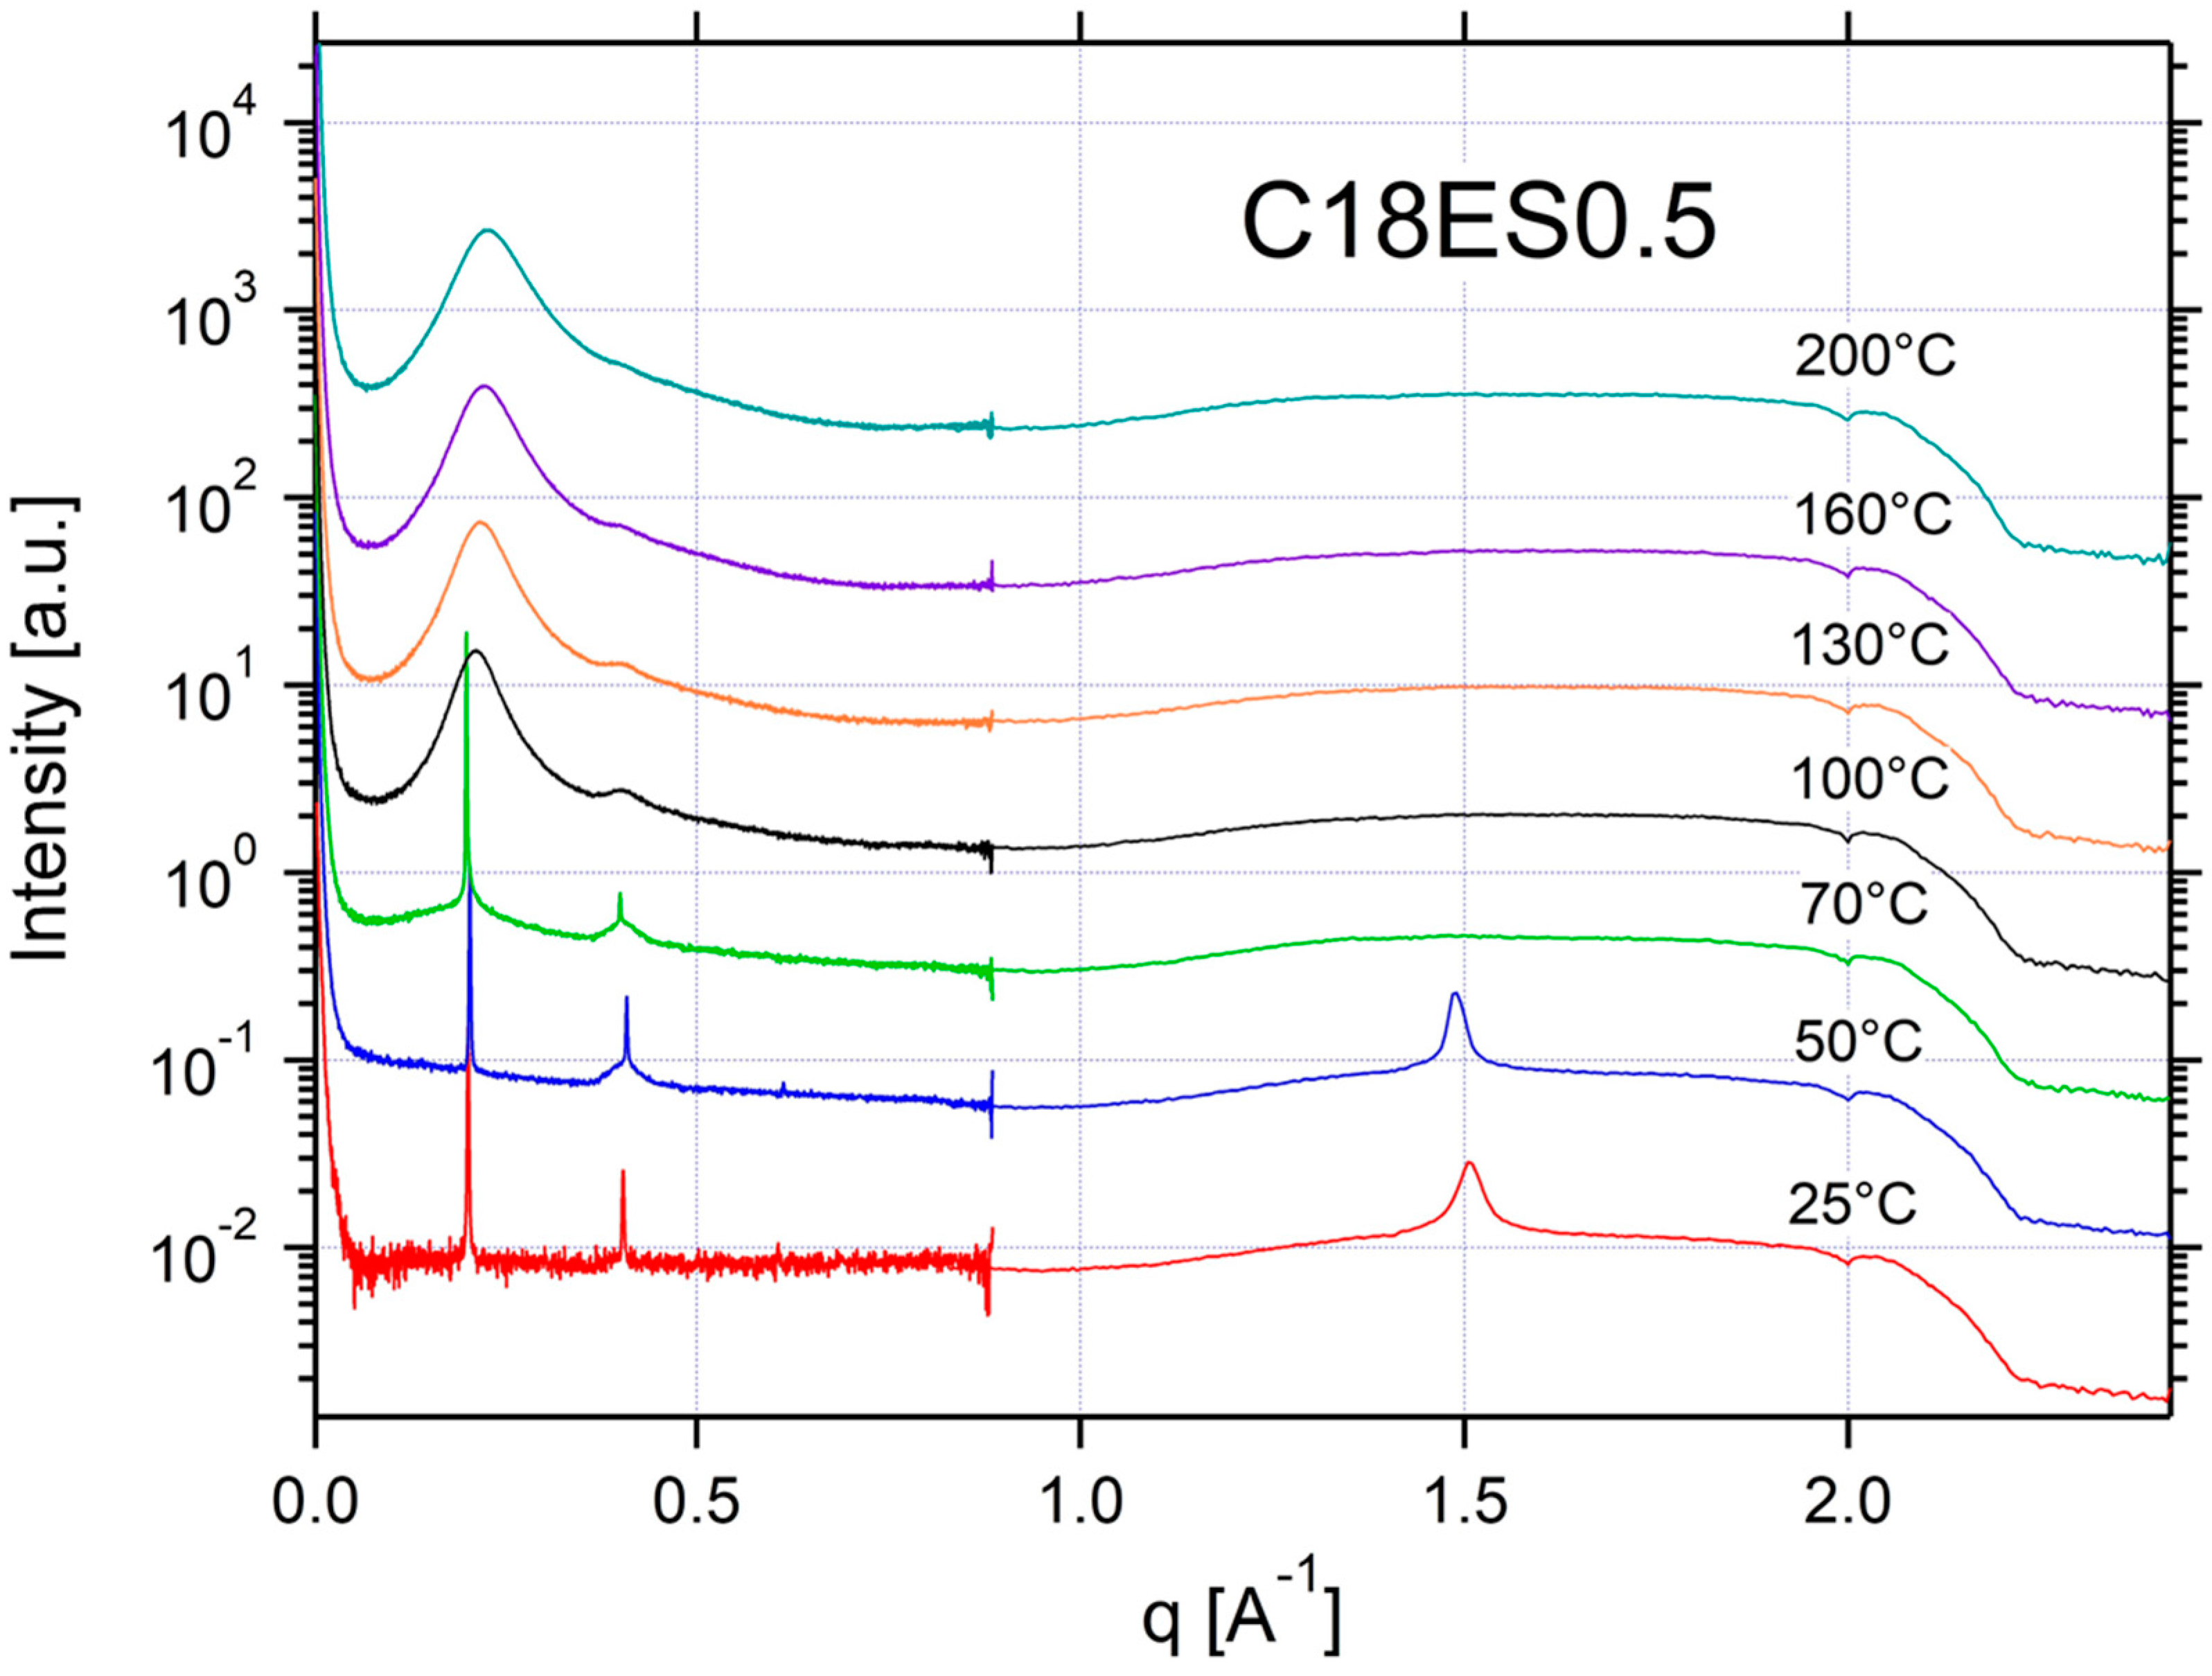
| C18ES0.5 | ISO | ISO | ISO | ISO | SM | CRYSTAL | CRYSTAL | 0.20 | 31 |
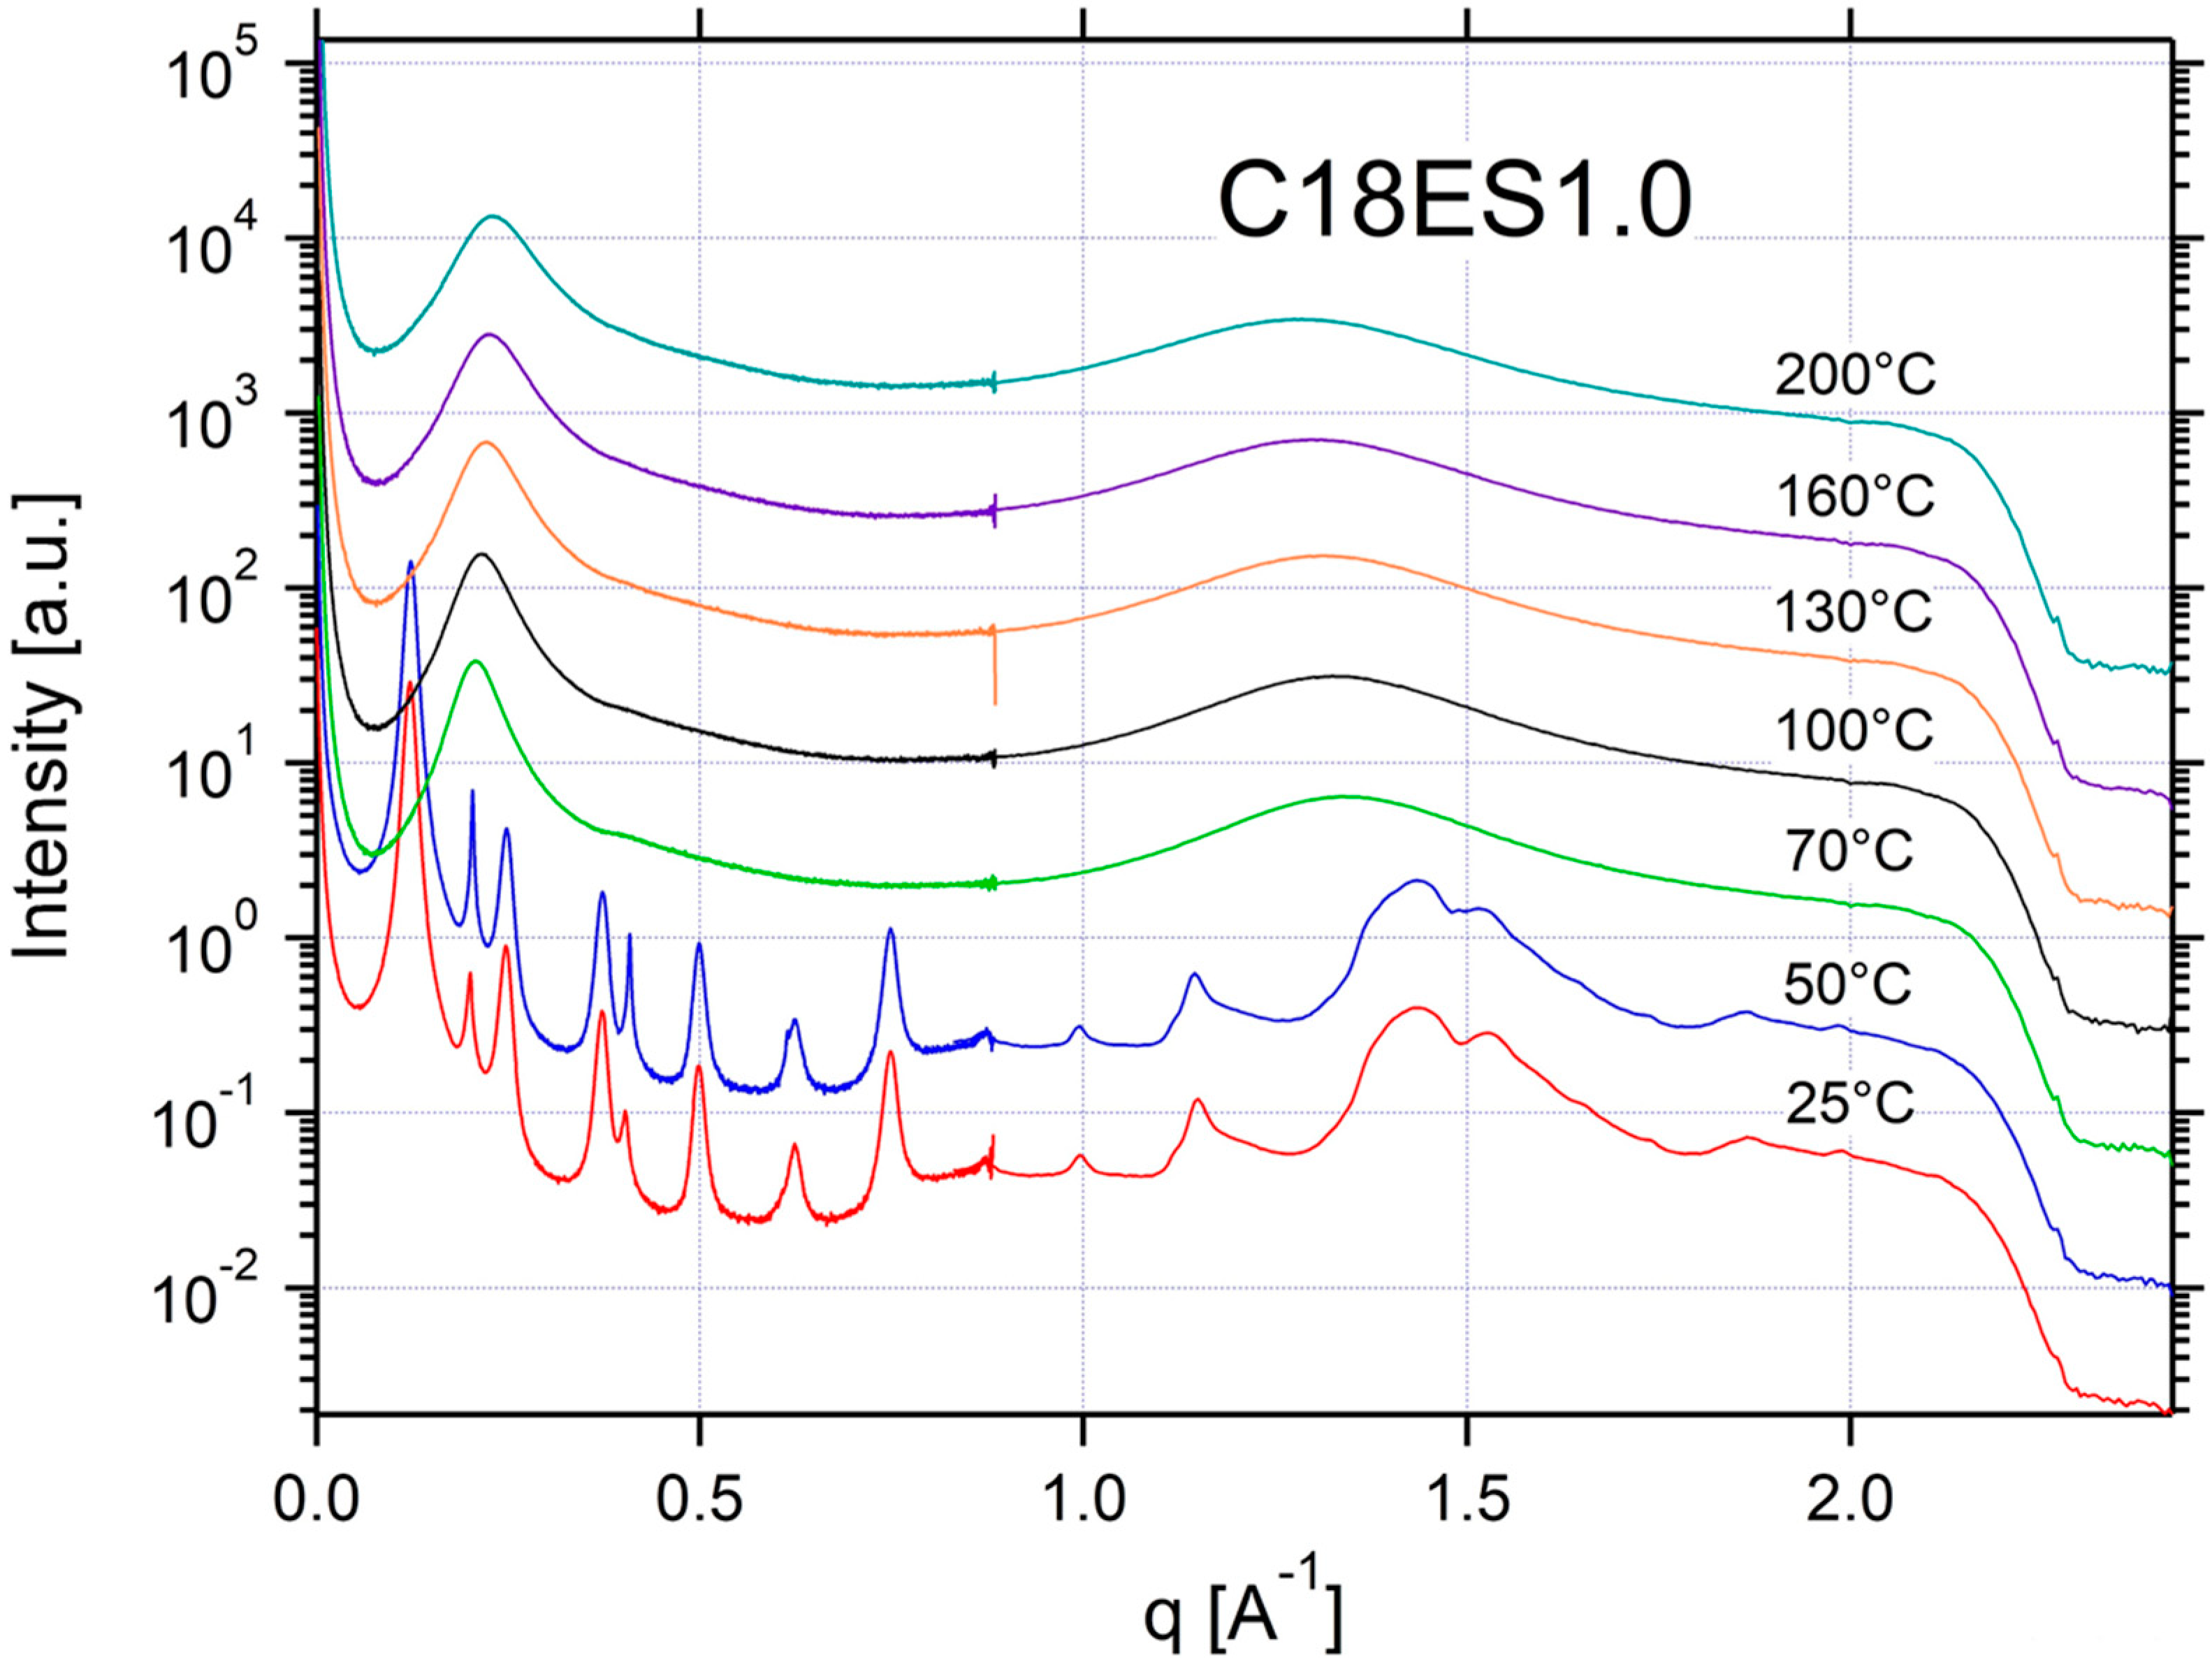
| C18ES1.0 | ISO | ISO | ISO | ISO | ISO | CRYSTAL | CRYSTAL | 0.13 | 48 |
| C18ES | ISO | ISO | ISO | ISO | CRYSTAL | CRYSTAL | CRYSTAL | 0.13 | 48 |
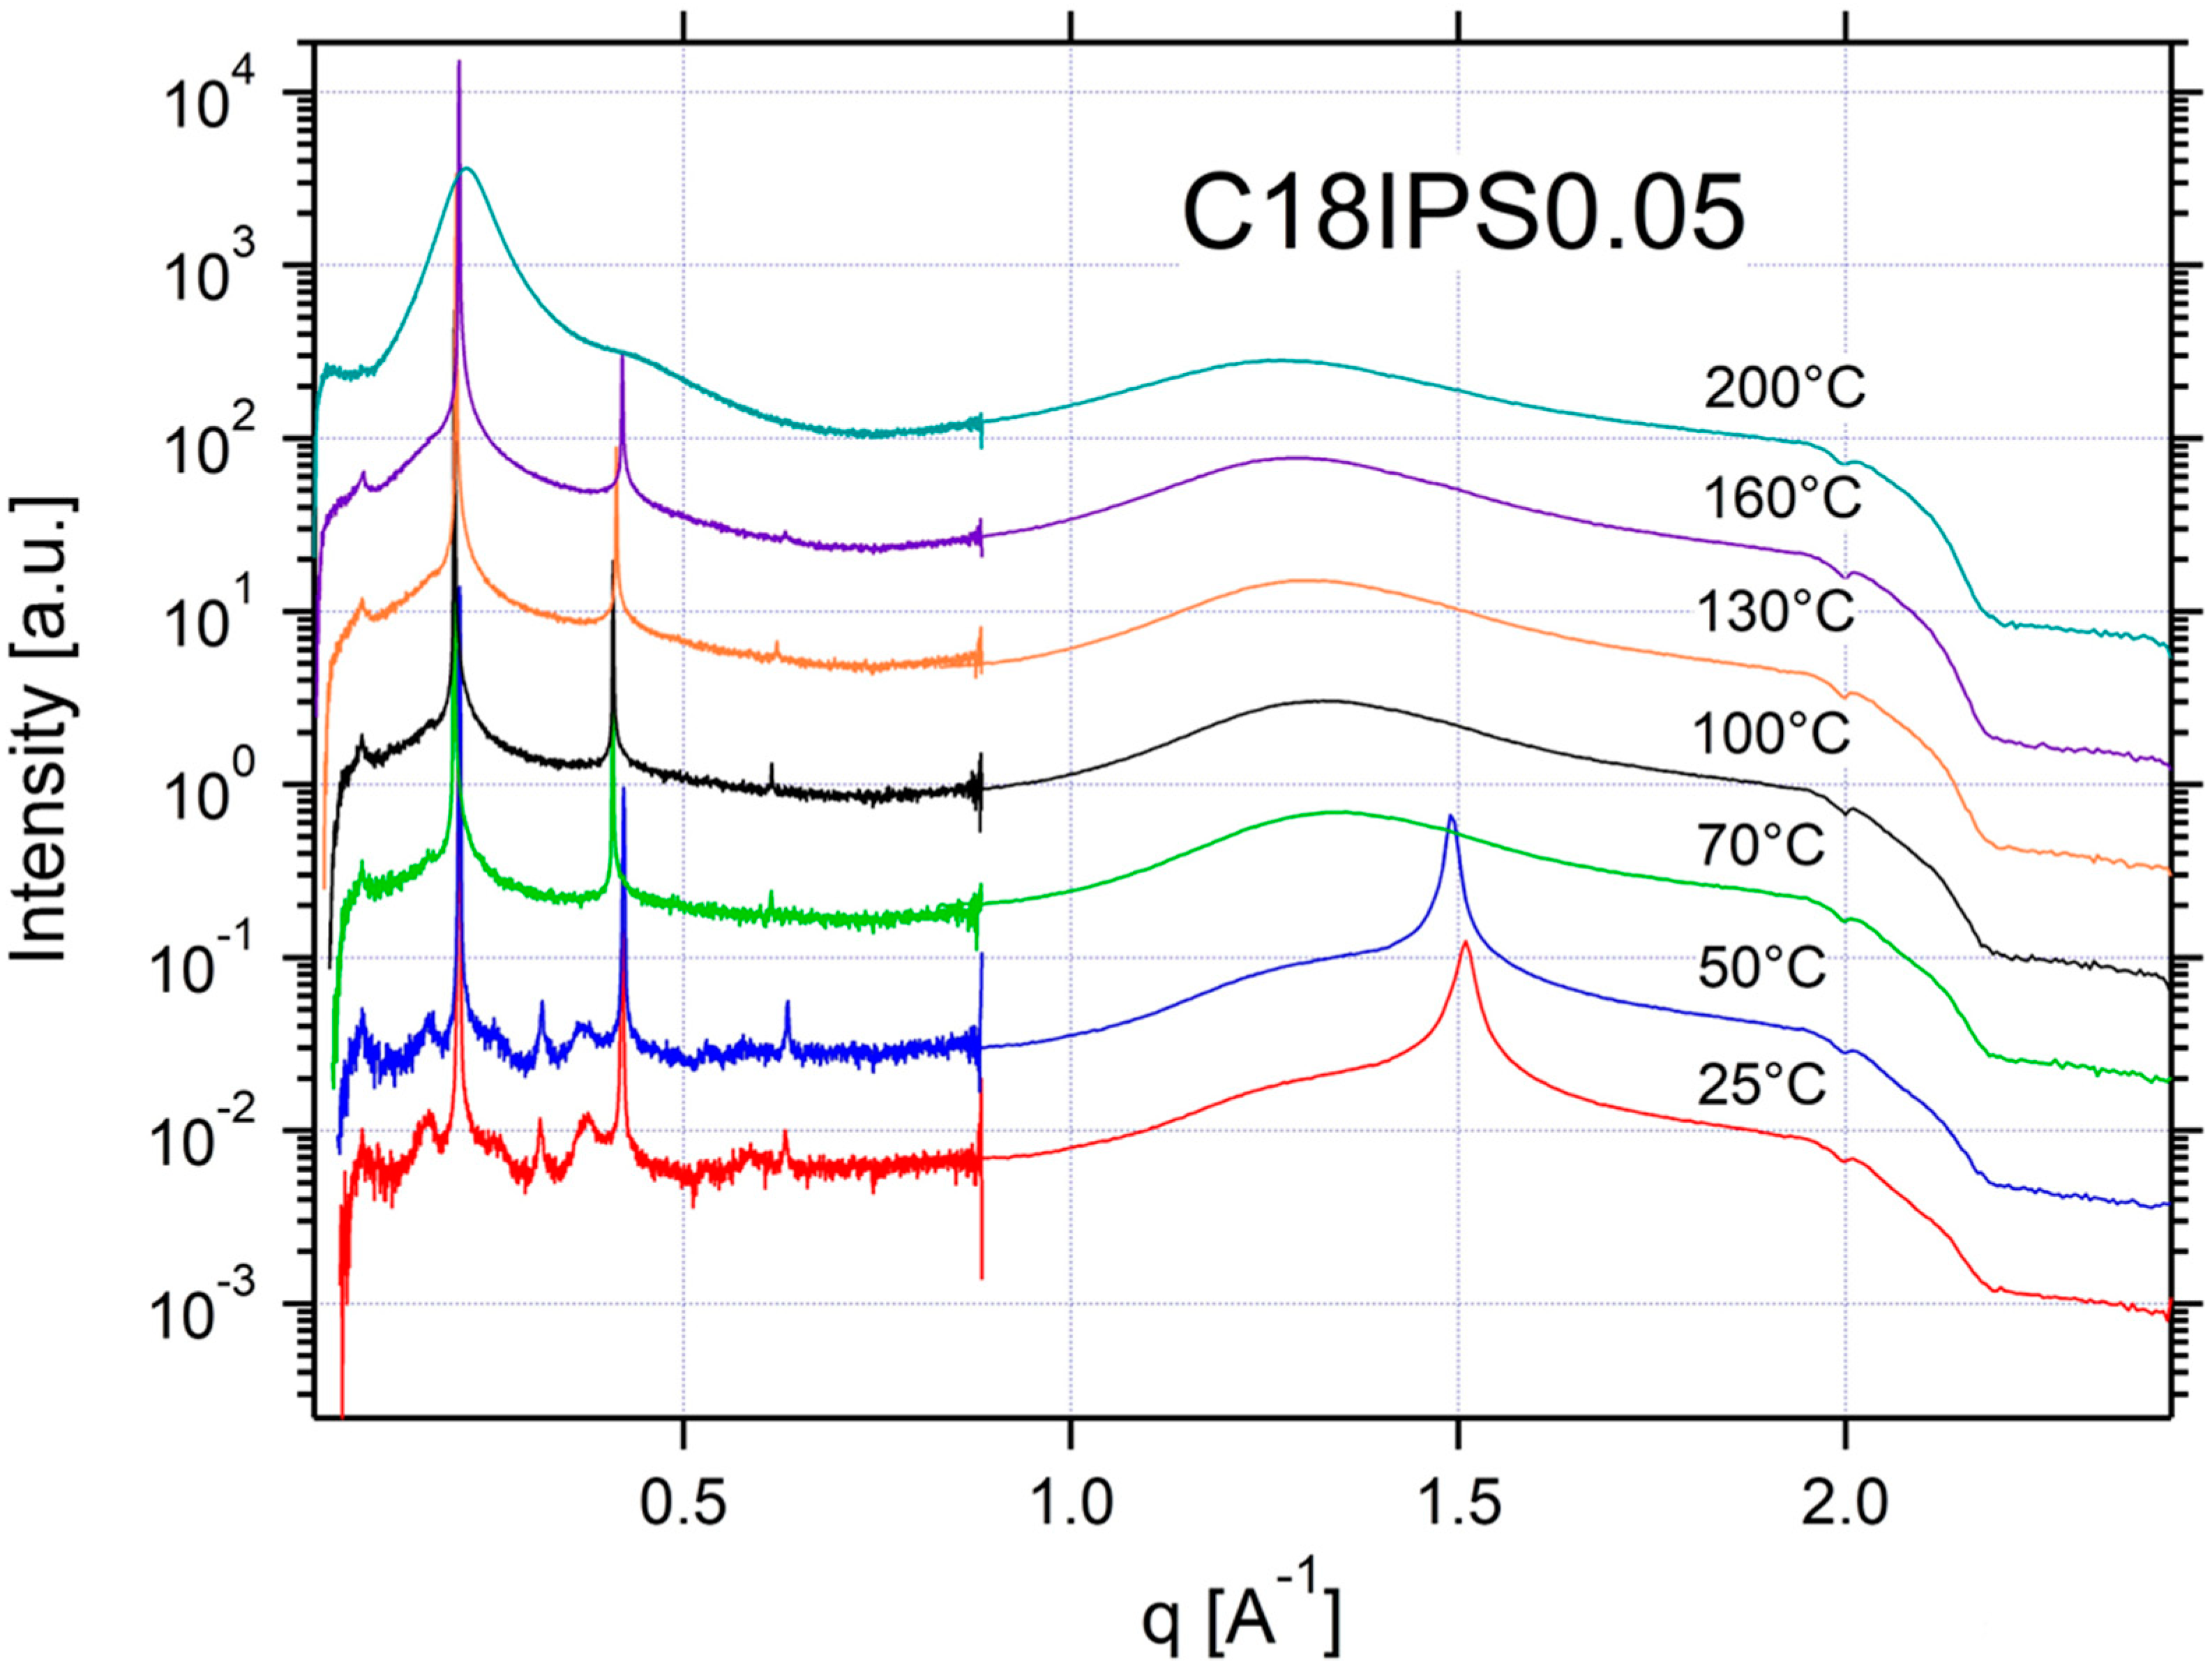
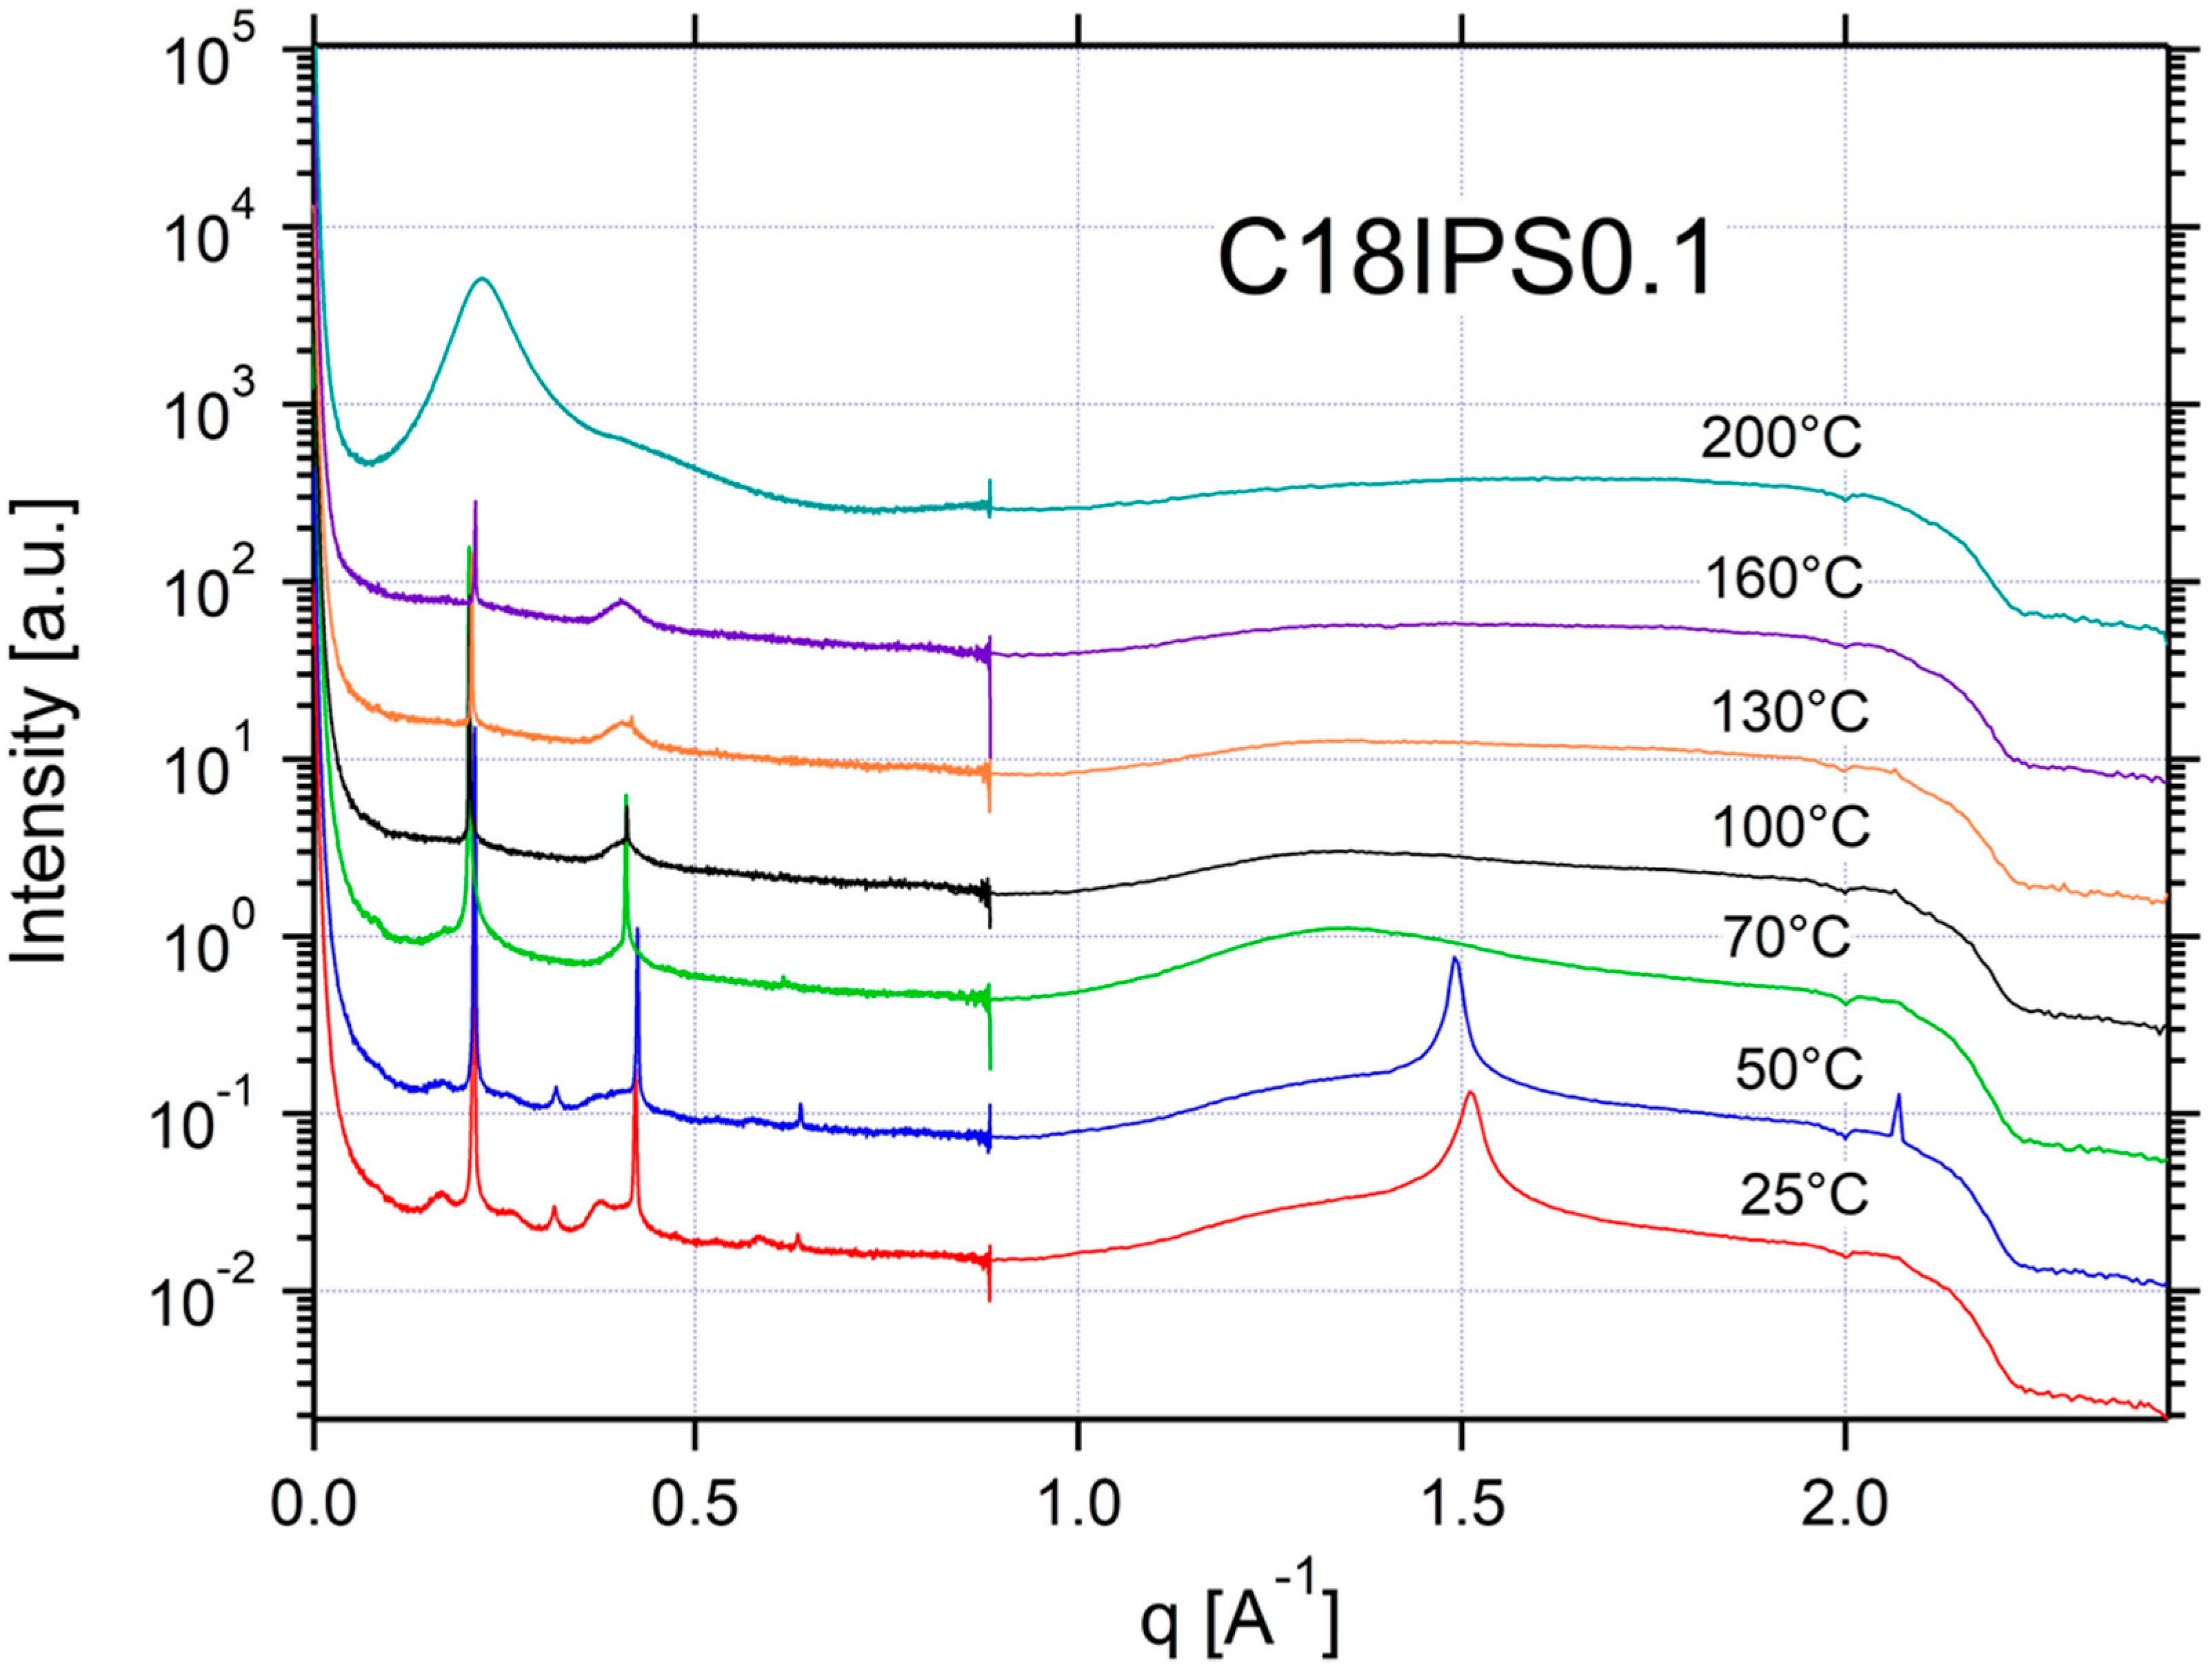
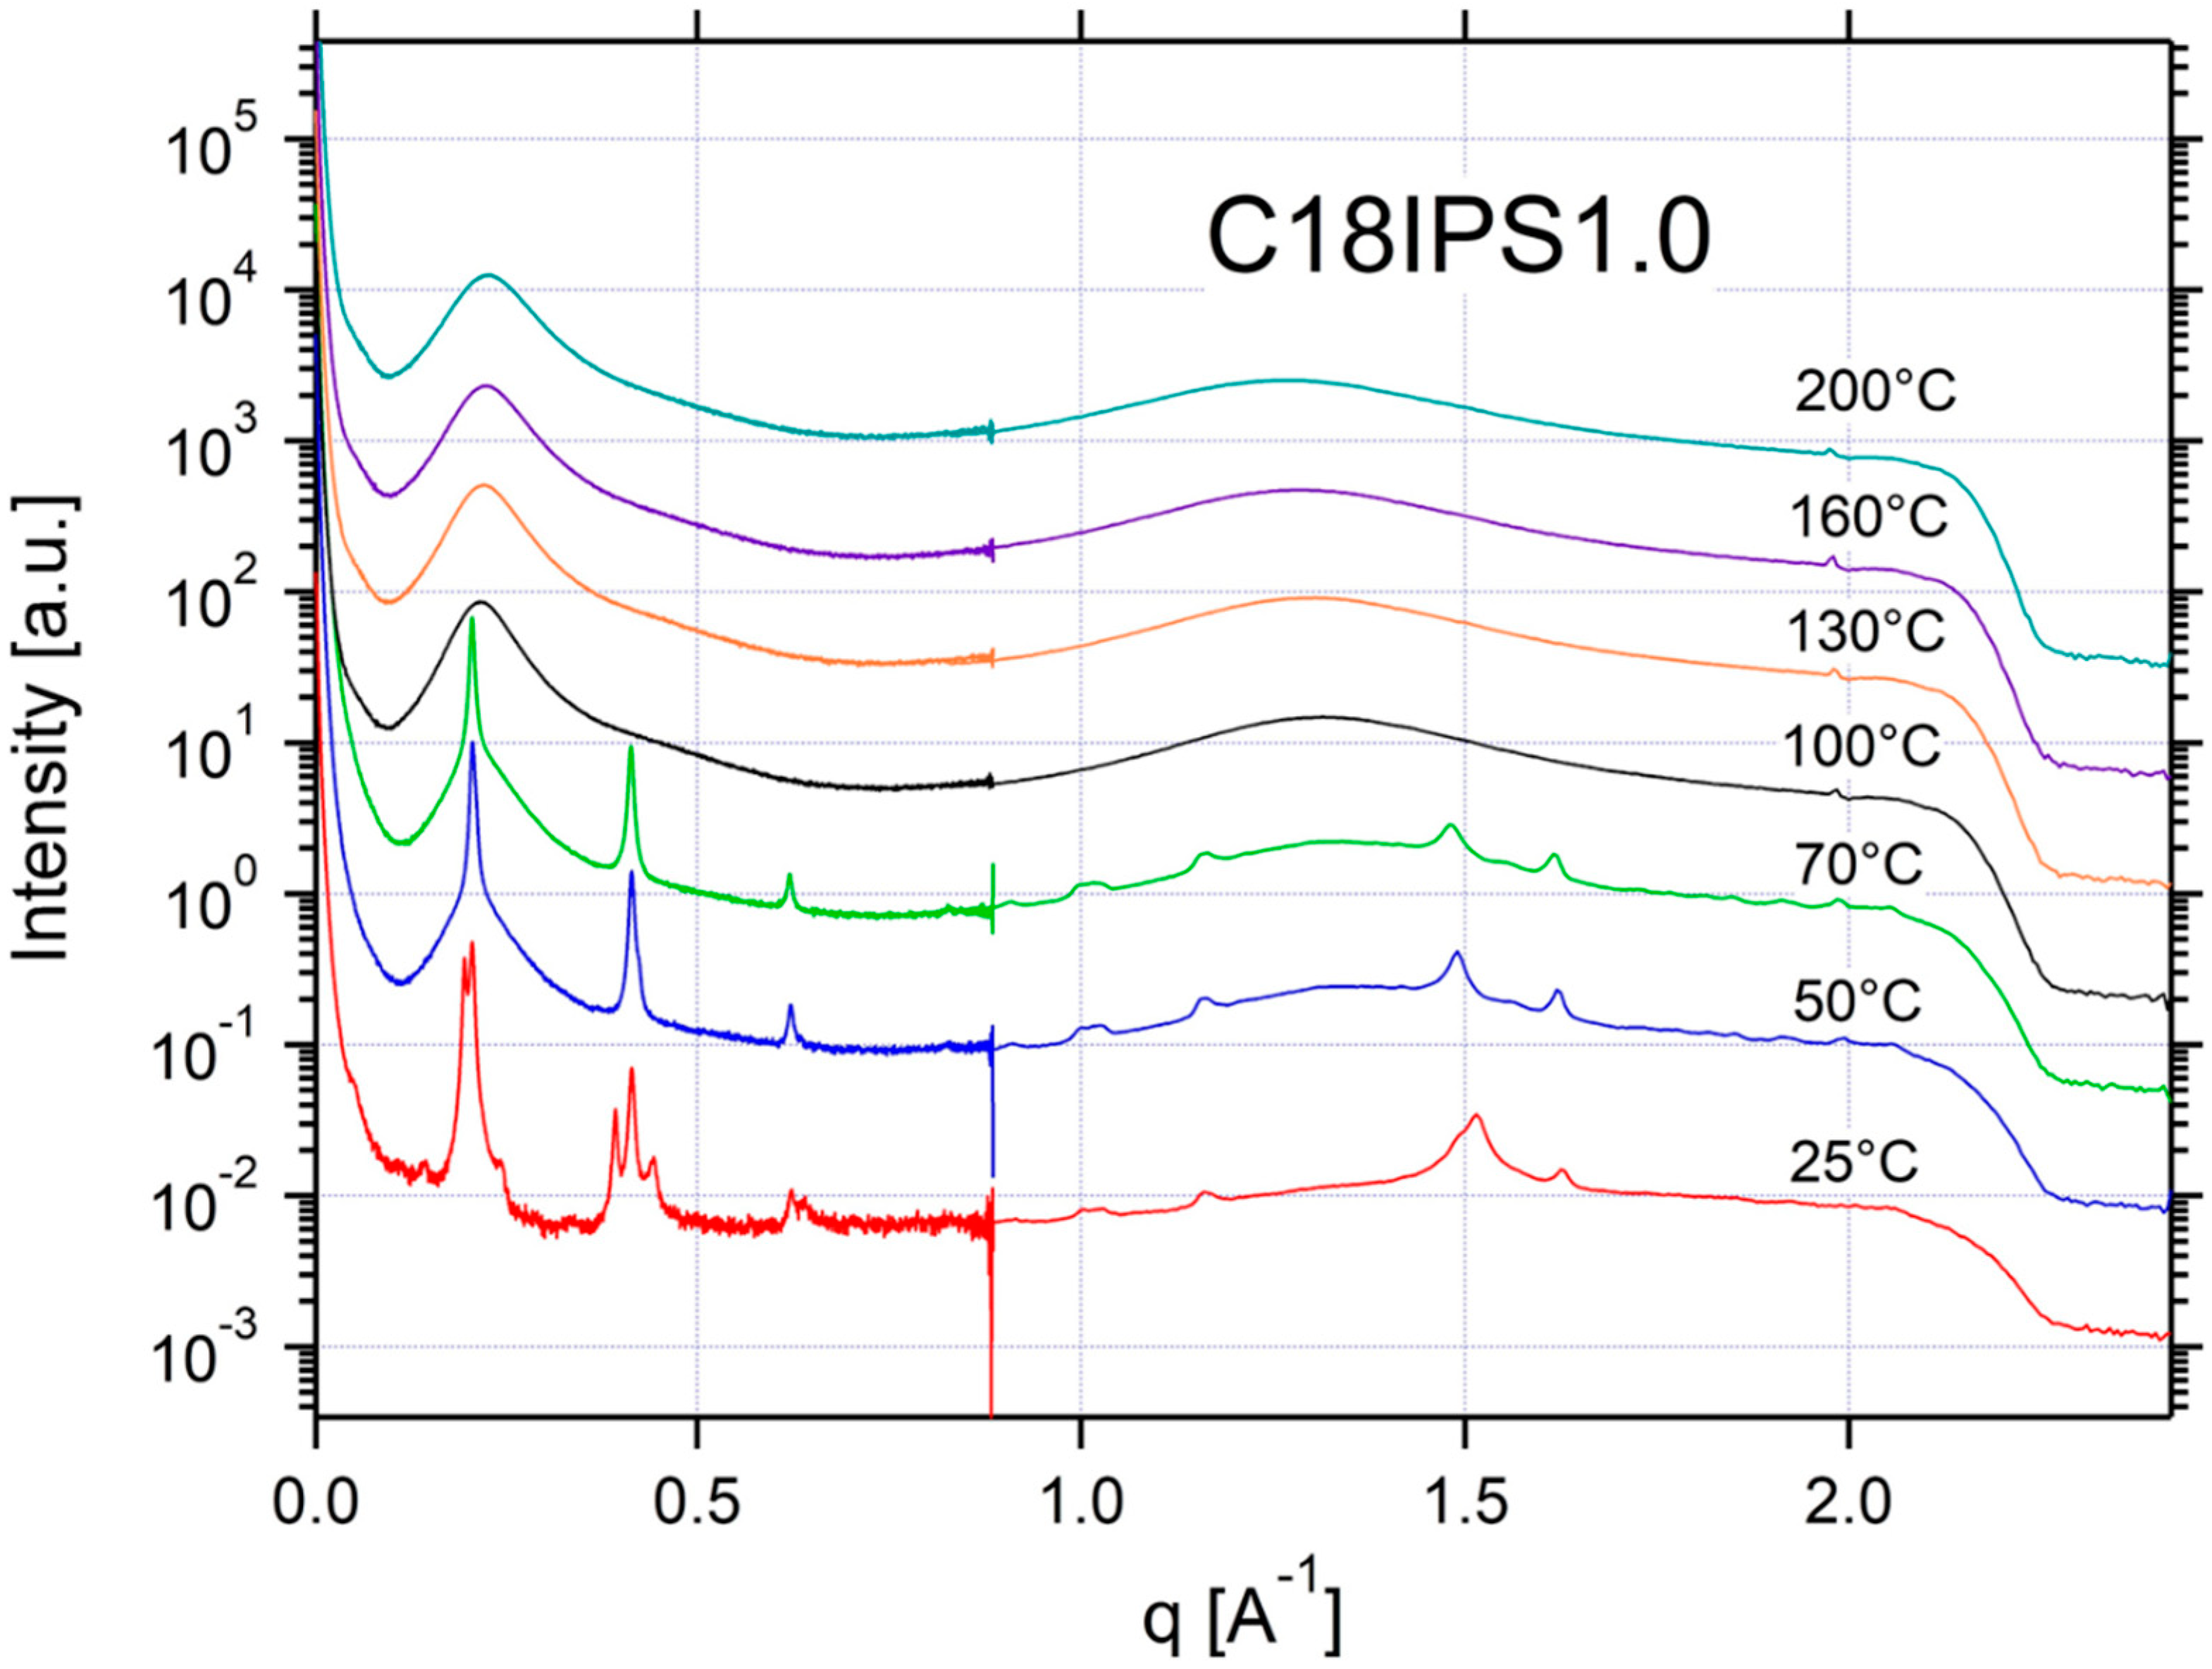
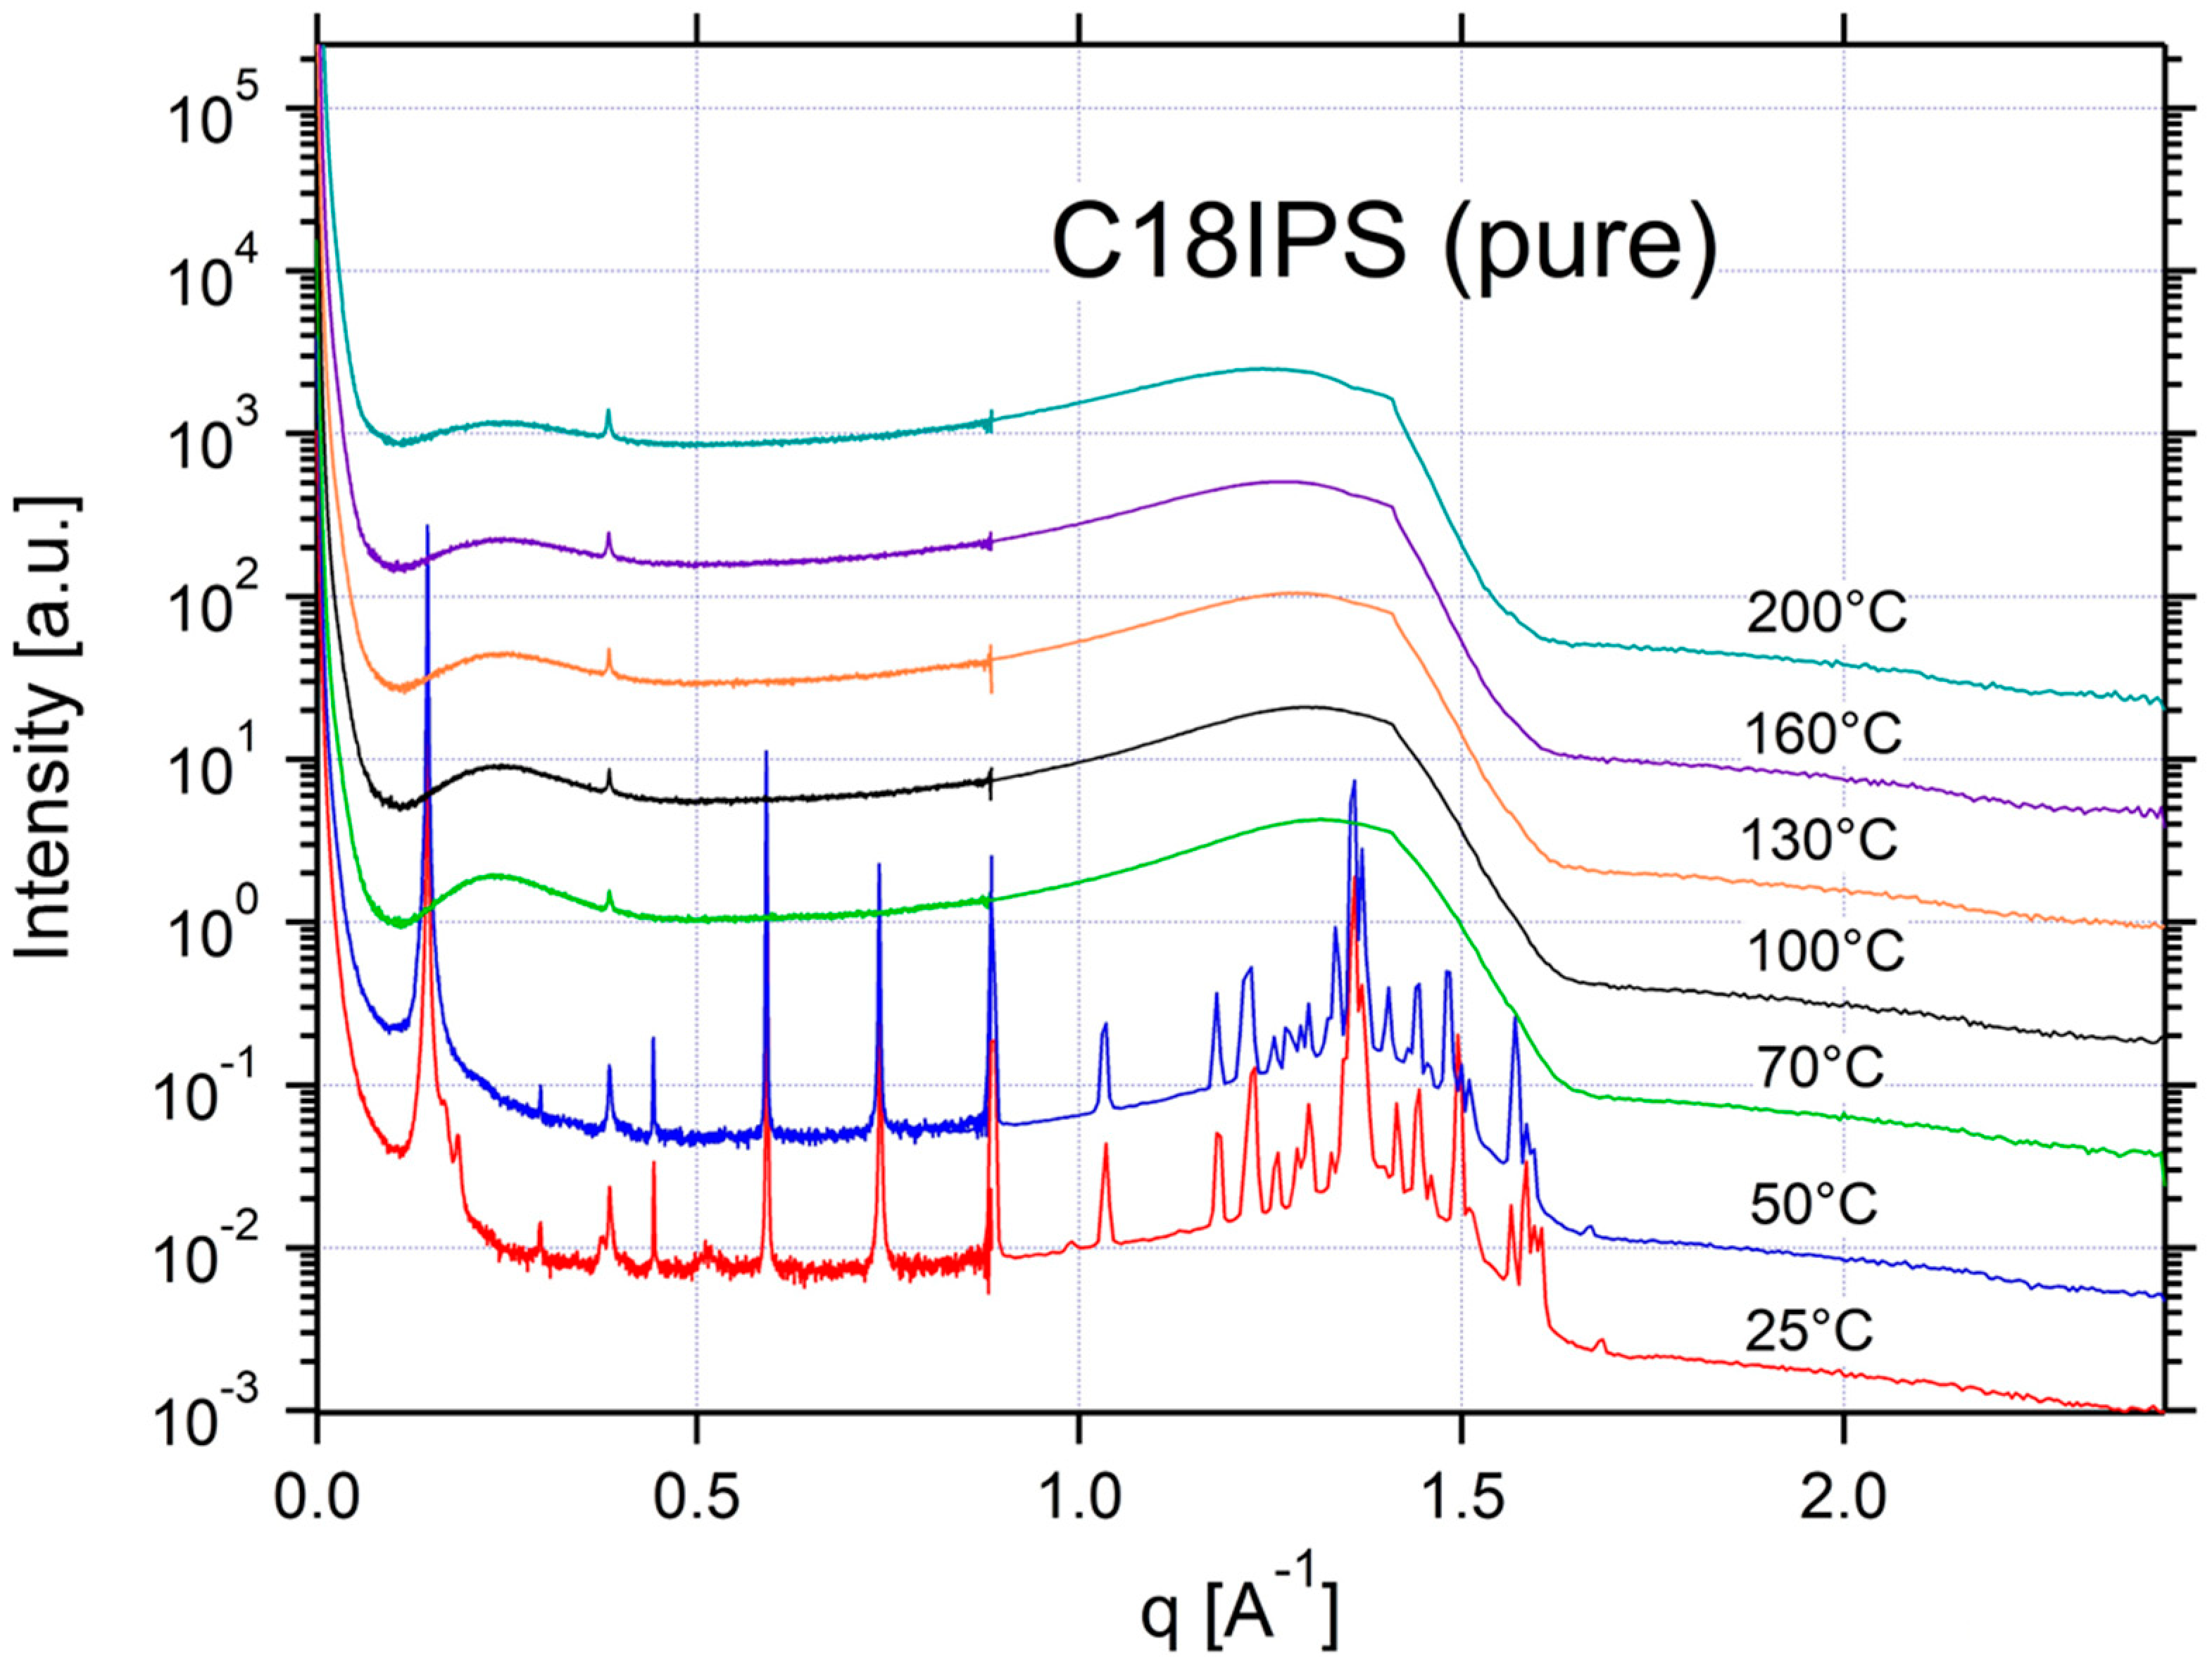
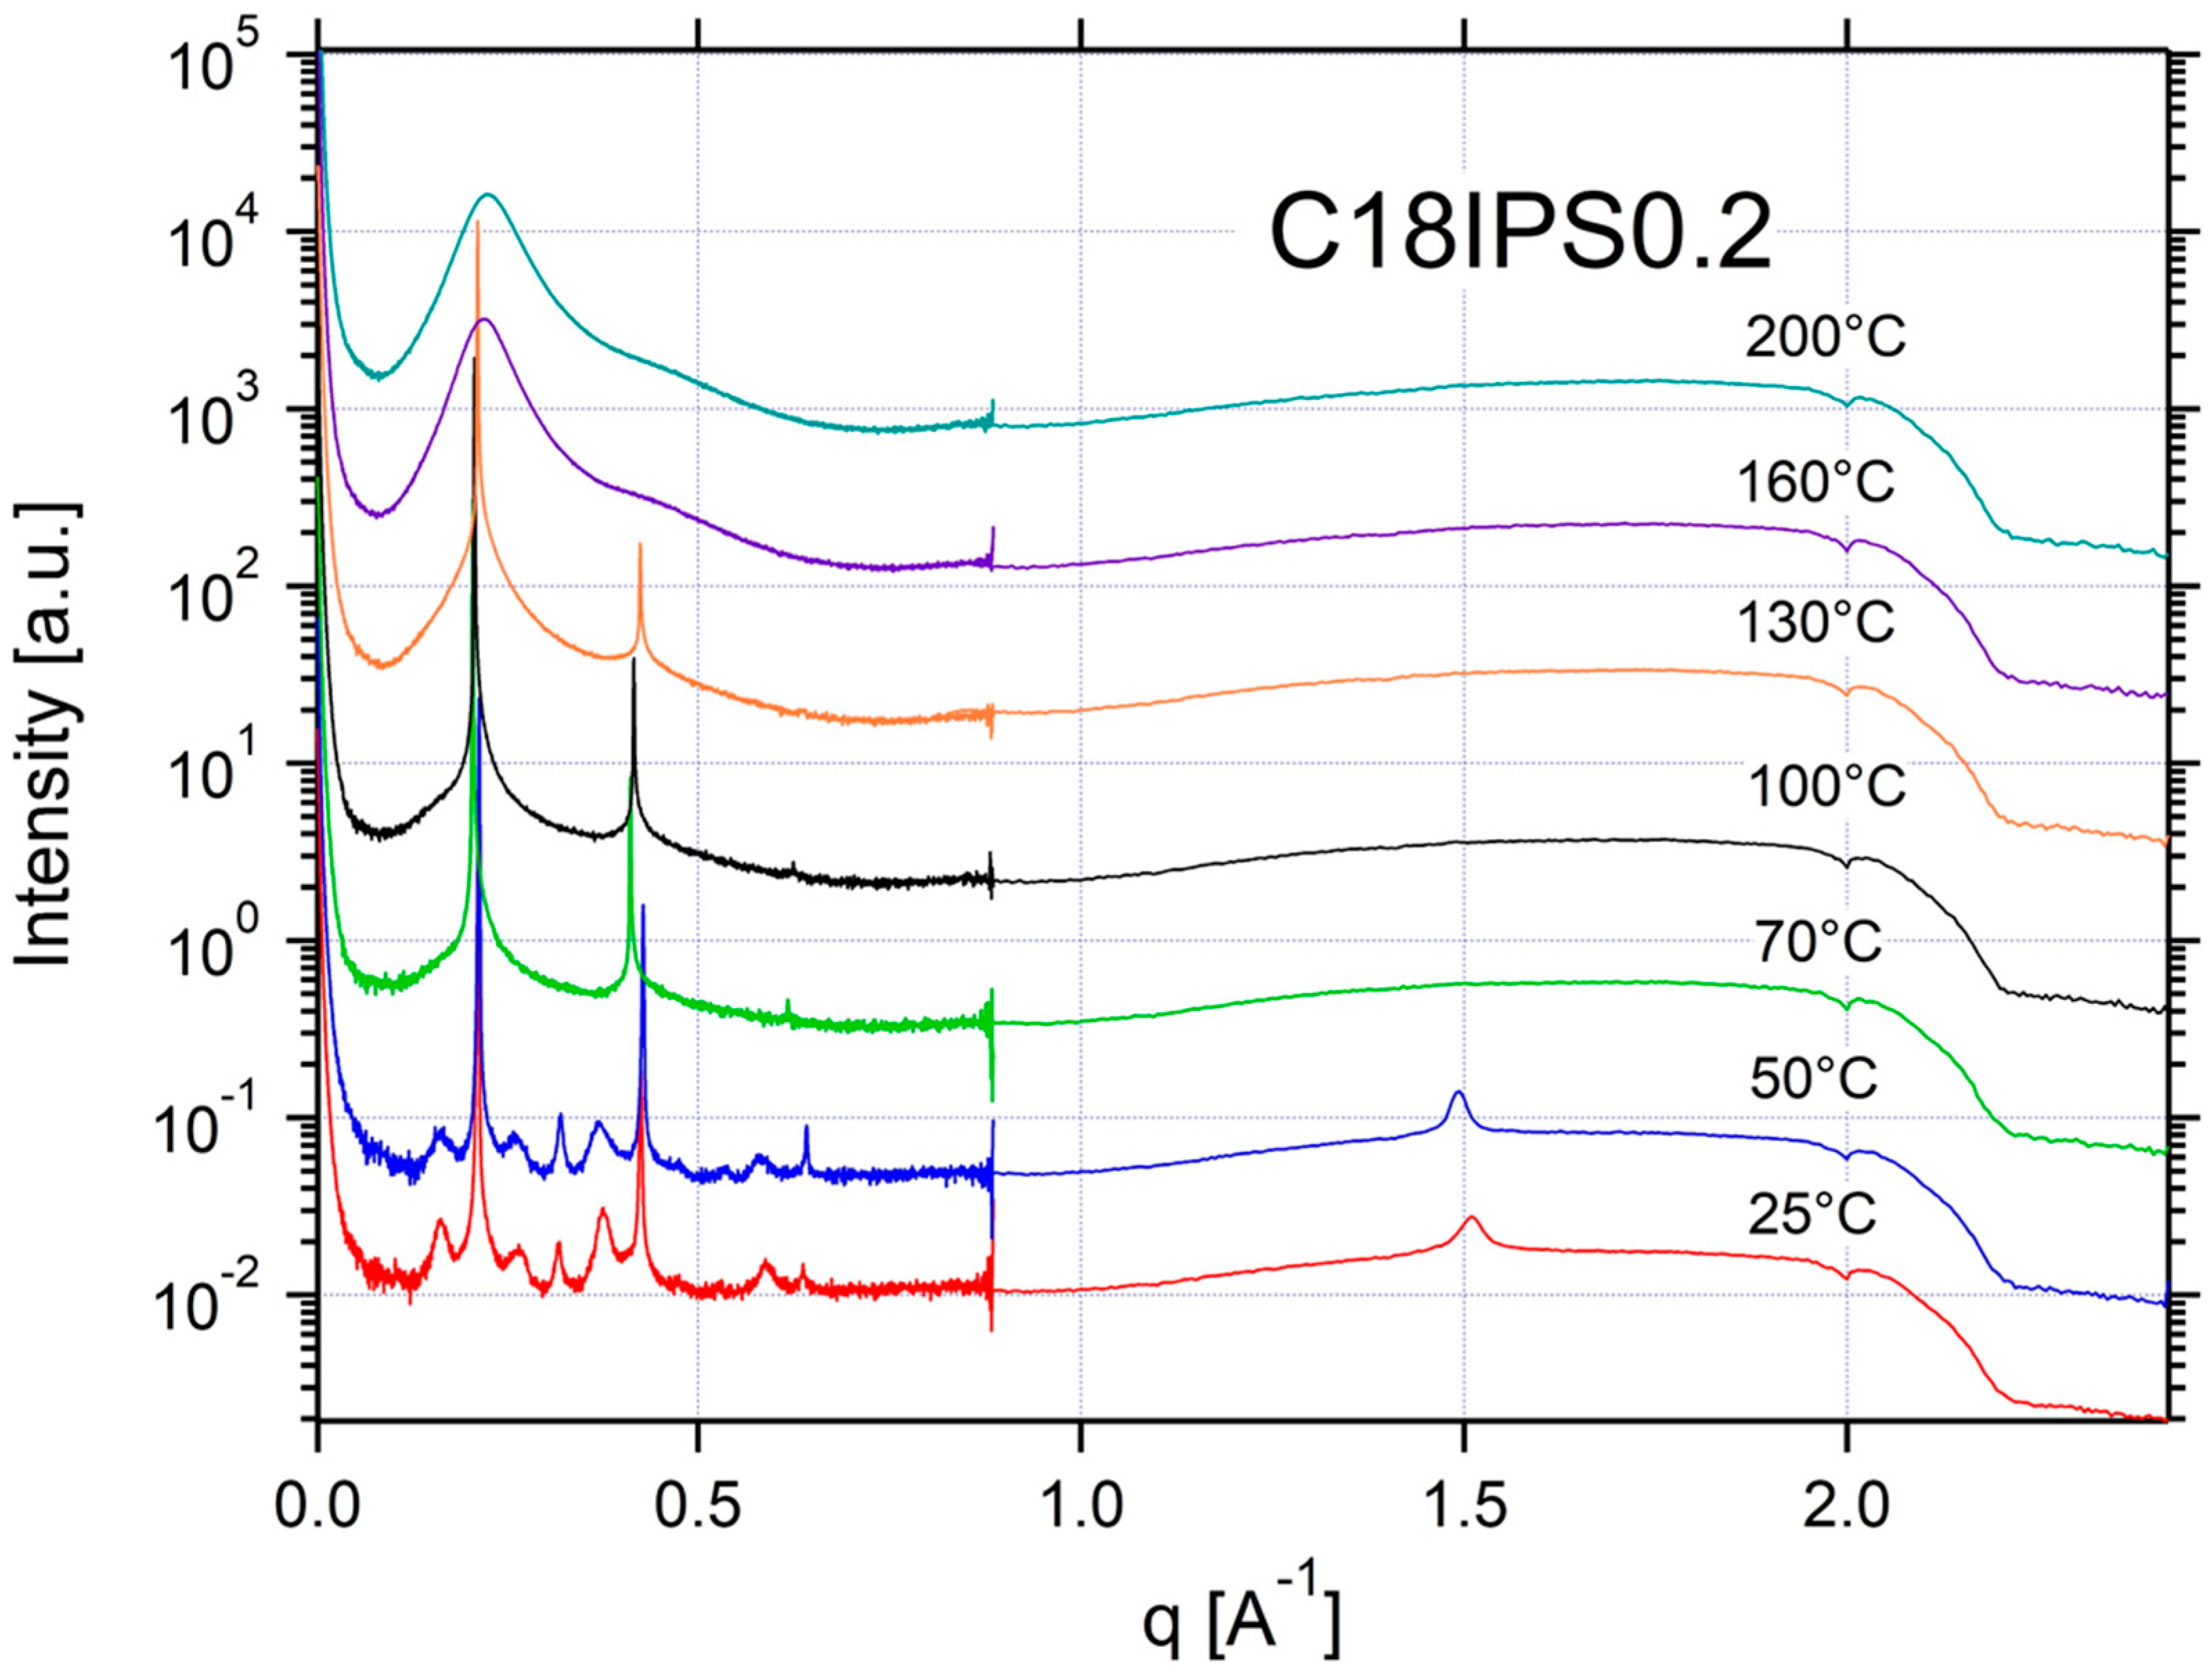
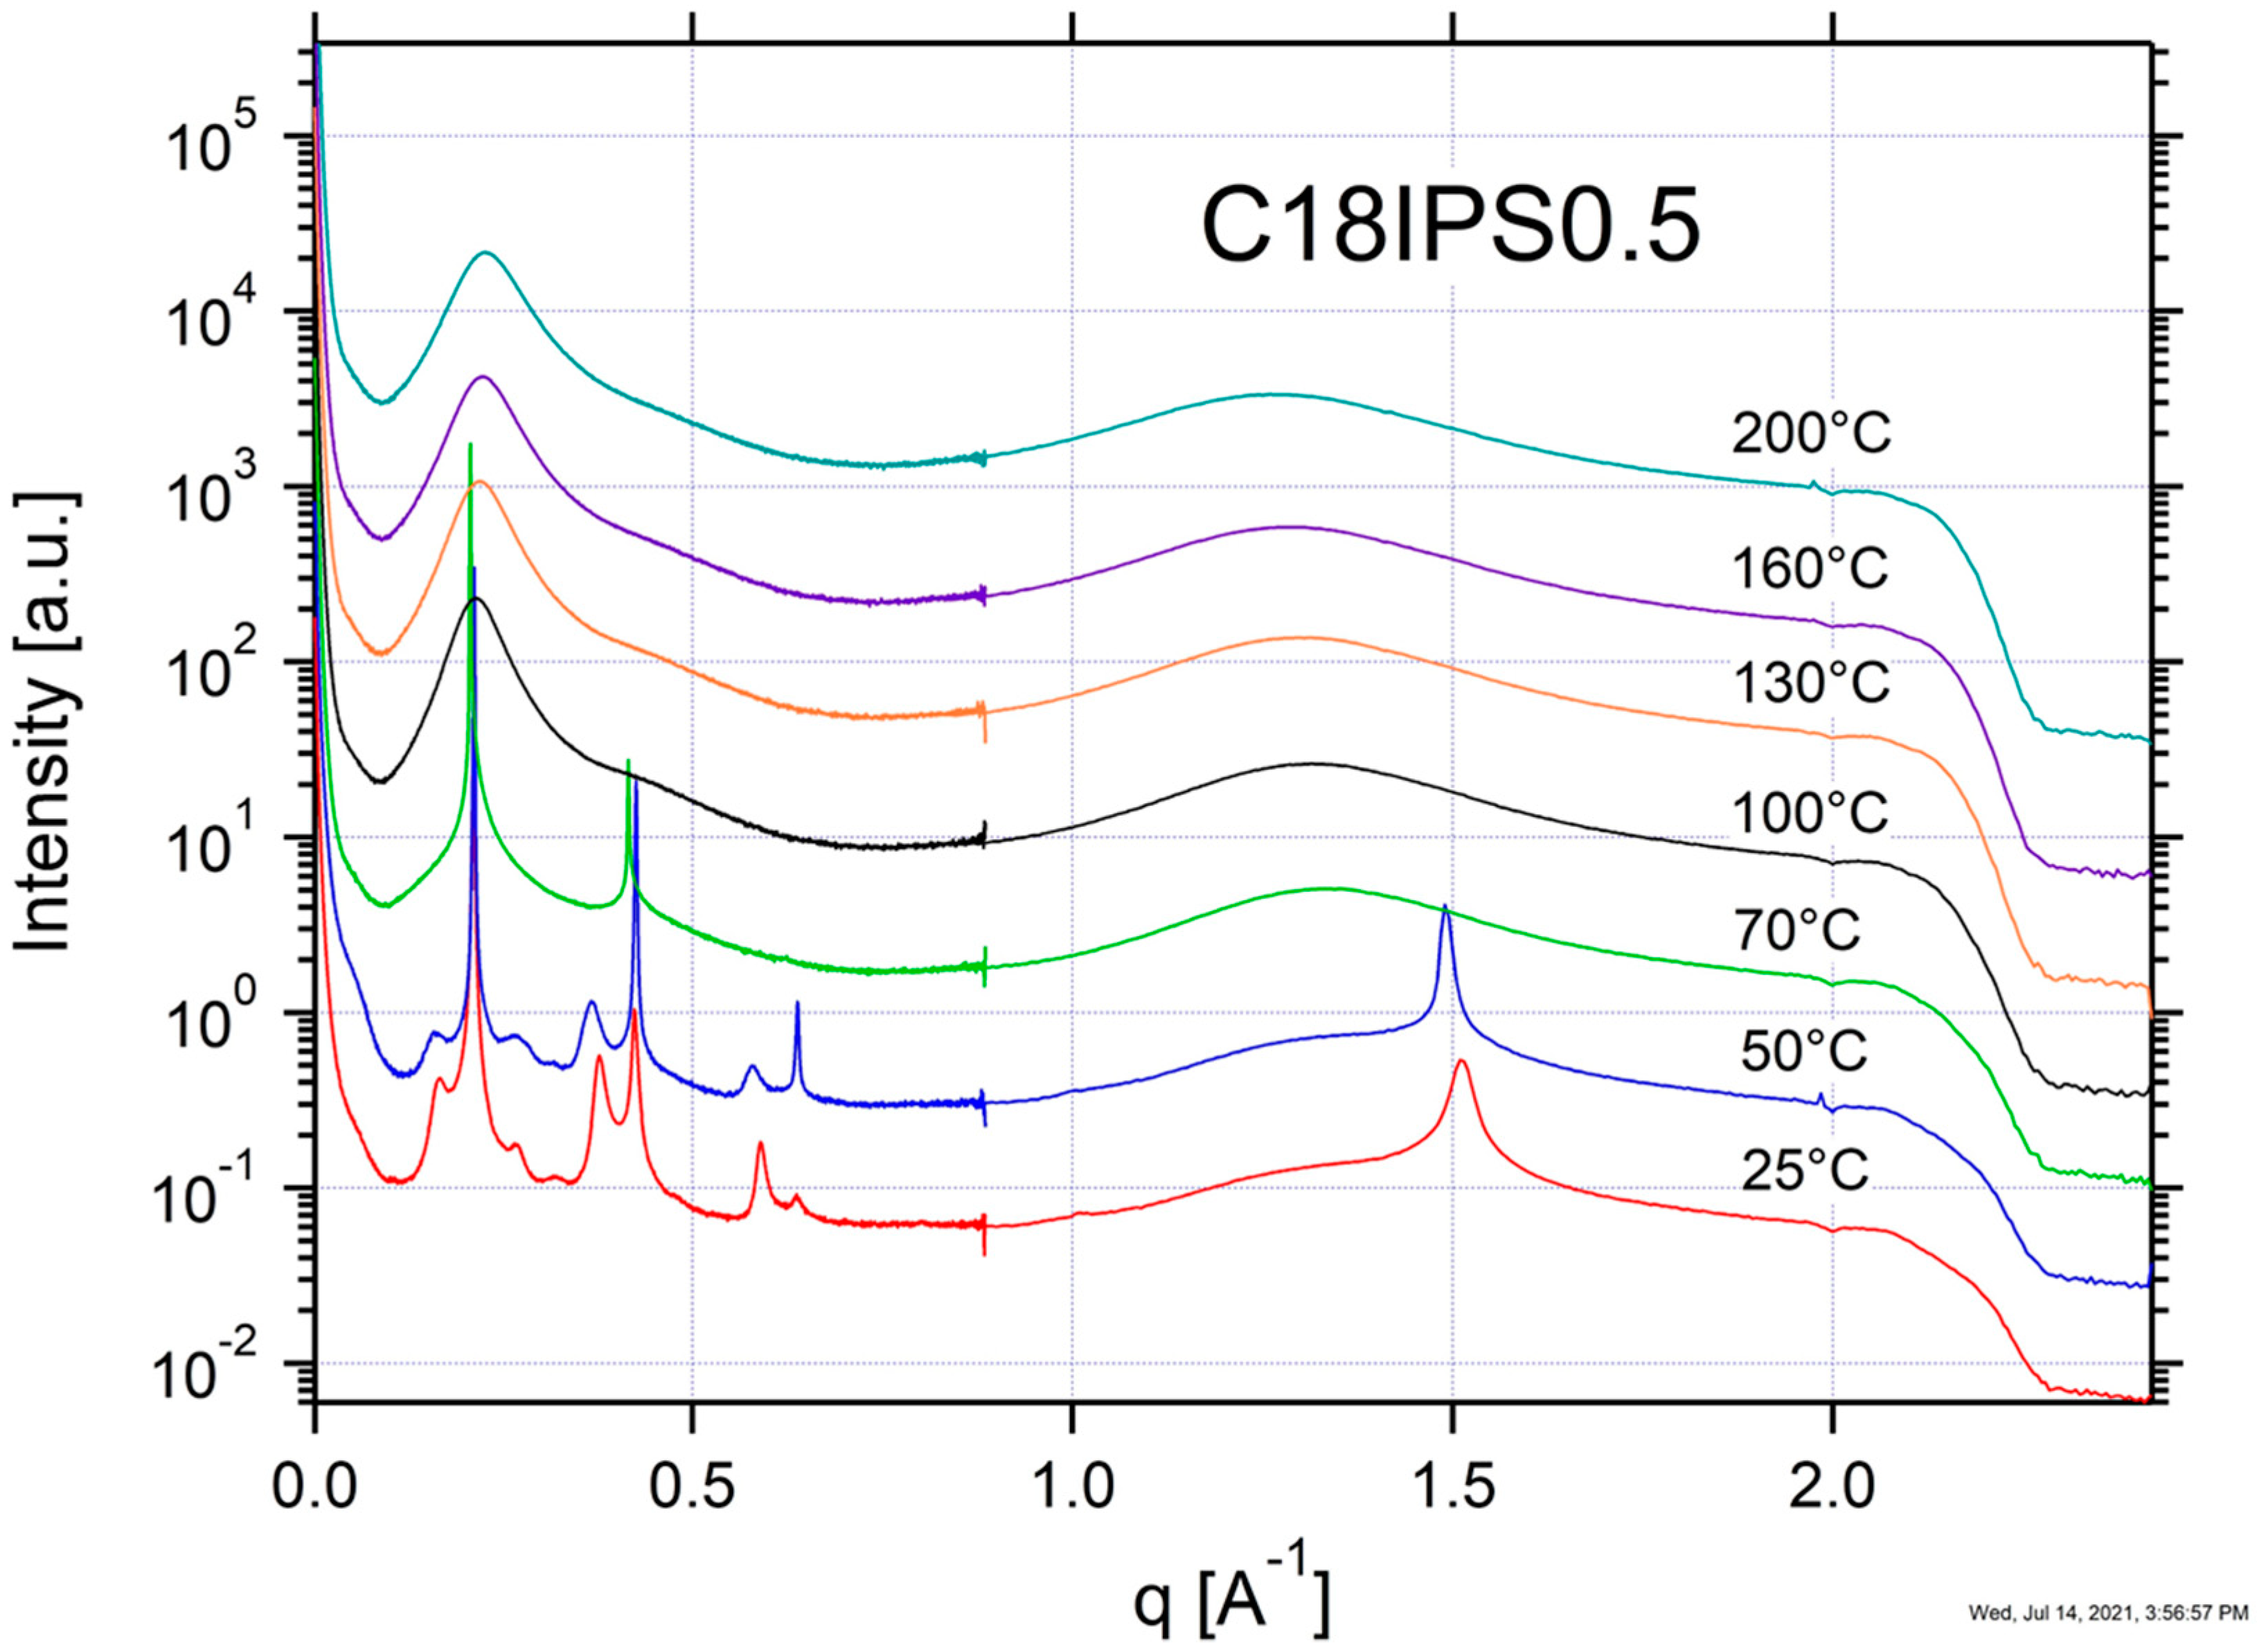
| Material | 200 °C | 160 °C | 130 °C | 100 °C | 70 °C | 50 °C | 25 °C | q (Å−1) (70 °C) | d = 2π/q (Å) |
|---|---|---|---|---|---|---|---|---|---|
| C18IPS0.05 | ISO | SM | SM | SM | SM | CRYSTAL | CRYSTAL | 0.21 | 30 |
| C18IPS0.1 | ISO | SM | SM | SM | SM | CRYSTAL | CRYSTAL | 0.21 | 30 |
| C18IPS0.2 | ISO | ISO | SM | SM | SM | CRYSTAL | CRYSTAL | 0.21 | 30 |
| C18IPS0.3 | ISO | ISO | ISO | SM | SM | CRYSTAL | CRYSTAL | 0.21 | 30 |
| C18IPS0.5 | ISO | ISO | ISO | ISO | SM | CRYSTAL | CRYSTAL | 0.21 | 30 |
| C18IPS1.0 | ISO | ISO | ISO | ISO | CRYSTAL | CRYSTAL | CRYSTAL | 0.21 | 30 |
| C18IPS | ISO | ISO | ISO | ISO | ISO | CRYSTAL | CRYSTAL | 0.15 | 42 |
| Temperature | 30 °C | 60 °C | 120 °C | 135 °C | 210 °C |
|---|---|---|---|---|---|
| C18LiTFSI | 2.4 × 10⁻⁸ | 2.1 × 10⁻⁵ | 2.4 × 10⁻⁴ | 3.5 × 10⁻⁴ | 1.2 × 10⁻³ |
| C18MS0.05 | 9.8 × 10⁻⁷ | 2.4 × 10⁻⁵ | 1.9 × 10⁻⁴ | 2.6 × 10⁻⁴ | — |
| C18MS0.3 | 1.5 × 10⁻⁶ | 3.1 × 10⁻⁵ | 2.1 × 10⁻⁴ | 2.8 × 10⁻⁴ | — |
| C18MS1.0 | 2.2 × 10⁻⁹ | 8.1 × 10⁻⁶ | 7.9 × 10⁻⁵ | 1.1 × 10⁻⁴ | — |
| C18ES0.05 | 5.2 × 10⁻¹⁰ | 2.2 × 10⁻⁵ | 3.4 × 10⁻⁵ | — | 3.7 × 10⁻⁴ |
| C18IPS0.05 | 1.3 × 10⁻¹² | 3.6 × 10⁻⁵ | 3.0 × 10⁻⁵ | 5.4 × 10⁻⁵ | 3.1 × 10⁻⁴ |
| C18ES0.3 | 3.3 × 10⁻¹⁰ | 1.8 × 10⁻⁶ | 4.8 × 10⁻⁵ | 8.0 × 10⁻⁵ | 4.2 × 10⁻⁴ |
| C18IPS0.3 | — | 5.9 × 10⁻⁷ | 2.2 × 10⁻⁵ | 3.6 × 10⁻⁵ | 1.8 × 10⁻⁴ |
| Material | σ0 (S/cm) | Ea (kJ/mol) |
|---|---|---|
| C18LiTFSI | 6.31 × 10¹⁶ ± 1.1 × 10¹⁵ | 141 ± 2 |
| C18MS0.05 | 5.17 × 10² ± 2.9 × 101 | 49.6 ± 0.8 |
| C18MS0.3 | 1.22 × 10¹¹ ± 2 × 10⁹ | 98.2 ± 0.6 |
| C18MS1.0 | 1.62 × 1030 ± 3 × 1028 | 225 ± 3 |
| C18ES0.05 | 8.03 × 1025 ± 3.6 × 1024 | 204 ± 7 |
| C18ES0.3 | 3.44 × 1033 ± 1.7 × 1032 | 250 ± 10 |
Publisher’s Note: MDPI stays neutral with regard to jurisdictional claims in published maps and institutional affiliations. |
© 2022 by the authors. Licensee MDPI, Basel, Switzerland. This article is an open access article distributed under the terms and conditions of the Creative Commons Attribution (CC BY) license (https://creativecommons.org/licenses/by/4.0/).
Share and Cite
Collins, H.; Liu, J.; Yang, L.; Schaefer, J.L. Phase Behavior and Ionic Conductivity of Blended, Ion-Condensed Electrolytes with Ordered Morphologies. Appl. Sci. 2022, 12, 6529. https://doi.org/10.3390/app12136529
Collins H, Liu J, Yang L, Schaefer JL. Phase Behavior and Ionic Conductivity of Blended, Ion-Condensed Electrolytes with Ordered Morphologies. Applied Sciences. 2022; 12(13):6529. https://doi.org/10.3390/app12136529
Chicago/Turabian StyleCollins, Hannah, Jiacheng Liu, Lingyu Yang, and Jennifer L. Schaefer. 2022. "Phase Behavior and Ionic Conductivity of Blended, Ion-Condensed Electrolytes with Ordered Morphologies" Applied Sciences 12, no. 13: 6529. https://doi.org/10.3390/app12136529
APA StyleCollins, H., Liu, J., Yang, L., & Schaefer, J. L. (2022). Phase Behavior and Ionic Conductivity of Blended, Ion-Condensed Electrolytes with Ordered Morphologies. Applied Sciences, 12(13), 6529. https://doi.org/10.3390/app12136529