
Geotechnical Study of Raspadalica Cliff Rockfall, Croatia


Abstract
:1. Introduction
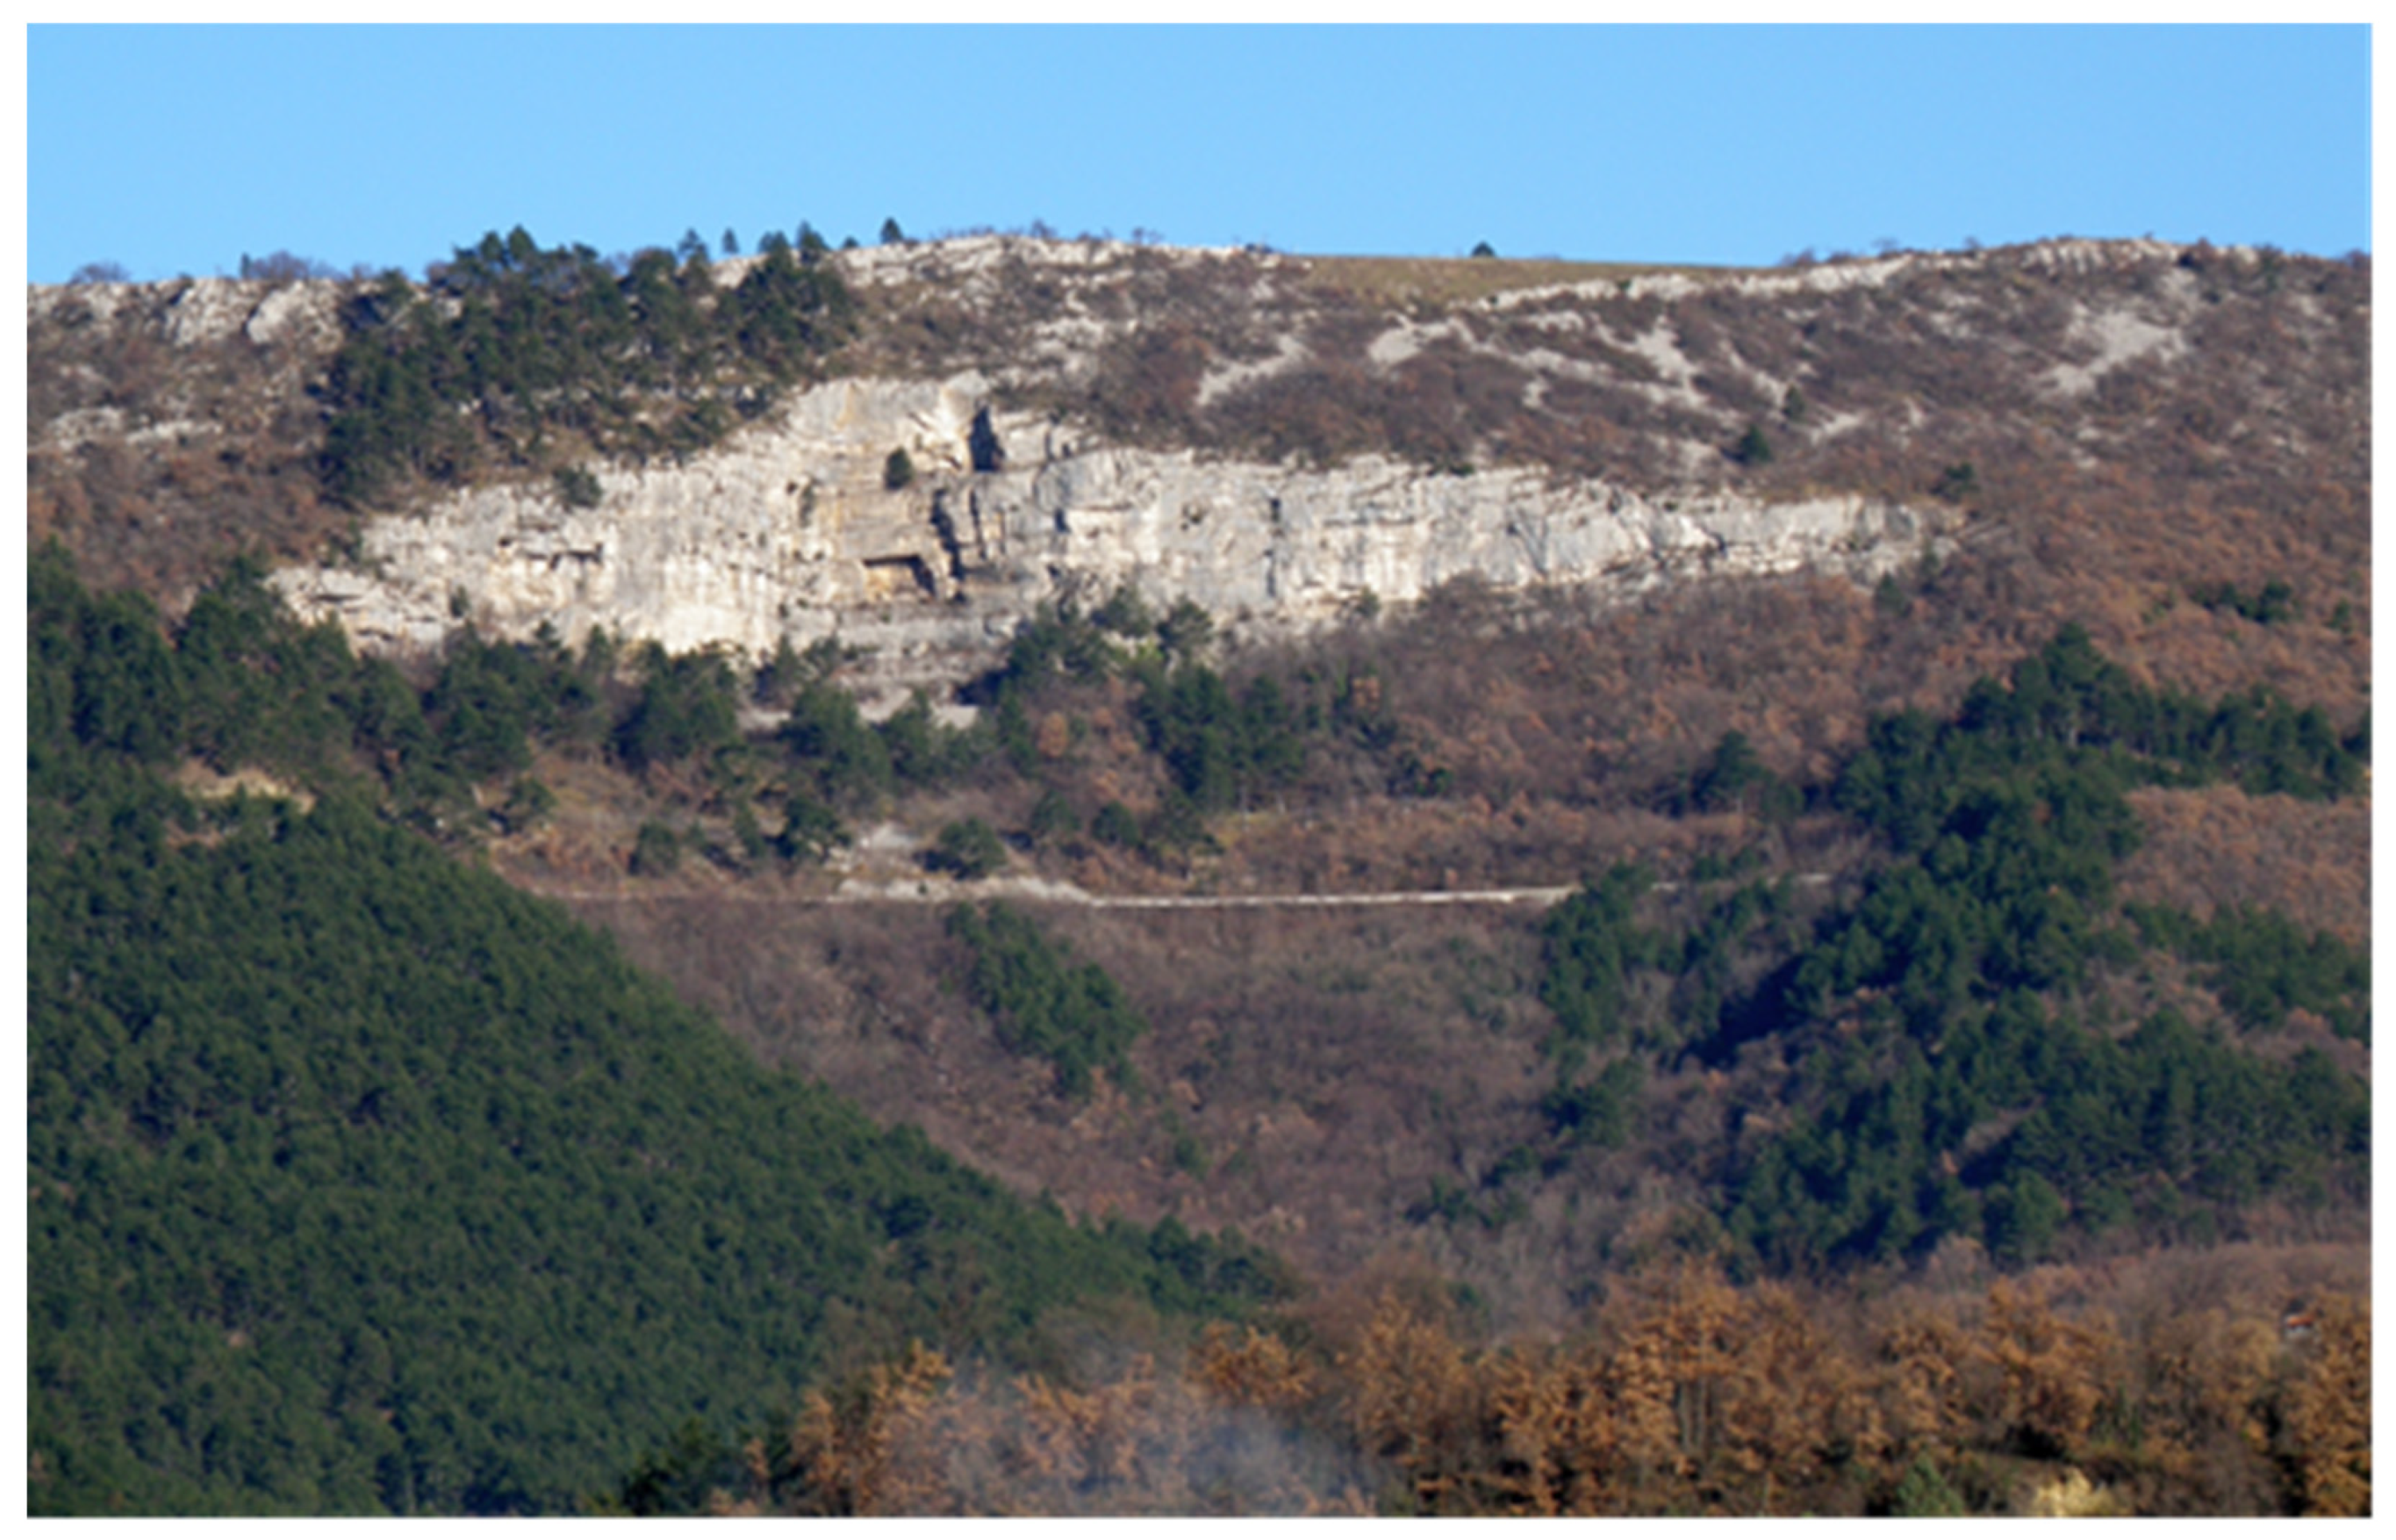
2. Site Description
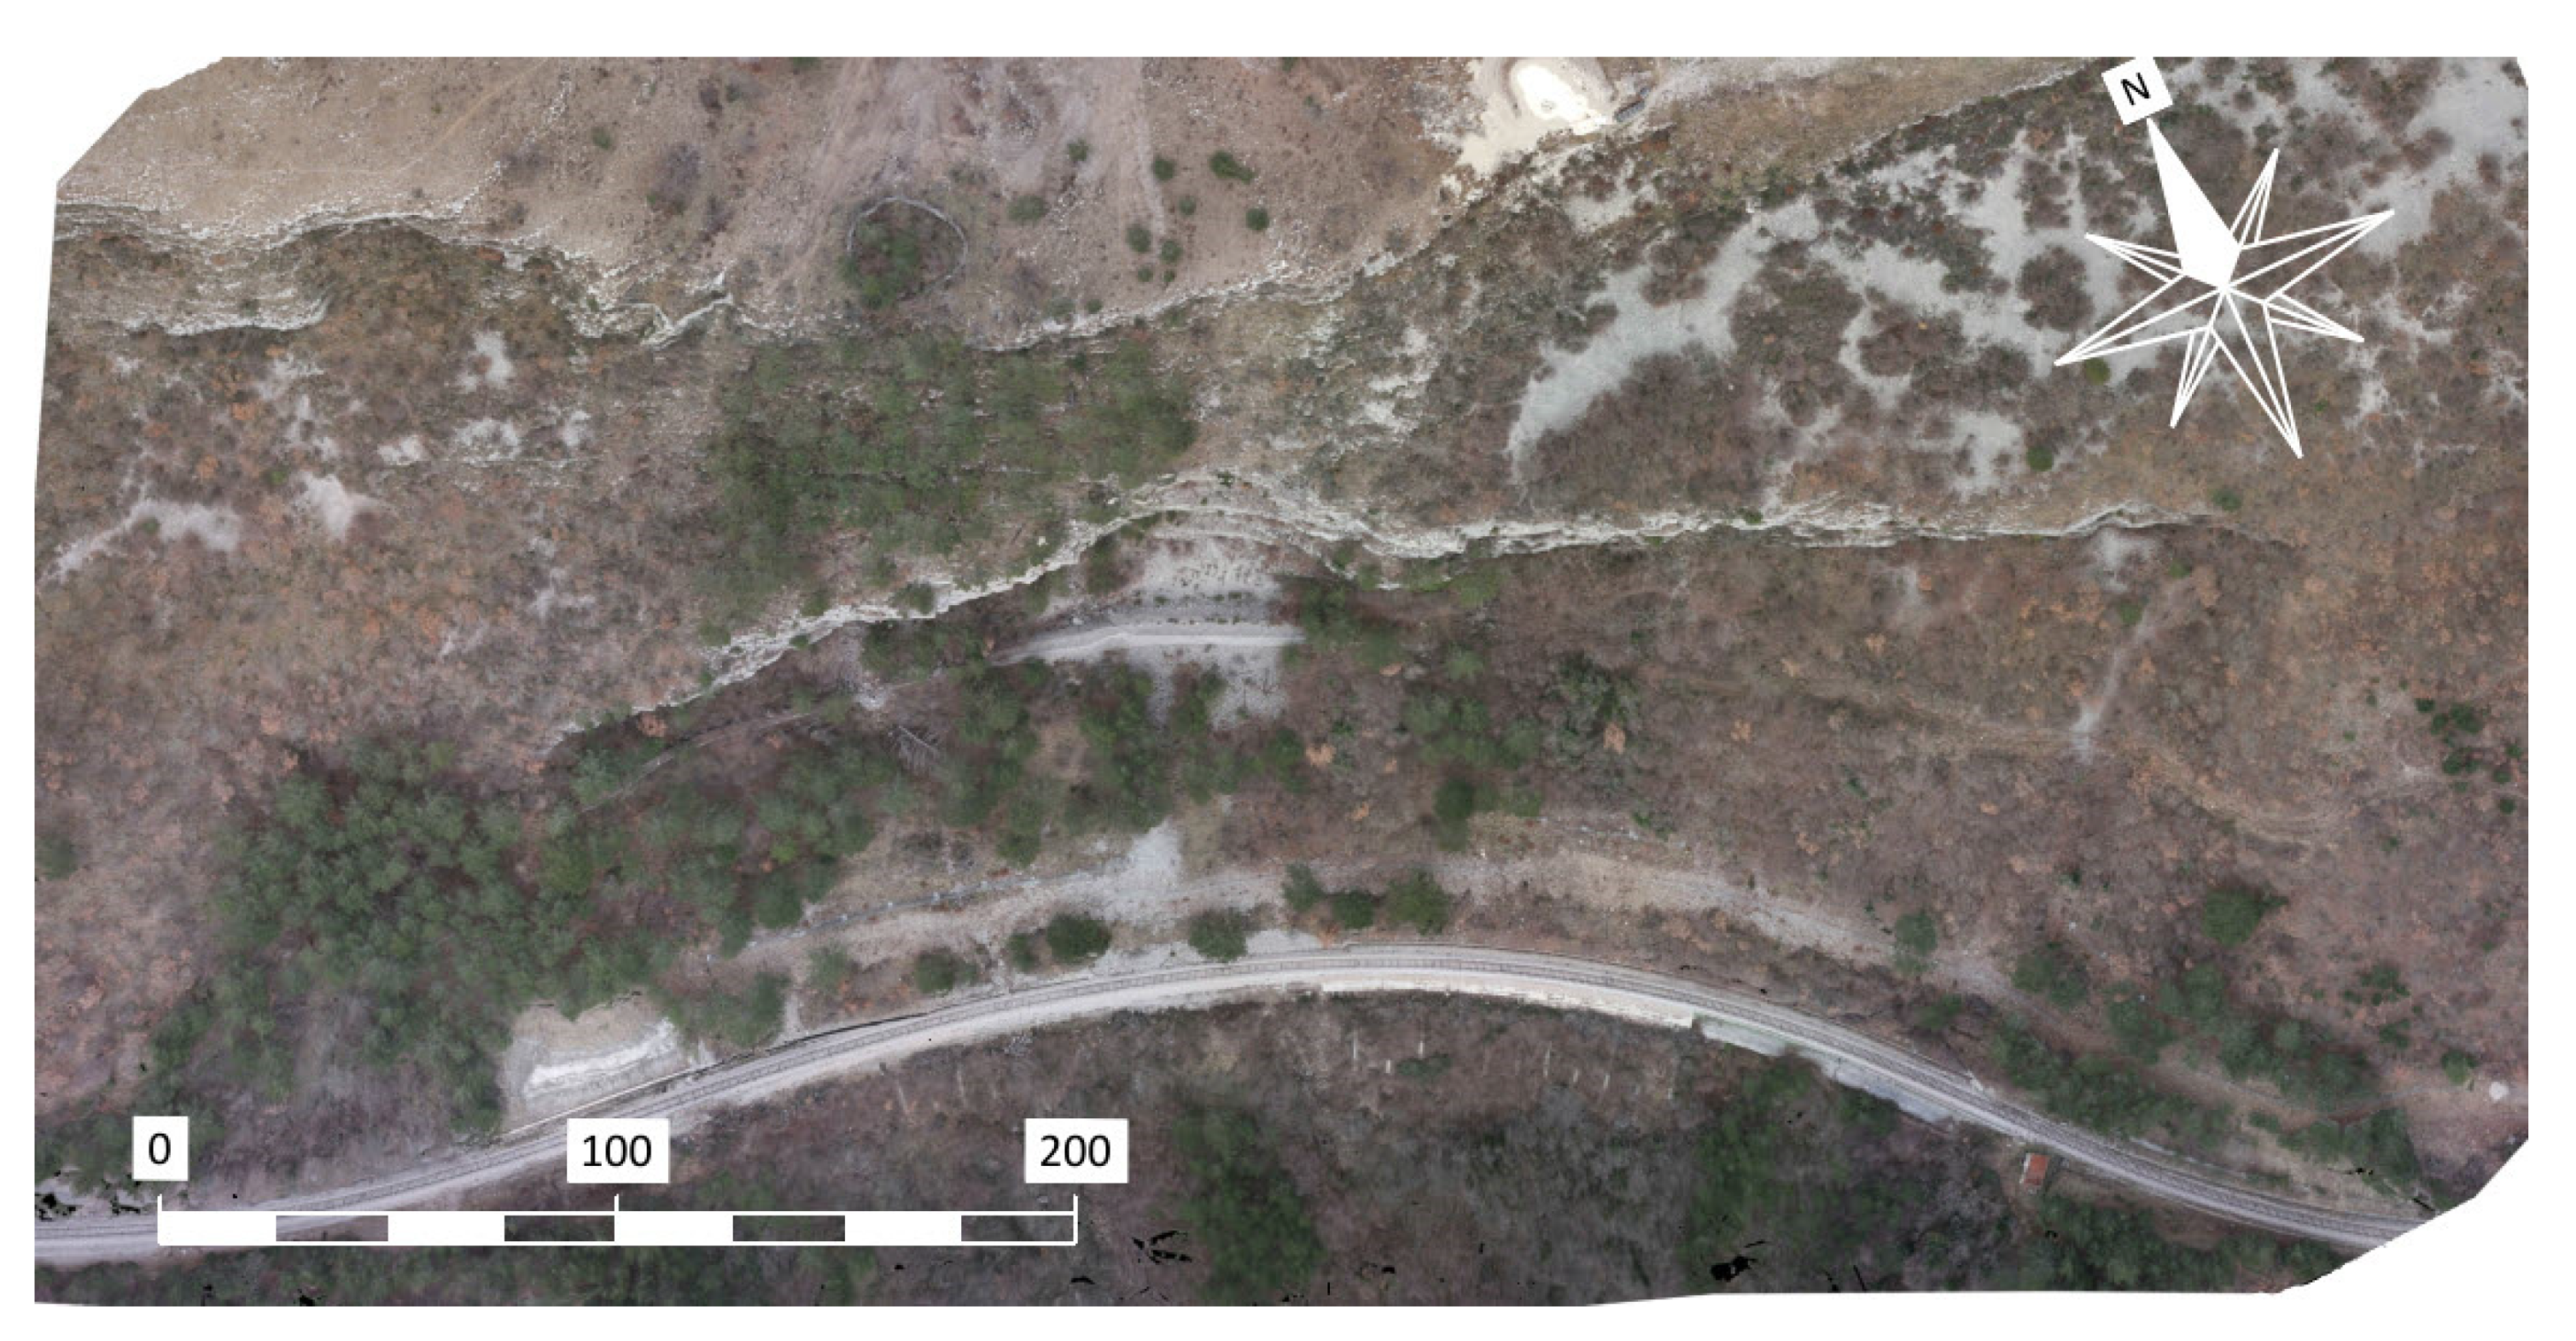
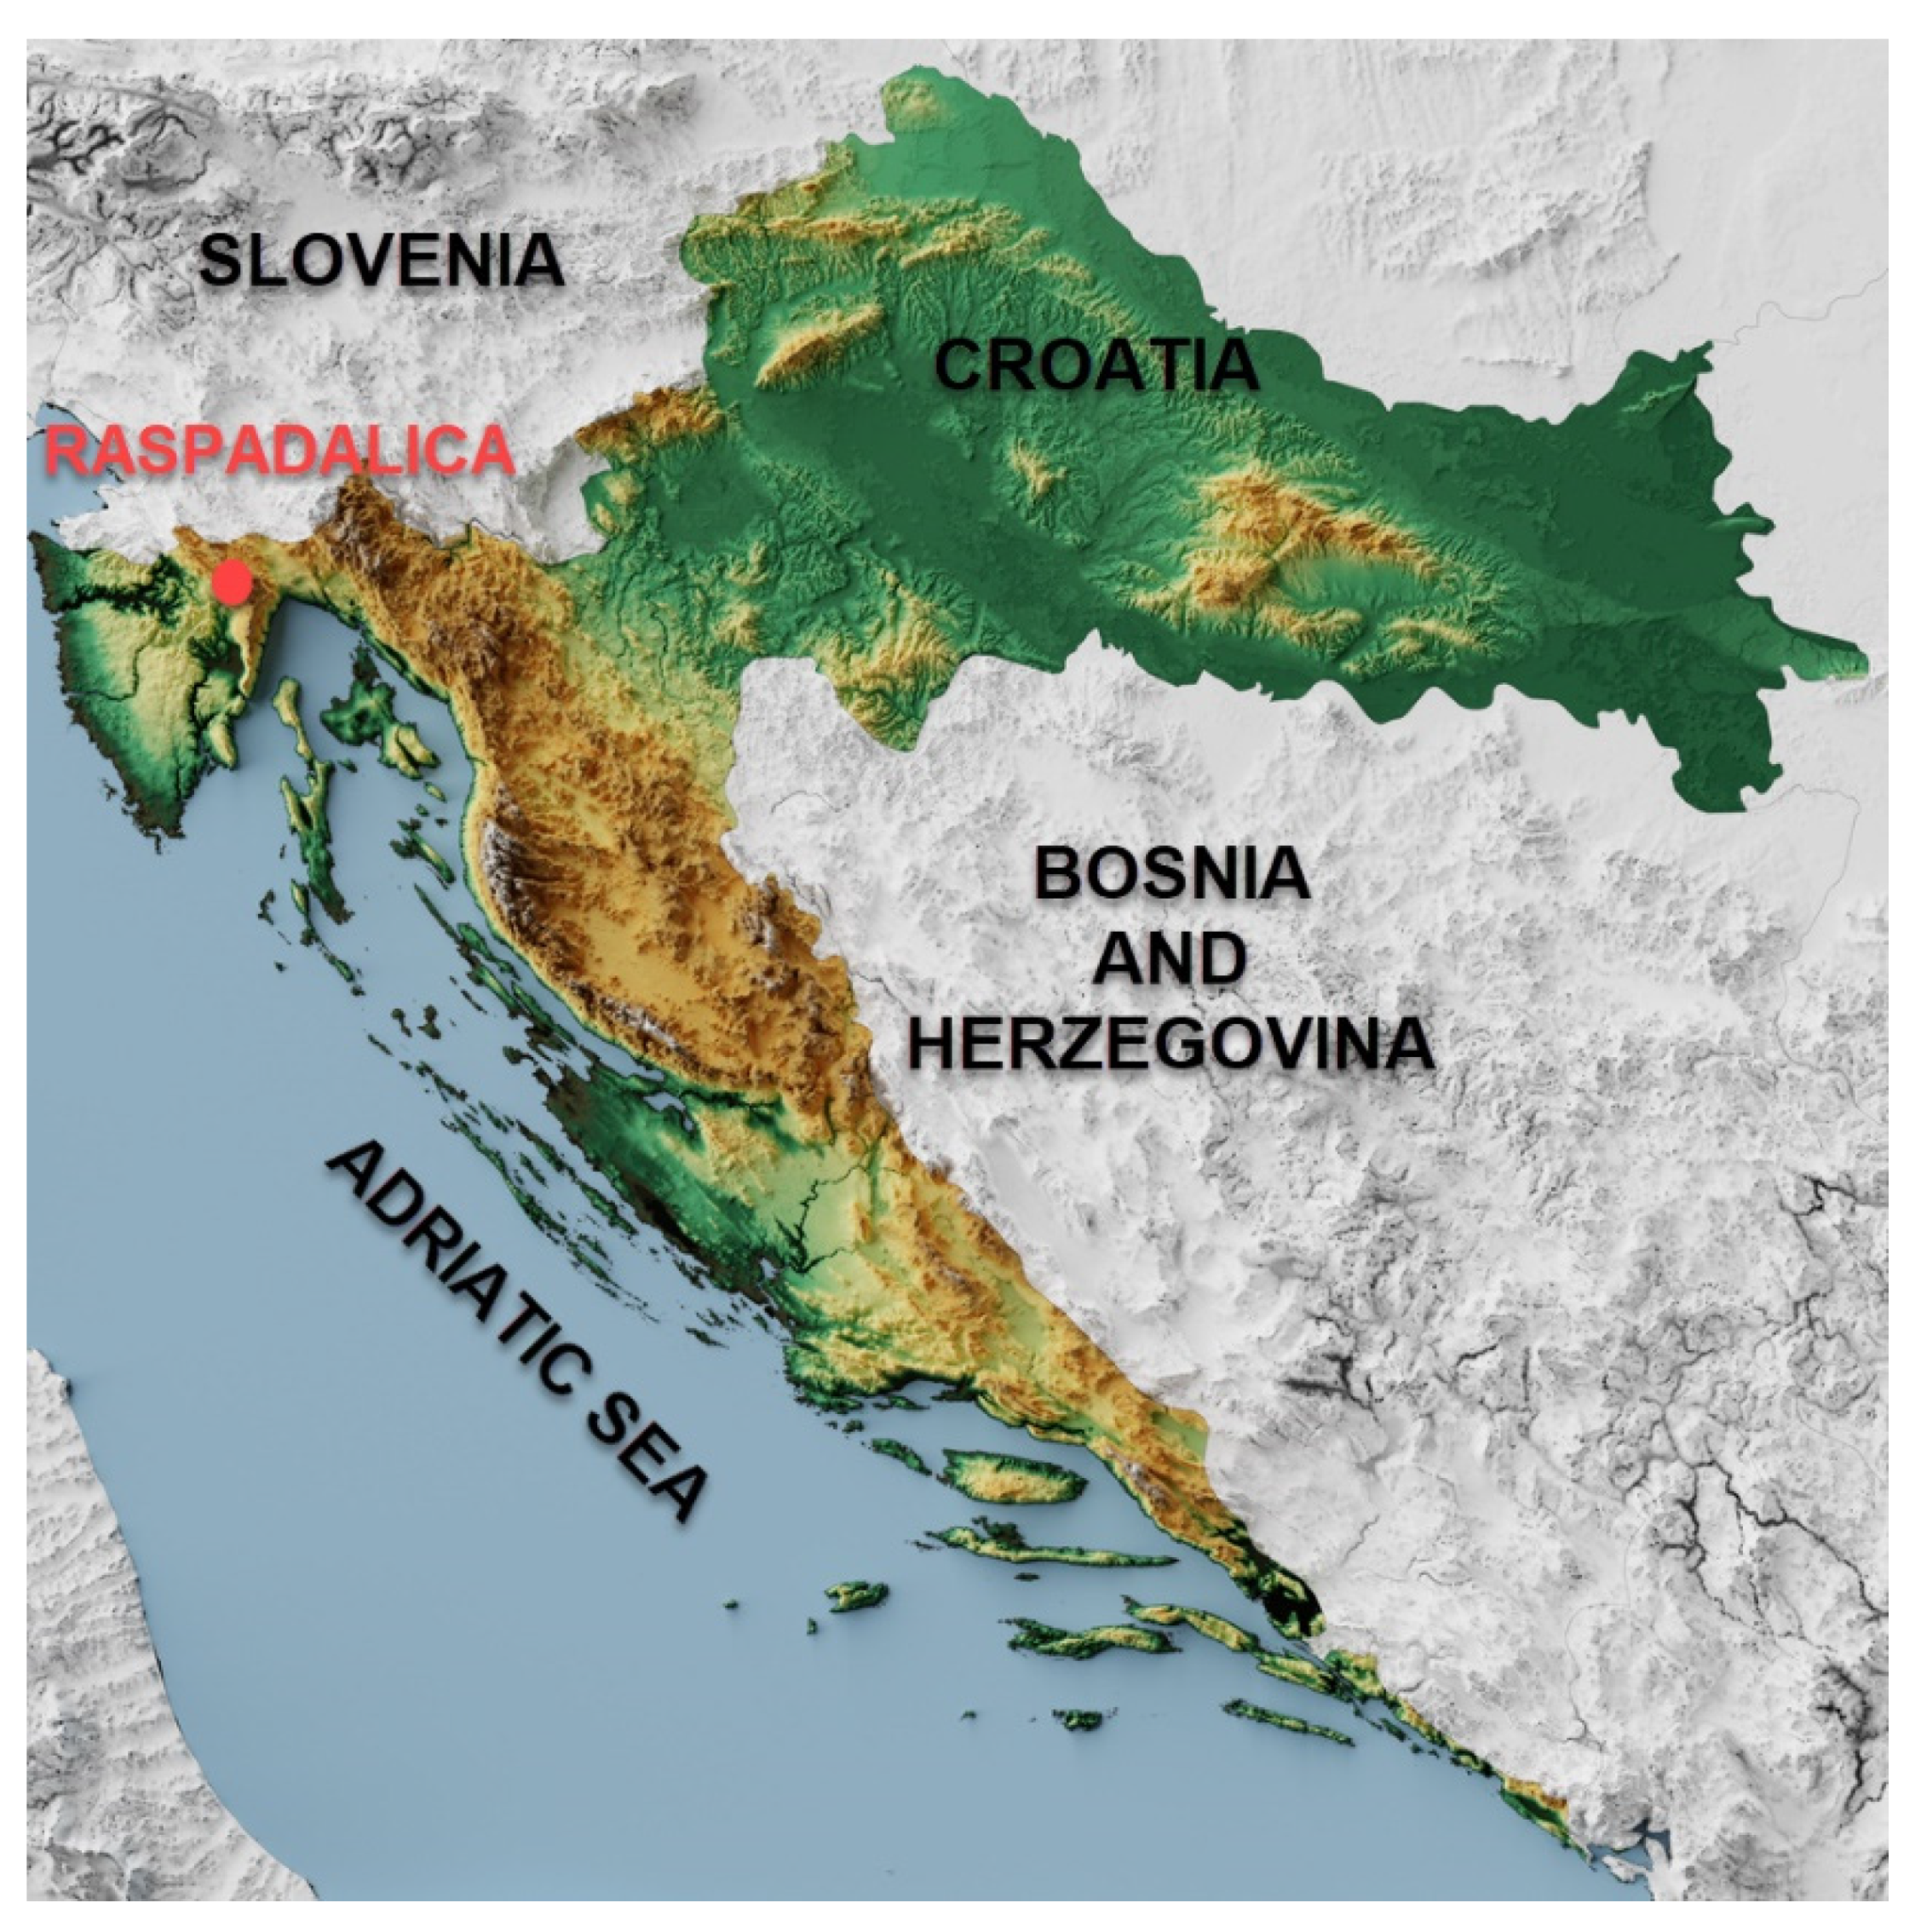
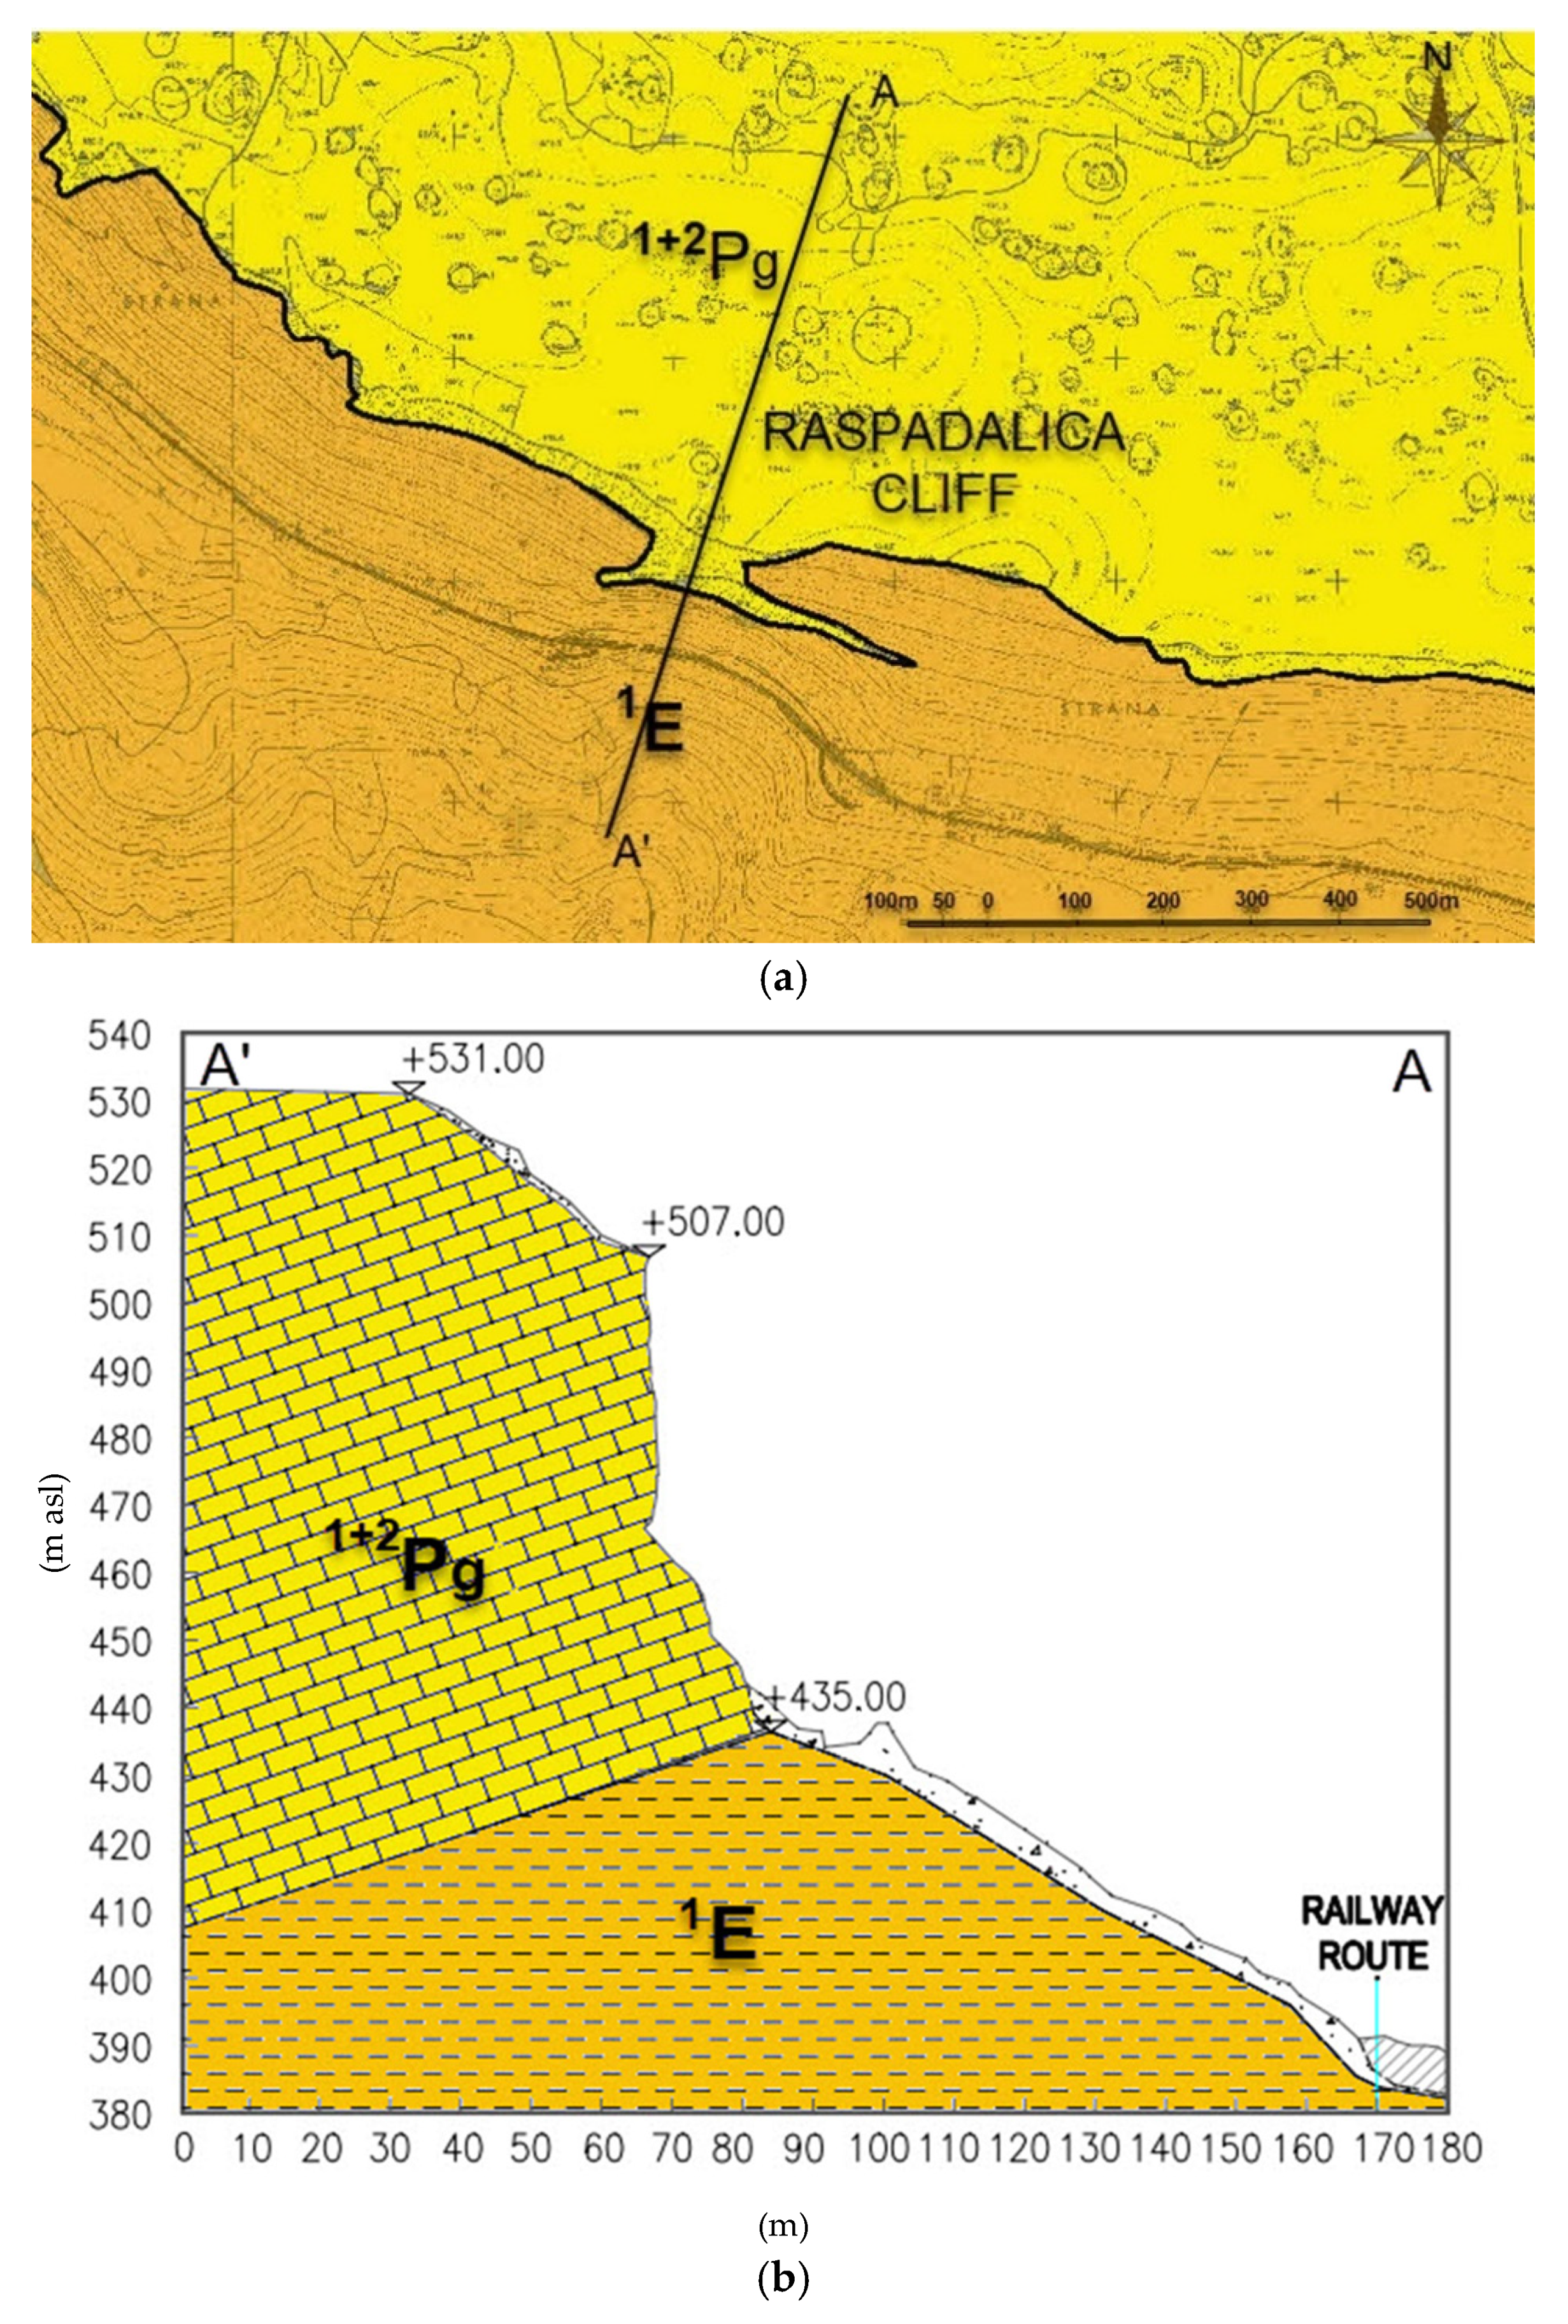
2.1. Geographic and Geological Settings
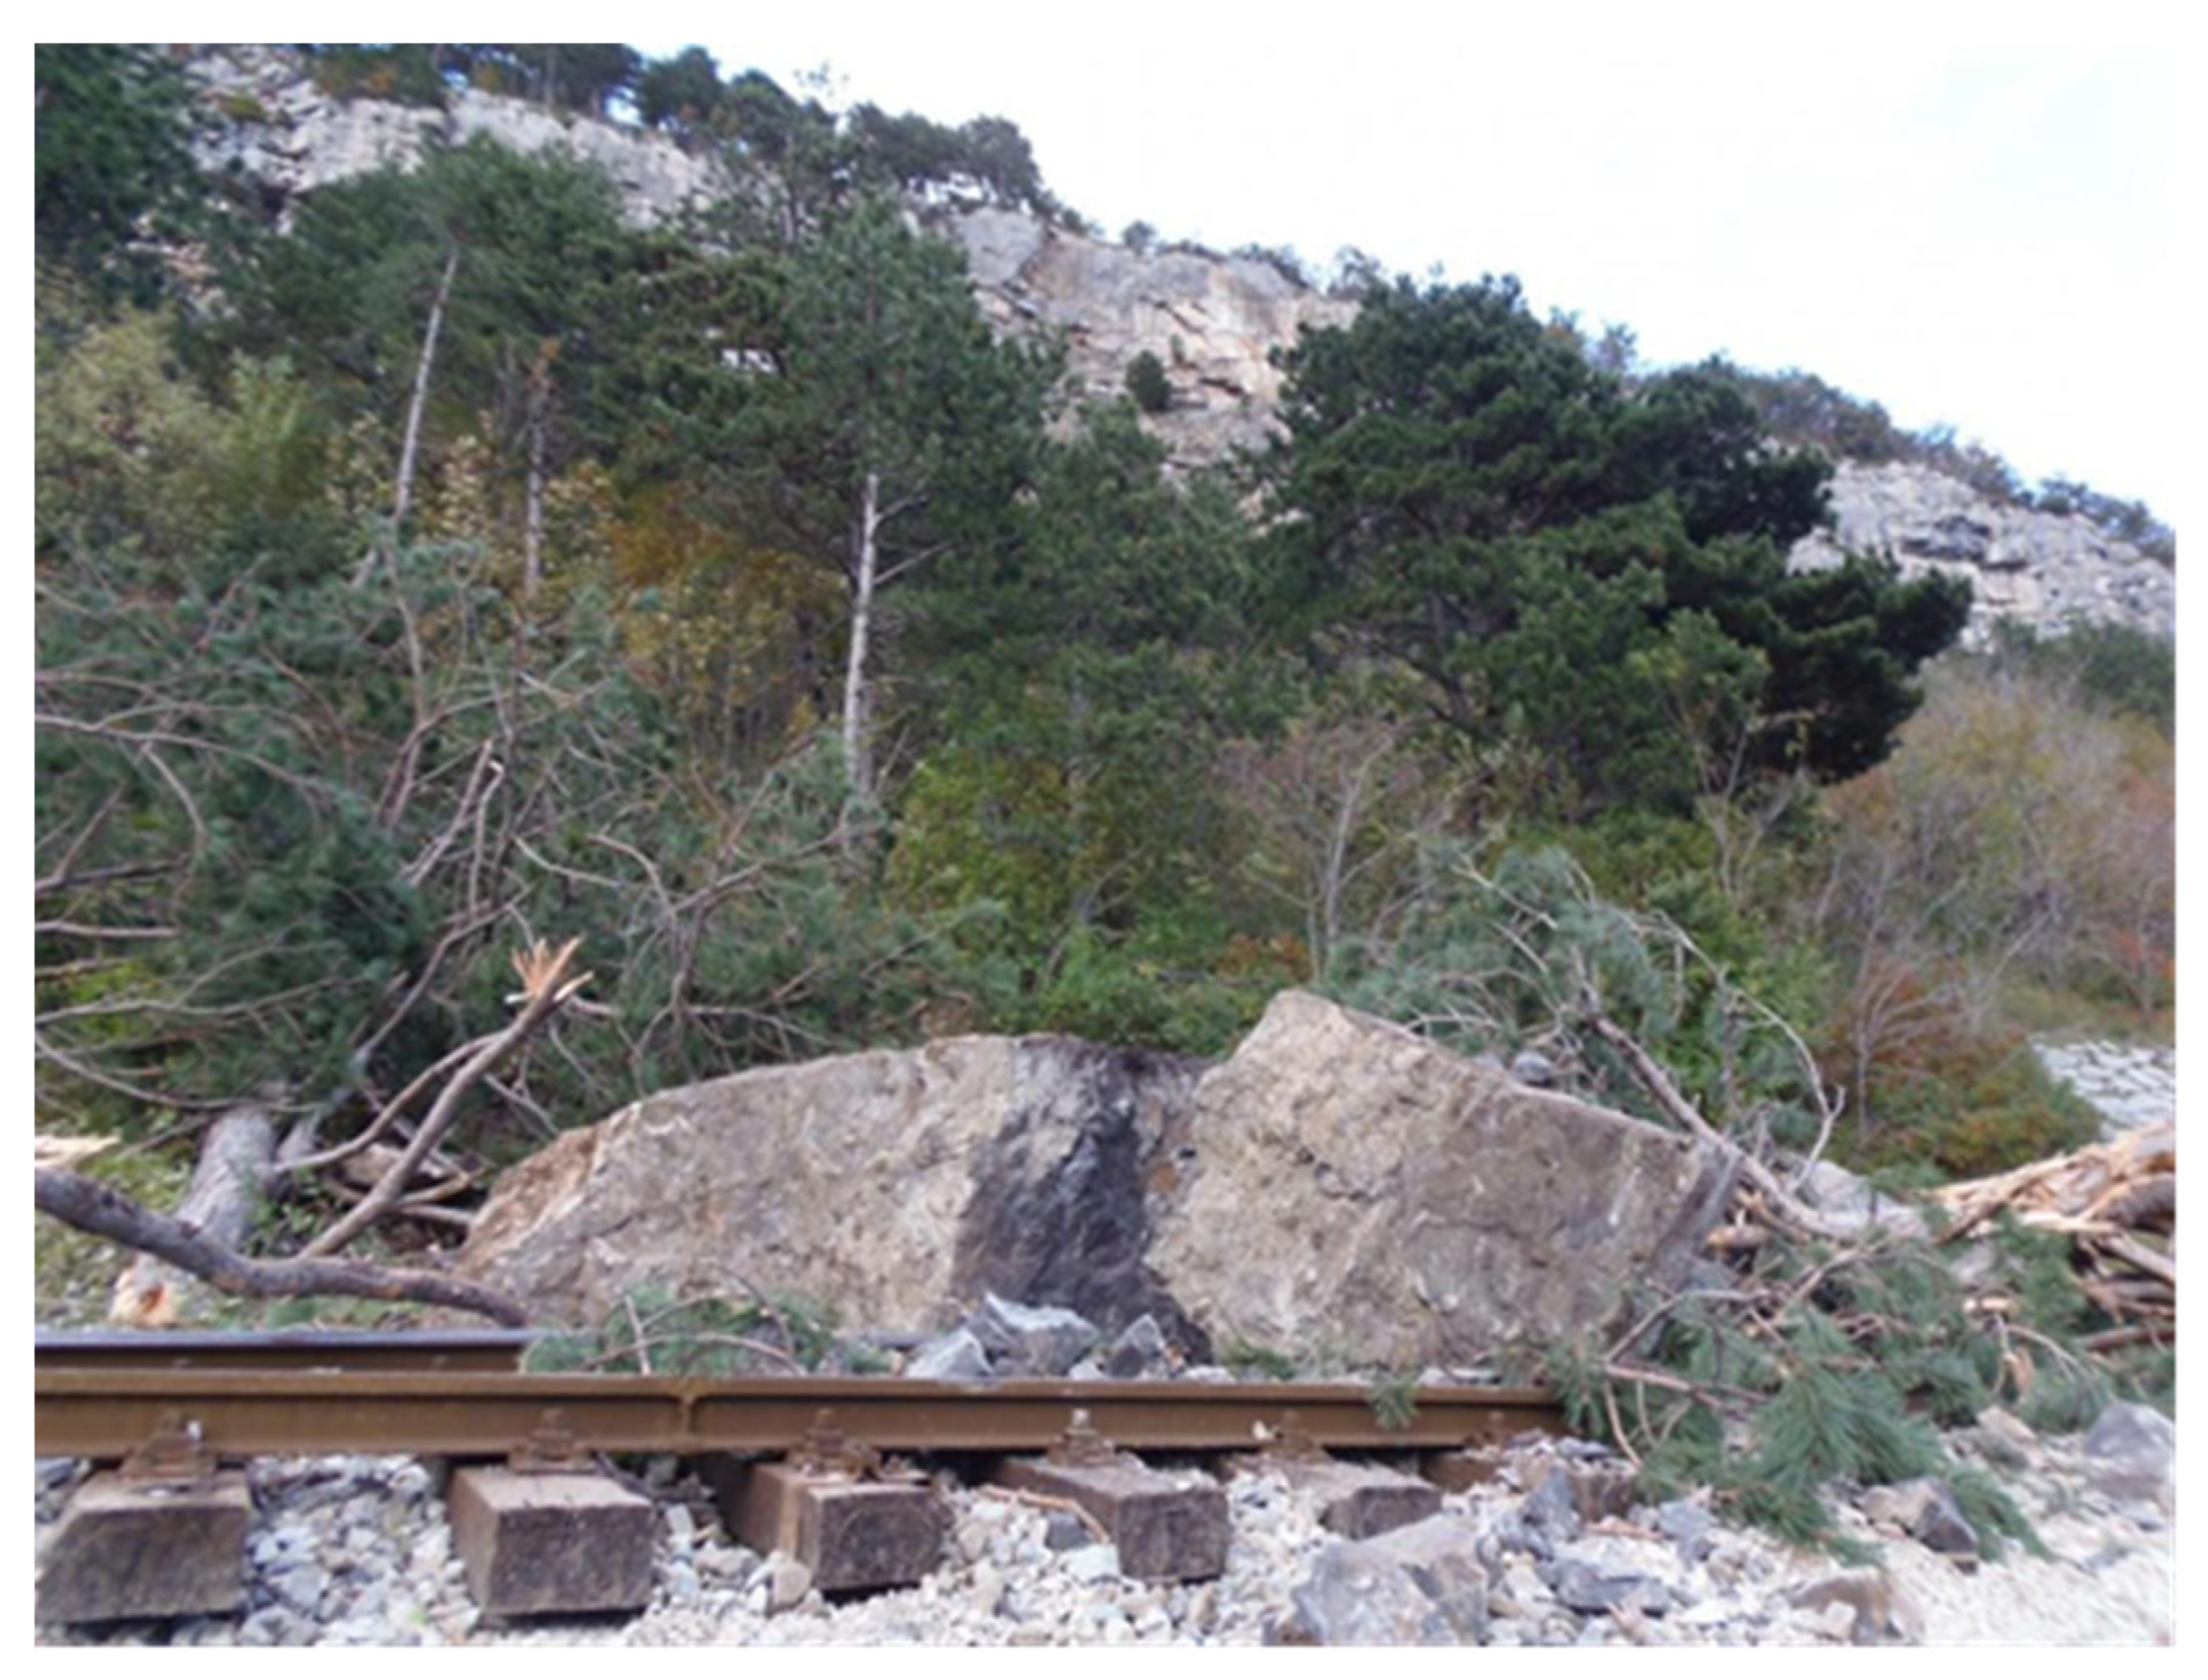
2.2. Raspadalica Cliff Rockfall History
3. Materials and Methods
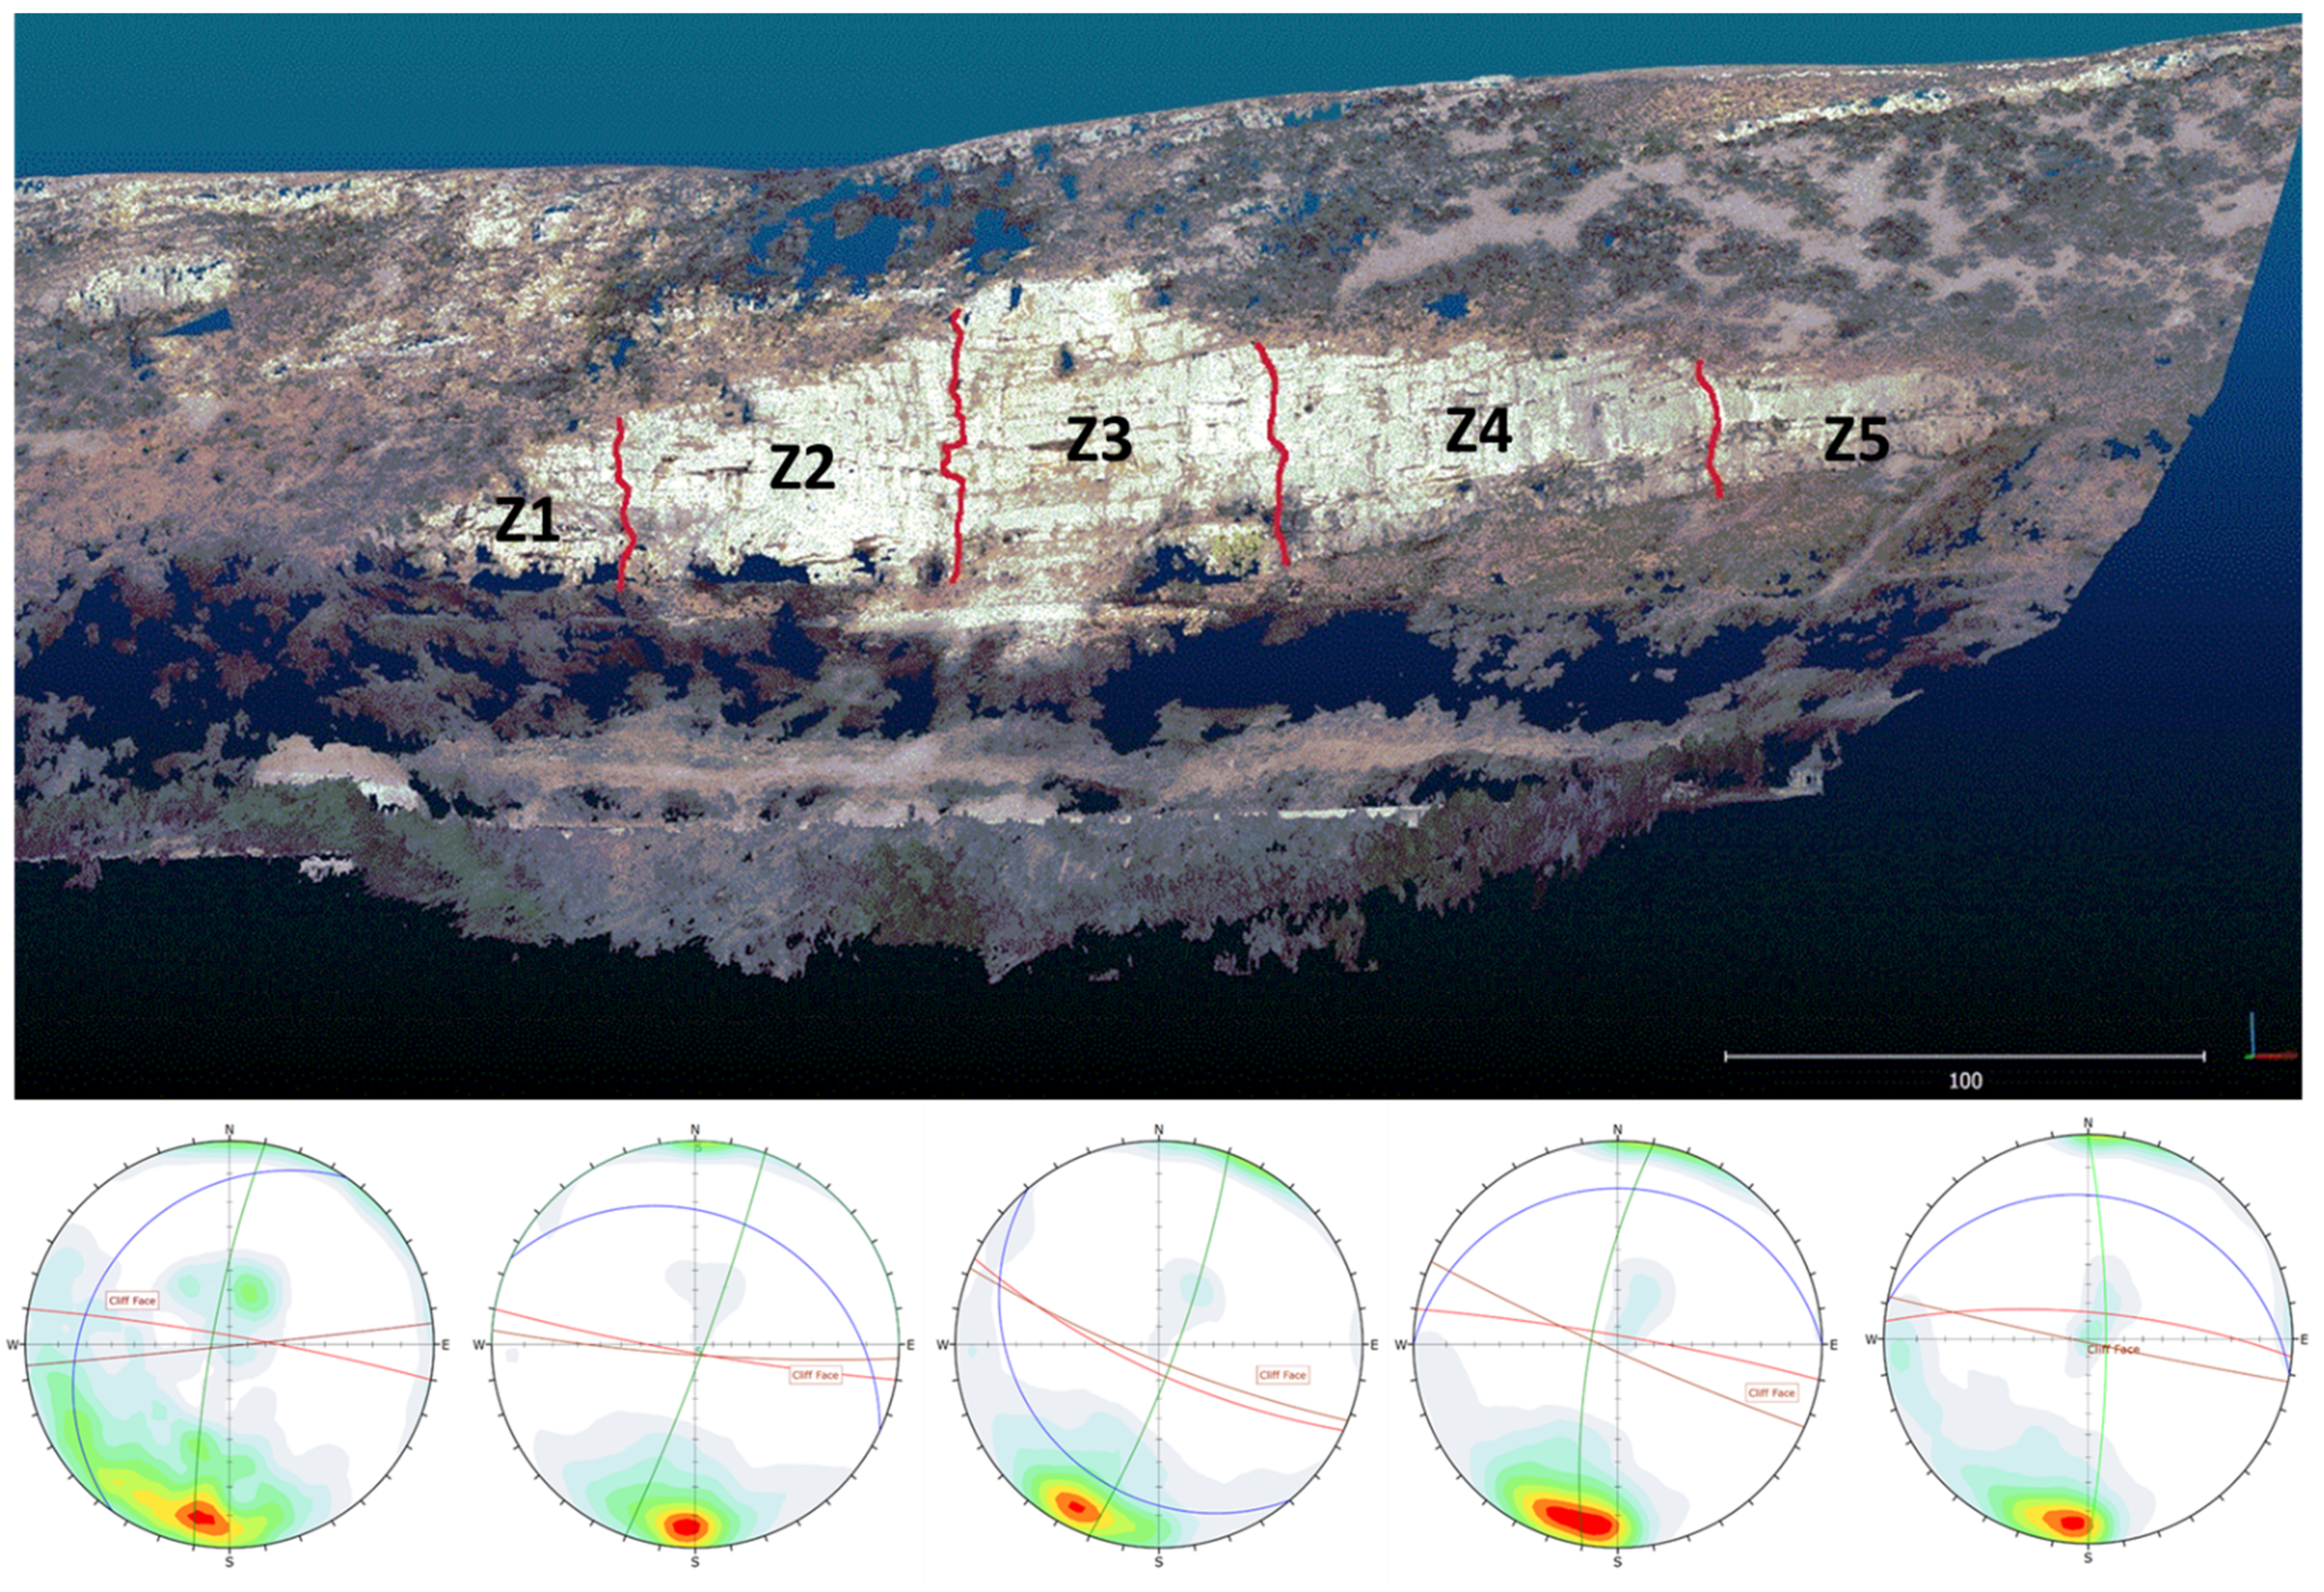
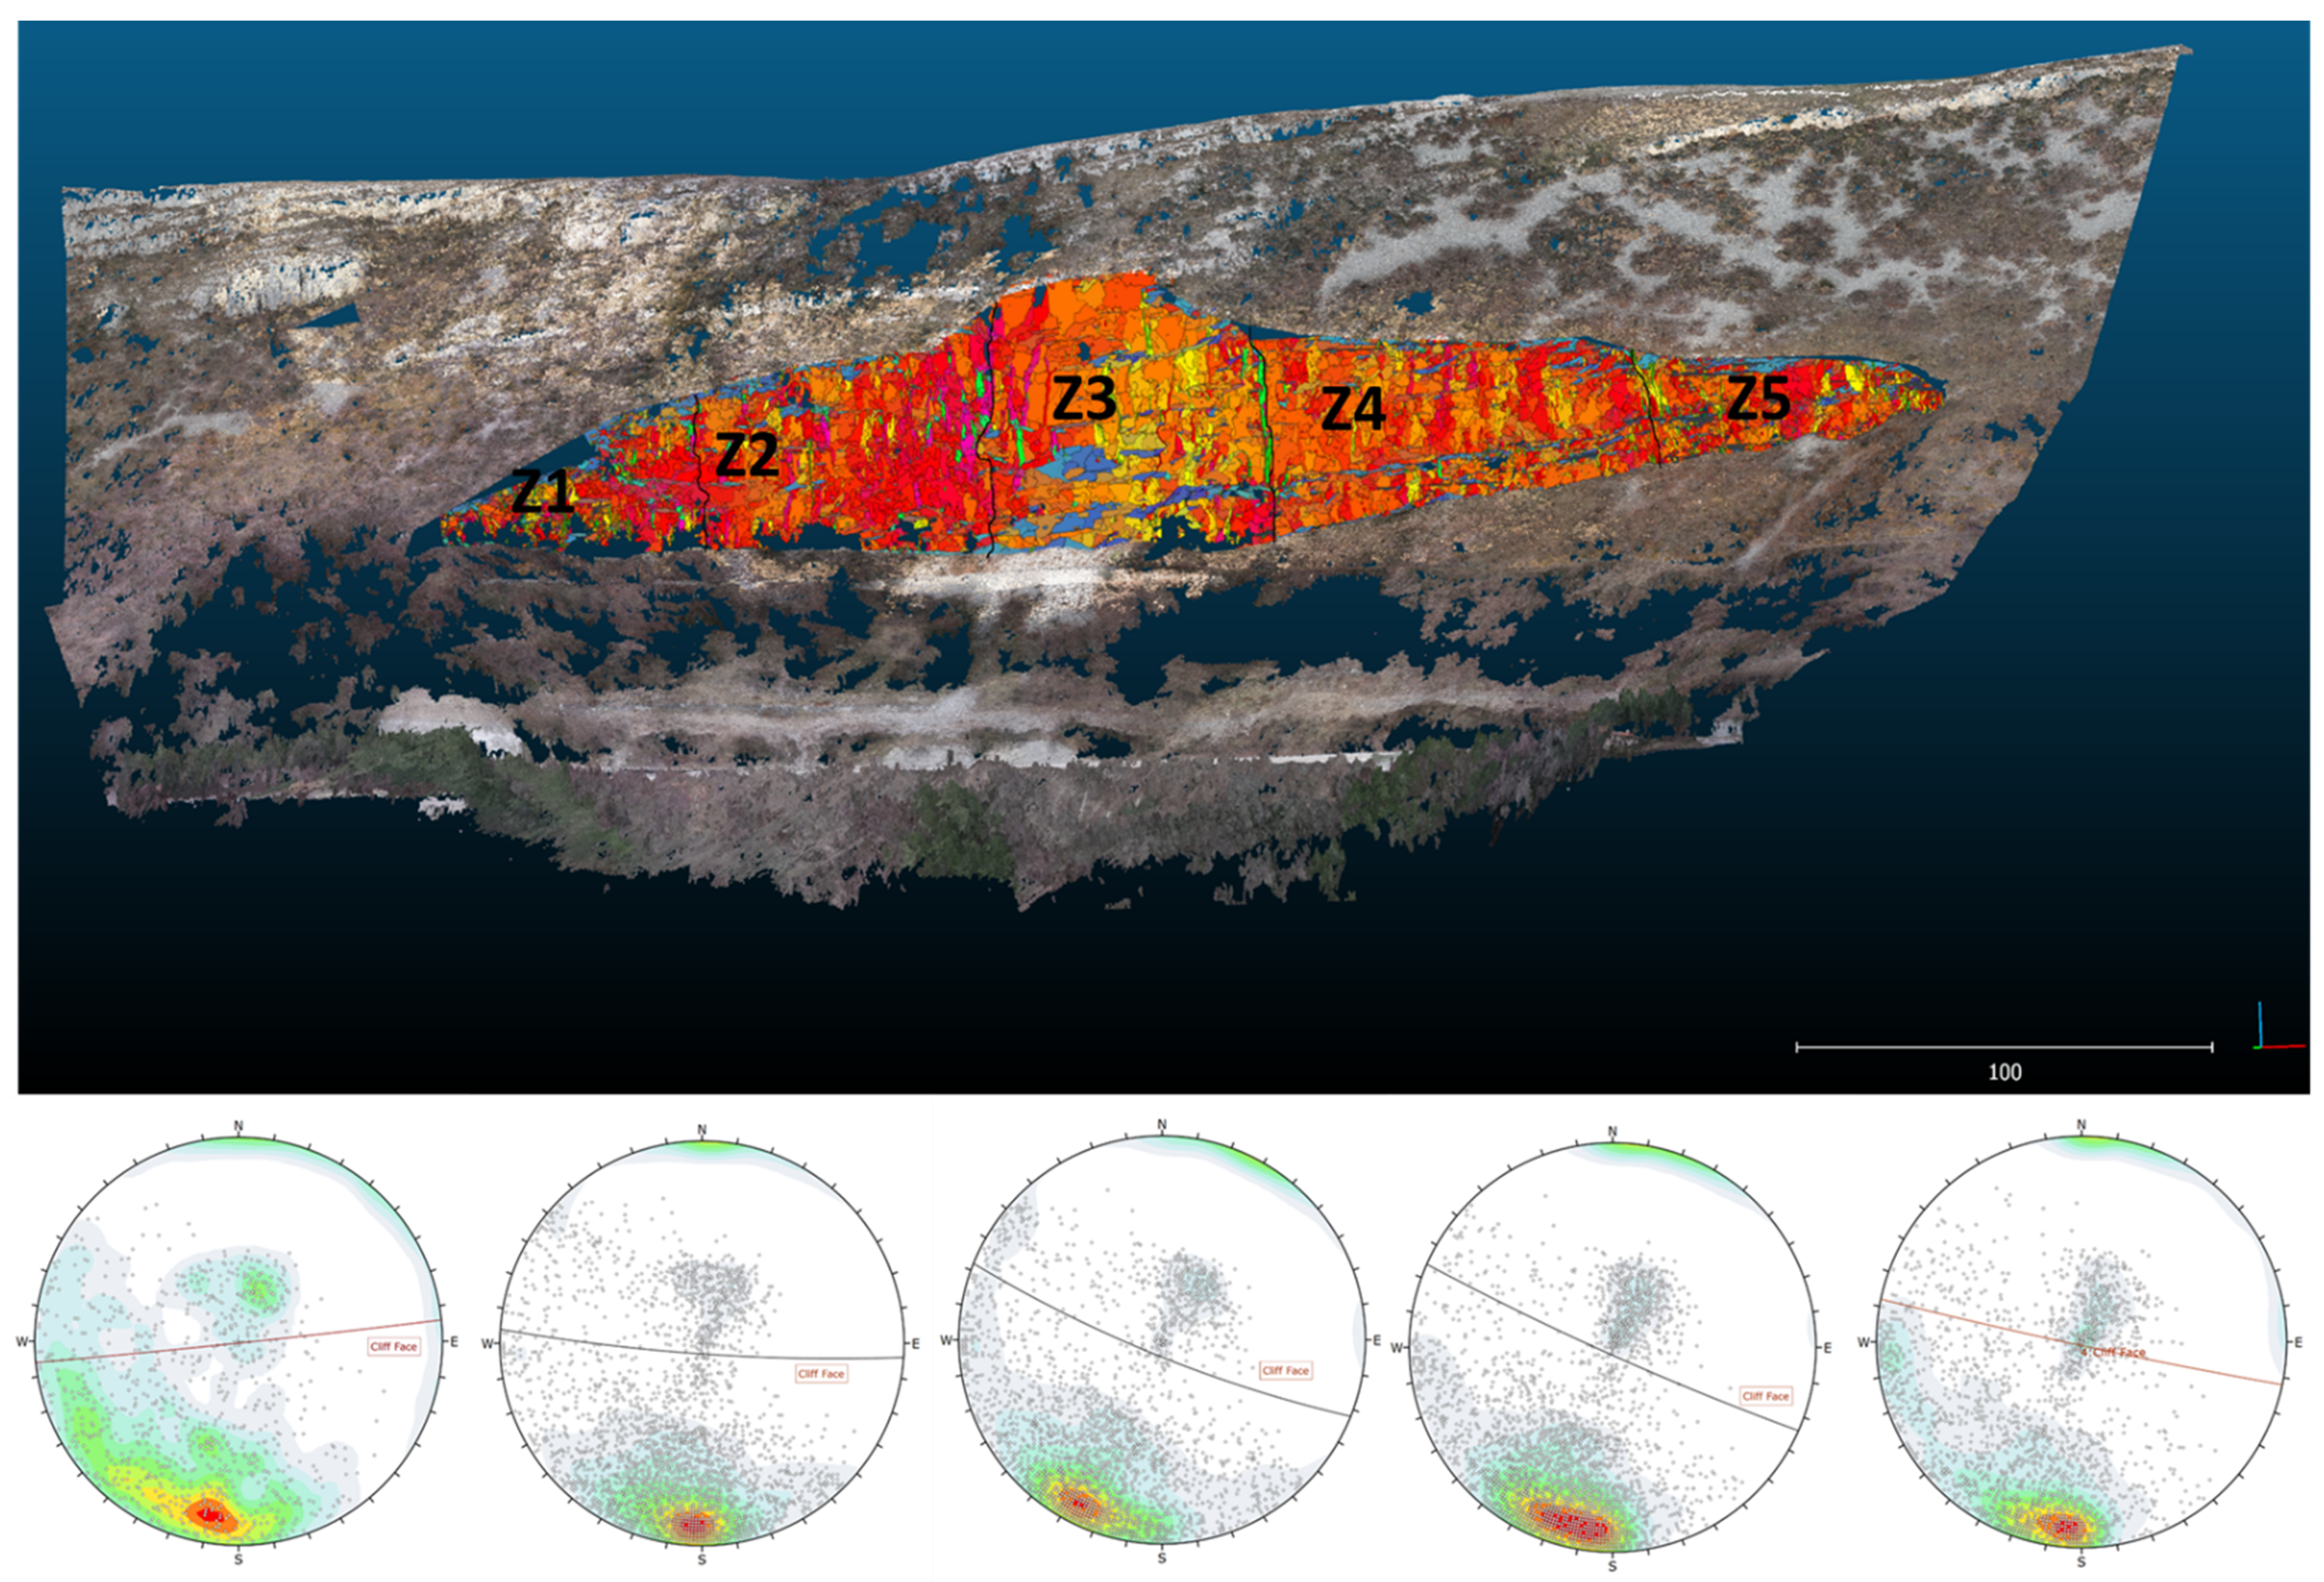
3.1. Raspadalica Cliff 3D Model Establishment
3.2. In Situ and Remote Sensing Surveys
3.3. Kinematic Analysis
4. Results
4.1. Results of the Geological and Geotechnical Survey
In Situ Traditional Geological and Geotechnical Survey
4.2. Geotechnical Model of the Raspadalica Cliff
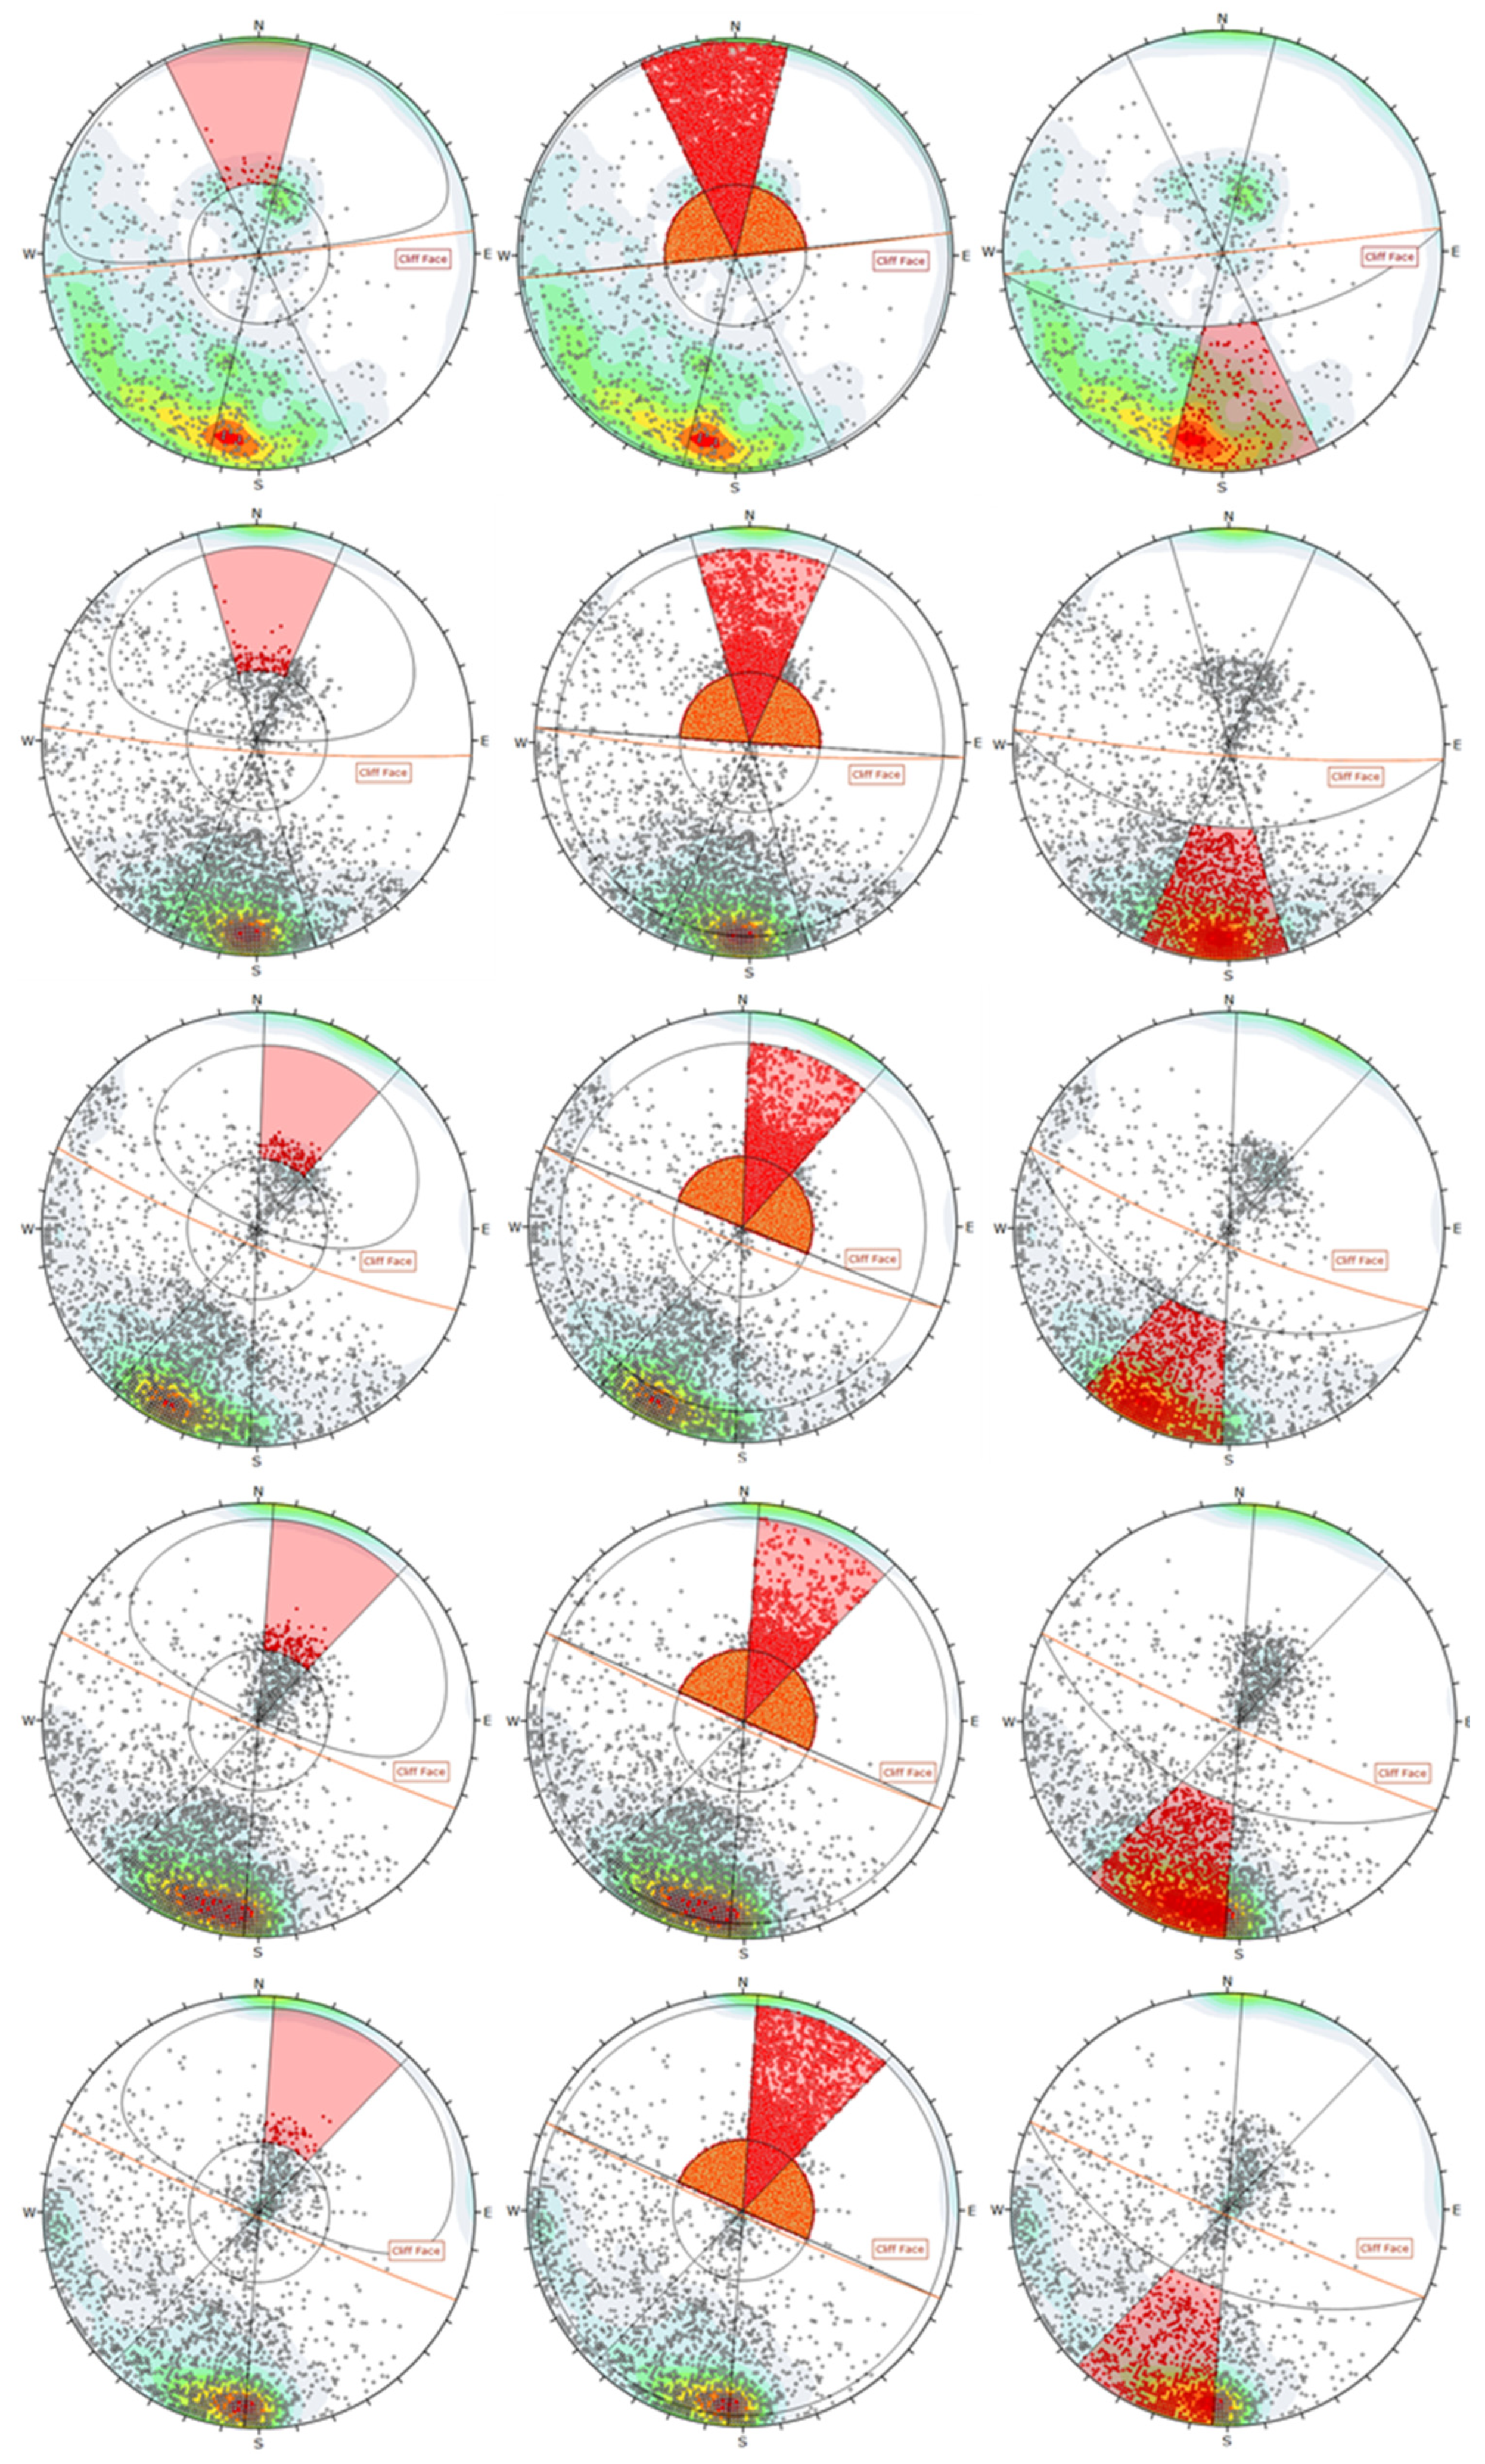
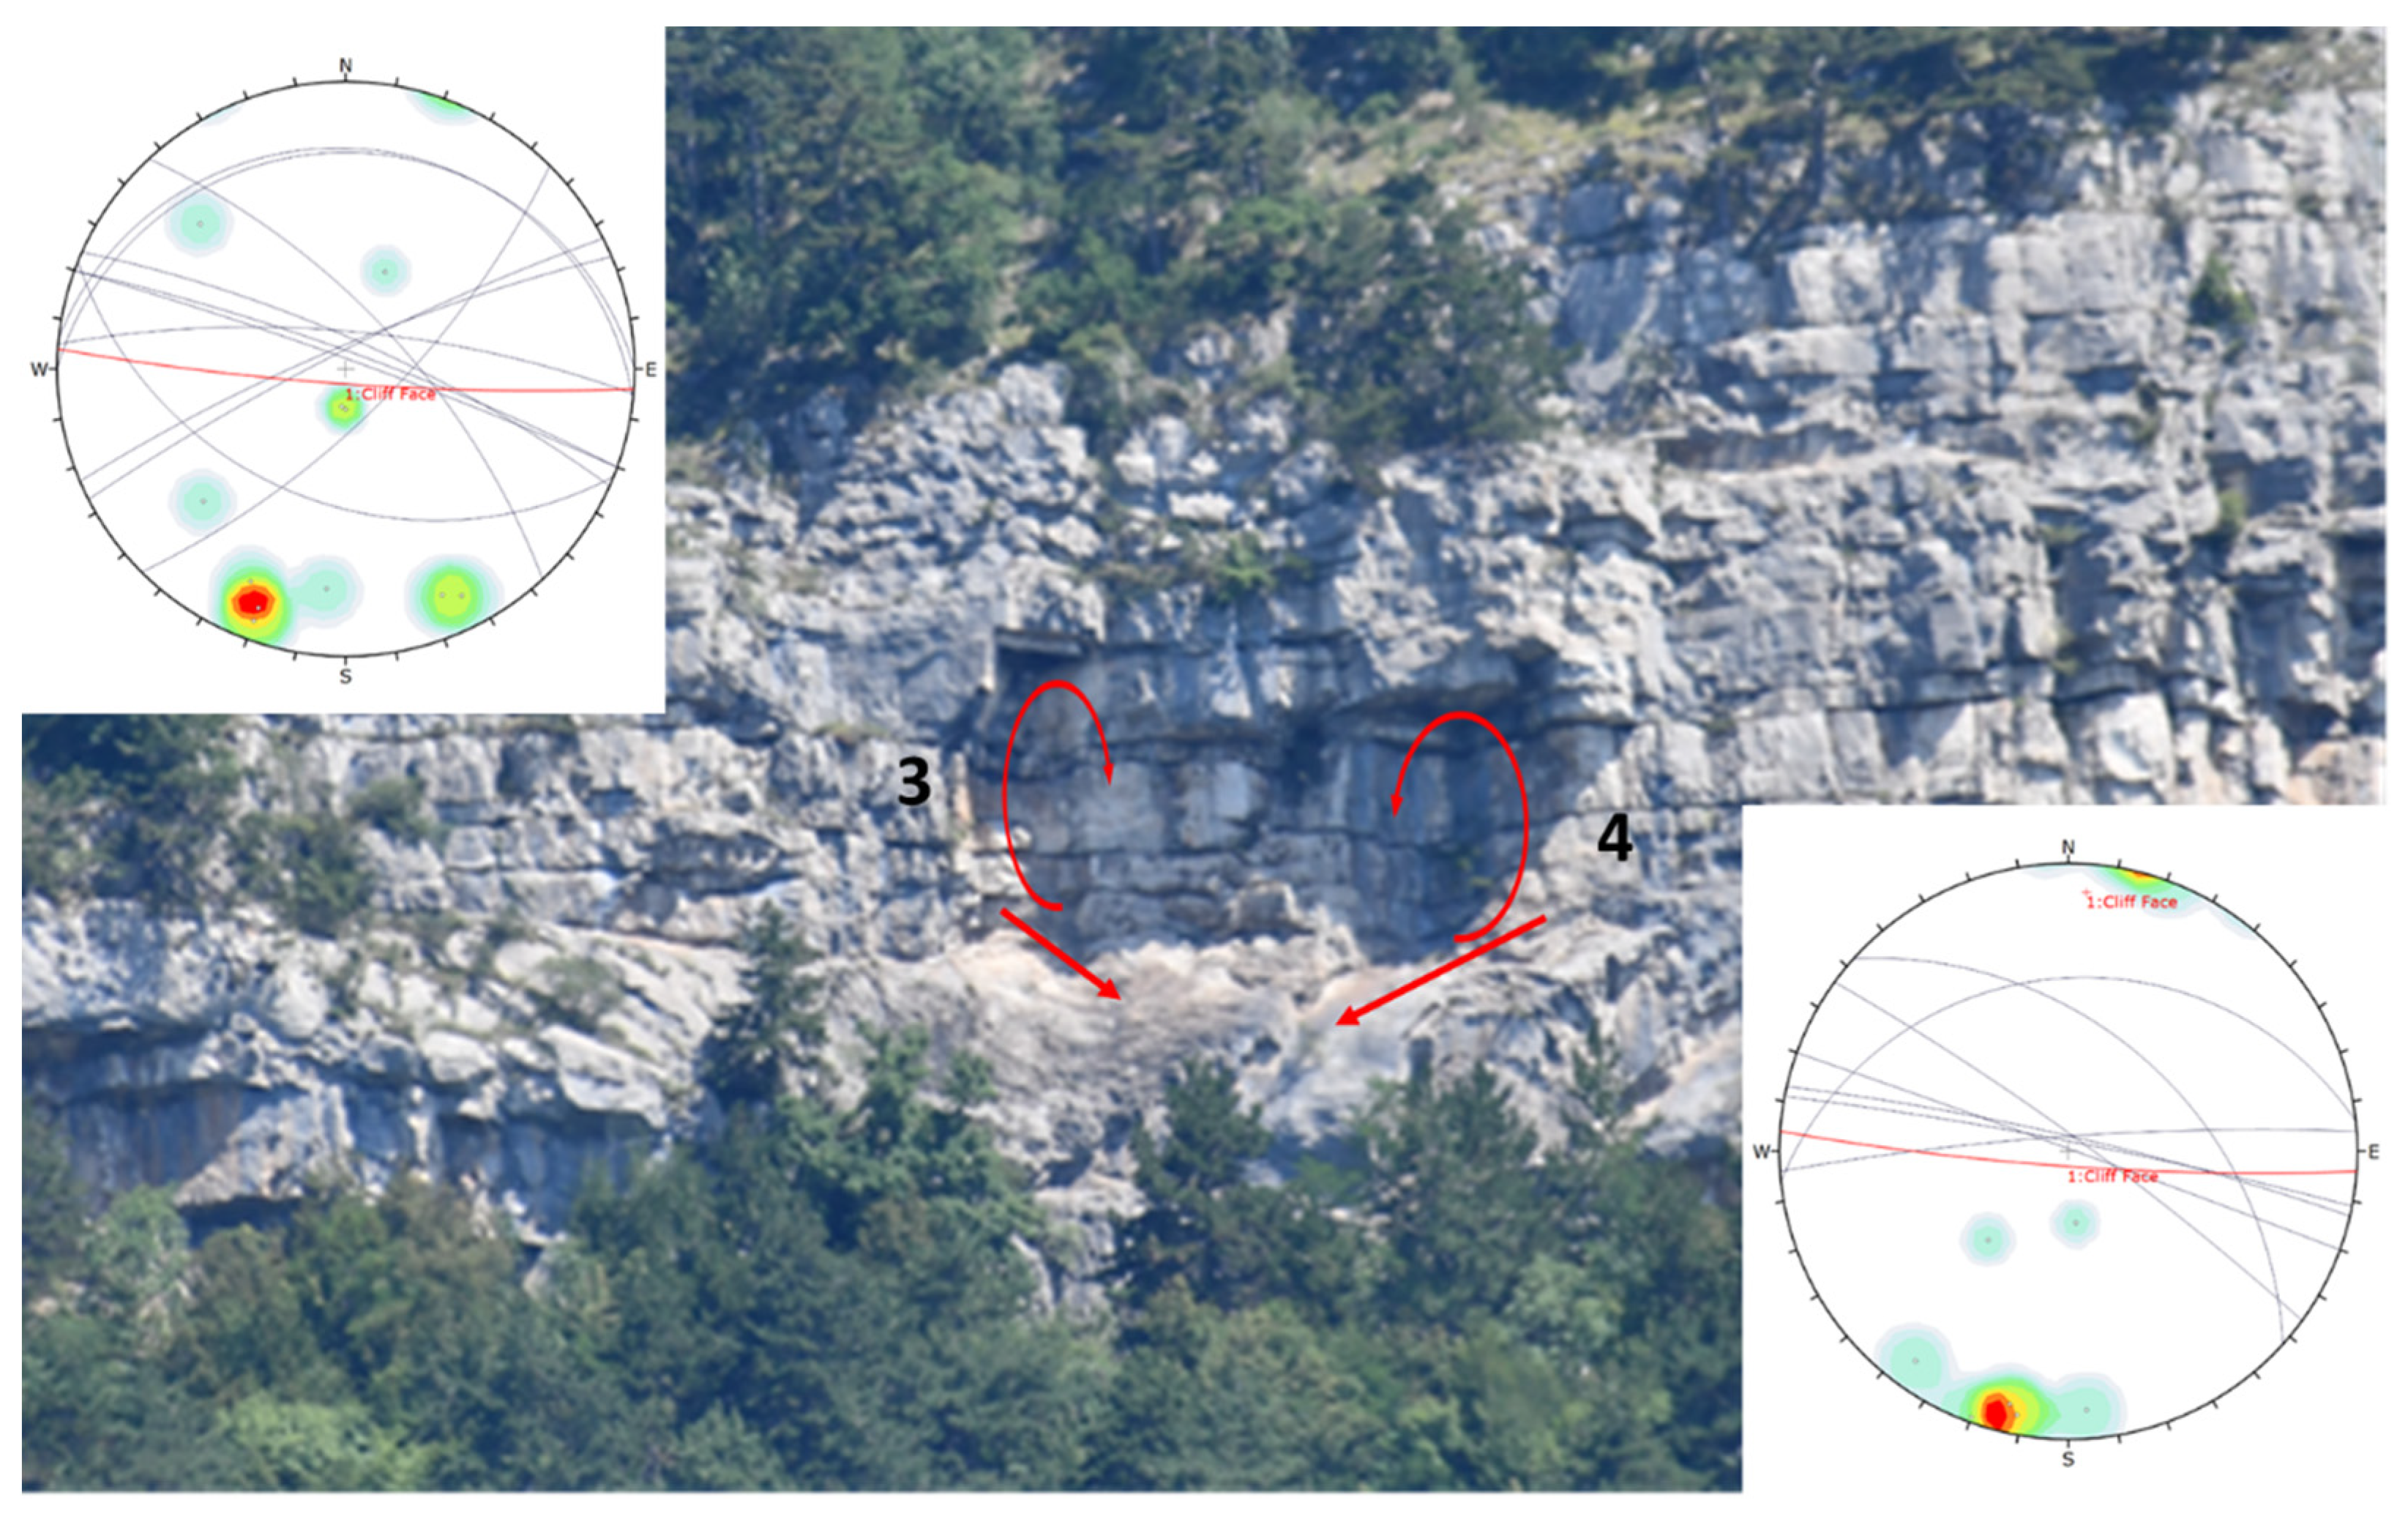
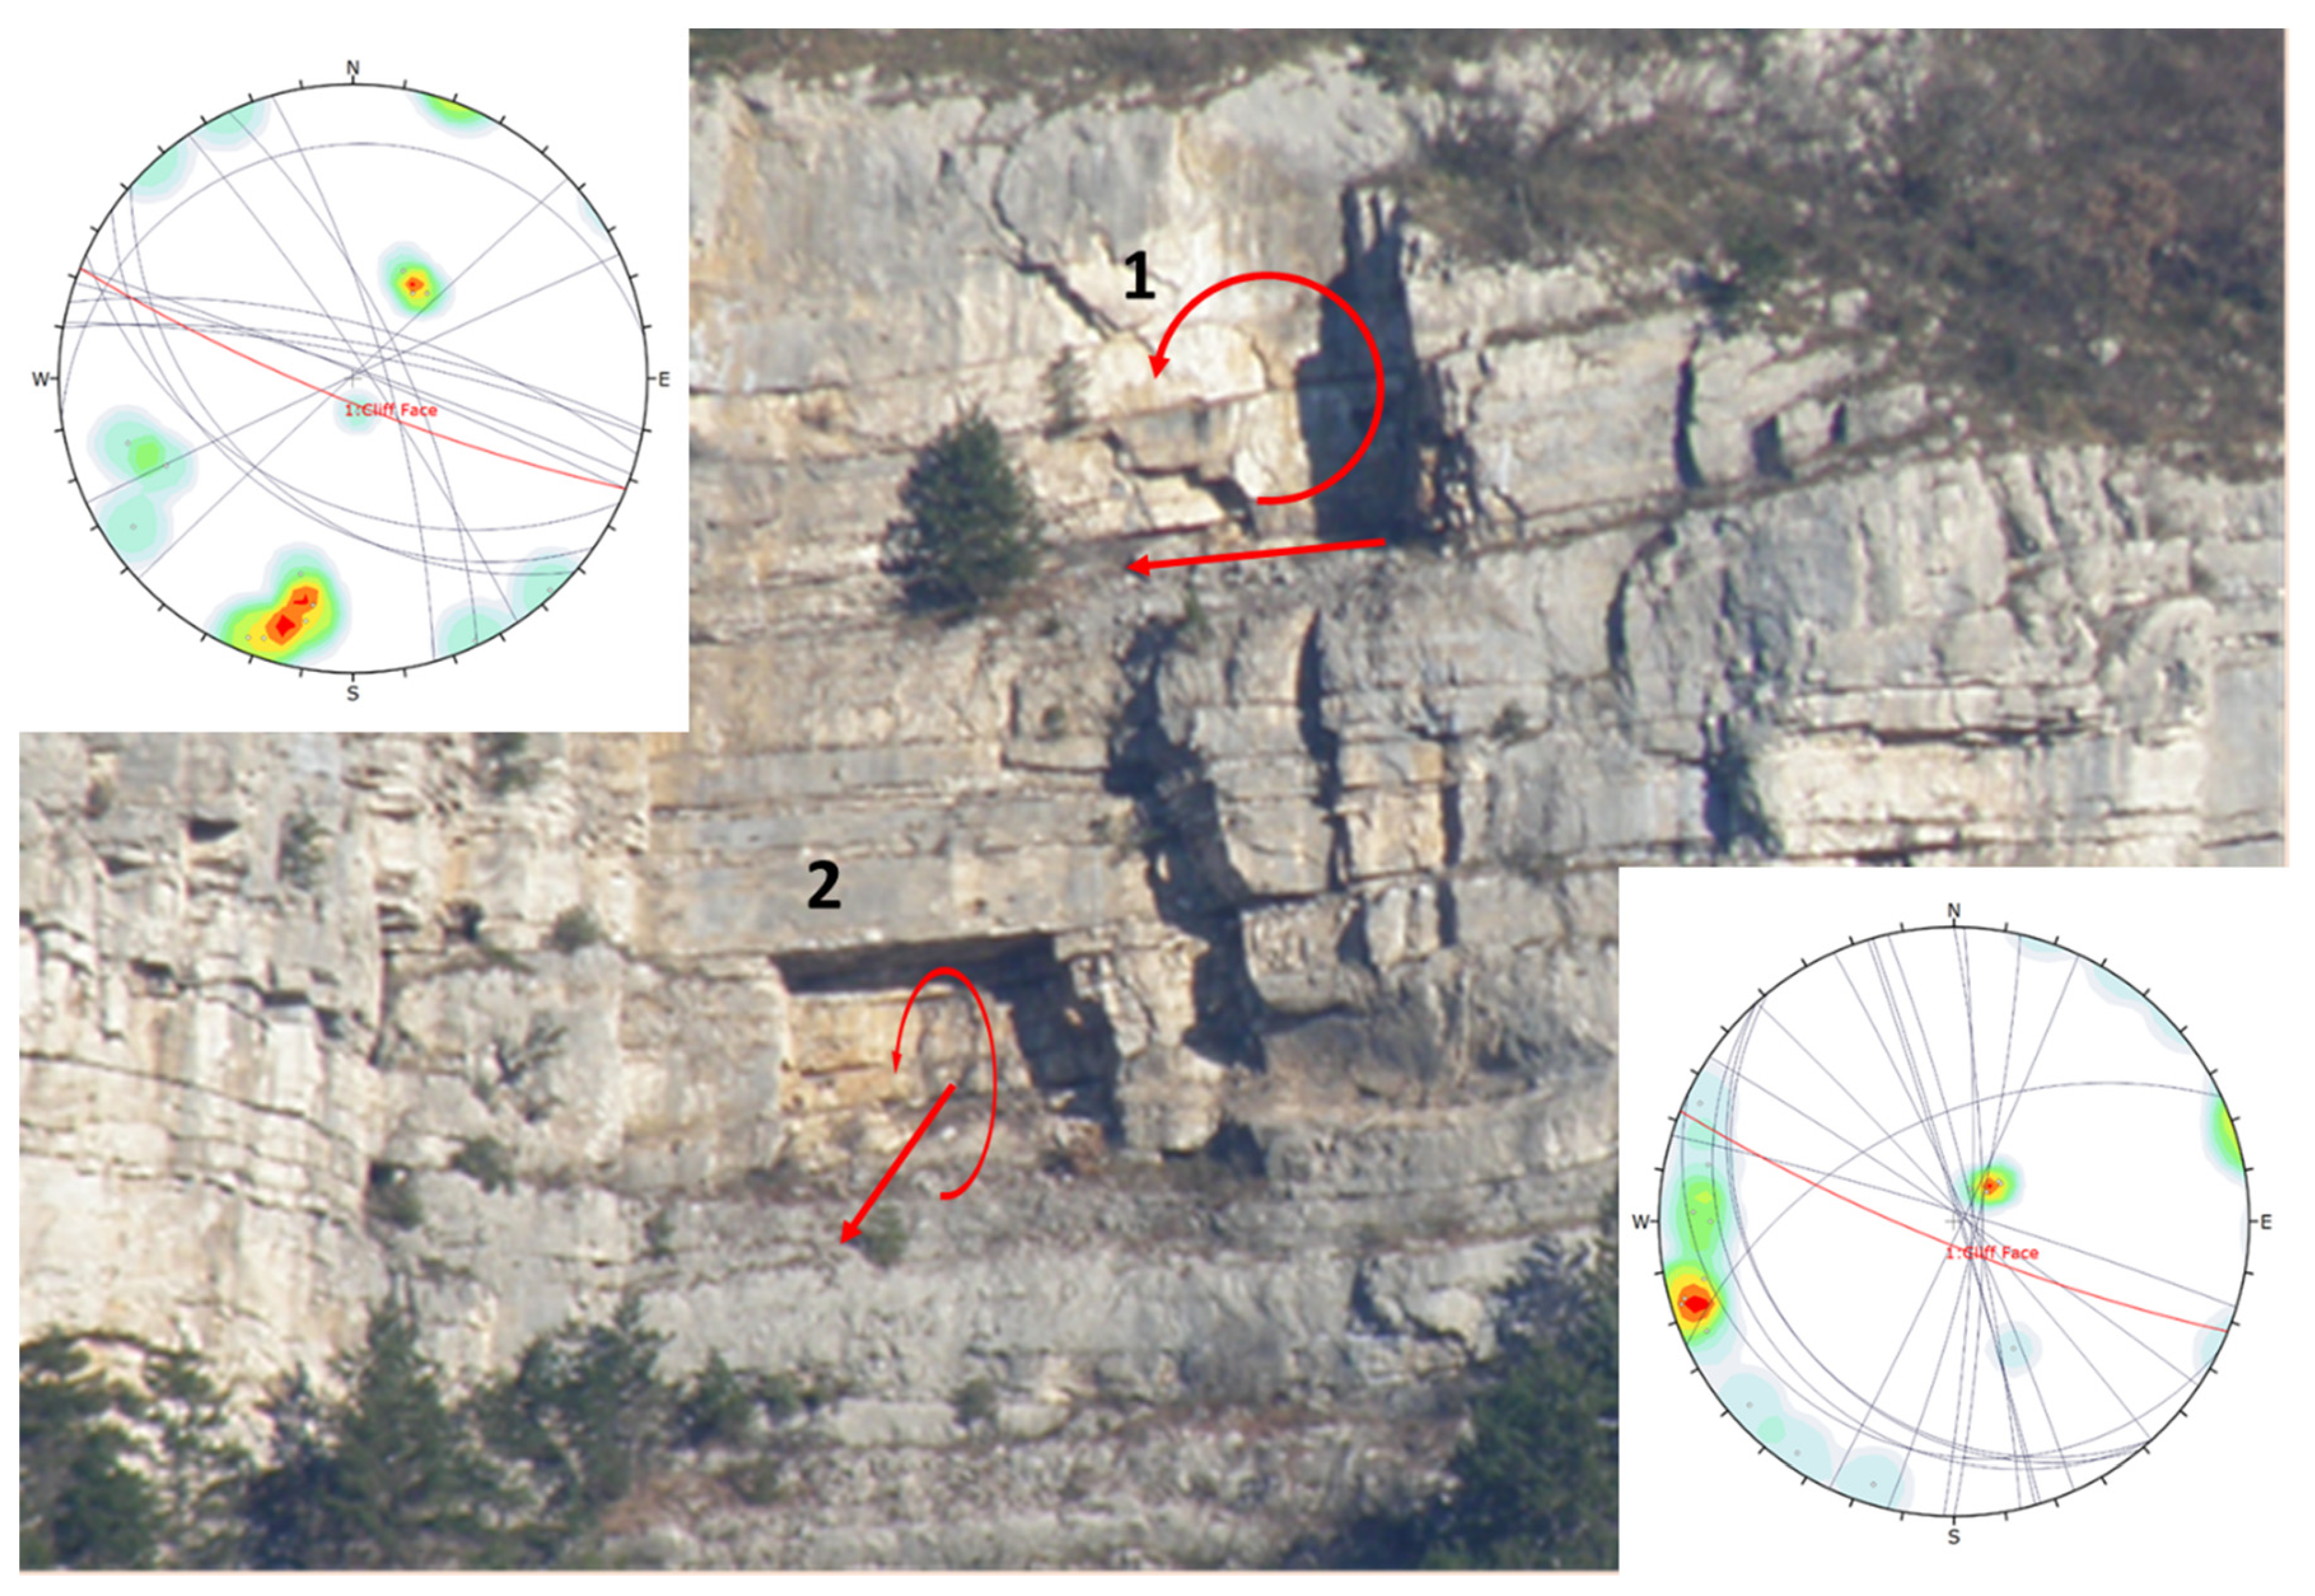
4.3. Kinematic Analysis
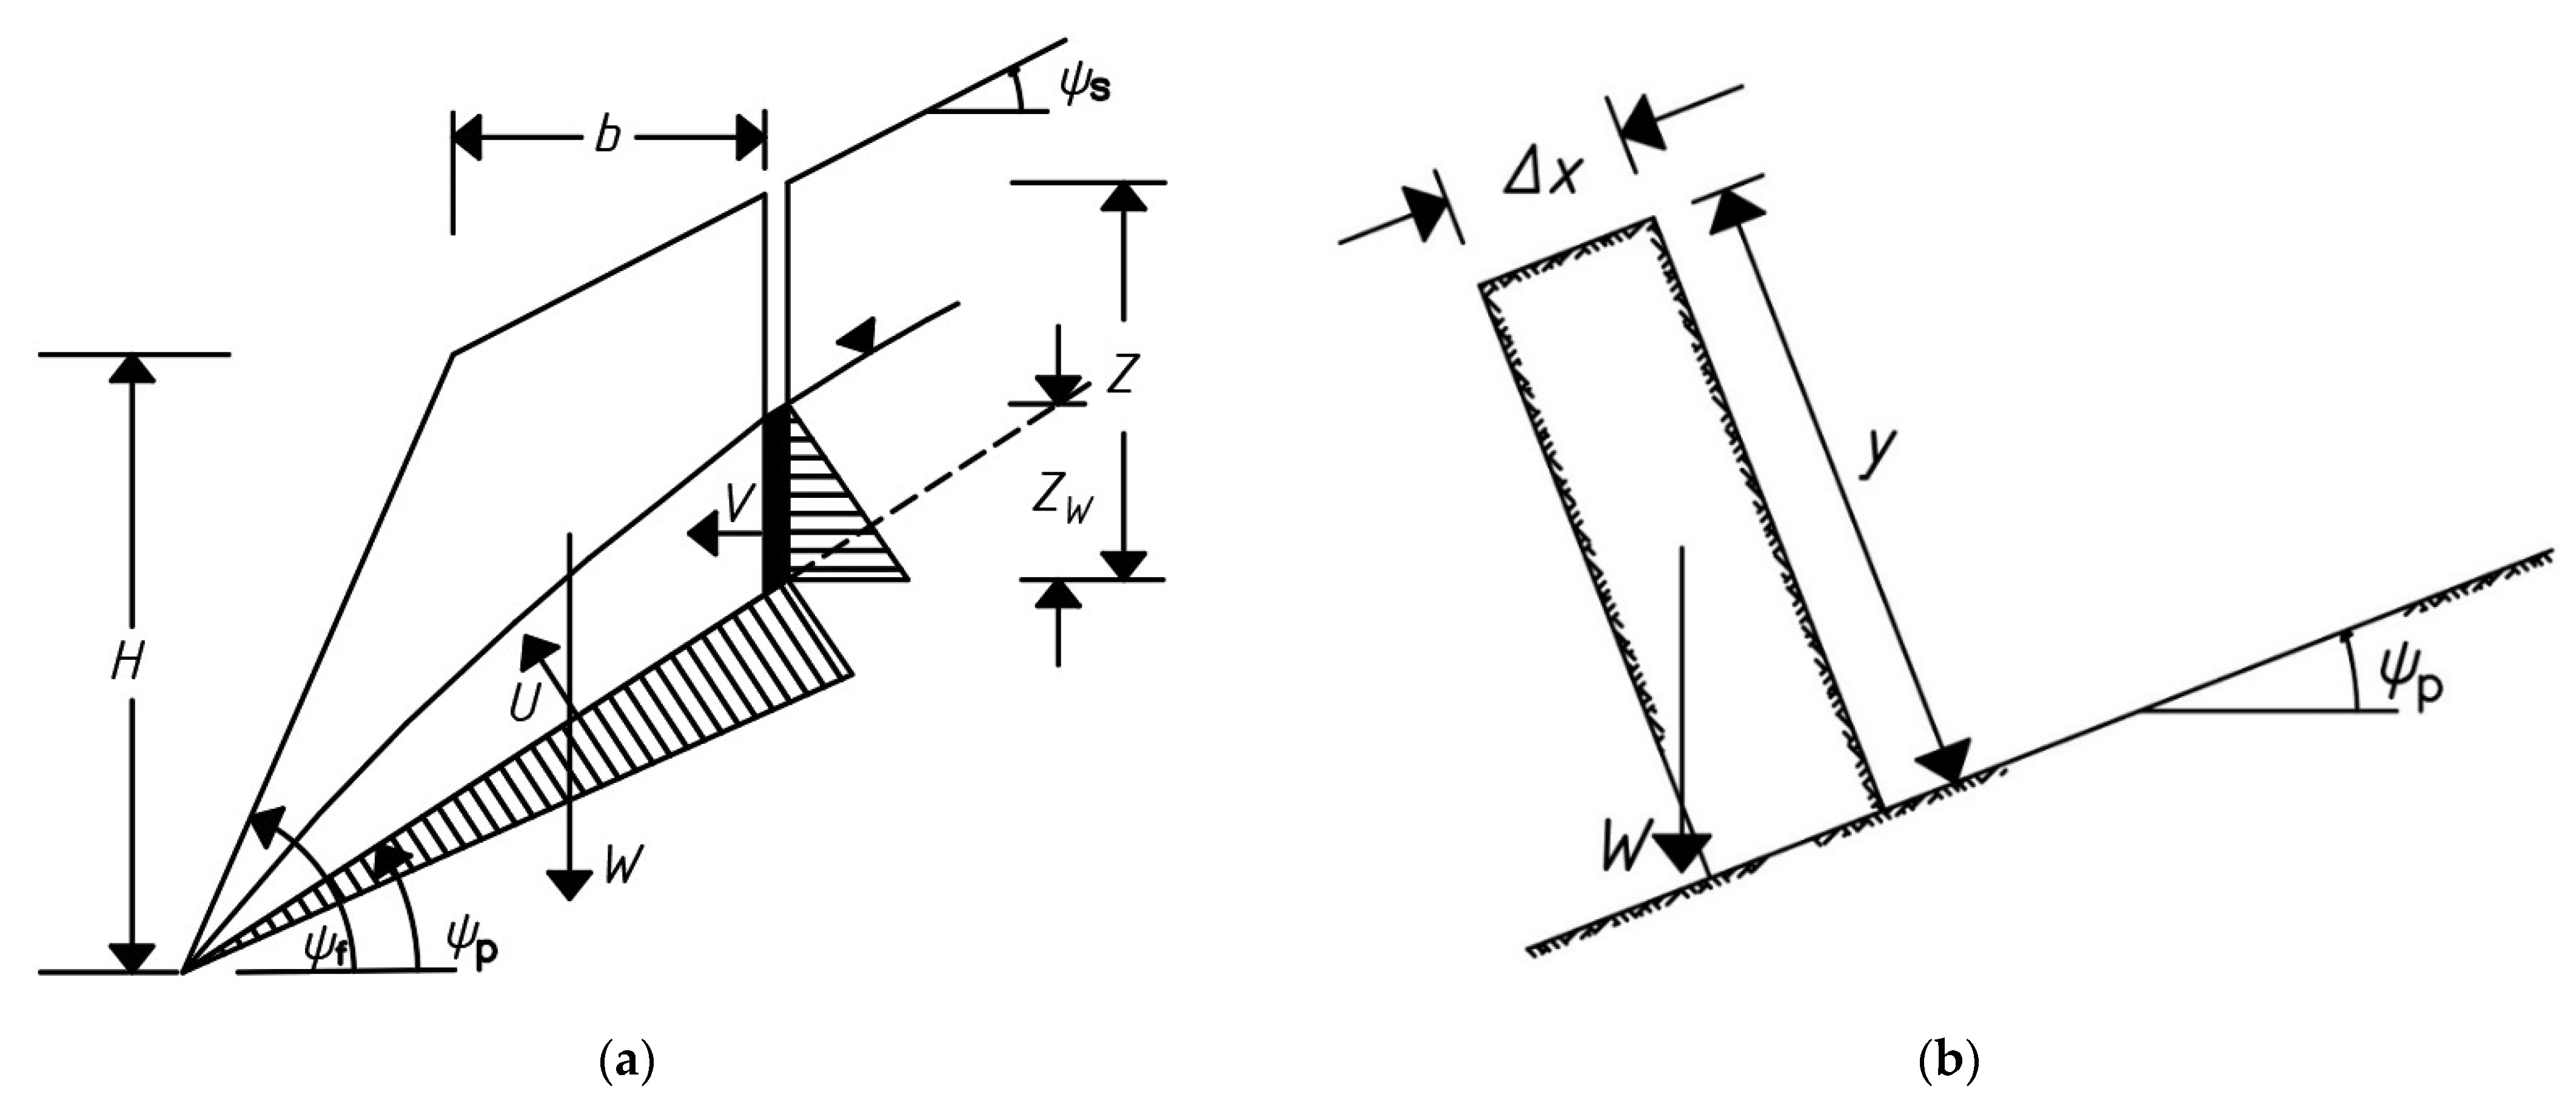
4.4. Stability Analysis
5. Discussion
6. Conclusions
Author Contributions
Funding
Institutional Review Board Statement
Informed Consent Statement
Data Availability Statement
Acknowledgments
Conflicts of Interest
References
- Hungr, O.; Leroueil, S.; Picarelli, L. The Varnes Classification of Landslide Types, an Update. Landslides 2014, 11, 167–194. [Google Scholar] [CrossRef]
- Volkwein, A.; Schellenberg, K.; Labiouse, V.; Agliardi, F.; Berger, F.; Bourrier, F.; Dorren, L.K.A.; Gerber, W.; Jaboyedoff, M. Rockfall Characterisation and Structural Protection—A Review. Nat. Hazards Earth Syst. Sci. 2011, 11, 2617–2651. [Google Scholar] [CrossRef] [Green Version]
- Dorren, L.K.A. A Review of Rockfall Mechanics and Modelling Approaches. Prog. Phys. Geogr. Earth Environ. 2003, 27, 69–87. [Google Scholar] [CrossRef]
- Emmer, A. Geographies and Scientometrics of Research on Natural Hazards. Geosciences 2018, 8, 382. [Google Scholar] [CrossRef] [Green Version]
- Ritchie, A.M. Evaluation of Rockfall and Its Control. Highw. Res. Rec. 1963, 17, 13–28. [Google Scholar]
- Siddique, T.; Pradhan, S.P.; Vishal, V. Rockfall: A Specific Case of Landslide. In Landslides: Theory, Practice and Modelling; Pradhan, S.P., Vishal, V., Singh, T.N., Eds.; Advances in Natural and Technological Hazards Research; Springer International Publishing: Cham, Switzerland, 2019; Volume 50, pp. 61–81. ISBN 978-3-319-77376-6. [Google Scholar]
- Arbanas, Ž.; Benac, Č.; Jurak, V. Causes of Debris Flow Formation in Flysch Area of North Istria, Croatia. In Proceedings of the Monitoring, Simulation, Prevention and Remediation of Dense and Debris Flows, Rome, Italy, 12–14 October 2022; WIT Press: Rhodes, Greece, 2006; Volume 1, pp. 283–292. [Google Scholar]
- Šikić, D.; Pleničar, M.; Šparica, M. Basic Geological Map, Sheet Ilirska Bistrica, M:100.000; Croatian Geological Survey: Zagreb, Croatia, 1975. [Google Scholar]
- Babić, L.J.; Blašković, I.; Ferajančić, L.; Grad, K.; Grimani, I. Basic Geological Map, Sheet Trst, M:100.000; Geological Survey of Slovenia: Ljubljana, Slovenia, 1969. [Google Scholar]
- Dugonjić Jovančević, S.; Arbanas, Ž. Recent Landslides on the Istrian Peninsula, Croatia. Nat. Hazards 2012, 62, 1323–1338. [Google Scholar] [CrossRef]
- Francioni, M.; Calamita, F.; Coggan, J.; De Nardis, A.; Eyre, M.; Miccadei, E.; Piacentini, T.; Stead, D.; Sciarra, N. A Multi-Disciplinary Approach to the Study of Large Rock Avalanches Combining Remote Sensing, GIS and Field Surveys: The Case of the Scanno Landslide, Italy. Remote Sens. 2019, 11, 1570. [Google Scholar] [CrossRef] [Green Version]
- Grošić, M. Raspadalica Cliff, Geotechnical Report; Geotech Ltd.: Rijeka, Croatia, 2012. [Google Scholar]
- Loiotine, L.; Liso, I.S.; Parise, M.; Andriani, G.F. Optimization of Geostructural Surveys in Rock Mass Stability Analyses Using Remote Sensing Techniques. Ital. J. Eng. Geol. Environ. 2019, 73–78. [Google Scholar] [CrossRef]
- Lambert, S.; Bourrier, F. Design of Rockfall Protection Embankments: A Review. Eng. Geol. 2013, 154, 77–88. [Google Scholar] [CrossRef]
- Grošić, M. Raspadalica Cliff, Rockfall Protection Design; Geotech Ltd.: Rijeka, Croatia, 2012. [Google Scholar]
- Bishop, M.P. Remote Sensing and GIScience in Geomorphology: Introduction and Overview. In Treatise on Geomorphology; Elsevier: Amsterdam, The Netherlands, 2013; pp. 1–24. ISBN 978-0-08-088522-3. [Google Scholar]
- James, M.R.; Robson, S. Straightforward Reconstruction of 3D Surfaces and Topography with a Camera: Accuracy and Geoscience Application. J. Geophys. Res. 2012, 117, F03017. [Google Scholar] [CrossRef] [Green Version]
- Tannant, D. Review of Photogrammetry-Based Techniques for Characterization and Hazard Assessment of Rock Faces. IJGE Int. J. Georesour. Environ. 2015, 1, 76–87. [Google Scholar] [CrossRef] [Green Version]
- Núñez-Andrés, M.A.; Buill, F.; Puig, C.; Lantada, N.; Prades, A.; Gili, J.A. Comparison of Geomatic Techniques for Rockfall Monitoring. In Proceedings of the 4th Joint International Symposium on Deformation Monitoring (JISDM), Athens, Greece, 15–17 May 2019; p. 8. [Google Scholar]
- Nesbit, P.R.; Durkin, P.R.; Hugenholtz, C.H.; Hubbard, S.M.; Kucharczyk, M. 3-D Stratigraphic Mapping Using a Digital Outcrop Model Derived from UAV Images and Structure-from-Motion Photogrammetry. Geosphere 2018, 14, 2469–2486. [Google Scholar] [CrossRef] [Green Version]
- Giordan, D.; Hayakawa, Y.; Nex, F.; Remondino, F.; Tarolli, P. Review Article: The Use of Remotely Piloted Aircraft Systems (RPASs) for Natural Hazards Monitoring and Management. Nat. Hazards Earth Syst. Sci. 2018, 18, 1079–1096. [Google Scholar] [CrossRef] [Green Version]
- Giordan, D.; Adams, M.S.; Aicardi, I.; Alicandro, M.; Allasia, P.; Baldo, M.; De Berardinis, P.; Dominici, D.; Godone, D.; Hobbs, P.; et al. The Use of Unmanned Aerial Vehicles (UAVs) for Engineering Geology Applications. Bull. Eng. Geol. Environ. 2020, 79, 3437–3481. [Google Scholar] [CrossRef] [Green Version]
- Francioni, M.; Simone, M.; Stead, D.; Sciarra, N.; Mataloni, G.; Calamita, F. A New Fast and Low-Cost Photogrammetry Method for the Engineering Characterization of Rock Slopes. Remote Sens. 2019, 11, 1267. [Google Scholar] [CrossRef] [Green Version]
- Alptekin, A.; Çelik, M.Ö.; Doğan, Y.; Yakar, M. Mapping of a Rockfall Site with an Unmanned Aerial Vehicle. Mersin Photogramm. J. 2019, 1, 12–16. [Google Scholar]
- Stead, D.; Donati, D.; Wolter, A.; Sturzenegger, M. Application of Remote Sensing to the Investigation of Rock Slopes: Experience Gained and Lessons Learned. ISPRS Int. J. Geo-Inf. 2019, 8, 296. [Google Scholar] [CrossRef] [Green Version]
- Menegoni, N.; Giordan, D.; Perotti, C.; Tannant, D.D. Detection and Geometric Characterization of Rock Mass Discontinuities Using a 3D High-Resolution Digital Outcrop Model Generated from RPAS Imagery—Ormea Rock Slope, Italy. Eng. Geol. 2019, 252, 145–163. [Google Scholar] [CrossRef]
- Sarro, R.; Riquelme, A.; García-Davalillo, J.; Mateos, R.; Tomás, R.; Pastor, J.; Cano, M.; Herrera, G. Rockfall Simulation Based on UAV Photogrammetry Data Obtained during an Emergency Declaration: Application at a Cultural Heritage Site. Remote Sens. 2018, 10, 1923. [Google Scholar] [CrossRef] [Green Version]
- Francioni, M.; Salvini, R.; Stead, D.; Coggan, J. Improvements in the Integration of Remote Sensing and Rock Slope Modelling. Nat. Hazards 2018, 90, 975–1004. [Google Scholar] [CrossRef] [Green Version]
- Vanneschi, C.; Di Camillo, M.; Aiello, E.; Bonciani, F.; Salvini, R. SfM-MVS Photogrammetry for Rockfall Analysis and Hazard Assessment Along the Ancient Roman Via Flaminia Road at the Furlo Gorge (Italy). ISPRS Int. J. Geo-Inf. 2019, 8, 325. [Google Scholar] [CrossRef] [Green Version]
- Wang, S.; Zhang, Z.; Wang, C.; Zhu, C.; Ren, Y. Multistep Rocky Slope Stability Analysis Based on Unmanned Aerial Vehicle Photogrammetry. Environ. Earth Sci. 2019, 78, 260. [Google Scholar] [CrossRef]
- Wang, S.; Ahmed, Z.; Hashmi, M.Z.; Pengyu, W. Cliff Face Rock Slope Stability Analysis Based on Unmanned Arial Vehicle (UAV) Photogrammetry. Geomech. Geophys. Geo-Energ. Geo-Resour. 2019, 5, 333–344. [Google Scholar] [CrossRef]
- Salvini, R.; Mastrorocco, G.; Esposito, G.; Di Bartolo, S.; Coggan, J.; Vanneschi, C. Use of a Remotely Piloted Aircraft System for Hazard Assessment in a Rocky Mining Area (Lucca, Italy). Nat. Hazards Earth Syst. Sci. 2018, 18, 287–302. [Google Scholar] [CrossRef] [Green Version]
- Francioni, M.; Antonaci, F.; Sciarra, N.; Robiati, C.; Coggan, J.; Stead, D.; Calamita, F. Application of Unmanned Aerial Vehicle Data and Discrete Fracture Network Models for Improved Rockfall Simulations. Remote Sens. 2020, 12, 2053. [Google Scholar] [CrossRef]
- Bieniawski, Z.T. Engineering Rock Mass Classifications A Complete Manual for Engineers and Geologists in Mining, Civil, and Petroleum Engineering; Wiley-Interscience: New York, NY, USA, 1989. [Google Scholar]
- Marinos, P.; Hoek, E. GSI: A Geologically Friendly Tool For Rock Mass Strength Estimation. In Proceedings of the ISRM International Symposium, Melbourne, Australia, 19–24 November 2000; p. 19. [Google Scholar]
- Ulusay, R.; Hudson, J. (Eds.) The ISRM Suggested Methods for Rock Characterization, Testing and Monitoring: 2007–2014; Springer International Publishing: Cham, Switzerland, 2015; ISBN 978-3-319-07712-3. [Google Scholar]
- Caudal, P.; Simonetto, E.; Merrien-Soukatchoff, V.; Dewez, T.J.B. Semi-Automatic Rock Mass Geometry Analysis from a Dense 3D Point Cloud with Discontinuitylab. ISPRS Ann. Photogramm. Remote Sens. Spatial Inf. Sci. 2020, V-2–2020, 679–686. [Google Scholar] [CrossRef]
- Riquelme, A.; Cano, M.; Tomás, R.; Abellán, A. Identification of Rock Slope Discontinuity Sets from Laser Scanner and Photogrammetric Point Clouds: A Comparative Analysis. Proc. Eng. 2017, 191, 838–845. [Google Scholar] [CrossRef]
- Riquelme, A.; Abellán, A.; Tomás, R.; Jaboyedoff, M. Rock Slope Discontinuity Extraction and Stability Analysis from 3D Point Clouds: Application to an Urban Rock Slope. In Proceedings of the Vertical Geology Conference 2014, Lausanne, Switzerland, 6–7 February 2014; pp. 75–78. [Google Scholar]
- Wong, D.; Chan, K.; Millis, S. Digital Mapping of Discontinuities. In Proceedings of the 39th HKIE Geotechnical Division Annual Seminar, Hong Kong, China, 11 April 2019; p. 13. [Google Scholar]
- Zhang, K.; Wu, W.; Zhu, H.; Zhang, L.; Li, X.; Zhang, H. A Modified Method of Discontinuity Trace Mapping Using Three-Dimensional Point Clouds of Rock Mass Surfaces. J. Rock Mech. Geotech. Eng. 2020, 12, 571–586. [Google Scholar] [CrossRef]
- Zhang, P.; Zhao, Q.; Tannant, D.D.; Ji, T.; Zhu, H. 3D Mapping of Discontinuity Traces Using Fusion of Point Cloud and Image Data. Bull. Eng. Geol. Environ. 2019, 78, 2789–2801. [Google Scholar] [CrossRef]
- Buyer, A.; Schubert, W. Extraction of Discontinuity Orientations in Point Clouds. In Proceedings of the Rock Mechanics and Rock Engineering: From the Past to the Future, Ürgüp, Turkey, 29–31 August 2016; CRC Press: Cappadocia, Turkey, 2016; pp. 1133–1137. [Google Scholar]
- Ge, Y.; Tang, H.; Xia, D.; Wang, L.; Zhao, B.; Teaway, J.W.; Chen, H.; Zhou, T. Automated Measurements of Discontinuity Geometric Properties from a 3D-Point Cloud Based on a Modified Region Growing Algorithm. Eng. Geol. 2018, 242, 44–54. [Google Scholar] [CrossRef]
- Liu, L.; Xiao, J.; Wang, Y. Major Orientation Estimation-Based Rock Surface Extraction for 3D Rock-Mass Point Clouds. Remote Sens. 2019, 11, 635. [Google Scholar] [CrossRef] [Green Version]
- Nagendran, S.K.; Mohamad Ismail, M.A.; Wen, Y.T. Photogrammetry Approach on Geological Plane Extraction Using CloudCompare FACET Plugin and Scanline Survey. Bull. Geol. Soc. Malays. 2019, 68, 151–158. [Google Scholar] [CrossRef]
- Riquelme, A.; Tomás, R.; Cano, M.; Pastor, J.L.; Abellán, A. Automatic Mapping of Discontinuity Persistence on Rock Masses Using 3D Point Clouds. Rock Mech. Rock Eng. 2018, 51, 3005–3028. [Google Scholar] [CrossRef]
- Anders, K.; Hämmerle, M.; Miernik, G.; Drews, T.; Escalona, A.; Townsend, C.; Höfle, B. 3D Geological Outcrop Characterization: Automatic Detection of 3D Planes (Azimuth and Dip) Using LiDAR Point Clouds. ISPRS Ann. Photogramm. Remote Sens. Spatial Inf. Sci. 2016, III–5, 105–112. [Google Scholar] [CrossRef] [Green Version]
- Buyer, A. Contributions to Block Failure Analyses Using Digital Joint Network Characterization. Ph.D. Thesis, TU Graz, Graz, Austria, 2019. [Google Scholar]
- Bar, N.; Kostadinovski, M.; Tucker, M.; Byng, G.; Rachmatullah, R.; Maldonado, A.; Pötsch, M.; Gaich, A.; McQuillan, A.; Yacoub, T. Pit Slope Failure Evaluation in near Real Time Using UAV Photogrammetry and 3D Limit Equilibrium Analysis. Austral. Geomech. J. 2020, 55, 15. [Google Scholar]
- Bonilla-Sierra, V.; Scholtès, L.; Donzé, F.V.; Elmouttie, M.K. Rock Slope Stability Analysis Using Photogrammetric Data and DFN–DEM Modelling. Acta Geotech. 2015, 10, 497–511. [Google Scholar] [CrossRef]
- del Río, L.; Posanski, D.; Gracia, F.J.; Pérez-Romero, A.M. Application of Structure-from-Motion Terrestrial Photogrammetry to the Assessment of Coastal Cliff Erosion Processes in SW Spain. J. Coast. Res. 2020, 95, 1057. [Google Scholar] [CrossRef]
- Donati, D.; Stead, D.; Ghirotti, M.; Wolter, A. A Structural Investigation of the Hope Slide, British Columbia, Using Terrestrial Photogrammetry and Rock Mass Characterization. Rend. Online Soc. Geol. Ital. 2013, 24, 107–109. [Google Scholar]
- Drews, T.; Miernik, G.; Anders, K.; Höfle, B.; Profe, J.; Emmerich, A.; Bechstädt, T. Validation of Fracture Data Recognition in Rock Masses by Automated Plane Detection in 3D Point Clouds. Int. J. Rock Mech. Min. Sci. 2018, 109, 19–31. [Google Scholar] [CrossRef]
- Farmakis, I.; Marinos, V.; Papathanassiou, G.; Karantanellis, E. Automated 3D Jointed Rock Mass Structural Analysis and Characterization Using LiDAR Terrestrial Laser Scanner for Rockfall Susceptibility Assessment: Perissa Area Case (Santorini). Geotech Geol. Eng. 2020, 38, 3007–3024. [Google Scholar] [CrossRef]
- Karantanellis, E.; Marinos, V.; Vassilakis, E.; Christaras, B. Object-Based Analysis Using Unmanned Aerial Vehicles (UAVs) for Site-Specific Landslide Assessment. Remote Sens. 2020, 12, 1711. [Google Scholar] [CrossRef]
- Menegoni, N.; Giordan, D.; Perotti, C. Reliability and Uncertainties of the Analysis of an Unstable Rock Slope Performed on RPAS Digital Outcrop Models: The Case of the Gallivaggio Landslide (Western Alps, Italy). Remote Sens. 2020, 12, 1635. [Google Scholar] [CrossRef]
- Robiati, C.; Eyre, M.; Vanneschi, C.; Francioni, M.; Venn, A.; Coggan, J. Application of Remote Sensing Data for Evaluation of Rockfall Potential within a Quarry Slope. SPRS Int. J. Geo-Inf. 2019, 8, 367. [Google Scholar] [CrossRef] [Green Version]
- Nagendran, S.K.; Mohamad Ismail, M.A.; Tung, W.Y. 2D and 3D Rock Slope Stability Assessment Using Limit Equilibrium Method Incorporating Photogrammetry Technique. BGSM 2019, 68, 133–139. [Google Scholar] [CrossRef]
- Guo, J.; Liu, Y.; Wu, L.; Liu, S.; Yang, T.; Zhu, W.; Zhang, Z. A Geometry- and Texture-Based Automatic Discontinuity Trace Extraction Method for Rock Mass Point Cloud. Int. J. Rock Mech. Min. Sci. 2019, 124, 104132. [Google Scholar] [CrossRef]
- Guo, J.; Wu, L.; Zhang, M.; Liu, S.; Sun, X. Towards Automatic Discontinuity Trace Extraction from Rock Mass Point Cloud without Triangulation. Int. J. Rock Mech. Min. Sci. 2018, 112, 226–237. [Google Scholar] [CrossRef]
- Kong, D.; Wu, F.; Saroglou, C. Automatic Identification and Characterization of Discontinuities in Rock Masses from 3D Point Clouds. Eng. Geol. 2020, 265, 105442. [Google Scholar] [CrossRef]
- Zhang, Y.; Yue, P.; Zhang, G.; Guan, T.; Lv, M.; Zhong, D. Augmented Reality Mapping of Rock Mass Discontinuities and Rockfall Susceptibility Based on Unmanned Aerial Vehicle Photogrammetry. Remote Sens. 2019, 11, 1311. [Google Scholar] [CrossRef] [Green Version]
- Dewez, T.J.B.; Girardeau-Montaut, D.; Allanic, C.; Rohmer, J. Facets: A CloudCompare Plugin to Extract Geological Planes from Unstructured 3D Point Clouds. Int. Arch. Photogramm. Remote Sens. Spatial Inf. Sci. 2016, XLI-B5, 799–804. [Google Scholar] [CrossRef] [Green Version]
- Riquelme, A.; Tomás, R.; Cano, M.; Abellán, A. Using Open-Source Software for Extracting Geomechanical Parameters of a Rock Mass from 3D Point Clouds: Discontinuity Set Extractor and SMRTool. In Rock Mechanics and Rock Engineering: From the Past to the Future; CRC Press: Cappadocia, Turkey, 2016; pp. 1091–1096. [Google Scholar]
- Tung, W.Y.; Nagendran, S.K.; Mohamad Ismail, M.A. 3D Rock Slope Data Acquisition by Photogrammetry Approach and Extraction of Geological Planes Using FACET Plugin in CloudCompare. IOP Conf. Ser. Earth Environ. Sci. 2018, 169, 012051. [Google Scholar] [CrossRef]
- Chesley, J.T.; Leier, A.L.; White, S.; Torres, R. Using Unmanned Aerial Vehicles and Structure-from-Motion Photogrammetry to Characterize Sedimentary Outcrops: An Example from the Morrison Formation, Utah, USA. Sediment. Geol. 2017, 354, 1–8. [Google Scholar] [CrossRef]
- Eltner, A.; Sofia, G. Structure from motion photogrammetric technique. In Developments in Earth Surface Processes; Elsevier: Amsterdam, The Netherlands, 2020; Volume 23, pp. 1–24. ISBN 978-0-444-64177-9. [Google Scholar]
- Liu, C.; Liu, X.; Peng, X.; Wang, E.; Wang, S. Application of 3D-DDA Integrated with Unmanned Aerial Vehicle–Laser Scanner (UAV-LS) Photogrammetry for Stability Analysis of a Blocky Rock Mass Slope. Landslides 2019, 16, 1645–1661. [Google Scholar] [CrossRef]
- Mancini, F.; Castagnetti, C.; Rossi, P.; Dubbini, M.; Fazio, N.; Perrotti, M.; Lollino, P. An Integrated Procedure to Assess the Stability of Coastal Rocky Cliffs: From UAV Close-Range Photogrammetry to Geomechanical Finite Element Modeling. Remote Sens. 2017, 9, 1235. [Google Scholar] [CrossRef] [Green Version]
- Mikita, T.; Balková, M.; Bajer, A.; Cibulka, M.; Patočka, Z. Comparison of Different Remote Sensing Methods for 3D Modeling of Small Rock Outcrops. Sensors 2020, 20, 1663. [Google Scholar] [CrossRef] [PubMed] [Green Version]
- Nagendran, S.K.; Mohamad Ismail, M.A.; Tung, W.Y. Integration of UAV Photogrammetry and Kinematic Analysis for Rock Slope Stability Assessment. Bull. Geol. Soc. Malays. 2019, 67, 105–111. [Google Scholar] [CrossRef]
- Riquelme, A.J.; Abellán, A.; Tomás, R.; Jaboyedoff, M. A New Approach for Semi-Automatic Rock Mass Joints Recognition from 3D Point Clouds. Comput. Geosci. 2014, 68, 38–52. [Google Scholar] [CrossRef] [Green Version]
- Riquelme, A.J.; Tomás, R.; Abellán, A. Characterization of Rock Slopes through Slope Mass Rating Using 3D Point Clouds. Int. J. Rock Mech. Min. Sci. 2016, 84, 165–176. [Google Scholar] [CrossRef] [Green Version]
- Zekkos, D.; Greenwood, W.; Lynch, J.; Manousakis, J.; Athanasopoulos-Zekkos, A.; Clark, M.; Saroglou, C. Lessons Learned from The Application of UAV-Enabled Structure-From-Motion Photogrammetry in Geotechnical Engineering. Int. J. Geoeng. Case Hist. 2018, 4, 254–274. [Google Scholar] [CrossRef]
- Brugger, M.; Sellmeier, B.; Menschik, F.; Käsling, H.; Thuro, K. The Scope of Photogrammetry and TLS in the Context of Geomechanical Discontinuity Analysis. In IAEG/AEG Annual Meeting Proceedings, San Francisco, California, 2018—Volume 1; Shakoor, A., Cato, K., Eds.; Springer International Publishing: Cham, Switzerland, 2019; pp. 311–316. ISBN 978-3-319-93123-4. [Google Scholar]
- Buyer, A.; Schubert, W. Joint Trace Detection in Digital Images. In Proceedings of the 10th Asian Rock Mechanics Symposium, Singapore, 29 October–3 November 2018; p. 11. [Google Scholar]
- Buyer, A.; Schubert, W. Calculation the Spacing of Discontinuities from 3D Point Clouds. Proc. Eng. 2017, 191, 270–278. [Google Scholar] [CrossRef]
- Riquelme, A.J.; Abellán, A.; Tomás, R. Discontinuity Spacing Analysis in Rock Masses Using 3D Point Clouds. Eng. Geol. 2015, 195, 185–195. [Google Scholar] [CrossRef] [Green Version]
- Bonetto, S.; Umili, G.; Ferrero, A.M.; Carosi, R.; Simonetti, M.; Biasi, A.; Migliazza, M.R.; Bianchini, S. Geostructural and Geomechanical Study of the Piastrone Quarry (Seravezza, Italy) Supported by Photogrammetry to Assess Failure Mode. Geosciences 2020, 10, 64. [Google Scholar] [CrossRef] [Green Version]
- Donati, D.; Stead, D.; Brideau, M.-A.; Ghirotti, M. Using Pre-Failure and Post-Failure Remote Sensing Data to Constrain the Three-Dimensional Numerical Model of a Large Rock Slope Failure. Landslides 2021, 18, 827–847. [Google Scholar] [CrossRef]
- Guerin, A.; Jaboyedoff, M.; Collins, B.D.; Derron, M.-H.; Stock, G.M.; Matasci, B.; Boesiger, M.; Lefeuvre, C.; Podladchikov, Y.Y. Detection of Rock Bridges by Infrared Thermal Imaging and Modeling. Sci. Rep. 2019, 9, 13138. [Google Scholar] [CrossRef] [PubMed] [Green Version]
- Palmstrom, A. Measurement and Characterization of Rock Mass Jointing; Sharma, V.M., Saxena, K.R., Eds.; A. A. Balkema Publishers: Lisse, The Netherlands; Abingdon, UK; Exton, PA, USA; Tokio, Japan, 2001. [Google Scholar]
- Zhang, W.; Lan, Z.; Ma, Z.; Tan, C.; Que, J.; Wang, F.; Cao, C. Determination of Statistical Discontinuity Persistence for a Rock Mass Characterized by Non-Persistent Fractures. Int. J. Rock Mech. Min. Sci. 2020, 126, 104177. [Google Scholar] [CrossRef]
- Zhang, W.; Wang, J.; Xu, P.; Lou, J.; Shan, B.; Wang, F.; Cao, C.; Chen, X.; Que, J. Stability Evaluation and Potential Failure Process of Rock Slopes Characterized by Non-Persistent Fractures. Nat. Hazards Earth Syst. Sci. 2020, 20, 2921–2935. [Google Scholar] [CrossRef]
- Mastrorocco, G.; Salvini, R.; Esposito, G.; Seddaiu, M. 3D Point Cloud Analysis for Surface Roughness Measurement: Application of UAV Photogrammetry. Rend. Online Soc. Geol. Ital. 2016, 41, 313–316. [Google Scholar] [CrossRef]
- Salvini, R.; Vanneschi, C.; Coggan, J.S.; Mastrorocco, G. Evaluation of the Use of UAV Photogrammetry for Rock Discontinuity Roughness Characterization. Rock Mech Rock Eng. 2020, 53, 3699–3720. [Google Scholar] [CrossRef]
- Bolla, A.; Paronuzzi, P. Geomechanical Field Survey to Identify an Unstable Rock Slope: The Passo Della Morte Case History (NE Italy). Rock Mech Rock Eng. 2020, 53, 1521–1544. [Google Scholar] [CrossRef]
- Shang, J.; West, L.J.; Hencher, S.R.; Zhao, Z. Geological Discontinuity Persistence: Implications and Quantification. Eng. Geol. 2018, 241, 41–54. [Google Scholar] [CrossRef]
- Wyllie, D.C.; Mah, C.W. Rock Slope Engineering: Civil and Mining, 4th ed.; Spon Press: London, UK; New York, NY, USA, 2004; p. 456. [Google Scholar]
- Available online: http://https://www.rocscience.com/software/dips (accessed on 10 May 2021).
- Available online: http://www.cloudcompare.org/doc/qCC/CloudCompare%20v2.6.1%20-%20User%20manual.pdf (accessed on 12 March 2021).
- Draebing, D.; Krautblatter, M. The Efficacy of Frost Weathering Processes in Alpine Rockwalls. Geophys. Res. Lett. 2019, 46, 6516–6524. [Google Scholar] [CrossRef]
- Gratchev, I.; Pathiranagei, S.V.; Kim, D.H. Strength Properties of Fresh and Weathered Rocks Subjected to Wetting–Drying Cycles. Geomech. Geophys. Geo-Energ. Geo-Resour. 2019, 5, 211–221. [Google Scholar] [CrossRef] [Green Version]
- Francioni, M.; Sciarra, N.; Ghirotti, M.; Borgatti, L.; Salvini, R.; Calamita, F. The Impact of New Technologies in the Engineering Classification of Rock Masses. Ital. J. Eng. Geol. Environ. 2019, 33–39. [Google Scholar] [CrossRef]
- Pagano, M.; Palma, B.; Ruocco, A.; Parise, M. Discontinuity Characterization of Rock Masses through Terrestrial Laser Scanner and Unmanned Aerial Vehicle Techniques Aimed at Slope Stability Assessment. Appl. Sci. 2020, 10, 2960. [Google Scholar] [CrossRef]
- Popov, V.I. Frost Weathering as a Process of Degradation of Surface of Rocks under the Action of Internal Stresses. IOP Conf. Ser. Earth Environ. Sci. 2020, 459, 052018. [Google Scholar] [CrossRef] [Green Version]
- Hencher, S. Practical Rock Mechanics; Taylor & Francis: Boca Raton, FL, USA, 2015. [Google Scholar]
- Casagli, N.; Pini, G. Analisi cinematica della stabilità di versanti naturali e fronti di scavo in roccia. Geol. Appl. Idrogeol. 1993, 28, 223–232. (In Italian) [Google Scholar]
- Barton, N.; Choubey, V. The shear strength of rock joints in theory and practice. Rock Mech. 1977, 10, 1–54. [Google Scholar] [CrossRef]


| Date | Time | Rockfall Volume | Consequences | Note |
|---|---|---|---|---|
| 11 February 1963 | 21:48 | Unknown | Traffic interruption | - |
| 6 September 1964 | 16:52 | Unknown | Traffic interruption | - |
| 18 November 1975 | - | >500 m3 | Facilities damage, human casualties | The train ran into rock blocks and slipped off the tracks |
| 16 March 1976 | 20:30 | Unknown | Traffic interruption | - |
| 28 May 1976 | 20:30 | Unknown | Traffic interruption | - |
| 28 January 1977 | 00:25 | Unknown | Traffic interruption | - |
| 2 March 1977 | 10:20 | Unknown | Traffic interruption | - |
| 7 May 1987 | 17:30 | Unknown | Traffic interruption | Damage to train bumper |
| 11 November 1987 | 01:45 | Unknown | Traffic interruption | The train stopped before the rock blocks |
| 21 December 1990 | 03:45 | ≈20 m3 | Traffic interruption | - |
| 11 August 1992 | 14:15 | >500 m3 | Traffic interruption | Caused by storm |
| 21 October 1993 | - | ≈10 m3 | Traffic interruption | Caused by storm |
| 3 October 1994 | 04:47 | Block > 15 m3 | Traffic interruption | Locomotive and first wagon slipped off the tracks |
| November 1998 | - | Six blocks ≈ 0.7 m3 each | Traffic closed | Blocks stopped over the railway in the forest |
| 10 February 1999 | 17:45 | >500 m3 | Facilities damage | Caused by storm |
| 2 November 1999 | 05:35 | Block ≈ 2 m3 | Traffic interruption | The train stopped before the rock block |
| 27 November 1999 | - | Block ≈ 0.8 m3 | Traffic closed | - |
| 16 December 2013 | - | ≈20 m3 | Facilities damage | Traffic stopped for several months |
| Joint Set | Dip Direction/Dip | Discontinuity Spacing (cm) | Persistence (m) |
|---|---|---|---|
| Joint Set 1 | 8–209/73–84 | 250–500 | >20 |
| Joint Set 2 | 88–281/76–88 | 120–310 | >20 |
| Bedding | 224–307/1–23 | 10–150 | >20 |
| Joint Set | Dip Direction/Dip | Discontinuity Spacing (cm) | Persistence (m) |
|---|---|---|---|
| Joint Set 1 | 10–210/75–85 | 300–500 | >20 |
| Joint Set 2 | 90–280/75–85 | 100–300 | >20 |
| Bedding | 230–305/0–25 | 20–200 | >20 |
| Cliff Zone | Joint Set | Mean Dip Direction/ Dip + | Discontinuity Spacing (cm) + | Separation (mm) * | Infilling * | Roughness (JRC) * | Weathering Grade * | Block Volume (m3) x | RMR x |
|---|---|---|---|---|---|---|---|---|---|
| Z1 | Joint set 1 | 10/85 | 300–500 | 5–100 | None | 8–10 | SW/MW | 1.2–10.0 | 58 |
| Joint set 2 | 280/80 | 80–100 | <5 | None | 8–10 | SW/MW | |||
| Bedding | 305/30 | 50–200 | 1–50 | Hard filling | 6–8 | SW/MW | |||
| Z2 | Joint set 1 | 190/85 | >100 | 1–5 | None | 8–10 | SW/MW | 0.5–15.0 | 60 |
| Joint set 2 | 110/85 | 100–300 | 0.1–5 | None | 8–10 | SW/MW | |||
| Bedding | 25/25 | 50–200 | <5 | Hard filling | 6–8 | SW/MW | |||
| Z3 | Joint set 1 | 205/75 | 50–300 | >5 | None | 4–6 | SW | 0.01–18.0 | 54 |
| Joint set 2 | 110/80 | 20–300 | >5 | None | 4–6 | SW | |||
| Bedding | 230/20 | 10–200 | 1–5 | Hard filling | 4–6 | SW/MW | |||
| Z4 | Joint set 1 | 10/85 | 50–300 | <5 | None | 6–8 | SW | 0.03–25.0 | 58 |
| Joint set 2 | 280/75 | 50–300 | <5 | None | 6–8 | SW | |||
| Bedding | 0/15 | 50–300 | <5 | Hard filling | 4–6 | SW/MW | |||
| Z5 | Joint set 1 | 5/75 | 50–300 | <5 | None | 6–8 | SW/MW | 0.05–18.0 | 58 |
| Joint set 2 | 90/80 | 50–300 | <5 | None | 6–8 | SW/MW | |||
| Bedding | 10/20 | 20–200 | 1–5 | Hard filling | 6–8 | SW/MW |
| Cliff Zone | Type of Failure | Probability (%) | Number of Planes |
|---|---|---|---|
| Planar sliding | 3.06 | ||
| Z1 | Direct toppling | 11.11 | 914 |
| Flexural toppling | 22.76 | ||
| Planar sliding | 3.10 | ||
| Z2 | Direct toppling | 8.25 | 3099 |
| Flexural toppling | 43.21 | ||
| Planar sliding | 3.93 | ||
| Z3 | Direct toppling | 11.22 | 2750 |
| Flexural toppling | 40.73 | ||
| Planar sliding | 3.73 | ||
| Z4 | Direct toppling | 8.33 | 3301 |
| Flexural toppling | 43.93 | ||
| Planar sliding | 2.43 | ||
| Z5 | Direct toppling | 9.94 | 2260 |
| Flexural toppling | 32.88 |
Publisher’s Note: MDPI stays neutral with regard to jurisdictional claims in published maps and institutional affiliations. |
© 2022 by the authors. Licensee MDPI, Basel, Switzerland. This article is an open access article distributed under the terms and conditions of the Creative Commons Attribution (CC BY) license (https://creativecommons.org/licenses/by/4.0/).
Share and Cite
Udovič, D.; Kordić, B.; Arbanas, Ž. Geotechnical Study of Raspadalica Cliff Rockfall, Croatia. Appl. Sci. 2022, 12, 6532. https://doi.org/10.3390/app12136532
Udovič D, Kordić B, Arbanas Ž. Geotechnical Study of Raspadalica Cliff Rockfall, Croatia. Applied Sciences. 2022; 12(13):6532. https://doi.org/10.3390/app12136532
Chicago/Turabian StyleUdovič, Dalibor, Branko Kordić, and Željko Arbanas. 2022. "Geotechnical Study of Raspadalica Cliff Rockfall, Croatia" Applied Sciences 12, no. 13: 6532. https://doi.org/10.3390/app12136532
APA StyleUdovič, D., Kordić, B., & Arbanas, Ž. (2022). Geotechnical Study of Raspadalica Cliff Rockfall, Croatia. Applied Sciences, 12(13), 6532. https://doi.org/10.3390/app12136532