1. Introduction
In numerical simulations of tunnel advance, the constitutive model for the surrounding rock mass is a key component for obtaining realistic deformations and stress states. However, in most of the existing tunneling simulations considered in a practical engineering context, frequently isotropic linear–elastic perfectly plastic material models are employed, neglecting two essential characteristics of the mechanical behavior of rock: First, the mechanical behavior of rock is highly nonlinear. This is manifested by a nonlinear response in triaxial compression, irreversible deformation including strain hardening in the pre-peak regime as well as strain softening, accompanied by a degradation of the material stiffness, in the post-peak regime of the stress-strain relations. Second, depending on the genesis of a particular rock, inherent structures, such as stratification or foliation planes, lead to a distinct inherent anisotropic material behavior.
Typical approaches for capturing the nonlinear and potentially anisotropic mechanical behavior of rock mass can be classified into two main categories: (i) continuum-based approaches, treating rock mass as an equivalent continuum with smeared properties of both rock and discontinuities, and (ii) discontinuum approaches, in which discontinuities between pieces of intact rock are modeled in a discrete manner. The scope of this publication is on the continuum-based modeling of rock; readers interested in discontinuum modeling are referred to the literature, e.g., Lisjak and Grasselli [
1], Jing and Hudson [
2], Jing [
3], Barton [
4] or Wittke [
5].
In contrast to discontinuum approaches, continuum-based approaches offer an approximate but computationally more efficient approach for modeling rock mass, as inherent discontinuities and intact rock are modeled in a smeared manner as a quasi-continuum. For estimating the mechanical properties, either a homogenization procedure based on a representative volume element, or, as an alternative, empirical relations may be employed. A popular representative of the last category was proposed by Hoek et al. [
6,
7] for estimating the strength and stiffness of quasi-homogeneous rock mass based on a rock mass classification system.
Continuum-based modeling approaches assuming quasi-isotropic elasto-plastic behavior have been widely used since the 1970s. Most of them use failure criteria according to Hoek–Brown [
8] or Mohr–Coulomb. For a realistic modeling of the highly nonlinear mechanical behavior of rock, Unteregger et al. [
9] proposed an isotropic rock damage–plasticity model. It originates from the well-established concrete model by Grassl and Jirásek [
10] and incorporates linear elasticity, hardening plasticity with non-associated plastic flow as well as strain softening resulting from damage due to micro-cracking. The smooth Hoek–Brown failure criterion, proposed by Menétrey and Willam [
11] is used as an ultimate strength envelope. For objectively capturing structural failure mechanisms, such as the formation of shear bands in the context of tunnel excavation or borehole breakout, the model was extended by an over-nonlocal implicit gradient-enhanced formulation by Schreter et al. [
12].
The above mentioned models are restricted to rock types with isotropic material behavior. However, inherent anisotropy associated with an oriented microstructure of rock may have a significant impact on predicting the mechanical behavior. Especially in a stratified or foliated rock mass, e.g., shales or phyllites, often the special cases of orthotropic or transversely isotropic material behavior arise.
For considering such inherent direction dependence in continuum-based models, several approaches have been developed in the past: anisotropic yield functions were proposed by Hill [
13], Pariseau [
14] and Tsai and Wu [
15], amongst others. Ubiquitous joint models, building upon the
single plane of weakness theory by Jaeger [
16], in which failure—in the rock matrix, along oriented joints or in both—may occur, were proposed by Goodman et al. [
17] and Ismael et al. [
18,
19]. An anisotropic generalization of isotropic failure criteria by means of scalar anisotropy parameters was proposed by Pietruszczak and Mroz [
20], Gao et al. [
21], Chen et al. [
22,
23] and Parisio et al. [
24]. Alternatively, by means of a linear mapping of the Cauchy stress tensor into a fictitious isotropic configuration, originally proposed by Boehler [
25], a transversely isotropic failure criterion was obtained as an extension of an isotropic failure criterion. This approach was applied in several works, e.g., [
26,
27,
28,
29,
30,
31]. The last three mentioned concepts, i.e., ubiquitous joint models, generalization of isotropic failure criteria by means of scalar anisotropy parameters and linear mapping into a fictitious isotropic configuration, were part of a comprehensive review for considering transversely isotropic material behavior by Mader et al. [
32]. The mapping of the Cauchy stress tensor into a fictitious isotropic configuration turned out to be the most versatile modeling approach. Thus, the
transversely
isotropic
rock
damage–
plasticity (TI-RDP) model was proposed by combining the isotropic rock damage–plasticity model [
9,
12] and the approach by Boehler [
25]. Based on three-dimensional (3D) FE simulations of triaxial compression tests, it was shown that the TI-RDP model is well suited for modeling the inherent direction-dependent and highly nonlinear behavior of stratified or foliated rock types in a realistic manner.
Modeling the tunnel excavation or borehole breakout was subject of numerous publications, e.g., [
27,
33,
34,
35,
36,
37,
38]. In Schreter et al. [
39], the importance of employing advanced constitutive models for rock mass and shotcrete for predicting the mechanical behavior of deep tunnels was demonstrated. In Wang et al. [
40], numerical simulations of the failure mechanism of tunneling in transversely isotropic rock mass were presented. Schuller and Schweiger [
41] investigated the deformation behavior of a tunnel structure using a multi-laminate model for the surrounding rock mass, considering directional dependencies but not damaging processes. Pardoen et al. [
42] investigated the influence of transversely isotropic elasto-plastic material behavior on the evolution of shear bands during tunnel excavation, considering the approach by Pietruszczak and Mroz [
20] and including strain hardening and softening. For regularizing the softening behavior, a local second gradient model was used.
The combined effect of the highly nonlinear material behavior and the inherent anisotropic response of rock is inevitable in particular for the numerical analysis of potential collapse of a tunnel structure in stratified or foliated rock mass.
Thus, in this contribution the influence of both the highly nonlinear and anisotropic mechanical behavior of stratified or foliated rock mass on the deformation, stress distribution and stability during tunnel excavation, will be systematically investigated on the example of a well-monitored stretch of the Brenner Base Tunnel (BBT), which connects Austria and Italy through the Eastern Alps (cf.
Figure 1). For a more detailed representation of the geology, interested readers are referred to, for example, Foderà et al. [
43] or Bistacchi et al. [
44].
To this end, the recently proposed continuum-based rock model will be enhanced for considering the influence of discontinuities, i.e., joints and faults, in rock mass. The latter are considered by reducing the intact rock parameters independent of the orientation of the discontinuities in terms of the
geological
strength
index GSI, whereas the anisotropic mechanical behavior only refers to the stratification or foliation planes of intact rock. The material parameters will be identified by means of 3D finite element simulations of triaxial tests on specimens of
quartz-phyllite belonging to the Innsbruck quartz-phyllite complex according to
Figure 1. They were conducted for varying loading angles with respect to the foliation planes and different confining pressures.
The remainder of the paper is organized as follows: In
Section 2, the equations of the TI-RDP model are briefly summarized and extended for modeling stratified or foliated rock mass (in contrast to intact rock). In
Section 3, the calibration of the material parameters by means of 3D finite element simulations of triaxial tests on
Innsbruck quartz-phyllite with different loading directions with respect to the foliation planes and different confining pressures are presented. In
Section 4, the influence of the orientation of foliation planes on the mechanical behavior of the rock mass during tunnel excavation is assessed by means of 2D finite element simulations, and a comparison with the results from a related study by Schreter et al. [
12], using an
isotropic rock damage–plasticity model, is presented. Finally, in
Section 5, the paper is closed with a summary and a discussion on recommended future research activities.
2. A Transversely Isotropic Damage–Plasticity Model for Intact Rock and Rock Mass
In the following, the
transversely
isotropic
damage–
plasticity (TI-RDP) model, proposed by Mader et al. [
32], is described briefly and extended for considering the mechanical behavior of rock mass. A description of the used symbols is provided in
Table A1 in
Appendix A.The TI-RDP model is based on a combination of the isotropic damage–plasticity model, proposed by Unteregger et al. [
9], extended by an implicit gradient-enhanced regularization scheme in Schreter et al. [
12], and the approach by Boehler [
25] for capturing transversely isotropic material behavior.
Based on the theories of plasticity and damage mechanics, the stress–strain relation of the TI-RDP model, defined in the global coordinate system, reads as
where
denotes the nominal Cauchy stress tensor (force per total area),
is the scalar isotropic damage variable ranging from 0 (undamaged material) to 1 (completely damaged material),
and
represent the total and the plastic strain tensor, respectively. The fourth-order
transversely
isotropic elastic stiffness tensor with respect to the global coordinate system
is obtained by transforming the transversely isotropic elastic stiffness tensor
, aligned with the principal directions of the material, into the global coordinate system by means of the orthogonal transformation matrix
. In Voigt notation,
reads as
characterized by five independent material parameters, i.e., the Young’s modulus
in the direction of the normal vector
to the planes of isotropy (planes with the same material parameters in all directions within those planes), i.e,
represents the axis of material symmetry, as illustrated in
Figure 2, the Poisson’s ratio
and the shear modulus
in the planes containing the axis of material symmetry, and the Young’s modulus
as well as the Poisson’s ratio
, both in the plane of isotropic material behavior.
As shown in
Figure 2, in contrast to intact rock, which is characterized by a stratification or a pervasive foliation, the macro structure of rock mass is governed by mechanical discontinuities, such as joints and faults, resulting in a strong dependence of the material properties of rock mass on the surface conditions of those discontinuities. Thus, by analogy to the isotropic version of the RDP model, the elastic stiffness properties of intact rock, i.e., the Young’s moduli
and
as well as the shear modulus
are multiplied by the empirical stiffness reduction factor
according to Hoek et al. [
6]. The latter is expressed in terms of the
geological
strength
index (GSI) for considering the geological conditions of rock mass, ranging from 1 (intact rock) to 0 (completely disintegrated rock), and the disturbance factor D for taking into account the disturbance of the in situ stress in the rock mass due to the excavation process with
. According to Hoek et al. [
7], for excellent quality controlled blasting or mechanized tunneling,
is recommended.
2.1. Transversely Isotropic Plasticity Formulation
The plastic part of the TI-RDP model is formulated in terms of the effective stress tensor
(force per undamaged area), which is linked to the nominal stress tensor
by
. For considering the transversely isotropic behavior, a fictitious effective stress tensor
is defined by mapping the effective stress tensor into a fictitious isotropic configuration, denoted by the superscript
, as originally proposed by Boehler [
25] and for instance applied by Semnani et al. [
28], Borja et al. [
46] and Bryant [
29,
47].
denotes the fourth-order linear mapping tensor with major and minor symmetry, reading in terms of the Walpole algebra [
48] as
with the anisotropy parameters
and
. The latter are linked to the uniaxial compressive strength for intact rock perpendicular to the planes of isotropy
, the uniaxial compressive strength parallel to the latter
, the shear strength in planes perpendicular to the planes of isotropy
and the shear strength in the plane of isotropy
by
can be determined by means of uniaxial compression tests with loading directions perpendicular and parallel to the planes of isotropy of intact layered rock.
can be determined by simple shear tests with loading in planes perpendicular to the planes of isotropy and in the plane of isotropy of intact layered rock. According to (7),
and
are limited to values greater than 0 for a meaningful physical interpretation. The sub-tensors
describe the influence of the stratification or foliation planes on the material behavior, based on the microstructure tensor
and its orthogonal tensor
, which are both defined by the normal vector
of the planes of isotropy.
For delimiting the elastic domain, a direction-dependent yield criterion is formulated by expressing the yield function of the original isotropic RDP model in terms of the Haigh–Westergaard coordinates
,
and
of the mapped effective stress tensor
:
According to (5), the mapped effective stress depends on the mapping tensor
and thus incorporates the orientation of the principal material directions and the anisotropy parameters. The parameters of the yield function comprise the uniaxial compressive strength for loading perpendicular to the planes of isotropy
, the friction parameter for intact rock
and two empirical reduction factors,
and
, for considering the influence of discontinuities on the friction and cohesion in rock mass by analogy to the original isotropic RDP model. Hoek et al. [
7] proposed the latter as
and
in terms of the geological strength index GSI and the disturbance factor D. In
Figure 3, the influence of GSI and D on the empirical reduction factors, defined by (4), (10) and (11), is depicted.
The shape of the yield function in deviatoric planes is controlled by the Willam–Warnke [
49] function
, defined by the eccentricity parameter
e ranging from 0.5 (triangular shape) to 1 (circular shape). The evolution of the yield function (9) is controlled by the stress-like hardening variable
, depending on the strain-like hardening variable
. For
, the ultimate strength surface
corresponds to the smooth version of the Hoek–Brown failure criterion, proposed by Menétrey and Willam [
11].
For considering the influence of transverse isotropy on the plastic strain tensor
, the non-associated plastic potential function
is also formulated in terms of the mapped effective stress tensor, reading as
represents a reduced dilatancy parameter, calculated by the dilatancy parameter for intact rock
, which can be determined from uniaxial compression tests, loaded perpendicular to the planes of isotropy, and triaxial compression tests, loaded in the principal material directions of an intact rock specimen. As described in detail by Unteregger et al. [
50], the parameter
denotes a dependent dilatancy parameter, which can be calculated from
such that the radial plastic strain rate vanishes in uniaxial tension perpendicular to the planes of isotropy.
For calculating the rate of the plastic strain tensor, the plastic potential function (12) is employed in the non-associated flow rule
with
denoting the consistency parameter.
The stress-like hardening variable
with the uniaxial compressive yield stress for the loading direction perpendicular to the planes of isotropy
, is formulated in terms of the strain-like hardening variable
, the evolution of which is governed by
For controlling the ductility of the hardening behavior, the strain-like hardening variable depends on a direction-dependent hardening ductility measure
, defined as
with
and the hardening parameters
,
,
,
and
. As described in detail by Mader et al. [
32], the dependence of the ductility behavior in the hardening regime on the material orientation can be different from the transversely isotropic variation of the yield surface. Thus, a modified mapping tensor
is defined for controlling the direction dependence of the hardening ductility measure, introducing an additional anisotropy parameter
.
2.2. Transversely Isotropic Gradient-Enhanced Damage Behavior
Damage material behavior is initiated when the yield function (9) attains the ultimate strength surface, i.e., at
. The evolution of the damage variable
is described by the exponential relation
as a function of the local damage driving variable
. It is controlled by the softening modulus
for the loading direction perpendicular to the planes of isotropy. The latter can be calibrated by the specific mode I fracture energy
for loading perpendicular to the planes of isotropy. The rate equation for the local damage driving variable is given as
with
and
denoting the volumetric plastic strain rate and the softening ductility measure, respectively.
represents the compressive part of the volumetric plastic strain rate and
and
are softening parameters, which can be calibrated from uniaxial compression tests, loaded perpendicular to the planes of isotropy, and triaxial compression tests, loaded in the principal material directions.
For obtaining mesh-independent results in finite element simulations considering strain softening, the TI-RDP model is regularized by an over-nonlocal implicit gradient enhancement, following Schreter et al. [
12]. For this purpose, in (18)
is replaced by the over-nonlocal softening variable
represents the nonlocal counterpart of
, and
m is the weighting parameter. The nonlocal softening variable
is implicitly determined by the screened Poisson equation
with
l denoting an internal length scale parameter. The weak form of (21) together with the weak form of the equilibrium equations yields a coupled system of differential equations with the displacements
and the nonlocal softening variable
as the primary unknowns. A detailed description of the over-nonlocal implicit gradient enhancement can be found in Schreter et al. [
12].
Note that according to (13), the rate of the plastic strain tensor depends on the mapping tensor . Hence, the evolution of and consequently of the damage variable are influenced by the direction-dependent material behavior.
3. Parameter Calibration
In the following, the material parameters of the TI-RDP model are calibrated for
Innsbruck quartz-phyllite based on experimental results of triaxial compression tests performed by Blümel [
51] on specimens sampled from a construction site of the Brenner Base Tunnel. The eccentricity parameter
e in (9) cannot be calibrated by triaxial compression tests. It is assumed as
as recommended in [
50]. In the experimental study, tests with three different confining pressures
12.5 MPa, 25 MPa and 37.5 MPa and three different directions of axial loading with respect to the inclination of the foliation planes, i.e.,
,
and
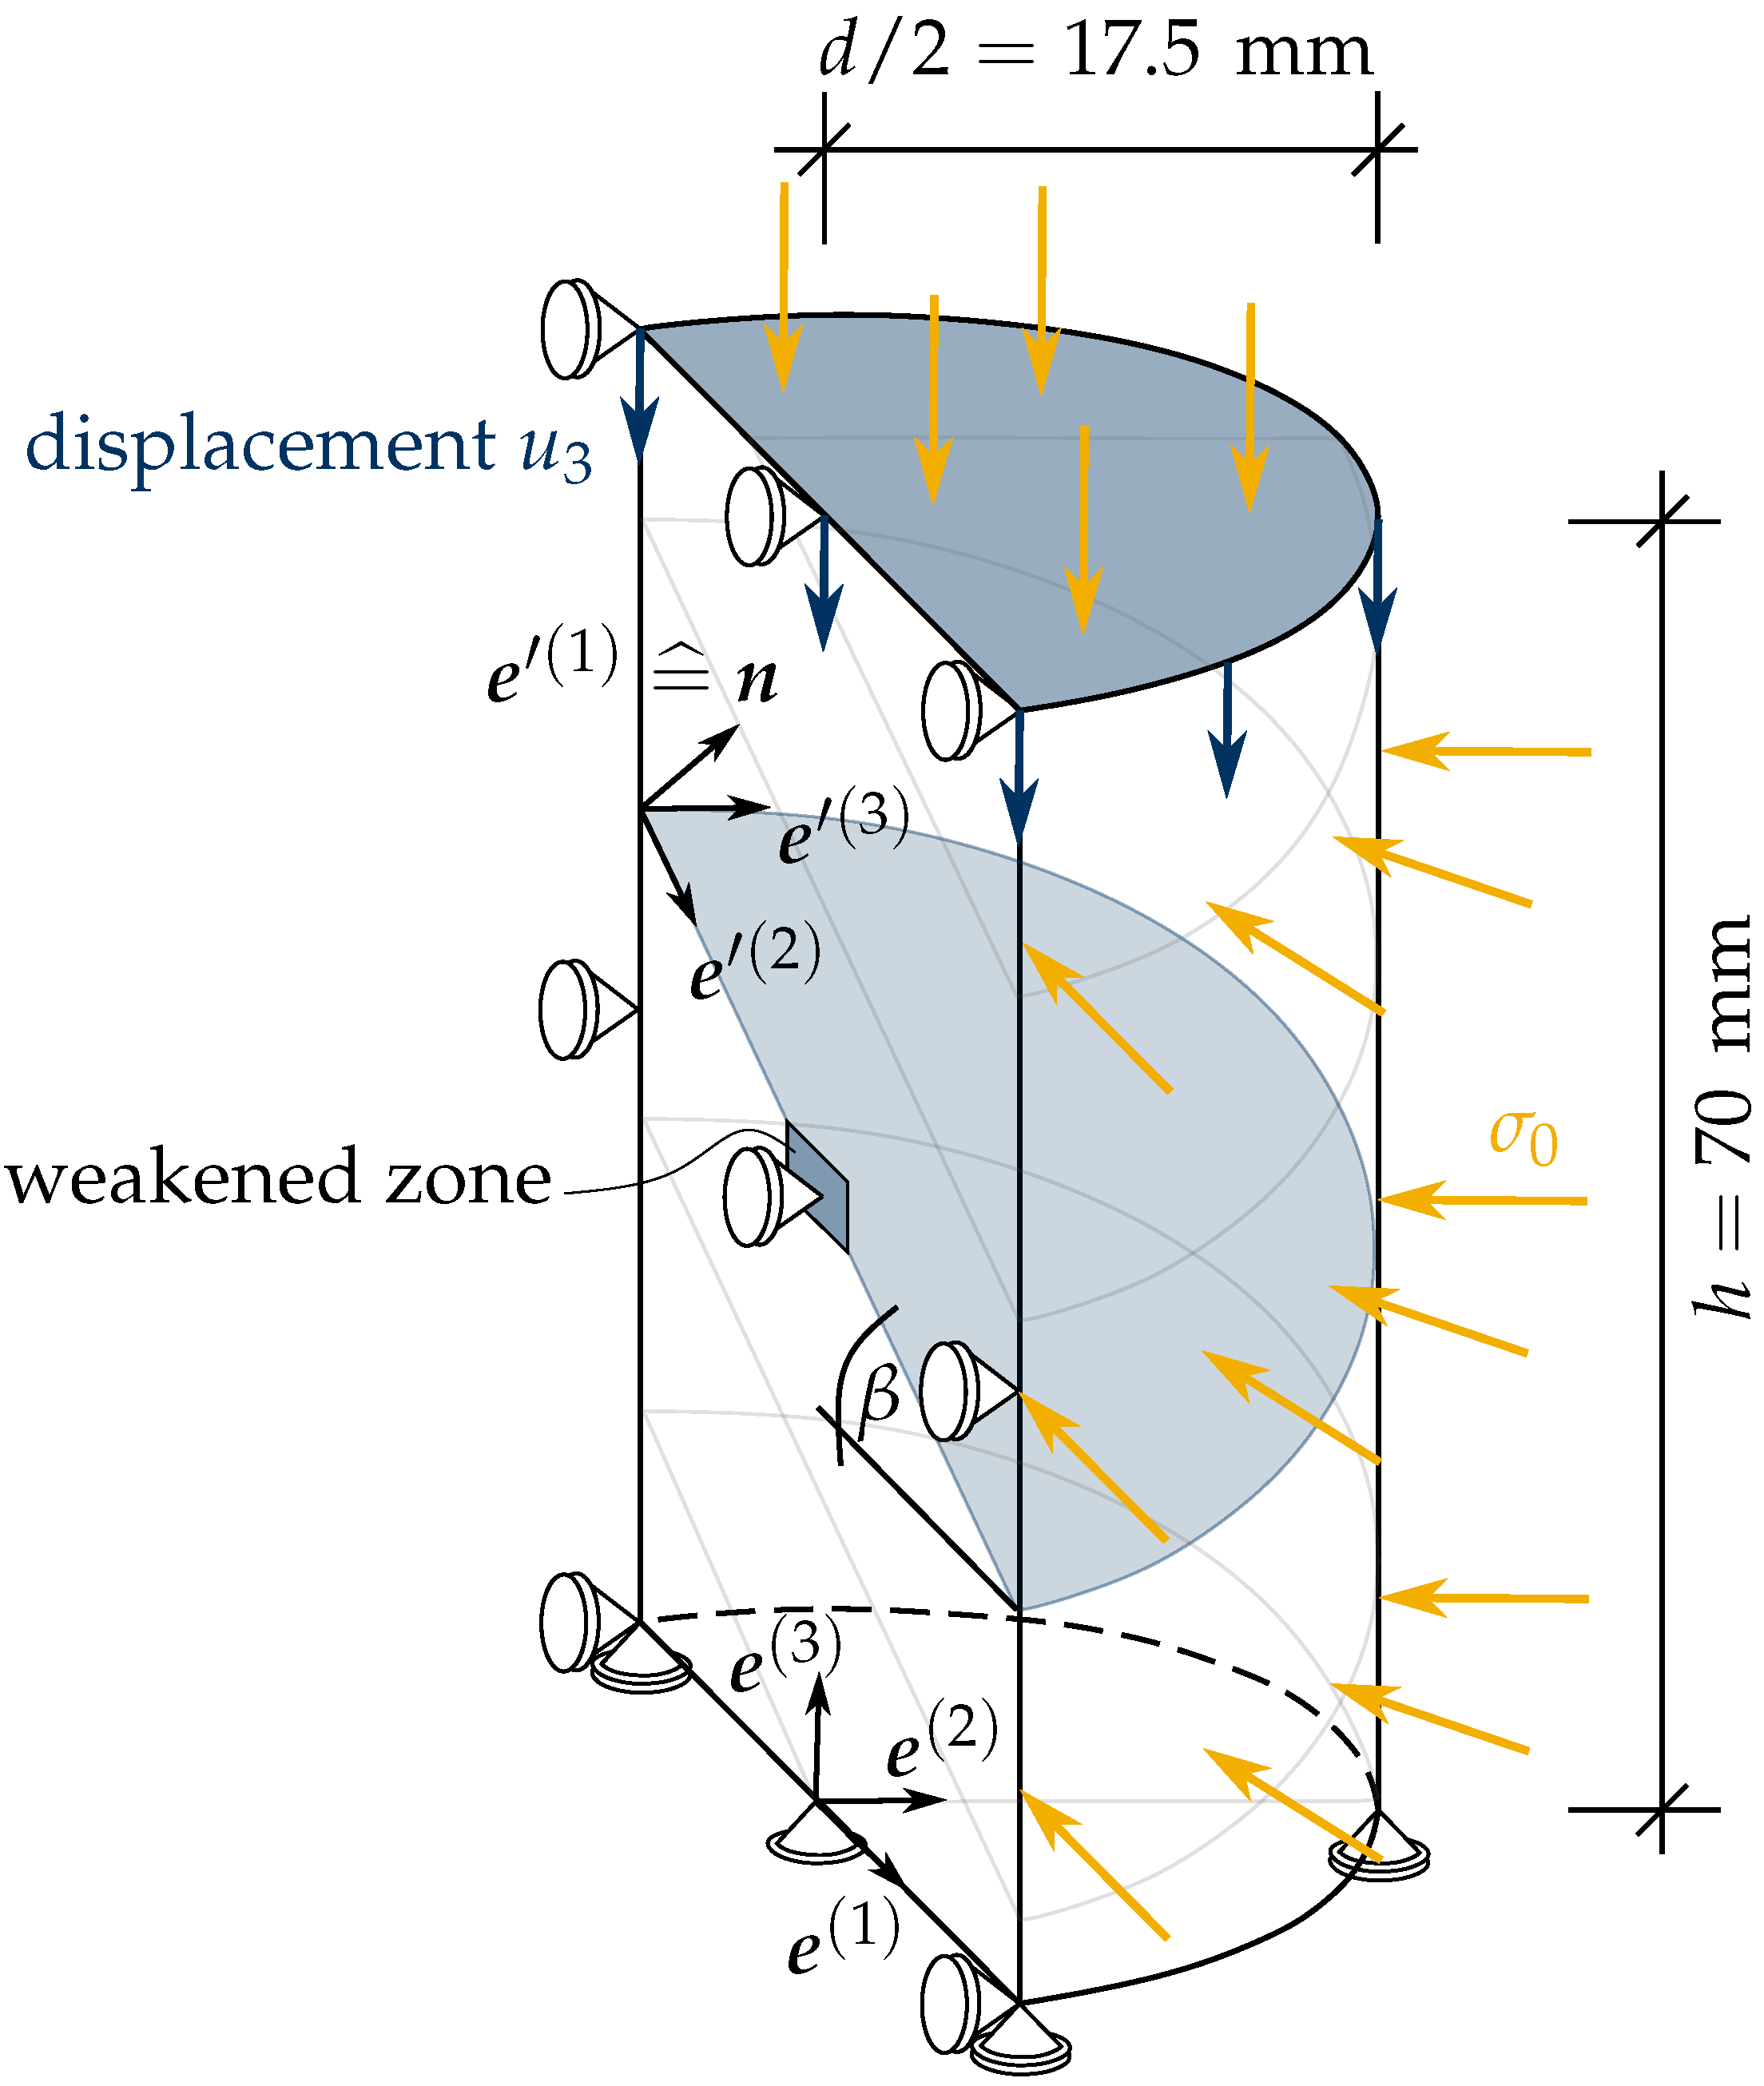
, were carried out. The cylindrical specimens with a height of 70 mm and a diameter of 35 mm were tested in a displacement controlled manner by monotonically increasing the axial displacement at the top surface of the specimens.
For the parameter calibration, a three-dimensional finite element model of the triaxial compression tests is employed. Compared to commonly used single-element tests for this purpose, by the 3D simulations, also the structural effects, such as non-uniform strain distributions associated with the formation of shear bands, are captured. In
Figure 4, the geometry and boundary conditions of the finite element model are illustrated. To reduce the number of degrees of freedom, symmetry is exploited. The specimen is discretized by 20-node quadrilateral finite elements with quadratic shape functions, reduced integration and a characteristic element size of 2.5 mm, resulting in 53,582 degrees of freedom in total. For triggering strain localization, in a small zone at the center of the specimen, elements with slightly reduced values for
and
by
are considered, cf.
Figure 4.
The material parameters
,
,
,
,
,
,
,
,
,
,
,
,
and
of the TI-RDP model are calibrated such that a best fit with the experimentally determined deviatoric stress–strain curves is obtained from tests with identical values of
and
. For this purpose, the sum of nonlinear least-squares is minimized by using the
trust-region constrained algorithm available within the framework of the
scipy.optimize module [
52] of Python. The calibrated material parameters are constrained to positive values, i.e., the lower bounds are set to zero. In addition,
is restricted to an upper bound of 200 MPa and
is applied as a linear constraint. This way, a unique local minimum could be found within the prescribed physically meaningful range of the material parameters for
Innsbruck quartz-phyllite. The
axial strain is taken as the top displacement divided by the initial length of the specimens. The hardening parameters
,
, and
, the softening parameters
and
and the eccentricity parameter
e are chosen as recommended by Unteregger et al. [
50]. The softening modulus
perpendicular to the foliation planes and the internal length parameter
l are chosen such that a characteristic value of the specific mode I fracture energy
for uniaxial tension perpendicular to the foliation planes of
N/mm, as suggested by Schreter et al. [
39], is obtained. The calibrated parameters and the hardening and softening parameters are listed in
Table 1.
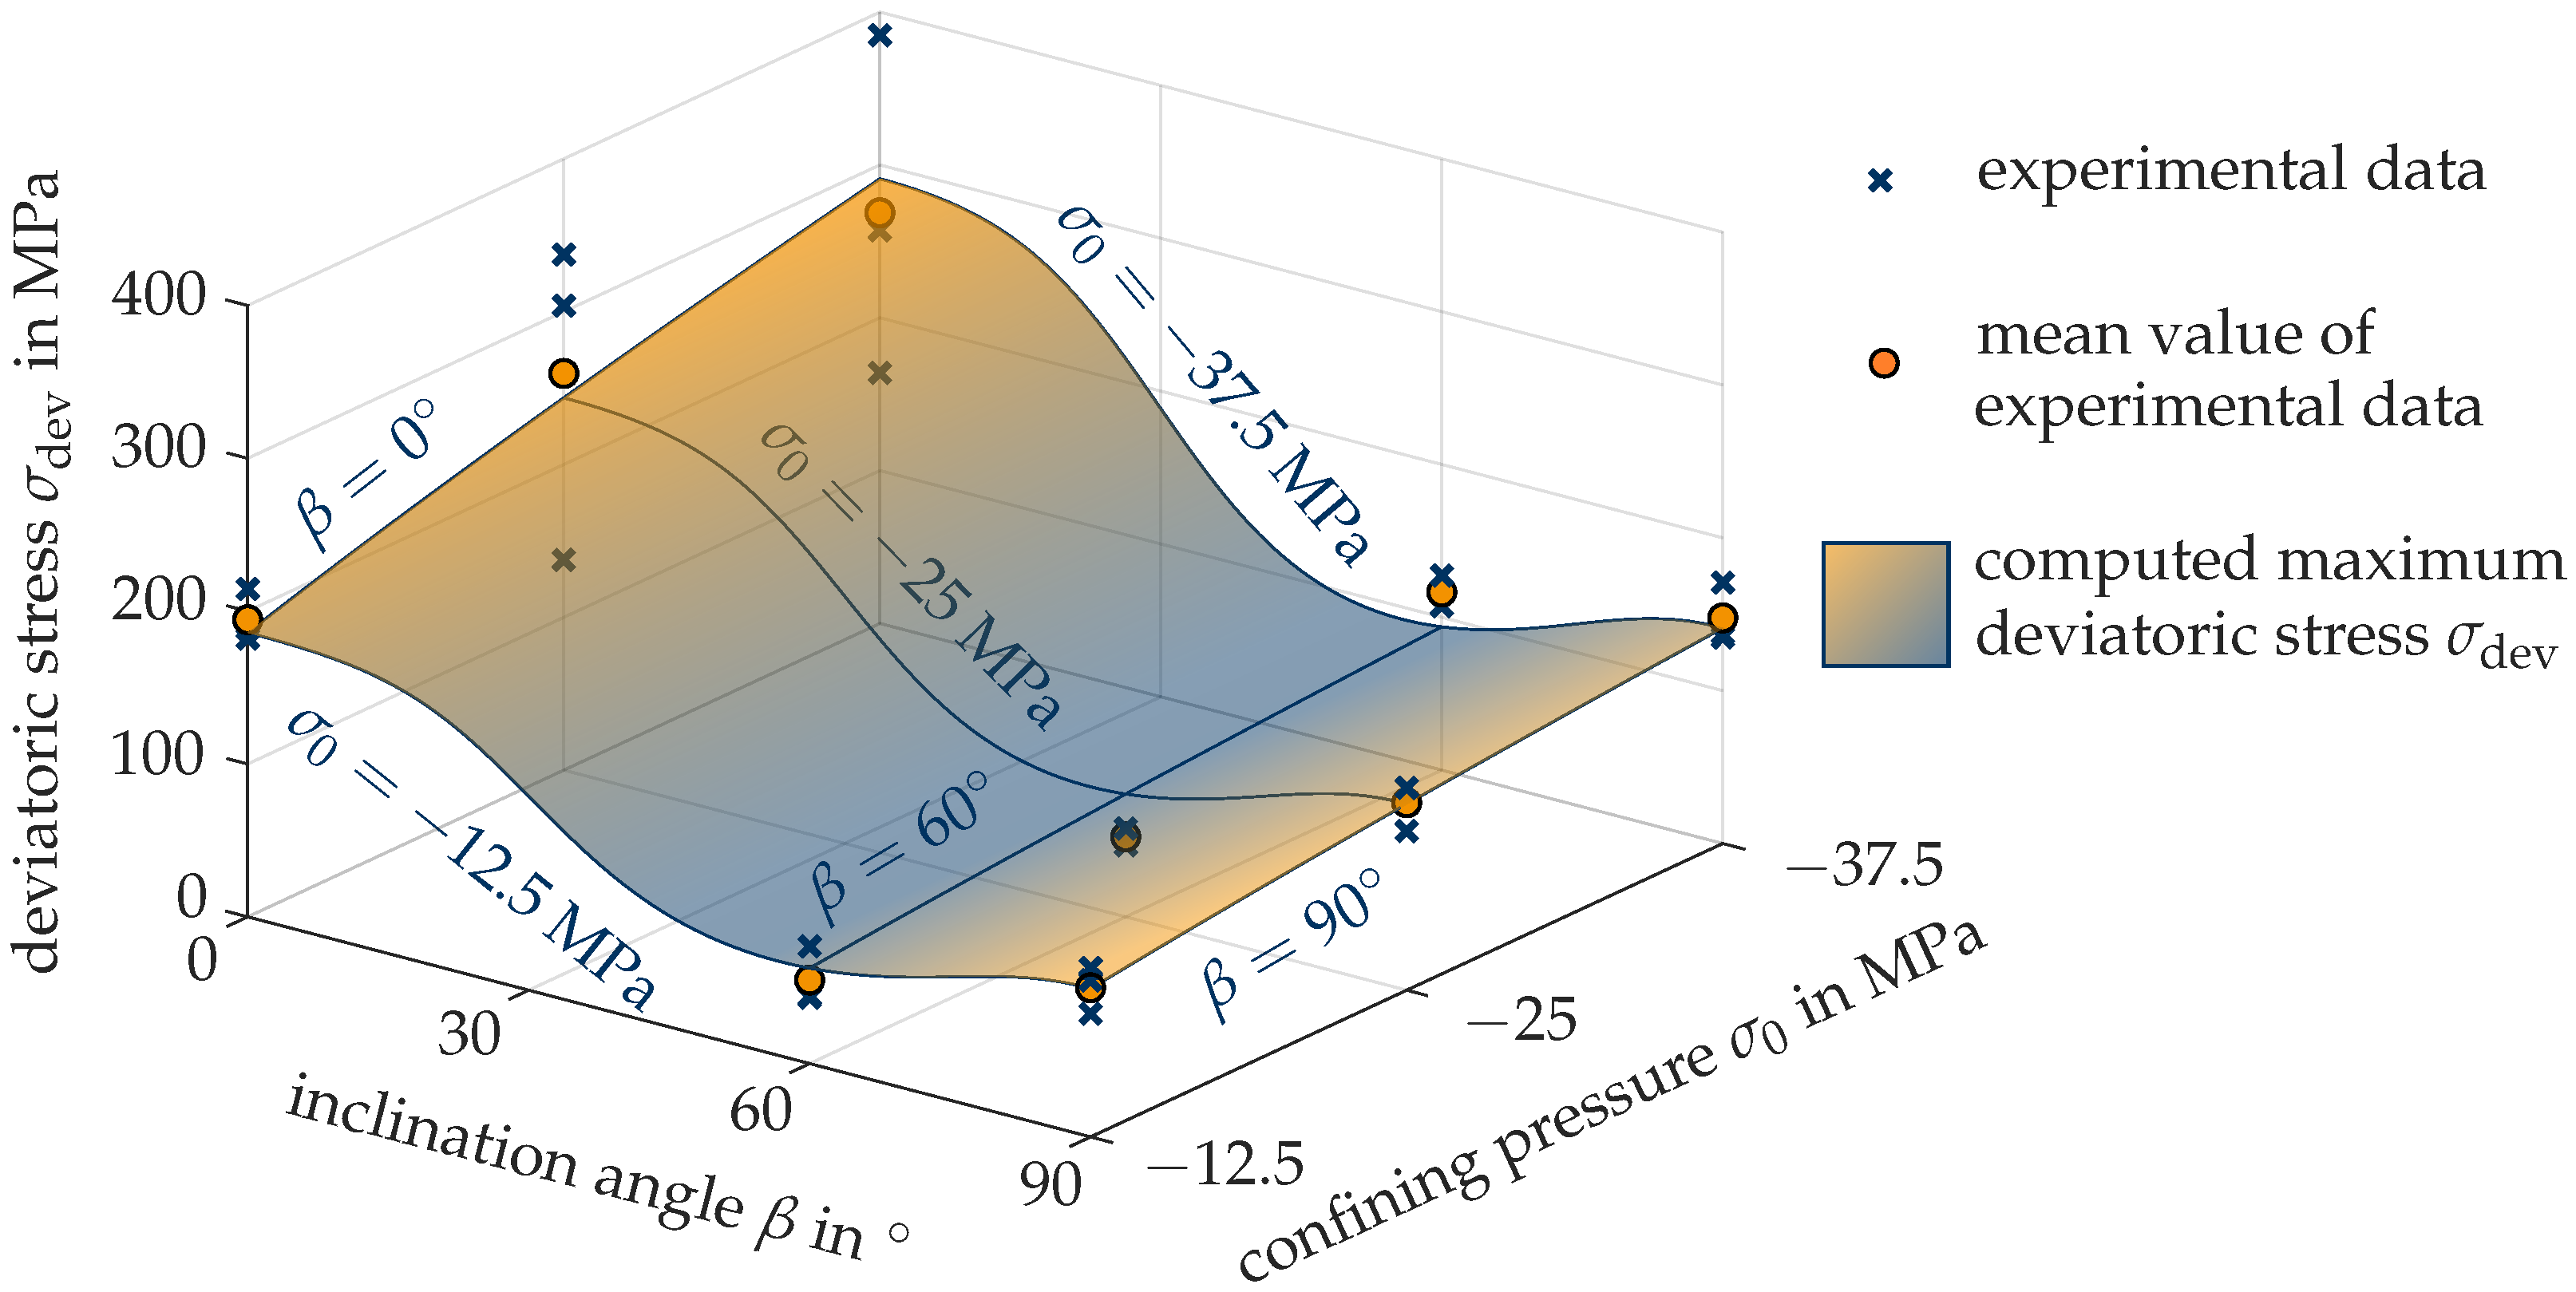
Figure 5 shows the computed maximum deviatoric stress
in terms of the confining pressure
and the inclination angle
of the foliation planes, compared to the respective peak values of the experimental data. From
Figure 5 follows, for a particular confining pressure, a strong direction dependence of the maximum deviatoric stress.
Figure 6 shows the computed deviatoric stress-strain curves of the triaxial compression tests together with the corresponding results from the experiments by Blümel [
51]. Despite of the large scatter of the experimental results, for the considered confining pressures of
MPa, 25 MPa and
MPa and inclination angles of the foliation planes
,
and
, the numerically predicted strength exhibits good agreement with the corresponding mean values of the experimentally determined strengths.
Furthermore, in the top row of
Figure 7, the computed distribution of the displacement magnitude is shown for an advanced stage of the simulation corresponding to a vertical top displacement of
mm, already indicating the predicted failure mode for the confining pressure of
MPa and the respective inclination angles
. In the bottom row of
Figure 7, the corresponding observed failure mechanisms in the experiments are depicted. A comparison of the observed and computed failure modes confirms good agreement for all three inclination angles of the foliation planes.
As noted from
Figure 7, the experimentally obtained crack does not necessarily pass through the center of the specimen as predicted by the numerical simulations. This discrepancy in the prediction of the location of the crack is traced back to the location of the introduced artificial imperfection in the numerical model. However, investigations of Desrues and Viggiani [
53] concluded that the location of imperfections, e.g., weak elements, does not influence the resulting global stress-strain curves. Thus, it is assumed that the calibration of the material parameters is not affected by the eccentric crack paths.
4. Numerical Simulation of Tunnel Excavation
The application of the gradient-enhanced transversely isotropic RDP model is demonstrated by predicting the formation of the complex pattern of shear bands due to the excavation of a deep tunnel. To this end, two-dimensional simulations of the excavation of a stretch of the Brenner Base Tunnel, constructed by the drill and blast method, are performed. In a previous publication [
12], the respective stretch was already the subject of a mesh study for investigating the capabilities of the gradient-enhanced regularization of the isotropic version of the rock damage-plasticity model ensuring mesh-independent response. Compared to the results of the latter, the impact of different orientations of the principal material directions of foliated rock mass will be demonstrated.
The finite element mesh together with the initial and boundary conditions is illustrated in
Figure 8. The tunnel profile is characterized by a circular cross section with a diameter of
m and an overburden of 950 m at the tunnel axis. To ensure a negligible influence of the boundary conditions (cf.
Figure 8 left) on the stress distribution in the vicinity of the tunnel, the considered area of the surrounding rock mass is chosen as 200 m × 200 m.
The model is discretized by 48,980 8-node finite elements with quadratic shape functions and reduced integration, resulting in 589,508 degrees of freedom. For triggering localized behavior, randomly chosen
of the elements in the near field of the tunnel cross section are weakened by reducing the uniaxial compressive strength
and the uniaxial yield strength
perpendicular to the foliation planes by
. For obtaining a high resolution of the localized shear bands in the vicinity of the tunnel, a finer mesh (cf.
Figure 8) with a typical element size of ∼0.05 m is chosen in this region.
Due to the high overburden, a spatially uniform distribution of the geostatic stress state, characterized by the hydrostatic pressure of
MPa is assumed. It is determined from the density of
Innsbruck quartz-phyllite of
. For the same reason, gravity is not active in the numerical model. For obtaining the most unfavorable excavation conditions, full-face excavation is assumed. At the beginning of the simulation, the initial stress state is represented by applying the hydrostatic pressure as initial stress in the discretized domain and the surface pressure
at the excavation boundary as shown in
Figure 8 right. The latter is released continuously for modeling the excavation process in the 2D numerical simulation of tunneling. The excavation is completed upon full release of the surface pressure. Failure of the rock mass in the vicinity of the tunnel is indicated, if full release of the surface pressure is not possible in the numerical simulation.
Since the focus of this contribution is on the influence of directional-dependent behavior of rock mass on the stress redistribution during the excavation process, supporting measures, such as a shotcrete shell or rock anchors, are neglected.
The material parameters for
Innsbruck quartz-phyllite are adopted from the calibrated parameters for intact rock as listed in
Table 1. For considering the effects of present joints and discontinuities in the rock mass, the geological strength index is set to
as reported in [
12]. In contrast to
Table 1, the internal length parameter is increased to
mm in view of the considerably larger dimensions of the tunnel model. Accordingly, the softening modulus in the direction perpendicular to the foliation planes is determined as
, thus preserving the mode I fracture energy of the triaxial compression tests.
4.1. Influence of the Anisotropy Parameters
For investigating the influence of the transversely isotropic behavior predicted by the TI-RDP model on the mechanical response due to tunnel excavation, a parameter study based on the variaton of the two anisotropy parameters and (7) is performed. and represent the ratio of the uniaxial compressive strength perpendicular and parallel to the foliation planes and the ratio of the shear strength in the planes of isotropy and in planes perpendicular to the latter, respectively. A horizontally foliated rock mass () is considered.
As a benchmark for assessing the influence of the anisotropy parameters and serves the simulation with the isotropic RDP model. For the latter, the parameters , and the isotropic elastic stiffness tensor in the stress-strain relation (1) with a Young’s modulus of 45,000 MPa, a Poisson’s ratio of and a shear modulus of are employed.
Figure 9 shows the distribution of the damage variable
(left) and the displacement magnitude (right) in the final stage of the simulation before failure, i.e., for a release of the surface pressure of 97.5%. Due to the excavation, for a release of the surface pressure exceeding ∼90%, the rock mass is subjected to softening, which leads to localization of strains into multiple distinct shear bands, cf.
Figure 9 left. In the simulation, strain localization is triggered by the weakened elements, mentioned in
Section 4, breaking the otherwise expected axisymmetric behavior. A similar shape of the damage pattern was observed in experiments performed, for example, by Papamichos et al. [
54] or Meier et al. [
55].
In
Figure 10, the distribution of the damage variable
(left) and the displacement magnitude (right) is shown for two different values of the anisotropy parameter
(top) and
(bottom) and a constant value of
in the final stage of the simulation before failure, at a release of the surface pressure
of 96%. From
Figure 10A,B follows that for
the highly damaged zones are concentrated around the side walls of the tunnel, where the surface pressure
acts in the direction parallel to the foliation planes. This is attributed to the lower uniaxial compressive strength parallel to the foliation planes,
, compared to the uniaxial compressive strength perpendicular to the foliation planes,
.
In
Figure 10C,D the damage distribution and displacement pattern are shown for
, resulting in a lower value for
compared to
. Compared to the side walls, this results in a concentration of the highly damaged zones and consequently larger displacements at the top and the bottom of the tunnel cross section. Here the surface pressure at the excavation boundary acts in the direction perpendicular to the foliation planes.
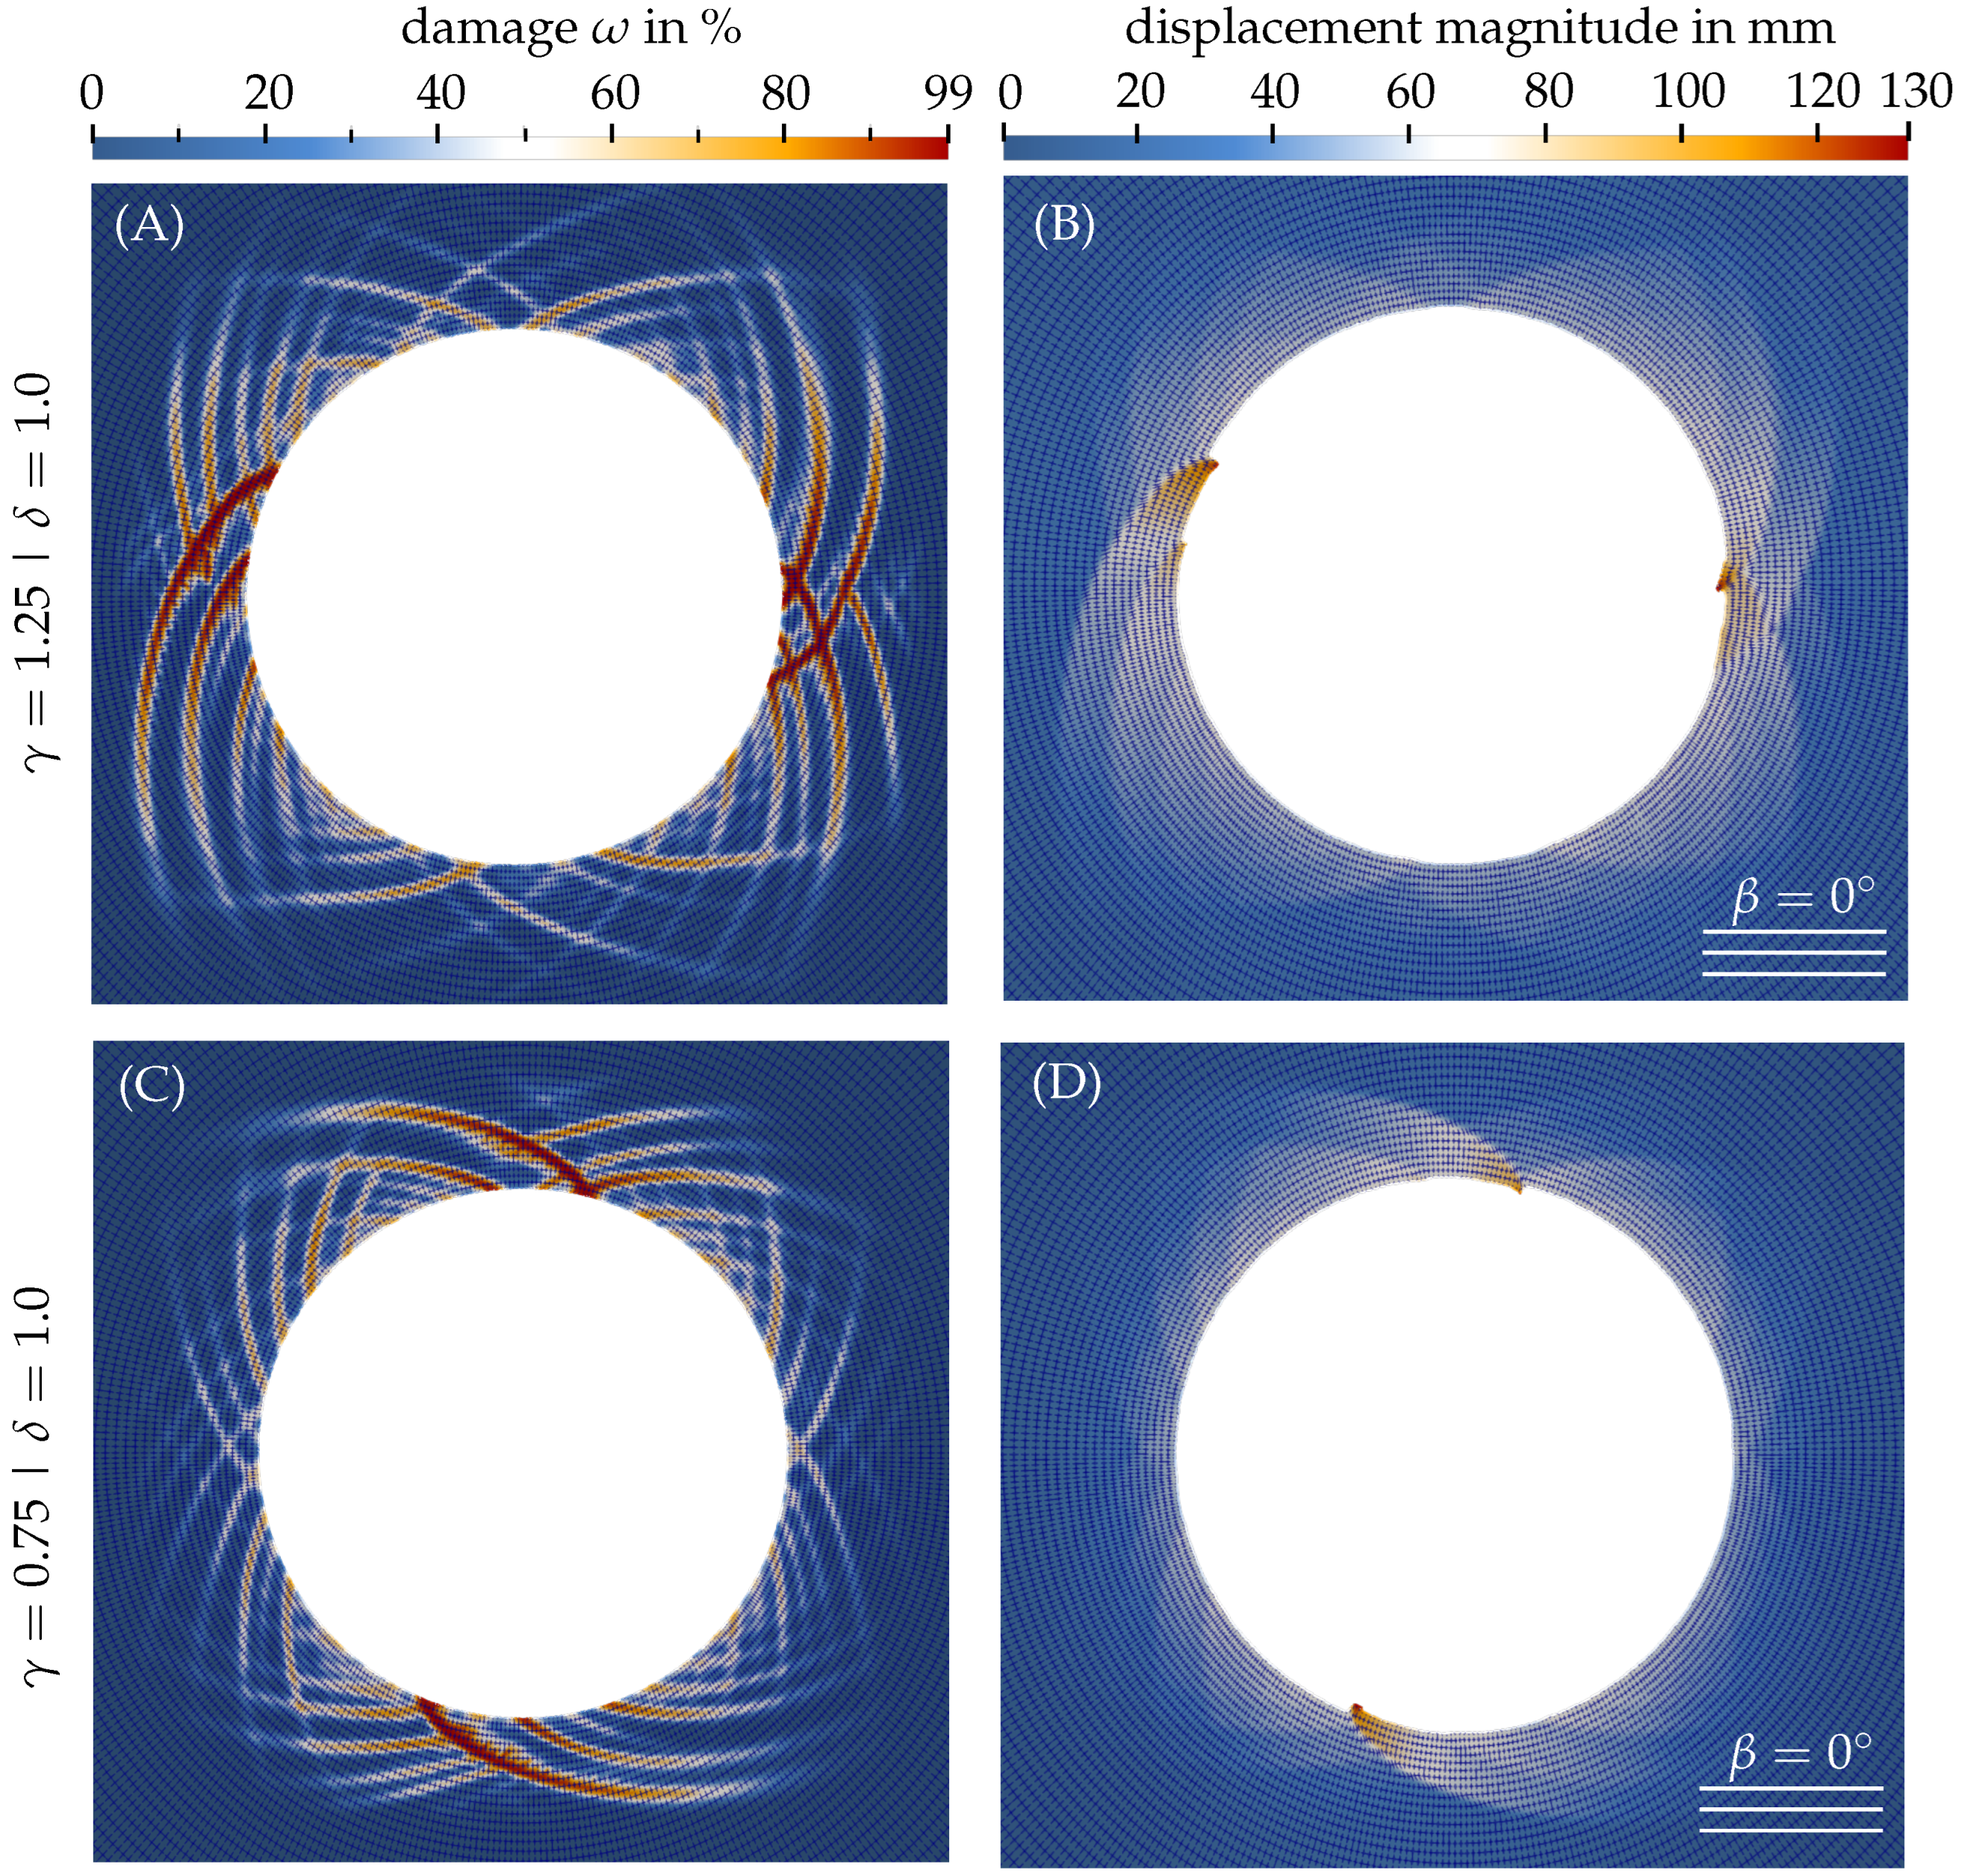
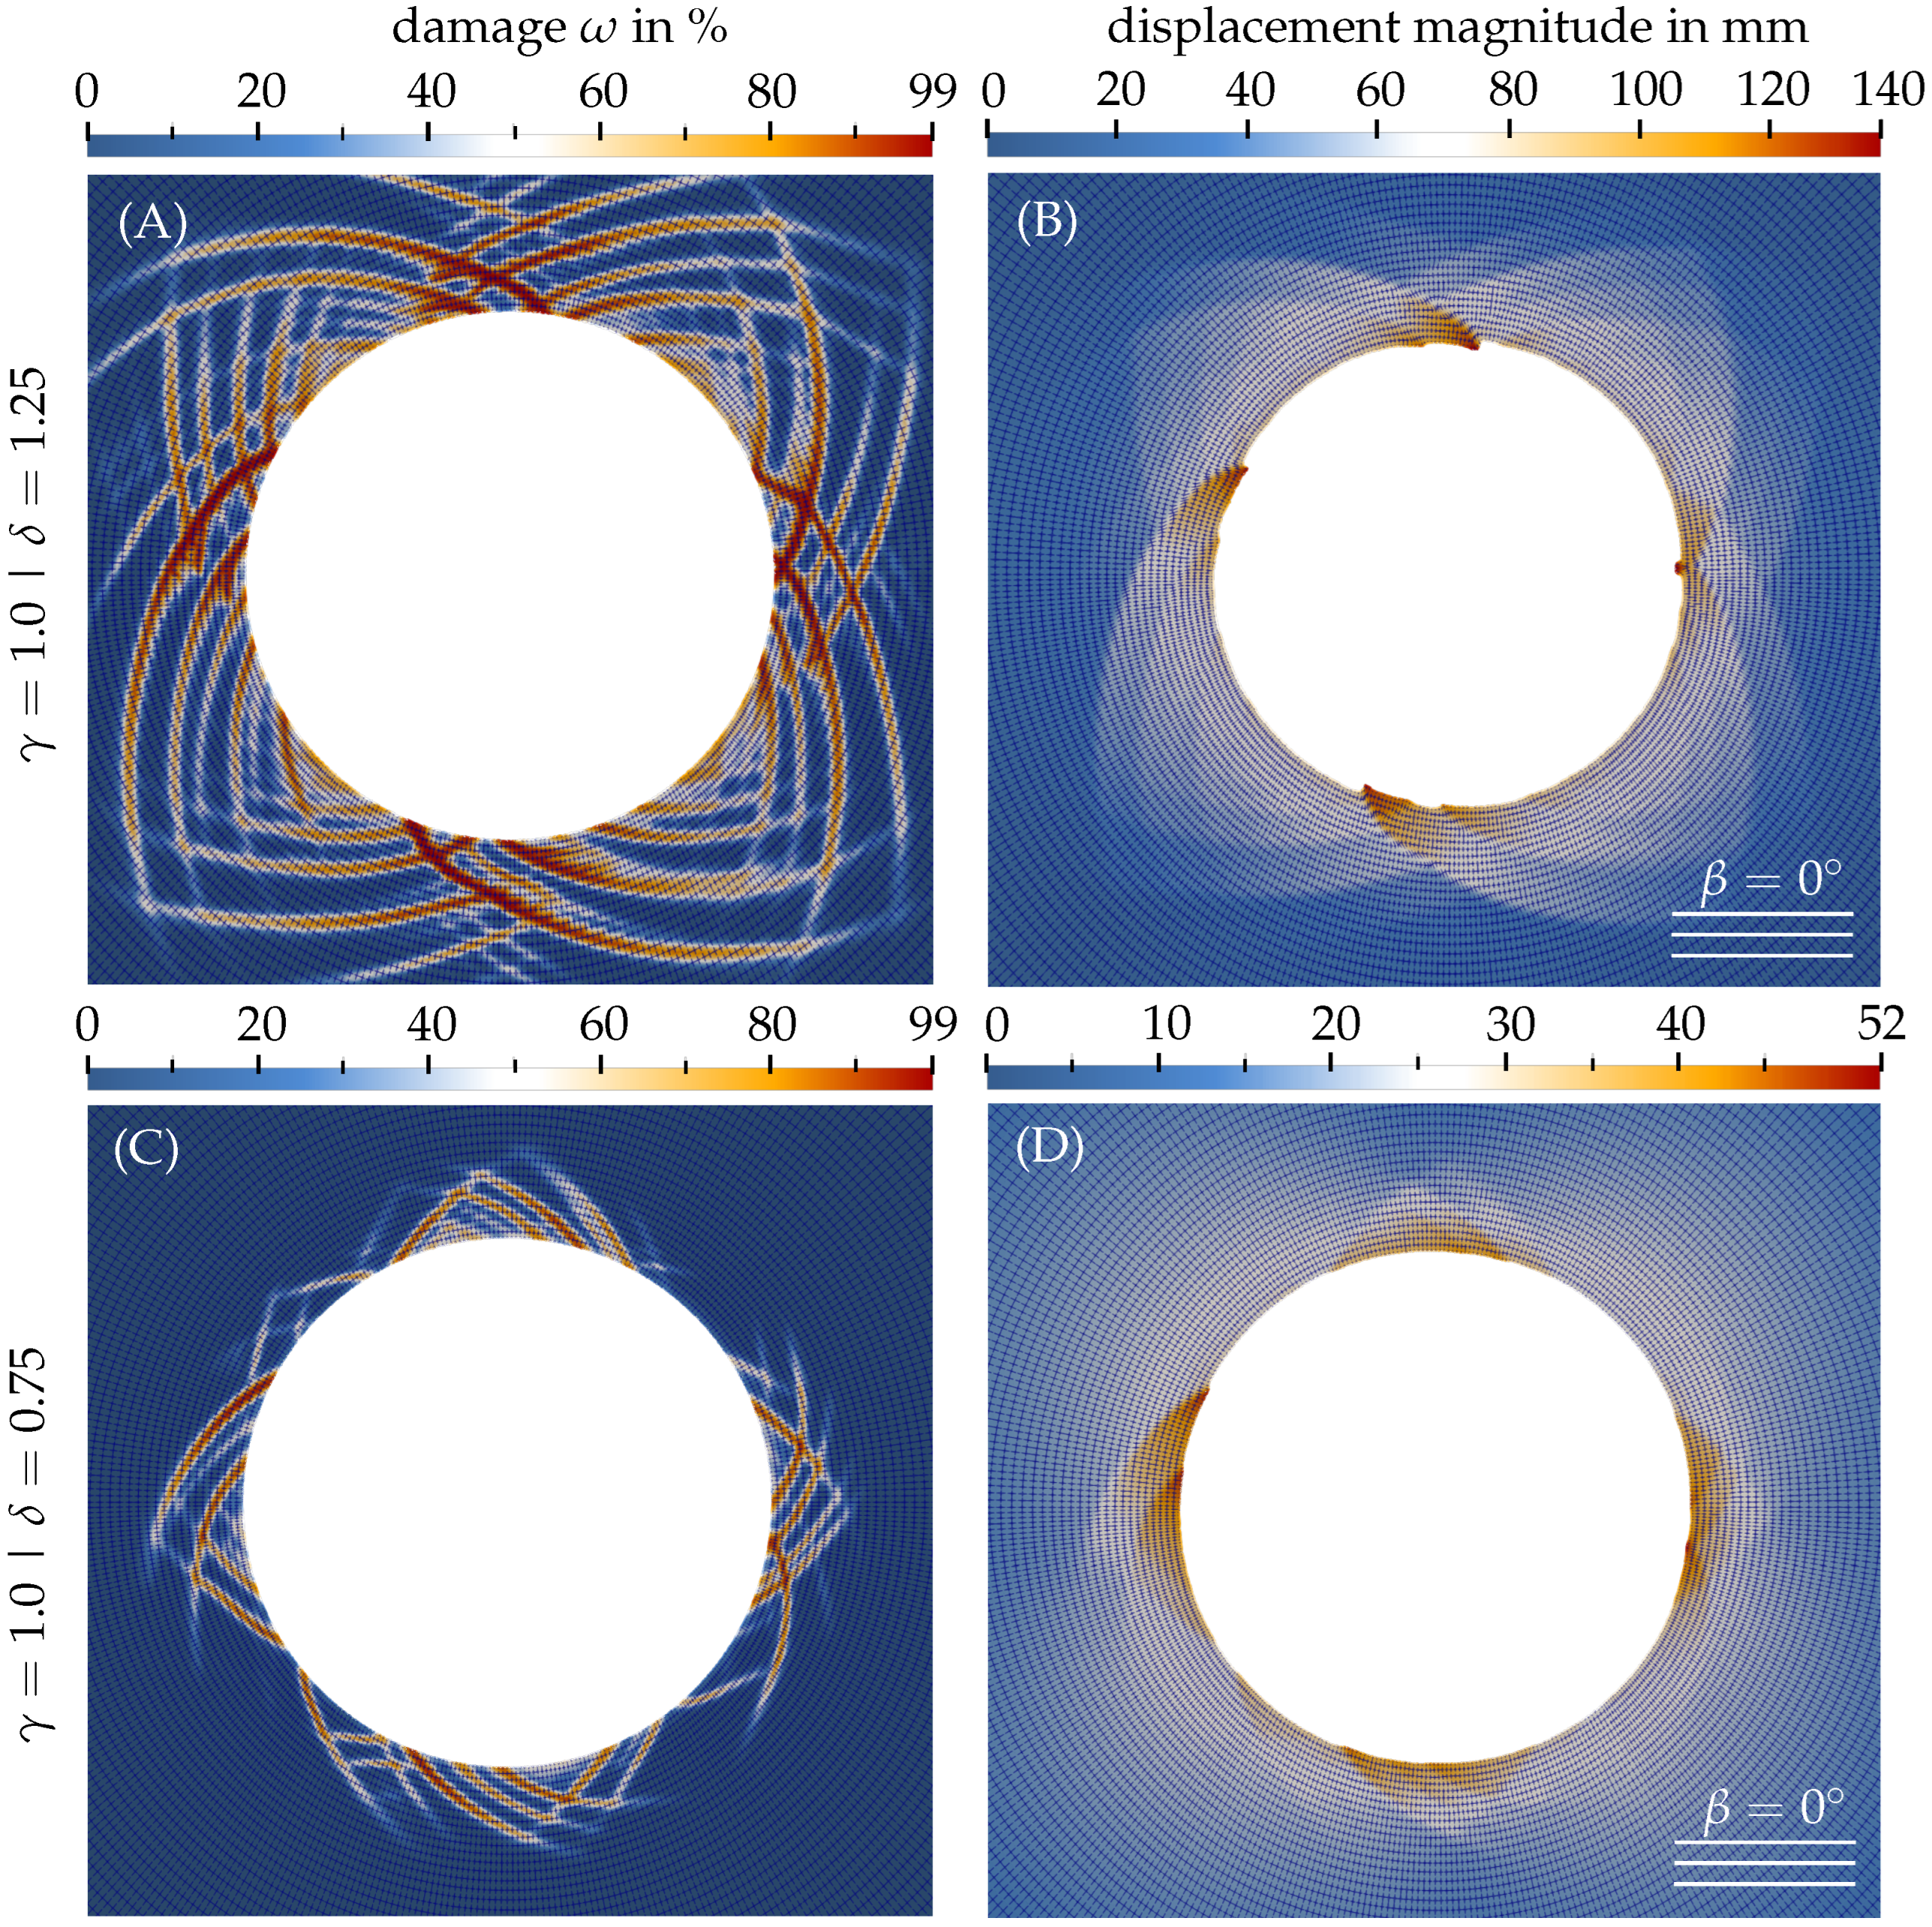
Figure 11 shows the distribution of the damage variable
(left) and the displacement magnitude (right) obtained for different values of
(top) and 0.75 (bottom) and a constant value of
in the final stage of the simulation before failure at a release of the surface pressure
of 97.5%. For the considered horizontally foliated rock mass
, due to the transversely isotropic linear elastic material behavior, the magnitude of the principal normal stresses has the most unfavorable effect in the horizontal and vertical planes. For this reason, at the top, bottom and sidewalls of the tunnel the damage variable and the displacement magnitude exhibit maximum values. In the present case of a two-dimensional analysis,
represents a scale factor of the shear strength
in planes perpendicular to the foliation planes. Thus, by comparison of the results for
(cf.
Figure 11C,D) and
(cf.
Figure 11A,B), it can be seen that due to the higher shear strength predicted for
compared to
, the highly damaged zones become smaller and, hence, the displacement magnitude is reduced significantly by a factor of 0.37.
By comparing the results obtained by the isotropic RDP model, shown in
Figure 9, and by the TI-RDP model, shown in
Figure 10 and
Figure 11, the influence of the anisotropy parameters can be summarized as follows: For a horizontally layered rock mass, depending on the ratio between the uniaxial compressive strength parallel and perpendicular to the foliation planes, failure at either the side walls or at the tunnel crown and invert is predicted. This is in contrast to the simulations with the isotropic RDP model, where several highly damaged zones are distributed around the tunnel perimeter. Furthermore, it was shown that a smaller shear strength influences the mechanical behavior significantly in the highly damaged zones due to larger shear deformations as well as in zones where the predominant loading direction is inclined to the foliation planes.
4.2. Influence of the Inclination of the Foliation Planes
The influence of the inclination of the foliation planes on the mechanical response of the 2D tunneling simulation is investigated by considering four different values of the inclination angles of the foliation planes , , and .
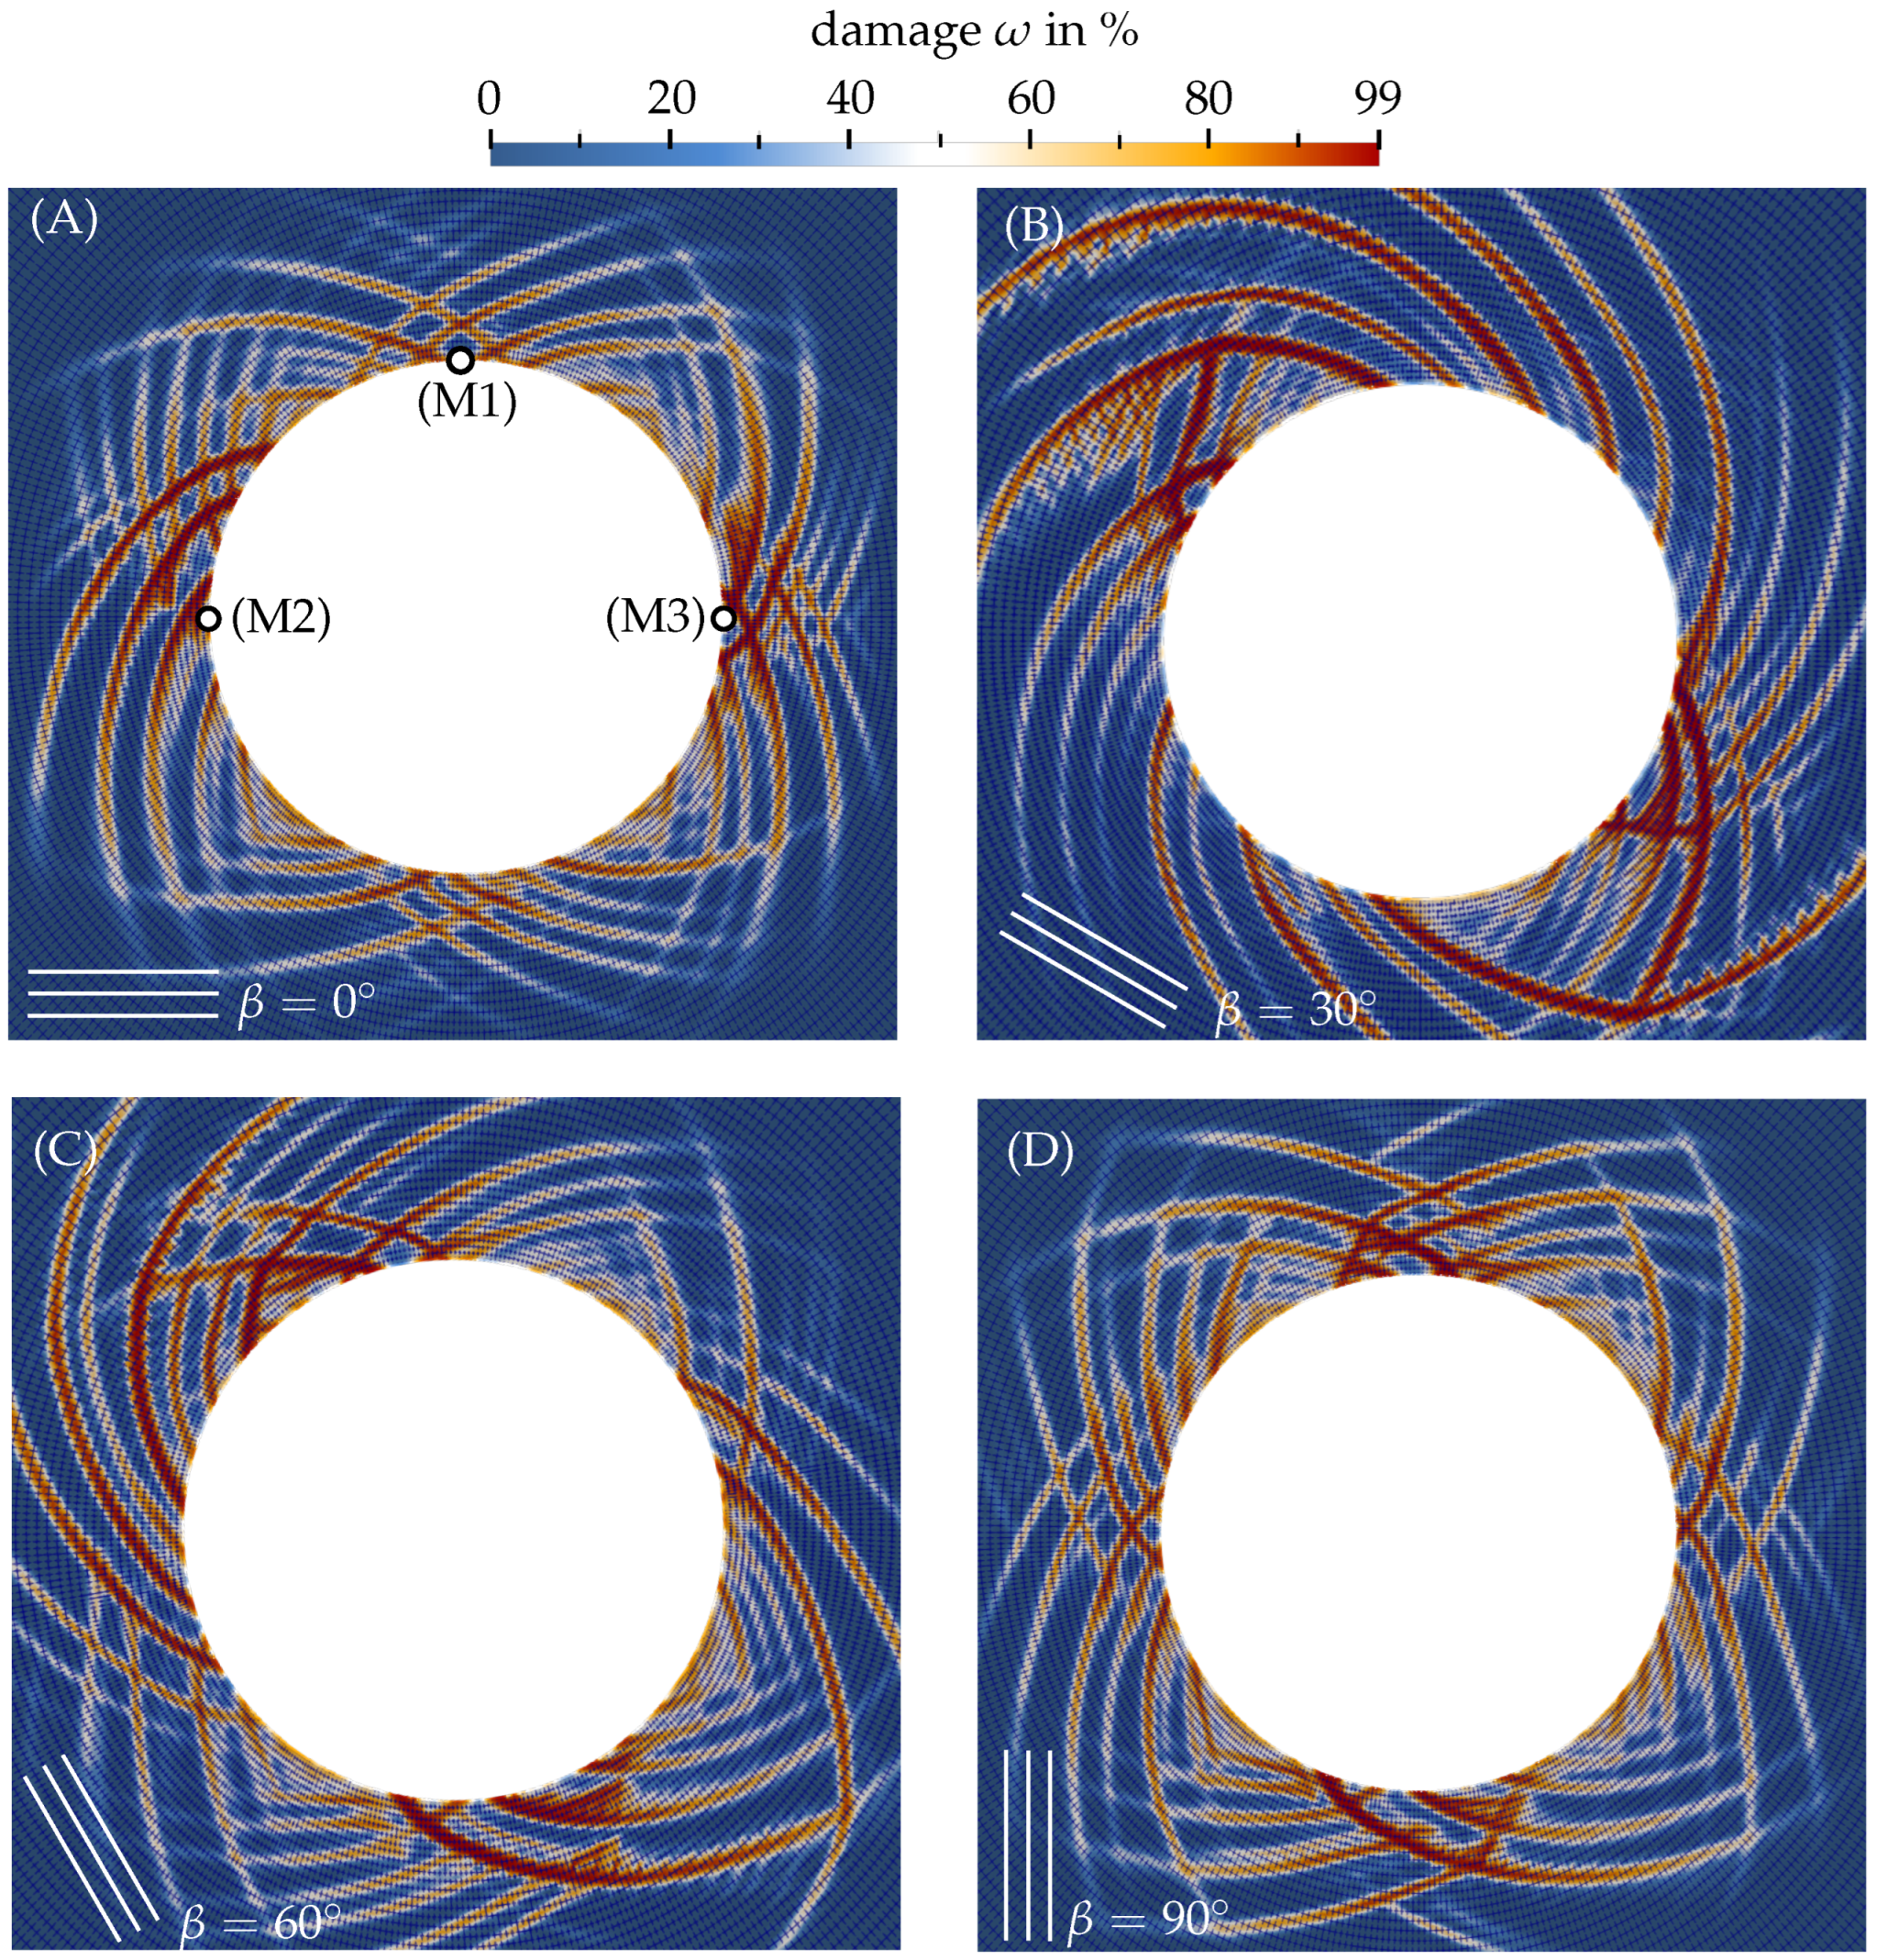
In
Figure 12, the distribution of the damage variable
is shown for the four inclination angles
in the final stage of the simulation before failure at a release of the surface pressure
of 97.5%. It can be seen that the failure pattern, manifested by the distribution of the highly damaged zones, strongly depends on the inclination angle of the layered rock mass. Considering the mechanical properties of
Innsbruck quartz-phyllite, cf.
Table 1 (
,
,
), it can sustain higher loads for loading perpendicular to the foliation planes compared to loading parallel to the foliation planes. Thus, the highly damaged zones are localized where the predominant loading direction, i.e., the direction of the acting surface pressure, is aligned with the foliation planes (cf.
Figure 12A–D). Note that for the present axisymmetric tunnel geometry and the hydrostatic initial geostatic stress, the damage patterns for the different inclinations of the foliation planes are not only obtained by a rotation around the tunnel center but are also slightly affected by the randomly distributed weakened zones.
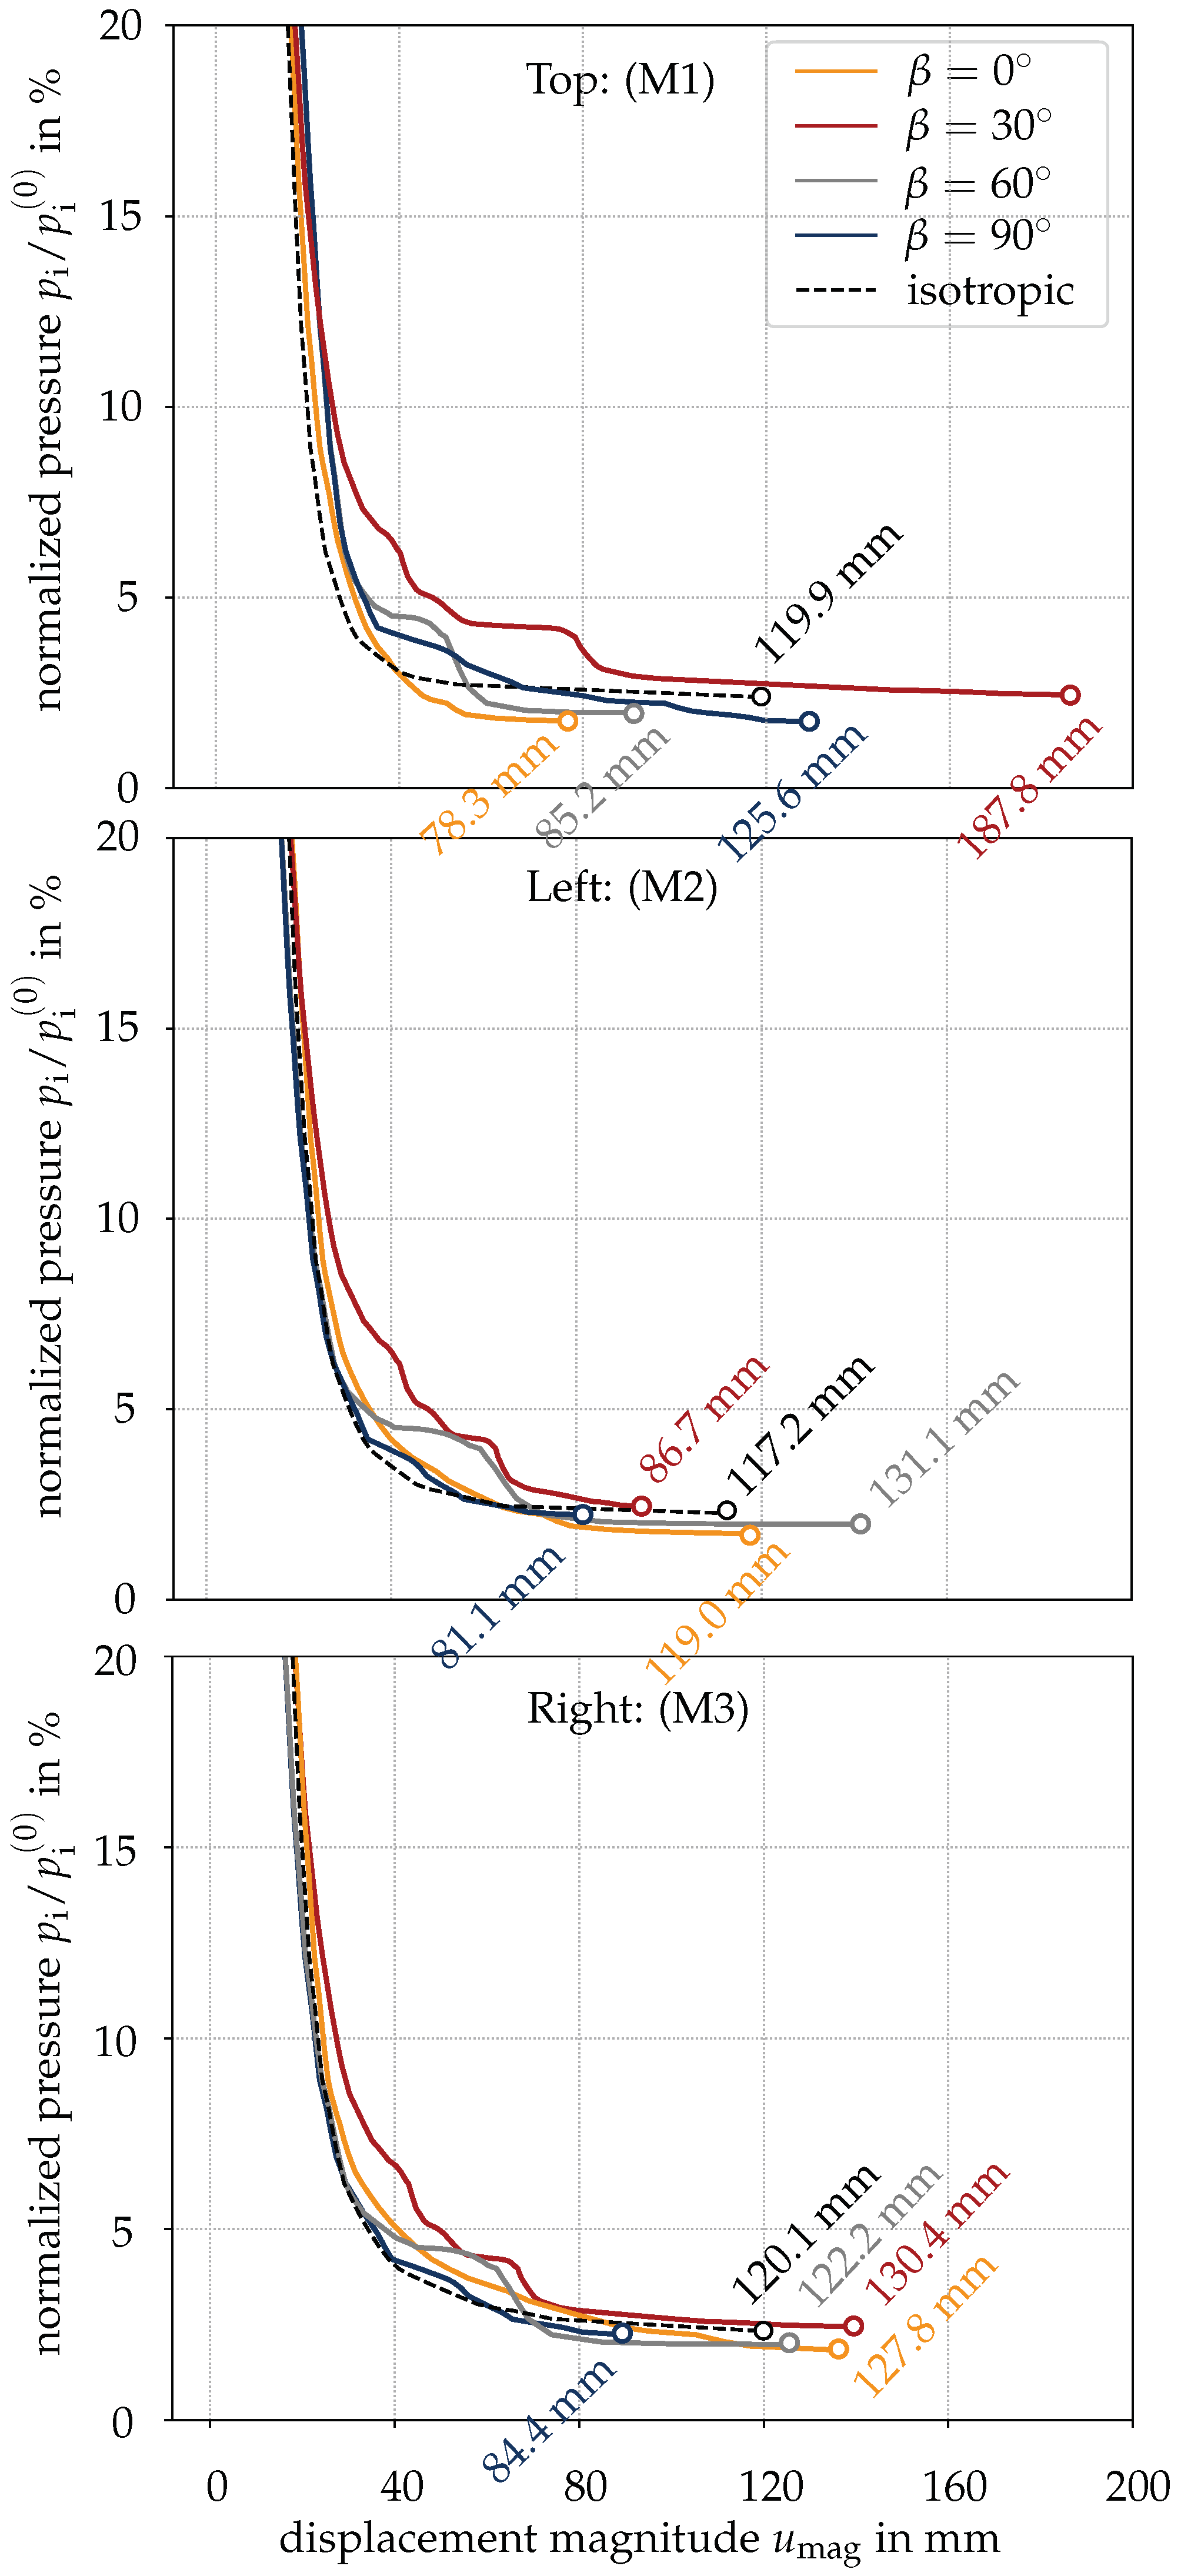
In
Figure 13, the release of the normalized surface pressure
is depicted in terms of the displacement magnitude for three characteristic points, i.e., top (M1), left (M2) and right side wall (M3) of the tunnel (cf.
Figure 12A) and the four inclination angles
,
,
and
. In addition, the corresponding results from the simulation using the isotropic RDP model are shown.
Up to a stress release of 90%, i.e., %, the influence of the inclination of the foliation planes on the displacement magnitude is negligible for the three considered points M1 to M3. However, from the onset of softening behavior, i.e., for a stress release exceeding , the displacement magnitude varies significantly since the strains localize into narrow zones of the rock mass, leading to the formation of shear bands in the vicinity of the tunnel. Since no securing measures are considered in this study, equilibrium is lost beyond the stress release of approximately 97.5%.
By employing the
isotropic RDP model (dashed line), the displacement magnitude in the final stage of the simulation is in the range of 117 to 120 mm at the top and the side walls of the tunnel cross section (cf.
Figure 13 (M1) to (M3)). The slight deviations of the latter are explained by the formation of shear bands due to the randomly distributed weak zones in the near field of the tunnel.
Employing the
transversely isotropic RDP model, for a horizontally layered rock mass, i.e.,
, the displacement magnitude at the top (cf.
Figure 13 (M1)) is about 2/3 of the respective value predicted at the side walls (cf.
Figure 13 (M2) and (M3)). This is attributed to the lower strength in the direction parallel to the foliation planes compared to the perpendicular direction. For a vertically layered rock mass, i.e.,
, the mechanical response is identical to
apart from a rotation by
: the displacement magnitude at the top is by a factor of 1.5 larger than the one on the side walls of the tunnel. For
and
, strongly varying values of the maximum displacement magnitude are obtained at the considered points (cf.
Figure 13 (M1) to (M3)), underlining the significant influence of the direction dependence. Hence, a distinct asymmetric deformation pattern of the tunnel cross section is obtained.
It is concluded that the direction-dependent material behavior in combination with softening rock mass behavior, accompanied by localization of deformations into narrow zones and the formation of shear bands, has a significant influence on the deformation pattern of the tunnel cross section.
5. Conclusions
This contribution is focused on the influence of direction-dependent and nonlinear material behavior of stratified or foliated rock mass on the mechanical response in deep tunneling. For this purpose, the
transversely
isotropic
rock
damage
plasticity (TI-RDP) model, recently proposed by Mader et al. [
32], was used for modeling the combined effects of nonlinear and direction-dependent rock mass behavior in finite element simulations of tunnel advance of a well-monitored stretch of the Brenner Base Tunnel.
The TI-RDP model was formulated by a combination of (i) the isotropic RDP model proposed by Unteregger et al. [
9], considering strain hardening, strain softening and the degradation of the material stiffness due to damaging processes and (ii) the approach by Boehler [
25] for considering the transversely isotropic material behavior of stratified or foliated rock. For obtaining mesh-insensitive results for the softening behavior, the TI-RDP is regularized by an implicit over-nonlocal gradient-enhancement according to Schreter et al. [
12]. For considering discontinuities such as joints or faults, which are typical for rock mass, an extension of the TI-RDP model from stratified or foliated intact rock to rock mass, following the approach by Hoek et al. [
6], was presented in this paper.
The material parameters of the TI-RDP model for
Innsbruck quartz-phyllite were calibrated by means of triaxial compression tests. To this end, 3D finite element simulations of intact rock specimens were conducted for different angles of the foliation planes with respect to the loading direction and different confining pressures. The parameters were identified by means of the experimentally determined load-displacement curves by Blümel [
51]. It was shown that in spite of the varying loading angles and confining pressures, good agreement of both the load-displacement curves and the failure modes was obtained.
Next, a 2D finite element model considering tunnel excavation in Innsbruck quartz-phyllite was set up for a stretch of the Brenner Base Tunnel. Studies on the influence of the anisotropy parameters of the TI-RDP model in a horizontally layered rock mass and the influence of the orientation of the foliation planes on the mechanical response of the rock mass were presented. The results of the latter were compared to the results predicted by the isotropic RDP model. It was demonstrated that the ratio between the uniaxial compressive strength perpendicular and parallel to the foliation planes significantly influences the location of the highly damaged zones. However, it has only a little effect on the maximum displacement magnitude for a horizontally layered rock mass. In the 2D simulations, the ratio between the shear strength in the plane of isotropy and the shear strength in planes perpendicular to the latter had no impact on the location of the highly damaged zones and thus did not influence the direction-dependent behavior. However, it significantly influenced the predicted displacement magnitude along the tunnel perimeter.
For determining the influence of the orientation of the foliation planes on the mechanical response of the rock mass, 2D finite element simulations of tunnel excavation were performed for different angles of the foliation planes , , and . As the formation pattern of shear bands depends on the orientation of the foliation planes, a strongly direction-dependent deformation pattern of the tunnel cross section was obtained. Thus, consideration of the direction-dependent material behavior, particularly with nonlinear stress–strain relations, including strain hardening and softening, is indispensable for predicting the mechanical response of stratified or foliated rock mass in numerical simulations of tunnel excavation.


